modelling nitrogen dynamics and distributions in the river ... · modelling nitrogen dynamics and...
TRANSCRIPT

Modelling nitrogen dynamics and distributions in the River Tweed, Scotland: an application of the INCA model
433
Hydrology and Earth System Sciences, 6(3), 433–453 (2002) © EGS
Modelling nitrogen dynamics and distributions in the RiverTweed, Scotland: an application of the INCA modelH.P. Jarvie1, A.J. Wade2, D. Butterfield2, P.G. Whitehead2, C.I. Tindall1, W.A. Virtue3,W. Dryburgh3 and A. McGraw3
1Centre for Ecology and Hydrology, Wallingford, OX10 8BB, UK2Aquatic Environments Research Centre, University of Reading. RG6 6AB, UK3Scottish Environment Protection Agency, Burnbrae, Mossilee Road, Galashiels, TD1 1NF, UK
Email for corresponding author: [email protected]
AbstractThe INCA (Integrated Nitrogen in Catchments) model was applied to the River Tweed in the Scottish Borders, a large-scale (4400km2),spatially heterogeneous catchment, draining a wide range of agricultural land-use types, and which contributes approximately 20% of UKriver flows to the North Sea. The model was calibrated for the first four years’ data record (1994 to 1997) and tested over the following threeyears (1998 to 2000). The model calibration and testing periods incorporated a high degree of variability in climatic conditions and riverflows within the Tweed catchment. The ability of the INCA model to reproduce broad-scale spatial patterns and seasonal dynamics in riverflows and nitrate concentrations suggests that the processes controlling first order variability in river water nitrate concentrations have beenrepresented successfully within the model. The tendency of the model to overestimate summer/early autumn baseflow nitrate concentrationsduring dry years may be linked to the operation of aquatic plant uptake effects. It is, therefore, suggested that consideration be given toincorporating a spatially and temporally variable in-stream plant uptake term for the application of INCA to lowland eutrophic rivers. Scenariosto examine possible impacts of environmental change on nitrate concentrations on the Tweed are examined. These include the effects of (i)implementing different recommendations for fertiliser use and land use change under the Nitrate Sensitive Areas (NSA) Scheme and theScottish Code of Good Agricultural Practice, (ii) worst case scenario changes linked to a dramatic reduction in livestock numbers as a resultof a crisis in UK livestock farming and (iii) changes in atmospheric nitrogen deposition.
Keywords: Nitrate, nitrogen, modelling, Tweed, INCA
IntroductionNitrogen (N), in combination with phosphorus (P), playsan important role in controlling the trophic status of surfacewaters. Increasing loadings of N and P from anthropogenicactivity (agriculture, wastewater disposal and atmosphericemissions) have resulted in widespread enrichment ofnutrients in surface waters and associated problems ofeutrophication linked to excessive accumulation ofphytoplankton/filamentous algal biomass, toxic algal bloomsand dissolved oxygen depletion. Eutrophication is mostvisibly apparent in lowland rivers which tend to receivegreatest nitrogen inputs from agriculture and effluent, andexhibit higher in-stream nutrient concentrations than uplandstreams. However, there are growing concerns about thenutrient status of upland streams and their sensitivity to
acidification and changes in trophic status (Neal, 2002).Nitrogen saturation (whereby deposition exceeds bioticdemand (Emmett et al., 1995; Stoddart, 1994)) is a growingconcern in upland catchments, linked to increasing N inputsfrom atmospheric deposition (Fowler et al., 1989) andenhanced rates of N leaching from forestry (Emmett et al.,1993; Dise and Wright, 1995).
Various strategies are employed to control N inputs torivers at the national (UK) and European levels. A majorinstrument for control of N losses to surface andgroundwaters is the 1992 European Nitrate Directive, whichfocuses on prevention at source and providesrecommendations for changes in agricultural practice andland use. In the UK, the Nitrate Sensitive Areas schemeintroduced by the Ministry for Agriculture, Fisheries and

H.P. Jar vie, A.J. Wade, D. Butterfield, P.G. Whitehead, C.I. Tindall, W.A. Vir tue, W. Dryburgh and A. McGraw
434
Food (MAFF, 1989) and the Code of Good AgriculturalPractice (MAFF/WOAD, 1991; Scottish Office, 1997)provide specific guidelines to farmers to minimise losses ofN from agricultural land, and are discussed further byParkinson (1993) and Ball (1993). However, the combinedimpact of these policies on controlling nitrogen pollutionin rivers is uncertain.
Nitrate is the predominant form of nitrogen transportedin rivers and is derived from a wide variety of sources withincatchments: fertilisers, sewage and industrial effluents,atmospheric inputs and mineralisation and nitrification oforganic nitrogen in soils (Stewart et al., 1982; Heathwaiteet al., 1996). The release of nitrate and subsequent transport,exchanges and transformations within the catchment andstream network are controlled by a complex set of biological,physical and chemical processes, which are highly variablein both space and time. Water quality models providesimplified representation of this highly complex system inorder to assess and analyse source contributions and fluxmodifications in catchments (e.g. MAGIC, Cosby et al.,1985a,b; MERLIN, Cosby et al., 1997) and in rivers (e.g.QUASAR, Whitehead et al., 1997). The INCA model(Integrated Nitrogen Model for Multiple Source Assessmentin Catchments), used in this study, integrates both catchmentdelivery of nitrogen and nitrogen transport andtransformation along river reaches within one model(Whitehead et al., 1998a,b; Wade et al., 2002). By simulatingsources and processes controlling N delivery and transport,models can provide valuable tools for catchmentmanagement and policy decision-making. Models can beused to assess possible impacts of measures aimed atreducing and managing nitrogen in river systems.
INCA models the delivery and transport of N through thecatchment-river continuum, incorporating hydrological andbiogeochemical processes. INCA is designed to be appliedat scales appropriate for catchment management and utilisesreadily-available land use and hydrological data to simulatemean daily soil N leaching loads.
The River Tweed provides a valuable case study forexamining N sources and dynamics within the coupledcatchment delivery and river reach modelling frameworkof INCA. The Tweed is a major river system and drains alargely rural catchment, in contrast to some of the other UKand European rivers draining into the North Sea, which havehighly populated and industrialised catchments, and thuscarry greater pollutant loads (Robson and Neal, 1997; Jarvieet al., 1998). The Tweed catchment, which covers an areaof 4400 km2, is characterised by large spatial variability inboth physiographic setting, hydrology, land use and nitrateconcentrations: from upland areas in the west, which aredominated by high rainfall, moorland and rough grazing
land, to the intensively farmed arable lowland areas of theeastern catchment. The River Tweed is of national ecologicalimportance and was designated a Site of Special ScientificInterest in 1976. This designation recognises that the Tweedrepresents (i) a nationally important example of a nutrientrich river system, with characteristic hydrological andbiological sequences (ii) one of the least polluted of theeasterly flowing large eutrophic British rivers (iii) thenorthern distribution limit of certain plant species in Britainand (iv) one of the most important salmon fisheries in theUK (Clayton, 1997). A wealth of water quality data alsoexists for the River Tweed, which have been used forapplication of the INCA model (Table 1). Long-term routinemonitoring data have been collected by the ScottishEnvironment Protection Agency (SEPA) and the Tweed hasalso been a focus within a major UK community researchprogramme, the Land Ocean Interaction Study (LOIS), withdetailed water quality studies at key river sites undertakenbetween 1994 and 1997 (Robson and Neal, 1997; Neal etal., 1997).
The major objectives of this study were as follows:
1. To examine the ability of INCA to model the river waternitrate dynamics and variability across the large-scaleand spatially heterogeneous Tweed catchment for aseven year time period (1994 to 2000), which wascharacterised by large variability in river flow andclimatic conditions.
2. To examine the relative contributions of nitrate fromdifferent land uses and point sources through time andalong a 160 km river continuum from the uplandheadwaters to the lowland input to the coastal zone.
3. To simulate the impact of possible land use changescenarios in the Scottish Borders region (linked tocurrent changes in agricultural practices and nitratecontrol guidelines detailed in the Scottish Code of GoodAgricultural Practice (Scottish Office, 1997)).
4. To examine the effects of changes in atmosphericnitrogen deposition on in-stream nitrate concentrations.
The Tweed catchmentThe characteristics of the Tweed catchment are describedin detail in Robson et al. (1996) and Robson and Neal(1997). The Tweed drains eastern slopes of the ScottishSouthern Uplands, with elevations ranging from 800 m tosea level. Mean annual rainfall across the catchment for 1969to 1996 was 990 mm (Institute of Hydrology, 1998).

Modelling nitrogen dynamics and distributions in the River Tweed, Scotland: an application of the INCA model
435
Table 1. Summary of data used in INCA modelling of the River Tweed
Data Description Source of data Reference
Streamwater NO3-N and NH4-N Spot samples from 12 sites SEPAconcentrations along the main stem of the
River Tweed. Weekly tomonthly sampling for1994 – 2000
Streamwater NO3-N and NH4-N LOIS weekly sampling at NERC Land Ocean Leeks et al. (1997)concentrations Boleside (Reach 12) and Interaction Study – LOIS
Norham (Reach 23) for database1994 to 1996
Effluent NO3-N and NH4-N Intermittent spot samples SEPAconcentrations and flow used to calculate mean daily
flows and concentrations(assumed to be constantthrough the year)
River flows Mean daily flows for six National River Flow Institute of Hydrology (1998)gauging stations on the main Archivestem of the Tweed(1994 – 2000)
MORECS rainfall, temperature Derived daily time series Meteorological Office Meteorological Office, (1981)and soil moisture deficit
Base Flow Index Derived for each flow gauging Institute of Hydrology Institute of Hydrology (1998)station and extrapolated toungauged river reaches
Fertiliser application rates Survey of British Fertiliser Fertiliser ManufacturersPractice Association
However, as a result of the topographic variations, there isa high degree of variation in rainfall across the catchment,ranging from mean annual rainfall of 1892 mm in theuplands to 650 mm in the low-lying eastern part of thecatchment (Institute of Hydrology, 1998). The land coverranges from heather moorlands and rough grazing on thehills, improved pastures on the lower slopes to arable landin the lowlands. The main arable crops are barley, wheat,oats, oilseed rape and potatoes. Conifer plantations occupyabout 16% of the land, and are located primarily on thehills in the south and west of the catchment. The geology ofthe Tweed catchment is predominantly sedimentary andmetamorphosed sedimentary rocks (Ordovician and Siluriangreywackes, shales and mudstones; old red sandstones,carboniferous shales, greywackes and limestones), withsome granitic igneous intrusions and extrusive basic lava
rocks in the Cheviot Hills to the south of the catchment.Soils in the lowlands are well-drained brown earths, withpodzols on the higher land and peats and gleys on hilltopsand the southern slopes. The Tweed catchment is sparselypopulated, with an average population density of 22people km–2, less than a tenth of the UK average. Centres ofpopulation are concentrated in a few small towns (Hawick,population 16 000; Galashiels, population 14 000, andSelkirk, population 6000). The Tweed catchment has beensubject to significant agricultural change during 2001, interms of livestock farming. The Scottish borders area hasseen large-scale livestock culling in response to a seriousoutbreak of Foot and Mouth Disease. Over 100 000 animalswere slaughtered on 117 farms within the Tweed catchmentbetween March and September 2001, although many of thefarms have now been restocked, indicating that the effects

H.P. Jar vie, A.J. Wade, D. Butterfield, P.G. Whitehead, C.I. Tindall, W.A. Vir tue, W. Dryburgh and A. McGraw
436
of the Foot and Mouth crisis may be relatively short-lived.However, this recent outbreak has followed a series ofprofound threats to UK livestock farming, which haveincluded BSE (Bovine Spongiform Encephalopathy or ‘MadCow Disease’), and, with meat export restrictions in placethe long-term economic future of livestock farming systemsin areas such as the Scottish Borders is uncertain. Theseeconomic drivers may have an important impact on landuse change within the Tweed catchment, and need to beconsidered when designing land use change scenarios forthe nitrogen modelling exercise.
Nitrate accounts for approximately 97% of dissolvedinorganic nitrogen (DIN) in the River Tweed, whereas nitriteand ammonium account for only 1.3% and 1.5% of DINrespectively (Jarvie et al., 1998). Organic forms of nitrogencan provide an important contribution to dissolved nitrogenfluxes, particularly in the upland regions of the Tweedcatchment during the summer (up to 37% total nitrogenfluxes, Chapman et al., 2001). However, organic nitrogenhas not been measured routinely by SEPA or under the LOISprogramme and thus the data availability is sparse. Figure 1shows the distribution of river water NO3-N concentrationsacross the Tweed catchment. The distribution of NO3-Nshows highest concentrations in the eastern lowland partsof the catchment, which correspond with arable land use.However, elevated NO3-N concentrations are also found insome smaller tributaries in the west of the region, linked tosewage inputs and relatively low dilution capacity of smallheadwater streams.
Concern about nitrogen inputs to the River Tweed and itsestuary has been growing over the last few years, with the
prospect of nitrate vulnerable zones being designated withinthe eastern part of the catchment. Attention has also focusedon eutrophication within the Lindisfarne National NatureReserve, an important European site. Linkages betweeneutrophication in the coastal waters around Lindisfarne andnitrate discharged from the Tweed have been suggested, andinvestigations are continuing.
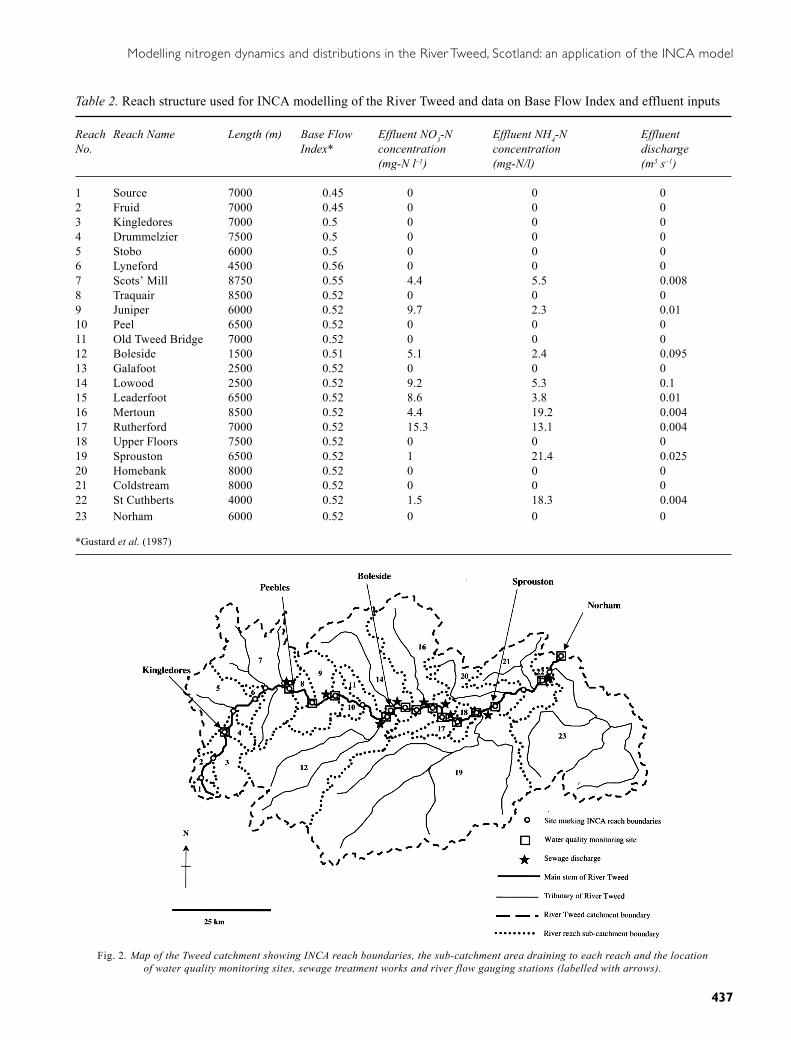
Model setupTo model nitrogen in the River Tweed, using INCA, themain stem of the River Tweed was sub-divided into 23reaches, of less than 10 km in length (Table 2). Reachboundaries were designed to coincide with key factorscontrolling flow and water quality, such as sub-catchmenttributary inputs, effluent discharges, and the location of flowgauging stations and water quality monitoring sites (Fig.2). The location of gauging stations and water qualitymonitoring sites at reach boundaries facilitates comparisonof model simulations with observed flow and chemicalconcentration data at specified sites along the river.
The data used to set up the INCA model for the Tweedand for calibration are outlined in Tables 1 to 3. The datarequired for application of INCA include mean daily riverflow, streamwater nitrate (as nitrogen, NO3-N) andammonium (as nitrogen, NH4-N) concentrations, and loadsfrom major land use and vegetation types within thecatchment, (Whitehead et al., 1998a,b; Wade et al, 1999,2001, 2002).
Fig. 1. Map of average nitrate concentrations across the Tweed catchment (1994 to 2000). Data supplied by theScottish Environment Protection Agency.
Modelling nitrogen dynamics and distributions in the River Tweed, Scotland: an application of the INCA model
437
Table 2. Reach structure used for INCA modelling of the River Tweed and data on Base Flow Index and effluent inputs
Reach Reach Name Length (m) Base Flow Effluent NO3-N Effluent NH4-N EffluentNo. Index* concentration concentration discharge
(mg-N l–1) (mg-N/l) (m3 s–1)
1 Source 7000 0.45 0 0 02 Fruid 7000 0.45 0 0 03 Kingledores 7000 0.5 0 0 04 Drummelzier 7500 0.5 0 0 05 Stobo 6000 0.5 0 0 06 Lyneford 4500 0.56 0 0 07 Scots’ Mill 8750 0.55 4.4 5.5 0.0088 Traquair 8500 0.52 0 0 09 Juniper 6000 0.52 9.7 2.3 0.0110 Peel 6500 0.52 0 0 011 Old Tweed Bridge 7000 0.52 0 0 012 Boleside 1500 0.51 5.1 2.4 0.09513 Galafoot 2500 0.52 0 0 014 Lowood 2500 0.52 9.2 5.3 0.115 Leaderfoot 6500 0.52 8.6 3.8 0.0116 Mertoun 8500 0.52 4.4 19.2 0.00417 Rutherford 7000 0.52 15.3 13.1 0.00418 Upper Floors 7500 0.52 0 0 019 Sprouston 6500 0.52 1 21.4 0.02520 Homebank 8000 0.52 0 0 021 Coldstream 8000 0.52 0 0 022 St Cuthberts 4000 0.52 1.5 18.3 0.00423 Norham 6000 0.52 0 0 0
*Gustard et al. (1987)
Fig. 2. Map of the Tweed catchment showing INCA reach boundaries, the sub-catchment area draining to each reach and the locationof water quality monitoring sites, sewage treatment works and river flow gauging stations (labelled with arrows).

H.P. Jar vie, A.J. Wade, D. Butterfield, P.G. Whitehead, C.I. Tindall, W.A. Vir tue, W. Dryburgh and A. McGraw
438
Tabl
e 3.
Sub
-cat
chm
ent a
reas
dra
inin
g to
indi
vidu
al ri
ver r
each
es a
nd th
e pe
rcen
tage
of l
and
use
with
in e
ach
sub-
catc
hmen
t
Reac
hN
ame
Area
% F
ores
t%
Sho
rt v
eget
atio
n%
Sho
rt v
eget
atio
n%
Sho
rt v
eget
atio
n%
Ara
ble
% U
rban
No.
km2
(ung
raze
d)gr
azed
, unf
ertil
ised
fert
ilise
d(u
nim
prov
ed g
rass
land
)(im
prov
ed g
rass
land
)
1So
urce
2124
076
00
02
Frui
d27
220
780
00
3K
ingl
edor
es87
140
860
00
4D
rum
mel
zier
3838
011
890
05
Stob
o15
93
487
15
06
Lyne
ford
150
093
07
07
Scot
s’ M
ill34
46
680
43
18
Traq
uair
8721
362
95
09
Juni
per
8333
854
22
110
Peel
3713
081
14
111
Old
Tw
eed
Brid
ge50
1614
5210
80
12B
oles
ide
471
150
850
00
13G
alaf
oot
40
075
025
014
Low
ood
254
14
7311
92
15Le
ader
foot
176
012
565
1216
Mer
toun
308
12
459
430
17R
uthe
rfor
d43
00
27
910
18U
pper
Flo
ors
270
00
793
019
Spro
usto
n11
3913
150
728
120
Hom
eban
k15
90
04
1284
021
Col
dstre
am17
90
00
496
022
St C
uthb
erts
90
00
010
00
23N
orha
m65
83
238
1542
0

Modelling nitrogen dynamics and distributions in the River Tweed, Scotland: an application of the INCA model
439
WATER CHEMISTRY DATA
LOIS water quality sampling took place on a weekly basisat three sites on the main River Tweed from 1994 to 1996.Two of the LOIS sampling sites were located on the mainstem of the Tweed and are used here (Boleside (Reach 12)and Norham (Reach 23)). SEPA sampling provides a goodspatial distribution across the catchment, with river watersamples collected typically on a monthly basis, except forthe Tweed at Galafoot (Reach 13) where samples arecollected on a weekly basis. SEPA also collects effluentchemistry and flow data, which provide another importantinput to the INCA model. For the LOIS programme,NO3-N concentrations were analysed using ionchromatography (Dionex DX1000 system) and NH4-Nconcentrations were determined by automated colorimetry(Leeks et al., 1997). For the SEPA water quality monitoringprogramme, both NO3-N and NH4-N concentrations weredetermined by ion chromatography. The LOIS chemicalmonitoring programme was subject to strict harmonisationand quality control measures (Leeks et al., 1997), andsimilarly, the SEPA analytical laboratories operate underUKAS accredited procedures. This meant that there wasgood agreement between the SEPA and LOIS datasets sothat they could be collated and merged on the LOIS riversdatabase (Tindall and Moore, 1997). This provided a datasetfor the Tweed catchment spanning seven years (1994 to2000, inclusive), for a wide range of river and effluentmonitoring sites. Of the SEPA river water quality monitoringsites across the Tweed catchment, twelve sites were locatedalong the main stem of the Tweed. These twelve SEPA sites,in addition to the two LOIS water quality monitoring sitesmentioned above (Fig. 2), provided the nitrate concentrationdata for INCA. Additionally, nine sewage treatment worksdischarged directly into the River Tweed between the sourceand Norham (Table 2).
DEPOSITION CHEMISTRY
Nitrogen inputs from atmospheric deposition were estimatedusing the MATADOR-N model (Model of AtmosphericTransport And Deposition Of Reacting Nitrogen, Rodgers,1993; RGAR, 1997). This model provides an estimate oflong-range transport and wet and dry deposition of oxidisedand reduced N (NOx and NHy). Details of calculationmethods are provided elsewhere (Whitehead et al., 1998a;Wade et al., 2001). Using MATADOR-N, the mean annualwet and dry deposition over the Tweed catchment wasestimated as 3 kg ha–1 yr–1 for both NO3-N and NH4-N, basedon 1994 meteorological and emission data.
HYDROLOGICAL DATA
Five flow gauging stations on the main stem of the RiverTweed (Fig. 2), supplied observed mean daily river flows.Hydrological input data are required to drive thehydrological component of the INCA model; these inputsare daily timeseries of hydrologically effective rainfall(HER, rainfall which penetrates the ground after allowingfor evapotranspiration and interception losses), soil moisturedeficit and air temperature (Fig. 3). The hydrological inputdata demonstrate a high degree of variability in thehydrological conditions experienced over the seven yearstudy period. There were relatively low rainfall inputs andhigh summer soil moisture deficits during 1994 to 1996,
Fig. 3. MORECS data for the Tweed catchment: hydrologicaltimeseries input for INCA (Soil Moisture Deficit (SMD),Hydrologically Effective Rainfall (HER) and air temperature from1994 to 2000).

H.P. Jar vie, A.J. Wade, D. Butterfield, P.G. Whitehead, C.I. Tindall, W.A. Vir tue, W. Dryburgh and A. McGraw
440
including a prolonged period with no HER during thesummer of 1996, followed by high rainfall and relativelylow soil moisture deficits during 1997 and 1998. Thehydrological input data were supplied by the UKMeteorological Office, based on meteorological obser-vations and output from the MORECS soil moisture andevaporation accounting model (Meteorological Office,1981). However, the high degree of spatial variability inrainfall across the Tweed catchment meant that, to calibratethe hydrological component of INCA, separate timeseriesof HER were required for the upland and lowland areas ofthe catchment, rather than a single catchment average. TheIHACRES model (Jakeman et al., 1990) was used tosimulate the differences in HER in the upper (Reaches 1 to12) and lower (Reaches 13 to 23) parts of the catchment,using the method described by Wade et al. (2001).IHACRES was calibrated using the MORECS-derivedactual precipitation and air temperature data, together withthe observed flow data at the flow gauging stations atBoleside (Reach 12) and Norham (Reach 23). IHACRESwas calibrated using hydrological data from 1994 to 1997and tested using the data from 1998 to 2000.
Velocity-flow information is required to estimate residencetimes of water within each river reach, and has been derivedfrom tracer experiments conducted by SEPA. These datahave been used to define the following flow-velocityrelationship:
V = a Q b (1)
where V and Q are mean daily velocity and flowrespectively; a and b are constants; for the Tweed, a = 0.02and b=0.67.
In INCA, the baseflow index (Gustard et al., 1987) is usedto partition the water moving between the soilwater andground water reservoirs (see Wade et al., 2002). Thebaseflow index is a measure of the proportion of river runoffwhich is derived from stored sources and, for the RiverTweed, the baseflow index ranges from 0.45 to 0.56(Institute of Hydrology, 1998).
CATCHMENT LAND USE
Sub-catchment areas draining to each of the 23 river reacheswere defined using the Institute of Hydrology Digital TerrainModel (IHDTM) within a Geographical Information System(GIS; ARC/INFO). Within each of the subcatchment areas,the land use characteristics were derived from the ITE LandCover data (Fuller, 1993). The twenty five ITE land coverclasses were then grouped into six categories, as defined byWhitehead et al. (1998a) : (i) forest, (ii) short vegetation
ungrazed, (iii) short vegetation grazed not fertilised(unimproved grassland), (iv) short vegetation grazed andfertilised (improved grassland), (v) arable, (vi) urban. Detailsof the sub-catchment areas draining to each of the Tweedriver reaches and percentage cover of each land use typewithin each sub-catchment are shown in Table 3.
LAND MANAGEMENT AND PLANT/CROP GROWTHPERIODS
Typical fertiliser application rates to arable and improvedgrassland were obtained from the British Survey of FertiliserPractice (Fertiliser Manufacturers’ Association, 1994), andestimated as 41 kg-N ha–1 yr–1 for both NO3-N and NH4-Napplications to improved grassland and 53 kg-N ha–1 yr–1
NO3-N and NH4-N applications to arable land. The timingsof applications were estimated to run between 1st Marchand 1st September, based on local farming knowledge (seeAppendix). It was assumed that fertiliser input occurredevenly over the period of application and was predominantlyapplied in the form of ammonium nitrate. The main plantgrowing season was estimated to begin on 1st March andend on 31st October, with the exception of arable land, wherethe growing season was estimated to end at harvest time(7th September).
Model calibrationThe availability of seven years of flow and NO3-Nconcentrations for the River Tweed meant that a split sampletest could be undertaken, with calibration of the modelduring the first four years (1994 to 1997, inclusive), andmodel testing during the final three years (1998 to 2000).Model calibration was undertaken in three steps:
1. Hydrology. Simulation of nitrogen concentrations andloads in both catchment and stream components isdependent on water volumes and the routing of waterthrough the soil, groundwater and river reaches.Therefore, it is important to simulate hydrologyaccurately. Parameters relating to the flow-velocityrelationship were set according to experimental tracerobservations. Constants defining the residence times ofwater in the soil and groundwater reservoirs weredetermined through calibration, until the simulated meandaily flows closely matched the observed mean dailyflows for the 1994-1997 period (Fig. 4).
2. Initial conditions. Having set the fertiliser applicationsand plant growth periods according to local landmanagement practices, the second step in the calibration

Modelling nitrogen dynamics and distributions in the River Tweed, Scotland: an application of the INCA model
441
procedure involved adjusting initial NO3-N andNH4-N concentrations in the soil, groundwater and in-stream components, so that that the simulated flow andinitial NO3-N concentrations in the first few days of themodel run matched observed in-stream concentrations.River water NH4-N and NO2-N concentrations in theRiver Tweed were typically close to or below analyticaldetection limits, and therefore the INCA model of theTweed was not calibrated to observed NH4-N andNO2-N data. By running the model to simulate a four-year period with a daily time step, the influence of initialconditions on model results was minimised.
3. Process rates. Parameters relating to soil nitrogenprocesses (rates of NH4-N immobilisation, NO3-Ndenitrification, NH4-N nitrification, NH4-N mineral-isation, and plant NH4-N and NO3-N uptake) and in-stream rates of denitrification and NH4-N nitrificationwere adjusted so that (i) the simulated annual fluxesfor catchment processes and annual leaching loads werelargely within expected ranges of published data for
relevant land use types (see Table 4), and (ii) thesimulated daily NO3-N concentrations matchedobserved daily NO3-N values closely during 1994 –1997(Fig. 5). The calibrated parameter values are shown inthe Appendix. While these values cannot be compareddirectly with measured parameters (they have no directphysical process meaning), they serve as a basis forcomparison with other INCA applications. Moreover,the loads derived for each process can be compared withmeasurements made in the field and provide a furthermeans of calibrating the model in addition to matchingthe observed flows and streamwater nitrate andammonium concentrations.
Fig. 4. INCA calibration results for hydrology: observed andsimulated river flows at Boleside (Reach 12) and Norham (Reach23) for 1994 to 1997. Observed flows are shown in dark blue;simulated flows are shown in
Table 4. Catchment process loads: comparing measuredvalues (kg-N ha–1 yr–1) within the published literature (Wadeet al., 2001a) with simulated mean annual fluxes (kg-Nha–1 yr–1) during 1994 to 1997 in the Tweed catchment
Land use/Process Measured value Simulatedor range in value forvalues Tweed
(1) NO3-N uptakeForest 17 – 153 16Ungrazed short vegetation 42 19Unimproved grassland 35 – 162 19Improved grassland 105 71Arable 95 94
(2)DenitrificationForest < 0.01 – 4 0.5Ungrazed short vegetation 1 0.7Unimproved grassland 1 2Improved grassland 19 16
(3) NitrificationForest 1 – 35 12Ungrazed short vegetation 3 – 54 17
(4) MineralisationForest 10 – 292 41Ungrazed short vegetation 20 – 60 41Unimproved grassland 73 52Improved grassland 40 – 50 81Arable 62 81
(5) Inorganic N leachingForest < 1 – 43 6
(a) Reach 12 (Boleside)
(b) Reach 23 (Norham)
0
100
200
300
400
500
600Ja
n-94
Apr-
94
Jul-9
4
Oct
-94
Jan-
95
Apr-
95
Jul-9
5
Oct
-95
Jan-
96
Apr-
96
Jul-9
6
Oct
-96
Jan-
97
Apr-
97
Jul-9
7
Oct
-97
Jan-
98
Rive
r flo
w (m
3 /s)
0
100
200
300
400
500
600
700
800
Jan-
94
Apr-
94
Jul-9
4
Oct
-94
Jan-
95
Apr-
95
Jul-9
5
Oct
-95
Jan-
96
Apr-
96
Jul-9
6
Oct
-96
Jan-
97
Apr-
97
Jul-9
7
Oct
-97
Jan-
98
Rive
r flo
w (m
3 /s)

H.P. Jar vie, A.J. Wade, D. Butterfield, P.G. Whitehead, C.I. Tindall, W.A. Vir tue, W. Dryburgh and A. McGraw
442
COMPARING OBSERVED AND SIMULATEDSTREAMFLOW HYDROGRAPHS
Observed mean daily river flows at Boleside and Norhamgauging stations from 1994 to 1997 and the correspondingsimulated mean daily river flows, following calibration ofthe INCA model, are shown in Fig. 4. The INCAhydrological calibration reproduces the dynamics of flowin the Tweed, although it tends to underestimate peak flows,especially at the upper site, Boleside. The fit of the calibrated
model simulations to the observed flow data (1994 to 1997)was assessed quantitatively by calculating the coefficientof determination (CoefOD) for each of the flow gaugingsites along the River Tweed (Table 5), where the CoefOD isdefined as follows (Nash and Sutcliffe, 1970):
CoefOD = 1 – (Σ (Oi – Pi)2/ Σ (Oi – µo)
2) (2)
For the ith value of data from 1 to n, O is the observedvalue, P is the predicted value and µo is the mean of theobserved values (Σi=1 Oi/n)
The coefficients of determination for flow in Reaches 12to 21 are all approximately 0.5 and above, thereforeindicating a successful model fit for the lower river reaches.However, at the two upper gauging stations, the coefficientsof determination were less than zero. This is likely to resultfrom reservoir storage and abstractions, which can havesignificant effects on the river flow at Kingledores, Lynefordand Scots Mill, but which have only a minor effectdownstream of Boleside (Institute of Hydrology 1998).
COMPARING OBSERVED AND SIMULATEDNITRATE CONCENTRATIONS
Examples of observed and simulated NO3-N concentrationsare shown in Fig. 5 for sites in the upper catchment (Juniper,Reach 9), middle catchment (Galafoot, Reach 13) and lowercatchment (Norham, Reach 23), and the coefficients ofdetermination (CoefOD) for NO3-N at the water qualitysampling sites along the River Tweed during the 1994 to1997 calibration period are shown in Table 6. Figure 5 showsthat dynamics of NO3-N variability are representedadequately by model simulations, especially in the middle
Table 5. Co-efficients of determination when comparingobserved and simulated river flows for the model calibrationphase (1994–1997) and model testing (1998 to 2000). (Co-efficients of determination were calculated using the methodsof Nash and Sutcliffe, 1970).
Reach No. 1994 to 1997 1998 to 2000 & Name (model calibration) (model testing)
3 Kingledores <0 <0 6 Lyneford <0 0.21 7 Scots Mill 0.36 0.5112 Boleside 0.54 0.5919 Sprouston 0.47 0.6121 Norham 0.56 0.56
Fig. 5. INCA calibration results for nitrate: observed and simulatedNO3-N concentrations at Juniper (Reach 9), Galafoot (Reach 13)and Norham (Reach 23) for 1994 to 1997. Observed nitrateconcentrations are shown as open circles; simulated nitrateconcentrations are shown as a solid black line.

Modelling nitrogen dynamics and distributions in the River Tweed, Scotland: an application of the INCA model
443
and upper catchment, and this is reflected in the CoefOD,which reach values of 0.35 at Juniper and 0.26 at Galafoot.However, at Norham, the coefficient of determination is lessthan zero for the calibration period. The main problem seemsto be an over-estimation of NO3-N concentrations duringthe low-flow period from July to November 1994, and thesubsequent period of wetting up and catchment nitratedelivery during the winter of 1994/1995. This may reflectthe inability of INCA to model in-stream uptake of nitrogenby aquatic plants, which are an important feature of thetributaries in the lower agricultural parts of the basin. Indeed,the lower reaches of the main river channel are subject toprolific growth of aquatic plants under extreme summerbaseflow conditions. The summer of 1995 was particularlydry, hot and sunny, with prolific filamentous algal growthrecorded from Ettrick Foot (Reach 14) to the tidal limit(Tweed River Purification Board, 1996).
The CoefOD across the water quality monitoring sites(Table 6) show a wide variation in the success of the modelfit during the 1994 to 1997 calibration phase, ranging fromCoefODs of less than zero in Reaches 3, 14, 15, 18 and 23,to a CoefOD of 0.44 in Reach 11 (Old Tweed Bridge). Theabsence of any obvious patterns in CoefOD values alongthe river demonstrates that there is a high degree of localvariation in the processes controlling nitrogen leaching andtransport in the different catchment vegetation/soil systemsand within individual river reaches.
Both observed and simulated NO3-N concentrations
demonstrate well-defined seasonality (Fig. 5), with lowestconcentrations occurring during the summer and risingNO3-N concentration in the autumn and winter, as soils wetup and nitrogen is flushed from the catchment. Typically,peak NO3-N concentrations occur in late February/earlyMarch. The low summer concentrations reflect (a) lowerflows and thus reduced delivery of diffuse-source nitrogenfrom the catchment, and (b) higher water residence timeswithin the river reaches, promoting greater in-streamdenitrification.
Model testingThe parameters derived by calibrating INCA for the RiverTweed between 1994 and 1997 were then used with datacollected between 1998 and to assess whether simulationswould reproduce spatial variations in average flow and NO3-N along the river reaches. Hydrological and NO3-Ndynamics were then tested by comparing simulated meandaily flows and NO3-N concentrations for 1998 to 2000,with corresponding observed flows and NO3-Nconcentrations using the model parameters derived from thecalibration run.
SPATIAL VARIATIONS IN FLOW AND NITRATECONCENTRATIONS
The simulated mean annual flow values and NO3-Nconcentrations (calculated from the 1998 to 2000 data) alongthe 23 reaches of the River Tweed compare well withobserved mean annual values (Figs. 6 and 7). For NO3-N,mean annual observed concentrations are based on arestricted number of water quality samples, whereas thesimulated mean annual NO3-N concentrations are based ondaily simulated values. Therefore, to calculate a CoefOD to
Table 6. Co-efficients of determination when comparingobserved and simulated nitrate concentrations for the modelcalibration phase (1994–1997) and model testing (1998 to2000). (Co-efficients of determination were calculated usingthe methods of Nash and Sutcliffe, 1970).
Reach Name 1994 to 1997 1998 to 2000No. (model (model
calibration) testing)
3 Kingledores <0 <09 Juniper 0.35 0.1911 Old Tweed Bridge 0.44 0.2512 Boleside 0.08 N/D13 Galafoot 0.26 0.2514 Lowood <0 0.415 Leaderfoot <0 0.3617 Rutherford 0.28 0.1818 Upper Floors <0 <021 Coldstream 0.19 0.1423 Norham <0 0.13
Fig. 6. Spatial variations in simulated and observed mean riverflows along the River Tweed during the model test period (1998 –2000). Observed flow values are shown as open circles; simulatedflow values are shown as black diamonds, joined by a solid blackline. Reach numbers are shown on the graph.

H.P. Jar vie, A.J. Wade, D. Butterfield, P.G. Whitehead, C.I. Tindall, W.A. Vir tue, W. Dryburgh and A. McGraw
444
compare observed and simulated mean annual NO3-Nconcentrations, the simulated means were calculated usingonly those values corresponding with the dates whenobserved NO3-N data were available. The CoefOD was 0.80for flow and 0.78 for NO3-N, indicating a very good modelfit for mean annual spatial variations in both flow and NO3-N along the River Tweed.
The steepest downstream gradients in mean annual flowvalues correspond with the major tributary inputs: Reach12, approximately 77 km from the source (the Ettrick Water),and Reach 19, approximately 120 km from the source (RiverTeviot). The steepest gradients in NO3-N concentrationsoccur in Reach 5, which represents a transition from uplandvegetation to arable land use, resulting in relatively highNO3-N inputs. This reach also receives a relatively smalltributary input from the Biggar Water, a headwater stream,receiving high effluent inputs from Biggar sewage treatmentworks (STW) (Robson et al., 1996). The slight reductionsin mean annual NO3-N concentrations from Reaches 7 to13, 16 to 18 and 21 to 22 may reflect hydrological dilutionwith water of lower NO3-N concentration and/or in-streamlosses of nitrate by in-stream uptake processes along theseriver reaches. There is a small but steep increase in NO3-Nconcentrations in Reach 14, which receives tributary inputfrom the Gala Water as well as urban runoff from the townof Galashiels and effluent from Galashiels STW. A majorincrease in NO3-N concentrations occurs in Reach 19,corresponding with input from the largest tributary, the RiverTeviot, which drains intensive arable land and areas withhigh livestock densities. A further steep increase in NO3-Nconcentrations occurs in Reach 23, which corresponds withthe tributary input from the River Till draining an area ofintensive arable land and high livestock densities.
FLOW AND NITRATE DYNAMICS
Timeseries of daily variations in simulated and observedflow concentration data for the model test period (1998 to2000) are shown in Fig. 8, for two river reaches: Boleside(Reach 12) and Norham (Reach 23). The model shows agood fit in terms of flow dynamics but, like the 1994 to1997 calibration period, INCA fails to predict the extremehigh flows (some of which may be associated with snowmeltevents in winter) and tends, slightly, to overpredictintermediate flows associated with the falling limb of stormhydrographs at both Boleside and Norham. However,CoefODs are relatively high for river flow at both sites forthe model test period (0.59 and 0.56 at Boleside and Norhamrespectively, Table 5), demonstrating successful model fit.CoefODs at the upper sites (Kingledores and Lyneford) aresignificantly lower, with poorer model fit reflectinginfluence of reservoir storage.
Timeseries of daily simulated and observed NO3-Nconcentrations for 1998 to 2000 are shown in Fig. 9, forthree sites: Juniper (Reach 9), Galafoot (Reach 13) andNorham (Reach 23). The model represents the seasonal
Fig. 7. Spatial variations in simulated and observed mean NO3-Nconcentrations along the River Tweed during the model test period(1998 – 2000). Observed nitrate concentrations are shown as opencircles; simulated nitrate concentrations are shown as blackdiamond joined by a solid black line. Reach numbers are shown onthe graph.
Fig. 8. INCA test results for hydrology: observed and simulated riverflows at Boleside (Reach 12) and Norham (Reach 23) for 1998 to2000. Observed flows are shown in dark blue; simulated flows areshown in red.
(a) Reach 12 (Boleside)
(b) Reach 23 (Norham)
050
100150200250300350400450500
Jan-
98
Mar
-98
May
-98
Jul-9
8
Sep-
98
Nov
-98
Jan-
99
Mar
-99
May
-99
Jul-9
9
Sep-
99
Nov
-99
Jan-
00
Mar
-00
May
-00
Jul-0
0
Sep-
00
Nov
-00
Jan-
01
Rive
r flo
w (m
3 /s)
0
200
400
600
800
1000
1200
Jan-
98
Mar
-98
May
-98
Jul-9
8
Sep-
98
Nov
-98
Jan-
99
Mar
-99
May
-99
Jul-9
9
Sep-
99
Nov
-99
Jan-
00
Mar
-00
May
-00
Jul-0
0
Sep-
00
Nov
-00
Jan-
01
Rive
r flo
w (m
3 /s)

Modelling nitrogen dynamics and distributions in the River Tweed, Scotland: an application of the INCA model
445
Fig. 9. INCA test results for nitrate: observed and simulated NO3-Nconcentrations at Juniper (Reach 9), Galafoot (Reach 13) andNorham (Reach 23) for 1998 to 2000. Observed nitrateconcentrations are shown as open circles; simulated nitrateconcentrations are shown as a solid black line.
dynamics in nitrate concentrations at all three sites, withCoefOD values of 0.19 (Juniper), 0.25 (Galafoot) and 0.13(Norham) (Table 6). Indeed, at Norham, nitrate model fitduring 1998 to 2000 is significantly better than during thecalibration phase of 1994 to 1997. During the 1998 to 2000model test period, INCA tends to underestimate winter peaksin nitrate concentrations, linked to high flow events,especially at Norham. The model test period of 1998 to 2000was characterised by higher HER than during the calibrationphase, especially during the summer months. Higher
summer HER has an important control on daily nitrateleaching dynamics, and this produces a better model fitduring the summer lower flows at Norham during 1998 to2000. CoefOD values demonstrate large variation betweenriver reaches and also between model test and calibrationperiods (Table 6). These results highlight issues of temporalas well as spatial variations in the processes controllingnitrate leaching and transport in neighbouring sub-catchments and river reaches.
Using model simulations to assessspatial and temporal variability innitrate sources and loadsFollowing successful calibration and testing of the TweedINCA model, simulations were used to investigate sourcesof nitrate loads (both point and diffuse source leaching loads)to the river and their variability through time. Firstly modelsimulations were used to examine the relative contributionof leaching loads from different land uses and effluentdischarge to the annual NO3-N load during 1995 along all23 river reaches. Secondly, seasonal variability in sourceswas assessed by examining the relative contributions of land-use types and effluents to monthly NO3-N loads withinReach 23 (Norham). Thirdly, daily dynamics in NO3-Nleaching loads were examined for two contrasting land-usetypes, arable and unfertilised grazing land, which representthe greatest contributors to NO3-N leaching loads in theTweed catchment. The uncertainty in the calibratedparameters means that any simulation results must remaintentative. However, the results are indicative of likelychanges in nitrogen dynamics in response to environmentalchanges.
ATTRIBUTING IN-STREAM NITRATE LOADS ALONGTHE RIVER TWEED TO DIFFERENT SOURCES
The simulated relative contributions of nitrate leaching fromdifferent land uses to the annual nitrate load of the Tweedfrom the source to the tidal limit are shown for one exampleyear (1995) in Fig. 10. The urban areas and point sourcecontributions are grouped into one category as the greatestcontributions from point sources tend to be found in urbanareas, and both sources provide only a very smallcontribution to total nitrate load in the Tweed catchment.The model simulation results indicate an overwhelmingdominance of unimproved grassland to the annual nitrateload in the upper and middle reaches of the Tweed. Thisreflects the rough livestock grazing within the upper andmiddle parts of the catchment. Moving downstream towardsthe lowland river reaches, arable contributions to NO3-N

H.P. Jar vie, A.J. Wade, D. Butterfield, P.G. Whitehead, C.I. Tindall, W.A. Vir tue, W. Dryburgh and A. McGraw
446
Fig. 10. Simulated relative contributions of different sources to the nitrate load along the River Tweed during 1995.
load increase (as the absolute NO3-N loads increase). BelowReach 15 (Leaderfoot), there is a large increase in theproportion of arable-derived NO3-N, reaching a maximumof approximately 60% of annual NO3-N load at Norham(Reach 23). The Leader tributary which flows into the Tweedin Reach 15, is a predominantly livestock area, butimportantly there is a very large broiler chicken farm in thecatchment, and nitrate concentrations in the Turfford Burntributary have increased rapidly with the expansion of thissector. In the reaches below Lyneford (Reach 6), improvedgrassland contributes a small but near-constant proportionof NO3-N load (around 15%). Ungrazed land contributesno more than 5% of total annual load at any point along theriver. While forests contribute over 20% of the annualNO3-N load in the upper two reaches, this contribution tailsoff to under 5% in the lower reaches of the Tweed. Urbanareas and point sources provide the lowest contribution tothe annual NO3-N load at any point on the river, owing tothe rural nature of the catchment and the low humanpopulation. Urban and point source inputs are greatest inthe middle reaches, reflecting nitrate inputs from the townsof Selkirk, Galashiels, St Boswells and Kelso.
SIMULATED SEASONAL VARIABILITY INCONTRIBUTING NITRATE SOURCES
The simulated contributions of the 6 land use categories tothe monthly NO3-N loads for Juniper (Reach 9), Galafoot(Reach 13) and Norham (Reach 23) are shown in Fig. 11.Throughout 1995, monthly loads of NO3-N in the upperand middle reaches (Juniper and Galafoot) were dominatedby leaching from unimproved grazing land, accounting forup to approximately 65% of monthly NO3-N loads. In thelower river at Norham, monthly loads of NO3-N weredominated by arable leaching which accounted for between
Fig. 11. Simulated relative contributions of different sources to themonthly nitrate load in the River Tweed at Norham (Reach 23)during 1995.
0%
20%
40%
60%
80%
100%
1 2 3 4 5 6 7 8 9 10 11 12 13 14 15 16 17 18 19 20 21 22 23
Reach number
urban&pointArableimproved pastureunimproved pastureungrazedForest
(a) Reach 9 (Juniper)
0%
20%
40%
60%
80%
100%
jan feb mar apr may jun jul aug sep oct nov dec
(b) Reach 13 (Galafoot)
0%
20%
40%
60%
80%
100%
jan feb mar apr may jun jul aug sep oct nov dec
(c) Reach 23 (Norham)
0%
20%
40%
60%
80%
100%
jan feb mar apr may jun jul aug sep oct nov dec
forest ungrazed unimproved pastureimproved pature arable urban & point

Modelling nitrogen dynamics and distributions in the River Tweed, Scotland: an application of the INCA model
447
50 and 70% of monthly NO3-N loads. At all three sites,there is a seasonal pattern in the proportion of urban andpoint sources; this reaches a maximum in August, reflectinglower river flows and reduced point source dilution duringthe summer months. Urban areas and point sources providethe greatest contributions to monthly NO3-N loads in themid-catchment at Galafoot (up to 10% NO3-N load inAugust), reflecting urban and sewage inputs from the townof Galashiels. The percentage of NO3-N load from arableand improved grassland increases during the summer at allthree sites, whereas unimproved grassland contributes ahigher percentage of monthly NO3-N loads during thewinter. This may reflect greater precipitation inputs anddelivery of diffuse source nitrate inputs from the moreupland areas during the winter. The proportion of nitratefrom forest and ungrazed land remains largely constantthroughout the year at all three sites, with a combinedcontribution of approximately 10 % at Juniper and Galafoot,but only 5% at Norham.
SIMULATED DYNAMICS IN DAILY NITRATELEACHING LOAD
Daily nitrate leaching loads, simulated for the subcatchmentdraining into Reach 13 (Galafoot) are shown in Fig. 12, forthe two land-use sources which contribute the largestproportion of nitrate leaching loads within the River Tweed:unimproved grassland and arable. These timeseriesdemonstrate a high variability in daily simulated NO3-Nleaching loads for both arable and unimproved grassland,and the timing of peak NO3-N inputs resembles the dailyHER timeseries closely (Fig. 3). NO3-N leaching from bothunimproved grassland and arable ceases during the summer/early autumn period of 1996, because of a lack ofhydrologically effective rainfall during this time. Although
nitrogen fertilisers are applied to the arable land from thebeginning of March to the end of August, this periodcorresponds with a time of generally lower simulatedNO3-N leaching loads from arable land. In addition to lowerrainfall and thus lower runoff generation, rates of biologicalactivity and uptake of N are also highest during the summer,resulting in lower NO3-N export.
Simulating environmental changewithin the Tweed catchment and itsimplications for nitrate leaching andriver transport
The calibrated INCA model of the River Tweed was usedto examine the impact of environmental change on nitrateconcentrations and loads in the Tweed catchment.Environmental change within the Tweed catchment wasmodelled in terms of two factors: land use change andchanging atmospheric nitrogen deposition.
Five land use scenarios were examined, related to changesin the proportions of different land-use types and fertiliserinputs:(i) a 20% reduction in all fertiliser applications;
(ii) all arable land converted to fertilised grassland,receiving no more than 150 kg-N ha–1 yr–1;
(iii) all arable land converted to unfertilised ungrazed land;
(iv) all grazed land converted to ungrazed land;
(v) all grazed fertilised land converted to arable; all grazednon-fertilised land converted to ungrazed land; and allexisting ungrazed land converted to forestry.
Fig. 12. Simulated daily nitrate leaching loads from unimproved pasture and arable to Reach 13 (Galafoot) 1994 to 2000.
0
0.05
0.1
0.15
0.2
0.25
0.3
1-Ja
n-94
1-Ap
r-94
1-Ju
l-94
1-O
ct-9
4
1-Ja
n-95
1-Ap
r-95
1-Ju
l-95
1-O
ct-9
5
1-Ja
n-96
1-Ap
r-96
1-Ju
l-96
1-O
ct-9
6
1-Ja
n-97
1-Ap
r-97
1-Ju
l-97
1-O
ct-9
7
1-Ja
n-98
1-Ap
r-98
1-Ju
l-98
1-O
ct-9
8
1-Ja
n-99
1-Ap
r-99
1-Ju
l-99
1-O
ct-9
9
1-Ja
n-00
1-Ap
r-00
1-Ju
l-00
1-O
ct-0
0
1-Ja
n-01
NO 3-
N le
achi
ng (k
g-N
/ha/
day)
Arable Unimproved pasture

H.P. Jar vie, A.J. Wade, D. Butterfield, P.G. Whitehead, C.I. Tindall, W.A. Vir tue, W. Dryburgh and A. McGraw
448
Scenarios (i) to (iii) correspond with Nitrate Sensitive Areasrecommendations (Johnes, 1996; Wade et al., 2001).Scenarios (iv) and (v) are linked to worst-case scenarios ofland use change in the Tweed catchment linked to a collapsein livestock farming within the catchment (see the discussionof agricultural change in the earlier description of the Tweedcatchment). In scenario (iv), all grassland is converted toungrazed land. Scenario (v) represents a majorreorganisation of land use within the Tweed catchment, withan expansion of arable into the more lowland of the existinglivestock areas, an expansion of forestry into existingungrazed areas, and existing unimproved grazing land beingconverted to ungrazed land.
Changing atmospheric deposition scenarios weremodelled as follows:
(vi) 50 % reduction in total N deposition;
(vii) 50 % increase in total N deposition;
(viii) 100 % increase in total N deposition;
(ix) 200 % increase total N deposition.
Whilst current European policy encourages reductions innitrogen emissions, largely though the use of catalyticconverters on vehicle exhausts, it is unclear how nitrogenemissions will change in the future. A potentially importantfactor in changing nitrogen deposition within the Tweedcatchment is a move towards more intensive livestockproduction and poultry farming and resultant increases inatmospheric ammonia emissions from these sources.Therefore, a range of scenarios was considered to coverpossible extremes. The INCA Tweed model was run for eachof the nine scenarios for the full modelling period (1994 to2000), by changing the relevant input parameters. TheNO3-N timeseries output for each scenario was thencompared with the output for the calibrated parameter set(the model ‘base run’), for two sites characteristic of theupper and lower river reaches (Juniper and Norham). Asummary, which compares mean daily NO3-N concen-trations for the model base run and for each scenario isprovided in Table 7. Scenario results are provided in termsof mean daily nitrate concentrations for (a) the full long-term data set (1994 – 2000), (b) summer (June to August),and (c) winter (November to February).
LAND-USE CHANGE SCENARIOS
Scenarios (i), (ii) and (iii), which are linked to reducedfertiliser inputs and a reduction in the proportion of arable
land had the greatest impact on reducing in-stream NO3-Nconcentrations in the lower river reaches, which drain thelowland agricultural parts of the catchment. Scenario (iii)produces the greatest percentage reductions in NO3-Nconcentrations, with > 50 % reduction in the concentrationof NO3-N at Norham throughout the year. Scenarios (i) and(ii) also result in a greater percentage reduction in NO3-Nconcentrations at Norham during the winter, compared withthe summer. This relates to reductions in the availability offertiliser-derived N for delivery from the catchment to theriver during the main period of nitrate flux transport underhigh flow conditions during the winter months.
Major agricultural re-organisation, linked to a dramaticreduction of livestock farming within the catchment ismodelled in scenarios (iv) and (v). The conversion of allgrazing land (both improved and unimproved grassland) toungrazed land produces an average reduction ofapproximately 20% in simulated in-stream mean dailyNO3-N concentrations in the upper catchment, comparedwith a 15% reduction in the lower river reaches. This higherpercentage loss in the upper catchment reflects thedominance of grazing land contributions to NO3-N leachingloads (approximately 70% at Reach 9 – Juniper, comparedwith approximately 35% at Norham). In scenario (v), theloss of grazing land is buffered to some extent by theconversion of improved grassland to arable land. This resultsin a much smaller percentage reduction in river NO3-Nconcentrations in the lower catchment (only 1%), comparedwith a 6% reduction in NO3-N concentrations in the uppercatchment.
ATMOSPHERIC DEPOSITION SCENARIOS
Scenarios of changing atmospheric total N inputs all havethe greatest impact in the upper catchment compared withthe lower catchment. This is because atmospheric nitrogensources contribute a greater proportion of total N inputs inthe upper catchment, since most upland land uses do notinvolve intensive application of fertilisers.
Each 50% change in atmospheric total N inputs changeslong-term mean daily in-stream NO3-N concentrations byapproximately 3.2% in the lower catchment, but 4% in theupper catchment. The percentage change in in-streamNO3-N concentrations is greater in winter than in summer.For example, there is a 5% change in winter mean dailyNO3-N concentrations per 50% change in total N depositionin the upper catchment, compared with a corresponding3.2% change in mean daily summer NO3-N concentrations.A 200% increase in total N deposition is predicted to resultin a 21% increase in winter mean daily NO3-N concen-trations in the upper catchment.

Modelling nitrogen dynamics and distributions in the River Tweed, Scotland: an application of the INCA model
449
Tabl
e 7.
Sum
mar
y ef
fect
s of d
iffer
ent l
and
use
chan
ge a
nd a
tmos
pher
ic d
epos
ition
scen
ario
s on
in-s
tream
nitr
ate
conc
entra
tions
, in
com
paris
on w
ith th
e m
odel
bas
e ru
n
Scen
ario
REA
CH
9 (J
UN
IPER
)R
EAC
H 2
3 (N
OR
HA
M)
no.
calib
rate
dsc
enar
io%
cha
nge
calib
rate
dsc
enar
io%
cha
nge
(bas
e ru
n) (b
ase
run)
120
% re
duct
ion
in N
O3-N
and
NH
4-N fe
rtilis
er lo
ads
long
-term
1.14
1.10
-3.4
1.85
1.64
-11.
6su
mm
er1.
051.
02-3
.51.
621.
47-9
.6w
inte
r1.
331.
29-3
.52.
542.
21-1
2.9
2A
ll ar
able
con
verte
d to
impr
oved
gra
zing
land
long
-term
1.14
1.10
-3.1
1.85
1.66
-10.
5su
mm
er1.
051.
02-3
.21.
621.
49-8
.3w
inte
r1.
331.
28-3
.62.
542.
19-1
3.7
3A
ll ar
able
con
verte
d to
ung
raze
d, u
nfer
tilis
ed la
ndlo
ng-te
rm1.
140.
97-1
4.2
1.85
0.79
-57.
3su
mm
er1.
050.
90-1
4.8
1.62
0.71
-56.
6w
inte
r1.
331.
14-1
4.1
2.54
1.07
-58.
04
All
graz
ing
land
(im
prov
ed a
nd u
nim
prov
ed)
long
-term
1.14
0.91
-19.
51.
851.
57-1
5.2
conv
erte
d to
ung
raze
d la
ndsu
mm
er1.
050.
86-1
8.1
1.62
1.38
-15.
2w
inte
r1.
331.
05-2
1.1
2.54
2.15
-15.
35
Exis
ting
ungr
azed
land
con
verte
d to
fore
stry
;lo
ng-te
rm1.
141.
07-5
.71.
851.
83-1
.1Ex
istin
g un
impr
oved
gra
zing
land
con
verte
d to
sum
mer
1.05
1.01
-3.9
1.62
1.60
-1.2
ungr
azed
land
;w
inte
r1.
331.
23-7
.62.
542.
52-1
.0w
inte
r1.
331.
23-7
.62.
542.
52-1
.06
Exis
ting
impr
oved
gra
zing
land
con
verte
d to
ara
ble
long
-term
1.14
1.09
-3.9
1.85
1.79
-3.3
50 %
redu
ctio
n in
atm
osph
eric
N d
epos
ition
win
ter
1.33
1.23
-7.6
2.54
2.52
-1.0
sum
mer
1.05
1.02
-3.1
1.62
1.58
-2.4
win
ter
1.33
1.27
-4.9
2.54
2.44
-3.8
750
% in
crea
se in
atm
osph
eric
N d
epos
ition
long
-term
1.14
1.18
4.0
1.85
1.91
3.2
sum
mer
1.05
1.09
3.2
1.62
1.66
2.4
win
ter
1.33
1.40
5.0
2.54
2.64
3.8
810
0% in
crea
se in
atm
osph
eric
N d
epos
ition
long
-term
1.14
1.23
8.0
1.85
1.98
6.5
sum
mer
1.05
1.12
6.3
1.62
1.70
4.8
win
ter
1.33
1.46
10.1
2.54
2.73
7.7
920
0% in
crea
se in
atm
osph
eric
N d
epos
ition
long
-term
1.14
1.32
16.5
1.85
2.10
13.2
sum
mer
1.05
1.19
12.8
1.62
1.78
9.8
win
ter
1.33
1.61
20.8
2.54
2.93
15.4

H.P. Jar vie, A.J. Wade, D. Butterfield, P.G. Whitehead, C.I. Tindall, W.A. Vir tue, W. Dryburgh and A. McGraw
450
DiscussionIn this study, INCA has been applied to a large-scale spatiallyheterogeneous catchment over a period of seven years,during which there has been a high degree of variability inclimatic conditions and river flows. Model calibration wasundertaken for the first four years of the data record (1994to 1997), which incorporated periods of summer drought,the most notable of which occurred in the summer of 1995,resulting in extremely low summer/autumn baseflowconditions. In contrast, the model test period (1998 to 2000)included periods of high summer HER, especially during1998. The ability of INCA to reproduce broad-scale seasonaldynamics in flow and nitrate concentrations at key sitesduring these changing river flow conditions suggests thatthe predominant processes controlling river water nitrateconcentrations have been represented successfully withinthe model. However, the variability in model fit along theriver reaches and through time highlights considerable localvariability in processes controlling the leaching and transportof nitrogen along the catchment-river continuum.
Extreme summer baseflow conditions during the modelcalibration phase had important implications for thelowermost reach of the river Tweed (Norham). Observednitrate concentrations during the summer and autumnperiods of 1994 and 1995 (Fig. 5) were significantly lowerthan simulated baseflow nitrate concentrations at Norham,suggesting that in-stream processes removing nitrate wereoperating. Long water residence times and a wide, shallowchannel cross-section in the lower reaches of the RiverTweed promote in-stream plant growth during these extremesummer baseflow conditions in both the main stem andlowland agricultural tributaries. In 1995, low river flows,combined with high river water temperatures (20–25oC) andsunlight resulted in prolific filamentous green algal growthsfrom Ettrick Foot to the tidal limit. The lower reaches ofWhiteadder, Teviot and Leet were also affected. Intense ratesof plant growth resulted in maximum values of pH of 10.00–10.35, with dissolved oxygen % saturation up to 254%(Tweed River Purification Board, 1996). Rapid plant growthand biomass production can result in rapid uptake of nitratefrom river water (Svendsen and Kronvang, 1993, Saundersand Kalff, 2001), and this may play a key role in controllingthe downstream nitrate flux and concentration reductionsobserved in the Tweed in the summer-autumn periods during1994 to 1996. The model fit at Norham was much betterduring the wetter summers of the model test period (1998to 2000), when observed nitrate concentrations weresignificantly higher (Fig. 9). This may reflect higher riverflows or poorer growth of aquatic plants and thus reducedin-stream nitrate uptake by plants. These results suggest that,
for applications of INCA to slow-flowing lowland eutrophicrivers, the possibility of incorporating a plant uptakecomponent needs to be investigated. Plant uptake parameterswill be variable through space and time, and linked to factorssuch as differences in reach morphology, water residencetimes and solar radiation.
While seasonal variability in nitrate concentrations waswell represented by model simulations, more short-termvariations, linked to individual predicted storm events wereless accurate. Extremely high flows and associatedintermittent high nitrate concentrations were often poorlysimulated. This may be a result of the heterogeneity ofresponse of source mobilisation to individual storm events,linked to differences in nitrate source availability in bothtime and space and delivery pathways.
However, INCA was successful in simulating downstreamaverage spatial variations in flow and nitrate concentrations,including the effects of flow and nitrate inputs from majortributaries. The model simulations provide valuable cluesabout key sources of nitrogen within the catchment and theirvariability in time and space. The simulations demonstratedthe importance of leaching from arable land to the loads ofnitrate draining from the Tweed catchment (up toapproximately 70% of monthly nitrate loads in 1995).Significant increases in river water nitrate fluxes correspondto the transition from the upland to the lowland parts of thecatchment, linked to a shift in land use from predominantlyunimproved grassland to arable. Highest leaching loads forall vegetation types occurred during the winter high flows,and leaching loads are closely linked to the timeseries ofHER and thus runoff generation, with lower summerleaching loads linked to lower rates of runoff generationand biological uptake of N. Analysis of seasonal patterns insimulated nitrate leaching loads suggests that the percentagecontributions of agriculture and improved grassland to in-stream nitrate loads increase during the summer, and theseare linked to higher contributions from unimprovedgrassland during the winter. Unimproved grassland is thepredominant land-use type in the upper catchment andincreases in nitrate leaching from unimproved grasslandrelative to agriculture and improved grassland may reflectgreater runoff generation and nitrate delivery from the uppercatchment during the winter months.
Simulated model responses to environmental changescenarios suggest possible catchment responses toperturbations in land use or atmospheric nitrogen inputs.However, caution must be exercised in evaluating modelpredictions, owing to the complex nature of the catchmentsystem and the multitude of possible feedback processes inthe real world, not included within the INCA model. Duringcalibration, the parameters are fixed, which implies that the

Modelling nitrogen dynamics and distributions in the River Tweed, Scotland: an application of the INCA model
451
relationships between soil nitrogen transformation processesare fixed. As nitrogen processes respond to environmentalchange, it would be expected that the relationships wouldchange and, therefore, the simulation results of futurescenarios must remain tentative. Potential process responsesto environmental changes require thorough investigationthrough field and laboratory studies. Land use scenarioslinked to implementation of Nitrate Sensitive Areasrecommendations have greatest impact in the lower riverreaches; a 20% reduction in fertiliser inputs is predicted toresult in average reductions of 12% in-stream nitrateconcentration at Norham. However, by allowing all arableland to revert to its semi-natural state (ungrazed, unfertilisedgrassland), INCA predicts an average nitrate reduction atNorham of 57%. Land use changes associated with dramaticreductions in livestock, have greatest impact on nitrateconcentrations in the upper catchment, which is dominatedby livestock farming. By allowing all grazing land to revertto its semi-natural state (ungrazed, unfertilised grassland),INCA predicts an average reduction in nitrate concentrationsof 20% at Juniper (Reach 9). Atmospheric depositionscenarios similarly have greatest impact in the upper Tweedcatchment, with an average 4% change in river-water nitrateconcentrations for every 50% change in atmosphericnitrogen deposition. However, the impact of these scenariosof increased atmospheric deposition on the eutrophic statusof the River Tweed is likely to be small. The greatestNO3-N contributions in the upper reaches are derived fromdiffuse-source run-off from unimproved grasssland whichoccurs predominantly during the winter, rather than duringthe summer growing season for macrophytes andfilamentous green algae. However, these diffuse sourceincreases could potentially exacerbate spring epilithic diatomgrowths. During the early 1980s, prolific benthic diatomgrowths were observed in the middle reaches of the Tweedduring the spring. These diatom blooms have been attributedto greater diffuse source nutrient inputs, linked to changesin land use in the upper and middle catchment and, inparticular, a shift towards winter sown cereal productionand increased fertiliser usage (Clayton, 1997). Predictedchanges in nitrate concentrations linked to environmentalchange are not uniform throughout the year. Changes in landuse and atmospheric inputs tend to have greatest impact onwinter nitrate concentrations, since winter runoff generationprovides the main route of delivery of nitrate from thecatchment to the river. This means that measures to reducein-stream nitrate have greatest proportional effect duringthe winter. However, greatest risk of eutrophication occursunder summer low flows. Therefore, the scale of differencesin response to environmental perturbation between winterand summer needs to be taken into account when assessing
potential impacts of change. Predicted increases in nutrientinputs in response to environmental change may be bufferedto some extent by enhanced aquatic plant growth and in-stream uptake, especially if nitrogen increases areaccompanied by enhanced rates of phosphorus leaching(Neal, 2002).
Concluding remarksINCA has been applied to the Tweed for modelling flowand seasonal nitrate dynamics over a seven-year period. Thelower river reaches are susceptible to overestimation ofsummer/early autumn baseflow nitrate concentrations duringdry years and this may be linked to aquatic plant uptakeeffects. Consideration should now be given to incorporatinga spatially and temporally variable in-stream plant uptakemodule for application of INCA to lowland eutrophic rivers.Short-term variability in flow and nitrate concentrationsduring winter storm events tends to be less accuratelysimulated, which may be linked to complexity of short-termrunoff and source generation processes. However, INCA issuccessful in modelling the seasonal dynamics in nitrateconcentrations and broad-scale spatial variability in nitrateconcentrations from the upland region to the lowlands undera wide range of hydroclimatic conditions. The model nowprovides a valuable tool by which to assess contributions ofdifferent catchment sources of nitrogen in the Tweed andpossible effects of future changes in catchment land use andmanagement. The application and further development ofthe model in collaboration with catchment managers andpolicy makers is strongly encouraged.
ReferencesBall, S., 1993. Nitrate and the law. In: Nitrate:Processes, Patterns
and Management. T.P. Burt, A.L. Heathwaite and S.T. Trudgill(Eds.), Wiley, Chichester, UK. 386–400.
Chapman, P.J., Edwards, A.C. and Cresser, M.S.,2001. Thenitrogen composition of streams in upland Scotland: someregional and seasonal differences. Sci. Total Envir., 265, 65–83.
Clayton, J.W., 1997. The biology of the River Tweed. Sci. TotalEnvir., 194/195,155–162.
Cosby, B.J., Wright, R.F., Hornberger, G.M. and Galloway, J.N.,1985a. Modelling the effects of acid deposition: assessment ofa lumped parameter model of soil water and stream waterchemistry. Water Resour. Res., 21, 51–63.
Cosby, B.J., Wright, R.F., Hornberger, G.M. and Galloway, G.N.,1985b. Modelling the effects of acid deposition: assessment oflong-term water quality responses in a small forested cathment.Water Resour. Res., 21, 1591–1601.
Cosby, B.J., Ferrier, R.C., Jenkins, A., Emmett, B., Tietama, A.and Wright, R.F., 1997. Modelling the ecosystem effects of Ndeposition at the catchment scale: model of ecosystem retentionand loss of inorganic nitrogen (MERLIN). Hydrol. Earth. Syst.Sci., 1, 137–158.

H.P. Jar vie, A.J. Wade, D. Butterfield, P.G. Whitehead, C.I. Tindall, W.A. Vir tue, W. Dryburgh and A. McGraw
452
Dise, N.B. and Wright, R.F., 1995. Nitrogen leaching fromEuropean forests in relations to nitrogen deposition. Forest.Ecol. Manage., 71, 153–163.
Emmett, B.A., Reynolds, B., Stevens, P.A., Norris, D., Hughes,S., Gorres, J. and Lubrecht, I., 1993. Nitrate Leaching fromafforested Welsh catchments – interactions between stand ageand nitrogen deposition. Ambio, 22, 386–394.
Emmett, B.A., Stevens, P.A. and Reynolds, B., 1995. Factorsinfluencing nitrogen saturation in Sitka spruce stands in Wales,UK. Wat. Air. Soil Pollut., 85, 1629–1634.
Fertliser Manufacturers’ Association, 1994. British Survey ofFertiliser Practice: Fertiliser use on Farm Crops. HMSO.London.
Fowler, D., Cape, J.N. and Unsworth, M.H., 1989. Deposition ofatmospheric pollutants on forests. Phil. Trans. Roy. Soc. London,B 324, 247–265.
Fuller, R.M., 1993. The land use cover map of Great Britain. EarthSpace Review, 2, 13–18.
Gustard, A., Marshall, D.C.W. and Sutcliffe, M.F., 1987. Low flowestimation in Scotland. Institute of Hydrology Report no. 101,Institute of Hydrology, UK.
Heathwaite, A.L., Johnes, P.J. and Peters, N.E., 1996. Trends innutrients. Hydrol. Proc., 10, 263–293.
Institute of Hydrology, 1998. Hydrological data UK. HydrometricRegister and statistics, 1991–1995. Institute of Hydrology, UK.
Jakeman, A.J., Littlewood, I.G. and Whitehead, P.G., 1990.Computation of the instantaneous unit hydrograph andidentifiable component flows with application to two uplandcatchments. J. Hydrol., 117, 273–300.
Jarvie, H.P., Whitton, B.A. and Neal, C., 1998. Nitrogen andphosphorus in east coast British rivers: speciation, sources andbiological significance. Sci. Tot. Environ., 210/211, 79–109.
Johnes, P.J., 1996. Evaluation and management of the impact ofland use change on nitrogen and phosphorus load delivered tosurface water: the export coefficient modelling approach. J.Hydrol., 183, 323–349.
Leeks, G.J.L., Neal, C., Jarvie, H.P., Casey, H. and Leach, D.V.,1997. The LOIS river monitoring network: strategy andimplementation. Sci. Total Envir., 194/195, 101–109.
MAFF (Ministry of Agriculture, Fisheries and Food), 1989. Thenitrate sensitive areas scheme. HMSO, London.
MAFF/WOAD (Ministry of Agriculture Fisheries and Food, WelshOffice Agriculture Department), 1991. Code of GoodAgricultural Practice for the protection of Water. HMSO,London.
Meteorological Office, 1981. The MORECS system. HydrologicalMemorandum no. 45.
Nash, J.E. and Sutcliffe, J.V.,1970. River flow forecasting throughconceptual models. Part 1a Discussion of principles. J. Hydrol.,10, 282–290.
Neal, C., 2002. Nutrient concentrations and fluxes for podzolicsoils at Plynlimon, mid-Wales: implications for modellinginorganic nitrogen and phosphorus in upland UK environments.Hydrol. Earth Sys. Sci., 6., 403–420.
Neal, C., Robson, A.J., Jeffrey, H.A., Harrow, M.L., Neal, M.,Smith, C.J. and Jarvie, H.P., 1997. Trace element inter-relationships for the Humber rivers: inferences for hydrologicaland chemical controls. Sci. Tot. Environ., 194/195, 321-343.
Parkinson. R.J., 1993. Changes in Agricultural Practice. In Nitrate:Processes, Patterns and Management, T.P. Burt, A.L.Heathwaite and S.T. Trudgill (Eds.), Wiley, Chichester, UK.386–400.
RGAR, 1997. Acid deposition in the UK 1993 – 1994. Fourthreport on the Review Group on Acid Rain. Department of theEnvironment, London, UK. 176pp.
Robson, A.J. and Neal, C., 1997. Regional water quality of theriver Tweed. Sci. Total Envir., 194/195, 173–192.
Robson, A.J., Neal, C., Currie, J.C., Virtue, W.A., Ringrose, A.,1996. The water quality of the Tweed and its tributaries. Instituteof Hydrology Report No. 128, Wallingford, UK. 58pp.
Rodgers, I.R., 1993. Transport and depositional model needs forpower generation. In: Pollution transport and depositionmodelling. Report on the conclusions of the National ForumICON.
Saunders, D.L. and Kalff, J., 2001. Nitrogen retention in wetlands,lakles and rivers. Hydrobiologia, 443, 205–212.
Scottish Office, 1997. Prevention of Pollution from AgriculturalSources: a Code of Good Practice. Scottish Office Agriculture,Environment and Fisheries Department. Edinburgh, Scotland.
Stewart, W.D.P., Preston, T., Peterson, H.G. and Christofi, 1982.Nitrogen cycling in the eutrophic freshwaters. Phil Trans Roy.Soc. London, B 296, 491–509.
Stoddart, J.L., 1994. Long-term change changes in watershedretention of nitrogen: its causes and aquatic consequences. In:Environmental Chemistry of lakes and reservoirs Advances inChemistry series no. 237, L.A. Baker (Ed.). American ChemicalSociety, Washington DC. 223–284.
Svendsen, L.M. and Kronvang, B., 1993. Retention of nitrogenand phosphorus in a Danish lowland river system: implicationsfor the export from the watershed. Hydrobiologia, 251, 123–135.
Tindall, C.I. and Moore, R.V., 1997. The Rivers database and theoverall data management for the Land-Ocean Interaction StudyProgramme. Sci Total Envir., 194/195, 129–135.
Tweed River Purification Board, 1996. Tweed River PurificationBoard Annual Report Annual Report 1995/96. ScottishEnvironment Protection Agency, Galashiels, UK. 28pp.
Wade, A.J., Neal, C., Soulsby, C., Smart, R.P., Langan, S.J. andCresser, M.S., 1999. Modelling streamwater quality undervarying hydrological conditions at different spatial scales. J.Hydrol., 217, 266–283.
Wade, A.J., Soulsby, C., Langan, S.J., Whitehead, P.J., Edwards,A.C., Butterfield, D., Smart, R.P., Cook, Y. and Owen, R.P.,2001. Modelling instream nitrogen variability in the Deecatchment, NE Scotland. Sci. Total Envir.., 265, 229–252.
Wade, A.J., Durand, P., Beaujouan, V., Wessels, W., Raat, K.,Whitehead, P.G., Butterfield, D., Rankinen, K. and Lepistö, A.,2002. A nitrogen model for European catchments: new modelstructure and equations. Hydrol. Earth Sys. Sci., 6, 559–582.
Whitehead, P.G., Williams, R. and Lewis, D., 1997. QualitySimulation Along Rivers (QUASAR): model theory anddevelopment. Sci Total Envir., 194/195, 447–456.
Whitehead, P.G., Wilson, E.J. and Butterfield, D., 1998a. A semi-distributed integrated nitrogen model for multiple sourceassessment in catchments (INCA): Part I, model structure andprocess equations. Sci. Total Envir., 210/211, 547–558.
Whitehead, P.G., Wilson, E.J, Butterfield, D. and Seed, K., 1998b.A semi-distributed integrated flow and nitrogen model formultiple source assessment in catchments (INCA): Part II,application to large river basins in south Wales and easternEngland. Sci. Total Envir., 210/211, 559–583.

Modelling nitrogen dynamics and distributions in the River Tweed, Scotland: an application of the INCA model
453
Appe
ndix
: IN
CA
Twee
d in
put p
aram
eter
s:
(a) E
stim
ated
par
amet
er v
alue
s fo
r eac
h la
nd u
se c
ateg
ory
Uni
tFo
rest
Shor
t Veg
etat
ion
Shor
t Veg
etat
ion
Shor
t Veg
etat
ion
Ara
ble
Urb
anPa
ram
eter
(Ung
raze
d)G
raze
d, U
nfer
tilis
edFe
rtilis
ed(u
nim
prov
ed g
rass
land
)(im
prov
ed g
rass
land
)
NO
3-N a
dditi
on (f
ertil
iser
/live
stoc
k)kg
-N/h
a/yr
0
0
0
41
530
NH
4-N a
dditi
on (f
ertil
iser
/live
stoc
k)kg
-N/h
a/yr
0
0
0
41
530
Plan
t gro
wth
sta
rt da
yda
y 6
0 6
0 6
0 6
060
0Pl
ant g
row
th p
erio
dda
ys24
524
524
524
519
00
Ferti
liser
add
ition
sta
rt da
yda
y
0
0
0 6
060
0Fe
rtilis
er a
dditi
on p
erio
dda
ys
0
0
018
418
40
(b) C
alib
rate
d pa
ram
eter
s fo
r eac
h la
nd u
se c
ateg
ory
Para
met
erU
nit
Fore
stSh
ort V
eget
atio
nSh
ort V
eget
atio
nSh
ort V
eget
atio
nA
rabl
eU
rban
(Ung
raze
d)G
raze
d, U
nfer
tilis
edFe
rtilis
ed(u
nim
prov
ed g
rass
land
)(im
prov
ed g
rass
land
)
Den
itrifi
catio
n ra
teda
y -1
0.00
10.
001
0.00
20.
001
0.00
10
Plan
t NO
3-N u
ptak
e ra
teda
y -1
00
00
00
Max
. pla
nt n
itrog
en u
ptak
ekg
-N/h
a/ye
ar75
4210
010
514
00
NH
4-N n
itrifi
catio
n ra
teda
y -1
0.07
0.1
0.05
0.02
0.02
0N
H4-N
min
eral
isat
ion
rate
day
-10.
250.
250.
320.
50.
50
NH
4-N im
mob
ilisa
tion
rate
day
-10.
070.
070.
010.
005
0.00
40
Plan
t NH
4-N u
ptak
e ra
teda
y -1
0.45
0.3
0.5
0.01
0.02
0M
ax. S
oil M
oist
ure
Def
icit
mm
100
100
100
100
100
100
Max
. air-
soil
tem
pera
ture
diff
eren
ceo C
4.5
4.5
4.5
4.5
4.5
4.5
Soil
wat
er ti
me
cons
tant
days
2.3
2.3
2.3
2.3
2.3
2.3
Gro
und
wat
er ti
me
cons
tant
days
2323
2323
2323
(c) C
alib
rate
d in
itial
con
ditio
ns
Uni
tFo
rest
Shor
t Veg
etat
ion
Shor
t Veg
etat
ion
Shor
t Veg
etat
ion
Ara
ble
Urb
anPa
ram
eter
(Ung
raze
d)G
raze
d, U
nfer
tiliz
edFe
rtiliz
ed(u
nim
prov
ed g
rass
land
)(im
prov
ed g
rass
land
)
Surf
ace
NO
3-N c
once
ntra
tion
mg-
N/l
11
13
31
Subs
urfa
ce N
O3-N
con
cent
ratio
nm
g-N
/l1.
51.
51.
54
41.
5Su
rfac
e N
H4-N
con
cent
ratio
nm
g-N
/l0
00
00
0Su
rfac
e N
H4-N
con
cent
ratio
nm
g-N
/l0
00
00
0

H.P. Jar vie, A.J. Wade, D. Butterfield, P.G. Whitehead, C.I. Tindall, W.A. Vir tue, W. Dryburgh and A. McGraw
454