modelling of a gfrp adhesive connection by an imperfect
TRANSCRIPT

HAL Id: hal-02478526https://hal.archives-ouvertes.fr/hal-02478526
Submitted on 25 Jun 2020
HAL is a multi-disciplinary open accessarchive for the deposit and dissemination of sci-entific research documents, whether they are pub-lished or not. The documents may come fromteaching and research institutions in France orabroad, or from public or private research centers.
L’archive ouverte pluridisciplinaire HAL, estdestinée au dépôt et à la diffusion de documentsscientifiques de niveau recherche, publiés ou non,émanant des établissements d’enseignement et derecherche français ou étrangers, des laboratoirespublics ou privés.
Modelling of a GFRP adhesive connection by animperfect soft interface model with initial damage
Aurelien Maurel-Pantel, Marco Lamberti, Maria Letizia Raffa, Camilo Suarez,Francesco Ascione, Frédéric Lebon
To cite this version:Aurelien Maurel-Pantel, Marco Lamberti, Maria Letizia Raffa, Camilo Suarez, Francesco Ascione, etal.. Modelling of a GFRP adhesive connection by an imperfect soft interface model with initial damage.Composite Structures, Elsevier, 2020, pp.112034. �10.1016/j.compstruct.2020.112034�. �hal-02478526�

Modelling of a GFRP adhesive connection by animperfect soft interface model with initial damage
A.Maurel-Pantela,∗, M.Lambertia, M.L.Raffac, C.Suareza, F.Ascioneb,F.Lebona
aAix Marseille Univ, CNRS, Centrale Marseille, LMA, Marseille, FrancebDept. of Civil Engineering, University of Salerno, Italy
cSupmeca, Laboratoire QUARTZ (EA 7393), Saint Ouen Cedex, France
Abstract
In this paper a methodology to model a GFRP adhesive connections by using
an imperfect soft interface model is presented. The model based on Kachanov’s
theory considered a cracked thin adhesive. Within this framework, the mechani-
cal properties and the initial damage (diffuse initial cracks) of the adhesive layer
has been experimentally evaluated. With a modified Arcan system, static tests
were performed on adhesively bonded assemblies in tensile and shear solicitation
mode considering three different adhesive thicknesses. The experimental results
highlighted how the thickness of adhesive influences the mechanical strength
and stiffness of the bonded connection. CT-scans were performed to measure
the porosity rate in the adhesive layer. Furthermore, the excellent comparison
of numerical and experimental data of an adhesive GFRP bonded connections
allow us to consider the imperfect soft interface model proposed as highly com-
petitive to evaluate complex structure performance in civil engineering context.
A parametric analysis has been proposed to provide a formula able to describe
the full response of the structure at varying adhesive property.
Keywords: Adhesive bonding, Imperfect interface model, GFRP connection,
CT-scan, Damage, Porosity
2019 MSC: 00-01, 74S05, 74k30, 74R10
∗Corresponding authorEmail address: [email protected] (A.Maurel-Pantel)
Preprint submitted to Composite Structures June 25, 2020

1. Introduction
During the last decade, the applications in the field of civil engineering of
composite structures made of FRP (Fibre Reinforced Polymers) involving ad-
hesives are grew exponentially due to the ability to tailor its structural perfor-
mance, high axial resistance, high resistance to aggressive environment [1, 2, 3],5
considerably lightweight when compared to conventional materials, and quick
installation time.
One of the most promising application is the realization of a beam-to-column
connection by using structural adhesives that is becoming a valid alternative to
the classical bolted connection. From nineties [4][5][6][7][8][9][10] to nowadays10
[11][12][13][14] beam-to-column connections were bolted and composed of I pro-
files based on the experience from steel applications. One of the principal draw-
back of these kind of connections is the bearing failure that limits the strength
and stiffness.
On the contrary, in bonded connections due to the absence of holes, stresses15
are more uniformly distributed over the bonded surfaces. Indeed, the lack of
holes avoid the presence of stress concentration, damage to the fibers and reduce
the risk of moisture penetration in members. Moreover, adhesively bonded
joints offer many advantages for the design of structures. But to improve the
confidence that currently limits the use of this technology, several authors try20
to develop experimental [15][16][17] or numerical [18][19][20] approaches.
Recently, several experimental and numerical investigations were performed
by some authors [21][22][23] to assess strength and stiffness of GFRP adhesive
connection showing that their overall performance can match or overcome the
performance of similar bolted connections in FRP structures. In the above men-25
tioned papers the role of GFRP geometry was investigated varying the profiles
adopted. In details, in [21][22] I-profiles (Fig.1(a)) were used for the beam and
the column while in [23], a square tube was used for the column and U-profiles
for the beam (built-up) as depicted in Fig.1(b). The first type of connection
2

(I-profiles) presented similar strength respect to the analogous bolted connec-30
tions while the last one showed an increase in terms of strength and stiffness
equal to 45%. If the overall mechanical response was deeply investigated, the
Figure 1: Homogeneous clamping device for the test samples
role of adhesive layer was not sufficiently studied. In particular, its thickness
and its mechanical properties have to be deeply investigated in view of a further
improvement of the mechanical response of such a bonded connection as well as35
for proposing design formulas.
The present paper proposes a methodology to model a GFRP adhesive con-
nection in a complex structure by using an imperfect soft interface model (in
the sense of [24] [25]) previously presented in [26]. In a first section a sum-
mary of previous experimental results obtained on a GFRP beam to column40
connection is proposed. Then in a second section the imperfect interface model
is described. This model is derived by an asymptotic analysis [27] on a micro
cracked adhesive based on Kachanov assumptions [28][29] successfully applied
to composites materials [30, 31, 32]. The Kachanov theory consists to consider
in a micro cracked adhesive the following main assumptions: a non interaction45
between the crack, a constant stress vector along the crack, and to ignore the
3

effect of the crack edge in the stress field. The choice of this model was done
thanks to the possibility to take into account some bonding variabilities such as
thickness variation, porosity, and initial damage. In a third section, experimen-
tal investigations are proposed in terms of adhesive stiffness and initial damage50
evaluation. Based on aforementioned experimental results, the interface model
is enhanced. Finally the model is implemented in a finite element software
and its validation is proposed comparing numerical results with those obtained
experimentally[21].
Figure 2: Details of the beam-to-column connections tested: (a) BTCj fc, (b) BTCj fcr.
2. GFRP Beam-to-column adhesive connection: experimental tests55
on complex structure
Some of the authors have experimentally investigated in a previous research
program [21] the behavior of full-scale bolt-free GFRP beam-to-column con-
nection under static load. Both the beam and the column had I-profile with
dimensions of 200x100x10 mm. Four beam-to-column connection prototypes60
were tested varying the position of the connection respect to the column height
and the strengthening system adopted. In all cases, the beam flanges and web
4

were bonded to the column compression flange by 50x50x6 mm seat angles. The
connections which mechanical behavior is here numerically investigated are de-
picted in Fig.2. They have been originally designated as BTCJ fc and BTCJ fcr65
where BTCJ stands for Beam-to-Column Junction, fc for flange connection, the
letter r for reinforced, respectively. More in detail, as shown in Fig.2(b), the
strengthening system (to avoid premature failure of the column) consisted of
pultruded GFRP strips (170x45x10 mm) and an angle at the column web/flange
connection. The column can be considered fixed at the bottom with its unsup-
Figure 3: GFRP beam column experimental tests: Load-beam tip deflection.
70
ported length being 650 mm. To support the column at its bottom, it has been
inserted inside a 350 mm high stiff steel jacket welded to a thick steel plate that
was bolted to the testing machine platen (Fig.2). The beam was loaded mono-
tonically in displacement control at a rate of 1 mm.min−1 by a servo-controlled
universal testing machine. The beam and column assembly was load by a point75
load applied near the free end of the beam at 450 mm from the beam-column
flange connected to the beam (Fig.2). The experimental results are reported
5

in Fig.3 in terms of Load-beam vertical deflection. The latter is relative to the
same cross-section where the load is applied. The connection exhibited basi-
cally a linear response up to failure. The un-strengthened connection reached a80
maximum applied load of 15.4 kN, while the strengthened one failed at about
23 kN. It must be pointed out that the deflection values in Fig.3 represent the
deflection of the beam as a cantilever plus the deflection caused by the column
end rotation, the local deformation of the column web and the joint rotation.
All the graphs exhibit nonlinearity at low load levels, followed by a linear part85
and again ending with a nonlinear segment. The initial nonlinearity is the result
of the specimen initial seating and not a characteristic of the connection.
3. Imperfect interface model
The proposed imperfect interface model coupling unilateral contact and dam-
age is obtained via homogenization techniques and by an asymptotic approach90
within the small perturbations framework [27, 31]. The damaging behavior is
modeled using the approach introduced in [26, 30, 32]: the thin glue interphase
sandwiched between the two GFRP structures is assumed to be a microcracked
material undergoing a degradation process. Each step of the proposed modeling
strategy, sketched in Fig.5, is described below.95
� Step 1: The real microstructure of the glue comprises various microcracks
families with randomly distributed lengths and orientations. Within the
non-interacting approximation [29] framework only one family of parallel
microcracks which is representative of the macroscale behavior of the glue
has been chosen denoting the equivalent length of microcracks family as100
l. Furthermore, the cracks orientation has been assumed parallel to the
bonding plate.
� Step 2: The effective mechanical properties of the idealized microcracked
material of Step 1 are obtained through a Kachanov-type homogenization
technique [28, 29] based on the Eshelby’s problem. The obtained elastic105
6

GFRP
GFRP
GFRP
GFRP
Cracked glue Idealized cracked glue Homogenized glue
GFRP bonded by homogenized glue
GFRP bonded by Imperfect interface
Step 1 Step 2
Step 3Step 4
𝑙
𝜀𝑆
𝑛
𝑡
Figure 4: Imperfect interface modeling methodology
properties depend on the microcracks density ρ, which 3D form is ρ =l3
V,
V being the volume of the representative elementary domain. In section
4, it will be shown that l can be experimentally characterized. As an
example, the Young’s modulus in the normal-to-bonding plane direction
EN is equal toE0
1 + Cρwhere E0 is the Young’s modulus of the undamaged110
material and C is given by16(1− ν20)
3, where ν0 is the Poisson ratio of the
undamaged material. Note that the cracks density ρ can evolve thus it is
representative of a damage parameter. An evolution law is introduced on
l (or equivalently on ρ). To this purpose, the variation in time of l can
be associated to a pseudo-potential of dissipation φ that is given by the115
sum of a quadratic term (rate-dependent) and a positively 1-homogeneous
functional (rate-independent) [26]. The pseudo-potential of dissipation
reads as: φ(l) = 12ηl
2 + I]0,∞[(l) where η is a positive viscosity parameter
(which depends on the thickness of the glue) and IB denotes the indicator
function of a set B, i.e. IB = 0 if x ∈ B and IB = ∞ otherwise. The120
term I]0,∞[ forces the crack length to assume non-negative values (i.e. the
crack length can only increases) and renders the irreversible character of
7

the degradation process of the glue. In addition, the damage begins only
if the elastic work is greater that a given value ω (which depends on the
thickness of the glue) [26]. It is established that a Kachanov-type material125
is a soft material, i.e. the stiffness of the glue is of the same order as its
thickness [33]. However, to impose unilateral contact (non-penetration
condition) in the asymptotic expansions (Step 4), the glue is considered
as a soft material only in traction (see first line of Equation (1)).
� Step 3: The homogenized material defined in step 2 is used to model a130
thin glue interphase of thickness ε. This interphase is sandwiched between
two GFRP layers (denoted also adherents). We make the assumption
that the bonding between the interphase and the adherents is perfect (i.e.
continuity in interface separation and stress vector).
� Step 4: Using matching asymptotic expansions [27], the small parameter
being the thickness of the glue, it is obtained at the limit that the inter-
phase volume of the glue is replaced by an interface S of normal unit n
(see fig. 5). More precisely, it is obtained a relationship across the surface
S between the two adherents linking the stress vector σn and the interface
separation [u]: σn = K(l) [u]+ + τn on S
τ [u] .n = 0, τ ≤ 0, [u] .n ≥ 0 on S
ηl =(ω − 1
2K,l(l) [u]+ . [u]+)+
on S
(1)
where (),l denotes the partial derivative in l, ()+ is the positive part of135
a function, [u]+ = [u] if [u] .n ≥ 0, [u]+ = [u] − [u] .n if [u] .n ≤ 0. The
parameter η (resp. ω) is the limit of η ε (resp. ω ε). Finally, as classically,
K is the stiffness of the interface (the ratio between the stiffness of the
glue and its thickness). Further details on asymptotic expansions, can be
found in [27].140
The interface constitutive law obtained in Equation (1) is a spring-like nonlinear
interface model with a nonlinear evolution (i.e. damage) as related in Fig.5.
8

Note that the stiffness K keeps in memory the mechanical features of the original
interphase (geometry, mechanical properties and damage).
Figure 5: Interface constitutive law of the imperfect interface model proposed in Equation (1)
for different values of η. (a) normal stress component and (b) two tangential stress compo-
nents.
4. Adhesive experimental characterization145
4.1. Adhesive and Substrate
The adhesive used in experimental investigation [21] was the Sikadur-30 pro-
duced by Sika [34]. Such an adhesive is a 2-components thixotropic structural
adhesive, a mixture of epoxy resin and special fillers, designed to bond at tem-
peratures between 8◦ and 35◦. The curing takes place in 7 days at room tem-150
perature. The properties of the glue given by the manufacturers are collected
in Table 1. The substrates take the form of cylindrical specimens as depicted
SikaDur30 Values (MPa) Test standards
Young Modulus EC 9, 600 ASTM D695
ET 11, 200 ISO 527
Compressive Strength σC 70− 80 (at 15◦C) et 85− 95 (at 35◦C) EN 196
Tensile Strength σN 24− 27 (at 15◦C) et 26-31 (at 35◦C) NF EN ISO 527-3
Shear Strength σT 14− 17 (at 15◦C) et 16-19 (at 35◦C) FIP 5.15
Table 1: Properties of the epoxy adhesive (SikaDur-30) after 7 days of curing provided by
manufacturers.[34]
9

in Fig.6. It is composed of Aluminum 2017 whose mechanical properties are
summarized in the table 2. The aluminium samples are manufactured in such
a way as to maintain a constant total height of the glued specimen equal to 64155
mm. The total height includes the height of two half aluminum samples and the
thickness of the adhesive joint as depicted in Fig.6. The samples are designed
with a straight edge in order to have a homogeneous stress field at the interface
in considering absence of defects.
Figure 6: Cylindrical samples used for the mechanical tests.
E(GPa) σy (MPa) ν
70 210 0.3
Table 2: Material properties of the Aluminum 2017 provided by manufacturers.
4.2. Static tests based on Arcan device160
Static tests are performed using the modified Arcan device [35]. This device
permits to apply to adhesively bonded assembly different types of load. It is
composed of two half discs with several attachment points along the perimeter.
These attachment points allow setting up the device on a standard tensile testing
machine. For the present investigation, the Arcan system was adapted to use165
cylindrical specimens. The positioning and the holding of the test sample are
carried out using flanges. These flanges fix the sample with screws uniformly
distributed on its periphery, which prevents the adhesive from being preloaded
10

(Fig.7). To keep a good stiffness gap, the half-discs are made of 40CMD8S Steel
and the flanges of 7075 Aluminium. The static tests were carried out on a tensile
Figure 7: Homogeneous clamping device for the test samples.
170
test machine, an electromechanical Instron testing system (Fig.8). The Arcan
device is connected to the machine with a ball joint that guarantees isostatism
and alignment of the applied force. The tests were performed at a quasi-static
speed of 0.5 mm.min−1. The load is measured with a sensor with a capacity of
50 kN .175
4.3. Bonding protocol
Three different adhesive joint thicknesses, noted ta, have been tested: 1, 5,
and 10 mm. For each test configuration, a minimum of five samples are tested
to obtain an admissible statistic. In order to ensure the effectiveness of the
bonding and to decrease dispersion, the aluminium surfaces was cleaned with180
acetone. To position the aluminium half samples and the adhesive, a mounting
was designed as depicted in Fig.9. It allows to respect the coaxiality between
the two aluminium half samples and has the advantage of being able to bond
five samples at the same time. The half samples are placed on a lower base.
The adhesive is applied to the bonding surfaces. The other half samples are185
placed on the upper base. The half samples are flanged in order to be attached
to the base to facilitate positioning on other half samples. A guidance system
allows the upper base to be positioned on the lower base and the half samples to
11

Figure 8: Arcan fixture is mounted in the Instron tensile machine.
be positioned relative to each other in calibrating the thickness. Once the test
piece has been assembled, the glue joint must be gently cleaned, especially for190
thicker adhesive joints. Two examples of bonded specimens are shown in Fig.10.
Then, it is necessary to wait for the polymerization of the adhesive which lasts
7 days at room temperature.
4.3.1. Tensile tests
In Fig.11, three of the total four graphs depict the stress-displacement curves195
obtained for a tensile loading for the three different adhesive thicknesses. In
details, on the vertical axis the tensile stress and on the horizontal axis the
normal displacement of the test machine are reported. For each test, the fracture
12

Figure 9: Mounting of samples to check the coaxiality and thickness of the adhesive joint.
Figure 10: Two examples of bonded specimens.
was cohesive (i.e it means that the fracture occurred exclusively in the adhesive
and not at the interface). The mechanical behaviour of the adhesive was linear200
with a brittle behaviour. In the test presented here, the contribution of the
aluminum substrate to the measured stiffness is neglected, because the Young’s
modulus of the adhesive is 8 times lower than the modulus of the aluminum
substrate. Results reported in Table 3 show that there is no dispersion on
normal stiffness KexpN and normal critical stress at rupture σcN over our five205
tests (the maximal coefficient of variation is less than 8.5%). It should be
noted that the normal stiffness KexpN and the normal critical stress at fracture
σcN decrease as a function of adhesive thickness. In the forth graph of Fig.11,
the stiffness of the interface has been plotted as a function of the thickness of
the adhesive, and it can be seen that the stiffness decreases quasi-linearly as210
13

a function of the thickness. The critical stress values are higher than those
provided by the manufacturer, probably because we bond at an intermediate
temperature (24◦C) with extreme thickness values. Indeed, the manufacturer
advises to use 3 mm and not to exceed 5 mm in thickness on vertical surfaces
in order to avoid the collapse of the adhesive during the gluing process. In civil215
engineering context, one of the main difficulties is to control adhesive thickness
(low thickness and low variability) for very large bonded surfaces.
Thickness KexpN Kexp
N σcN σcN
ta Mean Value RSD Mean Value CV
(mm) (N.mm−3) (%) (MPa) (%)
1 86.57 7.31 31.84 1.81
5 85.41 5.12 26.22 8.32
10 79.25 2.21 25.38 2.54
Table 3: Tensile tests results: average values and relative standard deviation (RSD) of normal
stiffness and normal stress for different thickness of the adhesive.
4.3.2. Shear tests
Similary to the case of tension test, in Fig.12 three of the total four graphs
depict the stress-displacement curves obtained for a shear loading for the three220
different adhesive thicknesses. In details, on the vertical axis the shear stress
and on the horizontal axis the displacement of the test machine are reported.
For each test, the fracture was both cohesive and adhesive, these particular
fracture surfaces observed are due to two successive shear phases: a pure shear
phase followed by a mixed mode phase after the initiation of local fracture.225
As in tensile, the shear mechanical behaviour of the adhesive is linear with a
brittle behaviour. Results reported in Table 4 show that tangential stiffness
KexpT and tangential critical stresses at fracture σcT over our five tests (the
maximal coefficient of variation is less than 5%). As previously, the critical
stress values are globally higher than those provided by the manufacturer. For230
10 mm thickness, a smaller value is observed probably due to the limitation
14

Figure 11: Experimental tensile tests results: Stress-displacement curves obtained for each
thickness considered and Evolution of normal stiffness in function of the adhesive thickness.
Numerical results of simulation of tensile tests with our imperfect interface model implemented
in a finite element software.
of extreme thickness values in shearing configuration. It should be noted that
the tangential stiffness KexpT and the tangential critical stress at rupture σcT
decreases with increasing adhesive thickness. In Fig.12, the stiffness of the
interface has been plotted as a function of the adhesive thickness, and it can235
be seen that the stiffness decreases quasi-linearly as a function of the thickness.
Globally, the same trends in tensile and in shear has been obtained.
4.4. CT-scan of the joint
The imperfect interface model assumes the description of initial damage by
Kachanov’s theory. For which the effect of a given number of diffuse cracks240
can be considered as the effect of a single large crack to describe the loss of
bonding stiffness as a function of the initial cracking rate. In this section, the
decrease of bonding stiffness is expressed as a function of thickness based on
15

Thickness KexpT Kexp
T σcT σcT
ta Mean Value RSD Mean Value CV
(mm) (N.mm−3) (%) (MPa) (%)
1 20.5 4.71 23.71 2.28
5 19.73 1.65 19.17 0.21
10 17.22 4.76 15.13 1.52
Table 4: Shear tests results: average values and relative standard deviation (RSD) of tangen-
tial stiffness and tangential stress for different thickness of the adhesive.
Figure 12: Experimental shear tests results: Stress-displacement curves obtained for each
thickness considered and Evolution of tangential stiffness in function of the adhesive thickness.
Numerical results of simulation of shear tests with our imperfect interface model implemented
in a finite element software.
three-dimensional CT-scan of adhesive joints using an X-ray micro-tomograph.
The adhesive joints are integrally scanned with a voxel size of 15 µm and a 1920245
pixels x 1536 pixels resolution imager. The device used is an EasyTom XL Ultra
150 produced by RX Solution. The X-ray generator is a 150 keV sealed tube
16

with a minimum X-ray focus size of 5 µm and a maximum power of 75W. At
the end of the reconstruction, each slice obtained has the thickness of a voxel.
The Fig.13 allows to visualize the bonding defects, the pores with a low density250
appear in black, and the adhesive appears in grey level. Indeed, Sikadur-30 is
a filled adhesive, on the slices of the Ct-scan the colloidal fillers can be seen
in white and the binders in grey. On these slices, a diffuse porosity for each
scanned adhesive joints and for each thickness considered is observed. Anyway,
it is difficult to reach a conclusion by looking only at the slices obtained by255
microtomography. To get a more quantitative measurement, the stack of slices
are uploaded to an open source analysis software developed by Vicente et al. and
called Imorph[36][37]. This software allows to perform segmentation between
pores and adhesive, in order to construct the boundary surfaces of the two
phases and calculate a porosity rate ρ in the volume of the joint V . In Fig.14260
the 3D reconstruction of pores obtained with the software is presented for the 1
mm adhesive joint. The number of pores seems very diffuse and quite important
visually, the software is then able to quantify the volume of each phase. The
values of the porosity rates calculated for the three thicknesses are reported in
Table 5. The analogy with the Kachanov model allows us to correlate an initial265
damage length l0 characteristic of the overall porosity volume l30 (i.e. the sum
of each porosity is equivalent to a single porosity of length l0).
Thickness Volume Porosity Volume Initial
ta of the joint rate of porosity Damage Length
(mm) V (mm3) ρ =l30V (%) l30 (mm3) l0 (mm)
1 254.47 7.68 19.54 2.69
5 1272.35 8.02 102.04 4.67
10 2544.69 8.88 225.97 6.09
Table 5: Analysis of CT-scan measurements on initial samples bonded: Volume of porosity in
function of the thickness of the adhesive.
17
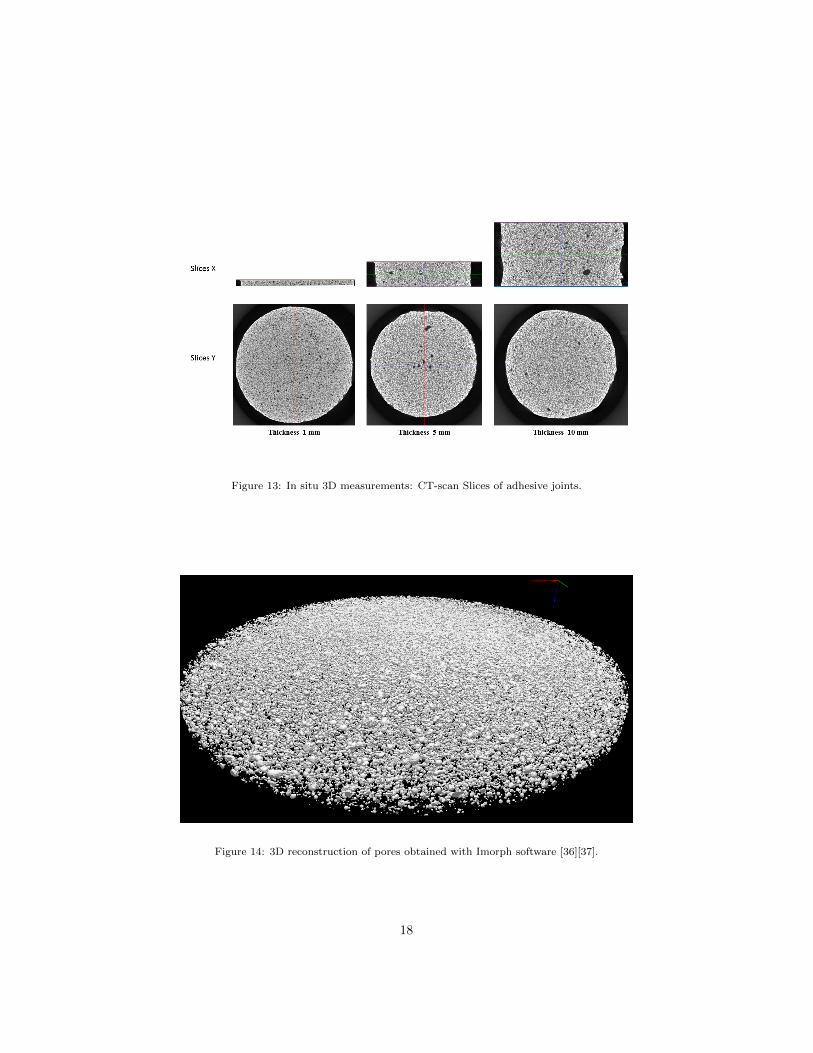
Figure 13: In situ 3D measurements: CT-scan Slices of adhesive joints.
Figure 14: 3D reconstruction of pores obtained with Imorph software [36][37].
18

4.5. Discussion on the model assumptions
Results of the experimental investigations allowed us to give an insight on
the imperfect interface model proposed in section 3. Indeed, static tensile and
shear tests showed that the normal and tangential stiffnesses of the interface
decrease with the increase of the adhesive thickness as in Eq.1. 3D CT-scans
demonstrates the possibility to correlate the decrease in stiffness with a porosity
rate which can be considered as an initial damage. This parameter can be cor-
related to an initial damage length l0 by analogy with Kachanov’s theory. Table
5 describes a quasi-linear relation between the thickness and the initial damage
length l0 and Fig.15 describes a quasi-linear relation between the stiffness and
l0. The following expression can be proposed: KN = f(thickness) = f(l0)
KT = f(thickness) = f(l0)(2)
In the imperfect interface model, the adhesive is characterized by an initial
damage l(t = 0) = l0. The value l0 depends on the adhesive thickness used270
and the quality of bonding of the beam-to-column connection. On experimental
results obtained with monotonic mechanical tests carried out on the beam-to-
column connections described in Fig.3 and in static tests related in Fig.11 and in
Fig.4, a brittle mechanical behavior of bonded connections is observed. It means
that no significant damage evolution is observed in Sikadur30 adhesive. Thus,275
the connections is modeled with l = 0 in Eq.1. This initial value is identified
experimentally for the elementary samples and identified by inverse method for
the GFRP adhesive connection.
5. Finite element simulations
The imperfect model presented in section 3, is implemented in the com-280
mercial finite element software COMSOL Multiphysics. In particular, both ex-
perimental tests on specimens for evaluating adhesive properties and on beam-
to-column full scale specimens are simulated. Finally, comparisons between
numerical and experimental investigation are performed.
19
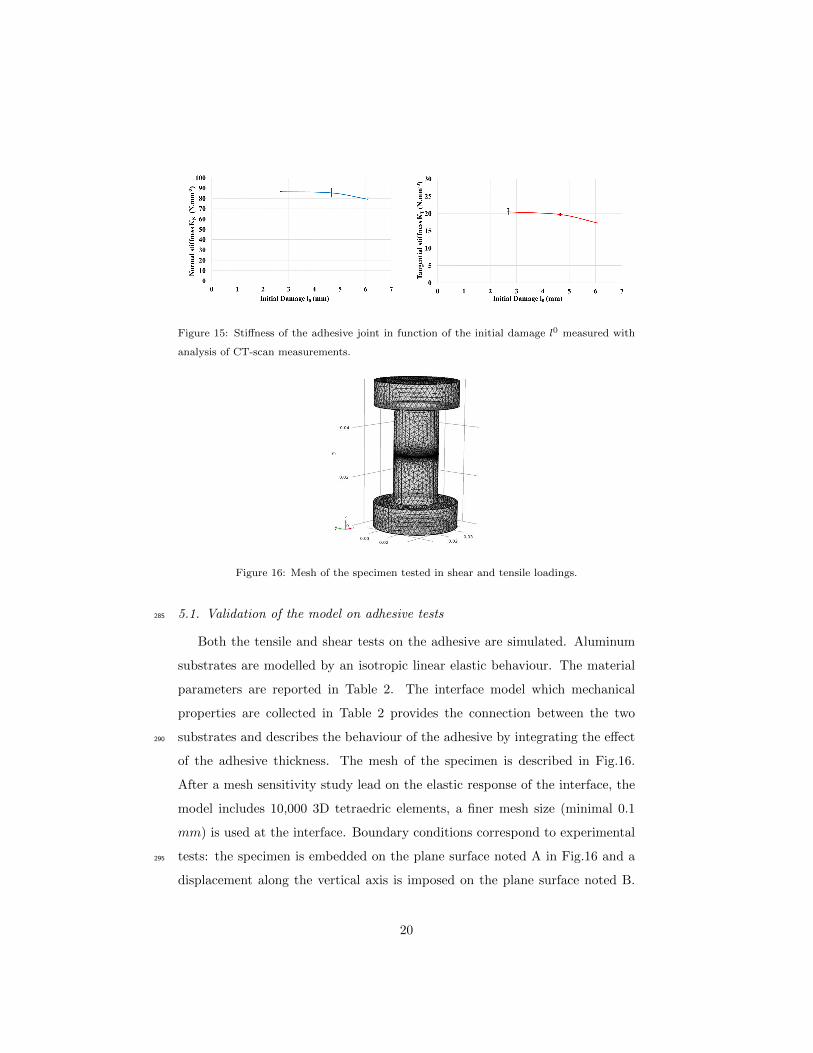
Figure 15: Stiffness of the adhesive joint in function of the initial damage l0 measured with
analysis of CT-scan measurements.
Figure 16: Mesh of the specimen tested in shear and tensile loadings.
5.1. Validation of the model on adhesive tests285
Both the tensile and shear tests on the adhesive are simulated. Aluminum
substrates are modelled by an isotropic linear elastic behaviour. The material
parameters are reported in Table 2. The interface model which mechanical
properties are collected in Table 2 provides the connection between the two
substrates and describes the behaviour of the adhesive by integrating the effect290
of the adhesive thickness. The mesh of the specimen is described in Fig.16.
After a mesh sensitivity study lead on the elastic response of the interface, the
model includes 10,000 3D tetraedric elements, a finer mesh size (minimal 0.1
mm) is used at the interface. Boundary conditions correspond to experimental
tests: the specimen is embedded on the plane surface noted A in Fig.16 and a295
displacement along the vertical axis is imposed on the plane surface noted B.
20

The numerical normal and tangential stiffnesses have been identified by compar-
ison with experimental global response (see Fig.11 and Fig.4). The numerical
stiffnesses identified are reported in Table 6. The maximal relative standard de-
viation on the normal stiffness is 1.24% and on the tangential stiffness is 6.21%.300
It is important to note that the differences between the experimental values
and those identified numerically are very small confirming the assessment of the
previous section.
Thickness KnumN Kexp
N KnumT Kexp
T
(mm) (N.mm−3) RSD (%) (N.mm−3) RSD (%)
1 85.85 0.83 19.59 4.44
5 84.35 1.24 19.27 2.33
10 79.93 0.85 18.29 6.21
Table 6: Values and deviations from experimental values of tangential and normal stiffness for
different thickness of the adhesive obtained by inverse identification based on finite element
simulation of tensile and shear tests.
Figure 17: Mesh of the GFRP structure : beam to column connection reinforced (BTCJ fcr).
21

Mechanical properties measure unit value
Young’s modulus of elasticity E0◦ MPa 28,000
Young’s modulus of elasticity E90◦ MPa 8,500
Shear modulus of elasticity G MPa 3,000
Poisson’s ratio ν0◦ - 0.09
Poisson’s ratio ν90◦ - 0.23
Table 7: Mechanical properties of GFRP pultruded laminates provided by the manufacturer.
5.2. Application of the model to GFRP beam-to-column connections
In order to validate the imperfect interface model and its efficiency to model a
GFRP adhesive connection. Both complex structures of GFRP beam-to-column
connection, depicted in Fig.2, are simulated using finite elements method. The
GFRP panels are considered transversally isotropic which material parameters
are reported in Table 7. The behaviour of the adhesive is described with the
imperfect interface model where the adhesive stiffness depends of the damage
variable l0 as checked with the experimental analyses. The imperfect interface
model framework presented in section 3, is applied at our parallelepipedic rect-
angular bonding thin interphase where L1 is its large side, L2 is its small side,
and ε is its thickness. The homogenization of the adhesive and the asymp-
totic approach (from step 2 to step 4) lead to the following expression for the
tangential and normal stiffness for a rectangular bonding interface [30][38]: KN = f(l0) = 3ETL1L2
16l30(1−ν2)
KT = f(l0) = 3ETL1L2(2−ν)32l30(1−ν2)
(3)
where ET is the tensile Young modulus of the adhesive as related in Table305
1 and ν is the Poisson ratio. The adhesive thickness is constant and equal
to 1 mm, thus, the value of l30 is constant for all interface zones considered.
This parameter has to be identified by inverse method for these specific GFRP
adhesive connections. The mesh of the GFRP structure is described in Fig.17.
The model includes 126,000 3D tetraedric elements, the mesh is refined at the310
bonding interface. The boundary conditions correspond to the test conditions:
22

the column is fixed at bottom and a displacement is imposed in the same cross
section where the load was applied during experiments.
Figure 18: Numerical simulation results: deformed structure and von Mises stress field.
Figure 19: Comparison between numerical prediction and experimental results for both beam
to column adhesive connection structures.
In Fig.18 the deformed structure and the von Mises stress field from the
simulation results are reported for the reinforced BTCJ fcr. It should be noted
that numerical simulation gives a good prediction of the GFRP beam-to-column
connections (see Fig.19). The l30 value identified by inverse method is equal to
0.028 mm3. The good agreement underline the capacity of the imperfect in-
terface model to model this complex structures. Using this model, we are able
23

to propose formulas to design and verify bonded connections. For instance, the
results summarized in Fig.20 allows to model the effect of the adhesive Young
modulus on the vertical deflection of the GFRP beam-to-column adhesive con-
nection BTCJ fcr under a load applied equal to 15kN. On the basis of numerical
results the following formula has been proposed in order to propose a first design
rule of BTCJ fcr structure:
v = aE−b (4)
with a = 95.68 and b = −0.64 identified on 8 different calculations with a
excellent coefficient of correlation (R2 = 0.9948). The parametric analysis is315
able to predict the nonlinear answer of the structure in taking into account the
adhesive behavior included in the imperfect interface model.
Figure 20: Variation of the vertical deflection of GFRP beam to column adhesive connection
BTCJ fcr in function of the Young modulus of the adhesive.
24

6. Conclusions
The mechanical properties of a structural adhesive available on the market
has been experimentally evaluated by means of modified Arcan device. A mono-320
tonic load was applied on the adhesive bonded assembly. The results obtained
by experimental tests have permitted to model a GFRP adhesive connection
of a complex structures by using an imperfect soft interface model previously
presented by some of the authors. The results of the study support the following
conclusions:325
1) The thickness of adhesive layers influences significantly interface mechan-
ical properties. In particular in reducing the thickness from 10 to 1 mm, it is
possible to obtain an increase of 25% and 8% in terms of normal strength and
stiffness, and an increment of 57% and 19% in terms of tangential strength and
stiffness. Furthermore, the adhesive presents a brittle mechanical behavior and330
an initial damage (i.e an initial porosity rate in Kachanov’s theory) depending
of the geometry, the thickness of the joint and the bonded GFRP structure
considered.
2) Results of the experimental investigations on elementary samples allowed
us to give an insight on the imperfect interface model. The CT-scan demon-335
strated that is possible to correlate the decrease in stiffness with a porosity rate
or initial damage. This parameter being correlated to an initial damage length
l0 by analogy with Kachanov theory. Numerical results of elementary tests are
in very good agreement with experimental ones.
3) The results of imperfect interface model are in very good agreement with340
the experimental results of a bonded GFRP connection previously tested by the
authors. The imperfect interface model is considered as an useful instrument
to study the performance of GFRP adhesive connection in civil engineering
context.
4) A parametric analysis have been undertaken in order to define a new345
formula able to describe the nonlinear response of the bonded connection in
terms of vertical deflection at varying of adhesive property.
25

After the first encouraging results, the next goal for the authors will be the
investigation of the influence of adhesive mechanical properties on cyclic be-
haviour with particular attention on damage evolution. It will be possible in350
the future to reactivate the l parameter in order to describe the mechanical re-
sponse of these connections to cyclic solicitations (loads/unloads) or connections
with different geometries.[23]
Acknowledgement
This project has received funding from the European Union Horizon 2020355
research and innovation programme under the Marie Sklodowska-Curie grant
agreement No 843218-ASSO (Adhesive connection for Secondary Structures in
Offshore wind installations).
References
References360
[1] J. R. Correia, GFRP pultruded profiles in civil engineering: hybrid solu-
tions, bonded connections and fire behaviour, Lisboa: Tese de Doutora-
mento em Engenharia Civil, Instituto Superior Tecnico-Universidade
Tecnica de Lisboa.
[2] K. Liao, C. Schultheisz, D. L. Hunston, Effects of environmental aging on365
the properties of pultruded GFRP, Composites Part B: Engineering 30 (5)
(1999) 485–493.
[3] S. Cabral-Fonseca, J. Correia, M. Rodrigues, F. Branco, Artificial acceler-
ated ageing of GFRP pultruded profiles made of polyester and vinylester
resins: characterisation of physical–chemical and mechanical damage,370
Strain 48 (2) (2012) 162–173.
[4] A. S. Mosallam, M. K. Abdelhamid, J. H. Conway, Performance of pul-
truded FRP connections under static and dynamic loads, Journal of Rein-
forced Plastics and Composites 13 (5) (1994) 386–407.
26

[5] L. C. Bank, A. S. Mosallam, G. T. McCoy, Design and performance of375
connections for pultruded frame structures, Journal of Reinforced Plastics
and Composites 13 (3) (1994) 199–212.
[6] L. C. Bank, J. Yin, L. Moore, D. J. Evans, R. W. Allison, Experimen-
tal and numerical evaluation of beam-to-column connections for pultruded
structures, Journal of Reinforced Plastics and Composites 15 (10) (1996)380
1052–1067.
[7] S. Smith, I. Parsons, K. Hjelmstad, An experimental study of the behavior
of connections for pultruded GFRP I-beams and rectangular tubes, Com-
posite Structures 42 (3) (1998) 281–290.
[8] S. Smith, I. Parsons, K. Hjelmstad, Experimental comparisons of connec-385
tions for gfrp pultruded frames, Journal of Composites for Construction
3 (1) (1999) 20–26.
[9] J. Mottram, Y. Zheng, Further tests on beam-to-column connections for
pultruded frames: Web-cleated, Journal of Composites for Construction
3 (1) (1999) 3–11.390
[10] J. Mottram, Y. Zheng, Further tests of beam-to-column connections for
pultruded frames: flange-cleated, Journal of Composites for Construction
3 (3) (1999) 108–116.
[11] J. Qureshi, J. T. Mottram, Behaviour of pultruded beam-to-column joints
using steel web cleats, Thin-Walled Structures 73 (2013) 48–56.395
[12] J. Qureshi, J. T. Mottram, Response of beam-to-column web cleated joints
for FRP pultruded members, Journal of Composites for Construction 18 (2)
(2013) 04013039.
[13] A. Mosallam, Design Guide for FRP Composite Connections, American
Society of Civil Engineers, 2011. doi:10.1061/9780784406120.400
27

[14] M. Lamberti, M. Maurel-Pantel, F. Ascione, F. Lebon, Influence of
web/flange reinforcement on the GFRP bonded beams mechanical re-
sponse: A comparison with experimental results and a numerical predic-
tion, Composite Structures 147 (2016) 247–259.
[15] S. Chataigner, J.-F. Caron, K. Benzarti, M. Quiertant, C. Aubagnac, Use of405
a single lap shear test to characterize composite-to-concrete or composite-
to-steel bonded interfaces, Construction and Building Materials 25 (2)
(2011) 468–478. doi:10.1016/j.conbuildmat.2010.08.009.
[16] G. Bresson, J. Jumel, M. E. Shanahan, P. Serin, Strength of adhesively
bonded joints under mixed axial and shear loading, International Journal410
of Adhesion and Adhesives 35 (2012) 27–35. doi:10.1016/j.ijadhadh.
2011.12.006.
[17] J. Jumel, N. B. Salem, M. K. Budzik, M. E. Shanahan, Measurement
of interface cohesive stresses and strains evolutions with combined mixed
mode crack propagation test and backface strain monitoring measure-415
ments, International Journal of Solids and Structures 52 (2015) 33–44.
doi:10.1016/j.ijsolstr.2014.09.004.
[18] F. Freddi, E. Sacco, An interphase model for the analysis of the masonry-
FRP bond, Composite Structures 138 (2016) 322–334. doi:10.1016/j.
compstruct.2015.11.041.420
[19] C. Sarrado, F. A. Leone, A. Turon, Finite-thickness cohesive elements for
modeling thick adhesives, Engineering Fracture Mechanics 168 (2016) 105–
113. doi:10.1016/j.engfracmech.2016.03.020.
[20] A. Maurel-Pantel, M. Voisin, Q. Bui, N. Cocheteau, F. Lebon, C. Hochard,
A cohesive zone model for fracture initiation and propagation of fused sil-425
ica direct bonding interface, Engineering Fracture Mechanics 219 (2019)
106649. doi:10.1016/j.engfracmech.2019.106649.
28

[21] F. Ascione, M. Lamberti, A. Razaqpur, S. Spadea, Strength and stiffness
of adhesively bonded GFRP beam-column moment resisting connections,
Composite Structures 160 (2017) 1248–1257.430
[22] F. Ascione, M. Lamberti, A. Razaqpur, S. Spadea, M. Malagic, Pseudo-
ductile failure of adhesively joined GFRP beam-column connections: An
experimental and numerical investigation, Composite Structures 200 (2018)
864–873.
[23] G. Razaqpur, F. Ascione, M. Lamberti, S. Spadea, M. Malagic, GFRP hol-435
low column to built-up beam adhesive connection: Mechanical behaviour
under quasi-static, cyclic and fatigue loading, Composite Structures 224
(2019) 111069.
[24] Y. Benveniste, T. Miloh, Imperfect soft and stiff interfaces in two-
dimensional elasticity, Mechanics of Materials 33 (6) (2001) 309–323.440
doi:10.1016/s0167-6636(01)00055-2.
[25] Z. Hashin, Thermoelastic properties of fiber composites with imperfect
interface, Mechanics of Materials 8 (4) (1990) 333–348. doi:10.1016/
0167-6636(90)90051-g.
[26] E. Bonetti, G. Bonfanti, F. Lebon, R. Rizzoni, A model of imperfect inter-445
face with damage, Meccanica 52 (2017) 1911–1922.
[27] F. Lebon, R. Rizzoni, Asymptotic behavior of a hard thin linear elastic
interphase: an energy approach, International Journal of Solids and Struc-
tures 49 (2011) 441–449.
[28] I. Tsukrov, M. Kachanov, Effective moduli of an anisotropic material with450
elliptical holes of arbitrary orientational distribution, International Journal
of Solids and Structures 69 (2000) 5919–5941.
[29] I. Sevostianov, M. Kachanov, On some controversial issues in effective field
approaches to the problem of the overall elastic properties, Mechanics of
Materials 69 (2014) 93–105.455
29

[30] M. L. Raffa, F. Lebon, R. Rizzoni, Derivation of a model of imperfect
interface with finite strains and damage by asymptotic techniques: an ap-
plication to masonry structures, Meccanica 53 (2018) 1645–1660.
[31] A. Rekik, F. Lebon, Homogenization methods for interface modeling in
damaged masonry, Advances in Engineering Software 46 (2012) 35–42.460
[32] A. Orefice, G. Mancusi, S. Dumont, F. Lebon, Experimental/numerical
study on the interfacial damage of bonded joints for fibre-reinforced poly-
mer profiles at service conditions, Technologies 4 (2016) in line.
[33] M. L. Raffa, F. Lebon, G. Vairo, Normal and tangential stiffnesses of rough
surfaces in contact via an imperfect interface model, International Journal465
of Solids and Structures 87 (2016) 245–253.
[34] SikaDur30 technical data sheet (2020).
URL http://fra.sika.com/dms/getdocument.get/
f87e83b7-c0c8-3d69-b5ad-8ac164d9be05/sikadur_30_nt3022.pdf
[35] J. Cognard, P. Davies, B. Gineste, L. Sohier, Development of470
an improved adhesive test method for composite assembly de-
sign, Composites Science and Technology 65 (3-4) (2005) 359–368.
doi:10.1016/j.compscitech.2004.09.008.
URL http://linkinghub.elsevier.com/retrieve/pii/
S0266353804002131475
[36] J. Vicente, Y. Wyart, P. Moulin, Characterization (2d-3d) of ceramic mi-
crofiltration membrane by synchrotron radiation: new and abraded mem-
branes, Journal of Porous Media 16 (6) (2013) 537–545. doi:10.1615/
jpormedia.v16.i6.50.
[37] C. El Hachem, K. Abahri, J. Vicente, R. Bennacer, R. Belarbi, Hygromor-480
phic characterization of softwood under high resolution X-ray tomography
for hygrothermal simulation, Heat and Mass Transfer 54 (9) (2018) 2761–
2769.
30

[38] M. L. Raffa, Micromechanical modeling of imperfect interfaces and appli-
cations, Ph.D. thesis, Aix-Marseille Universite, Universita di Roma Tor485
Vergata (2015).
31