modelling of travel behaviour of students using …
TRANSCRIPT

ARCHIVES OF TRANSPORT ISSN (print): 0866-9546
Volume 51, Issue 3, 2019 e-ISSN (online): 2300-8830
DOI: 10.5604/01.3001.0013.6159
Article is available in open access and licensed under a Creative Commons Attribution 4.0 International (CC BY 4.0)
MODELLING OF TRAVEL BEHAVIOUR OF STUDENTS USING
ARTIFICIAL INTELLIGENCE
Anu P. ALEX1, V. S. MANJU2, Kuncheria P. ISAAC3 1, 2 College of Engineering Trivandrum, Kerala, India
3 Hindustan Institute of Technology and Science, Chennai, India
Abstract:
Travel demand models are required by transportation planners to predict the travel behaviour of people with different
socio-economic characteristics. Travel behaviour of students act as an essential component of travel demand modelling. This behaviour is reflected in the educational activity travel pattern, the timing, sequence and mode of travel of students.
Roads in the vicinity of schools are adversely affected during the school opening and closing hours. It enhances the traffic
congestion, emission and safety problems around schools. It is necessary to improve the safety of school going children by understanding the present travel behaviour and to develop efficient sustainable traffic management measures to reduce
congestion in the vicinity of schools. It is possible only if the travel behaviour of educational activities are studied. This
travel behaviour is complex in nature and lot of uncertainty exists. Selection of modelling technique is very important for modelling the complex travel behaviour of students. This leads to the importance of application of artificial intelligence
(AI) techniques in this area. AI techniques are highly developed in twenty first century due to the advancements in
computer, big data and theoretical understanding. It is proved in the literature that these techniques are suitable for modelling the human behaviour. However, it has not been used in behaviourally oriented activity based modelling. This
study is aimed to develop a model system to predict the daily travel behaviour of students using artificial intelligence technique, ANN. These ANN models were then compared with the conventional econometric models developed. It was
observed that artificial intelligence models provide better results than econometric models in predicting the activity-travel
behaviour of students. These models were further applied to study the variation in activity-travel behaviour, if short term travel-demand management measures like promoting walking for educational activities are implemented. Thus the study
established that artificial intelligence can replace the conventional econometric methods for modelling the activity-travel
behaviour of students. It can also be used for analysing the impact of short term travel demand management measures.
Keywords: educational activity, ANN, travel demand management, travel behaviour, artificial intelligence, econometric
models.
To cite this article:
Alex, A. P., Manju, V. S, Isaac, K. P., 2019. Modelling of travel behaviour of students
using artificial intelligence. Archives of Transport, 51(3), 7-19. DOI:
https://doi.org/10.5604/01.3001.0013.6159
Contact: 1) [email protected] [https://orcid.org/0000-0001-7172-627X] – corresponding author

8
Alex, A. P., Manju, V. S, Isaac, K. P.,
Archives of Transport, 51(3), 7-19, 2019
1. Introduction
Activity-travel behaviour based demand modelling
has got wide publicity in the past few decades. This
approach views travel behaviour as a demand de-
rived from the necessity to take part in activities.
These behavioural models are capable of modelling
the time and sequence of activities even though they
are complex in nature. Activity-travel behaviour is
often investigated by researchers from a variety of
standpoints. They separated the compulsory and
non-compulsory activities of individuals for devel-
oping the activity – travel behaviour model systems.
Compulsory / mandatory activities of individuals in-
volve both work and educational activities. Most of
the research works are carried out with work/school
activity travel-behaviour as a crucial component of
travel demand. The econometric model CEMDEP
proposed a comprehensive activity generation-allo-
cation scheduling model (Bhatt and Singh 2000,
Bhat et al. 2004). It considered ‘work/school’ as the
primary activity of the travel behaviour. Recker et
al. (1986) developed STARCHILD (Simulation of
Travel /Activity Response to Complex Household
Interactive Logistic Decisions), to examine the for-
mation of household travel/activity behaviour. They
developed the model with 'planned and unplanned'
activities.
Arentze and Timmermans (2000) developed ALBA-
TROSS which is the most comprehensive and oper-
ational computational process model. It was a rule-
based system which predicts the travel behaviour of
mandatory and non-mandatory activities. Work and
school activities are considered together as manda-
tory activities in ALBATROSS. Daily activity par-
ticipation decisions of individual, which lead to trip
chaining, were studied by Wainaina and Richter
(2002). FAMOS, (Florida Activity Mobility Simula-
tor), proposed a prism constrained simulation ap-
proach where work/school are considered as fixed
activities (Pendyala et al. 2005). The rule-based ac-
tivity scheduler TASHA also takes the same ap-
proach for generating work/ school duration (Roorda
et al. 2008). Nurul Habib and Miller (2009) devel-
oped an econometric modelling framework for ac-
tivity-agenda formation. The agenda was the collec-
tion of different types of activities within a specific
time period. This approach dealt with all activity
types together in a unified econometric modelling
framework. The model ensured the scope for un-
planned activities within the time budget. Potoglou
and Arslangulova (2016) identified the factors asso-
ciated with the travel behaviour of primary and sec-
ondary school students on a typical school day in
Wales.
Developing countries like India have mixed traffic
and the modes used in these countries include bus,
train, car, two wheeler and walk/cycle. Hence the
mode choice behaviour is more complex in develop-
ing countries than in developed countries. Limited
studies have been reported in developing countries
on activity based travel demand modelling. Bindu et
al.(2005, 2006)developed a prototype of time-use di-
ary design which was user friendly, offers fewer bur-
dens on respondent, and ensures good quality and
quantity of data. They also presented a tour-based
approach of modelling mode choice of the residents
of Mumbai city of Maharashtra. The study found
that the performance of the mixed logit model is bet-
ter than Multi Nomial Logit (MNL). Subbarao and
Rao (2014) analysed the activity travel behaviour in
the context of Mumbai metropolitan region by de-
veloping a new activity travel diary. Interactions
among households or other members were also fa-
cilitated by the newly designed diary. Surekha
(2009) developed a micro simulation model for ac-
tivity travel pattern for Tiruchirappalli City, Tamil
Nadu, India. Sreela et al. (2013) studied the shop-
ping activity travel behaviour of workers in Calicut
city, one of the major urban centres in Kerala. Manoj
and Verma (2013) studied the activity-travel behav-
iour of non-workers in Bangalore city of India. This
study modelled the out-of-home activity participa-
tion behaviour of non-workers using a primary ac-
tivity-travel survey data. Babu et al (2018) explored
the travel behaviour of workers and students in Cal-
icut city to model their activity-travel patterns.
Literature shows that there are so many activity gen-
eration model systems for developed countries, in
which work and school travel behaviour are mod-
elled together as mandatory activities. Few of the re-
ported studies in developing countries concentrated
on school travel behaviour which is the mandatory
activity of an individual. Roads in the vicinity of
schools are adversely affected during the school
opening and closing hours. It enhances the traffic
congestion, emission and safety problems around
schools. It is necessary to improve the safety of
school going children by understanding the present
travel behaviour and to develop efficient sustainable
traffic management measures to reduce congestion

Alex, A. P., Manju, V. S, Isaac, K. P.,
Archives of Transport, 51(3), 7-19, 2019
9
in the vicinity of schools. This is possible only if the
travel behaviour of educational activities are stud-
ied. This study is aimed to predict the activity-travel
behaviour of students.
The modelling of educational activity-travel behav-
iour is a complex process that depends on factors
such as the traveller’s socio-economic characteris-
tics and the relative advantages of each mode as per-
ceived by the user in terms of travel time, cost, com-
fort, convenience, and safety. This involves lot of
uncertainty and hence selection of a modelling tech-
nique is very important for the prediction accuracy
of the model. Econometric models, which are sys-
tems of equations representing probabilities of deci-
sion outcomes, are the most popularly adopted
method for activity based travel demand modelling.
They are based on the theory of probability and sta-
tistics, produce probabilities for all possible out-
comes, and are typically based on utility maximiza-
tion assumption. These model systems rely on mul-
tinomial logit models, nested logit models, structural
equation models, hazard duration models and linear
regression models. They do not have any learning
and training capability, which is essential for mod-
elling the human behaviour.
Artificial intelligence techniques have been proved
to have better learning and training capability and
suitable for modelling the human behaviour.
Buscema et al. (2009) experimented Artificial Neu-
ral Network (ANN) to create diagnostic procedures
for eating disorders in human being. The prediction
accuracy was reported as 86.94% in this study. Abu-
bakar et al. (2018) proposed and experimented an
ANN model for the effect of organizational safety
climate and behaviours on workplace injuries.
Gibała and Konieczny (2018) applied ANN effec-
tively to predict necessary repairs on ordinary rail-
way switches. Borimnejad et al. (2016) modelled the
consumer’s behaviour in the Mayadin Management
Organization of Tehran for vegetables using ANN
and estimated the demand curve and elasticity. Ama-
natiadis et al. (2014) trained and utilised ANN with
the observations on user satisfaction with respect to
website attributes. The results indicated that website
attributes had impacts on satisfaction, but the rela-
tionships found both asymmetry and nonlinearity.
Function approximation using ANN was found to be
appropriate for estimating relationships providing
valuable information about satisfaction's formation.
Sharma et al. (2017) attempted to develop SEM and
ANN model to understand and predict the effect of
individual characteristics viz; technology experi-
ence [TE] and personal innovativeness [PI]) and e-
LMS quality determinants on the use of e-LMS by
instructors. The ANN model results showed that ser-
vice quality was the most important predictor of e-
learning acceptance followed by SYS-Q, PI, infor-
mation quality, and TE. Hence it is proved in the lit-
erature that ANN is suitable for modelling the hu-
man behaviour, however it has not been used in be-
haviourally oriented activity based modelling. This
study is intended to check the suitability of artificial
intelligence technique to model the activity-travel
behaviour of students. The developed model sys-
tems are further applied for analysing the impact of
sustainable travel demand management measures.
2. Modelling of travel behaviour of students
Thiruvananthapuram City, which is the capital of
Kerala, the southernmost state in India, is selected as
the study area. It is a growing city located in the
southern region of India. It consists of 100 wards and
the total population is 966,856 as per the 2011 cen-
sus data. An activity travel diary was designed to
collect the data by home interview survey. The sam-
ple size obtained for the study is 9530 members col-
lected from 2521 households. Student population in
the sample was 20.5%, among which, 54% were
male. Data of students in the age group 5- 40 were
considered for developing the models
Daily educational activity-travel behaviour of stu-
dents consists of educational activity generation,
scheduling of educational activity, involvement in
other activities and stopping pattern during travel.
Educational activity generation and scheduling part
includes models for finding the out-of-home educa-
tion activities, educational activity duration, educa-
tional activity start time, distance travelled, mode
and duration of commute for education. Behaviour
of students related to other activity include probabil-
ity to participate in other activities, time of occur-
rence, mode used, start time and duration of other
activities. While commuting for education, the stu-
dent may stop for other activities and the stopping
behaviour includes probability to stop, purpose of
stop and duration of stop. Two modelling techniques
have been used in this study for modelling the daily
activity-travel behaviour of students. i.e: economet-
ric models and artificial neural network models. The
models are discussed in the following subsections.

10
Alex, A. P., Manju, V. S, Isaac, K. P.,
Archives of Transport, 51(3), 7-19, 2019
2.1. Econometric models
Daily educational activity-travel behaviour model
system using econometric modelling technique con-
sists of six models for predicting educational activity
generation and scheduling, five models for other ac-
tivity of students and three models for stop level pat-
tern of students during commute. N-Logit Software
was used for developing the econometric models.
Binary Logit, Multi Nomial Logit (MNL) and Mul-
tiple Linear Regression (MLR) are the econometric
models used for modelling the travel behaviour of
students. Binary logit models are used for binary
choice decision making and Eq. (1) represents the
mathematical form of the model.
( )( )( )
exp β XP Y 1
1 exp β X
= =
+ (1)
MNL models are used for multi choice decision
making and has a mathematical form as shown in
Eq. (2). For choice j= 1,2,3…, J
( )
( )1
exp β XjProb choice j
exp β XjJ
j=
=
(2)
Multiple linear regression models are used for find-
ing out the duration and it is of the form given in
Eq. (3).
( )Y= β X + C (3)
Where: β - Coefficient matrix, X - Variable matrix.
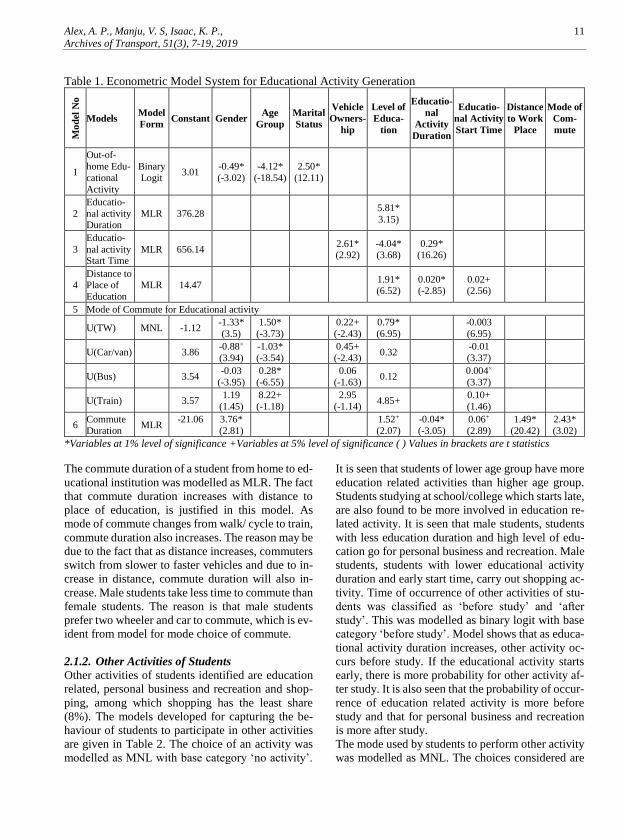
2.1.1. Educational activity generation and
scheduling
Educational activity generation and scheduling part
includes econometric models for finding the out-of-
home education activities, educational activity dura-
tion, educational activity start time, distance trav-
elled, mode and duration of commute for education.
The model coefficients and t- statistics are shown in
Table 1. A binary logit model was developed for pre-
dicting students with out-of-home activities. Model
shows that male, young and unmarried students go
for more out-of-home educational activities. The
time in minutes a student spends in the educational
institution was modelled by daily educational activ-
ity duration. It was modelled as Multiple Linear Re-
gression (MLR). Model shows that under graduate
and post graduate students spend more time in edu-
cational institution than secondary and higher sec-
ondary students, which is normally observed as per
the present education system. The educational activ-
ity start time of a student is the time(in minutes) of
arrival of the student at school/college. To account
the variability in start time, it was modelled as
MLR.It is observed that if the educational activity
duration is more, students reach early in the institu-
tion. Under graduate and post graduate students
reach the institution early than secondary and higher
secondary students. As vehicle ownership increases
students are found to reach the institution early.
Distance from home to place of education was also
modelled as a MLR. Model shows that the daily dis-
tance travelled by under graduate and post graduate
students is more than that of secondary and higher
secondary students. This may be due to the fact that
at lower levels, the students choose institution in the
neighbourhood. At higher levels, institutions are
limited; hence they are forced to select an institution
which is away from the neighbourhood. The stu-
dents who reach the institution early, travel more
compared to others. This is in accordance with the
observation that ‘under graduate and post graduate
students reach the institution early than secondary
and higher secondary students’ as seen from model
for educational activity start time. Daily distance
travelled by under graduate and post graduate stu-
dents is more than that of secondary and higher sec-
ondary students as observed in model for daily dis-
tance travelled. The mode choice of the commuter
for educational activity was modelled as Multi No-
mial Logit (MNL). The modes selected are two
wheeler, car/van/jeep, bus, train and walk/cycle
among which the base mode is selected as walk/cy-
cle. The model shows that male, under graduate and
post graduate students and higher age group students
prefer two wheelers, which is the normal trend in
practice. If the educational institution starts early,
there is more probability of choosing two wheeler
and car. This is in accordance with the observation
‘as vehicle ownership increases students are found
to reach the institution early’ seen from the model
for educational activity start time. It is observed that,
if the educational activity starts late, students travel
by bus.
Alex, A. P., Manju, V. S, Isaac, K. P.,
Archives of Transport, 51(3), 7-19, 2019
11
Table 1. Econometric Model System for Educational Activity Generation M
od
el N
o
Models Model
Form Constant Gender
Age
Group
Marital
Status
Vehicle
Owners-
hip
Level of
Educa-
tion
Educatio-
nal
Activity
Duration
Educatio-
nal Activity
Start Time
Distance
to Work
Place
Mode of
Com-
mute
1
Out-of-
home Edu-
cational
Activity
Binary
Logit 3.01
-0.49*
(-3.02)
-4.12*
(-18.54)
2.50*
(12.11)
2
Educatio-
nal activity Duration
MLR 376.28 5.81*
3.15)
3
Educatio-
nal activity Start Time
MLR 656.14 2.61*
(2.92) -4.04* (3.68)
0.29* (16.26)
4 Distance to Place of
Education
MLR 14.47 1.91*
(6.52) 0.020* (-2.85)
0.02+ (2.56)
5 Mode of Commute for Educational activity
U(TW) MNL -1.12 -1.33*
(3.5)
1.50*
(-3.73)
0.22+
(-2.43)
0.79*
(6.95) -0.003
(6.95)
U(Car/van) 3.86 -0.88×
(3.94)
-1.03*
(-3.54)
0.45+
(-2.43) 0.32
-0.01
(3.37)
U(Bus) 3.54 -0.03
(-3.95)
0.28*
(-6.55)
0.06
(-1.63) 0.12
0.004×
(3.37)
U(Train) 3.57 1.19
(1.45)
8.22+
(-1.18)
2.95
(-1.14) 4.85+
0.10+
(1.46)
6 Commute
Duration MLR
-21.06
3.76*
(2.81)
1.52+
(2.07)
-0.04*
(-3.05)
0.06+
(2.89)
1.49*
(20.42)
2.43*
(3.02)
*Variables at 1% level of significance +Variables at 5% level of significance ( ) Values in brackets are t statistics
The commute duration of a student from home to ed-
ucational institution was modelled as MLR. The fact
that commute duration increases with distance to
place of education, is justified in this model. As
mode of commute changes from walk/ cycle to train,
commute duration also increases. The reason may be
due to the fact that as distance increases, commuters
switch from slower to faster vehicles and due to in-
crease in distance, commute duration will also in-
crease. Male students take less time to commute than
female students. The reason is that male students
prefer two wheeler and car to commute, which is ev-
ident from model for mode choice of commute.
2.1.2. Other Activities of Students
Other activities of students identified are education
related, personal business and recreation and shop-
ping, among which shopping has the least share
(8%). The models developed for capturing the be-
haviour of students to participate in other activities
are given in Table 2. The choice of an activity was
modelled as MNL with base category ‘no activity’.
It is seen that students of lower age group have more
education related activities than higher age group.
Students studying at school/college which starts late,
are also found to be more involved in education re-
lated activity. It is seen that male students, students
with less education duration and high level of edu-
cation go for personal business and recreation. Male
students, students with lower educational activity
duration and early start time, carry out shopping ac-
tivity. Time of occurrence of other activities of stu-
dents was classified as ‘before study’ and ‘after
study’. This was modelled as binary logit with base
category ‘before study’. Model shows that as educa-
tional activity duration increases, other activity oc-
curs before study. If the educational activity starts
early, there is more probability for other activity af-
ter study. It is also seen that the probability of occur-
rence of education related activity is more before
study and that for personal business and recreation
is more after study.
The mode used by students to perform other activity
was modelled as MNL. The choices considered are

12
Alex, A. P., Manju, V. S, Isaac, K. P.,
Archives of Transport, 51(3), 7-19, 2019
walk/cycle, two wheeler and car/van/jeep, where
walk/cycle was taken as the base mode. It is revealed
that higher age group students prefer two wheeler for
other activities. As the vehicle ownership increases,
there is chance for using car/van/jeep for other ac-
tivities. There is more probability of using
car/van/jeep for shopping activity than education re-
lated and recreation. Duration of other activities of
students was modelled as MLR. Students spend
more time for education related activity than per-
sonal business and recreation and shopping. It is ob-
served that duration of activity is more for male stu-
dents than females. When mode used for the activity
changes from walk/cycle to car/van/jeep, duration of
activity also increases. Activity duration is observed
to be more, if the students participate in other activ-
ities after study. Start time of other activity of stu-
dents or the time spent by the individual at home be-
tween the educational activity and other activity was
modelled as MLR. The model given in Table 2
shows that if the duration of commute for education
and educational activity duration are more, home
stay duration will be less. As the purpose of activity
changes from education related to shopping, home
stay duration increases.
2.1.3. Stop level Behaviour during School/College-
to-Home Travel
While commuting before and/or after education, the
students may stop for other activities and the proba-
bility of stopping was modelled in this section. The
stop level behaviour of students during school/col-
lege-to-home travel was only modelled, since the
stops during home-to-school/college travel is less
than 1%. Coefficients and t-statistics of the models
are shown in Table 3. Probability to stop was mod-
elled as binary logit.
Table 2. Econometric Model System for Other Activities of Students
*Variables at 1% level of significance +Variables at 5% level of significance ( ) Values in brackets are t statistics
Mo
del
No
Models Model
Form
Con-
stant Gender
Age
group
Level of
education
Educational
activity du-
ration
Educatio-
nal ac-
tivity start
time
Educa-
tion rela-
ted ac-
tivity
Personal
business
and rec-
reation
activity
7
Probability and purpose of other activities of students
U(Education
related)
MNL
4.70 0.29
(1.45)
-1.25+
(-2.50)
-0.04
(-0.17)
-0.002
(-0.98)
0.01*
(3.04)
U(Personal
business and
recreation)
-5.62
-2.28*
(-5.89)
0.43
(0.94)
0.49+
(2.01)
-0.005*
(-2.13)
0.004*
(1.13)
U(Shopping) 4.52
-1.39*
(-2.86)
0.67*
(1.07)
0.61
(1.70)
-0.01*
(-3.28)
-0.01+
(-2.15)
8
Time of occur-
rence of other
activities
BL 16.82 -0.01+
(-1.85)
-0.02*
(-3.39)
-1.66+
(-1.55)
2.20+
(2.04)
Mo-
del
No
Models Model
Form
Con-
stant Gender
Age
group
Educatio-
nal ac-
tivity du-
ration
Vehicle ow-
nership
Purpose of
activity
Mode for
other ac-
tivity
Time of
occur-
rence
Duration
of com-
mute for
education
9 Mode used for other activities
U(TW)
MNL
-3.46
1.56*
(4.12)
0.05
(0.37)
0.18
(0.63)
U(car/van/jeep) -7.84
-0.70
(-0.98)
1.23*
(2.62)
1.30*
(3.00)
10 Duration of
other activity MLR 185.26
-15.24*
(-2.48)
-38.37*
(-10.66)
11.54*
(2.97)
13.02+
(3.01)
11 Start time of
other activity MLR 333.39
-0.74*
(-4.47)
29.42+
(1.98)
-1.05*
(-3.12)

Alex, A. P., Manju, V. S, Isaac, K. P.,
Archives of Transport, 51(3), 7-19, 2019
13
Table 3. Econometric Model System for Stop during School/College-to-Home Travel M
od
el
No
Models Model
Form Constant
Level of
education
Vehicle
owners-
hip
Distance to
education
Duration of
commute for ed-
ucation
Mode of commute
for education
Purpose of
stop
12 Probability of
stop BL 0.53
-0.45*
(-7.58)
-0.22*
(-5.67)
-0.10*
(-7.47)
13
Purpose of stop
U( Personal business and
recreation) MNL
-0.26 2.40+
(2.52)
-1.16
(-1.58)
-0.01
(-0.90)
U( Education
related)
8.24
1.46
(1.29)
-3.43 x
(-1.71)
-0.04+
(-2.20)
14 Duration of stop
MLR 70.83 -0.35* (-3.73)
35.25* (4.89)
*Variables at 1% level of significance +Variables at 5% level of significance ( ) Values in brackets are t statistics
The model shows that if the distance to education
and commute duration is more, there is less proba-
bility to stop during school/college-to-home travel.
If the mode of commute is bus, the probability to
stop is less.
Purposes of stop during school/college-to-home
commute are identified as shopping, personal busi-
ness and recreation, and education related. It was
modelled as MNL with base category ‘shopping’. It
is observed from the model that as the level of edu-
cation increases, there is more probability for per-
sonal business and recreation than shopping. As the
commute duration increases, there is less probability
for education related activity stop than shopping.
Duration of stop during school/college-to-home
commute was modelled as MLR. If the travel dura-
tion increases, duration of stop is found to be less.
Duration of stop is highest for education related ac-
tivities and least for shopping.
2.2. Artificial neural network models
The econometric models developed in the previous
subsection were based on theory of probability and
statistics. They do not have any learning and training
capability. Hence complex travel behaviour of stu-
dents are modelled with ANN also, to check whether
there is any improvement in the efficiency of the
models. ANN is made up of a number of simple, and
highly interconnected processing elements, which
processes information by its dynamic state response
to external inputs. The multi-layer feed-forward net-
work was used in this study. The network was
trained using an error back propagation training al-
gorithm. This algorithm adjusts the connection
weights according to the back propagated error com-
puted between the observed and the estimated re-
sults. This procedure attempts to minimise the error
between the desired and the predicted outputs. Four
neural networks for modelling the activity-travel be-
haviour of students are shown in Table 4.
Table 4. ANN Networks for modelling the educa-
tional activity behaviour
Sl.
No. Econometric Models
ANN
Models
1 Probability of out-of-home edu-cational activity (yes/ no)
Network 1 2 Educational activity duration
3 Educational activity start time
4 Distance to place of education
5 Mode of commute for educa-tional activity
Network 2
6 Duration of commute for educa-
tional activity
Network 3
7 Probability and purpose of other
activities
8 Probability of stop during school/college-to-home travel
9 Purpose of stop during school/college-to-home travel
10 Time of occurrence of other ac-
tivities
Network 4
11 Mode used for other activities
12 Duration of other activities
13 Start time of other activity
14 Duration of stop during
school/college-to-home travel

14
Alex, A. P., Manju, V. S, Isaac, K. P.,
Archives of Transport, 51(3), 7-19, 2019
First network deals with educational activity gener-
ation and scheduling, second network was devel-
oped for mode of commute, third stage for other ac-
tivity generation and fourth stage network was for
other activity scheduling of students. Table 5 pre-
sents the input and output variables used for each
network. The networks are shown in Figures (Neural
Networks for Educational Activity Travel Behav-
iour Fig. 1a to Fig. 1d). The networks used in this
study consisted of four layers: one input layer, two
hidden layers and one output layer. The input layer
consists of one neuron each for all input variables,
two hidden layers consisting of twenty neurons each
and the output layer consisting of one neuron each
for all output variables. The number of hidden layers
and neurons in each layer were selected by trial and
error based on the training and testing performance.
The number of neurons in the input, output and hid-
den layers are shown in the networks.
Table 5. Input and Output Variables of ANN Models for Students ANN Models Input Variables Output Variables
Network 1
Gender, age group, level of education, vehicle ownership
and marital status
Whether the individual perform out-of-home educational activity, educational activity du-
ration, educational activity start time and dis-
tance to place of education
Network 2
Gender, age group, level of education, vehicle ownership,
marital status, educational activity duration, educational
activity start time and distance to place of education
Mode of commute for educational activity
Network 3
Gender, age group, level of education, vehicle ownership, marital status, educational activity duration, educational
activity start time, distance to place of education, mode
of commute for educational activity
Duration of commute for educational activity,
purpose of other activity, purpose of stop dur-ing school/college-to-home travel
Network 4
Gender, age group, level of education, marital status, ve-
hicle ownership, educational activity duration, educa-
tional activity start time and distance to place of educa-tion, commute mode and duration for educational activ-
ity, purpose of other activity, purpose of stop during
school/college-to-home travel
Commute mode, time of occurrence and Du-
ration of other activities, duration of stop dur-ing commute and duration of home stay be-
tween the activities of workers.
Fig. 1a. Network 1 for Educational Activity Generation

Alex, A. P., Manju, V. S, Isaac, K. P.,
Archives of Transport, 51(3), 7-19, 2019
15
Fig.1b. Network 2 for Mode of Educational Activity
Fig. 1c. Network 3 for Educational Activity Scheduling

16
Alex, A. P., Manju, V. S, Isaac, K. P.,
Archives of Transport, 51(3), 7-19, 2019
Fig. 1d. Network 4 for Other Activity of Students
2.3. Validation of the models
Econometric models and neural network models dis-
cussed in the previous sections were validated with
20% of the collected data. The actual/collected data
was given as input to each of the model for workers.
Each of the output was compared with the ac-
tual/collected data and RRMSE was found out.
Empty cells are given for continuous variables.
RRMSE was calculated for these variables with pre-
dicted value and actual value. Prediction accuracies
of all the models are given in Table 6. Validation re-
sults reveal that ANN models show better accuracy
than econometric models.
Table 6. Validation results
Econometric Models ANN Networks
Response Variables Truly
Predicted
Wrongly
Predicted
Error
(%)
Truly
Predicted
Wrongly
Predicted
Error
(%)
Decrease in
Error (%)
Out home Educational activity
(Yes/ No) 370 20 5.13 386 4 1.03 4.10
Daily Educational duration - - 18.14 - - 13.99 4.15
Daily Educational Start time - - 23.09 - - 6.72 16.37
Distance to the Education place - - 33.03 - - 11.8 21.23
Mode of Commute before Edu-
cational Activity 283 99 25.92 342 40 10.47 15.45
Mode of Commute after Educa-
tional Activity 328 54 14.14 356 26 6.81 7.33
Duration of commute before Educational Activity
- - 20.42 - - 40 10.47
Duration of commute after Edu-cational Activity
- - 12.83 - - 8.64 4.19

Alex, A. P., Manju, V. S, Isaac, K. P.,
Archives of Transport, 51(3), 7-19, 2019
17
The prediction errors of econometric models varied
from 5% to 33% and that of ANN models varied
from 1% to 14% only. ANN models were able to
predict the daily activity-travel pattern of students
with accuracy ranging from 86% to 99%. The de-
crease in percentage error ranges from 4% to 21%,
when econometric models are replaced with ANN
models. This shows that level of prediction of arti-
ficial intelligence is better than econometric models
to predict the activity-travel behaviour of students.
This can be attributed to the training and learning
capability of ANN.
3. Application of the ANN models for sustaina-
ble transportation planning
The efficiency of any transportation system is pri-
marily assessed in terms of traffic congestion and
safety. This depends on the traffic volume, its com-
position and road capacity. Enhancement of road ca-
pacity is a long term management measure and often
not feasible. Hence nowadays policy makers rely on
short term demand management policies. The study
also intended to check the suitability of the devel-
oped artificial intelligence to analyse the effect of
short term travel demand management measures.
The effect of promoting sustainable mode of travel
for educational activity is analysed. Cycling/Walk-
ing to school is a sustainable means of transportation
and it is a good chance to implant a regular physical
activity in students' daily routines. ANN models de-
veloped in the study were used to analyse the effect
of sustainable transportation planning viz; promot-
ing walk as mode for educational activity.
If walking is promoted for educational activity up to
2 km, the resulting impact in other modal shares is
studied. It was obtained from the study that walk
share of school going students without any TDM
measure is 3.0%. It was also found that if walking is
promoted upto 2km for all the school going students,
the walk share for school going activity would be in-
creased to 13.0%. Figure2 shows the resulting share
of different modes. It is revealed that when walk
share increases from 3.0% to 13.0%, bus share de-
creases from 54.9% to 47.9%, two wheeler share de-
creases from 30.0% to 28.2% and car share de-
creases from 10.9% to 9.6%.
4. Conclusion
Travel demand models are used to replicate the real
world transportation system and to predict the future
travel demand. A behavioural oriented approach in
travel demand analysis is provided by activity based
travel demand modelling and it provides a better un-
derstanding of the travel behaviour of an individual.
The present study has made an attempt to introduce
artificial intelligence in the modelling of daily edu-
cational activity – travel behaviour. Artificial Neural
Network models were developed in this study and it
was compared with the conventional econometric
models. Results showed that ANN models are able
to predict the educational activity-travel behaviour
with better accuracy than econometric models. The
decrease in percentage error ranges from 4% to 21%,
when econometric models are replaced with ANN
models.
Fig. 2. Modal Share after Shift to Walking
35,9
13
30 29,3 28,2
10,9 10,2
9,6
54,9 53,5
47,9
1,3 1,3 1,30
10
20
30
40
50
60
No TDM 1 km 2km
No.
of
Trip
s(%
) Walk
TW
Car/Van
Bus
Train

18
Alex, A. P., Manju, V. S, Isaac, K. P.,
Archives of Transport, 51(3), 7-19, 2019
However ANN models do not have a statistical
check and model transferability is tedious compared
to econometric models. These ANN models were
later used for analysing the effect of sustainable
travel demand management measure like promoting
walking for students. The study revealed that if
walking is promoted for educational trips for 1km to
2 km, walk share increases from 3.0% to 13%, bus
share decreases from 54.9% to 47.9%, two wheeler
share decreases from 30.0% to 28.2% and car share
decreases from 10.9% to 9.6%. Similar to the above,
different policy options can be tried to obtain a fea-
sible solution to reduce congestion in the school vi-
cinity. Policy or decision makers can use the find-
ings of this study for making appropriate steps for
promoting walking for educational activities. It can
also be used for designing walkways to improve the
safety of school children and to promote sustainable
transportation. Hence it was proved in the study that
artificial intelligence can effectively be used for
modelling the educational activity-travel behaviour
than conventional methods. It was also established
in the study that the resulting models can be applied
for analysing the impact of short term travel demand
management measures, which will give more realis-
tic results than conventional models.
Acknowledgements
The authors are grateful to Kerala State Council for
Science, Technology and Environment for funding
the project.
References
[1] ABUBAKAR, A. M., KARADAL, H.,
BAYIGHOMOG, S. W., MERDAN, E., 2018.
“Workplace injuries, safety climate and ba-
haviours: application of an artificial neural net-
work”, International Journal of Occupational
safety and Ergonomics. Pp: 1-32
[2] AMANATIADIS, A., MITSINIS, N., MADI-
TINOS, D. 2014. “A neural network-based ap-
proach for user experience assessment”, Behav-
iour & Information Technology, Volume 34, Is-
sue 3.pp: 304-315.
[3] ARENTZE,T. A. AND TIMMERMANS, H.
2000. "ALBATROSS - A learning based trans-
portation oriented simulation system", TRB
Conference 2000, USA, Issue No. 1706: 136-
144.
[4] BABU, D., BALAN, S., ANJANEYULU,
M.V.L.R, 2018. Activity-travel patterns of
workers and students: a study from Calicut city,
India. Archives of Transport, 46(2), 21-32.
DOI:
https://doi.org/10.5604/01.3001.0012.2100
[5] BHAT, C. R. AND SINGH, S. K. 2000. "A
Comprehensive Daily Activity-Travel Genera-
tion Model System for Workers", Transporta-
tion Research Part A: Policy and Practice, 34
(1): 1-22.
[6] BHAT, C. R., GUO, J.Y., SRINIVASAN, S.,
AND SIVAKUMAR, A. 2004. "Comprehen-
sive Econometric Microsimulator for Daily Ac-
tivity-Travel Patterns", Transportation Re-
search Record: Journal of the Transportation
Research Board, No. 1894: 57-66.
[7] BINDU, M., MATHEW, T. V. AND
DHINGRA, S.L. 2006. "Prototype Time-Space
Diary Design and Administration for a Devel-
oping Country", Journal of Transportation En-
gineering, ASCE, 132(6): 489-498.
[8] BINDU, M., MATHEW,T. V. AND
DHINGRA, S. L. 2005. “Development of a
Mixed Logit Model to Tour Mode Choice for an
Urban Region”, Paper presented at CUPUM
2005, International Conference, London U.K.
[9] BORIMNEJAD, V., SAMANI, R. E.,
WRIGHT, L. T., 2016. “ Modelling consumer’s
behavior for packed vegetable in Mayadin Man-
agement Organization of Tehran using artificial
neural network, Cogent Business & Manage-
ment, Volume 3, Issue 1. Pp: 1-14
[10] BUSCEMA, M., PIETRALATA, M. M., SA-
LVEMINI, V., INTRALIGI, M., INDRIMI, M.
1998. “Application of Artificial Nueral Net-
works to Eating Disorders”, Substance Use &
Misuse, Vol. 33-3: 765-791.
[11] GIBAŁA, Ł., KONIECZNY, J., 2018. Applica-
tion of artificial neural networks to predict rail-
way switch durability. Scientific Journal of Si-
lesian University of Technology. Series
Transport. 2018, 101, 67-77. ISSN: 0209-3324.
DOI:
https://doi.org/10.20858/sjsutst.2018.101.7.
[12] KITAMURA, R. 1988. An evaluation of activ-
ity-based travel analysis. Transportation 15: 9-
34.
[13] MANOJ, M., VERMA, A. 2013. "Analysis and
Modelling of Activity-Travel Behaviour of

Alex, A. P., Manju, V. S, Isaac, K. P.,
Archives of Transport, 51(3), 7-19, 2019
19
Nonworkers from a City of Developing Coun-
try, India", Procedia - Social and Behavioral
Sciences 104: 621 – 629.
[14] NURUL HABIB, K.M. AND MILLER, E. J.
2009.“Modelling Activity Generation: a Utility
Based Model for Activity-Agenda For-
mation”,Transportmetrica, 5(1) 3-23.
[15] PENDYALA, R. M., KITAMURA, R., KIKU-
CHI, A., YAMAMOTO, T. AND FUJII, S.
2005. "Florida Activity Mobility Simulator -
Overview and Preliminary Validation Results",
Transportation Research Record: Journal of
the Transportation Research Board, No. 1921:
123-130.
[16] POTOGLOU, D., ARSLANGULOVA, B.
2016. “Factors influencing active travel to pri-
mary and secondary schools in Wales”, Trans-
portation Planning and Technology, 39(7): 1-
21.
[17] RECKER, W. W. AND MCNALLY, M. G.
AND ROOT, G. S. 1986. "A model of complex
travel behaviour: part I - theoretical develop-
ment", Transportation research A, 20A (4):
307-318.
[18] ROORDA,M. J.,MILLER, E. J. AND HABIB,
K. M. N. 2008.“Validation of TASHA: A 24-h
activity scheduling microsilulation model”,
Transportation Research Part A: 360-375.
[19] SHARMA, S. K., GAUR, A., SADDIKUTI, V.,
RASTOGI, A. 2017. “Structural equation
model (SEM)-Neural Network (NN) model for
predicting quality determinants of e-learning
management systems”, Behaviour & Infor-
mation Technology, Volume 36, Issue 10.
Pp:1053-1066.
[20] SREELA, P.K, MELAYIL,S. AND AN-
JANEYULU, M.V.L.R. 2013. "Modeling of
Shopping Participation and Duration of Work-
ers in Calicut", Procedia - Social and Behav-
ioral Sciences 104: 543 – 552.
[21] SUBBARAO, S. S. V., RAO, K. V. K. 2014.
“Characteristics of household activity and travel
patterns in the Mumbai metropolitan region”,
Transportation Planning and Technology,
37(5): 484-504.
[22] SUREKHA, N. 2009. "Microsimulation of Ac-
tivity-Travel Pattern for Tiruchirappalli City",
M.Tech diss., NIT Tiruchirappalli.
[23] WAINAINA, S. & RICHTER, M., 2002. Sto-
chastic approach in modelling travellers behav-
iour as a result of activity chains. Archives of
Transport, 14( 2), 95-112.