modelling soot formation from wall films in a gasoline
TRANSCRIPT

Modelling soot formation from wall filmsin a gasoline direct injection engineusing a detailed population balance model
Preprint Cambridge Centre for Computational Chemical Engineering ISSN 1473 – 4273
Modelling soot formation from wall filmsin a gasoline direct injection engine
using a detailed population balance model
Buyu Wang 1, Sebastian Mosbach 2, Sebastian Schmutzhard 2,
Shijin Shuai 1, Yaqing Huang 1, Markus Kraft 2,3
released: 19 June 2015
1 Department of Automotive EngineeringTsinghua UniversityHaidian DistrictBeijing, 100084ChinaE-mail: [email protected]
2 Department of Chemical Engineeringand BiotechnologyUniversity of CambridgeNew Museums SitePembroke StreetCambridge, CB2 3RAUnited Kingdom
3 School of Chemicaland Biomedical EngineeringNanyang Technological University62 Nanyang DriveSingapore 637459E-mail: [email protected]
Preprint No. 157
Keywords: GDI engine, soot, wall film

Edited by
CoMoGROUP
Computational Modelling GroupDepartment of Chemical Engineering and BiotechnologyUniversity of CambridgeNew Museums SitePembroke StreetCambridge CB2 3RAUnited Kingdom
Fax: + 44 (0)1223 334796E-Mail: [email protected] Wide Web: http://como.cheng.cam.ac.uk/

Abstract
In this study, soot formation in a Gasoline Direct Injection (GDI) engine is simulatedusing a Stochastic Reactor Model (SRM Engine Suite) which contains a detailedpopulation balance soot model capable of describing particle morphology and chem-ical composition. In order to describe the soot formation originating from the wallfilm, the SRM Engine Suite is extended to include spray impingement and wall filmevaporation models. The cylinder is divided into a wall and a bulk zone to resolvethe equivalence ratio and temperature distributions of the mixture near the wall. Thecombustion chamber wall is assumed to exchange heat directly only with the wallzone. The turbulent mixing within each zone and between the two zones are simu-lated with different mixing models. The effects of key parameters on the temperatureand equivalence ratio in the two zones are investigated. The mixing rate between thewall and bulk zone has a significant effect on the wall zone, while the mixing ratein the wall zone only has a negligible impact on the temperature and equivalenceratio below a certain threshold. Experimental data are obtained from a four-cylinder,gasoline-fuelled direct injection spark ignition engine operated stoichiometrically.An injection timing sweep, ranging from 120 CAD BTDC to 330 CAD BTDC, isconducted in order to investigate the effect of spray impingement on soot formation.The earliest injection case (330 CAD BTDC), which produces significantly higherlevels of particle emissions than any other case, is simulated by the current model. Itis found that the in-cylinder pressure and the heat release rate match well with the ex-perimental data. The particle size distribution in the simulation has the same order ofmagnitude as the experimental one. By tracing the particles in an equivalence ratio-temperature diagram, it is demonstrated that the rich mixture near the wall becomesthe source of the soot formation as a result of the wall film evaporation.
• Soot formation from a wall film in a GDI engine is simulated.
• Spray impingement and wall film evaporation models are added to SRM EngineSuite.
• Soot is modelled using a highly detailed population balance model.
• Particle size distributions are measured experimentally.
• Evolution of wall region is shown in equivalence ratio-temperature diagrams.
1

Contents
1 Introduction 3
2 Model description 5
2.1 Existing model . . . . . . . . . . . . . . . . . . . . . . . . . . . . . . . 5
2.1.1 Engine model . . . . . . . . . . . . . . . . . . . . . . . . . . . . 5
2.1.2 Soot model . . . . . . . . . . . . . . . . . . . . . . . . . . . . . 6
2.2 Model extensions . . . . . . . . . . . . . . . . . . . . . . . . . . . . . . 6
3 Algorithm 8
3.1 Spray, impingement, and wall film evaporation process . . . . . . . . . . 8
3.2 The mixing process between the wall zone and bulk zone . . . . . . . . . 10
4 Experimental setup and results 11
5 Simulation results and discussion 13
5.1 Parameter sweeps . . . . . . . . . . . . . . . . . . . . . . . . . . . . . . 13
5.2 Wall film soot simulation . . . . . . . . . . . . . . . . . . . . . . . . . . 14
6 Conclusions 19
References 21
2
1 Introduction
Gasoline Direct Injection (GDI) engines are becoming the most widely used gasolineengines all over the world attributed to the high efficiency compared with traditional PortFuel Injection (PFI) engines [55]. Unfortunately, the particle emissions are higher for GDIengines, and it is difficult for the manufacturers to control the particle mass and numberbelow the limit value of EURO VI (PM < 5 mg/km and PN < 6 × 10¹¹ particles/km)[7, 43, 61]. Additionally, the fine particles, especially the ones with the size less than2.5 µm (known as PM2.5), have adverse health effects [48]. Thus, it is necessary todetermine the source of particles in GDI engines and take measures to reduce the particleemissions.
It is well-known that the engine-out particulate matter from Diesel engines can be di-vided into two modes by size, the nucleation mode and the accumulation mode [26]. Forthe nucleation mode, the particles normally have the size ranging between 5 and 50 nmand consist of soluble organic fraction (SOF) and sulfate. Typically the nucleation modecontains 1-20% of the particle mass and more than 90% of the particle number. For theaccumulation mode, main part of the particles is dry soot with the size ranging between100 to 300 nm. It was found by many tests that most of the particles from GDI engines arelocated in the accumulation mode [7, 19, 61]. The peak value of the accumulation modeis around 100 nm.
Because of the longer ignition delay and good volatility of gasoline, fuel in GDI engineshas sufficient time to premix and fewer locally fuel-rich regions are formed than in com-pression ignition direct injection (CIDI) engines, especially if the injection takes placelong before top dead center. So the traditional soot formation mechanism may not be ap-plicable for GDI engines. The soot formation process in GDI engines has been widely in-vestigated by optical methods such as high-speed camera combustion images [8, 16, 74],two colour method [64], Laser-Induced Fluorescence (LIF) [45, 63] and Laser-InducedIncandescence (LII) [54, 70]. Wyszynski et al. [74] compared three fuels (unleaded gaso-line, iso-octane, and toluene) on an optical GDI engine. From high-speed combustionimages, they observed soot formed in rich regions from pool fires glowing late in theengine cycle. Catapano et al. [8] also used combustion images of ethanol and gasolineblends to demonstrate that the diffusion combustion of fuel films is the source of soot for-mation. Similar results were found by Fatouraie et al. [16]. Stojkovic et al. [64] used twocolour method to calculate the soot concentration in a stratified charge GDI engine anddescribed the soot formation in detail. They concluded that there are two main sourcesof soot formation: one is the partially premixed flame through locally rich zones and theother is pool fires fed by piston surface films. Soot from the former burns out rapidly dueto high temperature and rapid mixing with surrounding lean regions, while soot from thelatter can persist until late in the cycle, when soot oxidation is unlikely as a result of lowtemperature and vanishing hydroxyl radicals. Recently, Rossbach et al. [54, 70] used LIIto quantify soot formation in a Direct Injection Spark Ignition (DISI) engine. They mea-sured the soot concentrations, mean particle diameters and number densities in differentcombustion modes and different injection timings. Besides, Berndorfer et al. [5] proposedthat another source for soot in GDI engines might be the diffusion flame near the tip ofthe injector. The soot emissions can be worse for a coked injector. The liquid fuel film
3

wetting the piston surface is at relatively low temperature, evaporates and is subject toslow oxidation – such conditions trigger the formation of carbonaceous deposits [20, 32].The resulting coke coating decreases the thermal conductivity of the walls and thus leadsto increased operating temperature in the engine [33]. Fuel can condense in the porousdeposit during the injection and be released at the end of the power stroke, causing in-creased emission of soot [49]. The deposits formed at the injector nozzles can seriouslyaffect their performance [20]. The processes of deposit and soot formation are conjugated– soot may nucleate or sediment onto deposit contributing to its thickness, and vice versa,engine deposits may significantly alter the soot emissions [20, 32]. In summary, numer-ous studies demonstrate that the wall film formed due to spray impingement is the mainsource of soot and carbonaceous deposits in GDI engines.
Even though there are many numerical works focused on soot formation and oxidationin Diesel engines, computational research into GDI soot formation is currently very lim-ited, especially studies considering both the detailed wall film formation and soot for-mation. Etheridge et al. [13] coupled Stochastic Reactor Model (SRM) with SWEEP, aMonte Carlo based population balance solver, to simulate the soot formation in a strati-fied charge GDI engine and found the high stratification by late injection led to more sootemissions. Jiao and Reitz [23] and Naik et al. [42] performed 3D computational fluiddynamics simulations in GDI engines to show the in-cylinder soot evolution by semi-detailed soot models. But none of them considered the effect of spray impingement andsoot from the wall film. Sukegawa et al. [68] applied LES to simulate the mixture forma-tion process including spray development and impingement, but they did not calculate thecombustion process and particle results were given by empirical expressions only.
In order to describe soot formation from the wall film, the spray impingement process andthe wall film evaporation should be considered. In addition, the same processes controlthe temperature and the evolution of the composition of the film, which are the mostimportant factors affecting coking [20]. Since Naber and Reitz first modelled the sprayimpingement [40], a number of models have been proposed. Most of the models containthree major parts: the regimes of spray impingement, the criteria for different regimes,and the calculation of the post-impingement characteristics [30]. Naber and Reitz describethree regimes: stick, reflect, and jet [40]. However, they did not provide any criteria todiscriminate between the different regimes. Shih and Assanis [57] and Watkins [71, 72]respectively modified Naber model by setting the Weber number as criteria. They useddifferent methods to calculate the droplet characteristics after impingement. Mundo etal. [38, 39] and Senda et al. [56] developed a spray-wall interaction model based onexperiments and took the state of the wall into account. Based on previous research, thewell-known Bai and Gosman model [1] was proposed and widely used in different engineconditions. For example, Su et al. [66] incorporated the Bai and Gosman model intoa stochastic spray model to investigate the dual-injection HCCI combustion, where thefirst injection event of Diesel fuel at low in-cylinder pressure during compression causedimpingement of the fuel on the wall. To better model gasoline spray impingement, Bai andGosman modified the original model in 2002 [3]. More details about the Bai and Gosmanmodel are described in the next section. Following Bai and Gosman, Stanton and Rutland[62], O’Rourke and Amsden [44], Trujillo et al. [69], Han et al. [21], Lee et al. [28, 29],and Kim et al. [25] proposed their own spray impingement models, respectively. Themajor differences among these models are the definition of the criteria between different
4

regimes and the assumptions and calculation methods used to determine the droplet speedand size distribution after impingement.
The aim of this paper is to present an engine model which can be used to simulate sootformation in a GDI engine accounting for the effect of a wall film. The model incorporatesa detailed population balance soot model, which can describe the soot morphology andchemical composition, and is applied to simulate a GDI engine with an early injection andspray impingement. The paper is structured as follows. Firstly the engine and soot modeldetails are explained. Then, the algorithm to calculate the spray impingement and filmevaporation is presented. In the subsequent section, the results of numerical simulationsare compared with experimental results.
2 Model description
In this section the integrated engine and soot model is briefly summarised. The modifica-tions to this model made as part of this work, which include spray impingement, wall filmevaporation, heat transfer, and mixing sub-models, are also described.
2.1 Existing model
2.1.1 Engine model
The Stochastic Reactor Model (SRM) is a spatially zero-dimensional model of the con-tents of the combustion chamber based on Probability Density Function (PDF) transportmethods [11, 51]. The model has been successfully employed in a number of studiesin Homogeneous Charge Compression Ignition (HCCI) engines [6, 27, 36, 65], SparkIgnition (SI) engines [14], conventional Compression Ignition Direct Injection (CIDI) en-gines [59], and Partially Premixed Compression Ignition (PPCI) engines [60]. It was alsopreviously used to simulate soot in HCCI [37], stratified GDI [13], and conventional com-pression ignition engines [60]. Being a PDF method, the SRM describes distributions oftemperature and species concentrations within the engine cylinder. These distributions arerepresented by an ensemble of stochastic particles, each of which can be thought of as afluid parcel in the cylinder with its own temperature and composition. The time-evolutionof the stochastic particles and hence the distributions as a consequence of processes suchas turbulent mixing, heat transfer, direct injection, and flame propagation is described byappropriate sub-models. The number of particles governs the precision of predictions.To eliminate the dependence on the particle number, 100 particles are sufficient in manyapplications according to previous studies (e.g. [37]). An advantage of SRM is that itallows detailed chemistry calculations with relatively short computational times. In thiswork, a detailed Primary Reference Fuel (PRF) mechanism containing 208 species and1002 reactions is employed [37].
5

2.1.2 Soot model
In order to describe the formation and oxidation of soot, a detailed set of populationbalance equations is solved by SWEEP [9], which is based on a Monte Carlo method[4, 18, 47].
The soot model tracks for each aggregate the surface area, the number of primary particlesand the diameter of each primary particle. The numbers of carbon atoms, hydrogen atomsand PAH molecules for each aggregate are also stored to model the chemical compositionof soot. By using the Aromatic Site Counting Model [10], each type of functional site ona PAH is tracked including free edge, armchair, zigzag, and bay sites, and five-memberedrings. A statistical representation of the functional sites on the PAHs is employed insteadof tracking each molecule in order to achieve acceptable computational times and memoryrequirements. Since tracking such a large number of quantities results in a very high-dimensional population balance, a Monte Carlo method is used to solve it – being theonly method suitable to treat such problems.
In terms of processes involving soot particles, the following are included in the model:inception, condensation, surface growth and oxidation, and coagulation. Inception, i.e.nucleation of a new soot particle, is modelled by dimerisation of coronene – a seven-ring aromatic compound and the largest species represented by the gas-phase chemistrymodel. Condensation involves adsorption of a coronene molecule on the surface of anexisting soot particle. Surface growth and oxidation are modelled using detailed sets ofreactions whose rates depend on the attacked functional site and also the neighbouringones, which can be provided through statistical correlations obtained from Kinetic MonteCarlo (KMC) simulations [52]. The Linear Process Deferment Algorithm (LPDA) [46] isemployed to speed up the calculation of surface reactions.
2.2 Model extensions
In order to model the effects of a wall film in this work, the stochastic particle ensembleis divided into two zones: a wall zone and a bulk zone. The particles in the bulk zoneundergo the injection process. The particles in the wall zone represent the region nearthe wall and are involved in the spray impingement and film evaporation processes. Thetotal mass of the wall zone is assumed as a small fraction of the total in-cylinder mass.The initial mass of the wall particles is (much) smaller than that of the bulk particles inorder to resolve the film evaporation due to the quite small amount of fuel in the film.Mixing occurs both within and between each zone with different models. A model basedon proximity in composition space [67] is used in each of the zones and Curl’s model [12]is used for the mixing between zones. Chemical reactions, as in the original model, occurat every time-step in every particle, while the heat transfer to the cylinder wall only occursin the wall zone.
The wall film is formed due to spray impingement. In terms of the special conditionsof the GDI engines during the injection process, such as the 3-20 MPa injection pres-sure [53], relatively low back pressure, and high piston surface temperature, the sprayimpingement model should be carefully chosen. While several impingement models have
6

been proposed in the literature, the model by Bai and Gosman [1, 3] is employed in thisstudy as it has been validated in injection experiments of GDI engines and used in 3DCFD simulations [31, 34, 58]. It should be noted that Su et al. [66] used the same modelto simulate spray impingement with SRM. In the current work, this approach is extendedto include the presence of a wall film. According to the Bai and Gosman model [1, 3],assuming a wetted wall, the regimes of post-impingement droplets are determined by theWeber number We:
Stick: We 6 2
Rebound: 2 < We 6 20
Spread: 20 < We 6 Wec
Splash: Wec < We
We =ρlddv
2in
σ
Wec =1320La−0.18 with La =ρlσdd
µ2,
(1)
where ρl is the liquid density, dd is the incident droplet diameter, vin is the normal com-ponent of incident droplet velocity, σ is the droplet surface tension, La is the Laplacenumber, and µ is the liquid viscosity.
In the rebound regime, none of the impingement droplets will stick to the wall and thereflected droplets have the same size as the impinging ones. In the spread regime, all ofthe impingement droplets will become part of the film. In the splash regime, some ofthe incident droplets will be transferred to the wall film, while the remaining ones, calledsecondary droplets, will be rebounded. The split ratio γ of the droplet mass in the twoparts is given by [1]
γ =∆mw
∆mw + ∆mfilm
= 0.2 + 0.9a, (2)
where ∆mw and ∆mfilm are droplet mass rebounded and transferred to wall film, respec-tively, and a is a random number distributed uniformly between 0 and 1. γ can exceedunity, which accounts for splashing droplets entraining liquid from the wall film.
In order to predict the size of the secondary droplets, the model by Han et al. [21] is em-ployed, which is based on several experimental observations of the droplet impingement.A type of Nukiyama-Tanasawa function is used to model the size distribution of the re-bounded droplets. Thus, the Sauter Mean Diameter (SMD) d′d of the secondary dropletsize distribution is given by [1, 3, 21]:
d′d = 2.16dm
dm =[ γ
30( WeWec− 1)
]1/3
dd.(3)
Furthermore, mass transfer from the wall film to the wall zone takes place due to evapo-ration of the wall film. The film evaporation rate mfilm is calculated using [2]
mfilm =ShρgD(Y∞ − Yfs)
l(1− Yfs), (4)
7

Table 1: Physical parameters used in the simulation.
Parameter Value Unit
ρl 762.9 kg/m3
σ 21 mN/mµ 3.43 mm2/sQf 0.3 MJ/kgRe 10667 -Sc 3.75 -D 4.0 mm2/s
where Sh denotes the Sherwood number, ρg the density of the surrounding gas, D thefuel/air binary diffusion coefficient, Yfs the fuel mass fraction at the film surface obtainedfrom the Clausius-Clapeyron equation, and Y∞ the fuel mass fraction in the surroundinggas far from the surface. The Sherwood number is calculated from the Reynolds num-ber Re and the Schmidt number Sc according to [73]
Sh = 0.332Re1/2Sc1/3. (5)
l is defined as l = l0δ0δ, where the ratio of characteristic length l0 and characteristic film
thickness δ0 is assumed as 100 according to French’s experiments [17]. The film thicknessδ is determined by Nagaoka’s model [41], δ = 2σ/(ρlv
2in). The temperature of the film is
assumed constant and equal to the temperature of the cylinder wall, so the heat transferbetween the film and the cylinder wall as well as evaporative cooling of the film areignored.
Table 1 shows the values used for the physical parameters appearing above.
3 Algorithm
3.1 Spray, impingement, and wall film evaporation process
The cylinder is divided into two zones, the bulk zone, which is denoted by a subscript “b”,and the wall zone, which is denoted by a subscript “w”. The model extensions describedin the previous section are implemented as follows:
1. In each time-step, calculate the spray penetration S(t) according to [22]
S(t) =
{0.39(2∆p
ρl)1/2t, t < tbreak
2.95(∆pρg
)1/4(d0t)1/2 t > tbreak
(6)
tbreak =28.65ρld0
(ρg∆p)1/2, (7)
where t is the time since start of injection, ∆p is the pressure drop across the nozzle, d0 is
8

the nozzle diameter, ρl and ρg are the fuel liquid and gas densities respectively, and tbreak
is the spray break-up time.
Calculate the current spray penetration volume
Vpen =π
3sin2
(θ2
)S(t)3, (8)
where θ is the cone angle of the spray.
2. Pick stochastic particles to be penetrated by the spray as follows: Let U denote the setof indices of all particles which have been chosen since the start of injection. Then, addnew particles to this set, picked uniformly randomly from the bulk zone, until their totalvolume
Vpar =∑i
V (i) ∀i ∈ U (9)
at least equals the penetration volume, i.e. Vpar > Vpen. This ensures that a set of particlesis chosen such that their combined volume approximates Eqn. 8.
3. Assign to each of the chosen particles a value of m(i)liq proportional to the statistical
weight W (i), i.e. the particle mass, such that the total injected mass∑m
(i)liq during the
time-step ∆t equals mfuel∆t, where mfuel is the injected mass flow rate and m(i)liq is the
mass of liquid fuel in the ith particle:
m(i)liq =
W (i)∑jW
(j)mfuel∆t. (10)
In each of the chosen particles, initialise the droplet diameter d(i)d = dn, where dn is an
initial diameter defined by the user according to injection data and calculate the dropletnumbers according to
N(i)d =
6m(i)liq
πρld(i)3d
∀i ∈ 1, . . . , Npar. (11)
4. If
S(t) sin(θ
2
)>
Bore
2or S(t) cos
(θ2
)>
4V (t)
πBore2 , (12)
where V (t) is the current cylinder volume, spray impingement occurs, go to step 5. Oth-erwise, go to step 6.
5. The particles involved in the impingement are the ones at the tip of the spray, i.e. theones newly selected in the current time-step. In each of these particles, determine theregimes of the post-impingement droplets according to Eqn. 1 by calculating the Webernumber
We =ρldd
[v(t) cos
(θ2
)]2
σ, (13)
9

where v(t) = dS(t)/dt denotes the velocity of the tip of the spray. If a particle containsdroplets of a diameter such that the Weber number corresponds to the spread regime, thefuel droplet mass involved in the impingement is added to the wall film mass and then thedroplet mass and number, particle mass, and enthalpy of each particle in the bulk zone areupdated.
If the particle locates in the rebound regime, all of the fuel involved in the impingement istransferred to the wall zone ∆mw and these droplets have the same size as the impingingdroplets, i.e. d′(i)d = d
(i)d . The droplet size of the updated particles in the wall zone is given
by
d(i)dw =
[ 6(m(i)lw + ∆m
(i)lw )
πρl(N(i)dw + ∆N
(i)dw)
]1/3
, (14)
where ∆m(i)lw and ∆N
(i)dw are the mass and number of droplets added to each particle, which
are determined through equations similar to Eqns. 10 and 11, respectively.
If the particle locates in the splash regime, the mass of the impinging droplets is distributedto the wall film mass and droplet mass in the particles in the wall zone (similar to Eqn. 10)according to the split ratio γ, which is calculated by Eqn. 2. The rebounded dropletsize d′(i)d is calculated by Eqn. 3.
6. Calculate the film evaporation rate mfilm according to Eqn. 4, with the average fuelmass fraction in the wall zone taken as Y∞. Update the composition and temperature ofthe particles in the wall zone as follows: Add to the mass of each particle in the wall zonea value of ∆m
(i)fuel proportional to the statistical weight to represent the evaporated mass,
i.e.
∆m(i)fuel =
W (i)∑jW
(j)mfilm∆t ∀particles i in the wall zone. (15)
Update the enthalpy according to[W (i)H(i) + ∆m
(i)fuel(H
(i)f −Qf)
]/(W (i) + ∆m
(i)fuel
), and
the statistical weight W (i) for all particles in the wall zone, where H(i) is the enthalpyin the last time-step, Qf is the vaporization heat, and H
(i)f is the fuel enthalpy of the
film. Update the particle masses and gas-phase species mass fractions according to massconservation.
7. Update the liquid fuel mass, statistical weight, gas-phase species mass fractions, andenthalpy of all particles in both bulk and wall zones after the droplet evaporation, whichis treated as in previous work [35].
3.2 The mixing process between the wall zone and bulk zone
The characteristic rate for the exchange of mass between the wall and bulk zones is definedas
β =Exchange mass flow rate
Mtot,w
, (16)
10

where Mtot,w denotes total mass in the wall zone. Thus, in a time-step ∆t, the massexchanged between the zones is given by βMtot,w∆t. Larger β corresponds to more rapidmixing.
The mass exchange process is implemented as follows:
1. Pick particles uniformly randomly from the wall zone until the combined mass ofthese particles exceeds the exchange mass, i.e.
∑jW
(j) > βMtot,w∆t, where the sum isunderstood to range over the chosen particles only.
2. The exchange mass for each of the chosen particles ∆m(i)w is proportional to the statis-
tical weight and calculated by
∆m(i)w =
W (i)∑jW
(j)βMtot,w∆t. (17)
3. Perform a procedure analogous to steps 1 and 2 for the bulk zone to obtain the particlesinvolved in the mixing process and the exchange mass for each of the chosen particles∆m
(i)b .
4. Update all particles in the wall zone by averaging the information in the chosen particlesin the bulk zone. The statistical weight of each particle does not change. The gas-phasespecies mass fractions Y (i)
j of the ith wall particle are updated according to
Y(i)j ←
(1− ∆m
(i)w
W (i)
)Y
(i)j +
∆m(i)w
W (i)
( 1∑kW
(k)
∑k
Y(k)j W (k)
), (18)
where the sums over k are understood to range over the chosen bulk particles only. Theliquid mass m(i)
liq and droplet number N (i)d are updated in a similar fashion. The droplet
diameter is then recalculated as
d(i)d =
( 6m(i)liq
πρlN(i)d
)1/3
. (19)
5. Update the enthalpy for all particles in the wall zone according to[(W (i)−∆m
(i)w )H
(i)w +
∆m(i)w H
(i)b
]/W (i), where H(i)
w and H(i)b are the enthalpy of particles in the wall zone and
the bulk zone before the mixing, respectively.
6. Similar to step 4 and 5, update the chosen particles in the bulk zone.
4 Experimental setup and results
The engine used in this study is a Geely four-cylinder GDI engine. Engine specificationsare shown in Table 2. The test fuel is commercial gasoline, with a Research OctaneNumber (RON) of 93. The ETAS INCA electronic control system can flexibly control theinjection timing and duration. Engine-out particles are sampled from the exhaust manifold
11

Table 2: Test engine specifications.
Engine type4-cylinder turbo-charged
GDI engineBore × Stroke 75 mm × 73.5 mmDisplacement 1.3 LCompression ratio 10.2Injector 6 holesInjector cone angle 72 degIntake valve open 389 CAD BTDCIntake valve close 167 CAD BTDCExhaust valve open 172 CAD ATDCExhaust valve close 382 CAD ATDC
PC
TWC
Water
Tank
Cooler
IntercoolerIntake
Turbo Charger
DMS500
ETAS INCA Charge Amplifier Combustion Analyzer PC
Fuel Meter
GasolineEngine
Dynamometer
Figure 1: Engine system schematic.
and analysed by a Cambustion DMS500 differential mobility spectrometer to obtain theparticle size distribution. A schematic of the experimental apparatus is shown in Fig. 1.
In the test, the engine speed is 2000 rpm at a torque of 137 Nm. The air-fuel ratio iscontrolled at the stoichiometric ratio and the spark timing is 3 CAD ATDC. The intaketemperature and pressure are 313 K and 0.156 MPa, respectively. Single injection is usedwith 13 MPa injection pressure. In the experiments, different injection timings varyingfrom 120 CAD BTDC to 330 CAD BTDC are compared, which cover large parts ofthe intake and compression stroke. It can be seen in Fig. 2 that when the injection istoo early (330 CAD BTDC), particulate emissions increase significantly, especially ofparticles with size larger than 30 nm, which mainly consist of soot [26]. Similar results
12

can be found in [15, 50]. At 330 CAD BTDC, the distance between the injector andthe piston is too short to avoid the spray impinging. It should be noted that the injector,producing sprays with a relatively small cone angle, is designed for injections near bottomdead centre. The time for spray vaporisation and mixing is sufficiently long that thepossibility of soot formation from locally rich conditions occurring in the bulk mixturecan be excluded. Thus, it is suggested that the wall film is the only source of these largeparticles due to the late evaporation of the film and then the formation of locally richregions near the piston wall. No systematic variation in the particle size distribution canbe observed for a wide range of injection timings. It is concluded from this that themechanism of formation for these particles is likely to be unrelated to spray impingementon the piston.
1 0 1 0 0 1 0 0 01 0 4
1 0 5
1 0 6
1 0 7
1 0 8
1 0 9 1 2 0 B T D C 1 5 0 B T D C 1 8 0 B T D C 2 1 0 B T D C 2 4 0 B T D C 2 7 0 B T D C 3 0 0 B T D C 3 3 0 B T D C
dN/dl
ogDp
(1/cm
3 )
P a r t i c l e S i z e D p ( n m )Figure 2: Engine-out particle size distributions for different injection timings as mea-
sured by DMS500.
5 Simulation results and discussion
5.1 Parameter sweeps
Two important parameters are introduced in the modified mixing model, the turbulentmixing rate in the wall zone and the fraction β which determines the mixing between thewall zone and the bulk zone. It is necessary to discuss the influence of the two parame-ters. Figure 3 shows the effect of β on the average temperature and the equivalence ratioin the bulk and wall zone, respectively. A large β means the wall and bulk zones mixstrongly, so the average temperature is similar for the two zones and the equivalence ratiorapidly approaches the same value in both zones after the wall film is completely evapo-rated. By decreasing β, the bulk zone temperature is slightly influenced, but the wall zonetemperature drops significantly. Also, the wall zone becomes rich with small β. Since,experimentally, low temperatures and fuel-rich mixtures are found near the wall during
13

combustion [64], it is assumed that a small β is more realistic, i.e. the mass and heatexchange between the wall and the bulk zones is assumed to be slow.
- 5 0 - 4 0 - 3 0 - 2 0 - 1 0 0 1 0 2 0 3 0 4 0 5 0 6 0 7 0 8 00
5 0 0
1 0 0 0
1 5 0 0
2 0 0 0
2 5 0 0
3 0 0 0 � � � � � � � � � �� � � � � � � � � �� � � � � � � � � �� � � � � � � � � �� � � � � � � � �� � � � � � � � �
Avera
ge Te
mpera
ture (
K)
C r a n k A n g l e ( d e g )(a) Temperature.
- 2 0 - 1 0 0 1 0 2 0 3 0 4 0 5 0 6 00 . 0
0 . 5
1 . 0
1 . 5
2 . 0
2 . 5
3 . 0 � � � � � � � � � �� � � � � � � � � �� � � � � � � � � �� � � � � � � � � �� � � � � � � � �� � � � � � � � �
Avera
ge Eq
uivale
nce R
atio
C r a n k A n g l e ( d e g )(b) Equivalence ratio.
Figure 3: The average temperature and equivalence ratio of the wall and bulk particleswith different β.
Figure 4 shows the temperature and equivalence ratio in the bulk and wall zone withdifferent mixing rate in the wall zone. As a result of the heat transfer with the wall and theearly flame propagation in the bulk zone, the temperature in the wall zone is lower than inthe bulk zone, which slows the mixing process near the wall. Thus, a lower mixing ratefor the wall zone is used in the study. In order to describe the relation of the turbulenceintensities in the wall and the bulk zone, a parameter κ is defined as
κ =τbulk
τwall
, (20)
where τbulk and τwall are the mixing time in the wall and bulk zone, respectively. It shouldbe noted that for SI simulation, the particle ensemble is divided into three zones: un-burned, entrained and burned [14], and these zones are independent of the bulk/wall par-titioning. That is, any bulk or wall particle can be part of any of the three SI zones. Themixing time τbulk and τwall can vary in different SI zones, but κ is the same for these zones(κunburned=κentrained=κburned). For the results shown in Fig. 4, the mixing rate in the bulkzone is kept the same and κ is set at 0.01, 0.1, and 0.5, respectively. Unsurprisingly, thebulk zone is barely affected by the mixing rate in the wall zone, while the slow mixingprovides lower temperature and richer mixture in the wall zone. Ratios below 0.1 do notsignificantly affect the temperature and the equivalence ratio in the wall zone.
5.2 Wall film soot simulation
As mentioned in section 4, the experimental case with the earliest injection timing (330 CADBTDC) is the only one which exhibits a significant increase in particle emissions abovethe baseline. For this reason, this case is chosen to be simulated. The measured parti-cle size for comparison is modified as the difference between the results in the 330 CADBTDC case and the 300 CAD BTDC case. The time-step is 0.2 CAD and 100 SRM
14

- 5 0 - 4 0 - 3 0 - 2 0 - 1 0 0 1 0 2 0 3 0 4 0 5 0 6 0 7 0 8 00
5 0 0
1 0 0 0
1 5 0 0
2 0 0 0
2 5 0 0
3 0 0 0 � � � � � � � � � �� � � � � � � � � �� � � � � � � � �� � � � � � � � �� � � � � � � � �� � � � � � � � �
Avera
ge Te
mpera
ture (
K)
C r a n k A n g l e ( d e g )(a) Temperature.
- 2 0 - 1 0 0 1 0 2 0 3 0 4 0 5 0 6 00 . 0
0 . 5
1 . 0
1 . 5
2 . 0
2 . 5
3 . 0� � � � � � � � � �� � � � � � � � � �� � � � � � � � �� � � � � � � � �� � � � � � � � �� � � � � � � � �
Avera
ge Eq
uivale
nce R
atio
C r a n k A n g l e ( d e g )(b) Equivalence ratio.
Figure 4: The average temperature and equivalence ratio of the wall and bulk particleswith different κ. The rise in equivalence ratio is due to the wall film evapo-ration, which itself increases due to the temperature rise as a consequence ofcombustion heat release.
particles are used. The calculation duration is from the intake valve open to the exhaustvalve open. A breathing model is used to simulate the intake process [14]. 93 mass%iso-octane and 7 mass% n-heptane are used to match the RON of the test fuel. Modelparameters such as the turbulent mixing time and the parameters in the flame propagationmodel are calibrated to match the cylinder pressure and heat release rate with the exper-imental data. These parameters are listed in Table 3. Figure 5 shows a comparison ofin-cylinder pressure and heat release rate between experiment and simulation.
Table 3: Key model parameters used in the simulation.
Parameter Value Unit
Initial mass ratio of wall/bulk zone 0.01 -Particle number in wall zone 50 -Particle number in bulk zone 50 -Mixing time in bulk burnt zone 2.5 msMixing time in bulk entrained zone 0.25 msβ 0.01 1/sκ 0.1 -
Figure 6 shows the time-evolution of the liquid fuel mass in the wall film. The liquid filmcontains about 5.4 mg of fuel at spark timing (3 CAD ATDC), which is about 15% of thetotal injected fuel. Subsequently, the film evaporates rapidly, which can be attributed tothe rising temperature in the wall zone. The average temperature and equivalence ratioof the wall and bulk particles as a function of crank angle, respectively, are shown by thecorresponding curves (κ = 0.1) in Fig. 4. The average temperature of the wall particlesis lower than that of the bulk particles after the start of ignition (about 6 CAD ATDC).After 10 CAD ATDC, the evaporation rate of wall film increases (Fig. 6), which leads
15

- 1 0 0 - 8 0 - 6 0 - 4 0 - 2 0 0 2 0 4 0 6 0 8 0 1 0 0- 3- 2- 10123456
Pressu
re (M
Pa)
C r a n k A n g l e ( d e g )
- 1 001 02 03 04 05 06 07 08 09 01 0 01 1 01 2 0 E x p e r i m e n t
S i m u l a t i o n
HRR (
J/deg
)
Figure 5: The cylinder pressure and heat release rate in the experiment and simulation.
to an increase of the equivalence ratio in the wall particles. Attributed to the mixingbetween the wall zone and the bulk zone, the temperature of the bulk particles drops andthe equivalence ratio of the bulk particles slightly increases.
3 6 9 1 2 1 5 1 8 2 1 2 4 2 7 3 00
1
2
3
4
5
6
Liquid
fuel
mass
in the
wall fi
lm(m
g)
C r a n k A n g l e ( d e g )Figure 6: Simulated time-evolution of the liquid fuel mass in the wall film.
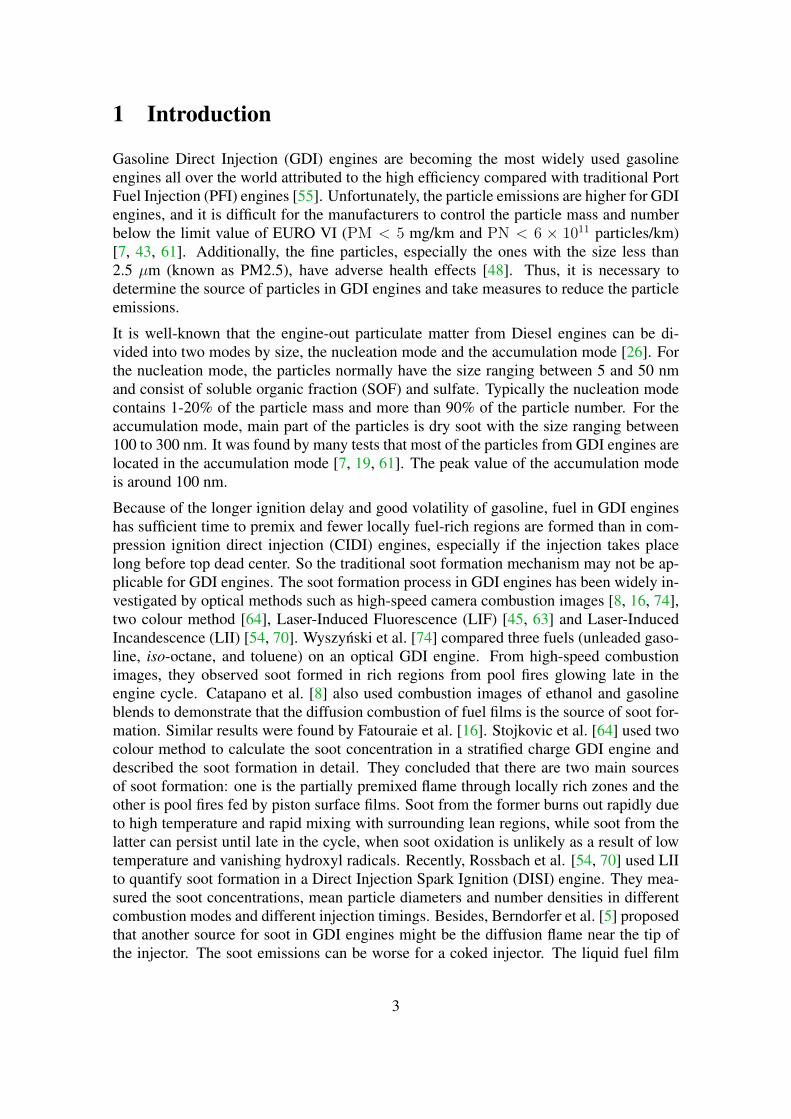
In order to trace the time-evolution of equivalence ratio and temperature of each particle,Φ-T distributions are plotted at several crank angles in Fig. 7. In the figure, the blue dotsrepresent the wall particles and the red ones the bulk particles. At 6 CAD ATDC, allof the particles are unburnt and the equivalence ratio is close to 1. At 10 CAD ATDC,the bulk particles firstly burn at the stoichiometric condition. Then the temperature ofthe wall particles increases, which can be attributed to ignition and mixing with the bulkparticles. At the same time, the mixture becomes richer due to the film evaporation andenters the soot peninsula (from 22 CAD ATDC). These rich mixtures in the wall zone
16
become the source of the soot formation. After the soot formation, the low temperature ofthe wall particles (< 1600 K) decreases the oxidation rate leading to the final engine-outsoot emissions, which is consistent with the optical results by Stojkovic et al. [64].
Figure 7: Equivalence ratio-temperature diagram of the wall and bulk particles at differ-ent crank angles in the simulation. The blue dots represent the wall particlesand the red ones represent the bulk particles. The soot and NOx iso-lines areadopted from Kamimoto and Bae [24].
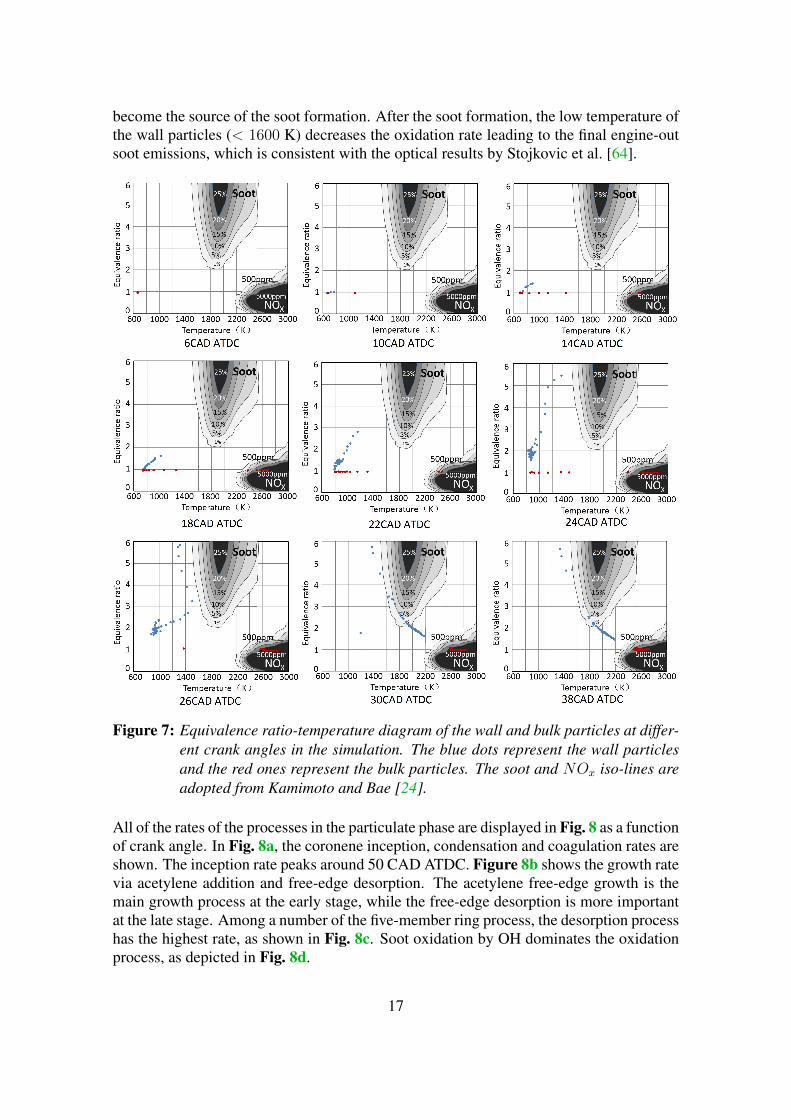
All of the rates of the processes in the particulate phase are displayed in Fig. 8 as a functionof crank angle. In Fig. 8a, the coronene inception, condensation and coagulation rates areshown. The inception rate peaks around 50 CAD ATDC. Figure 8b shows the growth ratevia acetylene addition and free-edge desorption. The acetylene free-edge growth is themain growth process at the early stage, while the free-edge desorption is more importantat the late stage. Among a number of the five-member ring process, the desorption processhas the highest rate, as shown in Fig. 8c. Soot oxidation by OH dominates the oxidationprocess, as depicted in Fig. 8d.
17

0 2 0 4 0 6 0 8 0 1 0 0 1 2 0 1 4 0 1 6 0 1 8 01 0 1 0
1 0 1 1
1 0 1 2
1 0 1 3
1 0 1 4
1 0 1 5
1 0 1 6
1 0 1 7
1 0 1 8
1 0 1 9
1 0 2 0
1 0 2 1 C o r o n e n e i n c e p t i o n C O R O N E N E c o n d e n s a t i o n C o a g u l a t i o n
Rate
(1/cm
3 /s)
C r a n k A n g l e ( d e g )(a) Inception, condensation, and coagulation pro-
cesses.
0 2 0 4 0 6 0 8 0 1 0 0 1 2 0 1 4 0 1 6 0 1 8 01 0 1 0
1 0 1 1
1 0 1 2
1 0 1 3
1 0 1 4
1 0 1 5
1 0 1 6
1 0 1 7
1 0 1 8
1 0 1 9
1 0 2 0
1 0 2 1
Rate
(1/cm
3 /s)
C r a n k A n g l e ( d e g )
C 2 H 2 f r e e - e d g e g r o w t h F r e e - e d g e d e s o r p t i o n C 2 H 2 a r m c h a i r g r o w t h
(b) Edge growth and desorption processes.
0 2 0 4 0 6 0 8 0 1 0 0 1 2 0 1 4 0 1 6 0 1 8 01 0 1 0
1 0 1 1
1 0 1 2
1 0 1 3
1 0 1 4
1 0 1 5
1 0 1 6
1 0 1 7
1 0 1 8
1 0 1 9
1 0 2 0
1 0 2 1
Rate
(1/cm
3 /s)
C r a n k A n g l e ( d e g )
R 5 a d d i t i o n t o z i g - z a g R 5 d e s o r p t i o n R 5 c o n v e r s i o n a t e d g e R 5 f r e e - e d g e d e s o r p t i o n R 5 c o n v e r s i o n a t a r m c h a i r
(c) Five-member ring processes.
0 2 0 4 0 6 0 8 0 1 0 0 1 2 0 1 4 0 1 6 0 1 8 0 2 0 01 0 1 0
1 0 1 1
1 0 1 2
1 0 1 3
1 0 1 4
1 0 1 5
1 0 1 6
1 0 1 7
1 0 1 8
1 0 1 9
1 0 2 0
1 0 2 1
Rate
(1/cm
3 /s)
C r a n k A n g l e ( d e g )
O H o x i d a t i o n a t f r e e - e d g e O 2 o x i d a t i o n a t f r e e - e d g e O H o x i d a t i o n a t a r m c h a i r O 2 o x i d a t i o n a t a r m c h a i r
(d) Oxidation processes.
Figure 8: The rates of the processes in the particulate phase.
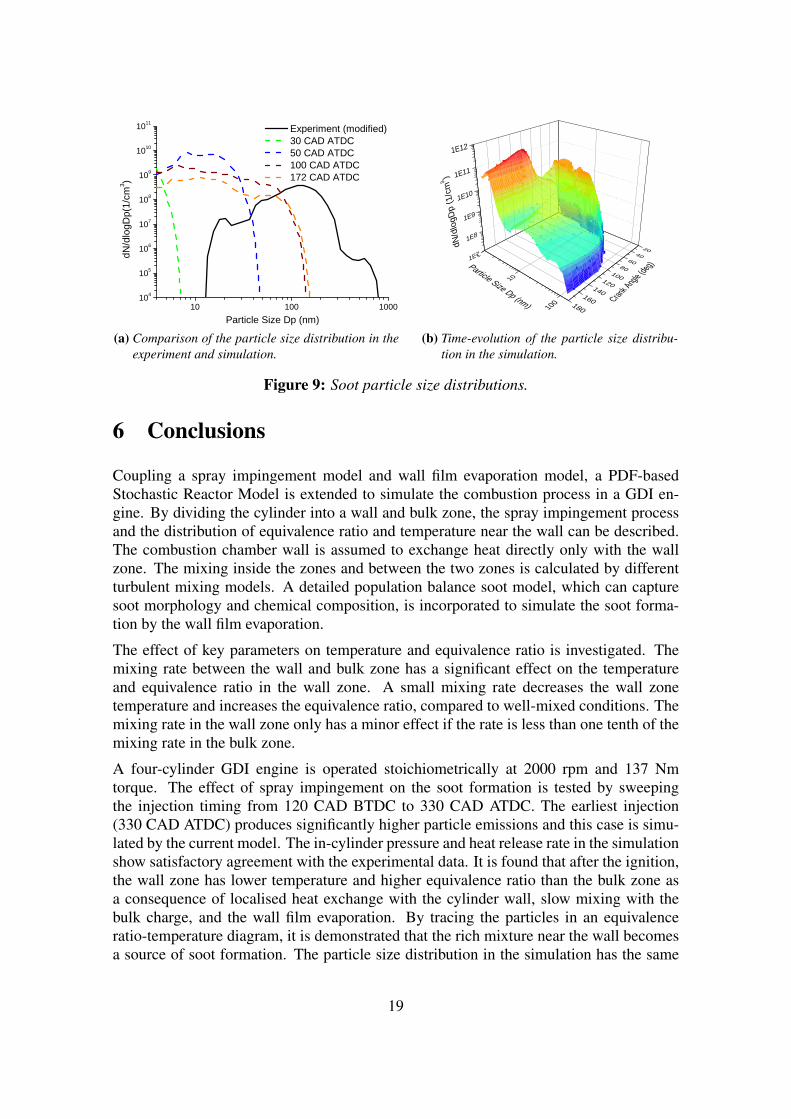
Figure 9a shows the experimental as well as simulated particle size distributions. Thesimulated number densities at exhaust valve open (172 CAD ATDC) are of the sameorder of magnitude as the experimental data. The number of particles with small sizeis over-predicted in the simulation, which may be explained by particle oxidation andcoagulation in the exhaust and sample system in the experiment. The size of the particlesin the main mode of the experimental distribution is under-predicted by about a factorof two. This, however, is sensitive to the detailed equivalence ratio-temperature historyof the fluid parcels in which most of the soot is formed, and to the surface growth andoxidation rate constants in the soot model.
The particle size distribution at different crank angles in the simulation is displayed inFig. 9b. The small particles (< 10 nm) form when the inception rate is high and thenthe number of the large particles (> 100 nm) increases as a consequence of growth andcoagulation. At a later stage of the cycle, a decrease in the particle number is found afterthe main heat release process due to oxidation.
18
1 0 1 0 0 1 0 0 01 0 4
1 0 5
1 0 6
1 0 7
1 0 8
1 0 9
1 0 1 0
1 0 1 1 E x p e r i m e n t ( m o d i f i e d ) 3 0 C A D A T D C 5 0 C A D A T D C 1 0 0 C A D A T D C 1 7 2 C A D A T D C
dN/dl
ogDp
(1/cm
3 )
P a r t i c l e S i z e D p ( n m )(a) Comparison of the particle size distribution in the
experiment and simulation.
1
1 0
1 0 0
1 E 71 E 8
1 E 91 E 1 0
1 E 1 1
1 E 1 2
1 8 01 6 0
1 4 01 2 0
1 0 08 0
6 04 0
2 0dN/dlo
gDp (
1/cm3 )
C r a n k A n g l e
( d e g )P a r t i c l e S i z e D p ( n m )
(b) Time-evolution of the particle size distribu-tion in the simulation.
Figure 9: Soot particle size distributions.
6 Conclusions
Coupling a spray impingement model and wall film evaporation model, a PDF-basedStochastic Reactor Model is extended to simulate the combustion process in a GDI en-gine. By dividing the cylinder into a wall and bulk zone, the spray impingement processand the distribution of equivalence ratio and temperature near the wall can be described.The combustion chamber wall is assumed to exchange heat directly only with the wallzone. The mixing inside the zones and between the two zones is calculated by differentturbulent mixing models. A detailed population balance soot model, which can capturesoot morphology and chemical composition, is incorporated to simulate the soot forma-tion by the wall film evaporation.
The effect of key parameters on temperature and equivalence ratio is investigated. Themixing rate between the wall and bulk zone has a significant effect on the temperatureand equivalence ratio in the wall zone. A small mixing rate decreases the wall zonetemperature and increases the equivalence ratio, compared to well-mixed conditions. Themixing rate in the wall zone only has a minor effect if the rate is less than one tenth of themixing rate in the bulk zone.
A four-cylinder GDI engine is operated stoichiometrically at 2000 rpm and 137 Nmtorque. The effect of spray impingement on the soot formation is tested by sweepingthe injection timing from 120 CAD BTDC to 330 CAD ATDC. The earliest injection(330 CAD ATDC) produces significantly higher particle emissions and this case is simu-lated by the current model. The in-cylinder pressure and heat release rate in the simulationshow satisfactory agreement with the experimental data. It is found that after the ignition,the wall zone has lower temperature and higher equivalence ratio than the bulk zone asa consequence of localised heat exchange with the cylinder wall, slow mixing with thebulk charge, and the wall film evaporation. By tracing the particles in an equivalenceratio-temperature diagram, it is demonstrated that the rich mixture near the wall becomesa source of soot formation. The particle size distribution in the simulation has the same
19

order of magnitude as the experimental one.
Acknowledgements
The authors would like to acknowledge the National Key Basic Research Plan (Chinese”973” Plan) under Grant No. 2013CB228502. This project was partly funded by the Na-tional Research Foundation (NRF), Prime Minister’s Office, Singapore under its Campusfor Research Excellence and Technological Enterprise (CREATE) programme. The au-thors are grateful to CMCL innovations for technical support related to the SRM EngineSuite software through their global academic partnership programme, and to Dr RadomirI. Slavchov for valuable discussions and comments.
20

References
[1] C. Bai and A. Gosman. Development of methodology for spray impingement simu-lation. SAE Technical Paper 950283, 1995. doi:10.4271/950283.
[2] C. Bai and A. Gosman. Mathematical modelling of wall films formed by impingingsprays. SAE Technical Paper 960626, 1996. doi:10.4271/960626.
[3] C. Bai, H. Rusche, and A. Gosman. Modeling of gasoline spray impingement. At-omization and Sprays, 12(1-3):1–27, 2002. doi:10.1615/AtomizSpr.v12.i123.10.
[4] M. Balthasar and M. Kraft. A stochastic approach to calculate the particle sizedistribution function of soot particles in laminar premixed flames. Combustion andFlame, 133(3):289–298, 2003. doi:10.1016/S0010-2180(03)00003-8.
[5] A. Berndorfer, S. Breuer, W. Piock, and P. V. Bacho. Diffusion combustion phenom-ena in GDi engines caused by injection process. SAE Technical Paper 2013-01-0261,2013. doi:10.4271/2013-01-0261.
[6] A. Bhave, M. Kraft, L. Montorsi, and F. Mauss. Sources of CO emissions in anHCCI engine: A numerical analysis. Combustion and Flame, 144(3):634–637, 2006.doi:10.1016/j.combustflame.2005.10.015.
[7] M. Braisher, R. Stone, and P. Price. Particle number emissions from a range ofEuropean vehicles. SAE Technical Paper 2010-01-0786, 2010. doi:10.4271/2010-01-0786.
[8] F. Catapano, S. D. Iorio, M. Lazzaro, P. Sementa, and B. M. Vaglieco. Characteri-zation of ethanol blends combustion processes and soot formation in a GDI opticalengine. SAE Technical Paper 2013-01-1316, 2013. doi:10.4271/2013-01-1316.
[9] M. Celnik, R. Patterson, M. Kraft, and W. Wagner. Coupling a stochastic soot pop-ulation balance to gas-phase chemistry using operator splitting. Combustion andFlame, 148(3):158–176, 2007. doi:10.1016/j.combustflame.2006.10.007.
[10] M. Celnik, A. Raj, R. West, R. Patterson, and M. Kraft. Aromatic site de-scription of soot particles. Combustion and Flame, 155(1-2):161–180, 2008.doi:10.1016/j.combustflame.2008.04.011.
[11] cmcl innovations. srm engine suite, version 8.2, 2015.http://www.cmclinnovations.com/srm-suite/.
[12] R. Curl. Dispersed phase mixing: I. Theory and effects in simple reactors. AIChEJournal, 9(2):175–181, 1963. doi:10.1002/aic.690090207.
[13] J. Etheridge, S. Mosbach, M. Kraft, H. Wu, and N. Collings. Modelling soot forma-tion in a DISI engine. Proceedings of the Combustion Institute, 33(2):3159–3167,2011. doi:10.1016/j.proci.2010.07.039.
21

[14] J. Etheridge, S. Mosbach, M. Kraft, H. Wu, and N. Collings. Modelling cycle tocycle variations in an SI engine with detailed chemical kinetics. Combustion andFlame, 158(1):179–188, 2011. doi:10.1016/j.combustflame.2010.08.006.
[15] C. Farron, N. Matthias, D. Foster, M. Andrie, R. Krieger, P. Najt,K. Narayanaswamy, A. Solomon, and A. Zelenyuk. Particulate characteristics forvarying engine operation in a gasoline spark ignited, direct injection engine. SAETechnical Paper 2011-01-1220, 2011. doi:10.4271/2011-01-1220.
[16] M. Fatouraie, M. Wooldridge, and S. Wooldridge. In-cylinder particulate mat-ter and spray imaging of ethanol/gasoline blends in a direct injection spark igni-tion engine. SAE International Journal of Fuels and Lubricants, 6(1):1–10, 2013.doi:10.4271/2013-01-0259.
[17] W. French, D. Rose, P. Kelly-Zion, and C. Prusell. Analysis of evaporating fuelfilms using shadowgraph and schlieren imaging techniques. SAE Technical Paper2008-01-2443, 2008. doi:10.4271/2008-01-2443.
[18] M. Goodson and M. Kraft. An efficient stochastic algorithm for simulating nano-particle dynamics. Journal of Computational Physics, 183(1):210–232, 2002.doi:10.1006/jcph.2002.7192.
[19] B. Graskow, D. Kittelson, M. Ahmadi, and J. Morris. Exhaust particulate emissionsfrom a direct injection spark ignition engine. SAE Technical Paper 1999-01-1145,1999. doi:10.4271/1999-01-1145.
[20] P. Guthrie. A review of fuel, intake and combustion system deposits issues relevantto 4-stroke gasoline direct fuel injection engines. SAE Technical Paper 2001-01-1202, 2001. doi:10.4271/2001-01-1202.
[21] Z. Han, Z. Xu, and N. Trigui. Spray/wall interaction models for multidimensionalengine simulation. International Journal of Engine Research, 1(1):127–146, 2000.doi:10.1243/1468087001545308.
[22] H. Hiroyasu, T. Kadota, and M. Arai. Development and use of a spray com-bustion modeling to predict diesel engine efficiency and pollutant emissions(part 1 combustion modeling). Bulletin of the JSME, 26(214):569–575, 1983.doi:10.1299/jsme1958.26.569.
[23] Q. Jiao and R. Reitz. Modeling of equivalence ratio effects on particulate formationin a spark-ignition engine under premixed conditions. SAE Technical Paper 2014-01-1607, 2014. doi:10.4271/2014-01-1607.
[24] T. Kamimoto and M. Bae. High combustion temperature for the reduction of partic-ulate in diesel engines. SAE Technical Paper 880423, 1988. doi:10.4271/880423.
[25] M. Kim, H. Cho, Y. Cho, and K. Min. Computational and optical investigation ofliquid fuel film on the cylinder wall of an SI engine. SAE Technical Paper 2003-01-1113, 2003. doi:10.4271/2003-01-1113.
22

[26] D. Kittelson. Engines and nanoparticles: a review. Journal of Aerosol Science, 29(5-6):575–588, 1998. doi:10.1016/S0021-8502(97)10037-4.
[27] M. Kraft, P. Maigaard, F. Mauss, M. Christensen, and B. Johansson. Investigationof combustion emissions in a homogeneous charge compression injection engine:measurements and a new computational model. Proceedings of the CombustionInstitute, 28(1):1195–1201, 2000. doi:10.1016/S0082-0784(00)80330-6.
[28] S. Lee and H. Ryou. Modeling of diesel spray impingement on a flat wall. KSMEInternational Journal, 14(7):796–806, 2000.
[29] S. Lee and H. Ryou. Development of a new spray/wall interaction model. Inter-national Journal of Multiphase Flow, 26(7):1209–1234, 2000. doi:10.1016/S0301-9322(99)00080-4.
[30] R. Lindgren and I. Denbratt. Modelling gasoline spray-wall interaction – a reviewof current models. SAE Technical Paper 2000-01-2808, 2000. doi:10.4271/2000-01-2808.
[31] T. Lucchini, G. D’Errico, A. Onorati, G. Bonandrini, L. Venturoli, and R. D.Gioia. Development of a CFD approach to model fuel-air mixing in gasoline direct-injection engines. SAE Technical Paper 2012-01-0146, 2012. doi:10.4271/2012-01-0146.
[32] E. Magaril and R. Magaril. Motor fuels. KDU, Moscow, 2008.
[33] E. Magaril, R. Magaril, and V. Bamburov. Specific features of combustion ingasoline-driven internal combustion engines. Combustion, Explosion, and ShockWaves, 50(1):75–79, 2014. doi:10.1134/S0010508214010092.
[34] A. Montanaro, S. Malaguti, and S. Alfuso. Wall impingement process of a multi-hole GDI spray: Experimental and numerical investigation. SAE Technical Paper2012-01-1266, 2012. doi:10.4271/2012-01-1266.
[35] S. Mosbach, H. Su, M. Kraft, A. Bhave, F. Mauss, Z. Wang, and J. Wang. Dualinjection HCCI engine simulation using a stochastic reactor model. InternationalJournal of Engine Research, 8(1):41–50, 2007. doi:10.1243/14680874JER01806.
[36] S. Mosbach, A. Aldawood, and M. Kraft. Real-time evaluation of a detailed chem-istry HCCI engine model using a tabulation technique. Combustion Science andTechnology, 180(7):1263–1277, 2008. doi:10.1080/00102200802049414.
[37] S. Mosbach, M. Celnik, A. Raj, M. Kraft, H. Zhang, S. Kubo, and K. Kim. Towardsa detailed soot model for internal combustion engines. Combustion and Flame, 156(6):1156–1165, 2009. doi:10.1016/j.combustflame.2009.01.003.
[38] C. Mundo, M. Sommerfeld, and C. Tropea. Droplet-wall collisions: experimentalstudies of the deformation and breakup process. International Journal of MultiphaseFlow, 21(2):151–173, 1995. doi:10.1016/0301-9322(94)00069-V.
23

[39] C. Mundo, C. Tropea, and M. Sommerfeld. Numerical and experimental investiga-tion of spray characteristics in the vicinity of a rigid wall. Experimental Thermaland Fluid Science, 15(3):228–237, 1997. doi:10.1016/S0894-1777(97)00015-0.
[40] J. Naber and R. Reitz. Modeling engine spray/wall impingement. SAE TechnicalPaper 880107, 1988. doi:10.4271/880107.
[41] M. Nagaoka, H. Kawazoe, and N. Nomura. Modeling fuel spray impinge-ment on a hot wall for gasoline engines. SAE Technical Paper 940525, 1994.doi:10.4271/940525.
[42] C. Naik, L. Liang, K. Puduppakkam, and E. Meeks. Simulation and analysis of in-cylinder soot formation in a gasoline direct-injection engine using a detailed reactionmechanism. SAE Technical Paper 2014-01-1135, 2014. doi:10.4271/2014-01-1135.
[43] L. Ntziachristos, A. Mamakos, Z. Samaras, R. Stradling, U. Mathis, M. Mohr,L. Forti, N. Thompson, and C. de Serves. Overview of the European “Particu-lates” project on the characterization of exhaust particulate emissions from road ve-hicles: Results for light-duty vehicles. SAE Technical Paper 2004-01-1985, 2004.doi:10.4271/2004-01-1985.
[44] P. O’Rourke and A. Amsden. A spray/wall interaction submodel for the KIVA-3 wallfilm model. SAE Technical Paper 2000-01-0271, 2000. doi:10.4271/2000-01-0271.
[45] R. Ortmann, S. Arndt, J. Raimann, R. Grzeszik, and G. Wurfel. Methods and analy-sis of fuel injection, mixture preparation and charge stratification in different directinjected si engines. SAE Technical Paper 2001-01-0970, 2001. doi:10.4271/2001-01-0970.
[46] R. Patterson, J. Singh, M. Balthasar, M. Kraft, and J. Norris. The linear process de-ferment algorithm: a new technique for solving population balance equations. SIAMJournal on Scientific Computing, 28(1):303–320, 2006. doi:10.1137/040618953.
[47] R. Patterson, J. Singh, M. Balthasar, M. Kraft, and W. Wagner. Extending stochasticsoot simulation to higher pressures. Combustion and Flame, 145(3):638–642, 2006.doi:10.1016/j.combustflame.2006.02.005.
[48] P. Penttinen, K. Timonen, P. Tiittanen, A. Mirme, J. Ruuskanen, and J. Pekkanen.Ultrafine particles in urban air and respiratory health among adult asthmatics. Euro-pean Respiratory Journal, 17(3):428–435, 2001.
[49] J. Pinto da Costa, R. Cracknell, N. Seaton, and L. Sarkisov. Towards predictivemolecular simulations of normal and branched alkane adsorption in carbonaceousengine deposits. Carbon, 49(2):445–456, 2011. doi:10.1016/j.carbon.2010.09.041.
[50] W. Piock, G. Hoffmann, A. Berndorfer, P. Salemi, and B. Fusshoeller. Strategiestowards meeting future particulate matter emission requirements in homogeneousgasoline direct injection engines. SAE International Journal of Engines, 4(1):1455–1468, 2011. doi:10.4271/2011-01-1212.
24

[51] S. Pope. PDF methods for turbulent reactive flows. Progress of Energy and Com-bustion Science, 11:119–192, 1985. doi:10.1016/0360-1285(85)90002-4.
[52] A. Raj, M. Celnik, R. Shirley, M. Sander, R. Patterson, R. West, andM. Kraft. A statistical approach to develop a detailed soot growth modelusing PAH characteristics. Combustion and Flame, 156(4):896–913, 2009.doi:10.1016/j.combustflame.2009.01.005.
[53] E. Rivera, N. Mastro, J. Zizelman, J. Kirwan, and R. Ooyama. Development ofinjector for the direct injection homogeneous market using design for six sigma.SAE Technical Paper 2010-01-0594, 2010. doi:10.4271/2010-01-0594.
[54] M. Rossbach, A. Velji, U. Wagner, U. Spicher, R. Suntz, and H. Bockhorn. Investi-gations of the formation and oxidation of soot inside a direct injection spark ignitionengine. The spark ignition engine of the future, Strasbourg INSA, 2009.
[55] C. Schwarz, E. Schunemann, B. Durst, J. Fischer, and A. Witt. Potentials of thespray-guided BMW DI combustion system. SAE Technical Paper 2006-01-1265,2006. doi:10.4271/2006-01-1265.
[56] J. Senda, M. Kobayashi, S. Iwashita, and H. Fujimoto. Modeling of diesel spray im-pingement on a flat wall. SAE Technical Paper 941894, 1994. doi:10.4271/941894.
[57] L. Shih and D. Assanis. Implementation of a fuel spray wall interaction model inKIVA-II. SAE Technical Paper 911787, 1991. doi:10.4271/911787.
[58] Y. Shim, G. Choi, and D. Kim. Numerical and experimental study on effect of wallgeometry on wall impingement process of hollow-cone fuel spray under variousambient conditions. International Journal of Multiphase Flow, 35(10):885–895,2009. doi:10.1016/j.ijmultiphaseflow.2009.06.004.
[59] A. Smallbone, A. Bhave, A. Coble, S. Mosbach, M. Kraft, and R. McDavid. Iden-tifying optimal operating points in terms of engineering constraints and regulatedemissions in modern diesel engines. SAE Technical Paper 2011-01-1388, 2011.doi:10.4271/2011-01-1388.
[60] A. Smallbone, A. Coble, A. Bhave, S. Mosbach, M. Kraft, N. Morgan, andG. Kalghatgi. Simulating PM emissions and combustion stability in gasoline/dieselfuelled engines. SAE Technical Paper 2011-01-1184, 2011. doi:10.4271/2011-01-1184.
[61] Y. Sogawa, H. Hattori, T. Yamashita, N. Yanagisawa, T. Ikeda, S. Tanaka,M. Hosoya, K. Takahashi, T. Shoji, T. Suzuki, Y. Iwakiri, T. Nakajima, andY. Tonegawa. Nano particle emission evaluation of state of the art diesel af-tertreatment technologies (DPF, urea-SCR and DOC), gasoline combustion systems(lean burn/stoichiometric DISI and MPI) and fuel qualities effects (EtOH, ETBE,FAME, aromatics and distillation). SAE Technical Paper 2007-01-4083, 2007.doi:10.4271/2007-01-4083.
25

[62] D. Stanton and C. Rutland. Modeling fuel film formation and wall interaction indiesel engines. SAE Technical Paper 960628, 1996. doi:10.4271/960628.
[63] E. Stevens and R. Steeper. Piston wetting in an optical DISI engine: Fuelfilms, pool fires, and soot generation. SAE Technical Paper 2001-01-1203, 2001.doi:10.4271/2001-01-1203.
[64] B. Stojkovic, T. Fansler, M. Drake, and V. Sick. High-speed imaging of OH*and soot temperature and concentration in a stratified-charge direct-injection gaso-line engine. Proceedings of the Combustion Institute, 30(2):2657–2665, 2005.doi:10.1016/j.proci.2004.08.021.
[65] H. Su, A. Vikhansky, S. Mosbach, M. Kraft, A. Bhave, K. Kim, T. Kobayashi,and F. Mauss. A computational study of an HCCI engine with direct injec-tion during gas exchange. Combustion and Flame, 147(1-2):118–132, 2006.doi:10.1016/j.combustflame.2006.07.005.
[66] H. Su, S. Mosbach, M. Kraft, A. Bhave, S. Kook, and C. Bae. Two-stage fuel directinjection in a diesel fuelled HCCI engine. SAE Technical Paper 2007-01-1880, 2007.doi:10.4271/2007-01-1880.
[67] S. Subramaniam and S. Pope. A mixing model for turbulent reactive flows basedon Euclidean minimum spanning trees. Combustion and Flame, 115(4):487–514,1998. doi:10.1016/S0010-2180(98)00023-6.
[68] Y. Sukegawa, K. Kumano, and K. Ogata. Estimation of particulate matter in directinjection gasoline engines by non-combustion CFD. SAE Technical Paper 2014-01-1142, 2014. doi:10.4271/2014-01-1142.
[69] M. Trujillo, W. Mathews, C. Lee, and J. Peters. Modelling and experiment of im-pingement and atomization of a liquid spray on a wall. International Journal ofEngine Research, 1(1):87–105, 2000. doi:10.1243/1468087001545281.
[70] A. Velji, K. Yeom, U. Wagner, U. Spicher, M. Rosbach, R. Suntz, and H. Bockhorn.Investigations of the formation and oxidation of soot inside a direct injection sparkignition engine using advanced laser-techniques. SAE Technical Paper 2010-01-0352, 2010. doi:10.4271/2010-01-0352.
[71] D. Wang and A. Watkins. Numerical modeling of diesel spray wall impactionphenomena. International Journal of Heat and Fluid Flow, 14(3):301–312, 1993.doi:10.1016/0142-727X(93)90062-R.
[72] A. Watkins and D. Wang. A new model for diesel spray impaction on walls andcomparison with experiment. International Symposium COMODIA, 90:243–248,1990.
[73] J. Welty, C. Wicks, R. Wilson, and G. L. Rorrer. Fundamentals of Momentum, Heat,and Mass Transfer. Wiley, New Jersey, 5th edition, 2008.
[74] Ł. Wyszynski, R. Aboagye, R. Stone, and G. Kalghatgi. Combustion imaging andanalysis in a gasoline direct injection engine. SAE Technical Paper 2004-01-0045,2004. doi:10.4271/2004-01-0045.
26