modelling the linkages between dividend policy and … the linkages between dividend policy and...
TRANSCRIPT
Modelling the Linkages between Dividend Policy and Future Earnings
S. Abidin a, N. Wellalage a and I. Chowdhury a
a Department of Finance, Waikato Management School, University of Waikato, Private Bag 3105, Hamilton 3240, New Zealand
Email: [email protected]
Abstract: The motivation of this study is to investigate whether the strength of payout ratios able to explain expected earnings. More definitely, do higher dividend payout ratios direct to higher return? The hypothesis is that higher dividend payout is a signal of optimism that leads to higher likelihood of subsiding agency cost and thus resulting to higher growth in expected earnings. In other words lower payout ratio leads to inefficient empire building or even funding in less than ideal projects whereas higher payout ratio leads to more carefully chosen projects leading to higher subsequent growth in earnings. This study aims to explore the relation of dividend policies with expected earnings in 5 major Asian countries - Australia, Singapore, China, Japan and South Korea. The motivation is the inevitably dissimilar environmental characteristic of these Asian countries. Other than that, most of the empirical studies on this subject are conducted in either developed US or EU capital markets. The 5 countries are different in their legal setup, taxation policies and financial structures. All these factors have visible impact on their payout policies. The fixed effect model of regression on 10 year data from 2003 through 2012 reveals some mixed results. We found that the common law followers (Australia and Singapore) have higher mean values for payout ratios whereas the civil law followers (China, South Korea, and Japan) have lower mean value for payout ratios. For all the countries, we found that the large firms tend to have lower future earnings growth. More importantly, we found significant positive relation between dividend payout ratios and future earnings growth in Australia, Singapore, Japan and South Korea. The pervasive positive relationship means that high dividend payout ratios lead to strong growth in subsequent earnings. We found strong positive evidence in favor of free cash flow theory to explain this relationship in Japan. However, China’s findings as a negative relationship of dividend payout with future earnings growth is opposing to the inclusive inference.
Keywords: Dividend, earnings, mean reversion, free cash flow, fixed effect
21st International Congress on Modelling and Simulation, Gold Coast, Australia, 29 Nov to 4 Dec 2015 www.mssanz.org.au/modsim2015
1105

S. Abidin et al., Modelling the Linkages between Dividend Policy and Future Earnings
1. INTRODUCTION
Several important economic features make dividend an interesting subject to examine. In fact researchers established the notion that comparative higher tax on dividend over capital gain makes it informative about future prospects. De Angelo et al. (2000) showed that dividend has information content about earnings. Today the market is expected to react to dividend announcements. Consistent with signalling hypothesis, Al-Yahyae & Pham (2010) found that there are other factors beyond taxation differentials that make dividends informative. They explore firms announcing increase in dividend experience a significant positive price reaction whereas firms announcing decrease experience a significant decline in stock price. Moreover, firms that have no change in dividend report insignificant negative average abnormal returns. The other side of dividend policies is the linkages with expected earnings. In recent decade, it has been the subject of extensive corporate finance research, but it has been neglected in the prediction literatures (Ap Gwilym et al., 2006). In effect the market fascination with investment strategies in relation to dividend and earnings is rather motivating. Arnott & Asness (2003) found quite surprising research findings that at market level higher dividend payout ratios in the United States are associated with higher future earnings growth. This insight supports theories of dividend as a signal for expected earnings. Then again Zhou & Ruland (2006) tested the dividend earnings relationship at the firm level. Their results are aligned with Arnott & Asness under numerous sensitivity tests. We know a firm is to maintain an accurate cash balances to cope with operational and investment obligations. Then again, according to the dividend information contents hypothesis, it will also try to convey optimistic prospects for future earnings in paying higher cash dividend. But as an ongoing organization, if it allocates too much cash dividend, this will certainly lead to shortage of funds. Alternatively, if it allocates too much stock dividend, several scholars believe this will certainly aggravate agency problems otherwise create strong motivation in the places of mergers or acquisitions. Often the allocation of high stock dividend in such a firm with slower earnings growth will surely be unable to meet the need of investors in particular who specifically request cash dividend (Baker & Wurgler, 2004; Kumar & Graham, 2006). The core motivation of the hypothesis is that higher the dividend payout as a signal of optimism higher the likelihood of subsiding agency cost resulting higher growth in expected earnings. In other words (Arnott & Asness, 2003), lower payout ratio leads to inefficient empire building or even funding in less than ideal projects whereas higher payout ratio leads to more carefully chosen projects leading to higher subsequent growth in earnings. This study aims to explore the relation of dividend policies with expected earnings in 5 major Asian countries - Australia, Singapore, China, Japan and South Korea. The motivation is the inevitably dissimilar environmental characteristic of these Asian countries. Other than that, most of the empirical studies on this subject are conducted in either developed US or EU capital markets. The rest of the papers continue as follows. Section 2 is pertinent literature review. After that, there is a description of data, sample, method as well as estimation procedure i.e. depiction of selected variables with hypotheses. Then there is description statistics exhibits all the variables for all the countries. After that it is the result of the univariate analyses and then there is sensitivity analyses in terms of alternative measures of earnings, dividend, and other prospective phenomena along with the potential explanation of free cash flow theory. Finally conclusion is in Section 6.
2. LITERATURE REVIEW
The intertemporal augmentation of the MM dividend irrelevance theorem predicts that in a set up like unchanged investment also constant expected return, higher dividend payout ratios in fact expected to be linked with lower future growth (Ibbotson & Chen, 2003). This in point of fact indicate lower future equity returns. This is probably as the firm issues a higher amount of retained earnings as dividend it is left with lower fund in hand to associate with cost-effective i.e. profitable investment opportunity. Overall this passes lower growth in expected earnings. Over time, the belief in higher dividend payout ratios as negative to future earnings growth is accepted equally in academic literature and shared wisdom. Like a surprise, recently the whole concept is twisted out. In fact recent studies note that dividend payout ratios have a positive association with future earnings growth (Arnott & Asness, 2003; Zhou & Ruland, 2006; Vivian, 2006; Huang & You, 2008; Tan & Flint, 2010). The role of the payout ratios in asset pricing has been given increased attention in numerous researches after Arnott & Asness (2003) explored the surprising result while observing more than a century with various robustness checks that higher dividend payout ratios at the market level correspond to higher expected
1106
S. Abidin et al., Modelling the Linkages between Dividend Policy and Future Earnings
earnings growth in the United States. However, it is to mention that empirical enquiries on the decisive factor of dividend payout ratios in general support the idea that payout ratios are inversely correlated with investment prospect (Fama & French, 2002). This study aims to explore the relation of dividend policies with expected earnings in Australia, Singapore, China, Japan and South Korea. These countries differentiate in their diverse legal, taxation in addition financial structure. All these have impact on their dividend payout policies. Time effects show that on average dividend payout for Australian companies decreased over time (Akhtar, 2008). Then again according to Basse (2009), inflation is causative to dividend growth in Australia. It is also reported that higher inflation is a major driver of dividend increase. However, the country follows judgmental in addition to professional approach in particular standard common law. It operates under the imputation tax system avoiding double taxation on dividend income. Evidences in this regard show Australia has a significantly higher dividend payout ratio than Japan (Ho, 2003). Ho (2003) also states that in Australia, dividend policies are affected clearly by firm size. Singapore companies have the highest dividend yields in Asia (Howie, 2013). The legal system of the country is established on the English Common Law like Australia. It also follows a single-tier corporate tax system where firms themselves pay the tax on income. Like Australia, tax is not imputed to the shareholders i.e. dividend is tax free in Singapore. According to La Porta et al. (2000), China is a civil law country. It has weak legal protection for the minority shareholders (Wei et al. (2005). The ownership structures of listed companies is highly concentrated (Chen et al., 2009; Wang et al., 2011; and Bai et al., 2013). All these characteristics provide opportunities for large shareholders to expropriate minority shareholders i.e. not paying expected dividend (Claessens et al., 2000). Japan has a civil law system providing weaker protection to the minority shareholders. Therefore it is associated with the low dividend payments (La Porta et al., 2000). The classical tax system also supports this phenomena. It is to note that tax considerations can ruin the use of dividend policies for resolving management-shareholders conflicts when the tax on dividend is higher than tax on capital income (Harada & Nguyen, 2011). Faccio et al. (2001) state that in Japan, the principal form of ownership control is family focused. As a result often the family itself supplies the top managers. Thus managers are more likely to represent the interests of controlling shareholder. The legal system of South Korea is based on the civil law. However, the country is encouraging all the listed companies to pay higher dividend. It could in fact provide a stimulus to their underperforming stock market (Yoon, 2014). Recently a new tax order is imposed to change the tendencies of the companies to distribute extremely low dividend. According to Thomson Reuters (2012), the average dividend yield in South Korea is quite low compared with some comparable developed economies. It was even lower than that in Japan. Like Japan, it is also trying to increase the dividend through the creation of a return focused stock index.
3. DATA
This article investigate the association of dividend policies with the movement in expected earnings in 5 different major Asian countries - Australia, Singapore, China, Japan and South Korea. The data is obtained from Thomson Financial and Worldscope Databases. The data set includes earnings per share, cash dividend on common stock, market value of equity, return on assets, earnings yield, leverage, total assets, net income and total debts. The sample includes all companies i.e. both active and inactive on the Australian Securities Exchange (ASX), Singapore Exchange (SGX), Shanghai Stock Exchange (SSE), Tokyo Stock Exchange (TSE) and Korea Exchange (KRX). The sample period is 10 years i.e. from 2003 through 2012. As the studies require data for past and future earnings growth, to calculate such data was also undertaken on the years preceding and following the sample period (2002 - 2013). The final sample consists 572 observations for Australia, 375 observations for Singapore, 422 observations for China, 4985 observations for Japan and 1337 observations for South Korea. Compared to the recent related empirical studies, the sample size have the abilities to entirely address the research question. Following Zhou & Ruland (2006), the main regression equation is FEGt+1 = α0 + β1Payoutt + β2Sizet + β3ROAt + β4ErnYldt + β5Leveraget + β6PEGt-1 + β7FAGt+1 + Ɛt where FEG is future earnings growth as dependent variable with the main independent variable dividend payout, firm size, return on assets as ROA, earnings yield as ErnYld, leverage, past i.e. lagged earnings growth as PEG and future assets growth as FAG.
1107
S. Abidin et al., Modelling the Linkages between Dividend Policy and Future Earnings
4. EMPIRICAL RESULTS & DISCUSSIONS
The result of empirical enquiries are presented in the univariate analyses followed by the multivariare analyses.
4.1 Univariate Analyses
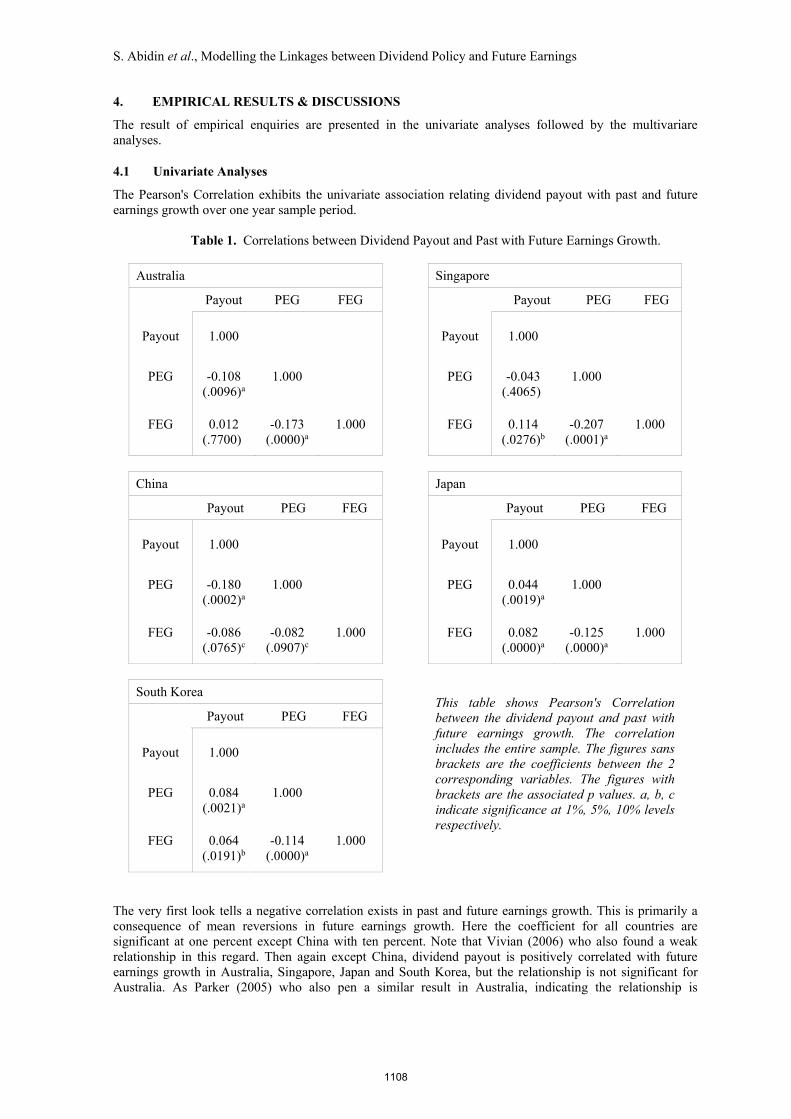
The Pearson's Correlation exhibits the univariate association relating dividend payout with past and future earnings growth over one year sample period.
Table 1. Correlations between Dividend Payout and Past with Future Earnings Growth.
Australia
Payout PEG FEG
Payout 1.000
PEG
-0.108 (.0096)a
1.000
FEG
0.012 (.7700)?
-0.173 (.0000)a
1.000
Singapore
Payout PEG FEG
Payout 1.000
PEG
-0.043 (.4065)?
1.000
FEG
0.114 (.0276)b
-0.207 (.0001)a
1.000
China
Payout PEG FEG
Payout 1.000
PEG
-0.180 (.0002)a
1.000
FEG
-0.086 (.0765)c
-0.082 (.0907)c
1.000
Japan
Payout PEG FEG
Payout 1.000
PEG
0.044 (.0019)a
1.000
FEG
0.082 (.0000)a
-0.125 (.0000)a
1.000
South Korea
Payout PEG FEG
Payout 1.000
PEG
0.084 (.0021)a
1.000
FEG
0.064 (.0191)b
-0.114 (.0000)a
1.000
This table shows Pearson's Correlation between the dividend payout and past with future earnings growth. The correlation includes the entire sample. The figures sans brackets are the coefficients between the 2 corresponding variables. The figures with brackets are the associated p values. a, b, c indicate significance at 1%, 5%, 10% levels respectively.
The very first look tells a negative correlation exists in past and future earnings growth. This is primarily a consequence of mean reversions in future earnings growth. Here the coefficient for all countries are significant at one percent except China with ten percent. Note that Vivian (2006) who also found a weak relationship in this regard. Then again except China, dividend payout is positively correlated with future earnings growth in Australia, Singapore, Japan and South Korea, but the relationship is not significant for Australia. As Parker (2005) who also pen a similar result in Australia, indicating the relationship is
1108

S. Abidin et al., Modelling the Linkages between Dividend Policy and Future Earnings
weakening over time. Surprisingly the strong negative relation of dividend payout and future earnings growth in China creates provisions for conventional phenomena on dividend policies. Or given the sample includes a large number of firms with missing dividend payout in particular from 2005 to 2011, the likely survivor bias cannot be overlooked completely.
4.2 Multivariate Analyses
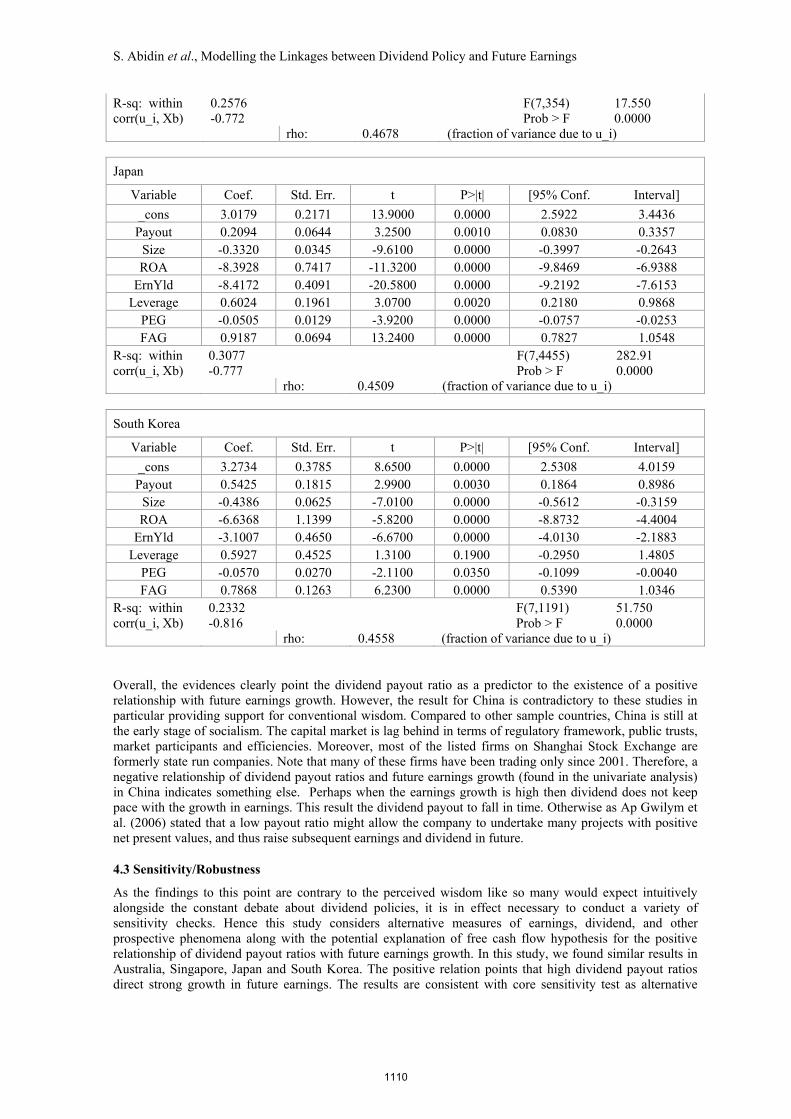
In the multivariate analysis, the regression models employed here followed Zhou & Ruland (2006). Regression outcomes for each of the 5 countries are reported in Table 2. The table shows that the explanatory variables in all countries except for China in common have the expected i.e. hypothesized sign while the majority of the variables are highly significant and consistent with the related empirical studies.
Table 2. Future Earnings Growth Over One Year as a Function of the Dividend Payout.
Australia
Variable Coef. Std. Err. T P>|t| [95% Conf. Interval]
_cons 2.4532 0.2825 8.6800 0.0000 1.8982 3.0081 Payout 0.2039 0.1025 1.9900 0.0470 0.0025 0.4054
Size -0.2265 0.0403 -5.6300 0.0000 -0.3056 -0.1474 ROA -2.8623 0.6555 -4.3700 0.0000 -4.1501 -1.5744
ErnYld -5.8292 0.8557 -6.8100 0.0000 -7.5103 -4.1481 Leverage -0.5502 0.3277 -1.6800 0.0940 -1.1940 0.0937
PEG -0.0975 0.0433 -2.2500 0.0250 -0.1826 -0.0124 FAG 0.2120 0.0774 2.7400 0.0060 0.0600 0.3641
R-sq: within 0.2552 F(7,504) 24.670 corr(u_i, Xb) -0.779 Prob > F 0.0000 rho: 0.4499 (fraction of variance due to u_i)
Singapore
Variable Coef. Std. Err. t P>|t| [95% Conf. Interval]
_cons 2.8833 0.4850 5.9500 0.0000 1.9292 3.8374 Payout 0.4221 0.1340 3.1500 0.0020 0.1585 0.6857
Size -0.3126 0.0723 -4.3200 0.0000 -0.4549 -0.1703 ROA -4.3508 1.2790 -3.4000 0.0010 -6.8670 -1.8347
ErnYld -3.9065 0.8061 -4.8500 0.0000 -5.4924 -2.3206 Leverage -0.5390 0.5252 -1.0300 0.3050 -1.5722 0.4941
PEG -0.1134 0.0489 -2.3200 0.0210 -0.2097 -0.0171 FAG 0.2258 0.1046 2.1600 0.0320 0.0200 0.4315
R-sq: within 0.3095 F(7,324) 20.740 corr(u_i, Xb) -0.762 Prob > F 0.0000 rho: 0.4412 (fraction of variance due to u_i)
China
Variable Coef. Std. Err. t P>|t| [95% Conf. Interval]
_cons 1.9433 0.3572 5.4400 0.0000 1.2408 2.6458 Payout -0.4662 0.1391 -3.3500 0.0010 -0.7398 -0.1926
Size -0.1547 0.0478 -3.2400 0.0010 -0.2486 -0.0607 ROA -3.6560 1.1653 -3.1400 0.0020 -5.9478 -1.3642
ErnYld -5.6225 1.2896 -4.3600 0.0000 -8.1587 -3.0864 Leverage -0.3395 0.2878 -1.1800 0.2390 -0.9056 0.2266
PEG -0.0871 0.0464 -1.8800 0.0610 -0.1784 0.0042 FAG 0.5056 0.0816 6.2000 0.0000 0.3452 0.6660
1109
S. Abidin et al., Modelling the Linkages between Dividend Policy and Future Earnings
R-sq: within 0.2576 F(7,354) 17.550 corr(u_i, Xb) -0.772 Prob > F 0.0000 rho: 0.4678 (fraction of variance due to u_i)
Japan
Variable Coef. Std. Err. t P>|t| [95% Conf. Interval]
_cons 3.0179 0.2171 13.9000 0.0000 2.5922 3.4436 Payout 0.2094 0.0644 3.2500 0.0010 0.0830 0.3357
Size -0.3320 0.0345 -9.6100 0.0000 -0.3997 -0.2643 ROA -8.3928 0.7417 -11.3200 0.0000 -9.8469 -6.9388
ErnYld -8.4172 0.4091 -20.5800 0.0000 -9.2192 -7.6153 Leverage 0.6024 0.1961 3.0700 0.0020 0.2180 0.9868
PEG -0.0505 0.0129 -3.9200 0.0000 -0.0757 -0.0253 FAG 0.9187 0.0694 13.2400 0.0000 0.7827 1.0548
R-sq: within 0.3077 F(7,4455) 282.91 corr(u_i, Xb) -0.777 Prob > F 0.0000 rho: 0.4509 (fraction of variance due to u_i)
South Korea
Variable Coef. Std. Err. t P>|t| [95% Conf. Interval]
_cons 3.2734 0.3785 8.6500 0.0000 2.5308 4.0159 Payout 0.5425 0.1815 2.9900 0.0030 0.1864 0.8986
Size -0.4386 0.0625 -7.0100 0.0000 -0.5612 -0.3159 ROA -6.6368 1.1399 -5.8200 0.0000 -8.8732 -4.4004
ErnYld -3.1007 0.4650 -6.6700 0.0000 -4.0130 -2.1883 Leverage 0.5927 0.4525 1.3100 0.1900 -0.2950 1.4805
PEG -0.0570 0.0270 -2.1100 0.0350 -0.1099 -0.0040 FAG 0.7868 0.1263 6.2300 0.0000 0.5390 1.0346
R-sq: within 0.2332 F(7,1191) 51.750 corr(u_i, Xb) -0.816 Prob > F 0.0000 rho: 0.4558 (fraction of variance due to u_i) Overall, the evidences clearly point the dividend payout ratio as a predictor to the existence of a positive relationship with future earnings growth. However, the result for China is contradictory to these studies in particular providing support for conventional wisdom. Compared to other sample countries, China is still at the early stage of socialism. The capital market is lag behind in terms of regulatory framework, public trusts, market participants and efficiencies. Moreover, most of the listed firms on Shanghai Stock Exchange are formerly state run companies. Note that many of these firms have been trading only since 2001. Therefore, a negative relationship of dividend payout ratios and future earnings growth (found in the univariate analysis) in China indicates something else. Perhaps when the earnings growth is high then dividend does not keep pace with the growth in earnings. This result the dividend payout to fall in time. Otherwise as Ap Gwilym et al. (2006) stated that a low payout ratio might allow the company to undertake many projects with positive net present values, and thus raise subsequent earnings and dividend in future.
4.3 Sensitivity/Robustness
As the findings to this point are contrary to the perceived wisdom like so many would expect intuitively alongside the constant debate about dividend policies, it is in effect necessary to conduct a variety of sensitivity checks. Hence this study considers alternative measures of earnings, dividend, and other prospective phenomena along with the potential explanation of free cash flow hypothesis for the positive relationship of dividend payout ratios with future earnings growth. In this study, we found similar results in Australia, Singapore, Japan and South Korea. The positive relation points that high dividend payout ratios direct strong growth in future earnings. The results are consistent with core sensitivity test as alternative
1110

S. Abidin et al., Modelling the Linkages between Dividend Policy and Future Earnings
measures of earnings with free cash flow hypothesis. The analysis also proves that possible mean reversions in earnings do not subsume the total power of payout ratios i.e. mean reversions is not the reason for positive relation of payout ratios with future earnings growth. However, China’s findings as a negative relationship of dividend and earnings is opposing to the inclusive inference here.
6. CONCLUSIONS
We found dividend is not simply made from the residual earnings after the optimal investment policy as this study shows substantial investment of retained earnings does not always lead to strong growth in future earnings. It also found that the common law follower Australia and Singapore have higher mean values for payout ratios whereas the civil law follower China, South Korea, and Japan have lower mean value for payout ratios. This finding provides support for the extant literature. Moreover, the large firms, firms with higher ROA and E/P tend to have lower future earnings growth. More importantly, we found significant positive relationship of dividend payout ratios with future earnings growth in Australia, Singapore, Japan and South Korea, and a significant negative relation in China. If the payout ratio is 10% above the mean, then future earnings growth is expected to rise in Australia, Singapore, Japan and South Korea to 2.0, 4.2, 2.0 and 5.4% respectively whereas in China, future earnings growth are expected to fall 4.6% over the next one year period. These results are statistically significant where more or less 25% of the variations in earnings growth can be captured by the payout ratios. The pervasive positive relationship means that high dividend payout leads to strong growth in subsequent earnings. The result is consistent with core sensitivity checks.
REFERENCES
Akhtar, S. (2008). Dividend Payout Determinants for Australian Multinational and Domestic Corporations. Working Paper, Australian National University.
Al-Yahyae, K. H., & Pham, T. M. (2010). The information content of cash dividend announcements in a unique environment. Journal of Banking & Finance, 35(3), 606-612.
Ap Gwilym, O., Seaton, J., Suddason, K., & Thomas, S. (2006). International evidence on the payout ratio, earnings, dividends, and returns. Financial Analysts Journal, 62(1), 36-53.
Arnott, R. D., & Asness, C. S. (2003). Surprise! higher dividends = higher earnings growth. Financial Analysts Journal, 59(1), 70-87. doi:10.2469/faj.v59.n1.2504.
Basse, T. (2009). Dividend policy and inflation in Australia: Results from cointegration tests. International Journal of Business and Management, 4(6) doi:10.5539/ijbm.v4n6p13.
DeAngelo, G., DeAngelo, L., Skinner, D. J. (2004). Are dividends disappearing? Dividend concentration and the consolidation of earnings. Journal of Financial Economics 72, 426-456.
Fama, E. F., & French, K. R. (2002). Testing trade‐off and pecking order predictions about dividends and debt. Review of financial studies, 15(1), 1-33.
Farsio, F., Geary, A., & Moser, J. (2004). The relationship between dividends and earnings. Journal for Economic Educators, 4(4), 1 – 5.
Ho, H. (2003). Dividend policies in Australia and Japan. International Advances in Economic Research, 9(2), 91-100. doi:10.1007/BF02295710.
Howie, G. (2013). Asia's highest dividend yields in Singapore. Shares Investment - Facts & Figures, Singapore Exchange (SGX). Singapore. Retrieved from - www.sgx.com/mygateway
Huang, C., & You, C. (2008). Cash dividends, stock dividends and subsequent earnings growth. Pacific-Basin Finance Journal, 17(5), 594-610. doi:10.1016/j.pacfin.2009.03.002.
Parker, K. C., (2005), Do higher dividends lead to higher earnings growth? Working Paper, Simon Fraser University.
Tan, A., & Flint, A. (2010). Predicting future earnings growth: A test of the dividend payout ratio in the Australian market. The International Journal of Business and Finance Research, 4(2), 43-58.
Vivian, A. (2006). The Payout Ratio, Earnings Growth Returns: UK Industry Evidence. Working Paper, School of Economics, Finance and Business, of University Durham.
Zhou, P., & Ruland, W. (2006). Dividend payout and future earnings growth. Financial Analysts Journal, 62(3), 58-69. doi:10.2469/faj.v62.n3.4157.
1111