modelling the production of solid and liquid products from
TRANSCRIPT

HAL Id: hal-03041927https://hal.univ-lorraine.fr/hal-03041927
Submitted on 5 Dec 2020
HAL is a multi-disciplinary open accessarchive for the deposit and dissemination of sci-entific research documents, whether they are pub-lished or not. The documents may come fromteaching and research institutions in France orabroad, or from public or private research centers.
L’archive ouverte pluridisciplinaire HAL, estdestinée au dépôt et à la diffusion de documentsscientifiques de niveau recherche, publiés ou non,émanant des établissements d’enseignement et derecherche français ou étrangers, des laboratoirespublics ou privés.
Distributed under a Creative Commons Attribution - NonCommercial - NoDerivatives| 4.0International License
Modelling the production of solid and liquid productsfrom the hydrothermal carbonisation of two biomasses
A.M. Borrero-López, Éric Masson, Alain Celzard, Vanessa Fierro
To cite this version:A.M. Borrero-López, Éric Masson, Alain Celzard, Vanessa Fierro. Modelling the production of solidand liquid products from the hydrothermal carbonisation of two biomasses. Industrial Crops andProducts, Elsevier, 2020, 151, pp.112452. �10.1016/j.indcrop.2020.112452�. �hal-03041927�

1
1
Modelling the production of solid and liquid 2
products from the hydrothermal 3
carbonisation of two biomasses 4
5
6
A.M. Borrero-López1, E. Masson
2, A. Celzard
1, V. Fierro
1* 7
8
9
1 Université de Lorraine, CNRS, IJL, F-88000 Épinal, France 10
2 Critt bois, 27 rue Philippe Seguin, BP 91067, 88051 Épinal Cedex 9, France 11
12
13
14
* Corresponding author. Tel: + 33 372 74 96 77. Fax: + 33 372 74 96 38. E-mail
address : [email protected] (V. Fierro)

2
Abstract 15
This work focuses on the hydrothermal carbonisation (HTC) of two bioresources, 16
olive stones (OS) and beechwood (BW), within the ranges of temperature and time of 17
160-240ºC and 1-24 hours, respectively. The final pH of the liquid phase, the yields of 18
solid and liquid, and the nature and amounts of a broad range of molecules (two furanic 19
and nine phenolic compounds) were produced and studied. The experimental results 20
obtained were discussed in relation to predictive equations developed in a previous 21
study (Borrero-López et al., 2018) regarding the cellulose, hemicellulose and lignin 22
contents of the two bioresources. Adequate fits were obtained for the pH of the liquid 23
phase (9-11% overestimation for OS and BW, respectively), the yields of solid (7-8% 24
error for OS and BW, respectively) and liquid (6-16% error for OS and BW, 25
respectively) and the production of 5-hydroxymethylfurfural and several phenolic 26
compounds, while some discrepancies for the production of furfural and a few phenolic 27
compounds were observed but were properly analysed and discussed. 28
29
30
31
32
33
34
Keywords: olive stones; beechwood; modelling; hydrothermal carbonization; furfural, 35
phenolics. 36
37

3
1. Introduction 38
Hydrothermal carbonisation (HTC) is attracting increasing interest because of the 39
mild pressure and temperature conditions involved in this process (Liu et al., 2012), the 40
production of valuable products in the aqueous phase (Guardia et al., 2019), and the 41
possibility of using the hydrochars obtained as precursors of new carbonaceous (Yahia 42
et al., 2019) or oxide materials (Kavil et al., 2019). Hydrothermal carbonisation of 43
biomass is indeed a simple process in which bioresources are treated in hot pressurised 44
water in an autoclave at moderate temperatures, within the typical range of 140-240ºC. 45
Then, hydrothermal reactions occur at the medium pressures generated by water 46
evaporation in the hermetically sealed autoclave (Borrero-López et al., 2018). The 47
hydrochars produced when biomass was subjected to HTC have been used for soil 48
conditioning (Bento et al., 2019), development of lubricants (Huang et al., 2019), 49
stabilisation of Pickering emulsions (Xie et al., 2018), conversion to solid fuels (Lucian 50
et al., 2018; Ma et al., 2018; Zhao et al., 2018), adsorbents (Lei et al., 2018), and metal 51
detection (Liu et al., 2012). 52
In addition to hydrochar, the release of many valuable products from the main 53
components of biomass, i.e., from hemicellulose, cellulose and lignin, is achieved 54
through bond cleavage and self-catalysed reactions due to the presence of water 55
(Borrero-López et al., 2017). Materials scientists often neglect the liquid phase although 56
various phenolic compounds (Borrero-López et al., 2018), as well as furfural (FU) and 57
5-hydroxymethyl furfural (5-HMF) (Grote et al., 2018; Wataniyakul et al., 2018), can 58
be obtained, making this phase a high-added value, cheap and safe source of chemicals 59
(Borrero-López et al., 2018; Nakason et al., 2018; Zhao et al., 2018). However, products 60
separation is still difficult and therefore, restricting production to a limited number of 61
product by catalysis (Sun et al., 2018) seems a very interesting strategy. Moreover, the 62

4
importance and applications of FU and 5-HMF have been ubiquitously highlighted 63
(Borrero-López et al., 2017). Among the phenolic compounds, some interesting 64
chemicals such as vanillin and syringaldehyde have also been found (Rodrigues Pinto et 65
al., 2012, Borrero-López et al., 2017). Others, such as acetosyringone, guaiacylacetone, 66
guaiacol or syringol, have also been produced, all of them having noteworthy 67
antioxidant and antimicrobial activity (Conde et al., 2011; Gullón et al., 2017). Finally, 68
the production of gases at higher temperatures, usually catalysed by acids and/or metal, 69
has also been extensively studied (Salimi et al., 2018). In conclusion, HTC undoubtedly 70
is an outstanding biorefinery tool for converting lignocellulosic resources into valuable, 71
useful solid, liquid and gaseous products. 72
On the other hand, efforts have focused on understanding the kinetics of the involved 73
transformation mechanisms. Thus, Keiller et al. (2019) stated that hydrothermal 74
carbonisation may occur through direct reactions, often of first order, whereas others 75
have discussed the possibility of intermediates and side products (Borrero-López et al., 76
2017; Gallifuoco et al., 2018; Gallifuoco and Di Giacomo, 2018; Zhao et al., 2018). The 77
modelling of HTC products was carried out by applied statistical methods (Gallifuoco 78
and Di Giacomo, 2018), response surface methodology (Heidari et al. (2019) and Zhao 79
et al., 2018) and process simulators (Gómez et al. (2019)). Overall, these studies require 80
powerful calculation tools in addition to the development of sophisticated models, due 81
to the complexity of kinetics (Marcotullio, 2011), as well as accurate experimental and 82
analytical studies. In a former work, the solid and liquid products obtained when 83
cellulose, hemicellulose and lignin were subjected to HTC have been meticulously 84
studied. Various models were presented that were able to predict solid and liquid yields, 85
the final pH of the liquid phase and the concentrations of FU, 5-HMF and several 86
phenolic products (Borrero-López et al., 2018). 87

5
The objective of the present study is to test the validity of these models when the 88
entire lignocellulosic biomass, instead of its independent components, is submitted to 89
HTC. To this end, olive stones (OS) (Olea europaea) and beechwood (BW) (Fagus 90
sylvatica) have been subjected to HTC at temperatures ranging from 140 to 240ºC and 91
durations ranging from 1 to 24 hours. The severity factor, which is a useful tool for 92
understanding HTC, was used to simultaneously account for the effects of time and 93
temperature. The experimental data were finally compared to the predictions of the 94
models. 95
2. Materials and Methods 96
2.1. Raw materials 97
The cellulose, hemicellulose and lignin contents of OS and BW were determined 98
according to the Tappi standards (T 264, T 203 and T 222, respectively). Each analysis 99
was repeated three times and the average error was lower than 3%. More details can be 100
found elsewhere (Borrero-López et al., 2017). 101
Olive stones (OS) were purchased at a local factory in Gabès (Tunisia) and ground at 102
a size of less than 2 mm. The cellulose, hemicellulose and lignin contents were 40.5, 103
21.7 and 29.9 wt.%, respectively (Borrero-López et al., 2017). Beechwood (BW) was 104
cut and milled and the resultant chips of an average size of less than 1 mm were 105
recovered by using a powder collector. The corresponding cellulose, hemicellulose and 106
lignin contents were 43.6, 33.5 and 22.1 wt.%, respectively. 107
All compounds used for identification and quantification of phenolic and furan 108
compounds using HPLC equipment were analytical grade and purchased from Sigma-109
Aldrich (Steinheim, Germany). 110
111
6
2.2. Hydrothermal carbonisation 112
Hydrothermal carbonisation tests were performed according to the conditions 113
established elsewhere (Borrero-López et al., 2018). In brief, 2 g of the selected biomass 114
were introduced into a glass vial with 16 g of distilled water. The vial was then placed 115
in a 100 mL Teflon-lined autoclave, sealed and placed in a preheated oven at the desired 116
temperature (140-240ºC) for times ranging from 1 to 24h. 117
The combined effect of time and temperature on the process was taken into account 118
through the severity factor, logR0, (Overend and Chornet, 1987), as follows: 119
(1) 120
where the higher importance of temperature, T (°C), with respect to time, t (min), can be 121
observed in the exponential dependence of R0 on T and its linear dependence on t. 122
Regarding the empirical parameter ω, a value of 14.75 has been traditionally used with 123
lignocellulosic materials. However, it has been modified as needed to accommodate a 124
variety of bioresources and temperatures (Kim et al., 2014; Ko et al., 2015). Table 1 125
shows the experimental conditions and consequent severity factors used for OS and 126
BW. 127
128

7
Table 1. Performed tests and corresponding values of severity (logR0). 129
Olive Stones Beechwood
Test conditions logR0 Test conditions logR0
160ºC, 6h 4.32 160ºC, 1h 3.54
170ºC, 2h 4.14 160ºC, 2h 3.85
170ºC, 4h 4.44 160ºC, 3h 4.02
170ºC, 6h 4.62 160ºC, 6h 4.32
180ºC, 2h 4.43 160ºC, 12h 4.62
180ºC, 4h 4.74 160ºC, 24h 4.92
180ºC, 6h 4.91 180ºC, 1h 4.13
190ºC, 4h 5.03 180ºC, 2h 4.43
190ºC, 6h 5.21 180ºC, 3h 4.61
190ºC, 8h 5.33 180ºC, 6h 4.91
200ºC, 2h 5.02 180ºC, 12h 5.21
200ºC, 4h 5.32 180ºC, 24h 5.51
200ºC, 6h 5.50 200ºC, 1h 4.72
220ºC, 2h 5.61 200ºC, 2h 5.02
240ºC, 1h 5.90 200ºC, 3h 5.20
240ºC, 2h 6.20 200ºC, 6h 5.50
200ºC, 12h 5.80
200ºC, 24h 6.10
130
2.3. Liquid/Solid separation 131
Upon completion of the HTC, the brownish solid, or hydrochar, was separated from 132
the liquid by vacuum filtration and completely dried in a vacuum oven, where it was 133
held for 6h at 60ºC before being weighed and stored. After separation, the liquid was 134
also weighed and refrigerated to avoid further reactions until analysis. 135
2.4. Chromatographic analysis 136
The quantitative analysis of the main compounds in the liquid phase was carried out 137
using an Ultimate 3000 high-performance liquid chromatograph (Thermo Fisher 138
Scientific, Germany), coupled to an automatic sampler and with both diode array and 139
fluorescence detectors. Two different columns were used for the appropriate separation 140
and quantification of furan and phenolic compounds: Hypersyl Green PAH (Thermo 141

8
Fisher Scientific, Germany) and Pinnacle DB BiPh 5 μm (Restek, USA), respectively. 142
The quantification of furans was performed at UV absorption wavelengths of 220, 276, 143
284 and 291 nm by selecting water and acetonitrile as mobile phases. For the 144
determination of phenolic compounds, the same mobile phases were used, but 195, 201, 145
231 and 300 nm were the selected UV absorption wavelengths. More information on the 146
analysis protocol can be found elsewhere (Borrero-López et al., 2018). The limits of 147
detection for HPLC measurements were around 0.0004 g/L. 148
2.5. Yield analysis 149
The hydrochar and liquid-phase yields, i.e., YHC and YLC, respectively, were 150
calculated according to the following equations (2) and (3): 151
(2) 152
(3) 153
where WHC expresses the dry weight of the resultant hydrochar, WBC is the initial weight 154
of the biomass compound (BC) fed into the autoclave, L is the resultant liquid content 155
after HTC, and L0 is the initial amount of distilled water added. 156
2.6. Procedure to estimate HTC products 157
The present procedure is based on recent models (Borrero-López et al., 2018) 158
initially developed to describe the behaviour of the three main biomass components: 159
cellulose, hemicellulose and lignin, submitted to HTC separately, in terms of final pH, 160
hydrochar and liquid yields, and concentrations in FU, 5-HMF and phenolic molecules. 161
Based on these former models, we tried to assess whether it was possible to predict the 162
final composition and yields of HTC products or the possible synergistic effects when 163
the real biomass is submitted to HTC. For that purpose, we used two rather different 164

9
biomasses, OS and BW, the former being much richer in lignin than the latter. The final 165
pH of the liquid phase reads as follows: 166
(4) 167
where p1, p2 and p3 are experimental parameters. A polynomial expression was then 168
determined for each biopolymer: cellulose, hemicellulose and lignin. 169
The hydrochar yield from each biomass compound is as follows: 170
(5) 171
where the hydrochar yield of each lignocellulosic polymer (YHC,BC) depends on the 172
constant initial and final hydrochar yields (Y0 and Y∞, respectively), and on two 173
parameters, k and m, which account for the slope of the yield drop and the severity value 174
at which the drop starts, respectively. 175
The concentrations of FU and 5-HMF produced when submitting biomass to HTC 176
read, respectively: 177
(6) 178
(7) 179
Both models were applied because the latter takes into account an intermediate in the 180
production of FU from xylose. CBC was the initial concentration of the BC (cellulose, 181
hemicellulose or lignin) while k1, k2 and k3 were the constants corresponding to the 182
various reactions taking place. 183
The concentrations of the following phenolic molecules produced from lignin read as 184
follows: 185
Vanillin, syringaldehyde and acetosyringone: 186
(8) 187
10
Guaiacyalcetone: 188
(9) 189
Syringol, guaiacol and phenol production: 190
(10) 191
where a determined set of parameters has been developed for each compound. 192
Using the corresponding model and taking into account the lignocellulosic 193
composition of both OS and BW, the aforementioned yields and concentrations of the 194
main HTC products were estimated. 195
2.7. Relative error analysis 196
To determine to what extent the various models match the real data, the following 197
expression was used to calculate the relative error: 198
(11) 199
where Vexp and Vth are respectively the experimental and predicted data, whether for pH 200
value, hydrochar or liquid yields, or concentration of a given product obtained during 201
the HTC of OS or BW. 202
203

11
3. Results 204
3.1. Final pH of the liquid phase 205
The final pH after HTC gives information on the severity of the process and on the 206
reactions that have taken place. Fig. 1a shows the pH of the liquid fraction after HTC of 207
OS and BW along with the predicted data obtained. 208
Figure 1 209
As can be seen, the pH of the liquid fraction after HTC was generally higher for BW 210
than for OS within the studied range of severity, which is in good agreement with their 211
lignocellulosic composition. At low severity, the higher the cellulose and hemicellulose 212
contents, the higher the pH final values (Borrero-López et al., 2018). In the former 213
paper it was shown that, as severity increases, lignin produces a slight increase in the 214
final pH, cellulose decreases it considerably, and hemicellulose gives a minimum of 215
about pH 5. Therefore, the experimental results observed represent a clear combination 216
of the degradations of the three biopolymers. Although a slight overestimation of pH 217
was observed (about +9% and +11% for OS and BW, respectively), the predicted 218
evolution of pH with severity followed the same trend as the experimental one. 219
3.2. Hydrochar yield 220
Fig. 1b shows the values of for OS and BW. At low severity, was 221
higher than due to the higher cellulose content of BW, a biopolymer that was 222
found to lead to the highest yields under these conditions (Borrero-López et al., 2018). 223
Nevertheless, at the highest severities, lignin began to play a more significant role in the 224
hydrochar yield, leading to values of closer to those of . 225

12
The differences between the predicted and experimental were as low as about 226
7% and 8% for OS and BW, which shows the relevance of the proposed equation for 227
predicting the yield of hydrochar of two very different biomasses submitted to HTC. 228
3.3. Liquid yield 229
Fig. 2a shows the liquid yield for both biomasses, that of OS being higher than that 230
of BW due to its higher lignin and lower cellulose contents, respectively. Nevertheless, 231
due to the high hemicellulose content of BW, the two datasets were very similar. In our 232
former work (Borrero-López et al., 2018), no model could be obtained for the liquid 233
yields from the HTC of hemicellulose, cellulose and lignin, due to the scattering of the 234
results. However, the experimental liquid yields of lignin, cellulose and hemicellulose 235
and the corresponding compositions were used here to predict the results. Thus, for each 236
severity value and for each bioresource, the liquid yields previously obtained from raw 237
cellulose, hemicellulose and lignin were weighed with the lignocellulose concentration, 238
generating the predicted values. In spite of that impossibility to previously obtain a 239
proper model (Borrero-López et al., 2018), the predicted data were found to be in very 240
good agreement with the OS liquid yield, with an average error of about 6%; however, 241
the BW liquid yield was slightly overestimated, with an average error of 16%. 242
Fig. 2b shows the differences between experimental and predicted values from the 243
model. The general overestimation of the liquid yield, especially for BW, can be 244
explained by some synergistic effect that may occur when the three biopolymers are 245
linked together. As a result, some reactions can be hindered and the extraction of water 246
from the raw biomass can be limited. In addition, it can be concluded that both cellulose 247
and hemicellulose must be responsible for this higher resistance to HTC, because OS, 248

13
with a higher lignin content, does not present such an overestimation of liquid yield 249
(Xiao et al., 2012). 250
Figure 2 251
3.4. Concentrations of FU and 5-HMF and estimates 252
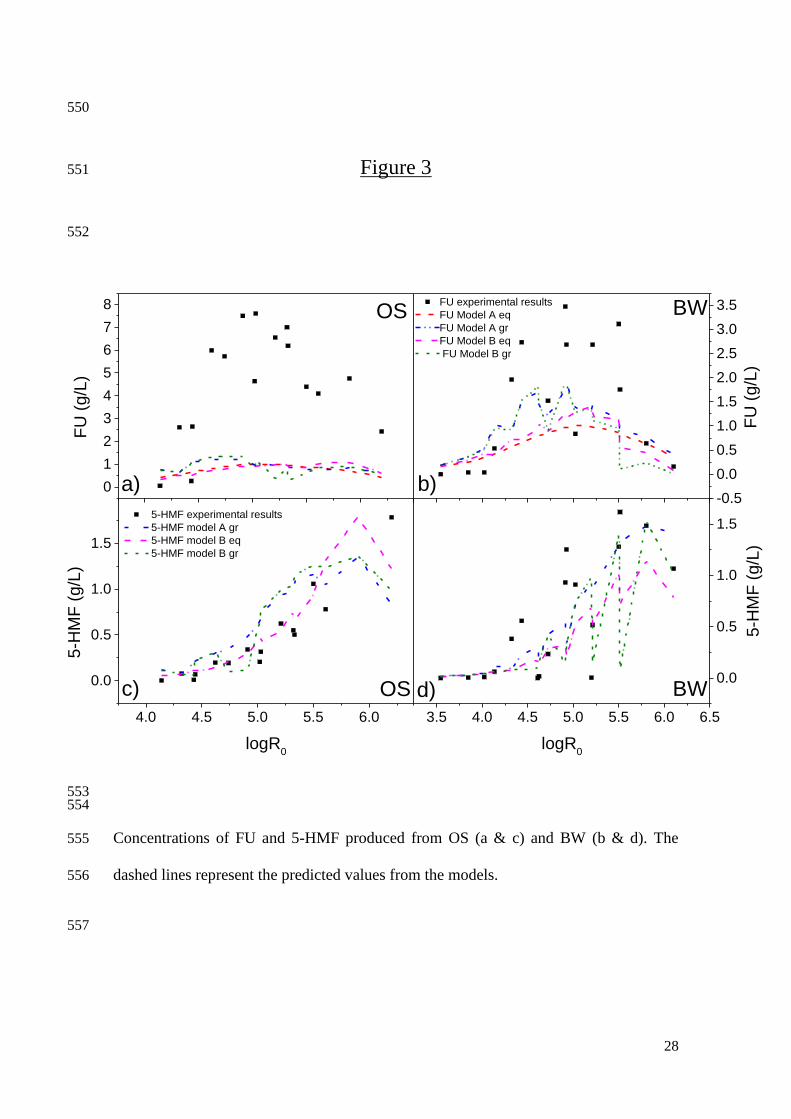
Fig. 3 shows the concentrations of FU and 5-HMF experimentally produced from OS 253
and BW. Unexpectedly, the FU concentration from OS was significantly higher than 254
that from BW. Such a finding was surprising because BW contains a much higher 255
fraction of hemicellulose, which is directly responsible for the production of FU. 256
Moreover, the latter from both materials was much higher than expected, based on their 257
hemicellulose content and our previous study (Borrero-López et al., 2018), as clearly 258
seen in Fig. 3a and 3b, which also show the predictions of models A and B. This can be 259
explained because higher concentrations of pentoses are known to be responsible for 260
side reactions, so the lower hemicellulose concentration of both biomasses may actually 261
increase the yields (Marcotullio, 2011). In addition, since FU is generally produced 262
under acid-catalysed conditions (Dashtban et al., 2012; Matsagar et al., 2017), cellulose 263
degradation, which produces a substantial decrease in pH, can potentially enhance the 264
production of FU from OS and BW compared to hemicellulose itself. Moreover, the 265
lower pH reported for OS can also explain the difference between the two biomasses. 266
The FU yields obtained are in the range of other studies, as already shown in a previous 267
work (Borrero-López et al., 2017). 268
Figure 3 269
Regarding 5-HMF production, overall, the predictions were closer to the 270
experimental data than for FU. Nonetheless, it is worth mentioning the extremely high 271
overestimation shown by model A when considering a constant calculated from the 272

14
equations (data not shown). The production of 5-HMF was higher for BW for almost all 273
the considered severity factors, which was consistent with its higher cellulose content 274
when compared to OS. Nevertheless, the highest 5-HMF production was obtained from 275
OS at the highest tested severity factor. In summary, the most reliable predictions 276
obtained were those considering equations developed from the application of model B. 277
3.5. Concentrations of phenolic compounds and estimates 278
It is well known that lignin can produce a wide range of phenolic compounds from 279
the decomposition of its structure into its constituent units (Borrero-López et al., 2018; 280
Cesari et al., 2019; Yang et al., 2019). In the present work, nine different types of 281
phenolic compounds have been identified and quantified for OS and BW, the 282
concentrations of which have also been estimated by application of the previous models 283
developed from HTC tests on lignin (Borrero-López et al., 2018). These phenolic 284
compounds are vanillin, guaiacylacetone, syringol, syringaldehyde, guaiacol, 285
acetosyringone, phenol, acetovanillone and creosol. Only the first seven compounds 286
were plotted in Fig. 4 for OS and BW, because the concentrations of acetovanillone and 287
creosol were below the limits of detection (0.0005 and 0.0004 mg/L, respectively) 288
throughout the whole range of conditions studied. The absence of creosol was somehow 289
expected, since previous studies on the HTC of lignin only produced it at severities 290
greater than 6 (Borrero-López et al., 2018). However, the concentration of 291
acetovanillone had comparable values to syringaldehyde (Borrero-López et al., 2018), 292
thus the production of acetovanillone should be somewhat limited by the synergistic 293
action of both cellulose and hemicellulose and the corresponding reduction of pH. 294
Figure 4 295

15
Since the concentration of lignin in OS is the highest, one would think that the 296
concentrations of phenolic compounds from this bioresource would be the highest. 297
However, similar to what occurred with FU production, this was true only for vanillin, 298
guaiacylacetone and final phenol concentration, while the remaining phenolic 299
compounds concentrations from OS were similar to or less than from BW. This fact 300
highlights the extreme importance of the lignin content, which may vary significantly 301
from one bioresource to another. Since the concentration of monolignols and other units 302
may be very different, different concentrations of the resulting products can be obtained 303
(Anderson et al., 2019; Santos et al., 2015a; Santos et al., 2015b). Both OS and BW 304
derive from hardwoods, thus close syringyl(S) / guaiacyl(G) (p-hydroxyphenylpropane) 305
ratios are expected. Some authors (Simon et al., 2014) have reported that BW has a S/G 306
ratio close to 1, while others suggest lower ratios that depend on the extraction process 307
(Choi et al., 2001). In contrast, the OS S/G ratio was postulated at 1.08 (Harman-Ware 308
et al., 2015). On the contrary, the lignin used for modelling was PROTOBIND 1075, 309
which comes from softwood, so that the S/G ratio drops dramatically to very low values 310
depending on the initial biomass (Anderson et al., 2019), which makes the structure of 311
lignin completely different. Therefore, this fact may compromise the accuracy of the 312
model (Borrero-López et al., 2018; Li et al., 2013; Sameni, 2015). 313
Nevertheless, the predicted data showed adequate fits for the vast majority of them, 314
highlighting the validity and adaptability of the model. However, here again, the 315
influence of the simultaneous HTC of the remaining lignocellulosic biopolymers affects 316
the prediction of the results by modifying the interactions and modifying the 317
composition of the liquid phase. Thus, in our previous work, it has been shown how the 318
final pH from lignin HTC increased with severity (Borrero-López et al., 2018), 319
although, for the bioresources studied in this work, the final pH has decreased as a result 320

16
of the presence of both cellulose and hemicellulose. Thus, the compounds that depend 321
on acidic or basic catalysis can have a completely different behaviour, as shown for 322
vanillin, acetosyringone, acetovanillone and syringaldehyde, whose concentration was 323
generally overestimated as a result of low pH. 324
In addition, the general underestimation observed for syringyl-derived units may also 325
result from the higher S/G ratio of hardwoods, with respect to softwoods, which is 326
known to facilitate the effectiveness of delignification (Anderson et al., 2019; Schmetz 327
et al., 2019). 328
4. Conclusions 329
The hydrothermal carbonisation of OS and BW was successfully performed in a 330
wide range of severity factor values. pH, hydrochar and liquid yields as well as some 331
furan and phenolic compounds were determined, and the experimental results were 332
compared to estimates. These estimates were obtained taking into account the 333
hemicellulose, cellulose and lignin contents of the biomasses as well as the results of the 334
fits obtained for the same parameters when these components of biomass were 335
separately submitted to HTC. The following general trends could be derived. 336
- The final pH of liquids derived from BW was generally higher than that 337
measured in OS-derived liquids, which is in good agreement with their 338
lignocellulosic composition. An average overestimate of 10% of the pH value 339
was obtained because of the synergistic effect between the three lignocellulosic 340
compounds, but the trends were well predicted. 341
- A similar trend was observed in the hydrochar yield although the agreement 342
between predicted and experimental values was much better (around 7%). 343

17
- The liquid yield was higher for the OS because of its higher lignin and lower 344
cellulose contents. A good fit was obtained, reaching about 6 and 16% average 345
error for OS and BW, respectively. 346
- Extremely high concentrations were obtained for FU, which is attributable to 347
lower rates of side reactions and the influence of the final pH. The 348
concentrations of 5-HMF were lower, and a better approximation was obtained 349
with model B. The concentrations of phenolic compounds were of the same 350
order as those predicted, but highly dependent on the selected biomass and pH. 351
Although further analysis is needed to explain the unexpected concentrations of FU, 352
the models predicted trends similar to those determined experimentally. A systematic 353
study in which mixtures of biomass components would be submitted to HTC would be 354
necessary to understand the undergoing reaction mechanisms and synergistic effects. 355
Declaration of interest 356
The authors declare no competing financial interest. 357
Acknowledgements 358
This work was supported by a grant overseen by the French National Research 359
Agency (ANR) as part of the “Investissements d’Avenir” program (ANR-11-LABX-360
0002-01, Lab of Excellence ARBRE) and TALiSMAN project, funded by FEDER 361
(2019-000214). A.M.B-L. acknowledges the Ph.D. Research Grant received from the 362
Ministerio de Educación, Cultura y Deporte (FPU16/03697). 363
364
18
Bibliography 365
Anderson, E.M., Stone, M.L., Katahira, R., Reed, M., Muchero, W., Ramirez, K.J., 366
Beckham, G.T., Román-Leshkov, Y., 2019. Differences in S/G ratio in natural 367
poplar variants do not predict catalytic depolymerization monomer yields. Nat. 368
Commun. 10, 2033. https://doi.org/10.1038/s41467-019-09986-1 369
Bento, L.R., Castro, A.J.R., Moreira, A.B., Ferreira, O.P., Bisinoti, M.C., Melo, C.A., 370
2019. Release of nutrients and organic carbon in different soil types from 371
hydrochar obtained using sugarcane bagasse and vinasse. Geoderma 334, 24–32. 372
https://doi.org/10.1016/j.geoderma.2018.07.034 373
Borrero-López, A M, Fierro, V., Jeder, A., Ouederni, A., Masson, E., Celzard, A., 2017. 374
High added-value products from the hydrothermal carbonisation of olive stones. 375
Environ. Sci. Pollut. Res. 24, 9859–9869. https://doi.org/10.1007/s11356-016-376
7807-6 377
Borrero-López, A.M., Masson, E., Celzard, A., Fierro, V., 2018. Modelling the 378
reactions of cellulose, hemicellulose and lignin submitted to hydrothermal 379
treatment. Ind. Crops Prod. 124, 919–930. 380
https://doi.org/10.1016/j.indcrop.2018.08.045 381
Cesari, L., Mutelet, F., Canabady-rochelle, L., 2019. Antioxidant properties of phenolic 382
surrogates of lignin depolymerisation. Ind. Crop. Prod. 129, 480–487. 383
https://doi.org/10.1016/j.indcrop.2018.12.010 384
Choi, J.W., Faix, O., Meier, D., 2001. Characterization of Residual lignins from 385
chemical pulps of spruce (Picea abies L.) and beech (Fagus sylvatica L.) by 386
19
analytical pyrolysis-gas chromatography/mass spectrometry. Holzforschung 55, 387
185–192. https://doi.org/10.1515/HF.2001.031 388
Conde, E., Moure, A., Domínguez, H., Parajó, J.C., 2011. Production of antioxidants by 389
non-isothermal autohydrolysis of lignocellulosic wastes. LWT - Food Sci. 390
Technol. 44, 436–442. https://doi.org/10.1016/j.lwt.2010.08.006 391
Dashtban, M., Gilbert, A., Fatehi, P., 2012. Production of furfural: overview and 392
challenges. J-For. 2, 44-53. 393
Gallifuoco, A., Di Giacomo, G., 2018. Novel kinetic studies on biomass hydrothermal 394
carbonization. Bioresour. Technol. 266, 189–193. 395
https://doi.org/10.1016/j.biortech.2018.06.087 396
Gallifuoco, A., Taglieri, L., Scimia, F., Papa, A.A., Di Giacomo, G., 2018. 397
Hydrothermal conversions of waste biomass: Assessment of kinetic models using 398
liquid-phase electrical conductivity measurements. Waste Manag. 77, 586–592. 399
https://doi.org/10.1016/j.wasman.2018.05.033 400
Gómez, J., Corsi, G., Pino-Cortés, E., Díaz-Robles, L.A., Campos, V., Cubillos, F., 401
Pelz, S.K., Paczkowski, S., Carrasco, S., Silva, J., Lapuerta, M., Pazo, A., 402
Monedero, E., 2019. Modeling and simulation of a continuous biomass 403
hydrothermal carbonization process. Chem. Eng. Commun. 404
https://doi.org/10.1080/00986445.2019.1621858 405
Grote, F., Ermilova, I., Lyubartsev, A.P., 2018. Molecular Dynamics Simulations of 406
Furfural and 5-Hydroxymethylfurfural at Ambient and Hydrothermal Conditions. 407
J. Phys. Chem. B 122, 8416–8428. https://doi.org/10.1021/acs.jpcb.8b03350 408

20
Guardia, L., Suárez, L., Querejeta, N., Rodríguez Madrera, R., Suárez, B., Centeno, 409
T.A., 2019. Apple Waste: A Sustainable Source of Carbon Materials and Valuable 410
Compounds. ACS Sustain. Chem. Eng. 7, 17335–17343. 411
https://doi.org/10.1021/acssuschemeng.9b04266 412
Gullón, B., Eibes, G., Moreira, M.T., Dávila, I., Labidi, J., Gullón, P., 2017. 413
Antioxidant and antimicrobial activities of extracts obtained from the refining of 414
autohydrolysis liquors of vine shoots. Ind. Crops Prod. 107, 105–113. 415
https://doi.org/10.1016/j.indcrop.2017.05.034 416
Harman-Ware, A.E., Crocker, M., Pace, R.B., Placido, A., Morton III, S., DeBolt, S., 417
2015. Characterization of Endocarp Biomass and Extracted Lignin Using Pyrolysis 418
and Spectroscopic Methods. Bioenergy Res. 8, 350–368. 419
https://doi.org/10.1007/s12155-014-9526-5 420
Heidari, M., Norouzi, O., Salaudeen, S., Acharya, B., Dutta, A., 2019. Prediction of 421
Hydrothermal Carbonization with Respect to the Biomass Components and 422
Severity Factor. Energy and Fuels 33, 9916–9924. 423
https://doi.org/10.1021/acs.energyfuels.9b02291 424
Huang, J., Li, Y., Jia, X., Song, H., 2019. Preparation and tribological properties of 425
core-shell Fe3O4@C microspheres. Tribol. Int. 129, 427–435. 426
https://doi.org/10.1016/j.triboint.2018.08.036 427
Kavil, J., Anjana, P.M., Roshni, C.P., Periyat, P., Raj, K.G., Rakhi, R.B., 2019. 428
Multifunctional nanohybrid material from discarded razor blades as cost-effective 429
supercapacitor electrodes and oil-spill cleaners. Appl. Surf. Sci. 487, 109–115. 430
https://doi.org/10.1016/j.apsusc.2019.05.055 431
21
Keiller, B.G., Muhlack, R., Burton, R.A., Van Eyk, P.J., 2019. Biochemical 432
Compositional Analysis and Kinetic Modeling of Hydrothermal Carbonization of 433
Australian Saltbush. Energy and Fuels 33, 12469–12479. 434
https://doi.org/10.1021/acs.energyfuels.9b02931 435
Kim, Y., Kreke, T., Mosier, N.S., Ladisch, M.R., 2014. Severity Factor Coefficients for 436
Subcritical Liquid Hot Water Pretreatment of Hardwood Chips. Biothecnol. 437
Bioeng. 111, 254–263. https://doi.org/10.1002/bit.25009 438
Ko, J.K., Kim, Y., Ximenes, E., Ladisch, M.R., 2015. Effect of liquid hot water 439
pretreatment severity on properties of hardwood lignin and enzymatic hydrolysis 440
of cellulose. Biotechnol. Bioeng. 112, 252–262. https://doi.org/10.1002/bit.25349 441
Lei, Y., Su, H., Tian, F., 2018. A Novel Nitrogen Enriched Hydrochar Adsorbents 442
Derived from Salix Biomass for Cr (VI) Adsorption. Sci. Rep. 8, 4040. 443
https://doi.org/10.1038/s41598-018-21238-8 444
Li, Y., Cui, D., Tong, Y., Xu, L., 2013. Study on structure and thermal stability 445
properties of lignin during thermostabilization and carbonization. Int. J. Biol. 446
Macromol. 62, 663–669. https://doi.org/10.1016/j.ijbiomac.2013.09.040 447
Liu, S., Tian, J., Wang, L., Zhang, Y., Qin, X., Luo, Y., Asiri, A.M., Al-Youbi, A.O., 448
Sun, X., 2012. Hydrothermal treatment of grass: A low-cost, green route to 449
nitrogen-doped, carbon-rich, photoluminescent polymer nanodots as an effective 450
fluorescent sensing platform for label-free detection of Cu(II) ions. Adv. Mater. 24, 451
2037–2041. https://doi.org/10.1002/adma.201200164 452
Lucian, M., Volpe, M., Gao, L., Piro, G., Goldfarb, J.L., Fiori, L., 2018. Impact of 453
hydrothermal carbonization conditions on the formation of hydrochars and 454

22
secondary chars from the organic fraction of municipal solid waste. Fuel 233, 257–455
268. https://doi.org/10.1016/j.fuel.2018.06.060 456
Ma, Q., Han, L., Huang, G., 2018. Effect of water-washing of wheat straw and 457
hydrothermal temperature on its hydrochar evolution and combustion properties. 458
Bioresour. Technol. 269, 96–103. https://doi.org/10.1016/j.biortech.2018.08.082 459
Marcotullio, G., 2011. The Chemistry and Technology of Furfural Production in 460
Modern Lignocellulose-Feedstock Biorefineries. 461
http://resolver.tudelft.nl/uuid:a307ecb3-513a-4f57-b519-873a73403cfd (accessed 462
18 December 2019) 463
Matsagar, B.M., Hossain, S.A., Islam, T., Alamri, H.R., Alothman, Z.A., Yamauchi, Y., 464
Dhepe, P.L., Wu, K.C.W., 2017. Direct Production of Furfural in One-pot Fashion 465
from Raw Biomass Using Brønsted Acidic Ionic Liquids. Sci. Rep. 7, 13508. 466
https://doi.org/10.1038/s41598-017-13946-4 467
Nakason, K., Panyapinyopol, B., Kanokkantapong, V., Viriya-empikul, N., Kraithong, 468
W., Pavasant, P., 2018. Hydrothermal carbonization of unwanted biomass 469
materials: Effect of process temperature and retention time on hydrochar and liquid 470
fraction. J. Energy Inst. 91, 786–796. https://doi.org/10.1016/j.joei.2017.05.002 471
Overend, R.P., Chornet, E., 1987. Fractionation of Lignocellulosics by Steam-Aqueous 472
Pretreatments. Philos. Trans. R. Soc. A 321, 523–536. 473
https://doi.org/10.1098/rsta.1987.0029 474
Rodrigues Pinto, P.C., Borges da Silva, E.A., Rodrigues, A.E., 2012. Lignin as Source 475
of Fine Chemicals: Vanillin and Syringaldehyde. In: Baskar C., Baskar S., Dhillon 476
R. (eds) Biomass Conversion. Springer, Berlin, Heidelberg, pp. 381-420. 477
23
Salimi, M., Tavasoli, A., Balou, S., Hashemi, H., Kohansal, K., 2018. Influence of 478
promoted bimetallic Ni-based catalysts and Micro/Mesopores carbonaceous 479
supports for biomass hydrothermal conversion to H2-rich gas. Appl. Catal. B 480
Environ. 239, 383–397. https://doi.org/10.1016/j.apcatb.2018.08.039 481
Sameni, J.K., 2015. Physico-Chemical Characterization of Lignin Isolated from 482
Industrial Sources for Advanced Applications. http://hdl.handle.net/1807/70871 483
(accessed 18 December 2019) 484
Santos, J.I., Martín-Sampedro, R., Fillat, Ú., Oliva, J.M., Negro, M.J., Ballesteros, M., 485
Eugenio, M.E., Ibarra, D., 2015a. Evaluating lignin-rich residues from biochemical 486
ethanol production of wheat straw and olive tree pruning by FTIR and 2d-nmr. Int. 487
J. Polym. Sci. 2015, 314891. https://doi.org/10.1155/2015/314891 488
Santos, J.I., Fillat, Ú., Martín-Sampedro, R., Ballesteros, I., Manzanares, P., Ballesteros, 489
M., Eugenio, M.E., Ibarra, D., 2015b. Lignin-enriched Fermentation Residues from 490
Bioethanol Production of Fast-growing Poplar and Forage Sorghum. BioResources 491
10, 5215–5232. https://doi.org/10.15376/biores.10.3.5215-5232 492
Schmetz, Q., Teramura, H., Morita, K., Oshima, T., Richel, A., Ogino, C., Kondo, A., 493
2019. Versatility of a Dilute Acid/Butanol Pretreatment Investigated on Various 494
Lignocellulosic Biomasses to Produce Lignin, Monosaccharides and Cellulose in 495
Distinct Phases. ACS Sustain. Chem. Eng. 7, 11069–11079. 496
https://doi.org/10.1021/acssuschemeng.8b05841 497
Simon, M., Brostaux, Y., Vanderghem, C., Jourez, B., Paquot, M., Richel, A., 2014. 498
Optimization of a formic/acetic acid delignification treatment on beech wood and 499
its influence on the structural characteristics of the extracted lignins. J. Chem. 500
Technol. Biotechnol. 89, 128–136. https://doi.org/10.1002/jctb.4123 501

24
Sun, Z., Fridrich, B., De Santi, A., Elangovan, S., Barta, K., 2018. Bright Side of Lignin 502
Depolymerization: Toward New Platform Chemicals. Chem. Rev. 118, 614–678. 503
https://doi.org/10.1021/acs.chemrev.7b00588 504
Wataniyakul, P., Boonnoun, P., Quitain, A.T., Kida, T., Laosiripojana, N., Shotipruk, 505
A., 2018. Preparation of hydrothermal carbon acid catalyst from defatted rice bran. 506
Ind. Crops Prod. 117, 286–294. https://doi.org/10.1016/j.indcrop.2018.03.002 507
Xiao, L.P., Shi, Z.J., Xu, F., Sun, R.C., 2012. Hydrothermal carbonization of 508
lignocellulosic biomass. Bioresour. Technol. 118, 619–623. 509
https://doi.org/10.1016/j.biortech.2012.05.060 510
Xie, X., Wang, Y., Li, X., Wei, X., Yang, S., 2018. Pickering emulsions stabilized by 511
amphiphilic carbonaceous materials derived from wheat straw. Colloids Surfaces 512
A Physicochem. Eng. Asp. 558, 65–72. 513
https://doi.org/10.1016/j.colsurfa.2018.08.063 514
Yahia, S.H., Keat Lee, K., Ayed, B., Church, T.L., Hedin, N., 2019. Activated Carbons 515
from Hydrothermal Carbons Prepared in Milk. Sci. Rep. 9, 16956. 516
https://doi.org/10.1038/s41598-019-53361-5 517
Yang, S., Fan, D., Li, G., 2019. Analysis of phenolic compounds obtained from bamboo 518
microwave liquefaction for fast-curing phenol-formaldehyde resin preparation. J. 519
Appl. Polym. Sci. 136, 46952. https://doi.org/10.1002/app.46952 520
Zhao, K., Li, Y., Zhou, Y., Guo, W., Jiang, H., Xu, Q., 2018. Characterization of 521
hydrothermal carbonization products (hydrochars and spent liquor) and their 522
biomethane production performance. Bioresour. Technol. 267, 9–16. 523
https://doi.org/10.1016/j.biortech.2018.07.006 524

25
525
Figure Captions 526
Fig. 1. a) Final pH of the liquid phase; and b) hydrochar yield after HTC of OS and 527
BW. The dashed lines represent the predicted values from the models. 528
Fig. 2. a) Experimental liquid yields for OS and BW; b) Differences between 529
experimental and predicted values from the models. 530
Fig. 3. Concentrations of FU and 5-HMF produced from OS (a & c) and BW (b & d). 531
The dashed lines represent the predicted values from the models. 532
Fig. 4. Phenolic compounds concentration from OS (left) and BW (right). The dashed 533
red lines are predicted data from modelling and lignin content of the bioresource. 534
535

26
536
Figure 1 537
538
3
4
5
6
3.5 4.0 4.5 5.0 5.5 6.0 6.540
50
60
70
80
90
100
b)
BW experimental pH
OS experimental pH
Fin
al pH
a) BW predicted pH
OS predicted pH
BW experimental Hydrochar Yield
OS experimental Hydrochar Yield
OS predicted Hydrochar Yield
Hydro
char
Yie
ld (
%)
logR0
BW predicted Hydrochar Yield
539
a) Final pH of the liquid phase; and b) hydrochar yield after HTC of OS and BW. The 540
dashed lines represent the predicted values from the models. 541
542

27
543
Figure 2 544
545
35
40
45
50
55
60
65
70
75
80
85
90
BW experimental Liquid Yield
OS experimental Liquid Yield
Liq
uid
Yie
ld (
%)
3.5 4.0 4.5 5.0 5.5 6.0 6.5-30
-20
-10
0
10
20
30
b)
Diffe
rences b
etw
een e
xperim
enta
l
and p
redic
ted d
ata
(%
)
logR0
BW
OS
a)
546
a) Experimental liquid yields for OS and BW; b) Differences between experimental and 547
predicted values from the models. 548
549
28
550
Figure 3 551
552
0
1
2
3
4
5
6
7
8
-0.5
0.0
0.5
1.0
1.5
2.0
2.5
3.0
3.5
4.0 4.5 5.0 5.5 6.0
0.0
0.5
1.0
1.5
3.5 4.0 4.5 5.0 5.5 6.0 6.5
0.0
0.5
1.0
1.5
FU experimental results
FU Model A eq
FU Model A gr
FU Model B eq
FU Model B gr
FU
(g/L
)
OS
b)
BW
FU
(g/L
)
a)
c) OS
5-HMF experimental results
5-HMF model A gr
5-HMF model B eq
5-HMF model B gr
5-H
MF
(g/L
)
logR0
d) BW
5-H
MF
(g/L
)
logR0
553 554
Concentrations of FU and 5-HMF produced from OS (a & c) and BW (b & d). The 555
dashed lines represent the predicted values from the models. 556
557

29
558
Figure 4 559
560
0.000.030.060.09
0.000.030.060.09
BeechwoodOlive StonesVanillin
0.00
0.02
0.04
Guaiacylacetone 0.00
0.02
0.04Guaiacylacetone
0.00
0.03
0.06
0.09
Concentr
ation (
g/L
)
Concentr
ation (
g/L
)
Syringol 0.00
0.03
0.06
0.09Syringol
0.000.040.080.12 Syringaldehyde Syringaldehyde
0.000.040.080.12
0.000.020.040.06
Guaiacol 0.000.020.040.06Guaiacol
0.0
0.1
Acetosyringone
Acetosyringone
0.0
0.1
4 5 6
0.00
0.01
0.02
Phenol
logR0
4 5 6
0.00
0.01
0.02Phenol
Vanillin
logR0
561 562
Phenolic compounds concentration from OS (left) and BW (right). The dashed red lines 563
are predicted data from modelling and lignin content of the bioresource. 564
565
566
567