modelling time-resolved two ... - mukamel.ps.uci.edu · rhodopsin (rh) is a type ii opsin found in...
TRANSCRIPT
Modelling Time-Resolved Two-Dimensional Electronic Spectroscopyof the Primary Photoisomerization Event in RhodopsinIvan Rivalta,*,†,‡ Artur Nenov,‡ Oliver Weingart,§ Giulio Cerullo,∥ Marco Garavelli,*,†,‡
and Shaul Mukamel*,⊥
†Universite de Lyon, CNRS, Institut de Chimie de Lyon, Ecole Normale Superieure de Lyon, 46 Allee d’Italie, F-69364 Lyon Cedex07, France‡Dipartimento di Chimica “G. Ciamician”, Universita di Bologna, V. F. Selmi 2, 40126 Bologna, Italy§Institut fur Theoretische Chemie und Computerchemie, Heinrich-Heine-Universitat Dusseldorf, Universitatsstr. 1, 40225Dusseldorf, Germany∥IFN-CNR, Dipartimento di Fisica, Politecnico di Milano, Piazza L. da Vinci 32, 20133 Milano, Italy⊥Department of Chemistry, University of California, Irvine, California 92697-2025, United States
*S Supporting Information
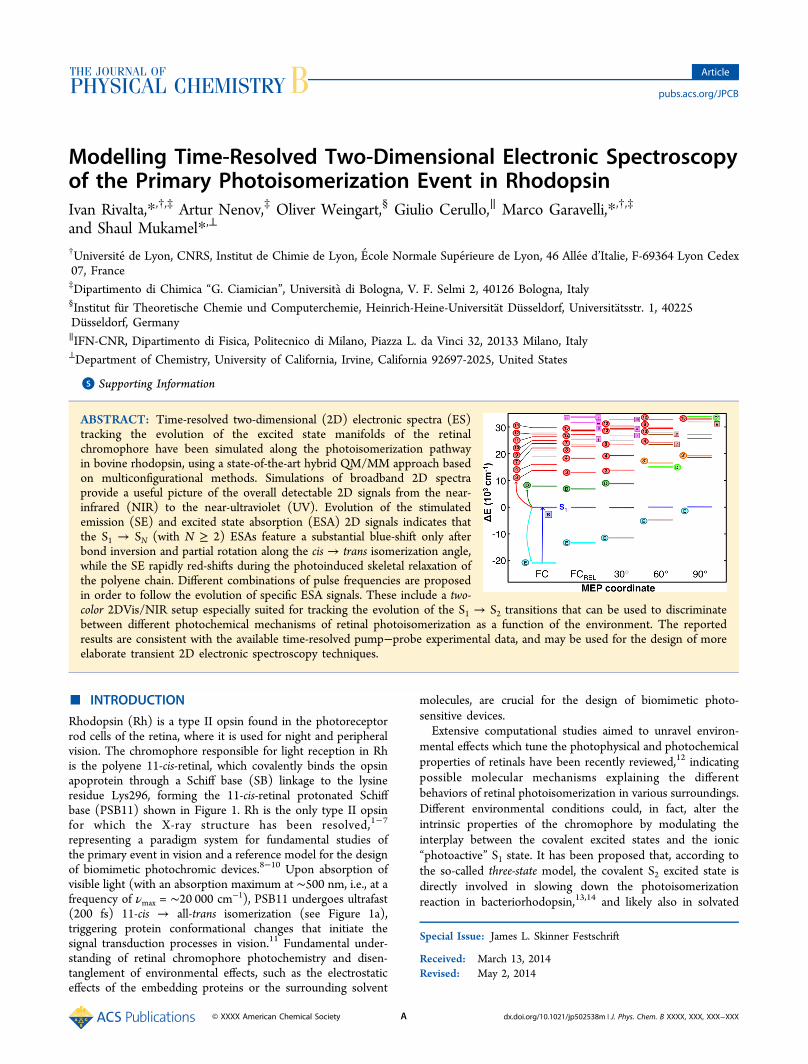
ABSTRACT: Time-resolved two-dimensional (2D) electronic spectra (ES)tracking the evolution of the excited state manifolds of the retinalchromophore have been simulated along the photoisomerization pathwayin bovine rhodopsin, using a state-of-the-art hybrid QM/MM approach basedon multiconfigurational methods. Simulations of broadband 2D spectraprovide a useful picture of the overall detectable 2D signals from the near-infrared (NIR) to the near-ultraviolet (UV). Evolution of the stimulatedemission (SE) and excited state absorption (ESA) 2D signals indicates thatthe S1 → SN (with N ≥ 2) ESAs feature a substantial blue-shift only afterbond inversion and partial rotation along the cis → trans isomerization angle,while the SE rapidly red-shifts during the photoinduced skeletal relaxation ofthe polyene chain. Different combinations of pulse frequencies are proposedin order to follow the evolution of specific ESA signals. These include a two-color 2DVis/NIR setup especially suited for tracking the evolution of the S1 → S2 transitions that can be used to discriminatebetween different photochemical mechanisms of retinal photoisomerization as a function of the environment. The reportedresults are consistent with the available time-resolved pump−probe experimental data, and may be used for the design of moreelaborate transient 2D electronic spectroscopy techniques.
■ INTRODUCTION
Rhodopsin (Rh) is a type II opsin found in the photoreceptorrod cells of the retina, where it is used for night and peripheralvision. The chromophore responsible for light reception in Rhis the polyene 11-cis-retinal, which covalently binds the opsinapoprotein through a Schiff base (SB) linkage to the lysineresidue Lys296, forming the 11-cis-retinal protonated Schiffbase (PSB11) shown in Figure 1. Rh is the only type II opsinfor which the X-ray structure has been resolved,1−7
representing a paradigm system for fundamental studies ofthe primary event in vision and a reference model for the designof biomimetic photochromic devices.8−10 Upon absorption ofvisible light (with an absorption maximum at ∼500 nm, i.e., at afrequency of νmax = ∼20 000 cm−1), PSB11 undergoes ultrafast(200 fs) 11-cis → all-trans isomerization (see Figure 1a),triggering protein conformational changes that initiate thesignal transduction processes in vision.11 Fundamental under-standing of retinal chromophore photochemistry and disen-tanglement of environmental effects, such as the electrostaticeffects of the embedding proteins or the surrounding solvent
molecules, are crucial for the design of biomimetic photo-sensitive devices.Extensive computational studies aimed to unravel environ-
mental effects which tune the photophysical and photochemicalproperties of retinals have been recently reviewed,12 indicatingpossible molecular mechanisms explaining the differentbehaviors of retinal photoisomerization in various surroundings.Different environmental conditions could, in fact, alter theintrinsic properties of the chromophore by modulating theinterplay between the covalent excited states and the ionic“photoactive” S1 state. It has been proposed that, according tothe so-called three-state model, the covalent S2 excited state isdirectly involved in slowing down the photoisomerizationreaction in bacteriorhodopsin,13,14 and likely also in solvated
Special Issue: James L. Skinner Festschrift
Received: March 13, 2014Revised: May 2, 2014
Article
pubs.acs.org/JPCB
© XXXX American Chemical Society A dx.doi.org/10.1021/jp502538m | J. Phys. Chem. B XXXX, XXX, XXX−XXX
retinals, with an avoided crossing between the S1 and S2surfaces giving rise to a transition state (TS) along the S1state photoisomerization pathway. Indeed, the presence of anenergy barrier on the S1 energy surface before reaching theconical intersection (CI) with the ground state (GS, or S0)would slow down the photoreaction rate and make thephotoisomerization itself less efficient. In Rh on the otherhand, the retinal photoisomerization occurs on a steep andbarrierless reaction path involving only the ionic S1 state anddirectly leading to a peaked CI, which has the form of a twistedintramolecular charge transfer (TICT) state and provides anefficient and fast (<100 fs) route for radiationless decay.According to the so-called two-state two-mode model,15 skeletaldeformations (namely, a bond order inversion) followed by atorsional motion of the central double bond characterize theexcited state branch of the photoisomerization path.Experimental evidence of two distinct mechanisms for retinal
photoisomerization in solution and in Rh is lacking, and theavailable ultrafast pump−probe experiments, which are intrinsi-cally one-dimensional (1D), do not provide sufficient data todescribe the interplay between ionic and covalent states duringphotoisomerization. Ad hoc designed ultrafast nonlinear opticalspectroscopy experiments are therefore needed to shed light onthe retinal photoisomerization mechanisms in different environ-ments. In order to guide the design of new time-resolvedoptical spectroscopy experiments, in this work, we report fullcharacterization of the excited state manifolds of PSB11 in Rhalong the retinal photoisomerization pathway. We havecharacterized the electronic structures of selected critical pointsalong the minimum energy path (MEP) of the S1 energysurface, see Figure 1b, by means of a state-of-the-art hybrid
quantum mechanics (QM)/molecular mechanics (MM)approach based on wave function methods, including completeactive space self-consistent field (CASSCF)16 and second-ordermultireference perturbation theory (CASPT2).17 This method-ology has shown to provide consistent photophysical andphotochemical data for retinals in different environments,including vacuo,18 protein,19 and solution,19 in excellentagreement with chiroptical data,20 absorption spectroscopy,18
resonance Raman,21 and ultrafast optical spectroscopy experi-ments.22−24 A set of data collected from first-principlescalculations has been used to simulate time-resolved two-dimensional (2D) electronic spectroscopy experiments ofphotoactivated rhodopsin. 2D electronic spectroscopy(2DES) is the ultimate third-order nonlinear optical experi-ment, combining high spectral and temporal resolution andproviding a wealth of information which usually remains hiddenin conventional pump−probe experiments, such as intra- andintermolecular electronic couplings (that are resolved as off-diagonal cross-peaks in a 2D map), pathway specific signals,homogeneous and inhomogeneous broadening, etc.25−30 In2DES, a sequence of three ultrashort laser pulses interacts withthe sample, and the emitted signal field is detected as a functionof the three time delays (t1, t2, and t3); see Figure S1 in theSupporting Information. The 2D rephasing (KI) and non-rephasing (KII) signals can be obtained by double Fouriertransformation (FT) with respect to times t1 and t3, providing2D signals as a function of two frequencies, the “pumpfrequency” Ω(t1), i.e., Ω1, and the “probe frequency” Ω(t3), i.e.,Ω3, given a fixed value of the “population time” t2. For eachvalue of the population time t2, the 2DES spectrum can beinterpreted, to a first approximation, by associating to the Ω1axis the absorption spectrum sensed by the excitation pulsesand to the Ω3 axis the transient absorption spectrum sensed bythe probe pulse. A complete description of excited staterelaxation is obtained by collecting a sequence of 2D maps as afunction of population time t2. Thus, with 2DES, thephotoisomerization process of retinals can be monitored inproteins and in solution with the best possible combination ofspectral and temporal resolution. Such types of experimentsshould be designed by setting the pump frequency resonantwith νmax, i.e., populating the spectroscopic state S1, andprobing the absorptions and/or the emission of the wavepacket evolving on the S1 surface with different probefrequencies and at various probe delays.In this scenario, the unique advantage of using 2DES instead
of conventional pump−probe spectroscopy is the possibility ofresolving inhomogeneous broadening of the different signalsalong the Ω1 axis, since there is only one diagonal peak presentin the 2D map due to the (GS)S0 → S1 transition, and off-diagonal cross-peaks are absent. Unfortunately, computationalmodeling of the inhomogeneous broadening of the electronictransitions requires a complete sampling of the configurationalspace of the ground state and the characterization of a verylarge number of electronic structures along the photo-isomerization dynamics, which is challenging, highly computa-tionally demanding, and beyond the scope of the present work.Nevertheless, the simulated 2DES spectra along the “static”MEP of the retinal photoisomerization can provide informationon the spectral regions where signals with opposite signs, e.g.,excited state absorption (ESA) versus stimulated emission(SE), overlap. In these regions, the inhomogeneous broadeningof each electronic transition could significantly affect the shapeof the 2D overall signal. Such an effect could be observed
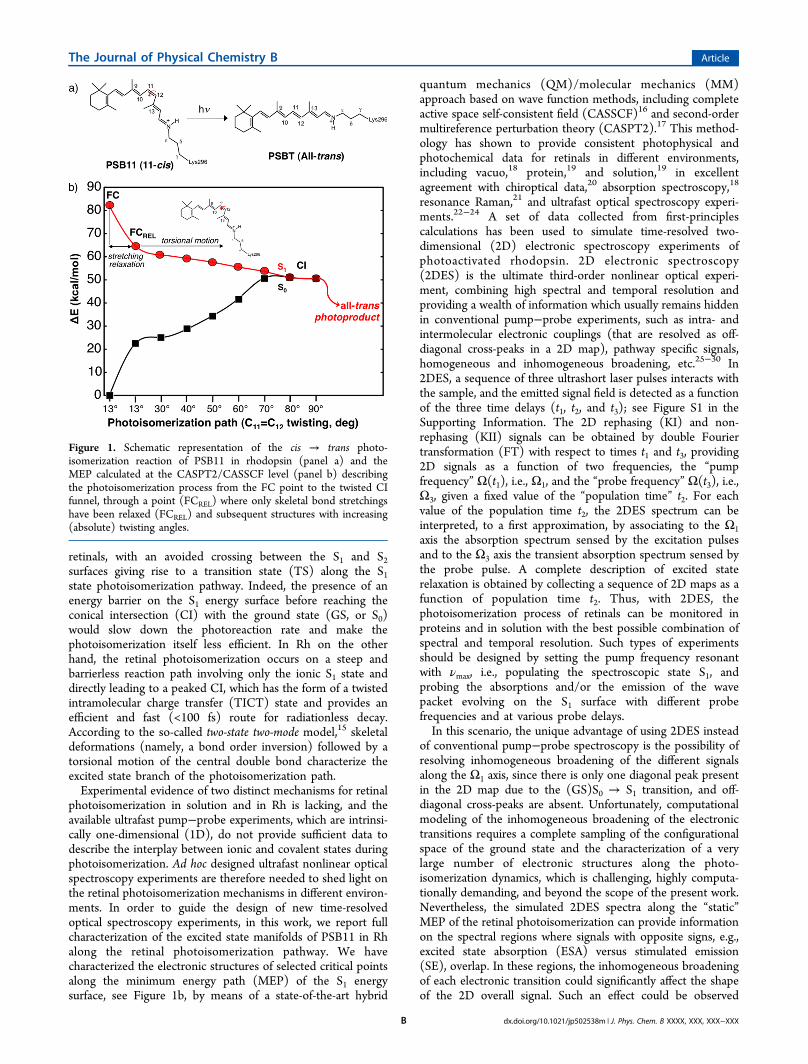
Figure 1. Schematic representation of the cis → trans photo-isomerization reaction of PSB11 in rhodopsin (panel a) and theMEP calculated at the CASPT2/CASSCF level (panel b) describingthe photoisomerization process from the FC point to the twisted CIfunnel, through a point (FCREL) where only skeletal bond stretchingshave been relaxed (FCREL) and subsequent structures with increasing(absolute) twisting angles.
The Journal of Physical Chemistry B Article
dx.doi.org/10.1021/jp502538m | J. Phys. Chem. B XXXX, XXX, XXX−XXXB
experimentally, providing information on the time evolution ofthe 2D signals, which in conjunction with the simulated 2DESspectra reported here could give “time-resolved” atomisticdetails of the retinal photoisomerization reaction in Rh. Reliablecharacterization of temporal evolution of the electronic levelsduring the photoisomerization reaction requires first-principlessimulations. Therefore, accurate simulations of 2DES spectrawill be performed using the sum-over-states (SOS) approach,31
as implemented in our SOS//QM/MM method,32,33 followingthe evolution of the 2DES map along the photoisomerizationpath, otherwise not achievable with a more simple parametrizedapproach based on Frenkel exciton models.32,33 Accuratesimulations of the 2DES spectra have the advantage ofpredicting the detectable 2D signals, allowing the design oftailored experiments suited for observation of specific signals.Despite the accuracy of electronic structure calculations of theMEP points, the simulated 2DES spectra still represent a coarsepicture of the experimental spectra, since here we assume thatduring time intervals t1 and t3 the electronic energy levelsremain fixed, i.e., a “static” snapshot of the photoisomerizingchromophore can be recorded in an experimental 2D spectrum.To follow more precisely the evolution of the electronic excitedstate manifold during a real measurement, a nonadiabaticpropagation of the eigenstates should be performed, but such alevel of complexity is beyond the scope of this work.Here, we focus on the detection of ESA involving low-lying
covalent states of PSB11, because of their relevance in themechanism of retinal photoisomerization. In particular, with theproposed 2DES experiments, it could be possible to detect theS1 → S2 transitions during the photoisomerization anddetermine the fluctuations of the S1/S2 energy gap separation,elucidating the role of the low energy ionic and covalent excitedstates on retinal photoisomerization in Rh. A comparisonbetween analogous 2DES experiments carried out in otherproteins and in solution could finally discriminate betweendifferent photochemical mechanisms of retinal photoisomeriza-tion as a function of the (bio)chemical environment. Finally, ithas been proposed that more elaborate multipulse two-dimensional techniques measuring the fifth-order nonlinearresponse, i.e., “transient” 2DES, could also be very informativefor determining the retinal photoisomerization mechanism indifferent environments.12 The electronic structure calculationsand the simulations of time-resolved 2DES spectra reportedhere represent the groundwork for the design of such elaboratemultipulse spectroscopy experiments.
■ THEORETICAL METHODSElectronic Structure Calculations. Constrained geometry
optimizations were performed along the C10C11C12C13torsion coordinate of the PSB11 ranging from −13° at FC toca. −90° at the CI (absolute values of the twisting angle indegrees are used hereafter) were performed using a combinedCASSCF(12,12)/6-31G*//Amber (QM/MM) approach andthe G09 Berny-algorithm34 through COBRAMM.35 The QMregion was described using Molpro’s CASSCF routines.36 Thewhole π-system of retinal and the N-terminal methylene groupwere considered. The β-ionone ring and its methyl groups weredescribed by Amber99ff parameters.22,37 QM and MM regionswere connected through hydrogen link-atoms,38 the β-iononemoiety and the two water molecules near the Schiff-baseterminus were free to move during optimization, and the rest ofthe protein pocket was kept fixed at their crystal structurepositions.39 The ground state equilibrium structure was
optimized with single state CASSCF considering only S0, andthe torsion path was obtained through state-averaging (SA)involving the S0 and S1 states with equal weight. SA gradientswere computed using Molpro’s CPMCSCF routine. As initialstructures, we used optimized geometries obtained in previouswork.40 On top of the newly optimized structures, QM/MMexcited state calculations were performed with Molcas 7.741
using the SA-CASSCF(12,12)/6-31G* method followed byenergy refinement at the single-state CASPT2 level (hereafternamed CASPT2/CASSCF), including all valence π-electronsand π-orbitals of the chromophore in the active space, with theMM part of the system treated as external point charges in bothCASSCF and CASPT2 calculations. In the CASSCF state-averaging procedure, 70 states were included to ensure thatenough roots are comprised in the CASSCF and CASPT2calculations in order to describe the energy ranges reported forthe 2D spectra. An imaginary shift42 of 0.2 and a zero-orderHamiltonian IPEA shift of 0.0 were used. Transition dipolemoments were calculated at the CASSCF level using the RASSImodule of Molcas 7.7.43
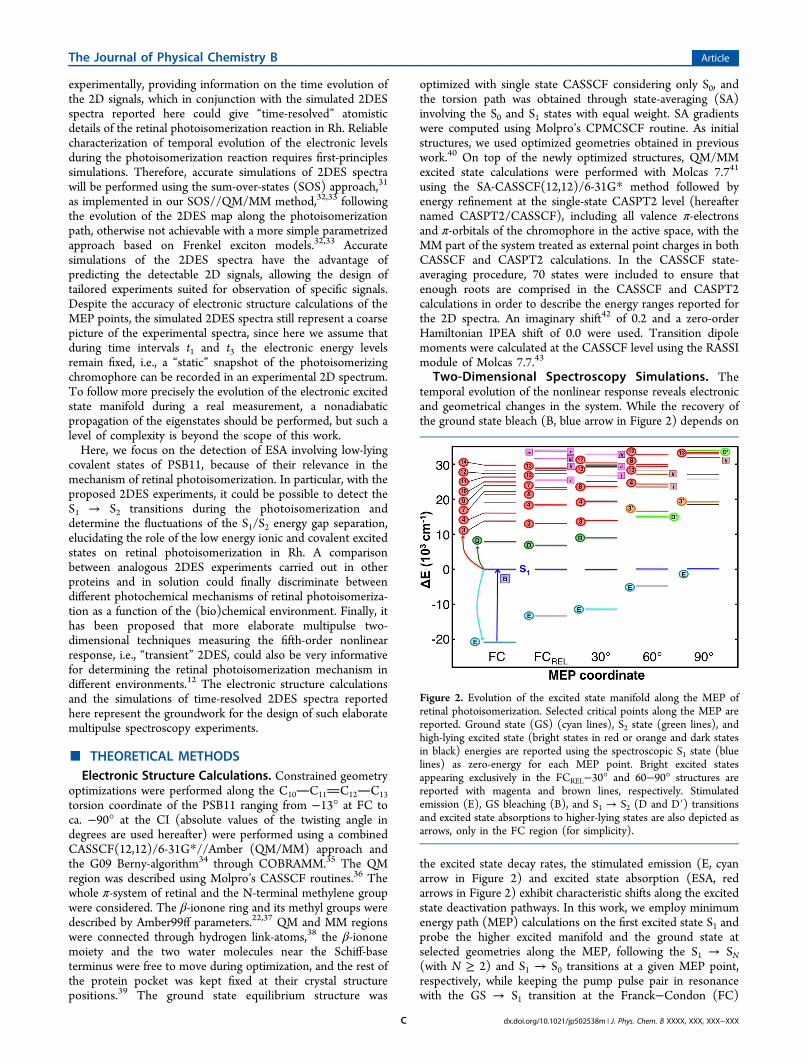
Two-Dimensional Spectroscopy Simulations. Thetemporal evolution of the nonlinear response reveals electronicand geometrical changes in the system. While the recovery ofthe ground state bleach (B, blue arrow in Figure 2) depends on
the excited state decay rates, the stimulated emission (E, cyanarrow in Figure 2) and excited state absorption (ESA, redarrows in Figure 2) exhibit characteristic shifts along the excitedstate deactivation pathways. In this work, we employ minimumenergy path (MEP) calculations on the first excited state S1 andprobe the higher excited manifold and the ground state atselected geometries along the MEP, following the S1 → SN(with N ≥ 2) and S1 → S0 transitions at a given MEP point,respectively, while keeping the pump pulse pair in resonancewith the GS → S1 transition at the Franck−Condon (FC)
Figure 2. Evolution of the excited state manifold along the MEP ofretinal photoisomerization. Selected critical points along the MEP arereported. Ground state (GS) (cyan lines), S2 state (green lines), andhigh-lying excited state (bright states in red or orange and dark statesin black) energies are reported using the spectroscopic S1 state (bluelines) as zero-energy for each MEP point. Bright excited statesappearing exclusively in the FCREL−30° and 60−90° structures arereported with magenta and brown lines, respectively. Stimulatedemission (E), GS bleaching (B), and S1 → S2 (D and D′) transitionsand excited state absorptions to higher-lying states are also depicted asarrows, only in the FC region (for simplicity).
The Journal of Physical Chemistry B Article
dx.doi.org/10.1021/jp502538m | J. Phys. Chem. B XXXX, XXX, XXX−XXXC
point. Evolution in the ground state is neglected; thus, the Bsignal arises by probing the ground state equilibrium geometry.We mainly assume that during time intervals t1 and t3 theelectronic energy levels remain fixed, i.e., their propagation is
slow with respect to the ultrafast measurement, which allowsassociating the electronic structure of a static MEP point withits corresponding 2D spectrum. Additional approximations areadopted: the system evolves coherently along S1 following
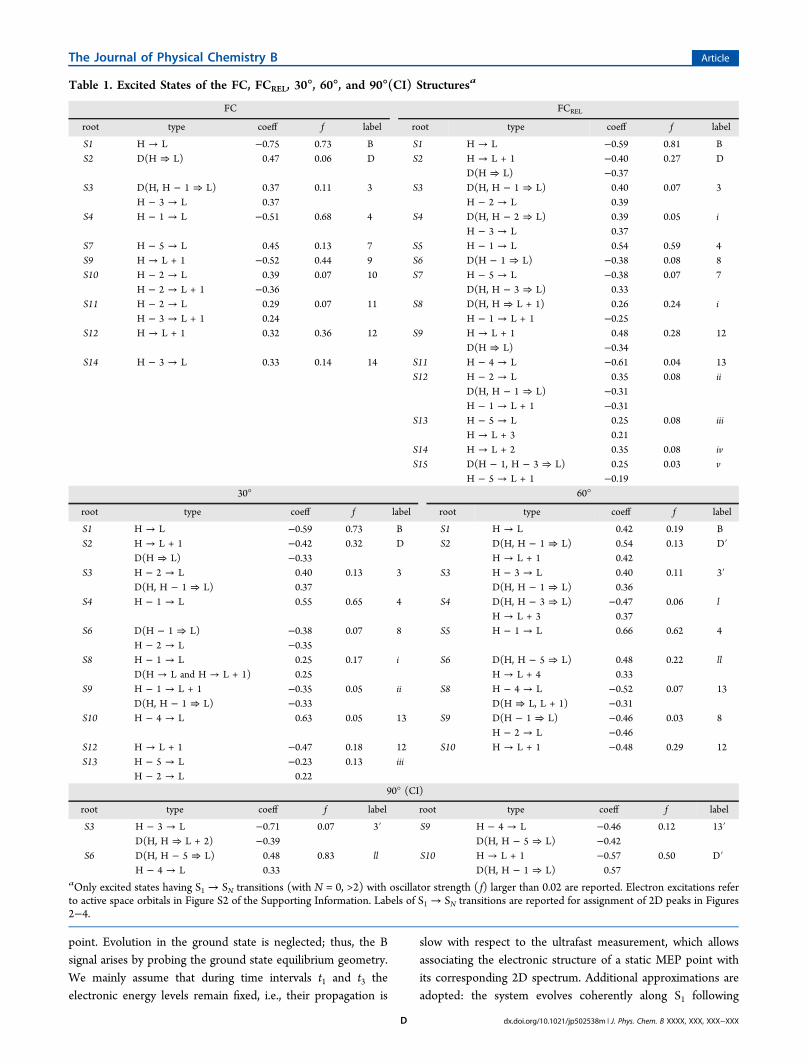
Table 1. Excited States of the FC, FCREL, 30°, 60°, and 90°(CI) Structuresa
FC FCREL
root type coeff f label root type coeff f label
S1 H → L −0.75 0.73 B S1 H → L −0.59 0.81 BS2 D(H ⇒ L) 0.47 0.06 D S2 H → L + 1 −0.40 0.27 D
D(H ⇒ L) −0.37S3 D(H, H − 1 ⇒ L) 0.37 0.11 3 S3 D(H, H − 1 ⇒ L) 0.40 0.07 3
H − 3 → L 0.37 H − 2 → L 0.39S4 H − 1 → L −0.51 0.68 4 S4 D(H, H − 2 ⇒ L) 0.39 0.05 i
H − 3 → L 0.37S7 H − 5 → L 0.45 0.13 7 S5 H − 1 → L 0.54 0.59 4S9 H → L + 1 −0.52 0.44 9 S6 D(H − 1 ⇒ L) −0.38 0.08 8S10 H − 2 → L 0.39 0.07 10 S7 H − 5 → L −0.38 0.07 7
H − 2 → L + 1 −0.36 D(H, H − 3 ⇒ L) 0.33S11 H − 2 → L 0.29 0.07 11 S8 D(H, H ⇒ L + 1) 0.26 0.24 i
H − 3 → L + 1 0.24 H − 1 → L + 1 −0.25S12 H → L + 1 0.32 0.36 12 S9 H → L + 1 0.48 0.28 12
D(H ⇒ L) −0.34S14 H − 3 → L 0.33 0.14 14 S11 H − 4 → L −0.61 0.04 13
S12 H − 2 → L 0.35 0.08 iiD(H, H − 1 ⇒ L) −0.31H − 1 → L + 1 −0.31
S13 H − 5 → L 0.25 0.08 iiiH → L + 3 0.21
S14 H → L + 2 0.35 0.08 ivS15 D(H − 1, H − 3 ⇒ L) 0.25 0.03 v
H − 5 → L + 1 −0.1930° 60°
root type coeff f label root type coeff f label
S1 H → L −0.59 0.73 B S1 H → L 0.42 0.19 BS2 H → L + 1 −0.42 0.32 D S2 D(H, H − 1 ⇒ L) 0.54 0.13 D′
D(H ⇒ L) −0.33 H → L + 1 0.42S3 H − 2 → L 0.40 0.13 3 S3 H − 3 → L 0.40 0.11 3′
D(H, H − 1 ⇒ L) 0.37 D(H, H − 1 ⇒ L) 0.36S4 H − 1 → L 0.55 0.65 4 S4 D(H, H − 3 ⇒ L) −0.47 0.06 l
H → L + 3 0.37S6 D(H − 1 ⇒ L) −0.38 0.07 8 S5 H − 1 → L 0.66 0.62 4
H − 2 → L −0.35S8 H − 1 → L 0.25 0.17 i S6 D(H, H − 5 ⇒ L) 0.48 0.22 ll
D(H → L and H → L + 1) 0.25 H → L + 4 0.33S9 H − 1 → L + 1 −0.35 0.05 ii S8 H − 4 → L −0.52 0.07 13
D(H, H − 1 ⇒ L) −0.33 D(H ⇒ L, L + 1) −0.31S10 H − 4 → L 0.63 0.05 13 S9 D(H − 1 ⇒ L) −0.46 0.03 8
H − 2 → L −0.46S12 H → L + 1 −0.47 0.18 12 S10 H → L + 1 −0.48 0.29 12S13 H − 5 → L −0.23 0.13 iii
H − 2 → L 0.2290° (CI)
root type coeff f label root type coeff f label
S3 H − 3 → L −0.71 0.07 3′ S9 H − 4 → L −0.46 0.12 13′D(H, H ⇒ L + 2) −0.39 D(H, H − 5 ⇒ L) −0.42
S6 D(H, H − 5 ⇒ L) 0.48 0.83 ll S10 H → L + 1 −0.57 0.50 D′H − 4 → L 0.33 D(H, H − 1 ⇒ L) 0.57
aOnly excited states having S1 → SN transitions (with N = 0, >2) with oscillator strength ( f) larger than 0.02 are reported. Electron excitations referto active space orbitals in Figure S2 of the Supporting Information. Labels of S1 → SN transitions are reported for assignment of 2D peaks in Figures2−4.
The Journal of Physical Chemistry B Article
dx.doi.org/10.1021/jp502538m | J. Phys. Chem. B XXXX, XXX, XXX−XXXD
closely the MEP; no population transfer between states occursbefore the CI (i.e., signal intensities depend only on thetransition dipole moments). It should be noted that MEPcalculations do not contain dynamical and temporal informa-tion; therefore, we cannot directly extract time delays. Forsimulation of the 2DES spectra, we have combined the QM/MM methodology, which provides the transition dipolemoments at the CASSCF level and CASPT2 correctedtransition energies, with the SOS approach,31 as implementedin our SOS//QM/MM approach documented elsewhere.32,33
SOS calculations were performed with Spectron 2.7,14
readapting the energy levels calculated at each MEP point inorder to include the GS bleaching (GSB), i.e., by maintainingthe FC S0−S1 energy gap and rigidly shifting all of the SNenergies calculated at the MEP point in order to align the S1energy with the FC S1 energy. A constant dephasing of 200cm−1 has been employed, with finite transform-limitedGaussian pulse envelopes corresponding to a bandwidth of5000 cm−1. Infinite bandwidth pulses have also been used whenspecified. We report the combined rephasing and nonrephasing(KI + KII) signals (hereafter named 2D signals), which haveabsorptive features and can be collected experimentally witheither partially collinear pump−probe geometry44,45 orheterodyne detected three-pulse photon echo configura-tion;46,47 see Figure S1 in the Supporting Information. Spectraare plotted on a logarithmic scale.
■ RESULTS
Excited State Manifolds along the Photoisomeriza-tion Pathway. Figure 2 shows the energy levels of PSB11along the S1 photoisomerization MEP for energies up to 34 000cm−1 (4.2 eV) from the spectroscopic state. The electronicstructures calculated at the CASPT2//CASSCF level arereported from the FC region to the CI (at ∼90° twistingangle), considering a structure where only skeletal bonds havebeen relaxed (FCREL), and two other structures withintermediate cis → trans isomerization angles, i.e., 30 and 60°.In the FC region, the first excited state accessible from thespectroscopic S1 state is the double excitation H⇒ L (hereafterD), i.e., the above-mentioned covalent S2 state (see green bar inFigure 2), located at ∼8000 cm−1 from S1, in agreement withprevious calculations.15 The molecular orbital labels, from H −5 to L + 5, refer to the 12 active space orbitals in theCASSCF(12,12) calculations reported in Figure S2 in theSupporting Information. Above 10 000 cm−1 from S1, the firsttwo excited states encountered are the covalent S3 state,characterized predominantly by double (H, H − 1 ⇒ L) andsingle H − 3 → L excitations, see Table 1, and the ionic S4state, corresponding to a single H − 1 → L excitation. The S1→ S2 and S1 → S3,4 transitions are bright (i.e., with an oscillatorstrength larger than 0.02, see transitions D, 3, and 4 in Figure2) and are expected to appear in the near-infrared (NIR) andthe visible (red) spectral regions, respectively. At higherenergies, in the range 20 000−30 000 cm−1 from S1, severalexcited states are found, generally characterized by singleexcitations into the lowest virtual orbitals (L and L + 1). Inparticular, the S1 → S7 transition (see transition 7 in Figure 2)has a transition energy close to the fundamental S0 → S1transition frequency in the blue-green region of the visiblespectrum, while higher-lying excited states, i.e., S9−12 and S14,give rise to a series of ESA bands in the violet and near-UVspectral regions (see transitions 9−12 and 14 in Figure 2).
Upon photoexcitation to the spectroscopic S1 state, theretinal chromophore undergoes skeletal relaxation15 inducingbond order inversion and formation of a (transient) relaxedstate (FCREL), which is characterized by an elongated C11−C12(“originally double”) bond which allows barrier-less rotationdriving the 11-cis → all-trans isomerization. As shown in Figure2, the photoinduced skeletal relaxation induces some significantchanges in the electronic structure of the chromophore. Asexpected, the S0/S1 energy gap is reduced due to the relaxationalong the S1 surface, with consequent red-shift of the S1 → S0SE (hereafter E, see cyan line in Figure 2). The relativepositions of the covalent S2 and S3 states with respect to S1 arenot significantly affected by the bond relaxation, and thecorresponding transitions from S1 result in being just slightlyred-shifted with respect to FC. It is worth noting, however, thatupon bond relaxation the single H → L + 1 excitation providesa significant contribution to the covalent S2 state and the H − 2→ L excitation contributes to the S3 state. In contrast, theskeletal relaxation induces a blue-shift of transition 4 by ∼2000cm−1. Interestingly, above 20 000 cm−1, the double H − 1 ⇒ Lexcitation, corresponding to the S8 state in the FC manifold(and the S6 state in FCREL), gives rise to a bright transition(transition 8) which falls in the same spectral region oftransition 7 and close to the fundamental S0 → S1 transitionfrequency. Analogously, the single H − 4 → L excitation (theS13 state in the FC manifold and the S11 state in FCREL) givesrise to a bright transition just below 30 000 cm−1 (see transition13 in Figure 2), which, in return, is dark (i.e., with an oscillatorstrength smaller than 0.02) in the FC region. It is worth notingthat skeletal relaxation also induces stabilization of some high-lying excited states that were not present in the FC regionbetween 25 000 and 34 000 cm−1 from S1 (see magenta lines inFigure 2, i.e., transitions i−v).Starting from the relaxed FCREL structure, the chromophore
undergoes rotation about the C11−C12 bond until reaching thetwisted CI, at a torsional angle of ∼90°. Here, we analyze thevariations of the excited state manifold induced by this torsionalmotion. At 30°, we find the electronic structure of thechromophore almost unchanged with respect to the FCRELstructure, with a slightly less rich excited state manifold due tothe disappearance of the transition 7 ESA band. All theconserved ESA bands, including transitions D, 3−4, 8, 12−13,and i−iii, are slightly blue-shifted with respect to the FCRELstructure, while, as expected, the SE keeps red-shifting. Incontrast to the first 30° rotation, a subsequent torsion of 30°induces significant changes in the excited state manifold of thechromophore. In fact, at 60° from the FCREL structure, most ofthe ESA bands are significantly blue-shifted (>2700 cm−1) withrespect to the 30° structure. Interestingly, at 60°, we observe asignificant localization of the CASSCF active orbitals whichsignificantly affects some of the ESAs. In particular, the firstexcited state above S1 is now characterized mainly by the singleH → L + 1 and double (H, H − 1 ⇒ L) excitations; see Table1. The S2 state still maintains its covalent character, but thetransition from S1 (hereafter named transition D′) blue-shiftsby ∼6000 cm−1 with respect to the 30° structure. At 60°, the S3state is mainly characterized by the H − 3 → L excitation (incontrast to H − 2 → L at 30°) and the transition from S1(hereafter named transition 3′) is blue-shifted by ∼2750 cm−1
with respect to its energy at 30°, now falling nearby the D′transition, in the red region of the visible spectrum (at ∼15 000cm−1). At energies above 20 000 cm−1 from S1, excited stateswith mainly double excitation nature are found, see Table 1,
The Journal of Physical Chemistry B Article
dx.doi.org/10.1021/jp502538m | J. Phys. Chem. B XXXX, XXX, XXX−XXXE
with corresponding bright transitions (named l and ll, seebrown lines in Figure 2) lying at ∼23 500 and ∼27 200 cm−1
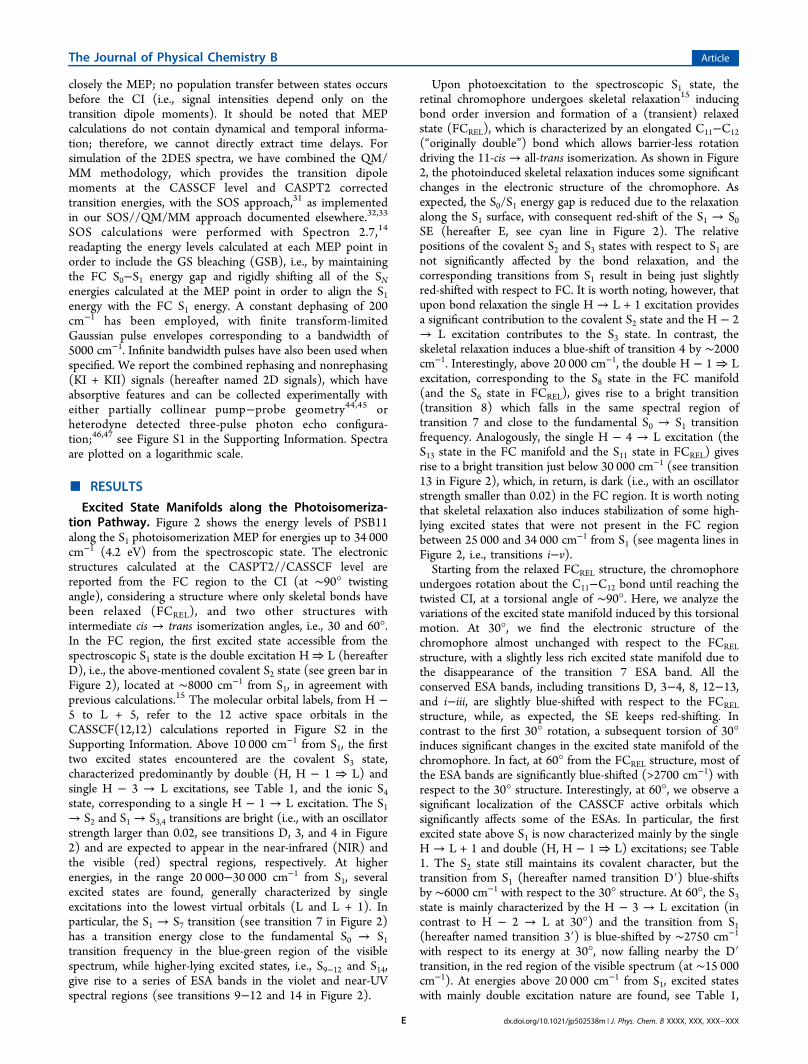
and transitions 4 and 8 being blue-shifted to ∼24 300 and∼30 000 cm−1, respectively, while transition 13 remainsunaffected. It should be noted that also the SE is significantlyaffected at 60°, red-shifting to the near-IR, well below 10 000cm−1 (i.e., 1 μm). Finally, at the CI structure with a twistingangle of 90°, only a few bright transitions survive, includingtransitions 3′, ll, 13, and D′. All the surviving ESA bandssubstantially blue-shift with respect to the 60° structure, inparticular transition D′, which now lies in the near-UV at∼33 800 cm−1. Particularly at the CI, transition 3′ falls nearbythe fundamental S0 → S1 transition frequency and is expectedto overlap with the GSB.Two-Dimensional Electronic Spectra. In the above
section, we have shown the changes of the electronic structureof retinal embedded in the Rh protein along the S1isomerization pathway, resulting in several ESA bands fromS1 to higher states, as well as an SE band from S1 to S0, whichpeak at frequencies that change very rapidly in time. Suchdramatic spectral evolution of the photoinduced signals can befollowed in real time using several advanced ultrafast spectros-copy techniques, such as broadband pump−probe spectroscopyor 2DES. The advantage of 2DES over pump−probe is that thenonlinear response can be resolved along the pump frequency(Ω1), allowing characterization of cross-peaks and inhomoge-neous broadenings of each electronic transition. In retinalphotoisomerization there is a unique spectroscopic state (S1)on which the photochemical reaction is known to take place. Inthe present work, thus, we are not interested in cross-peaks thatarise from electronic coupling between different excited states(e.g., S1−S2, S1−S3 off-diagonal peaks, etc.), since theircharacterization requires population of higher excited states(S2, S3, etc.) that have unknown photophysical or photo-chemical pathways. We thus focus on the ESA and SE signals ofthe wave packet evolving only along the S1 photoisomerizationpathway. In this work, we report 2D spectra that can beexperimentally collected with either the partially collinearpump−probe geometry44,45 or the heterodyne detected three-pulse photon echo experimental setups,46,47 using the simplestnonchiral xxxx polarization scheme.Broadband 2D Spectra. In the previous section, we have
described the evolution of the excited state manifold along theMEP of the photoisomerization, considering those excitedstates located below 34 000 cm−1 from S1. In order to visualizethe energy positions of these electronic transitions, the possibleoverlaps between signals and the energy shifting trends of someimportant transitions, we report in Figure 3 the broadband2DES spectra calculated using all three laser pulses centered atthe absorption maximum frequency of the chromophore (νmax,calculated to be at 20 875 cm−1 at the CASPT2/CASSCF level)with infinitely broad bandwidth. Infinitely broad pulses revealall signals that are “ideally” detectable, helping in the selectionof experimental parameters (i.e., central probe frequencies andpulse bandwidths) to be used in tailored experiments for thedetection of desired electronic transitions.Figure 3 shows the broadband 2DES spectra at the FC
region, i.e., at t2 = 0, with the negative signals of both GSS(peak B) and SE (peak E) overlapping at Ω3 = 20 875 cm−1,i.e., the absorption maximum frequency νmax, and severalpositive signals associated with ESA bands in the Ω3 range from8000 to 33 000 cm−1. Following the evolution of the excitedstate manifolds described in the previous section, all of the 2D
signals but the GSB are expected to shift along the MEP duringthe photoisomerization process. The simulations of 2D spectraat t2 > 0 are performed on selected geometries of the “static”MEP that cannot be directly associated with effective values ofthe excited state evolution time t2. However, comparison of thereported 2DES spectra with experimental data could allowassociation of probe delay times with PSB11 structures,providing unprecedented atomistic details of the retinalphotoisomerization.The transition from S1 to the covalent S2 state (see green
boxes in Figure 3, peak D) appears as a positive signal at ∼8000cm−1 in the NIR at the FC region. Its transition energy doesnot change significantly upon skeletal relaxation (small red-shiftof 1100 cm−1) and 30° C11−C12 bond rotation (blue-shift of1000 cm−1 with respect to FC). A strong blue-shift of the S1 →S2 transition is, instead, observed at a twisted angle of 60°,where the electronic excitation contributing to the covalent S2state changes and the corresponding ESA (peak D′) appears inthe visible at ∼15 160 cm−1. At the twisted CI, the S2 state ishighly destabilized and the peak D′ lies at very high energies(>30 000 cm−1), in the near-UV.The S1 → S3 transition (peak 3) behaves similarly to the S1
→ S2 transition along the photoisomerization path. In fact, upto 30°, its transition energy is almost unchanged (between 13100 and 13 900 cm−1) with respect to its value in the FC region(i.e., 13 820 cm−1), while a pronounced blue-shift of ∼2500cm−1 is observed at 60°, with corresponding changes in theelectronic excitations contributing to the S3 state. Here, peak 3′is found close to peak D′ in the red of the visible spectrum. Atthe CI, the S1 → S3 transition is further blue-shifted but it lies atmuch lower energies than the S1 → S2 transition, being locatedat ∼18 000 cm−1, in proximity to the GSB (B). Indeed, thebroadband 2DES spectrum at the CI reported in Figure 3indicates that the positive peak 3′ is canceled by overlap withthe strong negative B signal. It is worth noting that peak 3disappears in the FCREL broadband spectrum. This is due to theprogressive red-shift of the SE which bumps into low-lying ESAbands that concurrently red-shift during the photoisomerizationreaction. Such a signal quenching effect is observed for the S1→ S3 transition at the FCREL structure, and it is expected for the
Figure 3. Broadband 2DES spectra obtained with infinitely broad laserpulses, using the xxxx nonchiral polarization scheme. 2D spectra arereported for the selected MEP point from the FC to the CI (at ∼90°).The complex part of the signal is plotted on a logarithmic scale. Thetransitions are labeled according to the Figure 2 assignment, withgreen and light green boxes highlighting the D and D′ (S1 → S2)transitions, respectively.
The Journal of Physical Chemistry B Article
dx.doi.org/10.1021/jp502538m | J. Phys. Chem. B XXXX, XXX, XXX−XXXF
S1 → S2 transition at twisting angles slightly larger than 30°, i.e.,∼35°.The S1 → S4 transition (peak 4) is found as a positive signal
at Ω3 ≈ 16 000 cm−1 in the FC region, and differently frompeaks D and 3, it blue-shifts by ∼2100 cm−1 upon bondrelaxations. Therefore, the overlap of (positive) peak 4 with thered-shifted (negative) SE is expected to happen at the earlieststages of the photoisomerization, i.e., during the skeletalrelaxation and before the bond inversion is completed,corresponding to an energy range of 16 000−18 000 cm−1.This result is fully consistent with broadband pump−probeexperiments that show the absence of signals in the 16 000−18 000 cm−1 range (555−625 nm, in wavelength) at early probedelays, where actually the initial SE was expected to showup.22−24 Moreover, at energies >18 000 cm−1, in the spectralregion of the absorption maximum νmax, the experimental dataat probe delays <75 fs shows the presence of a broad ESA bandand its overlap with the GSB signal. Our results also indicatethat, in this region of the spectra and at early probe delays (fortwisting angles <60°), the negative B signal overlaps with theblue-shifting peak 4 and other two ESAs. Remarkably, at 60°,the calculated 2DES spectrum shows an almost unperturbednegative B signal and the positive peaks D′ and 3 at ∼15 200and ∼16 500 cm−1, respectively, in very nice agreement withultrafast pump−probe spectroscopy data at around 75 fs probedelay, showing the recovery of the GSB and the appearance ofpositive signals at energies below 17 400 cm−1 (wavelengths>575 nm), with two small spots appearing at ∼16 000 and∼16 900 cm−1. Finally, our 2D spectrum at the twisted CIsuggests that the only surviving bright ESA band is the S1 → S3transition (peak 3′), whose positive intensity is vanishing due tooverlap with the negative B signal. No signals are observedbelow 19 000 cm−1, and the first detectable ESA is in the near-UV, above 30 000 cm−1, in agreement with pump−probeexperiments revealing the presence of just GSB negative signaland the formation of the photoinduced ground state absorptionband of the rhodopsin photoproduct in the CI region.In summary, we showed that the broadband 2DES spectra,
obtained using the excited state manifolds calculated at theCASPT2/CASSCF level along the MEP of the retinalphotoisomerization, provide useful information on theevolution of ESA signals and their overlap with the SE andGSB signals with opposite sign, in good agreement with theavailable broadband pump−probe spectroscopy data. In thefollowing section, we consider realistic 2DES combinations ofpulse frequencies and bandwidths that can provide usefulinformation on the evolution of specific ESA bands duringretinal photoisomerization, including excitations from S1 tolow-lying covalent states that have been proposed to interplaywith the spectroscopic state in the photoisomerization of retinalin solution.One- and Two-Color 2D Spectra. The simplest 2DES
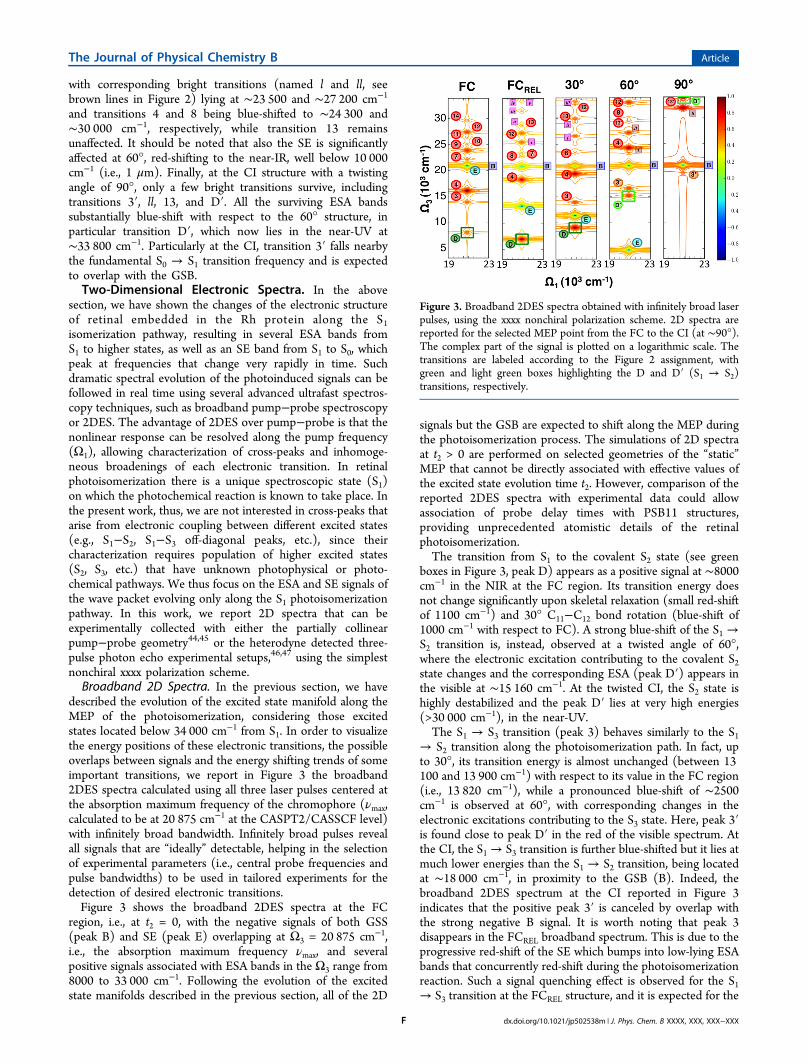
combination of pulses that can be considered involves identicalpump and probe pulses (one-color setup), with all frequenciescentered at the absorption maximum of the chromophore, νmax.Figure 4a shows the calculated 2DES spectra simulating suchone-color experiment with the pulses’ bandwidth of 5000 cm−1.The major contribution to all one-color spectra is, as expected,the negative GSB signal at Ω3 = νmax = 20 875 cm−1, peak B. Atthe FC region, the GSB is accompanied by the SE (at identicalfrequency) but the simulated 2D spectrum indicates that theexpected strong negative peak is partially overlapping with apositive ESA band, peak 7 at ∼22 000 cm−1, inducing depletion
of the signal and a tiny asymmetry along the Ω3 frequency axis.At very early probe delays, the wave packet leaves the FCregion and the simulated 2DES spectra at the FCREL and 30°structures indicate that the negative GSB signal will besignificantly depleted by a concomitant red-shift of the negativepeak E, blue-shift of the positive peak 4 that is approachingνmax, and lasting positive peaks 7 (at FCREL) and 8 (at FCRELand 30°). At twisting angles ≥60°, the GSB signal is almostunperturbed due to the further blue-shift of the ESA band 4,which at 60° lies already at energies >24 000 cm−1. At the CI,peak B almost recovers the shape of the 2D isolated signal witha tiny perturbation at energies below νmax due to the presenceof the blue-shifted S1 → S3 transition. The simulated 2DESspectra along the MEP reported in Figure 4a suggest that with aone-color setup it is possible to observe modulation of the GSBsignal at early stages of the photoisomerization, as affected bythe evolution of high-lying ESA bands (i.e., the transitions S1 →S4, 7−8 in the FC). Probe frequencies lower than νmax arenecessary in order to track the energy gaps between the S1 stateand low-lying covalent excited states (such as S2 and S3), and atwo-color setup is required.Figure 4b shows the calculated 2D spectra from the FC to
the CI region, simulating a time-resolved two-color 2DESexperiment with pump pulses centered at νmax (Ω1 = 20 875cm−1) and probe pulses centered at Ω3 = 15 000 cm−1, in thered region of the visible spectrum. In the FC region, the S1 →S3 and S1 → S4 transitions, i.e., peaks 3 and 4, are clearlyresolved at ∼13 800 and ∼16 000 cm−1, respectively, but uponbond relaxation, the red-shifted SE burns the positive peak 3,while peak 4 blue-shifts to the green, at ∼18 100 cm−1, andremains detectable. The positive S1 → S3 signal will recover inthe two-color spectrum upon torsional motion that further red-shifts the negative E signal. Before reaching the CI region,where the two-color 2D spectrum is essentially signal-free, theD′ transition rapidly shifts to the red and both peaks 3′ and D′are clearly resolved at 60°. The reported two-color 2DESspectrum at 90° suggests that peak 3′ should also be resolved atthe CI structure when using a probe pulse centered at 15 000cm−1 with a bandwidth of 5000 cm−1. The proposed two-color
Figure 4. 2D (xxxx) spectra obtained with the one-color 2DVis (panela) and the two-color 2DVis (panel b) setups. 2D spectra are reportedfor the selected MEP point from the FC to the CI (at ∼90°). Thecomplex part of the signal is plotted on a logarithmic scale. Thetransitions are labeled according to the Figure 2 assignment. Blackboxes indicate the 5000 cm−1 bandwidth that was used.
The Journal of Physical Chemistry B Article
dx.doi.org/10.1021/jp502538m | J. Phys. Chem. B XXXX, XXX, XXX−XXXG
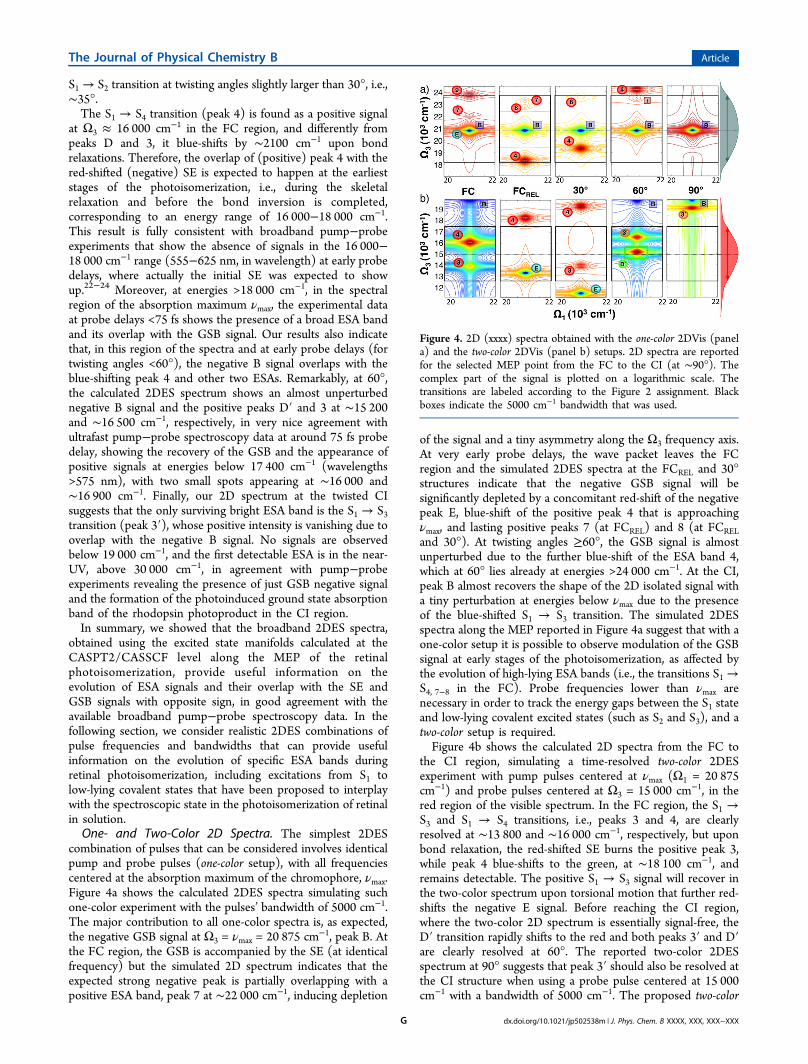
2DES combination of pulse frequencies allows, indeed, to trackthe energy gaps between the S1 state and the low-lying excitedstates S2−4 along the retinal photoisomerization pathway.However, the important S1 → S2 transition (peak D′) appearsin this detection spectral window only for twisting angles closeto 60°, where the covalent S2 state partially changes its doubleexcitation nature (see previous section), and this transition isexpected to move from ∼9000 to ∼33 000 cm−1 while goingfrom 30 to 90°. Thus, the D′ signal is expected to blue-shiftvery rapidly from the near-IR to the UV, suggesting that itcould be difficult to really track the S1 → S2 transition with atwo-color 2DES setup and detection in the visible. On theother hand, CASPT2/CASSCF calculations suggest that theposition of the covalent S2 state relative to the spectroscopic S1state remains almost invariant up to 30° twisting angle, with S1→ S2 transition energies varying from 6900 to 9000 cm−1 in theNIR. Therefore, here we propose an alternative two-color 2Dsetup especially suited to track the S1 → S2 transition during theearly stage of the photoisomerization reaction, with pumppulses centered at νmax and probe pulses in the NIR.Figure 5 shows the simulated 2DES spectra for MEP
structures from the FC to 60°, with NIR probe pulses centered
at Ω3 = 10 000 cm−1 (i.e., 1 μm in wavelength) and abandwidth of 5000 cm−1, corresponding to a transform-limitedpulse duration of ∼3 fs. Such tunable broadband pulses can begenerated from optical parametric amplifiers.48 With this two-color setup, peak D is clearly resolved at ∼8000, ∼6900, and∼9000 cm−1, for the FC, FCREL, and 30° structures,respectively. In particular, both peaks E and D are near theprobe central frequency at 30°, indicating that the probefrequency maximum is set very close to the region where theoverlap between SE and S1 → S2 ESA transition will occur.Unfortunately, the available pump−probe data do not coverenergy values below 10 000 cm−1, and direct observation of theS1 → S2 transition at early probe delays has not been achievedyet. In the computed 2DES spectra, the evolution of the S1 →S3 transition can also be detected from the FC to 60° structure,including its overlap with the E signal. The two-color 2DESsetup with NIR probing, thus, appears to be best suited forproviding a clear picture of the evolution of the S1 → S2 and S1→ S3 transitions, including their overlap with SE, along theretinal photoisomerization in rhodopsin.
■ CONCLUSIONS
In this work, we analyze the electronic structure changes of theretinal chromophore in bovine rhodopsin along its photo-isomerization pathway by characterizing the manifolds of theexcited states at critical points of the MEP along the S1 energysurface, from the FC region to the twisted CI. The electronicstructure calculations based on multiconfigurational ab initiotechniques within a hybrid QM/MM scheme reveal that the S1/S0 energy gap rapidly decreases during the photoinducedskeletal relaxation of the polyene chain, while the evolution ofexcited state S1 → SN (with N ≥ 2) absorption energies featuresa remarkable blue-shift only after bond inversion and partialrotation along the cis → trans isomerization angle, i.e., fortwisting angles larger than 30°. We report simulated time-resolved 2DES spectra to track the evolution of the S1 → S0 SEred-shift and ESA blue-shifts along the MEP. A set ofbroadband 2DES spectra are reported considering laser pulseswith infinite bandwidth, providing a useful picture of the overalldetectable 2D signals from the NIR to the near-UV frequencydomains. Three different 2D combinations of pulse frequencieshave been considered in order to follow the evolution ofspecific signals: a one-color setup with all pulses centered at theabsorption maximum frequency of the chromophore in theblue-green region of the visible (one-color 2DES), a two-colorsetup with probe pulse centered in the red (two-color 2DVis),and a two-color setup with probe pulses centered in the NIR(two-color 2DVis/NIR). We show that a modulation of theGSB signal due to the overlap with high-lying ESA bands, i.e.,transitions S1 → S4,7−8, can be observed at early stages of theretinal photoisomerization using a one-color 2DVis setup. Totrack, instead, the energy gaps between the S1 state and the low-lying covalent excited states (such as S2 and S3), a two-colorsetup is required. The simulated 2D spectra for the two-color2DVis setup reveal that the signal quenching of the S1 → S3ESA, due to overlap with the red-shifted SE, can be detected inthe red spectral window at early probe delays, while the S1 → S2transition is unlikely to be observed due to the large and rapidblue-shift of this signal at twisting angles larger than 30°. The S1→ S2 transition is particularly relevant because it provides directmeasurement of the S1/S2 energy gap separation along thephotoisomerization path, a parameter that could play a crucialrole in slowing down the photoreactivity, determining thephotoisomerization mechanism of retinal in solution. Finally,we show that the two-color 2DVis/NIR setup is best suited fortracking the evolution of the S1 → S2 and S1 → S3 transitionsalong the retinal photoisomerization pathway, and weencourage performing such type of experiments for elucidationof the molecular mechanisms that drive different behaviors ofretinal photoisomerization in various environments. Thereported results are consistent with the available time-resolved1D pump−probe experimental data, providing fundamentalinformation for the design of new time-resolved 2D experi-ments and laying the groundwork for simulation of moreelaborate multipulse sequences, such as in transient 2Delectronic spectroscopy.
■ ASSOCIATED CONTENT
*S Supporting InformationSchematic representations of different 2DES experimentalsetups, CASSCF(12,12) active space orbitals, and Cartesiancoordinates. This material is available free of charge via theInternet at http://pubs.acs.org.
Figure 5. 2D (xxxx) spectra obtained with the two-color 2DVis/NIRsetup. 2D spectra are reported for the selected MEP point from the FCto the 60° structure. The complex part of the signal is plotted on alogarithmic scale. The transitions are labeled according to the Figure 2assignment. Black boxes indicate the 5000 cm−1 bandwidth used.
The Journal of Physical Chemistry B Article
dx.doi.org/10.1021/jp502538m | J. Phys. Chem. B XXXX, XXX, XXX−XXXH

■ AUTHOR INFORMATION
Corresponding Authors*E-mail: [email protected]. Phone: +33 04 72 72 88 43.*E-mail: [email protected]. Phone: +39 051 20 9 9476.*E-mail: [email protected].
Author ContributionsThe manuscript was written through contributions of allauthors. All authors have given approval to the final version ofthe manuscript.
NotesThe authors declare no competing financial interest.
■ ACKNOWLEDGMENTS
G.C. and M.G. acknowledge support by the European ResearchCouncil Advanced Grant STRATUS (ERC-2011-AdG No.291198). S.M. gratefully acknowledges the support of theNational Institute of Health Grant No. GM-59230 and theNational Science Foundation through Grant No. CHE-1058791.
■ REFERENCES(1) Stenkamp, R. E.; Filipek, S.; Driessen, C. A. G. G.; Teller, D. C.;Palczewski, K. Crystal Structure of Rhodopsin: A Template for ConeVisual Pigments and Other G Protein-Coupled Receptors. Biochim.Biophys. Acta, Biomembr. 2002, 1565, 168−182.(2) Salom, D.; Lodowski, D. T.; Stenkamp, R. E.; Le Trong, I.;Golczak, M.; Jastrzebska, B.; Harris, T.; Ballesteros, J. A.; Palczewski,K. Crystal Structure of a Photoactivated Deprotonated Intermediate ofRhodopsin. Proc. Natl. Acad. Sci. U.S.A. 2006, 103, 16123−16128.(3) Palczewski, K.; Kumasaka, T.; Hori, T.; Behnke, C. A.;Motoshima, H.; Fox, B. A.; Le Trong, I.; Teller, D. C.; Okada, T.;Stenkamp, R. E.; et al. Crystal Structure of Rhodopsin: A G Protein-Coupled Receptor. Science 2000, 289, 739−745.(4) Li, J.; Edwards, P. C.; Burghammer, M.; Villa, C.; Schertler, G. F.X. Structure of Bovine Rhodopsin in a Trigonal Crystal Form. J. Mol.Biol. 2004, 343, 1409−1438.(5) Nakamichi, H.; Okada, T. Local Peptide Movement in thePhotoreaction Intermediate of Rhodopsin. Proc. Natl. Acad. Sci. U.S.A.2006, 103, 12729−12734.(6) Nakamichi, H.; Okada, T. Crystallographic Analysis of PrimaryVisual Photochemistry. Angew. Chem., Int. Ed. 2006, 45, 4270−4273.(7) Choe, H. W.; Kim, Y. J.; Park, J. H.; Morizumi, T.; Pai, E. F.;Krauss, N.; Hofmann, K. P.; Scheerer, P.; Ernst, O. P. Crystal Structureof Metarhodopsin Ii. Nature 2011, 471, 651−U137.(8) Birge, R. R. Photophysics and Molecular Electronic Applicationsof the Rhodopsins. Annu. Rev. Phys. Chem. 1990, 41, 683−733.(9) Briand, J.; Bram, O.; Rehault, J.; Leonard, J.; Cannizzo, A.;Chergui, M.; Zanirato, V.; Olivucci, M.; Helbing, J.; Haacke, S.Coherent Ultrafast Torsional Motion and Isomerization of aBiomimetic Dipolar Photoswitch. Phys. Chem. Chem. Phys. 2010, 12,3178−3187.(10) Lumento, F.; Zanirato, V.; Fusi, S.; Busi, E.; Latterini, L.; Elisei,F.; Sinicropi, A.; Andruniow, T.; Ferre, N.; Basosi, R.; et al. QuantumChemical Modeling and Preparation of a Biomimetic PhotochemicalSwitch. Angew. Chem., Int. Ed. 2007, 46, 414−420.(11) Baylor, D. How Photons Start Vision. Proc. Natl. Acad. Sci.U.S.A. 1996, 93, 560−565.(12) Rivalta, I.; Nenov, A.; Garavelli, M. Modelling RetinalChromophores Photoisomerization: From Minimal Models in Vacuoto Ultimate Bidimensional Spectroscopy in Rhodopsins. Phys. Chem.Chem. Phys. 2014, DOI: 10.1039/c3cp55211j.(13) Schulten, K.; Humphrey, W.; Logunov, I.; Sheves, M.; Xu, D.Molecular Dynamics Studies of Bacteriorhodopsin’s Photocycles. Isr. J.Chem. 1995, 35, 447−464.
(14) Gai, F.; Hasson, K. C.; McDonald, J. C.; Anfinrud, P. A.Chemical Dynamics in Proteins: The Photoisomerization of Retinal inBacteriorhodopsin. Science 1998, 279, 1886−1891.(15) Gonzalez-Luque, R.; Garavelli, M.; Bernardi, F.; Merchan, M.;Robb, M. A.; Olivucci, M. Computational Evidence in Favor of a Two-State, Two-Mode Model of the Retinal Chromophore Photo-isomerization. Proc. Natl. Acad. Sci. U.S.A. 2000, 97, 9379−9384.(16) Roos, B. O. Ab Initio Methods in Quantum Chemistry: Part II;Wiley: Chichester, U.K., 1987.(17) Andersson, K.; Malmqvist, P. A.; Roos, B. O. 2nd-OrderPerturbation-Theory with a Complete Active Space Self-ConsistentField Reference Function. J. Chem. Phys. 1992, 96, 1218−1226.(18) Rajput, J.; Rahbek, D. B.; Andersen, L. H.; Hirshfeld, A.; Sheves,M.; Altoe, P.; Orlandi, G.; Garavelli, M. Probing and Modeling theAbsorption of Retinal Protein Chromophores in Vacuo. Angew. Chem.,Int. Ed. 2010, 49, 1790−1793.(19) Altoe, P.; Stenta, M.; Bottoni, A.; Garavelli, M. A Tunable Qm/Mm Approach to Chemical Reactivity, Structure and Physico-Chemical Properties Prediction. Theor. Chem. Acc. 2007, 118, 219−240.(20) Buss, V.; Kolster, K.; Terstegen, F.; Vahrenhorst, R. AbsoluteSense of Twist of the C12-C13 Bond of the Retinal Chromophore inRhodopsin-Semiempirical and Nonempirical Calculations of Chirop-tical Data. Angew. Chem., Int. Ed. 1998, 37, 1893−1895.(21) Garavelli, M.; Negri, F.; Olivucci, M. Initial Excited-StateRelaxation of the Isolated 11-Cis Protonated Schiff Base of Retinal:Evidence for in-Plane Motion from Ab Initio Quantum ChemicalSimulation of the Resonance Raman Spectrum. J. Am. Chem. Soc.1999, 121, 1023−1029.(22) Polli, D.; Altoe, P.; Weingart, O.; Spillane, K. M.; Manzoni, C.;Brida, D.; Tomasello, G.; Orlandi, G.; Kukura, P.; Mathies, R. A.; et al.Conical Intersection Dynamics of the Primary PhotoisomerizationEvent in Vision. Nature 2010, 467, 440−U88.(23) Peteanu, L. A.; Schoenlein, R. W.; Wang, Q.; Mathies, R. A.;Shank, C. V. The 1st Step in Vision Occurs in Femtoseconds -Complete Blue and Red Spectral Studies. Proc. Natl. Acad. Sci. U.S.A.1993, 90, 11762−11766.(24) Schoenlein, R. W.; Peteanu, L. A.; Mathies, R. A.; Shank, C. V.The 1st Step in Vision - Femtosecond Isomerization of Rhodopsin.Science 1991, 254, 412−415.(25) Mukamel, S. Principles of Nonlinear Optical Spectroscopy; OxfordUniversity Press: New York, 1995.(26) Hamm, P.; Zanni, M. Concepts and Methods of 2d InfraredSpectroscopy; Cambridge University Press: Cambridge, U.K., 2011.(27) Zhuang, W.; Hayashi, T.; Mukamel, S. Coherent Multidimen-sional Vibrational Spectroscopy of Biomolecules: Concepts, Simu-lations, and Challenges. Angew. Chem., Int. Ed. 2009, 48, 3750−3781.(28) Zanni, M. T.; Hochstrasser, R. M. Two-Dimensional InfraredSpectroscopy: A Promising New Method for the Time Resolution ofStructures. Curr. Opin. Struct. Biol. 2001, 11, 516−522.(29) Mukamel, S. Multidimensional Femtosecond CorrelationSpectroscopies of Electronic and Vibrational Excitations. Annu. Rev.Phys. Chem. 2000, 51, 691−729.(30) West, B. A.; Moran, A. M. Two-Dimensional ElectronicSpectroscopy in the Ultraviolet Wavelength Range. J. Phys. Chem. Lett.2012, 3, 2575−2581.(31) Chen, G. H.; Mukamel, S.; Beljonne, D.; Bredas, J. L. TheCoupled Electronic Oscillators Vs the Sum-over-States Pictures for theOptical Response of Octatetraene. J. Chem. Phys. 1996, 104, 5406−5414.(32) Rivalta, I.; Nenov, A.; Cerullo, G.; Mukamel, S.; Garavelli, M. AbInitio Simulations of Two-Dimensional Electronic Spectra: The Sos//Qm/Mm Approach. Int. J. Quantum Chem. 2014, 114, 85−93.(33) Nenov, A.; Rivalta, I.; Cerullo, G.; Mukamel, S.; Garavelli, M.Disentangling Peptide Configurations Via Two-Dimensional Elec-tronic Spectroscopy: Ab Initio Simulations Beyond the FrenkelExciton Hamiltonian. J. Phys. Chem. Lett. 2014, 5, 767−771.(34) Frisch, M. J.; Trucks, G. W.; Schlegel, H. B.; Scuseria, G. E.;Robb, M. A.; Cheeseman, J. R.; Scalmani, G.; Barone, V.; Mennucci,
The Journal of Physical Chemistry B Article
dx.doi.org/10.1021/jp502538m | J. Phys. Chem. B XXXX, XXX, XXX−XXXI
B.; Petersson, G. A.; et al. Gaussian 09, revision A.1; Gaussian, Inc.:Wallingford, CT, USA, 2009.(35) Altoe, P.; Stenta, M.; Bottoni, A.; Garavelli, M., Cobramm: ATunable Qm/Mm Approach to Complex Molecular Architectures.Modelling the Excited and Ground State Properties of Sized MolecularSystems. In Computational Methods in Science and Engineering Vol 1:Theory and Computation: Old Problems and New Challenges; Maroulis,G., Simos, T. E., Eds.; American Institute of Physics: Melville, NY,2007; Vol. 963, pp 491−505.(36) Werner, H. J.; Knowles, P. J.; Knizia, G.; Manby, F. R.; Schutz,M. Molpro: A General-Purpose Quantum Chemistry ProgramPackage. Wiley Interdiscip. Rev.: Comput. Mol. Sci. 2012, 2, 242−253.(37) Case, D. A.; Cheatham, T. E.; Darden, T.; Gohlke, H.; Luo, R.;Merz, K. M.; Onufriev, A.; Simmerling, C.; Wang, B.; Woods, R. J. TheAmber Biomolecular Simulation Programs. J. Comput. Chem. 2005, 26,1668−1688.(38) Senn, H. M.; Thiel, W. Qm/Mm Methods for BiomolecularSystems. Angew. Chem., Int. Ed. 2009, 48, 1198−1229.(39) Okada, T.; Sugihara, M.; Bondar, A. N.; Elstner, M.; Entel, P.;Buss, V. The Retinal Conformation and Its Environment in Rhodopsinin Light of a New 2.2 Angstrom Crystal Structure. J. Mol. Biol. 2004,342, 571−583.(40) Tomasello, G.; Olaso-Gonzalez, G.; Altoe, P.; Stenta, M.;Serrano-Andres, L.; Merchan, M.; Orlandi, G.; Bottoni, A.; Garavelli,M. Electrostatic Control of the Photoisomerization Efficiency andOptical Properties in Visual Pigments: On the Role of CounterionQuenching. J. Am. Chem. Soc. 2009, 131, 5172−5186.(41) Aquilante, F.; De Vico, L.; Ferre, N.; Ghigo, G.; Malmqvist, P.A.; Neogrady, P.; Pedersen, T. B.; Pitonak, M.; Reiher, M.; Roos, B.O.; et al. Software News and Update Molcas 7: The Next Generation.J. Comput. Chem. 2010, 31, 224−247.(42) Forsberg, N.; Malmqvist, P. A. Multiconfiguration PerturbationTheory with Imaginary Level Shift. Chem. Phys. Lett. 1997, 274, 196−204.(43) Malmqvist, P. A.; Roos, B. O. The Casscf State InteractionMethod. Chem. Phys. Lett. 1989, 155, 189−194.(44) Tian, P. F.; Keusters, D.; Suzaki, Y.; Warren, W. S. FemtosecondPhase-Coherent Two-Dimensional Spectroscopy. Science 2003, 300,1553−1555.(45) Grumstrup, E. M.; Shim, S.-H.; Montgomery, M. A.; Damrauer,N. H.; Zanni, M. T. Facile Collection of Two-Dimensional ElectronicSpectra Using Femtosecond Pulse-Shaping Technology. Opt. Express2007, 15, 16681−16689.(46) Brixner, T.; Stiopkin, I. V.; Fleming, G. R. Tunable Two-Dimensional Femtosecond Spectroscopy. Opt. Lett. 2004, 29, 884−886.(47) Cowan, M. L.; Ogilvie, J. P.; Miller, R. J. D. Two-DimensionalSpectroscopy Using Diffractive Optics Based Phased-Locked PhotonEchoes. Chem. Phys. Lett. 2004, 386, 184−189.(48) Brida, D.; Manzoni, C.; Cirmi, G.; Marangoni, M.; Bonora, S.;Villoresi, P.; De Silvestri, S.; Cerullo, G. Few-Optical-Cycle PulsesTunable from the Visible to the Mid-Infrared by Optical ParametricAmplifiers. J. Opt. 2010, 12.
The Journal of Physical Chemistry B Article
dx.doi.org/10.1021/jp502538m | J. Phys. Chem. B XXXX, XXX, XXX−XXXJ