moderated e-portfolio project evaluation...moderated e-portfolio project evaluation executive...
TRANSCRIPT
Evaluation and Validation Assessment Directorate
UCLES
Moderated e-portfolio project evaluation
Jackie Greatorex University of Cambridge Local Examinations Syndicate (UCLES1), 1 Hills Road,
Cambridge CB1 2EU, United Kingdom. Email:[email protected]
Note: This evaluation was commissioned by OCR and undertaken by the Evaluation and Validation Unit within the Assessment Directorate.
1 The UCLES Group provides assessment services worldwide through three main business units.
• Cambridge-ESOL (English for speakers of other languages) provides examinations in English as a foreign language and qualifications for language teachers throughout the world.
• CIE (University of Cambridge International Examinations) provides international school examinations and international vocational awards.
• OCR (Oxford, Cambridge and RSA Examinations) provides general and vocational qualifications to schools, colleges, employers, and training providers in the UK.
For more information please visit http://www.ucles.org.uk
Moderated e-portfolio project evaluation
Table of contents
1 Introduction .............................................................................................................................. 5 1.1 Moderating GCSE and GCE coursework........................................................................... 5 1.2 OCR’s E-portfolio projects ................................................................................................ 5
1.2.1 Evaluation Strategy.................................................................................................... 6 1.2.2 Literature review........................................................................................................ 7
2 Questionnaire to e-moderated centres (GCSE ICT and GNVQ Science) .............................. 10 2.1 Method ............................................................................................................................. 10
2.1.1 Participants /sample ................................................................................................. 10 2.1.2 Materials .................................................................................................................. 10 2.1.3 Procedure ................................................................................................................. 10
2.2 Results .............................................................................................................................. 10 2.2.1 Your experience of e-portfolios............................................................................... 11 2.2.2 Pupils' experience of e-portfolios ............................................................................ 13
3 Questionnaire to e-moderators ............................................................................................... 18 3.1 Method ............................................................................................................................. 18
3.1.1 Participants /sample ................................................................................................. 18 3.1.2 Materials .................................................................................................................. 18 3.1.3 Procedure ................................................................................................................. 18
3.2 Results .............................................................................................................................. 18 3.2.1 Comparing e-portfolios and paper portfolios........................................................... 18 3.2.2 E-moderation ........................................................................................................... 20 3.2.3 Comparing e-moderation with postal moderation ................................................... 21 3.2.4 Choosing samples for moderation ........................................................................... 22 3.2.5 Recommending ranges of marks to be adjusted ...................................................... 23
4 Content analysis ..................................................................................................................... 25 4.1 Method ............................................................................................................................. 25
4.1.1 Sample ..................................................................................................................... 25 4.1.2 Materials .................................................................................................................. 25 4.1.3 Procedure ................................................................................................................. 25 4.1.4 Analysis ................................................................................................................... 26
4.2 Results .............................................................................................................................. 26 4.2.1 The proportions of portfolios with particular features............................................. 26 4.2.2 Results of the cluster analysis.................................................................................. 30
5 Evaluation Study 1: GCSE ICT A.......................................................................................... 32 5.1 Paired interviews with conventional and e-moderators.................................................... 32
5.1.1 Method..................................................................................................................... 32 5.1.2 Results ..................................................................................................................... 35
5.2 Statistical analysis of moderators judgements.................................................................. 39 5.2.1 Method..................................................................................................................... 39 5.2.2 Results ..................................................................................................................... 40
6 Evaluation Study 2: GNVQ Science ...................................................................................... 43 6.1 Paired interviews with paper and e-moderators ............................................................... 43
6.1.1 Method..................................................................................................................... 43 6.1.2 Results ..................................................................................................................... 44
6.2 Statistical analysis ............................................................................................................ 47
1
6.2.1 Method..................................................................................................................... 47 6.2.2 Results ..................................................................................................................... 48
7 Conclusion.............................................................................................................................. 50 8 References .............................................................................................................................. 54
2
Moderated e-portfolio project evaluation Executive summary OCR is piloting e-portfolios and e-moderation. As part of the pilot OCR commissioned the Evaluation and Validation Unit within the Assessment Directorate to evaluate e-portfolios and e-moderation. The evaluation strategy is somewhat constrained by the design of OCR’s pilot. The evaluation design is intended to make the most of the data available. The report details findings from: • Questionnaires to e-moderated centres; • Questionnaires to e-moderators; • Content analysis of candidates’ work; • Paired interviews with paper and e-moderators about any differences in judgement; • Statistical analysis of paper and e-moderators' marks. It was found that there were some disadvantages of e-portfolios and e-moderation. Firstly there is the infrastructure and associated access to computer facilities. Homes of pupils and moderators and schools all vary in the computer facilities available and this creates accessibility issues for e-portfolios although this might change over time. It might be that in the future OCR offers some specifications which are electronically based, if so comparability between specifications in the same subject and over time would need to be maintained. Technology problems also affected the coursework compilation and moderation. Centres experiences technology problems and e-moderators found e-moderation time consuming as it took a long time to download files to be viewed. Teachers found that it was difficult to annotate directly onto pupils e-portfolios. Hence the amount of teacher annotation available for moderators to review might be affected. To continue moderating in the way that they are accustomed, e-moderators need to be able to view: • More than one portfolio at a time; • The mark scheme and teachers’ annotations on the e-portfolio at the same time (rather than
having to switch between files). They are not able to do these at the moment and this affected the moderators’ experience of moderating. There are also advantages of e-moderation, for example, moderators do not need to rely on the post. Centres listed some advantages of e-portfolios like fewer printing problems and one centre reported that the majority of pupils responded positively to e-portfolios. It was also found that paper portfolios and e-portfolios are suited to somewhat different coursework tasks and types of evidence. One of the centres commented in the questionnaire that “It was difficult to meet the criteria of some projects as they were not written as e-portfolio projects. If tasks were written as e-portfolio tasks there would be no problem”. Currently OCR specifications encourage hand drawn lines of best fit in graphs, and handwritten responses to questionnaires are required. Such work needs to be input to be included in e-portfolios. Two centres mentioned in their questionnaire responses that they had input hand written work by scanning which takes a long time. There are other ways of inputting hand written or hand drawn data into an electronic file available on the market. Whether paper portfolios or e-portfolios are the best medium depends upon which is best suited to assessing the knowledge and skills which are educationally valued.
3
The statistical analysis revealed that there were some differences between the marks given by e-moderators and conventional moderators. However neither e-portfolios nor paper portfolios were systematically favoured. There was not sufficient evidence to say whether the differences were due to differences between moderators, centres, media or interactions between these factors. The paired interviews showed that the moderators perceived the e-portfolios and the paper portfolios differently and that the experience of moderation in each case was different. The differences between moderators’ perceptions did not appear to be related to the size of the difference between the marks they gave to the portfolios. The conventional and e-moderators also had different views about how important different factors were in influencing moderation judgements. Based on the research evidence it is concluded that due to infrastructure, technology limitations, incompatibility between software systems, moderation approaches and specification requirements e-portfolios and in particular e-moderation is not yet ready for wide scale implementation.
4
1 Introduction
1.1 Moderating GCSE and GCE coursework Moderators receive a list of the marks that centres have given to coursework. They request a sample of coursework to cover the whole range of marks that have been awarded. The moderator reviews the marking of the sample of coursework and then compares their mark to the mark the teacher gave their pupils. If there are differences which are within tolerance2 then the marks are left as the centre marking. If there are differences which are outside of tolerance then the moderator recommends that the coursework marks within particular ranges are changed. If they are unsure about where the ranges begin and end then they can request more coursework to review the marking and ensure that they choose the appropriate ranges. These ranges are reviewed by a senior moderator who signs off the recommendations or adjusts them as necessary. If the rank ordering within the centre is inappropriate then all the coursework from the centre has to be re-marked.
1.2 OCR’s E-portfolio projects Digitalbrain and TAG learning are electronic teaching and learning management systems where teachers can develop and store tasks for coursework or assignments, communicate with one another and with pupils and manage the allocation of tasks or assignments to pupils. There is the facility for the teacher to specify a task and to upload associated resources for the students to use whilst completing the task. There is also the facility for the teachers to feedback marks to the students. Students store their coursework as electronic files in the system. The candidate’s work is known as an e-portfolio. Once coursework is submitted for internal assessment and Awarding Body moderation the system is switched to moderation view so that the Awarding Body moderator can select e-portfolios for moderation, view them and record any new marks. E-portfolios are used in general and vocational qualifications. In the latter case they are an electronic tool for gathering evidence of a candidate’s competence. OCR’s development programme includes three e-portfolio projects; the first concerns e-moderation of coursework in GCSE ICT A 1094 and the second is about the e- moderation of GNVQ Science Intermediate 7974 e-portfolios. These two projects are the focus of the present report. In GCSE ICT there are two coursework units 2358 (constituting projects 1a and 1b each worth twenty eight marks and two communication marks) and 2360 (constituting project 2 worth fifty-six marks plus four communication marks). In GNVQ Science there are a number of coursework units, the one for which e-portfolios were produced in the present study was 6461. There are sixteen marks available for this unit. In these e-portfolio projects about the moderation of coursework different e-portfolio applications are currently used for different subjects; TAG Learning (MAPS) for GCSE ICT A 1094 and Digitalbrain for GNVQ Science 7974. OCR’s trialling of e-portfolios fits with the government’s drive for electronic solutions. The third development project is about the verification of e-portfolios in vocational qualifications; this is not considered here. 2 Tolerance is the difference which is allowable between the mark given by the moderator and the mark given by the teacher. The allowable difference is often up to 6% of the marks available. There are specific rules for each specification.
5
The aim of OCR’s project is to investigate the feasibility and viability of using e-portfolio products for remote moderation. There are a number of e-portfolio products available, including those used in this project. OCR plans to produce criteria which must be met by e-portfolio products and to list those known to conform. Other project concerns are: • How might changes in presentation affect moderators: what they do, their perceptions of
quality and judgements and hence standards? • How might changes in the types, nature and range of information available affect moderators
and their judgements? • How are candidates affected in terms of the range of evidence they might present and their
individual capacity to master the technologies available? Does comparison of their conventional and e-portfolios suggest that they have enjoyed more or less scope? Does comparison provide any evidence that some have been advantaged or disadvantaged by the technology?
• What special problems arise in authenticating candidates’ work as their own? It was planned by OCR that as part of the project a small number of centres entered e-portfolios for their coursework for GNVQ Science and GCSE ICT in the summer 2004 examination session. Once the e-portfolio coursework has been submitted by the due date it can not be amended by the candidates (the e-portfolio application will be in moderation view). The e-portfolio was printed and the paper version of the coursework was moderated as part of OCR’s live operations. The e-portfolio version of the coursework was also e-moderated. If there were any differences between the marks from e-moderation and conventional moderation they were resolved before the marks contributed to grading. The Evaluation and Validation Unit (E&V) of the Assessment Directorate were commissioned by OCR to take an evaluation role in each of the e-portfolio projects in general qualifications. The evaluation seeks to assist the project’s aim to investigate the feasibility and viability of using e-portfolio products for e-moderation. For sampling purposes for the evaluation it was requested that four centres submit GNVQ coursework and four submit ICT e-portfolios. During the OCR e-portfolio trial some centres dropped out and by the coursework submission date there were four centres using MAPs and one using Digitalbrain. The GNVQ coursework was not submitted for live moderation or assessment. The centre used the OCR project as a trial for some year ten students. There were fifteen pupils from the centre so they were all moderated rather than taking a sample. Some candidates from some ICT centres submitted part of their coursework as an e-portfolio and some as a paper portfolio. Only two centres submitted e-portfolios for both projects 1a and 1b, two centres submitted e-portfolios for project 1b but not 1a. Also only two centres submitted project 2 as e-portfolios. These were decisions made by centres which were beyond the control of OCR or E&V. These decisions do limit the evaluation design and the conclusions which can be drawn from the report.
1.2.1 Evaluation Strategy The evaluation strategy is somewhat constrained by the design of OCR’s development project (for example, centres dropping out); it is the same for both evaluation studies and is intended to make the most of the data available. It includes a: • Questionnaire to e-moderated centres asking about the nature of evidence, access issues,
candidates’ expertise, authentication, staff/pupil workloads;
6

• Questionnaire to e-moderators asking how the medium affects their judgements, quality of evidence, their perceptions of quality, capacity to judge authenticity, the sample they chose, what they pay attention to;
• Content analysis to note any differences between the contents of the e-portfolios and conventional portfolios
• Statistical analysis of moderation judgements to identify whether e-moderation is more lenient or severe than conventional moderation;
• Paired interviews with paper and e-moderators about issues which might affect moderation judgements.
Questionnaires were designed in consultation with OCR. Initially it was intended that for each specification a sample X of portfolios would be moderated in both the e-portfolio and the paper version by moderators B and A; respectively. Sample X would constitute candidates coursework from 4 centres matched to those in sample X. Moderator A would be the second person to moderate sample X, in blind conditions. This allowed judgements about paper and e-portfolios to be compared. The same moderators would moderate a second sample of portfolios in the paper version - sample Y, for moderator B this moderation was to be blind (they would not know the judgements made by A). This would enable comparison between the judgements of the two moderators in conventional circumstances. Hence any differences between e-moderation and paper moderation judgements would not be over interpreted. Sample Y was part of moderator A’s operational allocation and they chose and moderated the sample of candidates under normal conditions. Moderator A would chose the sample of candidates for sample X which was part of their operational allocation. There were a number of reasons why this plan could not be followed: • Centres dropping out (details given earlier); • Candidates submitting only parts of e-portfolios rather than the whole of a unit (details given
above); • The moderation of sample Y was not undertaken blind rather it was signed off by the second
moderator(s); • For one unit the e-moderator did not submit recommended ratings and details of candidates
moderated for sample Y to the Evaluation Team via OCR. Given this lack of data the design of the statistical analysis was adjusted to make the most of that available. Details are given later in the report.
1.2.2 Literature review
1.2.2.1 E-moderation Salmon (2004) in her book about e-moderation does not use the term in the way it is used in GCSE and GCE contexts but some of her arguments are relevant to this evaluation. Salmon (2004, 113) states that “However, many assessment procedures are still based on the transmission model of information. This means that unless issues of evaluation and assessment are tackled as the use of online learning increases, the gap between how students learn and how they are assessed may widen. Some students already comment on the irony of spending most of their time communicating through their computer, but taking their examination in a formal setting with only a pen and paper for company. As e-moderators become more comfortable with their on-line teaching roles, I think they will start to look closely at online assessment and evaluation, and will not wish their time and their students’ time to be constrained by old assessment methods”.
7

1.2.2.2 The presentation effect The presentation effect is presenting candidates examination or test responses to markers in different ways – usually on-screen versus on paper, or handwritten versus typed - to identify whether the presentation affects the scores given. One of the issues with which this evaluation is concerned – comparing paper and on-screen versions of the same portfolio is - possibly a new form of the presentation effect. A number of studies show that there is little if any difference between the marks awarded when marking on-screen versus on paper. Studies in the public domain include Powers et al (1997) and Powers and Farnum (1997) both cited in Zhang et al (2003), Twing et al (2003), Sturman and Kispal (2003) and Zhang et al (2003). Johnson and Green (2004a) gave matched groups of students a paper and computer version of a test. They found that the children’s overall test performance was not statistically significantly different. But there were differences (which were not statistically significant different) at the item level. They also found that children were more likely to attempt a question on computer than on paper. Johnson and Green (2004b) found that the mode of the test did have an impact on the strategies, perceptions and behaviours of children. But Whetton and Newton (2002) found consistently more marks being credited when marking on-line as opposed to on paper. Powers et al (1994) found that there was a difference between the grades of handwritten and typed essays in favour of handwritten essays. Later Powers and Farnum (1997) cited in Zhang et al (2003) and Russell and Tao (2004) reported a similar effect. Green et al (2003) found that if candidates’ handwritten work were transcribed into typed script by another party then the typed version of the work gained a higher mark. Russell and Tao (2004) also found that when markers had been trained to overcome the presentation effect the differences in scores were eliminated. In a literature review Bennett (2003, 15) reported that "the available research suggests little, if any, effect for computer versus paper display but a consistent difference for typed compared with handwritten presentation" (Bennett, 2003, 15). When he came to this conclusion his review did not include Whetton and Newton's (2002) findings. Part of the present evaluation includes comparing the moderation judgements made on paper and e-moderated portfolios and investigating whether the medium is a cause of any discrepancies. A difference between the present project and the investigations reviewed above is that it is in the context of moderation not externally marked tests or examinations. It is difficult to know whether any difference found between the paper moderation of coursework and the e-moderation of the coursework are due to different moderators or the different media. Taylor (1992) in Newton (1996) found that the correlation coefficient between two moderators re-marking Mathematics coursework folders ranged between 0.91 and 0.97 for different pairs of moderators. In the same research the correlation coefficients for GCSE English coursework were 0.87 and 0.97. Of course these figures refer to paper coursework and if correlations were different for e-moderation versus paper moderation this might be due to the presentation effect. Any comparison between Taylor’s correlation coefficients and those found in e-moderation are not very meaningful as we would not strictly be comparing like with like. The limitation of correlations is that they give an indication of whether markers have ranked candidates work in a similar way. To gain an indication of the size of the differences between examiners’ marking we rely on measures like mean differences between the scores awarded by different examiners. Unfortunately there is no mention in Newton’s review of the size of the
8
mean difference between the marks awarded by different examiners to the coursework and Taylor (the source of Newton’s figures) is an internal AQA report. There are some recent mean differences available but these are from marking not moderation. Baird et al (2004) report that in an experiment least mean square values for absolute differences between the prime marker and other markers ranged between 2.33 and 2.56. Least mean square values are a mean difference which accounts for an unbalanced sample. The maximum number of marks available for the essay was 25. So the mean difference between markers is about 10% of the marks available. It is difficult to compare these mean differences from marking an English essay marked using a levels mark scheme with results from other subjects or different types of marks schemes as we would not be comparing like with like.
1.2.2.3 Examiners’ experience of marking on-screen One strand of investigation in the present evaluation is teachers’, pupils’ and moderators’ experience of e-portfolios. There are some parallels between the present evaluation and the work of Raikes et al (2004). They investigated the on-screen marking experience of a small number of senior examiners. The senior examiners spent an hour or more experimentally marking on-screen, they viewed images of candidates’ scripts and entered marks into the application by clicking on the appropriate mark using the mouse. Raikes et al. (2004) found (amongst other things) that the marking application somewhat interfered with the examiner’s marking process. For example, examiners needed to be able to annotate images of scripts whilst they were marking to facilitate the marking process and to indicate to senior examiners why those marks had been accredited. Such things were to be expected as the marking application was being adapted for UCLES marking purposes and the examiners feedback was needed to facilitate the development. Ideally developing technological solutions to examining should involve establishing exactly what those involved do and how this might be improved before development begins. In the case of on-screen marking there is no research which describes in detail how examiners mark which could be used as a starting point for development. So in Raikes et al (2004) when examiners undertook on-screen marking the application did not always facilitate the examiners’ marking process: rather it sometimes hindered the process. There is no research which details exactly what teachers, candidates and moderators do as they write, compile mark and moderate coursework. Hence there is the possibility that e-moderation might mismatch with present coursework development and moderation processes.
9
2 Questionnaire to e-moderated centres (GCSE ICT and GNVQ
Science)
2.1 Method
2.1.1 Participants /sample Questionnaires were sent to all five centres who used Digitalbrain or MAPs.
2.1.2 Materials The questionnaire was designed in accordance with the aim of the project and the MAPs and Digitalbrain software. There were two versions of the questionnaire: one for GNVQ Science, and another for GCSE ICT.
2.1.3 Procedure The questionnaire was sent to centres after 17th May 2004 (date of submission for GCSE coursework). The centres were asked to complete and return the questionnaire by the end of June 2004. If they had not returned the questionnaire then a telephone interview was requested to gain the information. During the telephone interviews the questionnaire was read to the teachers and they gave their responses. When the answer was a free response the interviewer made a note of the points that the teacher made.
2.2 Results Two questionnaires were received from the five participating centres. A teacher from each of the three remaining participating centres consented to a telephone interview. The frequency of responses is given below for each question from the questionnaire. The questions are used as headings below. Free responses are given verbatim in a different font - Comic Sans MS. Each bullet point separates the responses of one centre from those of another centre. The frequencies and responses speak for themselves, so little additional comment is offered.
10
2.2.1 Your experience of e-portfolios
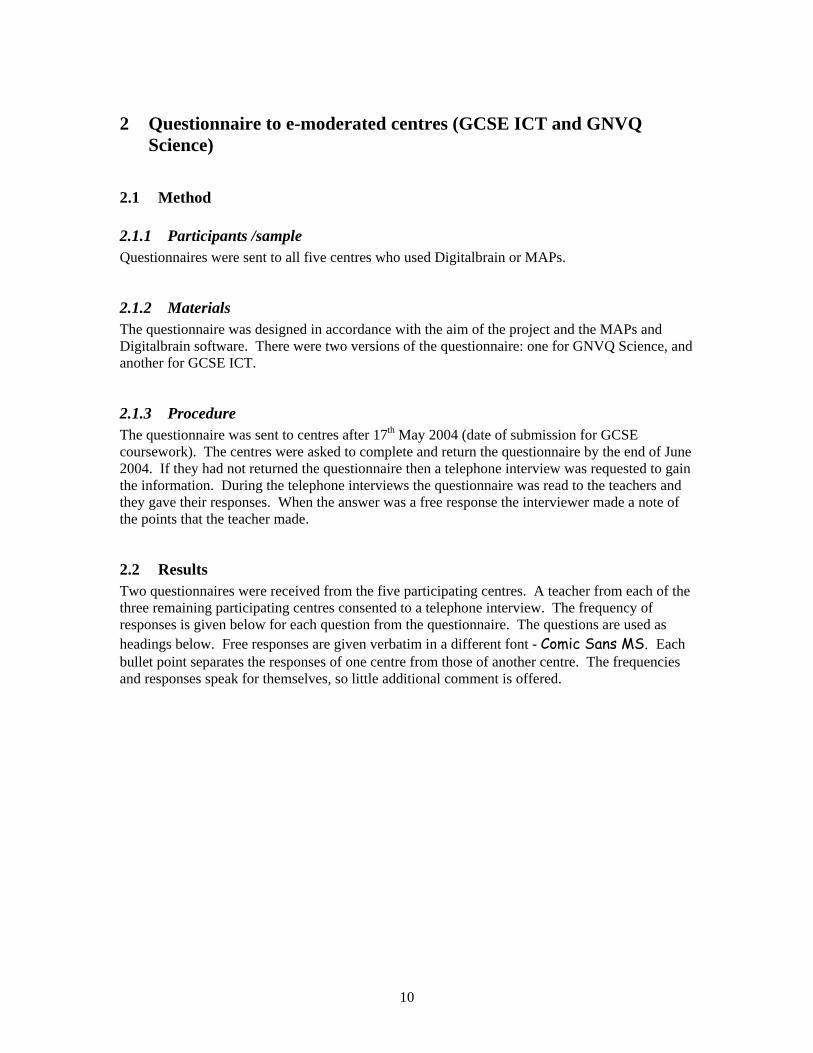
2.2.1.1 Did you mark e-portfolios in MAPS?
Yes No 5 0
2.2.1.2 How easy was it to mark e-portfolios in MAPS?
Easy Average Difficult 2 3 0
What, if anything, was particularly difficult?
• Switching between screens rather than laying paper out was time consuming. • As a moderator as well as a teacher I know that the difficulty of ensuring that
there is continuous page numbering over multiple files might make moderation more difficult. For teachers using Digitalbrain it will be easier to keep track of marks.
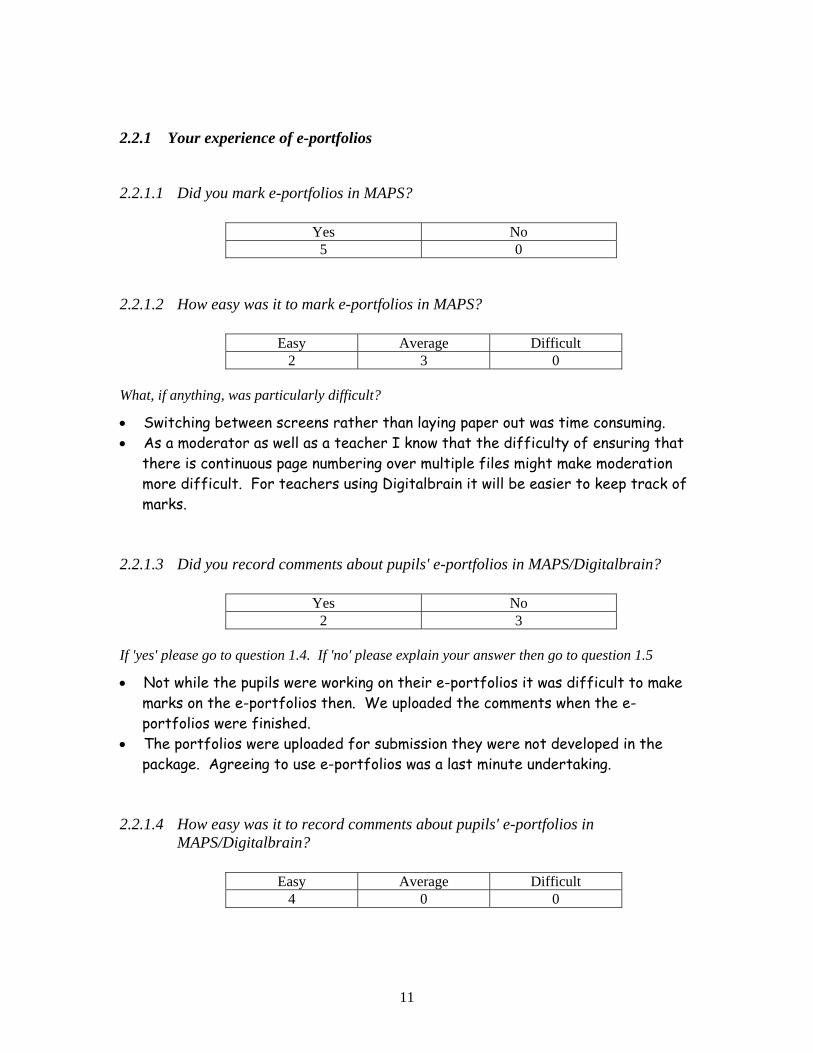
2.2.1.3 Did you record comments about pupils' e-portfolios in MAPS/Digitalbrain?
Yes No 2 3
If 'yes' please go to question 1.4. If 'no' please explain your answer then go to question 1.5
• Not while the pupils were working on their e-portfolios it was difficult to make marks on the e-portfolios then. We uploaded the comments when the e-portfolios were finished.
• The portfolios were uploaded for submission they were not developed in the package. Agreeing to use e-portfolios was a last minute undertaking.
2.2.1.4 How easy was it to record comments about pupils' e-portfolios in MAPS/Digitalbrain?
Easy Average Difficult
4 0 0
11
Only two participants responded 'yes' to 2.2.1.3. If the questionnaire instructions had been
followed there would have been two responses to 2.2.1.4. But additional respondents provided an
answer to 2.2.1.4. This can be explained by the comment made by one centre that they did not
mark the e-portfolios in the package as they went along but they did upload teacher comments at
the time of submission for the purposes of moderation.
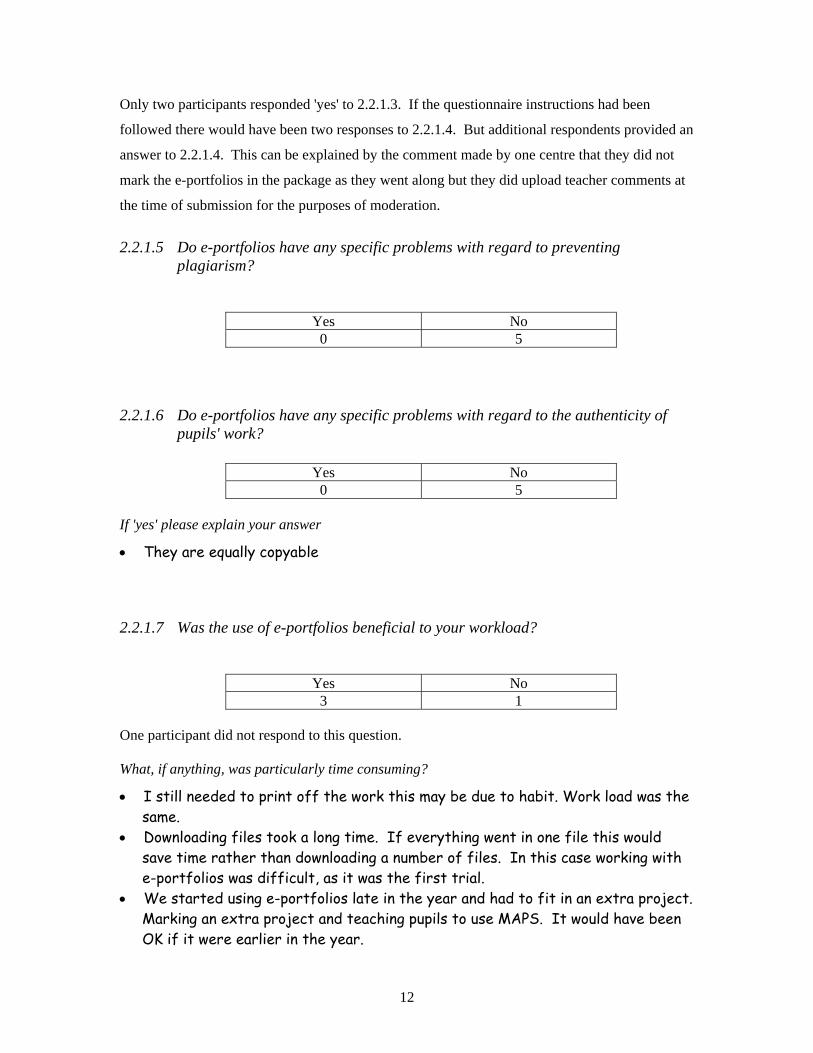
2.2.1.5 Do e-portfolios have any specific problems with regard to preventing plagiarism?
Yes No 0 5
2.2.1.6 Do e-portfolios have any specific problems with regard to the authenticity of pupils' work?
Yes No
0 5 If 'yes' please explain your answer
• They are equally copyable
2.2.1.7 Was the use of e-portfolios beneficial to your workload?
Yes No 3 1
One participant did not respond to this question. What, if anything, was particularly time consuming?
• I still needed to print off the work this may be due to habit. Work load was the same.
• Downloading files took a long time. If everything went in one file this would save time rather than downloading a number of files. In this case working with e-portfolios was difficult, as it was the first trial.
• We started using e-portfolios late in the year and had to fit in an extra project. Marking an extra project and teaching pupils to use MAPS. It would have been OK if it were earlier in the year.
12
• It was not time consuming as it was a small group of pupils. If the use of the e-portfolios had been continuous and embedded the process would have been easier. There are some marking issues in the application that need to be resolved. Getting started with Digitalbrain and e-portfolios and preparing the e-portfolios was time consuming. It was time consuming teaching the pupils to use Digitalbrain.
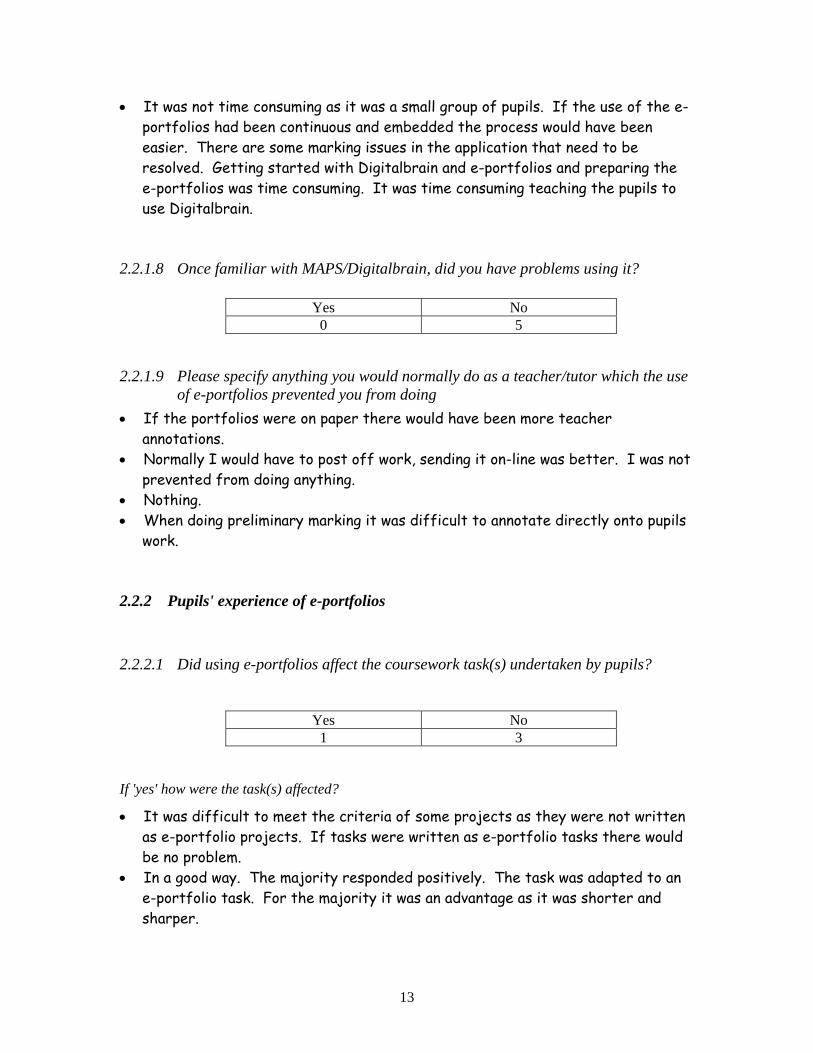
2.2.1.8 Once familiar with MAPS/Digitalbrain, did you have problems using it?
Yes No 0 5
2.2.1.9 Please specify anything you would normally do as a teacher/tutor which the use of e-portfolios prevented you from doing
• If the portfolios were on paper there would have been more teacher annotations.
• Normally I would have to post off work, sending it on-line was better. I was not prevented from doing anything.
• Nothing. • When doing preliminary marking it was difficult to annotate directly onto pupils
work.
2.2.2 Pupils' experience of e-portfolios
2.2.2.1 Did using e-portfolios affect the coursework task(s) undertaken by pupils?
Yes No 1 3
If 'yes' how were the task(s) affected?
• It was difficult to meet the criteria of some projects as they were not written as e-portfolio projects. If tasks were written as e-portfolio tasks there would be no problem.
• In a good way. The majority responded positively. The task was adapted to an e-portfolio task. For the majority it was an advantage as it was shorter and sharper.
13
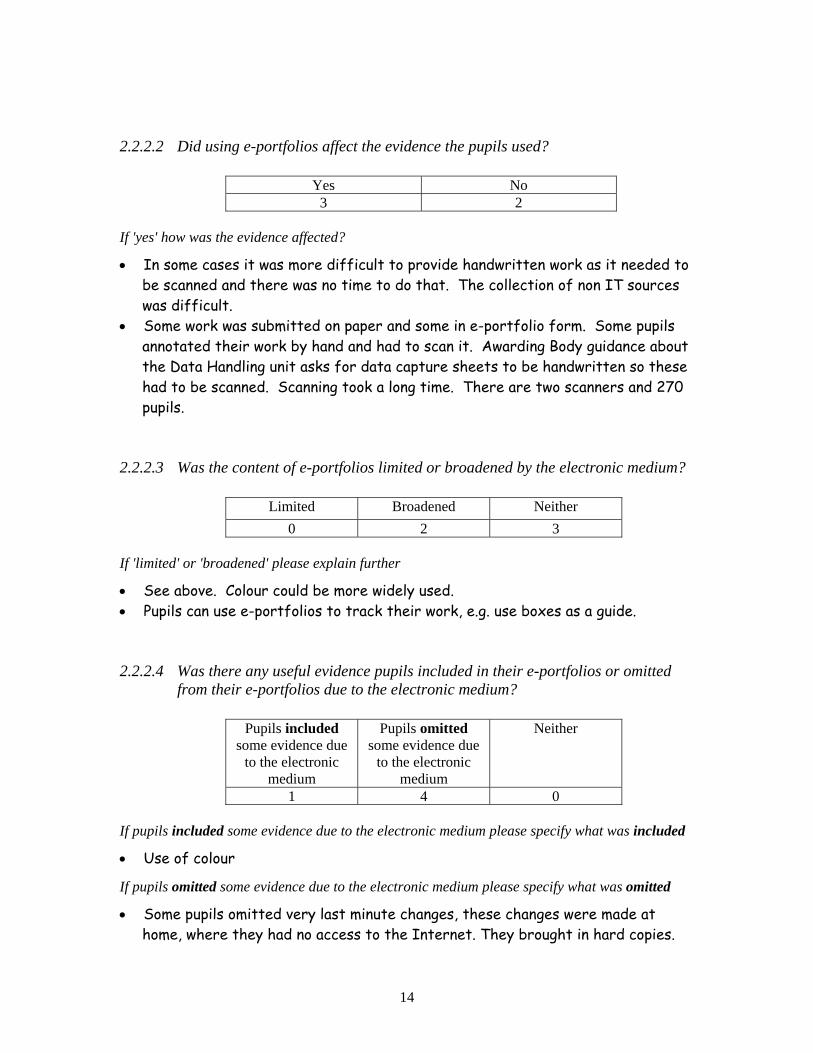
2.2.2.2 Did using e-portfolios affect the evidence the pupils used?
Yes No 3 2
If 'yes' how was the evidence affected?
• In some cases it was more difficult to provide handwritten work as it needed to be scanned and there was no time to do that. The collection of non IT sources was difficult.
• Some work was submitted on paper and some in e-portfolio form. Some pupils annotated their work by hand and had to scan it. Awarding Body guidance about the Data Handling unit asks for data capture sheets to be handwritten so these had to be scanned. Scanning took a long time. There are two scanners and 270 pupils.
2.2.2.3 Was the content of e-portfolios limited or broadened by the electronic medium?
Limited Broadened Neither 0 2 3
If 'limited' or 'broadened' please explain further
• See above. Colour could be more widely used. • Pupils can use e-portfolios to track their work, e.g. use boxes as a guide.
2.2.2.4 Was there any useful evidence pupils included in their e-portfolios or omitted from their e-portfolios due to the electronic medium?
Pupils included
some evidence due to the electronic
medium
Pupils omitted some evidence due
to the electronic medium
Neither
1 4 0 If pupils included some evidence due to the electronic medium please specify what was included
• Use of colour
If pupils omitted some evidence due to the electronic medium please specify what was omitted
• Some pupils omitted very last minute changes, these changes were made at home, where they had no access to the Internet. They brought in hard copies.
14

• Hand drawn diagrams were omitted from the portfolios, they should have been scanned and included in the portfolios.
2.2.2.5 Please indicate which problem(s) pupils experienced preparing e-portfolios and briefly describe the problem. (Please tick all appropriate options).
Response option Frequency Comment(s) Lack of access to desired IT equipment
3 • Those with computers at home sometimes had issues of no broadband - but school was open so they had access to facilities.
• Some pupils do not have computers/internet at home.
• Some pupils experienced this. Lack of familiarity with IT equipment
2 • Lack of experience, while I was off sick with logging onto MAPS.
• Few experienced this. Lack of familiarity with MAPS/Digitalbrain
3 • In some cases. • There were some issues at first with uploading as
the pupils had to get the hang of the process. Lack of skill to use the available IT equipment (other than MAPS/Digitalbrain)
2
IT equipment failure 4 • This happened the week coursework was due in. • Some IT failure happened. There was a case of a
server going down. • Not much. • There was an unstable network issue.
Lack of familiarity with e-portfolios
2 • This caused few problems. • In some cases.
Other 2 • Trying to work from home some pupils found that it was hard to transfer big files if they had no broadband.
• There were some technical problems with MAPS uploading work.
Pupils didn't experience any problems
0
15

2.2.2.6 Did the pupils experience any of the following problems preparing e-portfolios?
Response option Frequency
Logging on to MAPS/Digitalbrain 2
Uploading files to MAPS/Digitalbrain 3
Downloading files from MAPS/Digitalbrain 1
Finding a computer to work on at school/college 2
No or limited access to a computer to work on at
home
4
Connecting to MAPS/Digitalbrain 1
Lack of electronic storage space to store files on
MAPS/Digitalbrain
0
Loss of file(s) 0
Difficulties reading files on MAPS/Digitalbrain 0
Difficulties making links to the web on
MAPS/Digitalbrain
0
Incompatibility between files from different
versions or sources of software
3
MAPS/Digitalbrain did not support a type of file
pupil(s) wanted to include
0
Other please specify • It did reduce the printing problems for teachers.
• The submission process could be confusing pupils had to get the hang of it.
2.2.2.7 Were any pupils advantaged by the electronic medium?
Yes No 5 0
If 'yes' how were they advantaged?
• Yes: All could now enter designs knowing that ''print problems'' were not an issue.
16

• Four out of seven people had an advantage due to knowledge and access to computer facilities.
• Gave access to working at home and saved time printing. • Yes if they were motivated by it. I was surprised that some pupils handed in
work. • Yes, possibly if they had a computer at home.
2.2.2.8 Were any pupils disadvantaged by the electronic medium?
Yes No 2 3
If 'yes' how were they disadvantaged?
• By access to a computer etc at home. But the necessary equipment was available in schools/ library & this was used.
• If their basic skills were poor.
2.2.2.9 Was the use of e-portfolios beneficial to pupils' workload?
Yes No 4 1
What, if anything, was particularly time consuming?
• Once pupils found out how to use MAPS they were fine, like any package it takes a while to learn.
• In some cases. Nothing was particularly time consuming - just the general work. • It was more work for them to do as it added an extra project. But it did help
some as they did better on the new project. • Digitalbrain prevented pupils from deleting their work from the school server or
saving over the wrong version etc. The e-portfolios were no more time consuming than doing the usual coursework.
17
3 Questionnaire to e-moderators
3.1 Method
3.1.1 Participants /sample Questionnaires were sent to all three e-moderators.
3.1.2 Materials The questionnaire was designed in accordance with the aim of the project and the role of moderators. It was developed in consultation with OCR. There were two versions of the questionnaire; one for GNVQ Science and another for GCSE ICT.
3.1.3 Procedure The questionnaire was sent to e-moderators when moderation began. They were asked to complete and return the questionnaire by mid July 2004.
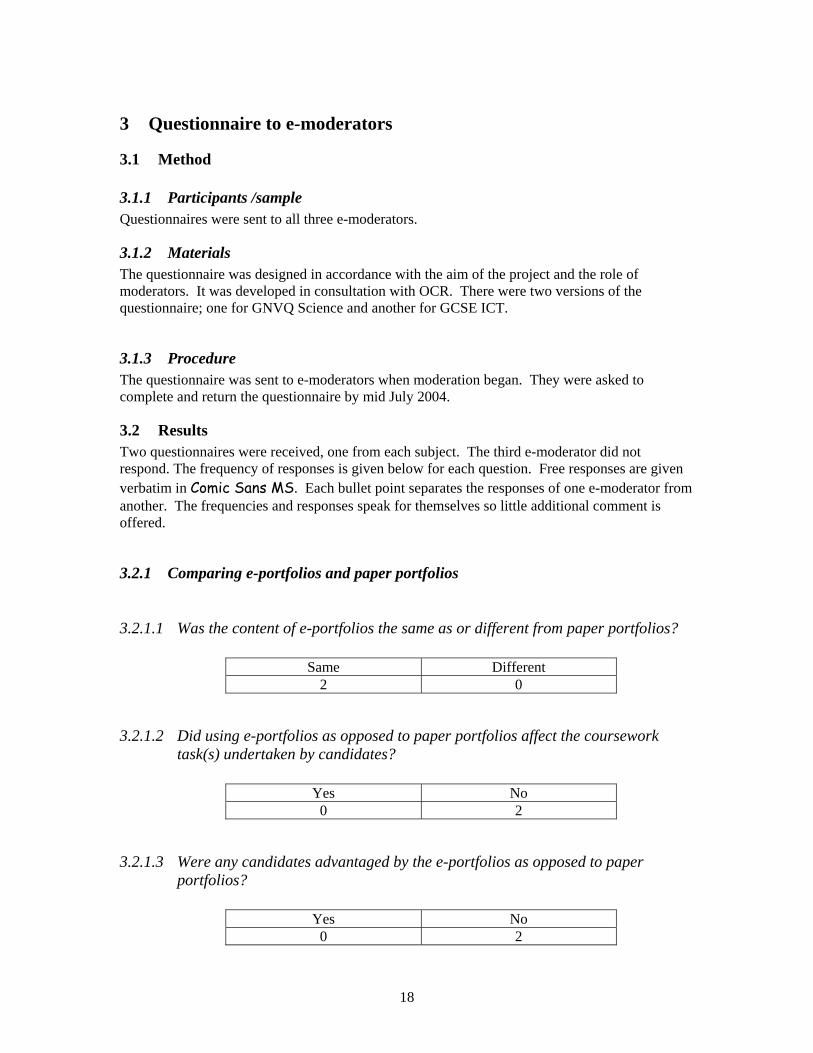
3.2 Results Two questionnaires were received, one from each subject. The third e-moderator did not respond. The frequency of responses is given below for each question. Free responses are given verbatim in Comic Sans MS. Each bullet point separates the responses of one e-moderator from another. The frequencies and responses speak for themselves so little additional comment is offered.
3.2.1 Comparing e-portfolios and paper portfolios
3.2.1.1 Was the content of e-portfolios the same as or different from paper portfolios?
Same Different 2 0
3.2.1.2 Did using e-portfolios as opposed to paper portfolios affect the coursework task(s) undertaken by candidates?
Yes No
0 2
3.2.1.3 Were any candidates advantaged by the e-portfolios as opposed to paper portfolios?
Yes No
0 2
18
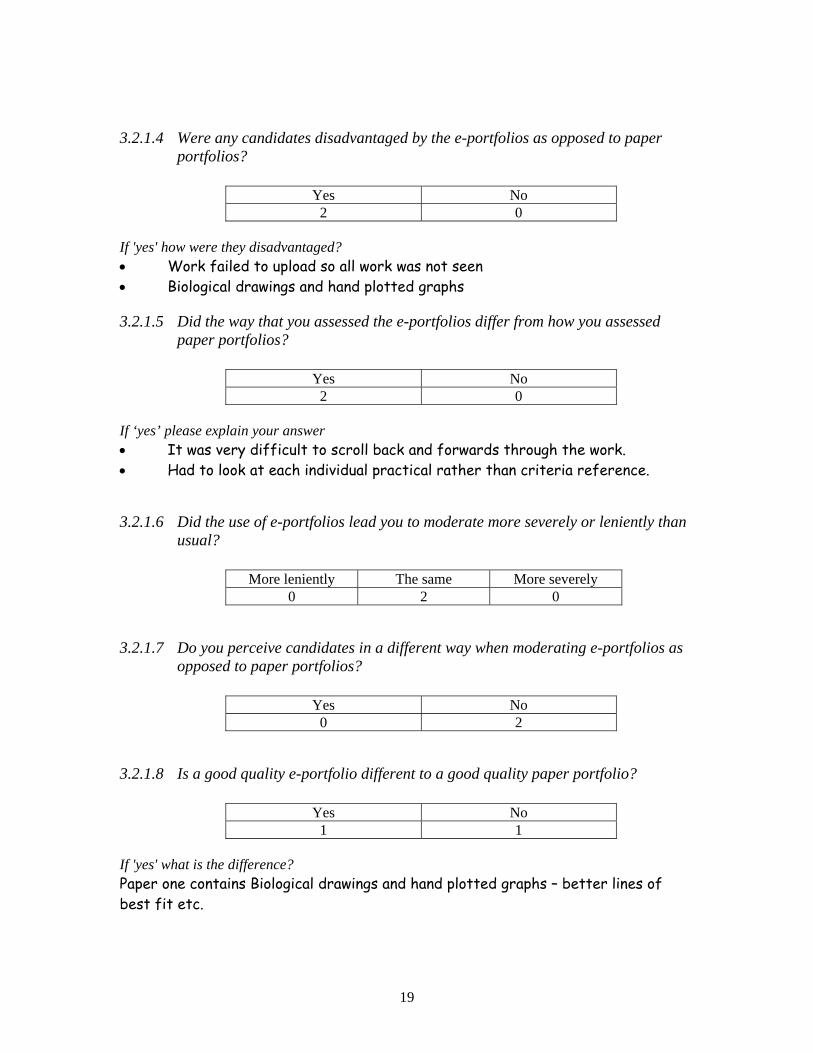
3.2.1.4 Were any candidates disadvantaged by the e-portfolios as opposed to paper portfolios?
Yes No
2 0 If 'yes' how were they disadvantaged? • Work failed to upload so all work was not seen • Biological drawings and hand plotted graphs
3.2.1.5 Did the way that you assessed the e-portfolios differ from how you assessed paper portfolios?
Yes No
2 0 If ‘yes’ please explain your answer • It was very difficult to scroll back and forwards through the work. • Had to look at each individual practical rather than criteria reference.
3.2.1.6 Did the use of e-portfolios lead you to moderate more severely or leniently than usual?
More leniently The same More severely
0 2 0
3.2.1.7 Do you perceive candidates in a different way when moderating e-portfolios as opposed to paper portfolios?
Yes No
0 2
3.2.1.8 Is a good quality e-portfolio different to a good quality paper portfolio?
Yes No 1 1
If 'yes' what is the difference? Paper one contains Biological drawings and hand plotted graphs – better lines of best fit etc.
19
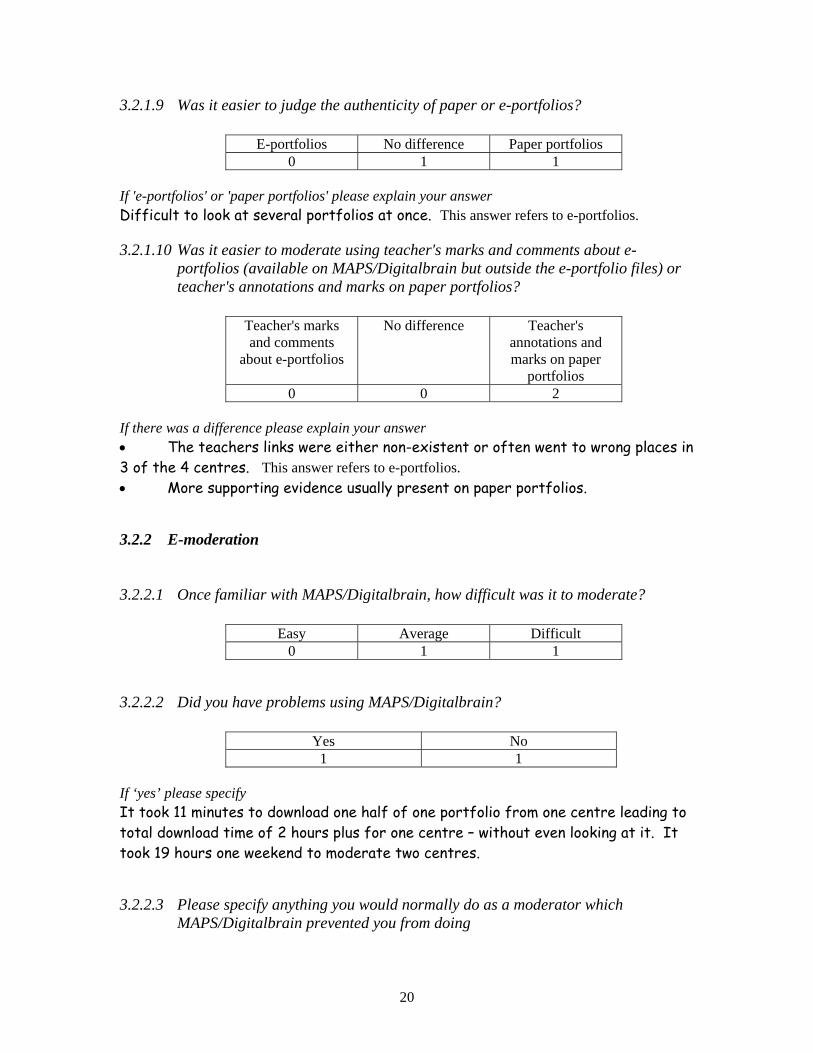
3.2.1.9 Was it easier to judge the authenticity of paper or e-portfolios?
E-portfolios No difference Paper portfolios 0 1 1
If 'e-portfolios' or 'paper portfolios' please explain your answer Difficult to look at several portfolios at once. This answer refers to e-portfolios.
3.2.1.10 Was it easier to moderate using teacher's marks and comments about e-portfolios (available on MAPS/Digitalbrain but outside the e-portfolio files) or teacher's annotations and marks on paper portfolios?
Teacher's marks and comments
about e-portfolios
No difference Teacher's annotations and marks on paper
portfolios 0 0 2
If there was a difference please explain your answer • The teachers links were either non-existent or often went to wrong places in 3 of the 4 centres. This answer refers to e-portfolios. • More supporting evidence usually present on paper portfolios.
3.2.2 E-moderation
3.2.2.1 Once familiar with MAPS/Digitalbrain, how difficult was it to moderate?
Easy Average Difficult 0 1 1
3.2.2.2 Did you have problems using MAPS/Digitalbrain?
Yes No 1 1
If ‘yes’ please specify It took 11 minutes to download one half of one portfolio from one centre leading to total download time of 2 hours plus for one centre – without even looking at it. It took 19 hours one weekend to moderate two centres.
3.2.2.3 Please specify anything you would normally do as a moderator which MAPS/Digitalbrain prevented you from doing
20
• Scrolling backwards and forwards looking at more than one portfolio at a time – refer back to the previous candidates work quickly. • Look at two pieces of work together.
3.2.3 Comparing e-moderation with postal moderation
3.2.3.1 Did the way that you e-moderated differ from how you moderated during postal moderation?
Yes No
0 1 One participant did not respond to this question.
3.2.3.2 What further information, if any, would you require to better judge the authenticity of candidates' work when you are e-moderating?
Ability to view several candidates work at once – impossible I know.
3.2.3.3 Was there any further information you needed when you e-moderated which might have been available during postal moderation?
Yes No
1 1 If 'yes' please explain your answer Work which was not uploaded by centres – communication marks as well.
3.2.3.4 Do you prefer e-moderation or postal moderation?
E-moderation No preference Postal moderation 0 0 2
Please explain your answer Easy and quicker to moderate opening and looking at work will always take much less time than downloading work particularly as with one centre when there are more than 10 files to download from each candidate.
3.2.3.5 Please give up to three advantages you found with e-moderation 1. Easier to re-sample 1. Faster. 2. Easier to read some of the work.
21
3.2.3.6 Please give up to three advantages you found with postal moderation 1. Can view whole centres work at once. 2. Can skip between candidates quickly. 3. Can look backward and forward through one candidate’s work more easily. 4. Can more easily examine work in light of teacher annotation. 1. Able to compare portfolios. 2. Hand drawings and graphs of candidates.
3.2.3.7 What improvements could be made to e-moderation? • Too difficult to say . Ability to look at several candidates’ work simultaneously. Increase speed of internet communication from 256 Mb/sec to 256 Gb/sec perhaps. • Allow you to open 2 or more documents at same time. Better facility for teacher annotation.
3.2.3.8 Which was faster e-moderation or postal moderation?
E-moderation Postal moderation 0 2
This is a contrast to 3.2.3.5 where one e-moderator said that an advantage of e-moderation is that it is faster. What made this type of moderation faster? • Can see all the work at once, easier to scroll through work. Quicker to open a portfolio than to download it (by an enormous factor). • Ability to scan for evidence.
3.2.4 Choosing samples for moderation
3.2.4.1 Did any factors in addition to the guidance given in QCA Code of Practice and OCR documents influence your choice of e-portfolios for moderation samples?
Yes No
0 2
3.2.4.2 Were there any factors which influenced your choice of sample of e-portfolios which would not apply to paper portfolios?
Yes No
1 1 If ‘yes’ please specify
22
• Work which had not been uploaded had to be ignored. • I had to do all so there was no sample.
3.2.4.3 Were there any factors which influenced your choice of sample of paper portfolios which would not apply to e-portfolios?
Yes No
0 2
3.2.4.4 Did you do anything differently when choosing a sample of e-portfolios as opposed to paper portfolios?
Yes No
1 1 If ‘yes’ please specify Selected more candidates.
3.2.5 Recommending ranges of marks to be adjusted
3.2.5.1 Did any factors in addition to the guidance given in QCA Code of Practice and OCR documents influence your recommendations for ranges of marks to be adjusted?
Yes No
1 1 If ‘yes’ please specify Lack of evidence due to work not being uploaded.
3.2.5.2 Were there any factors which influenced your recommendations for ranges of marks to be adjusted for e-portfolios which would not apply to paper portfolios?
Yes No
1 1 If ‘yes’ please specify See above.
23

3.2.5.3 Were there any factors which influenced your recommendations of ranges of marks to be adjusted for paper portfolios which would not apply to e-portfolios?
Yes No
0 2
3.2.5.4 Did you do anything differently when recommending ranges of marks to be adjusted for e-portfolios as opposed to paper portfolios?
Yes No
1 1 If ‘yes’ please specify Had to take into account that for 3 of the 4 centres both strands had not been uploaded.
24

4 Content analysis Content analysis is a method of comparing the contents of different documents or groups of documents. It has been applied to the conventional and e-portfolios to explore differences in content which might be created by the media. It was intended that the content analysis sample would be matched for e-portfolios and paper portfolios across the centres which should have been used in the statistical analysis. However as some centres dropped out of the project this was not possible. The sample was limited by the small number of e-portfolios in the GNVQ centre which took part in the evaluation. The sample was also limited by the coursework that could be spared for research by the Awarding Body for use in the project. Centres understandably want their coursework to be returned to them by the end of the summer term so that it can be returned to candidates. Some of the portfolios were large and this meant that the data capture for the content analysis was particularly time consuming (about 2 or 3 hours per portfolio) and there was not sufficient time to complete it. Due to these various reasons an analysis has been presented on a data set which is smaller and less balanced than originally intended. There were some diagrams and images in the portfolios about which the researcher needs to make assumptions to code them. For example, some portfolios contain graphs and diagrams which appear to be from text books or similar references and references are given in the portfolio but exactly what is from those sources is not always obvious. Given these caveats and the small size of the sample the generalisability of the results is limited.
4.1 Method
4.1.1 Sample For ICT there were six e-portfolios (three from project 2 and three from project 1) from four centres and six paper portfolios from four other centres. There were eight e-portfolios from one centre and six paper portfolios from four centres for GNVQ. As far as possible the marks of the portfolios in each group (subject and conventional versus e-portfolios) covered the range of marks available.
4.1.2 Materials E-portfolios and paper portfolios came from a variety of centres. There was very little time between the paper portfolios being used for moderation and when they needed to be returned to centres. Given this short time frame and the large amount of time that is needed for a content analysis the paper portfolios were photocopied and the copies were used as the basis for the analysis.
4.1.3 Procedure Originally the content analysis was undertaken on fourteen GNVQ portfolios and eight ICT portfolios. Data was recorded about the contents of each page. Some of the portfolios were large and this meant that the data capture for the content analysis was particularly time consuming (about 2 or 3 hours per portfolio) and there was not sufficient time to complete it. Therefore the
25

data capture process was changed and the presence or not of content in a portfolio was used as a data capture strategy for further portfolios to make the final sample. Data which had already been captured using the original strategy was electronically recoded to indicate the presence or not of features in a portfolio. The content analysis was restricted to the candidates work and mark sheets/ teachers comments but not the resources provided by teachers on the website. A qualitative coding frame was developed from the contents of a small number of paper and e-portfolios from a variety of centres and projects. The final coding frame was applied to all portfolios from all projects. The codes were mutually exclusive.
4.1.4 Analysis As there were different numbers of e-portfolios and paper portfolios the percentage of portfolios containing a feature rather than the frequencies are given. Subsequently a permuted (rearranged) data matrix was produced using cluster analysis. Cluster analysis is a way of aggregating data so that cases or variables which behave in a similar way are clustered together. The codes about different types of electronic files used to stored candidates’ work in e-portfolios were not included in this analysis.
4.2 Results Given the caveats listed earlier and the small size of the sample the generalisability of the results is limited.
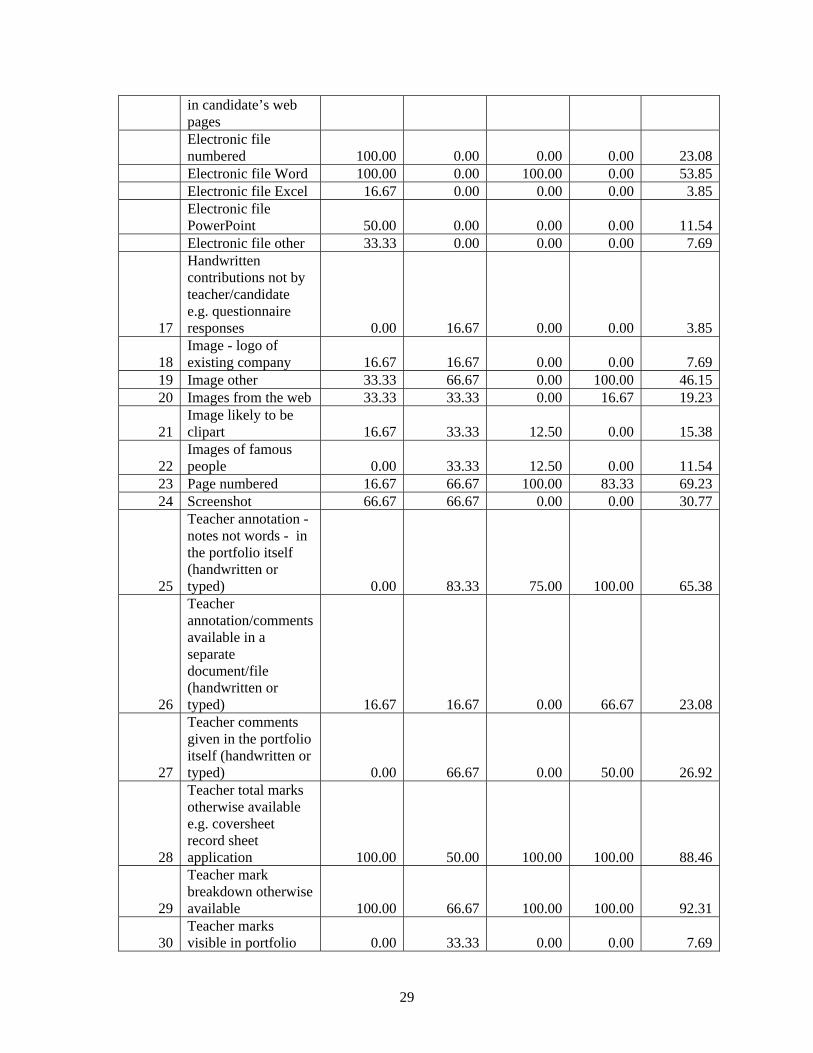
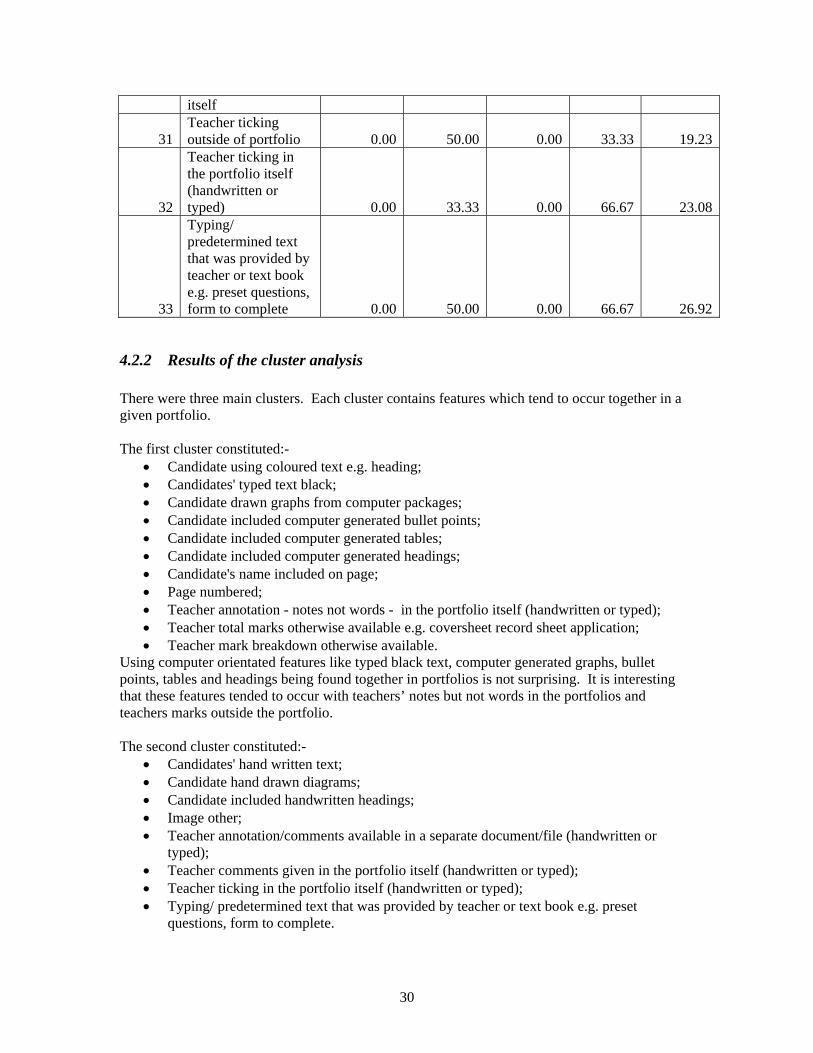
4.2.1 The proportions of portfolios with particular features There are some features which are not found in the e-portfolios:-
• Candidate created image by hand e.g. their design; • Candidate drawn diagrams with a computer; • Candidate hand drawn graphs; • Candidate included handwritten bullet points; • Handwritten contributions not by teacher/candidate e.g. questionnaire responses; • Teacher comments given in the portfolio itself (handwritten or typed); • Teacher marks visible in portfolio itself; • Teacher ticking outside of portfolio; • Teacher ticking in the portfolio itself (handwritten or typed); • Typing/ predetermined text that was provided by a teacher or text book e.g. preset
questions, form to complete. Some of these codes refer to hand written or hand drawn work or marking or annotation contributions by the teacher. But e-portfolios do contain some hand drawn diagrams and tables, hand written text and headings. Some science e-portfolios did contain some teacher annotations. This suggests that there is less hand written or hand drawn work in the e-portfolios than in the paper portfolios. The lack of inclusion of hand drawn graphs, for example, graphs with lines of best fit in the GNVQ e-portfolios was raised by the e-moderator in the questionnaire as candidates are encouraged to use them in their portfolios. Perhaps in the case of the sample of GNVQ e-portfolios this was because the e-portfolios were not for live moderation and the centre might be more conscientious for live moderation and scan in hand drawn graphs in that situation. There are other ways of entering hand drawn or written items into an e-portfolio but scanning was the mechanism mentioned by teachers in questionnaires. The lack of teacher's marking or
26
annotations in the e-portfolios and on accompanying sheets or files is an issue which was raised by the e-moderators in interviews. The lack of text provided by a teacher or text book could be a good sign for e-portfolios as the candidate has created the work themselves. Alternatively it could be that the teacher provided resources in the applications e.g. statement of the task were not included in the analysis only the candidates’ work was included. There were some codes about the types of files used to store portfolios which were designed to apply to e-portfolios only. Note that these were the types of file used to save the e-portfolios not the range of software applications the candidates used whilst compiling their coursework. The codes were:-
• electronic file named in candidate’s web pages; • electronic file numbered; • electronic file word; • electronic file excel; • electronic file PowerPoint; • electronic file other.
All e-portfolios contained word files. The ICT portfolios contained a wider variety of types of files – the Science e-portfolios were only saved in word files. This does not mean that the candidates necessarily only used word. They might have used Excel to drawn a graph and then imported the graph into the word file. The one code which was only applicable to e-portfolios and which was designed to cover both paper and e-portfolios was the candidate using coloured text. This might be due to using photocopies of candidates paper portfolios rather than the originals or it could be that colour wasn’t used in the first place. This finding does fit with the questionnaire responses from centres that colour was more widely used in e-portfolios than in conventional portfolios.
27
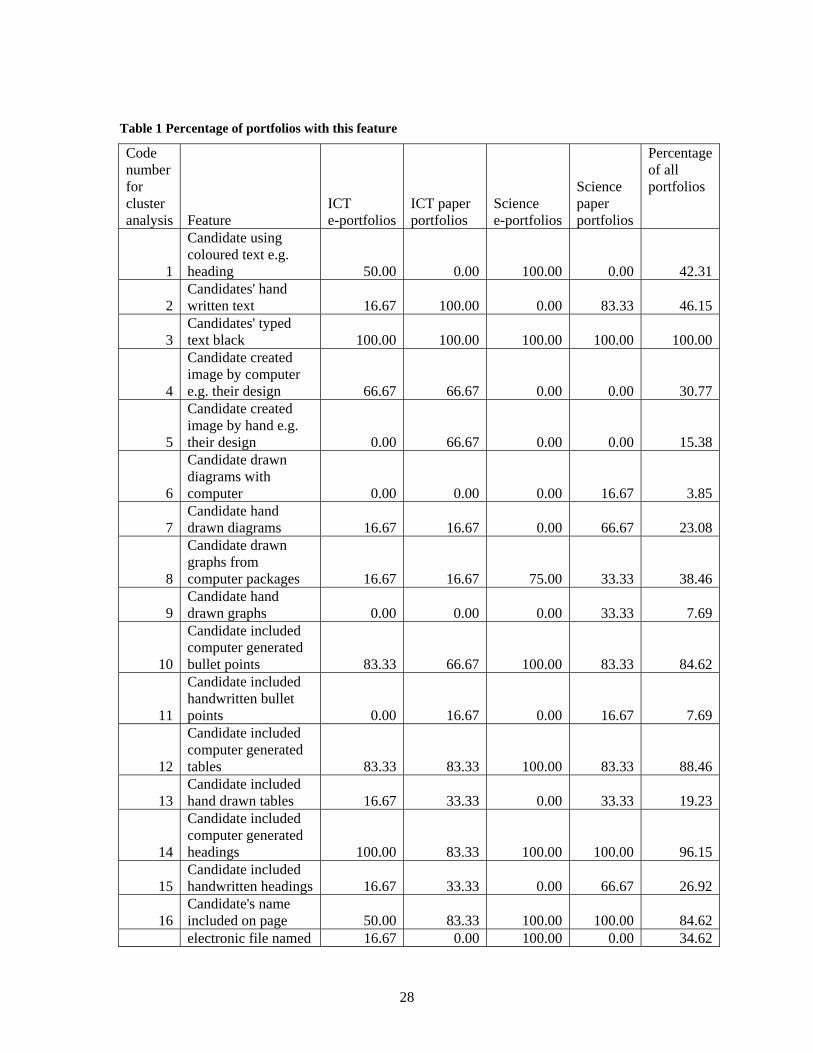
Table 1 Percentage of portfolios with this feature
Code number for cluster analysis Feature
ICT e-portfolios
ICT paper portfolios
Science e-portfolios
Science paper portfolios
Percentage of all portfolios
1
Candidate using coloured text e.g. heading 50.00 0.00 100.00 0.00 42.31
2 Candidates' hand written text 16.67 100.00 0.00 83.33 46.15
3 Candidates' typed text black 100.00 100.00 100.00 100.00 100.00
4
Candidate created image by computer e.g. their design 66.67 66.67 0.00 0.00 30.77
5
Candidate created image by hand e.g. their design 0.00 66.67 0.00 0.00 15.38
6
Candidate drawn diagrams with computer 0.00 0.00 0.00 16.67 3.85
7 Candidate hand drawn diagrams 16.67 16.67 0.00 66.67 23.08
8
Candidate drawn graphs from computer packages 16.67 16.67 75.00 33.33 38.46
9 Candidate hand drawn graphs 0.00 0.00 0.00 33.33 7.69
10
Candidate included computer generated bullet points 83.33 66.67 100.00 83.33 84.62
11
Candidate included handwritten bullet points 0.00 16.67 0.00 16.67 7.69
12
Candidate included computer generated tables 83.33 83.33 100.00 83.33 88.46
13 Candidate included hand drawn tables 16.67 33.33 0.00 33.33 19.23
14
Candidate included computer generated headings 100.00 83.33 100.00 100.00 96.15
15 Candidate included handwritten headings 16.67 33.33 0.00 66.67 26.92
16 Candidate's name included on page 50.00 83.33 100.00 100.00 84.62
electronic file named 16.67 0.00 100.00 0.00 34.62
28
in candidate’s web pages
Electronic file numbered 100.00 0.00 0.00 0.00 23.08
Electronic file Word 100.00 0.00 100.00 0.00 53.85 Electronic file Excel 16.67 0.00 0.00 0.00 3.85
Electronic file PowerPoint 50.00 0.00 0.00 0.00 11.54
Electronic file other 33.33 0.00 0.00 0.00 7.69
17
Handwritten contributions not by teacher/candidate e.g. questionnaire responses 0.00 16.67 0.00 0.00 3.85
18 Image - logo of existing company 16.67 16.67 0.00 0.00 7.69
19 Image other 33.33 66.67 0.00 100.00 46.1520 Images from the web 33.33 33.33 0.00 16.67 19.23
21 Image likely to be clipart 16.67 33.33 12.50 0.00 15.38
22 Images of famous people 0.00 33.33 12.50 0.00 11.54
23 Page numbered 16.67 66.67 100.00 83.33 69.2324 Screenshot 66.67 66.67 0.00 0.00 30.77
25
Teacher annotation - notes not words - in the portfolio itself (handwritten or typed) 0.00 83.33 75.00 100.00 65.38
26
Teacher annotation/comments available in a separate document/file (handwritten or typed) 16.67 16.67 0.00 66.67 23.08
27
Teacher comments given in the portfolio itself (handwritten or typed) 0.00 66.67 0.00 50.00 26.92
28
Teacher total marks otherwise available e.g. coversheet record sheet application 100.00 50.00 100.00 100.00 88.46
29
Teacher mark breakdown otherwise available 100.00 66.67 100.00 100.00 92.31
30 Teacher marks visible in portfolio 0.00 33.33 0.00 0.00 7.69
29
itself
31 Teacher ticking outside of portfolio 0.00 50.00 0.00 33.33 19.23
32
Teacher ticking in the portfolio itself (handwritten or typed) 0.00 33.33 0.00 66.67 23.08
33
Typing/ predetermined text that was provided by teacher or text book e.g. preset questions, form to complete 0.00 50.00 0.00 66.67 26.92
4.2.2 Results of the cluster analysis There were three main clusters. Each cluster contains features which tend to occur together in a given portfolio. The first cluster constituted:-
• Candidate using coloured text e.g. heading; • Candidates' typed text black; • Candidate drawn graphs from computer packages; • Candidate included computer generated bullet points; • Candidate included computer generated tables; • Candidate included computer generated headings; • Candidate's name included on page; • Page numbered; • Teacher annotation - notes not words - in the portfolio itself (handwritten or typed); • Teacher total marks otherwise available e.g. coversheet record sheet application; • Teacher mark breakdown otherwise available.
Using computer orientated features like typed black text, computer generated graphs, bullet points, tables and headings being found together in portfolios is not surprising. It is interesting that these features tended to occur with teachers’ notes but not words in the portfolios and teachers marks outside the portfolio. The second cluster constituted:-
• Candidates' hand written text; • Candidate hand drawn diagrams; • Candidate included handwritten headings; • Image other; • Teacher annotation/comments available in a separate document/file (handwritten or
typed); • Teacher comments given in the portfolio itself (handwritten or typed); • Teacher ticking in the portfolio itself (handwritten or typed); • Typing/ predetermined text that was provided by teacher or text book e.g. preset
questions, form to complete.
30
The second cluster tends to refer to hand written or hand drawn features. Judging by the percentages in Table 1 above these features tend to occur in the paper portfolios. This means that there are some features which tend to be found together in paper portfolios rather than in e-portfolios. Perhaps these features are replaced by electronic features in e-portfolios e.g. computer generated graphs, word processed headings and text, teacher comments given in separate files in e-moderation packages. The third cluster contained features which occurred infrequently and there was insufficient data to interpret.
31
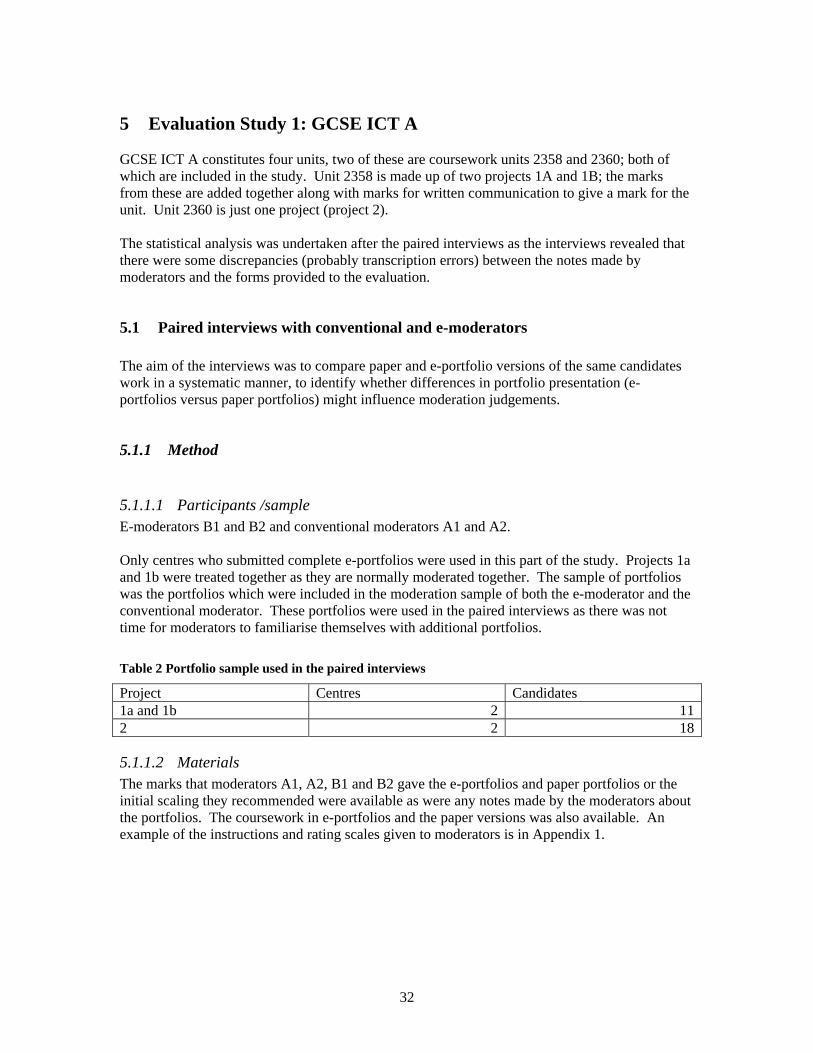
5 Evaluation Study 1: GCSE ICT A GCSE ICT A constitutes four units, two of these are coursework units 2358 and 2360; both of which are included in the study. Unit 2358 is made up of two projects 1A and 1B; the marks from these are added together along with marks for written communication to give a mark for the unit. Unit 2360 is just one project (project 2). The statistical analysis was undertaken after the paired interviews as the interviews revealed that there were some discrepancies (probably transcription errors) between the notes made by moderators and the forms provided to the evaluation.
5.1 Paired interviews with conventional and e-moderators The aim of the interviews was to compare paper and e-portfolio versions of the same candidates work in a systematic manner, to identify whether differences in portfolio presentation (e-portfolios versus paper portfolios) might influence moderation judgements.
5.1.1 Method
5.1.1.1 Participants /sample E-moderators B1 and B2 and conventional moderators A1 and A2. Only centres who submitted complete e-portfolios were used in this part of the study. Projects 1a and 1b were treated together as they are normally moderated together. The sample of portfolios was the portfolios which were included in the moderation sample of both the e-moderator and the conventional moderator. These portfolios were used in the paired interviews as there was not time for moderators to familiarise themselves with additional portfolios. Table 2 Portfolio sample used in the paired interviews
Project Centres Candidates 1a and 1b 2 112 2 18
5.1.1.2 Materials The marks that moderators A1, A2, B1 and B2 gave the e-portfolios and paper portfolios or the initial scaling they recommended were available as were any notes made by the moderators about the portfolios. The coursework in e-portfolios and the paper versions was also available. An example of the instructions and rating scales given to moderators is in Appendix 1.
32

5.1.1.3 Procedure To choose which portfolios to use in the interviews the differences between the scaling suggested by moderators at the portfolio level were used. To do this the original version of the Moderator’s Adjustment Form (MAF) was utilised so that the moderation judgements were the original moderation judgements made by moderators not judgements which had been changed after monitoring procedures. Pairs of paper and e-portfolios where there was little or no difference between the marks given by moderators (i.e. they are within tolerance) and where the biggest differences between the marks recommended by moderators (i.e. the judgements are not within tolerance) occur were identified. Some project 1a and project 1b MAFs referred to marks without communication and others referred to marks with communication3. The process described above ignored any differences in the approaches to recording marks in the MAF, on the basis that the moderation process ignored these differences. It was difficult to find portfolios where the difference between moderators judgements was outside of tolerance. For projects 1a and 1b there was only one such portfolio available (which was only 1 mark out of tolerance). For project 2 there were three portfolios available where there was a difference outside of tolerance. Due to time constraints all moderators were interviewed about the portfolios of two candidates and were asked to rate both portfolios. There was one candidate where there was a small difference and one candidate where there was a large difference between the recommendations about the paper and e-portfolio version of the coursework. The moderators of project 2 rated an additional two candidates' portfolios both of which had a large difference between the moderation judgements. The moderators were shown a pair of paper and e-portfolios where there was little or no difference between the marks given by the moderators (they were within tolerance). The moderators were interviewed using the Kelly’s Repertory Grid technique to list the similarities and differences between the portfolios. In consultation with the moderators each similarity and difference, such as organisation, was changed into a continuum e.g. from well to poorly organised. The characteristic at the end of each continuum is a bi-polar construct which forms the extremities of rating scales. In the example given 'well organised' would be one end of the rating scale and 'poorly organised' would be another. This was repeated for another pair of portfolios for which there was a big or the biggest difference between the moderators’ marks (they were outside tolerance)4. Subsequently, if time allowed the procedure was repeated for other pairs of portfolios one within tolerance and one
3 Discussion with moderators during the interviews indicated that the information that conventional and e- moderators received about marks was presented slightly differently and that this meant that some recorded totals with communication marks and others recorded totals without communication marks on the MAF. The moderators had not known about this difference until the interviews. 4 Initially it was thought that there was a much larger difference between the moderators’ judgements. But the moderators pointed out from their notes rather than the MAF that there was a transcription error from the moderators’ notes to the MAF. When this was corrected there was still a discrepancy of one mark above tolerance.
33
outside of tolerance. For the moderators to use the rating scales the constructs relating to ratings of 1 and 5 were chosen as intuitively as possible. The moderators rated all the portfolios used in the interviews on each of the rating scales. The moderators also ranked the constructs in terms of how influential they were on moderation judgements.
5.1.1.4 Analysis Where necessary the ratings of 1 to 5 were reversed so that 5 was advantageous and 1 was a disadvantage. The ratings given by the moderators were explored using cluster analysis. Cluster analysis is a way of aggregating data so that cases or variables which behave in a similar way are clustered together. The analysis was run in two different ways firstly to portfolios and secondly to cluster continuums. The ranking of the constructs (continuums) in terms of how influential they are on moderation judgements was also compared.
34
35
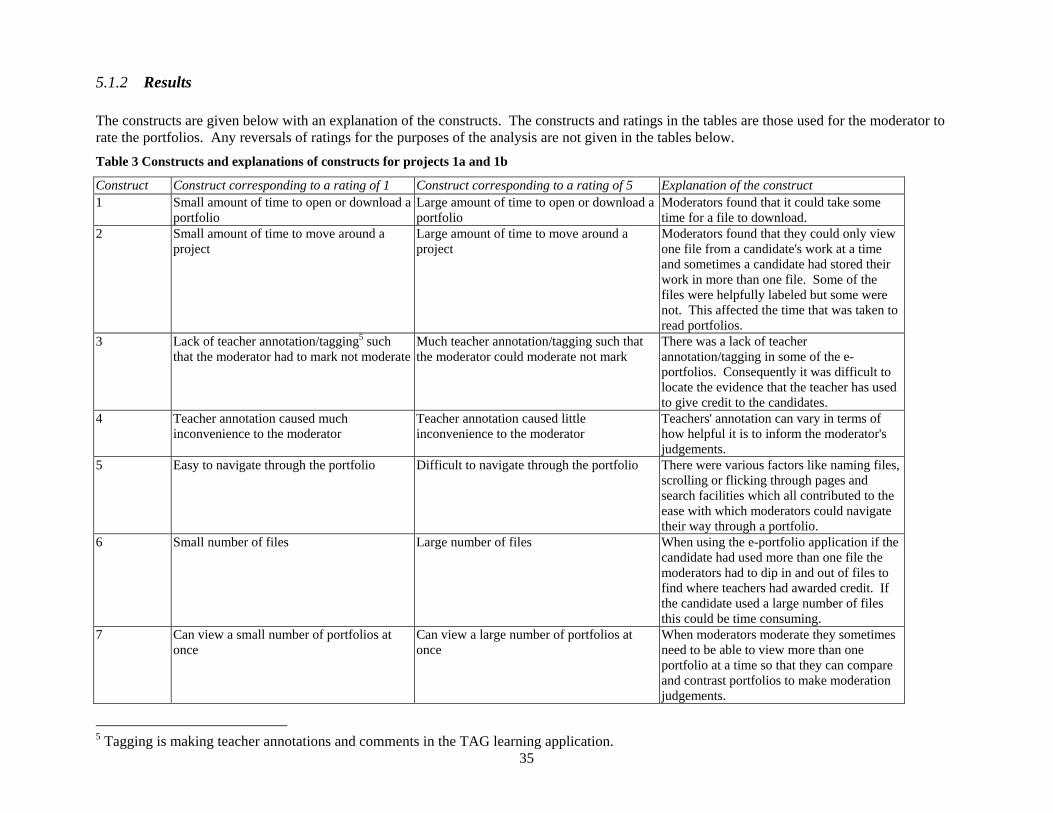
5.1.2 Results The constructs are given below with an explanation of the constructs. The constructs and ratings in the tables are those used for the moderator to rate the portfolios. Any reversals of ratings for the purposes of the analysis are not given in the tables below. Table 3 Constructs and explanations of constructs for projects 1a and 1b
Construct Construct corresponding to a rating of 1 Construct corresponding to a rating of 5 Explanation of the construct 1 Small amount of time to open or download a
portfolio Large amount of time to open or download a portfolio
Moderators found that it could take some time for a file to download.
2 Small amount of time to move around a project
Large amount of time to move around a project
Moderators found that they could only view one file from a candidate's work at a time and sometimes a candidate had stored their work in more than one file. Some of the files were helpfully labeled but some were not. This affected the time that was taken to read portfolios.
3 Lack of teacher annotation/tagging5 such that the moderator had to mark not moderate
Much teacher annotation/tagging such that the moderator could moderate not mark
There was a lack of teacher annotation/tagging in some of the e-portfolios. Consequently it was difficult to locate the evidence that the teacher has used to give credit to the candidates.
4 Teacher annotation caused much inconvenience to the moderator
Teacher annotation caused little inconvenience to the moderator
Teachers' annotation can vary in terms of how helpful it is to inform the moderator's judgements.
5 Easy to navigate through the portfolio Difficult to navigate through the portfolio There were various factors like naming files, scrolling or flicking through pages and search facilities which all contributed to the ease with which moderators could navigate their way through a portfolio.
6 Small number of files Large number of files When using the e-portfolio application if the candidate had used more than one file the moderators had to dip in and out of files to find where teachers had awarded credit. If the candidate used a large number of files this could be time consuming.
7 Can view a small number of portfolios at once
Can view a large number of portfolios at once
When moderators moderate they sometimes need to be able to view more than one portfolio at a time so that they can compare and contrast portfolios to make moderation judgements.
5 Tagging is making teacher annotations and comments in the TAG learning application.
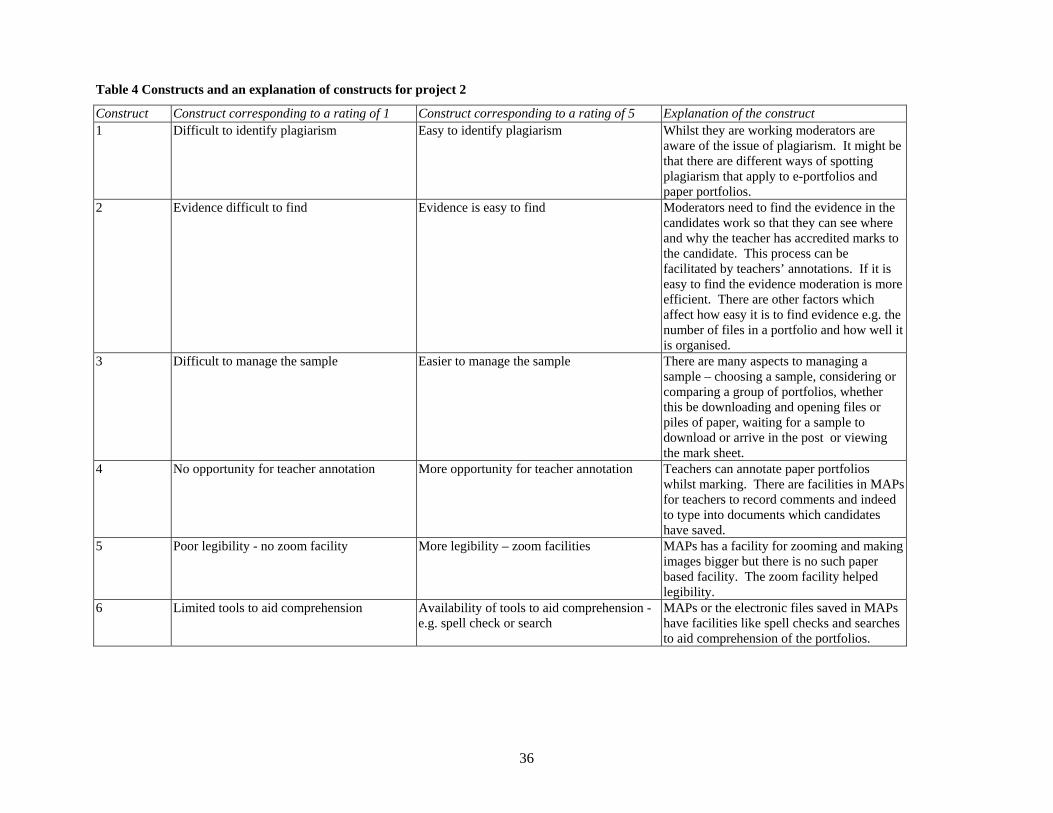
Table 4 Constructs and an explanation of constructs for project 2
Construct Construct corresponding to a rating of 1 Construct corresponding to a rating of 5 Explanation of the construct 1 Difficult to identify plagiarism Easy to identify plagiarism Whilst they are working moderators are
aware of the issue of plagiarism. It might be that there are different ways of spotting plagiarism that apply to e-portfolios and paper portfolios.
2 Evidence difficult to find Evidence is easy to find Moderators need to find the evidence in the candidates work so that they can see where and why the teacher has accredited marks to the candidate. This process can be facilitated by teachers’ annotations. If it is easy to find the evidence moderation is more efficient. There are other factors which affect how easy it is to find evidence e.g. the number of files in a portfolio and how well it is organised.
3 Difficult to manage the sample Easier to manage the sample There are many aspects to managing a sample – choosing a sample, considering or comparing a group of portfolios, whether this be downloading and opening files or piles of paper, waiting for a sample to download or arrive in the post or viewing the mark sheet.
4 No opportunity for teacher annotation More opportunity for teacher annotation Teachers can annotate paper portfolios whilst marking. There are facilities in MAPs for teachers to record comments and indeed to type into documents which candidates have saved.
5 Poor legibility - no zoom facility More legibility – zoom facilities MAPs has a facility for zooming and making images bigger but there is no such paper based facility. The zoom facility helped legibility.
6 Limited tools to aid comprehension Availability of tools to aid comprehension - e.g. spell check or search
MAPs or the electronic files saved in MAPs have facilities like spell checks and searches to aid comprehension of the portfolios.
36
5.1.2.1 Cluster analysis results for projects 1a and 1b
5.1.2.1.1 Clustering portfolios For projects 1a and 1b there were two clusters, one for the e-portfolios and one for the paper portfolios. But there were no subclusters or clusters, which corresponded to the size of the difference between the judgements made by the moderators.
5.1.2.1.2 Clustering constructs The clustering of the constructs for projects 1a and 1b was not obvious. There were two alternative clustering patterns one with two clusters and the other with three clusters. If two clusters were taken the first would constitute all constructs except construct 7 and the second cluster would be construct 7. Construct 7 was the number of files in a portfolio. If three clusters were used then again one cluster was construct 7. The second cluster was constructs 1, 2 and 5. These constructs are the difficulty of identifying plagiarism, the difficulty of finding evidence and legibility. The third cluster was constructs 3, 4 and 6. These constructs were about the difficulty of managing the sample, the opportunity for teacher annotation and the availability of tools to aid comprehension.
5.1.2.2 Clustering analysis results for project 2
5.1.2.2.1 Clustering portfolios The clustering of the portfolios resulted in two clusters being formed. The first contained the e-portfolios and the second the paper portfolios. There were no clusters, which could be explained by the size of the difference between the recommendations made by the moderators.
5.1.2.2.2 Clustering constructs The clustering of the constructs for project 2 produced two clusters. The first was constructs 1 to 4 about how difficult it is to find evidence, to identify plagiarism, manage the sample and the opportunities for teacher annotation. The second cluster was formed from the remaining constructs (5 and 6) which were about legibility and the tools available to aid comprehension.
5.1.2.3 How influential was each construct on moderation judgements? The moderators for projects 1a and 1b agreed that the most influential construct on moderation judgements was the time it took to open or download a portfolio (construct 1). The moderators gave similar ratings to one another for constructs 2, 3, and 4 which were about the amount of time to move around a project, whether teacher annotation meant the moderator had to mark or moderate and how much inconvenience it caused to the moderator. One moderator gave a rating of 8 to constructs 5, 6 and 7 which were about the ease of navigation through the portfolio, the number of files in a portfolio and how many portfolios could be viewed at once. But the other
37

moderator gave lower ratings to these constructs. It might be that the e-moderator thought these constructs were more important as they had more experience of using the software. The project 2 e-moderator and conventional moderator agreed that constructs 2, 3 and 4 which were about how difficult it was to find evidence in the portfolios, the ease of managing the sample and the opportunity for teacher annotation were the three most influential constructs. The conventional moderator rated all of them as 7. But the e-moderator rated construct 2 which was about the ease of finding evidence as 10 - the highest possible rank. The paper moderator rated constructs 5 and 6 which were about legibility and availability of tools to aid comprehension as 6, the e-moderator thought these were all less influential and rated them as 3. The paper moderator and the e-moderator both rated construct 1 (which was about the ease of identifying plagiarism) as 3 and the least influential. There were some differences between the moderator’s ratings which might be due to their differing amount of experience with e-moderation.
5.1.2.4 Other comments made by moderators The project 1a and 1b moderators were surprised that the samples of candidates that they had moderated were not the same, as they knew it was part of the intended evaluation design. There was some overlap in the two samples, however. It is not clear why somewhat different samples were moderated. The moderators also said that the differences between moderation judgements were not caused by the medium, but rather by different approaches to moderation and centre differences. During the course of the interview about project 2, the moderators raised a number of issues related to more general concerns, namely, what they saw as the advantages and disadvantages of e-moderation overall. Greater demand and expense in terms of available resources to do the work. The moderators
raised the point that e-moderation required that moderators had the necessary hardware available at home in order to carry out the work. They noted that the Awarding Body could not simply assume that this would be the case, not least because of the expense. High maintenance of resources to do the job. Leading on from the above point, they also noted
that the software, necessary to run the e-portfolio application would presumably need updating on a regular basis. This once again raised a cost issue and most importantly whose responsibility it would be to bear such costs. Presentation of the allocation of marks was confusing on the e-portfolio version (e.g.
communication and project totals). One moderator had assumed that because the communication mark had been listed separately, it needed to be added on to the candidate’s total mark. This in fact was not the case as the total mark already included the communication mark. The moderators commented that they could foresee that having e-portfolios would enable OCR
to monitor centres which flouted the deadlines for the submission of coursework. They felt that it offered the opportunity for centres to submit the work more reliably and more efficiently and that it afforded the Awarding Body greater control over regulating and dealing with those who did/did not meet the deadline.
38
The moderators felt that when presented with the e-portfolio, teachers assumed that candidates had checked the spelling and grammar of their work by using the appropriate facilities provided by the application (i.e. spellchecker, etc). The moderators noted that the number of spelling errors in the sample they had seen suggested this had not been the case. Candidates were still awarded top marks for quality of written communication thus suggesting that the work had not been checked by the candidate or teacher. Teachers therefore need to be aware of this issue. Following on from the above point, one moderator thought that the paper version of the
portfolio encouraged candidates to take more care about the presentation of their work in terms of making sure that it was ‘readable’ to its audience. The e-portfolios seen, suggested that candidates forgot this aspect; for example page breaks were not used to signify different headings. This made it more difficult to read.
5.2 Statistical analysis of moderators judgements The statistical analysis was undertaken after the paired interviews given the issues raised by the moderators about a transcription error between a moderator's notes and a MAF. The aim of the statistical analysis was to identify whether the medium affected moderation judgements such that there was a difference between the judgements made about e-portfolios and the paper version of the e-portfolios.
5.2.1 Method
5.2.1.1 Participants/sample E-moderators B1 and B2 and conventional moderators A1 and A2 were included. There were 4 centres who submitted e-portfolios. When these e-portfolios were also paper moderated they are included in the sample. The sample constituted portfolios from:- • 2 centres for projects 1a and 1b; • 2 centres for project 1b; • 2 centres for project 2. A portfolio did not occur in more than one group. There were a handful of candidates for whom there were project 1a e-portfolios only and these portfolios and corresponding marks were omitted from the data as there were too few from which to gain meaningful statistics.
5.2.1.2 Analysis The judgements that moderators had made about individual candidates were not entirely clear from the MAFs, moderators’ notes and evaluation team notes from the paired interviews. The firmest information from the MAFs was the first set of ranges that the moderators recommended for scaling the centre marks. These ranges always referred to the whole range of marks available where as the MAFs sometimes referred to marks with communication and sometimes marks without communication. The moderators had arrived at these recommendations individually and before monitoring procedures were applied. So these ranges/ scalings were applied to the centre
39
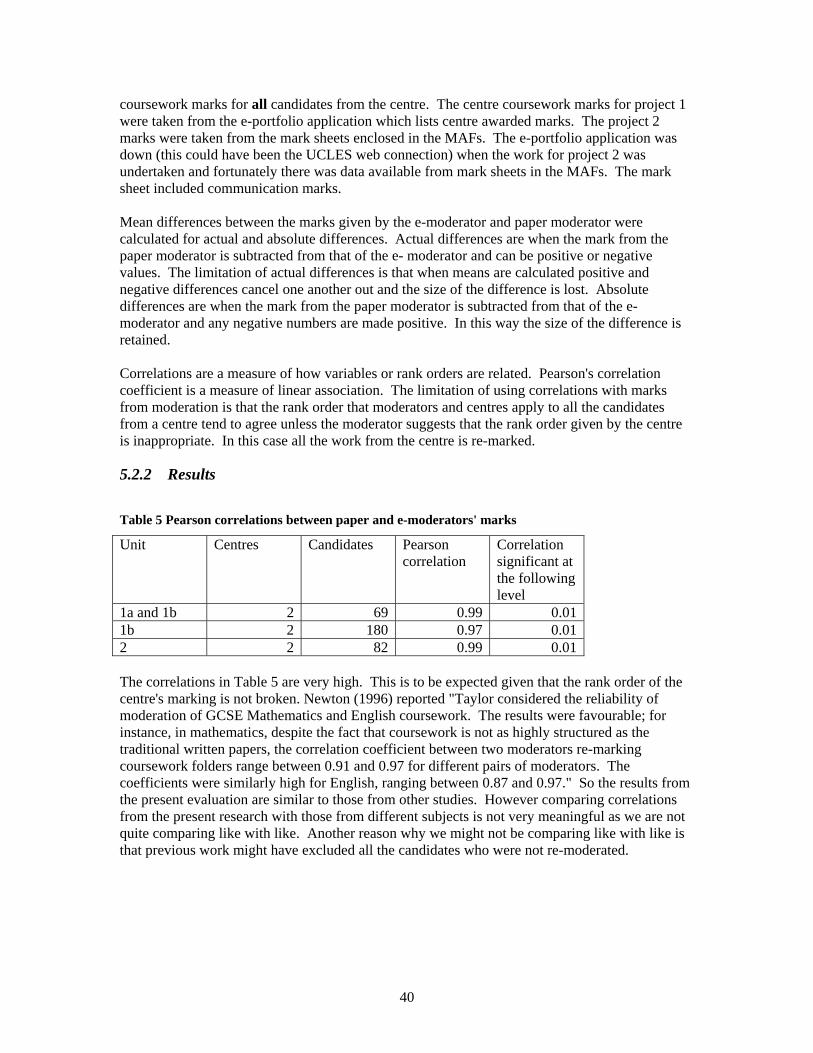
coursework marks for all candidates from the centre. The centre coursework marks for project 1 were taken from the e-portfolio application which lists centre awarded marks. The project 2 marks were taken from the mark sheets enclosed in the MAFs. The e-portfolio application was down (this could have been the UCLES web connection) when the work for project 2 was undertaken and fortunately there was data available from mark sheets in the MAFs. The mark sheet included communication marks. Mean differences between the marks given by the e-moderator and paper moderator were calculated for actual and absolute differences. Actual differences are when the mark from the paper moderator is subtracted from that of the e- moderator and can be positive or negative values. The limitation of actual differences is that when means are calculated positive and negative differences cancel one another out and the size of the difference is lost. Absolute differences are when the mark from the paper moderator is subtracted from that of the e-moderator and any negative numbers are made positive. In this way the size of the difference is retained. Correlations are a measure of how variables or rank orders are related. Pearson's correlation coefficient is a measure of linear association. The limitation of using correlations with marks from moderation is that the rank order that moderators and centres apply to all the candidates from a centre tend to agree unless the moderator suggests that the rank order given by the centre is inappropriate. In this case all the work from the centre is re-marked.
5.2.2 Results Table 5 Pearson correlations between paper and e-moderators' marks
Unit Centres Candidates Pearson correlation
Correlation significant at the following level
1a and 1b 2 69 0.99 0.01 1b 2 180 0.97 0.01 2 2 82 0.99 0.01 The correlations in Table 5 are very high. This is to be expected given that the rank order of the centre's marking is not broken. Newton (1996) reported "Taylor considered the reliability of moderation of GCSE Mathematics and English coursework. The results were favourable; for instance, in mathematics, despite the fact that coursework is not as highly structured as the traditional written papers, the correlation coefficient between two moderators re-marking coursework folders range between 0.91 and 0.97 for different pairs of moderators. The coefficients were similarly high for English, ranging between 0.87 and 0.97." So the results from the present evaluation are similar to those from other studies. However comparing correlations from the present research with those from different subjects is not very meaningful as we are not quite comparing like with like. Another reason why we might not be comparing like with like is that previous work might have excluded all the candidates who were not re-moderated.
40
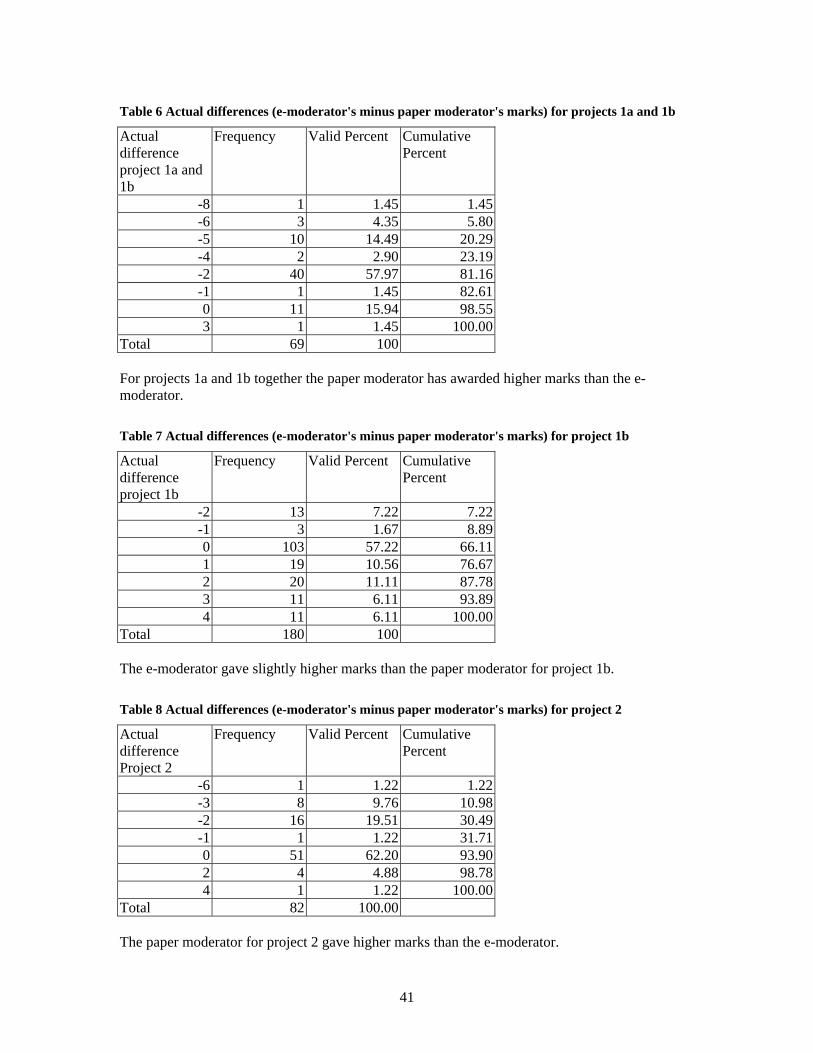
Table 6 Actual differences (e-moderator's minus paper moderator's marks) for projects 1a and 1b
Actual difference project 1a and 1b
Frequency Valid Percent Cumulative Percent
-8 1 1.45 1.45-6 3 4.35 5.80-5 10 14.49 20.29-4 2 2.90 23.19-2 40 57.97 81.16-1 1 1.45 82.610 11 15.94 98.553 1 1.45 100.00
Total 69 100 For projects 1a and 1b together the paper moderator has awarded higher marks than the e-moderator. Table 7 Actual differences (e-moderator's minus paper moderator's marks) for project 1b
Actual difference project 1b
Frequency Valid Percent Cumulative Percent
-2 13 7.22 7.22-1 3 1.67 8.890 103 57.22 66.111 19 10.56 76.672 20 11.11 87.783 11 6.11 93.894 11 6.11 100.00
Total 180 100 The e-moderator gave slightly higher marks than the paper moderator for project 1b. Table 8 Actual differences (e-moderator's minus paper moderator's marks) for project 2
Actual difference Project 2
Frequency Valid Percent Cumulative Percent
-6 1 1.22 1.22-3 8 9.76 10.98-2 16 19.51 30.49-1 1 1.22 31.710 51 62.20 93.902 4 4.88 98.784 1 1.22 100.00
Total 82 100.00 The paper moderator for project 2 gave higher marks than the e-moderator.
41
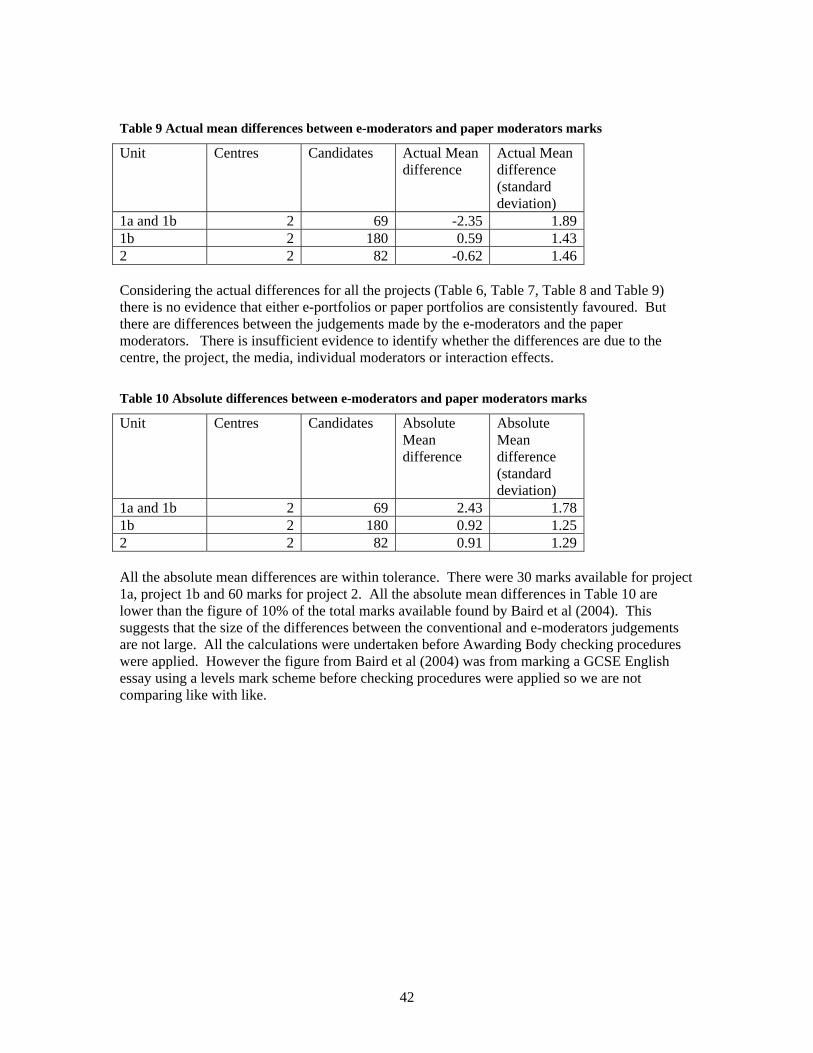
Table 9 Actual mean differences between e-moderators and paper moderators marks
Unit Centres Candidates Actual Mean difference
Actual Mean difference (standard deviation)
1a and 1b 2 69 -2.35 1.89 1b 2 180 0.59 1.43 2 2 82 -0.62 1.46 Considering the actual differences for all the projects (Table 6, Table 7, Table 8 and Table 9) there is no evidence that either e-portfolios or paper portfolios are consistently favoured. But there are differences between the judgements made by the e-moderators and the paper moderators. There is insufficient evidence to identify whether the differences are due to the centre, the project, the media, individual moderators or interaction effects. Table 10 Absolute differences between e-moderators and paper moderators marks
Unit Centres Candidates Absolute Mean difference
Absolute Mean difference (standard deviation)
1a and 1b 2 69 2.43 1.78 1b 2 180 0.92 1.25 2 2 82 0.91 1.29 All the absolute mean differences are within tolerance. There were 30 marks available for project 1a, project 1b and 60 marks for project 2. All the absolute mean differences in Table 10 are lower than the figure of 10% of the total marks available found by Baird et al (2004). This suggests that the size of the differences between the conventional and e-moderators judgements are not large. All the calculations were undertaken before Awarding Body checking procedures were applied. However the figure from Baird et al (2004) was from marking a GCSE English essay using a levels mark scheme before checking procedures were applied so we are not comparing like with like.
42
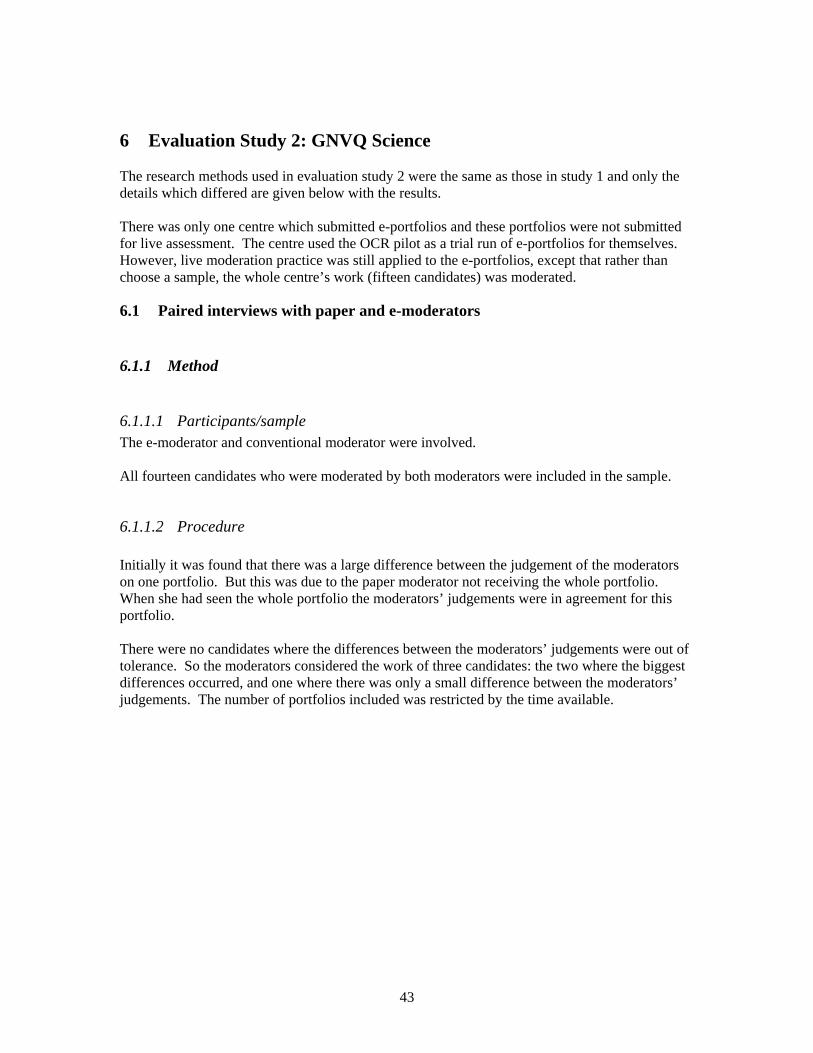
6 Evaluation Study 2: GNVQ Science The research methods used in evaluation study 2 were the same as those in study 1 and only the details which differed are given below with the results. There was only one centre which submitted e-portfolios and these portfolios were not submitted for live assessment. The centre used the OCR pilot as a trial run of e-portfolios for themselves. However, live moderation practice was still applied to the e-portfolios, except that rather than choose a sample, the whole centre’s work (fifteen candidates) was moderated.
6.1 Paired interviews with paper and e-moderators
6.1.1 Method
6.1.1.1 Participants/sample The e-moderator and conventional moderator were involved. All fourteen candidates who were moderated by both moderators were included in the sample.
6.1.1.2 Procedure Initially it was found that there was a large difference between the judgement of the moderators on one portfolio. But this was due to the paper moderator not receiving the whole portfolio. When she had seen the whole portfolio the moderators’ judgements were in agreement for this portfolio. There were no candidates where the differences between the moderators’ judgements were out of tolerance. So the moderators considered the work of three candidates: the two where the biggest differences occurred, and one where there was only a small difference between the moderators’ judgements. The number of portfolios included was restricted by the time available.
43
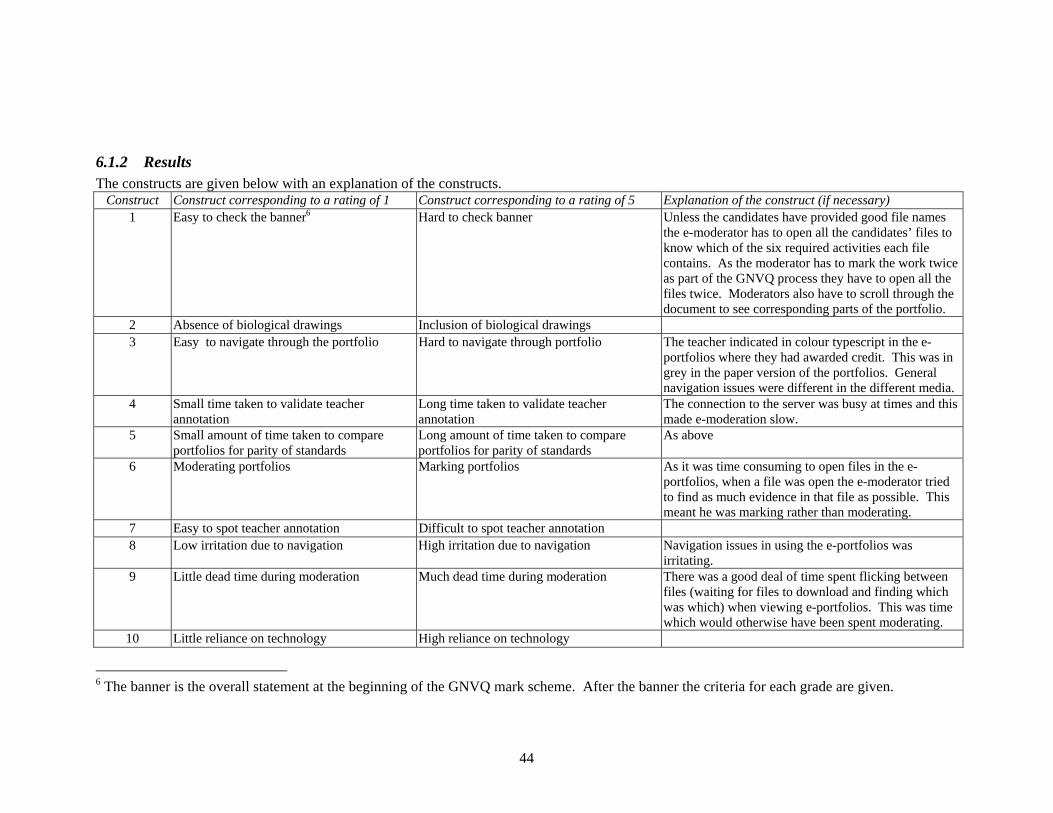
6.1.2 Results The constructs are given below with an explanation of the constructs.
Construct Construct corresponding to a rating of 1 Construct corresponding to a rating of 5 Explanation of the construct (if necessary) 1 Easy to check the banner6 Hard to check banner Unless the candidates have provided good file names
the e-moderator has to open all the candidates’ files to know which of the six required activities each file contains. As the moderator has to mark the work twice as part of the GNVQ process they have to open all the files twice. Moderators also have to scroll through the document to see corresponding parts of the portfolio.
2 Absence of biological drawings Inclusion of biological drawings 3 Easy to navigate through the portfolio Hard to navigate through portfolio The teacher indicated in colour typescript in the e-
portfolios where they had awarded credit. This was in grey in the paper version of the portfolios. General navigation issues were different in the different media.
4 Small time taken to validate teacher annotation
Long time taken to validate teacher annotation
The connection to the server was busy at times and this made e-moderation slow.
5 Small amount of time taken to compare portfolios for parity of standards
Long amount of time taken to compare portfolios for parity of standards
As above
6 Moderating portfolios Marking portfolios As it was time consuming to open files in the e-portfolios, when a file was open the e-moderator tried to find as much evidence in that file as possible. This meant he was marking rather than moderating.
7 Easy to spot teacher annotation Difficult to spot teacher annotation 8 Low irritation due to navigation High irritation due to navigation Navigation issues in using the e-portfolios was
irritating. 9 Little dead time during moderation Much dead time during moderation There was a good deal of time spent flicking between
files (waiting for files to download and finding which was which) when viewing e-portfolios. This was time which would otherwise have been spent moderating.
10 Little reliance on technology High reliance on technology
6 The banner is the overall statement at the beginning of the GNVQ mark scheme. After the banner the criteria for each grade are given.
44
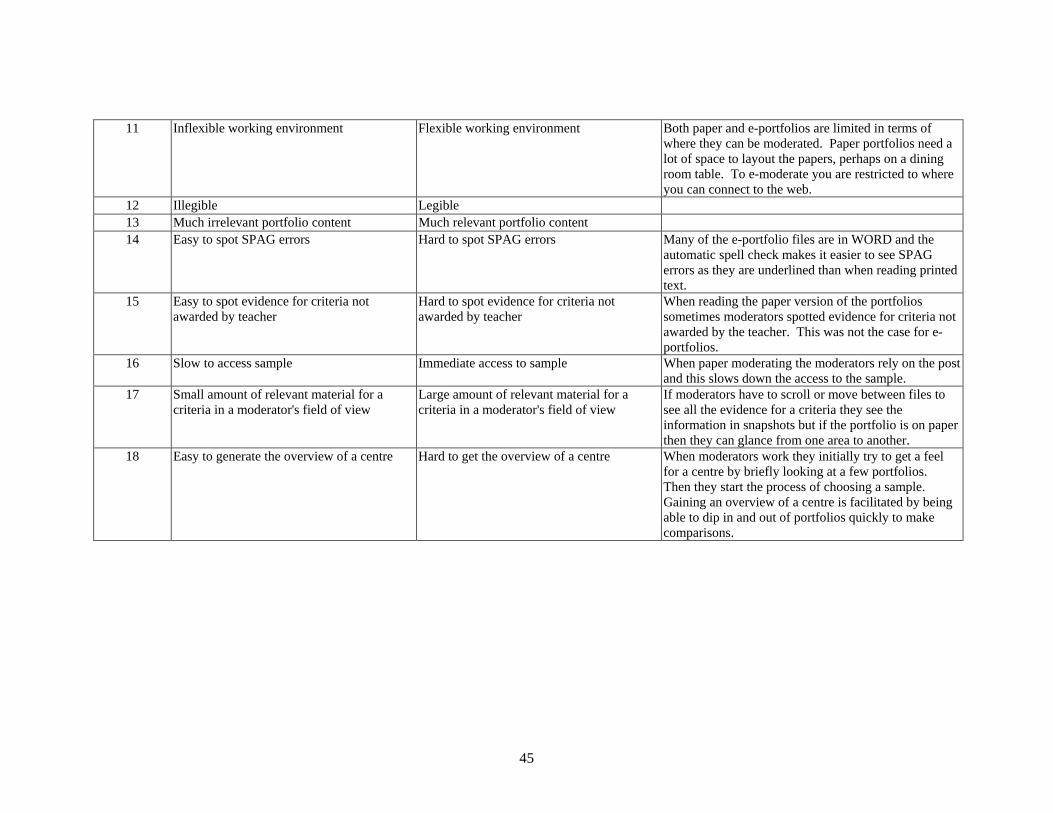
11 Inflexible working environment Flexible working environment Both paper and e-portfolios are limited in terms of where they can be moderated. Paper portfolios need a lot of space to layout the papers, perhaps on a dining room table. To e-moderate you are restricted to where you can connect to the web.
12 Illegible Legible 13 Much irrelevant portfolio content Much relevant portfolio content 14 Easy to spot SPAG errors Hard to spot SPAG errors Many of the e-portfolio files are in WORD and the
automatic spell check makes it easier to see SPAG errors as they are underlined than when reading printed text.
15 Easy to spot evidence for criteria not awarded by teacher
Hard to spot evidence for criteria not awarded by teacher
When reading the paper version of the portfolios sometimes moderators spotted evidence for criteria not awarded by the teacher. This was not the case for e-portfolios.
16 Slow to access sample Immediate access to sample When paper moderating the moderators rely on the post and this slows down the access to the sample.
17 Small amount of relevant material for a criteria in a moderator's field of view
Large amount of relevant material for a criteria in a moderator's field of view
If moderators have to scroll or move between files to see all the evidence for a criteria they see the information in snapshots but if the portfolio is on paper then they can glance from one area to another.
18 Easy to generate the overview of a centre Hard to get the overview of a centre When moderators work they initially try to get a feel for a centre by briefly looking at a few portfolios. Then they start the process of choosing a sample. Gaining an overview of a centre is facilitated by being able to dip in and out of portfolios quickly to make comparisons.
45

6.1.2.1 Cluster analysis results
6.1.2.1.1 Clustering portfolios The portfolios could be clustered in two clusters, one constituting the e-portfolios and the other constituting the paper portfolios. The results could also be clustered in four clusters: one of e-portfolios rated by the e-moderator, another of e-portfolios rated by the paper moderator, a third cluster was the paper portfolios and the e-moderators’ ratings and the fourth was the paper portfolios and the paper moderators’ ratings. This suggests that there was a difference between the e-portfolios and paper portfolios and that the moderators experience of the medium caused them to rate them differently. There was no evidence of clusters forming in relation to the size of the difference between the marks that the moderators gave the e-portfolios and paper portfolios.
6.1.2.1.2 Clustering constructs The constructs could be grouped into two, three or four clusters. The two cluster option divided the constructs so that the first cluster was constructs 1, 3, 4, 5, 6, 7, 8, 9, 10 and 18. These constructs are about using the mark scheme, reviewing teacher annotation, comparing portfolios to generate an overview of a centre, moderating not marking, low irritation due to easy navigation, dead time during moderation and generating the overview of a centre. The second cluster was constructs 2, 11, 12, 13, 14, 15, 16 and 17. These constructs are about the presence of biological drawings, inflexible working environment, legibility, the amount of relevant material in the moderator’s field of view, spotting SPAG and evidence for learning outcomes, speed of accessing the sample and the amount of relevant material in the moderator's field of view. An alternative is to choose three clusters. The first is described above it was constructs 1, 3, 4, 5, 6, 7, 8, 9, 10 and 18. The second cluster is constructs 11, 14, 15 and 17 which are about the inflexible working environment, the ease of spotting SPAG errors and criteria not awarded by the teacher and the amount of relevant material for a criterion in a moderator's field of view. The third cluster is made up of constructs 7, 16, 12 and 13 - ease of spotting teacher annotation, legibility, speed of accessing the sample and the amount of relevant portfolio content. It is also possible that there are four clusters; these would be the same clusters as when there are three clusters except constructs 7 and 16 form one cluster and 12 and 13 another cluster.
6.1.2.2 How influential was each construct on moderation judgements? The e-moderator rated construct 1 which was about the ease of checking the banner as the most influential construct and the paper moderator rated it as the least influential construct. The e-moderator rated construct 4 (the prevalence of teacher annotation and associated necessity for
46

marking or moderating) as very influential but the paper moderator rated this as far less influential. The e-moderator rated construct 14 about the ease of spotting SPAG as far more influential than the paper moderator. The e-moderator also rated constructs 12 and 17 about the legibility and the amount of relevant material for a criterion in a moderator's field of view as much more influential than did the paper moderator.
6.1.2.3 Other comments made by moderators The moderators noted that candidates are asked to draw lines of best fit for their data which they have collected and collated in a graph. Excel can draw lines of best fit but these are not as good as hand drawn lines. Also candidates are expected to hand draw biological drawings of what they have observed from a microscope. Unless candidates input their hand drawn work the e-portfolio medium is not as useful as paper portfolios. The biological drawings were absent from some of the e-portfolios. It was suggested that it would make the moderators’ job easier if: • the six activities to be reviewed were listed on the screen and there were web links to the
teacher annotations about each activity; • e-portfolios were only one file so that it was easier to find where the credit had been awarded. Some candidates can be disadvantaged by trying to draw diagrams into Word. The moderators said that one of the differences between the recommendation made by the paper moderator and the e-moderator for a particular candidate was due to the order in which the portfolios were moderated.
6.2 Statistical analysis The statistical analysis was undertaken after the paired interviews given that it was found in the interviews that one of the differences between the e-moderator's and paper moderator’s judgements was due to the paper moderator not receiving the whole portfolio. This was corrected before the statistical analysis was undertaken. The aim of the statistical analysis was to identify whether the media affected moderation judgements such that there was a difference between the judgements made about the e-portfolios and the paper portfolios.
6.2.1 Method
6.2.1.1 Participants/sample The e-moderator's and the conventional moderator 's judgements about all but one candidate from the one participating centre were included. This one candidate was judged by the e-moderator only.
47
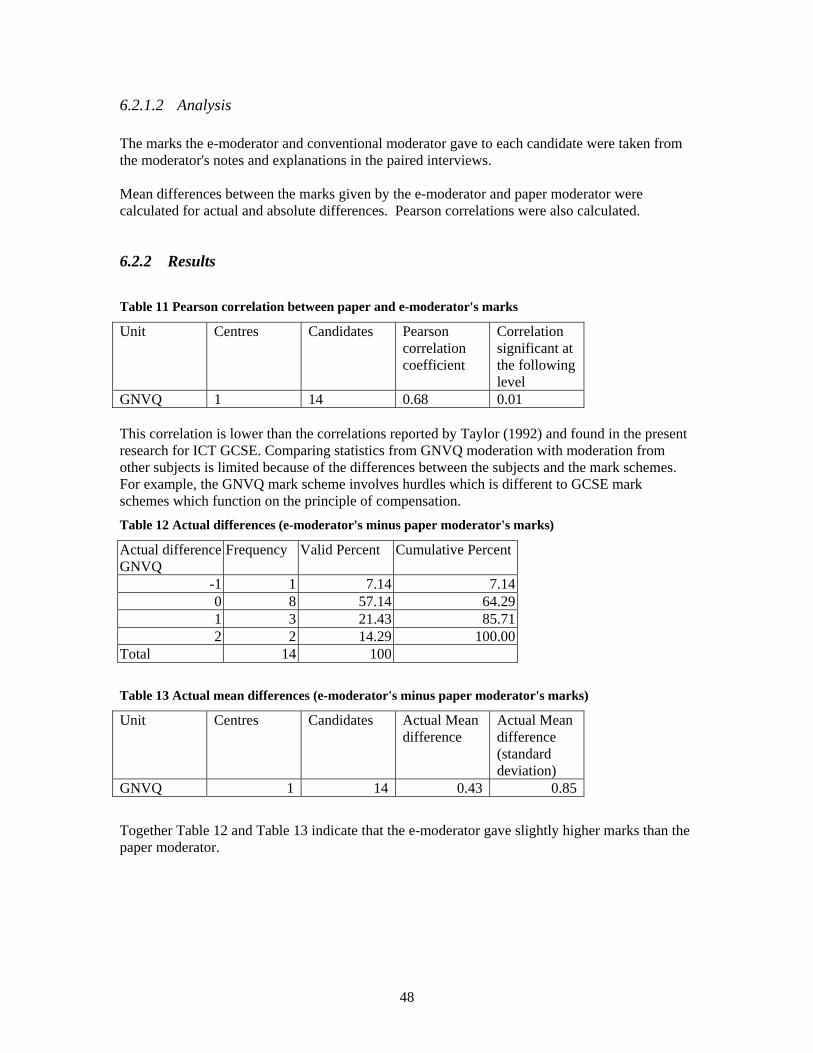
6.2.1.2 Analysis The marks the e-moderator and conventional moderator gave to each candidate were taken from the moderator's notes and explanations in the paired interviews. Mean differences between the marks given by the e-moderator and paper moderator were calculated for actual and absolute differences. Pearson correlations were also calculated.
6.2.2 Results Table 11 Pearson correlation between paper and e-moderator's marks
Unit Centres Candidates Pearson correlation coefficient
Correlation significant at the following level
GNVQ 1 14 0.68 0.01 This correlation is lower than the correlations reported by Taylor (1992) and found in the present research for ICT GCSE. Comparing statistics from GNVQ moderation with moderation from other subjects is limited because of the differences between the subjects and the mark schemes. For example, the GNVQ mark scheme involves hurdles which is different to GCSE mark schemes which function on the principle of compensation. Table 12 Actual differences (e-moderator's minus paper moderator's marks)
Actual difference GNVQ
Frequency Valid Percent Cumulative Percent
-1 1 7.14 7.140 8 57.14 64.291 3 21.43 85.712 2 14.29 100.00
Total 14 100 Table 13 Actual mean differences (e-moderator's minus paper moderator's marks)
Unit Centres Candidates Actual Mean difference
Actual Mean difference (standard deviation)
GNVQ 1 14 0.43 0.85
Together Table 12 and Table 13 indicate that the e-moderator gave slightly higher marks than the paper moderator.
48
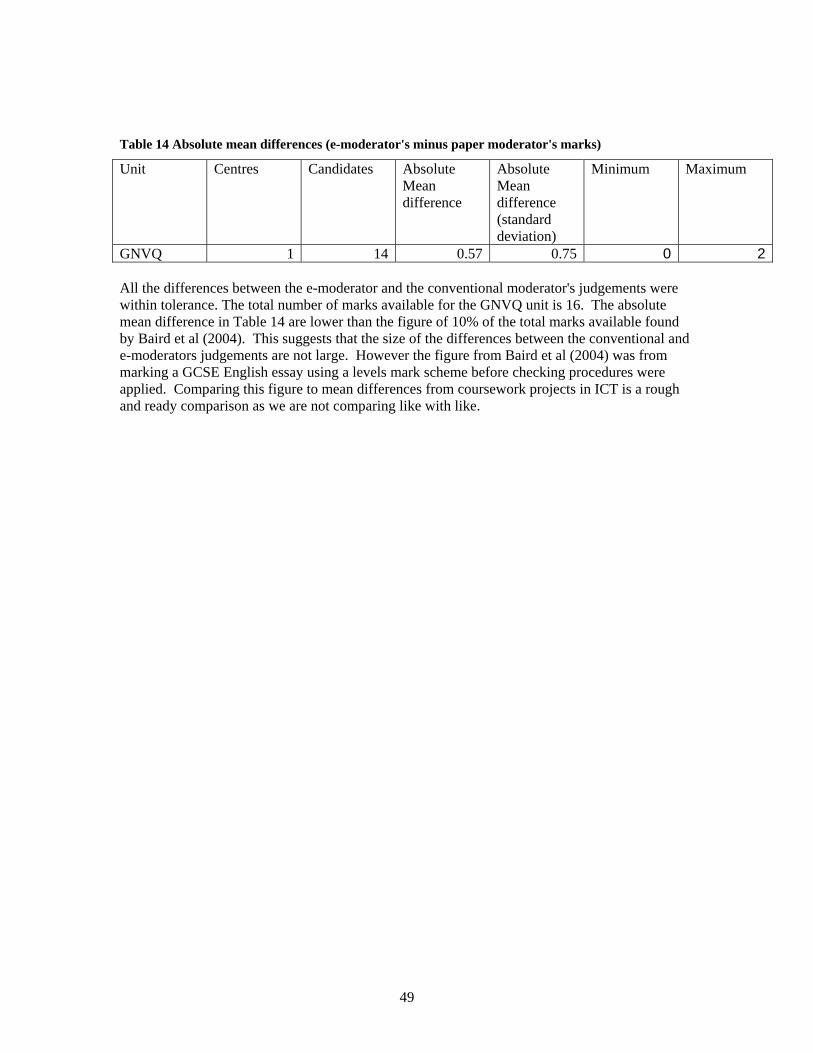
Table 14 Absolute mean differences (e-moderator's minus paper moderator's marks)
Unit Centres Candidates Absolute Mean difference
Absolute Mean difference (standard deviation)
Minimum Maximum
GNVQ 1 14 0.57 0.75 0 2 All the differences between the e-moderator and the conventional moderator's judgements were within tolerance. The total number of marks available for the GNVQ unit is 16. The absolute mean difference in Table 14 are lower than the figure of 10% of the total marks available found by Baird et al (2004). This suggests that the size of the differences between the conventional and e-moderators judgements are not large. However the figure from Baird et al (2004) was from marking a GCSE English essay using a levels mark scheme before checking procedures were applied. Comparing this figure to mean differences from coursework projects in ICT is a rough and ready comparison as we are not comparing like with like.
49

7 Conclusion From the paired interviews and the e-moderator questionnaires it emerged that the moderators do not moderate simply by comparing each portfolio individually with the criteria or mark scheme. Rather first they compare portfolios with one another and the assessment criteria or mark scheme and then they move on to considering individual portfolios. To be able to moderate in the way to which they are accustomed moderators need to be able to switch from one portfolio to another easily and quickly. Laming (2003) outlines some psychological research about human judgement and explains how it relates to marking. He does not consider how it relates to moderation but some of the principles might be relevant. He explains that psychological experiments show that when people make judgements about an individual stimulus they can only use five categories without error. He also explains that the accuracy of judgements is improved if a reference point (usually an example) is given. In another review of psychological experiments with human judgements Laming (2004, 12) says that one interpretation of these experiments is that “any and every judgement has to be expressed with respect to a frame of reference”. Later Laming says that the mark scheme can be used as a frame of reference and that mark schemes improve reliability. Indeed Furneaux and Rignall (2000) and later Shaw (2002) found that the mark scheme had a strong standardising effect even without a co-ordination meeting (where examiners are trained in how to apply the mark scheme). Moderators are required to use a mark scheme (or equivalent) as a frame of reference when they are moderating. Wolf (1995) argues that despite assessment criteria “The inherent variability of the contexts in which competence is tested and displayed means that assessors have to make constant, major decisions. They must determine how to take account of context when judging whether an observed piece of evidence fits a defined criterion.” Laming (2004) also notes that human judgements are made in a context and affected by our prior experience. Given this information it could be argued that when moderators first compare portfolios with one another and the assessment criteria or mark scheme before judging individual portfolios they are trying to become familiar with the context in which the teacher’s initial judgements were made. If they have a feel for the circumstances in which the teacher’s marking was undertaken then the moderator can try to compensate for context. The circumstances in which the teacher’s judgements are made include whether the portfolios are paper portfolios or e-portfolios. The psychological experiments reviewed by Laming (2004) tend to use example(s) as a frame of reference rather than a mark scheme or the equivalent; the exception is Murphy’s (1978) work. Wolf (1995) argued that the power of examples of work to inform assessors’ judgements has not been fully researched. Work by Baird et al (2004) has since shown that different types of exemplar scripts can affect judgements. In the present research perhaps moderators are trying to establish a frame of reference by looking at the work from different candidates and then making judgements about individual portfolios. Perhaps also when they refer back to other work to make a comparison the moderators are finding or reminding themselves of a reference point. Perhaps e-portfolio applications should include a facility to provide e-moderators with the common examples of e-portfolios on strategically chosen marks so that all e-moderators use the same benchmarks as points of reference. Given the work by Baird et al the recommended benchmarks would need to be chosen with care.
50
Laming (2004) also reviews psychological work which shows that “There is no absolute judgement. All judgements are comparisons of one thing with another….The comparisons are little better than ordinal”. He adds that even perfect pitch is due to people making internal comparisons. Laming (2003) explains that psychological experiments show that each stimulus is the point of reference for the next judgement. Hence an error in one judgement is transferred to the next judgement. This has also been found in marking. Spear (1997) found that good work tended to be assessed more favourably when it followed work of a lower standard than when it preceded such work. Poor quality work was assessed more severely when it followed work of higher quality. These phenomena are known as contrast effects. Moderators should be mindful of contrast effects when they are making judgements after switching between different portfolios. Indeed it could be argued that if7 moderators want to switch between e-portfolios to develop a frame of reference they should only use the benchmarks provided. This avoids contrast effects and ensures all moderators are using as similar a frame of reference as possible. In the present research it was found that there were some disadvantages of e-portfolios and e-moderation. Firstly there is the infrastructure and associated access to computer facilities. The centres and the homes of pupils and moderators all vary in the computer facilities available and this creates accessibility issues for e-portfolios. This might change over time and it could be that OCR would offer some entirely electronically based qualifications. The comparison of electronically based and paper based qualifications would need to be maintained much like Awarding Bodies currently maintain comparability between specifications and over time. Technology problems also affected the coursework compilation and moderation. Centres experienced some technology problems and e-moderators found e-moderation time consuming as it took a long time to download files to be viewed. When there are deadlines to meet for producing examination results it is of paramount importance that the methods used are efficient so issues like download time need to be addressed.
A recurring theme in the evaluation is teacher annotations. Teachers found that when doing preliminary marking it was difficult to annotate directly onto pupils’ work. Another teacher noted that if the portfolios were on paper there would have been more teacher annotations. It is worth noting that the teachers thought that the marking facilities made marking ‘easy’ or ‘average’ rather than difficult. Moderators use teacher annotations in the portfolio to facilitate their moderation by indicating where credit has been given and why. In paper portfolios this is easy to spot as there are teacher annotations in red on the candidates work and in some cases there are sheets at the beginning of the portfolio saying where the evidence can be found. However in some e-portfolios the teacher annotations are somewhat detached from the e-portfolio as they are in a different file. One teacher had added annotations to the candidates’ e-portfolios by typing into the candidates portfolios. The problems regarding teacher annotations interfered with the moderation process. This is similar to the findings of Raikes et al. (2004) that when doing on-screen marking examiners needed to be able to annotate whilst marking in order to facilitate the marking process and additionally so that senior examiners could review marking. It might be useful for teachers to have an annotation facility in the applications which enables them to add annotations within the e-portfolio file(s). Then they could be viewed by the moderator at the same time as viewing the portfolio. Raikes et al (2004) found that in an on-screen marking application examiners need to be able to distinguish between different types of marks, for example, marks for accuracy, method, or quality of written communication; there are
7 If has been emphasised as this research does not explain why moderators might want to switch between portfolios.
51
many more which vary with the subject and mark scheme. If e-portfolios are extended to use in additional subjects it might be found that similar facilities are required in e-portfolios. The lack of teacher's comments, marks and ticks in the e-portfolios is an issue which was raised by the e-moderators in the paired interviews and was illustrated by the content analysis. A lack of teacher marks, ticks and comments actually on or in the candidates’ work made it more difficult for moderators to review marking in the way to which they are accustomed. Moderators expressed a preference for seeing annotations when they are moderating. But are they valuable for making judgements? Murphy (1979) found that when two Senior Examiners marked two samples of scripts one without and the other with the original marks included the differences between the original and the new marks were twice as great when the old marks had been removed. Based on this research Laming (2004, 201) argues that the “most of the marks are determined by what the candidate has written; but there are places, especially in an examination involving essay questions, where the mark scheme leaves the examiner uncertain. Different examiners make different choices…When the original marks are left on the examiner undertaking the re-marking can see what choice the original examiner made and takes that choice into account”. Newton (1996) found that the mean difference between prime mark and re-mark was smaller for scripts with marks but no comments on them and larger for scripts with marks and comments. But the difference was not statistically significant. Massey and Foulkes (1994, 123) say “The higher levels of agreement observed between two examiners when the second knows how (and perhaps why) the first marked each paper may suggest that he or she has taken advantage of the extra information available when trying to judge the ‘best’ mark for each candidate. In ‘live’ examining this may be a virtue rather than a flaw. Processes for reconciling differences are likely to prove superior to averaging because they take better advantage of the information available or even gather and use some more”. Bearne and Kress (2001, 91) define affordance “as what is made possible and facilitated, and what is made difficult or inhibited by a medium”– i.e. paper or computer based testing. There were some affordance issues found in the current research. The evidence from moderators and centres suggested that paper portfolios and e-portfolios are suited to different coursework tasks and types of evidence. One of the responses to the questionnaire to centres was “It was difficult to meet the criteria of some projects as they were not written as e-portfolio projects. If tasks were written as e-portfolio tasks there would be no problem”. Of particular issue were hand drawn lines of best fit in graphs and handwritten responses to questionnaires each of which are currently encouraged by the OCR specifications. Such work needs to be input to be included in the e-portfolio. Two centres mentioned in the questionnaire that they had input handwritten work by scanning which takes a long time. There are other ways of entering hand drawn or written items into an e-portfolio available on the market. Whether paper portfolios or e-portfolios are the best medium depends upon which is best suited to assessing the knowledge and skills which are educationally valued. The results of the content analysis show that some forms of hand written or hand drawn work, were only present in the paper portfolios and not the e-portfolios. This coincides with the e-moderators responses to the questionnaires. Although this might be what is expected it is problematic because the specifications studied require that hand written responses to questionnaires are included in portfolios. Additionally the moderators argued in the paired interviews that Excel does not draw lines of best fit on graphs as well as can be achieved by hand drawing and so the lack of hand drawn graphs in e-portfolios is an issue of concern. The cluster analysis of the data from the content analysis showed that there are some features which are likely to occur together in portfolios. Some features tend to be more prevalent in the paper portfolios.
52
It might be that these features e.g. hand written text are replaced by electronic features in e-portfolios e.g. by typed text. The outcome of the paired interviews in both subjects was that there were differences in how the moderators perceived e-portfolios and conventional portfolios. But these differences were not related to the size of the difference between the marks the conventional moderator and the e-moderator gave the portfolios. The conventional and e-moderators thought that different factors were more or less influential on moderation judgements. These findings are consistent with Wiliam (1996) who reports that teachers from a 100% coursework GCSE in English learned to agree what grade an example of work was worth. But there were no specific criteria and the teachers did not necessarily agree on which aspects of the work were most significant in making the work worthy of a particular grade. The statistical analysis is based upon judgements independently made by the moderators. These are not the final marks that the candidates received for either GCSE ICT or GNVQ Science. For the statistical analysis moderators’ marks from before OCR's reviewing procedures were used. After the individual moderation judgements were made for GCSE ICT the marks are reviewed by the e-moderator and the conventional moderator and together they agreed on any changes to marks awarded by centres. It was these agreed marks which contributed to the candidates’ final GCSE grades. The GNVQ Science marks did not contribute to the candidates’ final grades as the centre wanted to take advantage of the OCR pilot to test out e-portfolios for themselves. From the statistical analysis of actual differences for both GNVQ Science and ICT GCSE there was no evidence that either e-portfolios or paper portfolios were consistently favoured. However it should be remembered that this was a small study. A larger study would be needed to be sure that the results from the present research are replicable. The result is consistent with the research literature about the presentation effect in an e-marking situation. But there are differences between the judgements made by the e-moderators and the conventional moderators. There is not sufficient evidence to identify whether the differences are due to the centre, the project, the media, individual moderators or interaction effects. The view of the moderators from projects 1a and 1b was that the differences between moderation judgements were due to the different approaches to moderation and different centres rather than the medium. The absolute mean differences for GNVQ and GCSE ICTs were lower than the figure of 10% of the total marks available found by Baird et al (2004). This suggests that the size of the differences between the conventional and e-moderators judgements are not large. However the figure from Baird et al (2004) was from marking a GCSE English essay using a different type of mark scheme to the mark schemes used in GNVQ and GCSE ICT. The paired interviews were based on a small sample of portfolios and with which both the e-moderator and the conventional moderator were familiar. This meant it was difficult to find large differences between the moderators’ judgements or differences which were out of tolerance. The statistical analysis was based on a larger sample, that is all the portfolios from relevant centres. The statistical analysis did pinpoint some differences between the moderators’ judgements which were out of tolerance. Perhaps this is why there were no clusters from the paired interviews which corresponded to the size of the difference between the judgements made by the moderators. Based on the research evidence, it is concluded that due to infrastructure and technology limitations, incompatibility between software systems, moderation approaches and specification requirements, e-portfolios - and in particular e-moderation - is not yet ready for wide scale use.
53
8 References Baird, J., Greatorex, J. and Bell, J. (2004) What makes marking reliable? Experiments with UK
examinations, Assessment in Education Principles, Policys and Practice, 11, 3 (pages to be determined).
Bearne, E. & Kress, G. (2001) Editorial, Reading, Literacy and Language, 35, 3, 89-93. Bennett, R. E. (2003) On-line Assessment and the Comparability of Score Meaning (ETS RM-03-
05), Princeton, NJ: Educational Testing Service. Furneaux, C. and Rignall, M. (2000) The effect of standardisation-training on rater-judgements
for the IELTS Writing Module, School of Linguistics and Applied Language Studies, University of Reading.
Green, S., Johnson, M., O'Donovan, N. & Sutton, P. (2003) Changes in Key Stage Two Writing from 1995 to 2002, Paper presented at the British Educational Research Association Conference, 10 to 13 September 2003 at Herriot-Watt University, Edinburgh.
Johnson, M and Green, S. (2004a) On-line assessment: the impact of mode on student performance. Paper presented at the British Educational Research Association conference 15-18 Sept 2004, University Manchester Institute of Science and Technology.
Johnson, M and Green, S. (2004b) On-line assessment: the impact of mode on students’ strategies perceptions and behaviours. Paper presented at the British Educational Research Association conference 15-18 Sept 2004, University Manchester Institute of Science and Technology.
Laming, D. (2004) Human Judgement The Eye of the Beholder. London: Thompson Learning. Laming, D. (2003) Marking university examinations: some lessons from psychophysics,
Psychology Learning and Teaching, 3(2), 89-96. Murphy, R. (1978) Reliability of marking in eight GCE examinations. British Journal of
Educational Psychology, 48, 196-200. Murphy, R. (1979) Removing the marks from examination scripts before remarking them: does it
make a difference? British Journal of Educational Psychology, 49, 73-8. Newton, P. (1996) The reliability of marking of General Certificate of Secondary Education
Scripts: mathematics and English. British Educational Research Journal, 22, 4, 405-420. Powers , D. D. E., Fowls, M. E., Farnum, M., and Ramsey, P. (1994) Will they think less of my
handwritten essay if others word process theirs? Effects on essay scores of intermingling handwritten and word-processed essays. Journal of Educational Measurement, 31, 220-233.
Powers, D. and Farnum, M. (1997) Effects of Mode of Presentation on Essay Scores, (ETS RM -97-08), Princeton, NJ: Educational Testing Service. In Zhang, Y., Powers, D. E., Wright, W. and Morgan, R. (2003) Applying the On-line Scoring Network (OSN) to Advanced Placement Program (AP) Tests. (RR-03-12) Princeton, NJ: Educational Testing Service.
Powers, D. E., Farnum, M., Grant, M., Kubota, M. (1997) A pilot test of on-line essay scoring (ETS RM – 97 – 07), Princeton, NJ: Educational Testing Service. In Zhang, Y., Powers, D. E., Wright, W. and Morgan, R. (2003) Applying the On-line Scoring Network (OSN) to Advanced Placement Program (AP) Tests. (RR-03-12) Princeton, NJ: Educational Testing Service.
Raikes, N., Greatorex, J. & Shaw, S., (2004) From Paper to Screen: some issues on the way. International Association of Educational Assessment Conference, Philadelphia, 13-18 June.
Russell, M. & Tao W. (2004) The Influence of Computer-Print on Rater Scores. Practical Assessment, Research & Evaluation, 9(10), 1-14.
Salmon, G. (2004) E-moderating. The key to teaching and learning on-line, London: Routledge Falmer.
54
Shaw, S. (2002) The effect of standardisation training on rater judgement and inter-rater reliability for the revised CPE writing paper 2, Research Notes, (in press).
Spear, M. (1997) The influence of contrast effects upon teachers’ marks, Educational Research, 39, 2, 229-233.
Sturman, L. and Kispal, A. To e or not to e? A comparison of electronic marking and paper-based marking. Paper presented at the 29th International Association for Educational Assessment Conference, 5-10 October 2003, Manchester, UK.
Taylor, M. (1992) The reliability of judgements made by coursework assessors, AEB Research Report, RAC/577. In Newton, P.E. (1996), The Reliability of Marking of General Certificate of Secondary Education Scripts; mathematics and English, British Educational Research Journal, 22, 4, 405-420.
Twing, J. S., Nichols, P. D. and Harrison, I. (2003) The comparability of Paper-Based and Image-based Marking of a High Stakes, Large Scale Writing Assessment, Paper presented at the 29th International Association for Educational Assessment Conference, 7 October 2003, Manchester, United Kingdom.
Whetton, C. and Newton, P. (2002) An evaluation of on-line marking, Paper presented at the 28th International Association for Educational Assessment Conference, 1-6 September 2002, Hong Kong SAR, China.
Wiliam D (1996) Standards in examinations: a matter of trust? The Curriculum Journal, 7, 3, 293-306.
Wolf, A. (1995) Competence-based assessment. Buckingham: Open University Press. Zhang, Y., Powers, D. E., Wright, W. and Morgan, R. (2003) Applying the On-line Scoring
Network (OSN) to Advanced Placement Program (AP) Tests. (RR-03-12) Princeton, NJ: Educational Testing Service.
Acknowledgements Lisa Hamnett undertook some of the Kelly's Repertory Grid interviewing and wrote the summary of the moderators' comments. Eva Malacova ran the cluster analysis from the paired interviews and interpreted the results. John Bell ran the cluster analysis for the content analysis and explained the results.
55

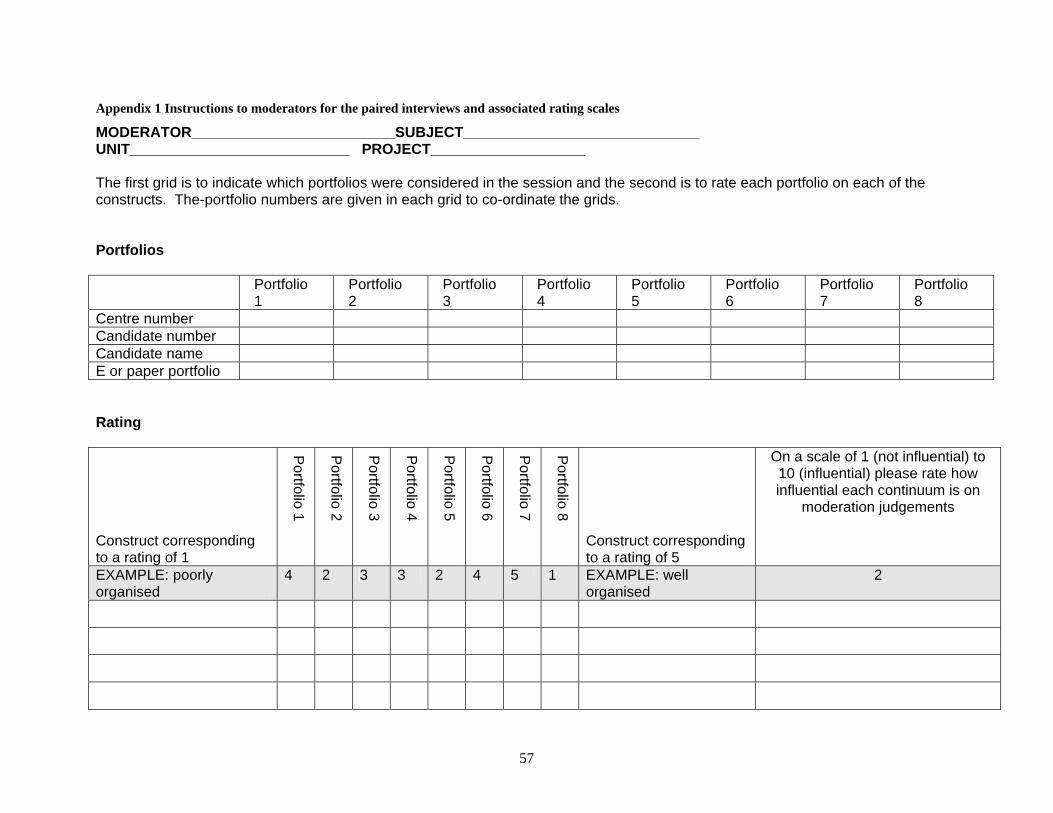
Appendix 1 Instructions to moderators for the paired interviews and associated rating scales
MODERATOR_________________________SUBJECT_____________________________ UNIT___________________________ PROJECT___________________ The first grid is to indicate which portfolios were considered in the session and the second is to rate each portfolio on each of the constructs. The-portfolio numbers are given in each grid to co-ordinate the grids. Portfolios Portfolio
1 Portfolio
2 Portfolio 3
Portfolio 4
Portfolio 5
Portfolio 6
Portfolio 7
Portfolio 8
Centre number Candidate number Candidate name E or paper portfolio Rating Construct corresponding to a rating of 1
Portfolio 1
Portfolio 2
Portfolio 3
Portfolio 4
Portfolio 5
Portfolio 6
Portfolio 7
Portfolio 8
Construct corresponding to a rating of 5
On a scale of 1 (not influential) to 10 (influential) please rate how influential each continuum is on
moderation judgements
EXAMPLE: poorly organised
4 2 3 3 2 4 5 1 EXAMPLE: well organised
2
57