modern and ancient seismogenic out-of-sequence …tsuji/pdf/tsuji2006_2006...modern and ancient...
TRANSCRIPT

Modern and ancient seismogenic out-of-sequence thrusts in the Nankai
accretionary prism: Comparison of laboratory-derived physical
properties and seismic reflection data
Takeshi Tsuji,1 Gaku Kimura,2 Shinya Okamoto,2 Fumio Kono,3 Hisako Mochinaga,3
Tatsuo Saeki,3 and Hidekazu Tokuyama1
Received 26 May 2006; revised 26 July 2006; accepted 1 August 2006; published 22 September 2006.
[1] To investigate characteristics of a seismogenic out-of-sequence thrust (OOST) imaged as a strong reflection onseismic profiles in the Nankai accretionary prism, wedetermined acoustic properties of discrete samples from anfossil Nobeoka OOST outcrop under confining pressures,and compared the acoustic properties with those of an activeOOST in the Nankai accretionary prism. We observedanisotropy of velocity and attenuation in the hanging wall ofNobeoka OOST attributed to foliation of pelitic-phyllite. Incontrast, the footwall is composed of brittlely deformed,chaotic shales and fine sandstones, and velocities in thefootwall are lower than those in the hanging wall.Amplitude variation with offset (AVO) modeling utilizingcontrasts in P- and S-wave velocities and densities betweenthe hanging wall and footwall of the Nobeoka OOSTindicates that fractures filled with overpressured fluidlikely account for angle-dependent reflection amplitudes ofthe active OOST in the Nankai Trough. Citation: Tsuji, T.,
G. Kimura, S. Okamoto, F. Kono, H. Mochinaga, T. Saeki, and
H. Tokuyama (2006), Modern and ancient seismogenic out-of-
sequence thrusts in the Nankai accretionary prism: Comparison
of laboratory-derived physical properties and seismic reflection
data, Geophys. Res. Lett., 33, L18309, doi:10.1029/
2006GL027025.
1. Introduction
[2] At convergent plate margins, plate boundary faultcharacteristics are important for understanding the nature ofearthquake mechanisms and deformation of the accretionaryprism. The decollements in the Nankai and Barbadosaccretionary prisms are commonly characterized using seis-mic data, including reflection polarity, seismic velocity, andattenuation [e.g., Moore and Shipley, 1993; Shipley et al.,1994; Tsuji et al., 2005], because seismic data can becalibrated by borehole data. However, the seismogenicOOST is too deep to penetrate with riserless drilling, soits properties have only been estimated from seismic data.Seismic reflection data from the Nankai Trough off the KiiPeninsula in southwest Japan (Figures 1a and 1b) image astrong negative polarity OOST (or splay fault) reflection
branching from the major plate boundary fault [e.g., Park etal., 2002; Tsuru et al., 2005]. This OOST might haveruptured during the 1944 Tonankai earthquake and associ-ated tsunami [e.g., Tanioka and Satake, 2001]. The negativepolarity reflection of the OOST has been interpreted toindicate elevated fluid pressure in the fault zone [Park et al.,2002]. From seismic data alone, the reflection polarity ishighly useful information to estimate fault zone properties.However, polarity of deep seismic reflections is also affectedby acoustic dispersion, and fracture zone causes wavelettuning [e.g., Costain and Coruh, 2004]. Therefore, fullOOST characterization solely using reflection polarity isnot possible, so we compare acoustic properties of an activeseismically-imaged OOST (Figure 1b) with those of a fossilOOST (Figure 1c).[3] Herein, we have determined acoustic properties of
discrete samples under confining pressures up to 55 MPaobtained from the Nobeoka fossil OOST (Figure 1c), andcompare them with those of an active Kumano OOSTimaged on seismic profiles off Kii Peninsula (Figure 1b).Although studies of discrete samples do not provide infor-mation on the effects of large-scale fracturing, we need toknow elastic moduli of the matrix for quantitative estima-tion of the degree of large-scale fractures from seismic data.A better understanding of active Kumano OOST’s charac-teristics will benefit scheduled penetration of the fault by theIntegrated Ocean Drilling Program (IODP).
2. Geological Setting
[4] The Shimanto belt, exposed along southwest Japan(Figure 1a), is divided into the northern and the southernbelts, separated by a major fault, the Aki Tectonic Line inthe Shikoku and Kii regions, and the Nobeoka Thrust inKyushu [Imai et al., 1971]. Although almost all parts of thefault corresponds to age boundary (Cretaceous - Tertiary),Eocene radiolaria are found in both hanging wall andfootwall rocks of the Nobeoka OOST in our study area[Murata, 1998] (Figure 1c), so here the OOST apparentdisplaces only Tertiary rocks. Deformation features of theNobeoka OOST differ from common thrust; the footwall ofthe Nobeoka OOST is more heavily deformed than thehanging wall, perhaps a consequence of more fluid in thefootwall side (Figure 1c).[5] Because the Nobeoka OOST is interpreted as a fossil
OOST, preserves in situ structure, and crops out [Kondo etal., 2005], it is ideal for evaluating characteristics of aseismogenic OOST. Kondo et al. [2005] estimated that theNobeoka OOST formed at depths of 7.1�9.0 km, similar to
GEOPHYSICAL RESEARCH LETTERS, VOL. 33, L18309, doi:10.1029/2006GL027025, 2006ClickHere
for
FullArticle
1Ocean Research Institute, University of Tokyo, Tokyo, Japan.2Department of Earth and Planetary Sciences, University of Tokyo,
Tokyo, Japan.3Technology and Research Center, Japan Oil, Gas and Metals National
Corporation, Chiba, Japan.
Copyright 2006 by the American Geophysical Union.0094-8276/06/2006GL027025$05.00
L18309 1 of 5
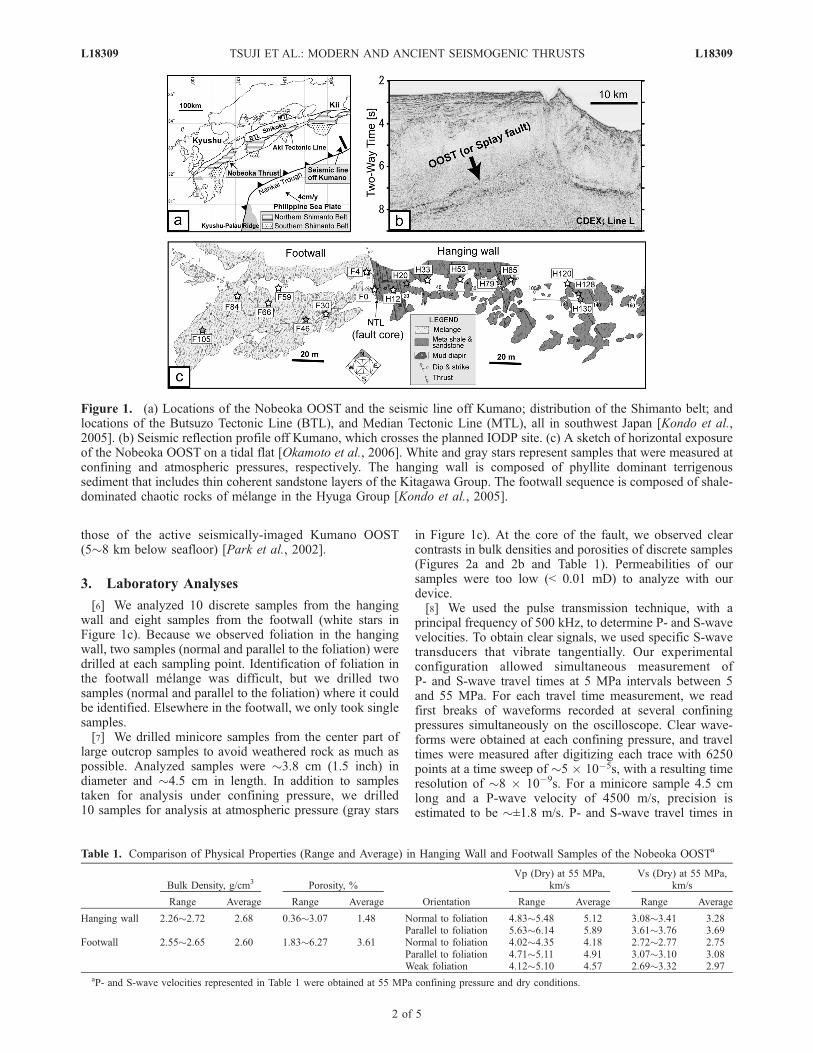
those of the active seismically-imaged Kumano OOST(5�8 km below seafloor) [Park et al., 2002].
3. Laboratory Analyses
[6] We analyzed 10 discrete samples from the hangingwall and eight samples from the footwall (white stars inFigure 1c). Because we observed foliation in the hangingwall, two samples (normal and parallel to the foliation) weredrilled at each sampling point. Identification of foliation inthe footwall melange was difficult, but we drilled twosamples (normal and parallel to the foliation) where it couldbe identified. Elsewhere in the footwall, we only took singlesamples.[7] We drilled minicore samples from the center part of
large outcrop samples to avoid weathered rock as much aspossible. Analyzed samples were �3.8 cm (1.5 inch) indiameter and �4.5 cm in length. In addition to samplestaken for analysis under confining pressure, we drilled10 samples for analysis at atmospheric pressure (gray stars
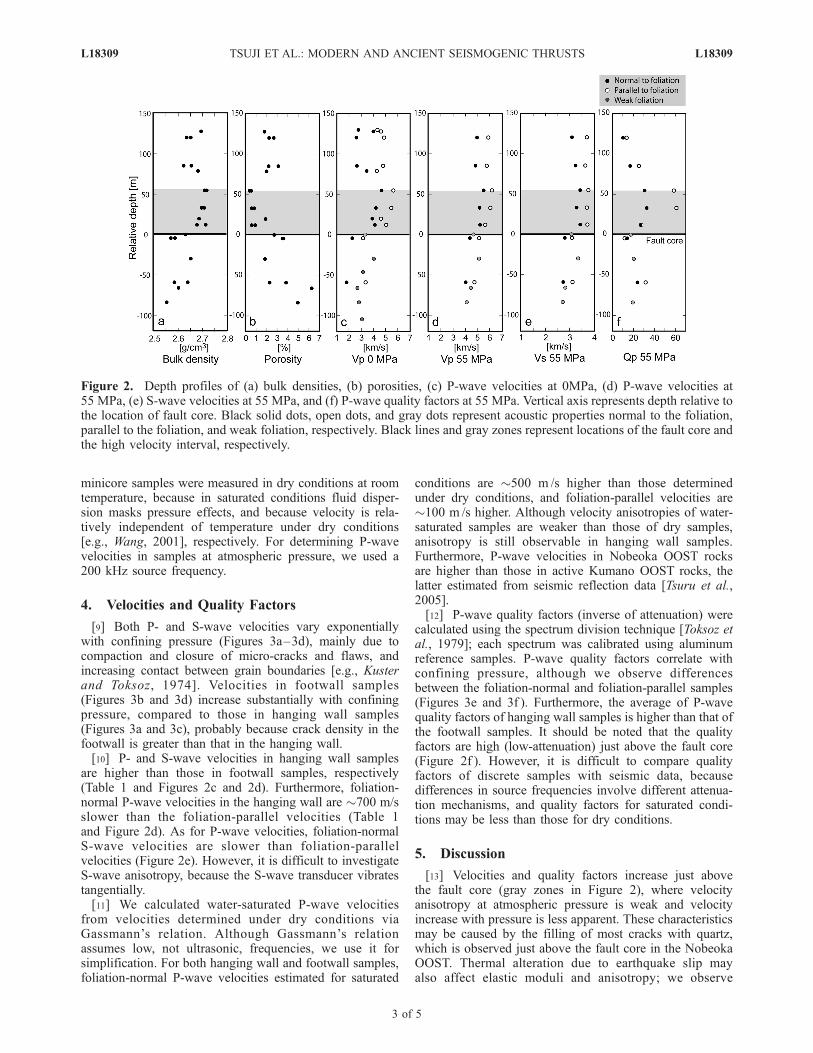
in Figure 1c). At the core of the fault, we observed clearcontrasts in bulk densities and porosities of discrete samples(Figures 2a and 2b and Table 1). Permeabilities of oursamples were too low (< 0.01 mD) to analyze with ourdevice.[8] We used the pulse transmission technique, with a
principal frequency of 500 kHz, to determine P- and S-wavevelocities. To obtain clear signals, we used specific S-wavetransducers that vibrate tangentially. Our experimentalconfiguration allowed simultaneous measurement ofP- and S-wave travel times at 5 MPa intervals between 5and 55 MPa. For each travel time measurement, we readfirst breaks of waveforms recorded at several confiningpressures simultaneously on the oscilloscope. Clear wave-forms were obtained at each confining pressure, and traveltimes were measured after digitizing each trace with 6250points at a time sweep of �5 � 10�5s, with a resulting timeresolution of �8 � 10�9s. For a minicore sample 4.5 cmlong and a P-wave velocity of 4500 m/s, precision isestimated to be �±1.8 m/s. P- and S-wave travel times in
Figure 1. (a) Locations of the Nobeoka OOST and the seismic line off Kumano; distribution of the Shimanto belt; andlocations of the Butsuzo Tectonic Line (BTL), and Median Tectonic Line (MTL), all in southwest Japan [Kondo et al.,2005]. (b) Seismic reflection profile off Kumano, which crosses the planned IODP site. (c) A sketch of horizontal exposureof the Nobeoka OOST on a tidal flat [Okamoto et al., 2006]. White and gray stars represent samples that were measured atconfining and atmospheric pressures, respectively. The hanging wall is composed of phyllite dominant terrigenoussediment that includes thin coherent sandstone layers of the Kitagawa Group. The footwall sequence is composed of shale-dominated chaotic rocks of melange in the Hyuga Group [Kondo et al., 2005].
Table 1. Comparison of Physical Properties (Range and Average) in Hanging Wall and Footwall Samples of the Nobeoka OOSTa
Bulk Density, g/cm3 Porosity, %
Orientation
Vp (Dry) at 55 MPa,km/s
Vs (Dry) at 55 MPa,km/s
Range Average Range Average Range Average Range Average
Hanging wall 2.26�2.72 2.68 0.36�3.07 1.48 Normal to foliation 4.83�5.48 5.12 3.08�3.41 3.28Parallel to foliation 5.63�6.14 5.89 3.61�3.76 3.69
Footwall 2.55�2.65 2.60 1.83�6.27 3.61 Normal to foliation 4.02�4.35 4.18 2.72�2.77 2.75Parallel to foliation 4.71�5.11 4.91 3.07�3.10 3.08Weak foliation 4.12�5.10 4.57 2.69�3.32 2.97
aP- and S-wave velocities represented in Table 1 were obtained at 55 MPa confining pressure and dry conditions.
L18309 TSUJI ET AL.: MODERN AND ANCIENT SEISMOGENIC THRUSTS L18309
2 of 5
minicore samples were measured in dry conditions at roomtemperature, because in saturated conditions fluid disper-sion masks pressure effects, and because velocity is rela-tively independent of temperature under dry conditions[e.g., Wang, 2001], respectively. For determining P-wavevelocities in samples at atmospheric pressure, we used a200 kHz source frequency.
4. Velocities and Quality Factors
[9] Both P- and S-wave velocities vary exponentiallywith confining pressure (Figures 3a–3d), mainly due tocompaction and closure of micro-cracks and flaws, andincreasing contact between grain boundaries [e.g., Kusterand Toksoz, 1974]. Velocities in footwall samples(Figures 3b and 3d) increase substantially with confiningpressure, compared to those in hanging wall samples(Figures 3a and 3c), probably because crack density in thefootwall is greater than that in the hanging wall.[10] P- and S-wave velocities in hanging wall samples
are higher than those in footwall samples, respectively(Table 1 and Figures 2c and 2d). Furthermore, foliation-normal P-wave velocities in the hanging wall are �700 m/sslower than the foliation-parallel velocities (Table 1and Figure 2d). As for P-wave velocities, foliation-normalS-wave velocities are slower than foliation-parallelvelocities (Figure 2e). However, it is difficult to investigateS-wave anisotropy, because the S-wave transducer vibratestangentially.[11] We calculated water-saturated P-wave velocities
from velocities determined under dry conditions viaGassmann’s relation. Although Gassmann’s relationassumes low, not ultrasonic, frequencies, we use it forsimplification. For both hanging wall and footwall samples,foliation-normal P-wave velocities estimated for saturated
conditions are �500 m /s higher than those determinedunder dry conditions, and foliation-parallel velocities are�100 m /s higher. Although velocity anisotropies of water-saturated samples are weaker than those of dry samples,anisotropy is still observable in hanging wall samples.Furthermore, P-wave velocities in Nobeoka OOST rocksare higher than those in active Kumano OOST rocks, thelatter estimated from seismic reflection data [Tsuru et al.,2005].[12] P-wave quality factors (inverse of attenuation) were
calculated using the spectrum division technique [Toksoz etal., 1979]; each spectrum was calibrated using aluminumreference samples. P-wave quality factors correlate withconfining pressure, although we observe differencesbetween the foliation-normal and foliation-parallel samples(Figures 3e and 3f ). Furthermore, the average of P-wavequality factors of hanging wall samples is higher than that ofthe footwall samples. It should be noted that the qualityfactors are high (low-attenuation) just above the fault core(Figure 2f ). However, it is difficult to compare qualityfactors of discrete samples with seismic data, becausedifferences in source frequencies involve different attenua-tion mechanisms, and quality factors for saturated condi-tions may be less than those for dry conditions.
5. Discussion
[13] Velocities and quality factors increase just abovethe fault core (gray zones in Figure 2), where velocityanisotropy at atmospheric pressure is weak and velocityincrease with pressure is less apparent. These characteristicsmay be caused by the filling of most cracks with quartz,which is observed just above the fault core in the NobeokaOOST. Thermal alteration due to earthquake slip mayalso affect elastic moduli and anisotropy; we observe
Figure 2. Depth profiles of (a) bulk densities, (b) porosities, (c) P-wave velocities at 0MPa, (d) P-wave velocities at55 MPa, (e) S-wave velocities at 55 MPa, and (f) P-wave quality factors at 55 MPa. Vertical axis represents depth relative tothe location of fault core. Black solid dots, open dots, and gray dots represent acoustic properties normal to the foliation,parallel to the foliation, and weak foliation, respectively. Black lines and gray zones represent locations of the fault core andthe high velocity interval, respectively.
L18309 TSUJI ET AL.: MODERN AND ANCIENT SEISMOGENIC THRUSTS L18309
3 of 5
many earthquake-related fractures just above the fault core(Figure 1c).[14] Comparison of the acoustic properties of the fossil
Nobeoka, determined from outcrop samples, and activeKumano, calculated from seismic reflection data, OOSTsis warranted by the two thrusts’ similar tectonic settings andlithologies (Figure 1c), although Eocene and current platemotions differ. Weathering has affected properties of theNobeoka OOST, but overall results from the hanging walland the footwall should reflect trends of in situ properties. Ifwe assume an average bulk density of 2.5 g/cm3, a seafloordepth of 2 km, an OOST depth of 7 km, hydrostaticconditions, and an effective stress coefficient of n = 1[e.g., Christensen and Wang, 1985], effective pressure inthe Kumano OOST is calculated to be �73 MPa. Thiseffective pressure may be higher than in situ values, becausethe Kumano OOST is probably overpressured [e.g., Park etal., 2002]. Assuming that velocities at 55 MPa representthose at in situ effective pressures, the contrast betweenfoliation-normal P-wave velocities in hanging wall samples
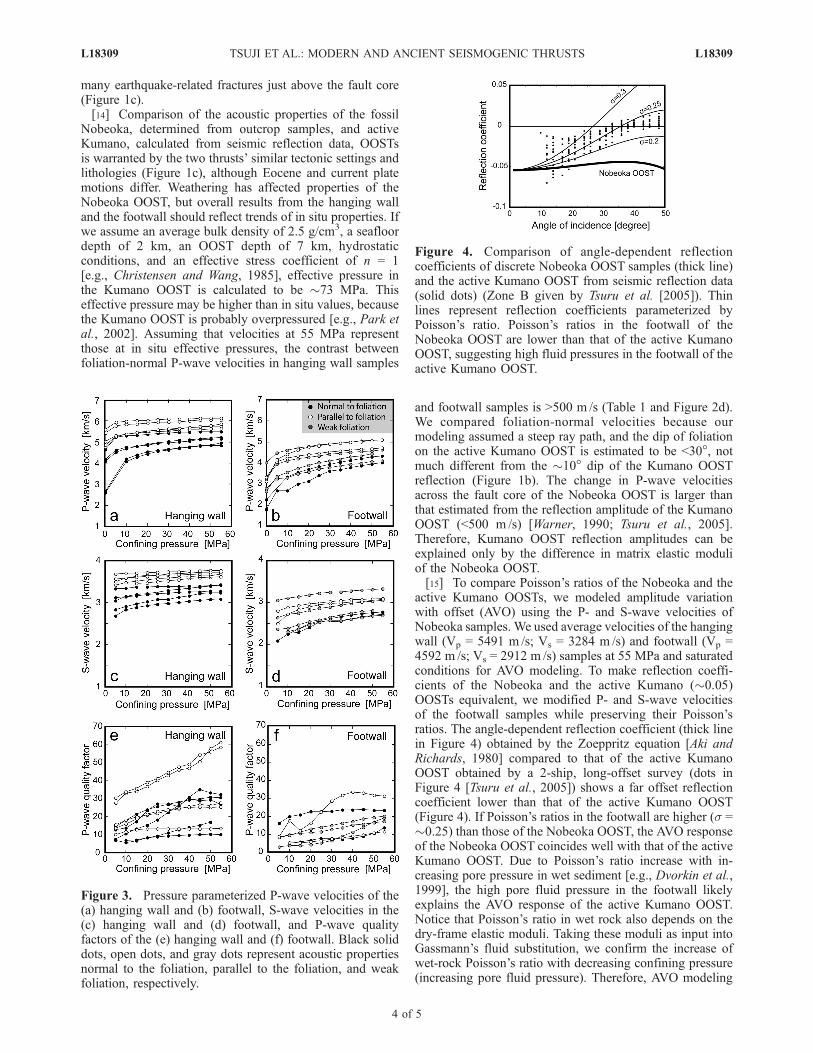
and footwall samples is >500 m /s (Table 1 and Figure 2d).We compared foliation-normal velocities because ourmodeling assumed a steep ray path, and the dip of foliationon the active Kumano OOST is estimated to be <30�, notmuch different from the �10� dip of the Kumano OOSTreflection (Figure 1b). The change in P-wave velocitiesacross the fault core of the Nobeoka OOST is larger thanthat estimated from the reflection amplitude of the KumanoOOST (<500 m /s) [Warner, 1990; Tsuru et al., 2005].Therefore, Kumano OOST reflection amplitudes can beexplained only by the difference in matrix elastic moduliof the Nobeoka OOST.[15] To compare Poisson’s ratios of the Nobeoka and the
active Kumano OOSTs, we modeled amplitude variationwith offset (AVO) using the P- and S-wave velocities ofNobeoka samples. We used average velocities of the hangingwall (Vp = 5491 m /s; Vs = 3284 m /s) and footwall (Vp =4592 m /s; Vs = 2912 m /s) samples at 55 MPa and saturatedconditions for AVO modeling. To make reflection coeffi-cients of the Nobeoka and the active Kumano (�0.05)OOSTs equivalent, we modified P- and S-wave velocitiesof the footwall samples while preserving their Poisson’sratios. The angle-dependent reflection coefficient (thick linein Figure 4) obtained by the Zoeppritz equation [Aki andRichards, 1980] compared to that of the active KumanoOOST obtained by a 2-ship, long-offset survey (dots inFigure 4 [Tsuru et al., 2005]) shows a far offset reflectioncoefficient lower than that of the active Kumano OOST(Figure 4). If Poisson’s ratios in the footwall are higher (� =�0.25) than those of the Nobeoka OOST, the AVO responseof the Nobeoka OOST coincides well with that of the activeKumano OOST. Due to Poisson’s ratio increase with in-creasing pore pressure in wet sediment [e.g., Dvorkin et al.,1999], the high pore fluid pressure in the footwall likelyexplains the AVO response of the active Kumano OOST.Notice that Poisson’s ratio in wet rock also depends on thedry-frame elastic moduli. Taking these moduli as input intoGassmann’s fluid substitution, we confirm the increase ofwet-rock Poisson’s ratio with decreasing confining pressure(increasing pore fluid pressure). Therefore, AVO modeling
Figure 3. Pressure parameterized P-wave velocities of the(a) hanging wall and (b) footwall, S-wave velocities in the(c) hanging wall and (d) footwall, and P-wave qualityfactors of the (e) hanging wall and (f) footwall. Black soliddots, open dots, and gray dots represent acoustic propertiesnormal to the foliation, parallel to the foliation, and weakfoliation, respectively.
Figure 4. Comparison of angle-dependent reflectioncoefficients of discrete Nobeoka OOST samples (thick line)and the active Kumano OOST from seismic reflection data(solid dots) (Zone B given by Tsuru et al. [2005]). Thinlines represent reflection coefficients parameterized byPoisson’s ratio. Poisson’s ratios in the footwall of theNobeoka OOST are lower than that of the active KumanoOOST, suggesting high fluid pressures in the footwall of theactive Kumano OOST.
L18309 TSUJI ET AL.: MODERN AND ANCIENT SEISMOGENIC THRUSTS L18309
4 of 5

suggests high fluid pressures in the footwall of the activeKumano OOST.
[16] Acknowledgments. We thank C. Moore, T. Tsuru, J. Dvorkin,and M. Coffin for valuable discussions. We also thank G. Moore, ananonymous referee, and GRL Editor E. Calais for helpful reviews of themanuscript. Seismic reflection data (Figure 1b) are courtesy of CDEX,JAMSTEC. Takeshi Tsuji was supported for this research by JSPS ResearchFellowship (DC).
ReferencesAki, K., and P. G. Richards (1980), Quantitative Seismology, Theory andMethods, vol. 1, 153 pp., Freeman, W. H., New York.
Christensen, N. I., and H. F. Wang (1985), The influence of pore pressureand confining pressure on dynamic elastic properties of Berea sandstone,Geophysics, 50, 207–213.
Costain, J. K.. and C. Coruh (2004), Basic theory of exploration seismologywith Mathematica notebooks and examples on CD-ROM, in Handbookof Geophysical Exploration, Seismic Exploration, vol. 1, pp. 231–238,518–548, Elsevier, New York.
Dvorkin, J., G. Mavko, and A. Nur (1999), Overpressure detection fromcompressional- and shear-wave data, Geophys. Res. Lett., 26, 3417–3420.
Imai, I., Y. Teraoka, and K. Okumura (1971), Geologic structure andmetamorphic zonation of the northeastern part of the Shimanto terranein Kyushu,Japan, J. Geol. Soc. Jpn., 77, 207–220.
Kondo, H., G. Kimura, H. Masago, K. Ohmori-Ikehara, Y. Kitamura,E. Ikesawa, A. Sakaguchi, A. Yamaguchi, and S. Okamoto (2005),Deformation and fluid flow of a major out-of-sequence thrustlocated at seismogenic depth in an accretionary complex: NobeokaThrust in the Shimanto Belt, Kyusyu, Japan, Tectonics, 24,TC6008, doi:10.1029/2004TC001655.
Kuster, G. T., and M. N. Toksoz (1974), Velocity and attenuation of seismicwaves in two-phase media, part 1–Theoretical formulations, Geophysics,39, 587–606.
Moore, G. F., and T. H. Shipley (1993), Character of the decollement in theLeg 131 area, Nankai Trough, Proc. Ocean Drill. Program Sci. Results,131, 73–82.
Murata, A. (1998), Duplexes and low-angle nappe structures of theShimanto terrane, southwest Japan, Mem. Geol. Soc. Jpn., 50, 147–158.
Okamoto, S., G. Kimura, S. Takizawa, and H. Yamaguchi (2006), (opendiscussion) Earthquake fault rock indicating a coupled lubricationmechanism, 135–149, sref_id:1815_3844/eed/2006_1_135.
Park, J.-O., T. Tsuru, S. Kodaira, P. R. Cummins, and Y. Kaneda (2002),Splay fault branching along the Nankai subduction zone, Science, 297,1157–1160.
Shipley, T., G. Moore, N. Bangs, C. Moore, and P. Stoffa (1994),Seismically inferred dilatancy distribution, northern Barbados Ridgedecollement, Geology, 22, 411–414.
Tanioka, Y., and K. Satake (2001), Detailed coseismic slip distribution of the1944 Tonankai earthquake estimated from tsunami waveforms, Geophys.Res. Lett., 28, 1075–1078.
Toksoz, M. N., D. H. Johnston, and A. Timur (1979), Attenuation ofseismic waves in dry and saturated rocks: 1. Laboratory measurements,Geophysics, 44, 681–690.
Tsuji, T., T. Matsuoka, Y. Yamada, Y. Nakamura, J. Ashi, H. Tokuyama,S. Kuramoto, and N. Bangs (2005), Initiation of plate boundary slip inthe Nankai Trough off the Muroto peninsula, southwest Japan,Geophys. Res. Lett., 32, L12306, doi:10.1029/2004GL021861.
Tsuru, T., S. Miura, J.-O. Park, A. Ito, G. Fujie, Y. Kaneda,T. No, T. Katayama, and J. Kasahara (2005), Variation of physical proper-ties beneath a fault observed by a two-ship seismic survey off southwestJapan, J. Geophys. Res., 110, B05405, doi:10.1029/2004JB003036.
Wang, Z. (2001), Fundamentals of seismic rock physics, Geophysics, 66,398–412.
Warner, M. (1990), Absolute reflection coefficients from deep seismicreflections, Tectonophysics, 173, 15–23.
�����������������������H. Tokuyama and T. Tsuji, Ocean Research Institute, University of
Tokyo, 1-15-1 Minamidai Nakano-ku, Tokyo 164-8639, Japan. ([email protected])G. Kimura and S. Okamoto, Department of Earth and Planetary Sciences,
University of Tokyo, 7-3-1 Hongo, Bunkyo-ku, Tokyo 113-0033, Japan.F. Kono, H. Mochinaga, and T. Saeki, Technology and Research Center
(TRC), Japan Oil, Gas and Metals National Corporation (JOGMEC), 1-2-2Hamada, Mihama-ku, Chiba-shi, Chiba 261-0025, Japan.
L18309 TSUJI ET AL.: MODERN AND ANCIENT SEISMOGENIC THRUSTS L18309
5 of 5