modern applied science, vol. 1, no. 2, july 2007, issn
TRANSCRIPT


Vol. 1, No. 2
July 2007
Contents
Modern Applied Science www.ccsenet.org/mas.html
Study on the Intelligence Structure of Current Differential Protection in Transmission Line of UHV
Based on Agent 2
Zhenyu Chen
'Biological Pump' Overestimated: Study Challenges How Life in the Oceans Removes Carbon from
the Atmosphere 8
University of Southampton R / S Analysis with Computer Algebra 9
Zongyan Xu, Dongwei Huang, Hongli Wang Design Concept for Future Autos 12
Wen Chen New Approach to Fixing Spreadsheet Errors Could Save Billions 15
Oregon State University
Application of MIGA to Multi-objective Optimization in Active Vibration Control 16
Xiangzhong Meng, Xiuhua Shi, Xiangdang Du
Radio Frequency Ablation Vaporizes Inoperable Kidney and Liver Tumors 23
Cedars-Sinai Medical Center
Application of Vandermonde Determinant in Combination Mathematics 24
Changzhou Dong & Junqing Wang
Interface between the Embedded Processor Nios and the TDC Module and its Application 27
Jiawei Zhang, Shengjun Zhai, Jiuling Lin
Angioplasty Procedure Has Potential to Damage Kidneys 33
Wake Forest University Baptist Medical Center
A Study on the Quality systems-Modal for Quality Management of Manufacturing 34
Qi Liang &Yukan Hou
A Primary Research on the Validity of Enterprise Encouraging System Based on the Paradigm of
Strategic Ecology Management 37
Yanling Jia & Wei Guo
Strongly Convergence Theorem of m-accretive Operators 41
Yujun Liu & Sumei Xu
Synthesis and Characterization of Multiblock Copolymers Composed of poly (aryl ether ketone
ketone) (PEKK) and 2, 6-bis ( -naphthoxy) benzonitrile (BNOBN) 44
Yikai Yu, Mingzhong Cai, Tao Wang, Ming Zhang
Eventually Strong Wrpp Semigroups Whose Idempotents Satisfy Permutation Identities 50
Xiaomin Zhang
Reconstruction of Video Electromagnetic Leakage from Computer 56
Bo Hu

Modern Applied Science www.ccsenet.org/mas.html
Vol. 1, No. 2
July 2007
2
Study on the Intelligence Structure of Current
Differential Protection in Transmission Line of UHV Based on Agent
Zhenyu Chen
Guangdong Business College
South China University of Technology, Guangzhou 510320, China
Tel: 86-20-384 90856 E-mail: [email protected]
The Project is supported by Guangdong Provincial Natural Science Foundation of China (0602396)AbstractAt present, action criterions of Phase-segregated current differential protection in Transmission line of UHV include the
criterion based on whole current, instantaneous value of fault and other changing from it. In different areas of fault,
each criterion has different reliability and sensitivity. On the basis of deeply analyses and study of the principle for
Phase-segregated current differential protection, this paper combines intelligence Agent technology, and creates an
intelligent protection structure which can choose reasonable action criterion according to the place of fault, and it can
make the reliability and sensitivity of Phase-segregated current differential protection in Transmission line of UHV
improved.
Keywords: Transmission line of UHV, Phase segregated and differential current Protection, Action criterion,
Intelligent Agent
With the rapid development of the global economy, the power demand is more and more growing, large-scale,
high-capacity and long-distance power transmission has become a form of modern power system development. But
comparing UHV transmission with the traditional HV and EHV transmission, the obvious economic and technical
superiority are presented, especially, they are widely applied to attention in foreign and China power system [1]. In order
to satisfy the development of the Northwest power grid to solve large-capacity power send out from west to east,
adopting UHV transmission is a general trend, so the country's first of UHV transmission lines has been built in china:
the 750kv single system about 146km from GuanTing to LanZhou East. Compared with other EHV(330kv,500kv,etc),
the 750kv transmission lines UHV brings about greater capacity of current and longer distance transmission, the too
high voltage and capacitance current caused by short circuit impact on the System reliability and stability. To achieve
this, we should learn from foreign experience in the design of protective relaying UHV transmission lines, fewer
detours, and speed up the pace; On the other hand, we must in-depth study line protection and create the basis for the
theory for the design and manufacture of UHV line protection, but also to ensure the stability operation of system.
1. Phase-segregated current differential protection 1.1 Principles and characteristics of the Phase-segregated current differential protection The basic principles: It transferred the time-lable current information and data packets by communication link from the
end to the other end; it realizes the balance and phase calculations between two ends. From this, we can judge whether
the breakdown will happen or not.
Looking from the principle of protection, Phase-segregated current longitudinal differential protection is an ideal
situation; it is not affected by the oscillation, the mode of operation and the resistance [2]
. Meanwhile, the
Phase-segregated differential current protection, without the introduction of voltage avoid a transient voltage secondary
circuit complexity in ultra-high voltage power grid, so comparing with the longitudinal direction for the protection and
longitudinal distance (zero sequence) protection, Phase-segregated current longitudinal differential protection principles
are simple, almost without affecting by the voltage transformer (TV) lost, contact compensate, same tower or many
other factors, it has long been considered to be professionals ideal transmission line protection program[3]
.
Their characteristics are manifested mainly in the following aspects:

3
Modern Applied Science
(1) Current differential protection only measured on the current value, and does not calculate the fault distance
impedance. The influence of greater arcing resistance to the protection does not exist in the EHV and the UHV system.
(2) The current differential protection makes the measurements for the current balance and phase at both ends, so the
fault phase can be elected clearly, and makes the fault phase correct easily.
(3) The current differential protection system is not influenced by system oscillation. When the system is oscillating, the
direction of current at the two ends is the same as it is normally operating and they have the identical swings of phase.
Even when the oscillation system fault protection device is able to act correctly according to different current phase.
(4) Current differential protection is not affected by voltage and current of opposite phase in the contact compensate
system. Because the protection methods only relate with the current numerical and phase at both ends, it does not
involve the phase relationship between voltage and current.
In addition, differential current protection is not affected by the load current and the problems in the three-phase
short-circuit death zone. Therefore, in approaching UHV transmission line protection, the technology of phase-distance
differential protection will replace the high-frequency technology, and become the mainstream technology of UHV
transmission line protection [4]
.
1.2The issues which exist in UHV current differential protection UHV which carries with a capacity of current for a long-distance owns economic and technical advantages, but also it
will face two major problems: First, because of the high voltage circuits and the high insulation costs, if it can promptly
lower voltage level after the fault? Second, because the transmission line brings about the larger electric capacity
current, the impact is particularly large for protection.
For the first issue, as storage elements exist and its energy cannot mutate, it will exert over -voltage in the UHV fault
lines when it puts into empty and breaks the fault. To ensure that the insulator was no breakdown when the over-voltage
presents, the program can be taken:
(1) Increasing the level of insulation (but increase investment);
(2) Through the rational allocation and choose arrester to prevent the electrical equipment damage from the
over-voltage (but it will generate conduction from lightning arrester to earth, and expand the scope of protection);
(3) Adding shunt induct coil (but it will result the operation complexity between it and breaker)
(4) Set up a reasonable order for protective actions and circuit breaker tripping in order to limit the over-voltage
(operating experience of UHV lines in Russian proves that the method is effective at certain extent).
Regarding the second question, the 750kv transmission line is composed of six divide wire. Comparing with 500kV
transmission lines, its wire diameter increases, its impedance declines, and its capacity of transport makes greater. But
also the distributed capacitance current increases between different phases and phase to earth, the current both ends of
the lines isn’t balance in the normal functioning of state, thus it results poor current, and it will become even more
noticeable in failure. The problem may be not serious on the general the differential current protection of the HV and
EHV long line, but for the UHV transmission line, it may be fatal. So on the EHV of long line, studying current
differential protection should be given sufficient attention.
1.3 Action criterions apply to current differential protection of UHV transmission lines After study in 750kv transmission line, the capacitive current will reach or surpass 100%Ie when the best transmission
radius is more than 1000km [6, 7]
, with the growth of line, capacitive current is also growing. Simulation experiments
prove that the flow of capacitive current passing through differential relay can be achieved 1270A in none measures and
normal working, and it accounts for 52.88% of the flow through the current phase. To protect from malfunction, it is
necessary to increase the differential fixed threshold value of the protection, but it will reduce the protective sensitive,
and make it difficult to set, it can easy lead to protection malfunction[7]
. Therefore, high voltage shunt reactor are
inserted in the actual transmission line to compensate part of capacitive current, reduce the influence and increase
sensitivity of capacitive current differential protection, but when the line is longer, the circuit will still be larger
capacitive current, it will affect the normal operation of the protection.
Therefore, how to raise the sensitive of protection at the same time, improve the reliability of the protection movement,
is the focus for us. At present, it is more effective way to study in the criterion. there are usually two ways of Criterions
used on, they are whole current and fault component, as well as Normalization criteria and the instantaneous value of
the fault component criteria transforming from these. Their characteristics are following:
(1) The whole current action criterion:

Modern Applied Science
4
0
.....
...
IIIKII
III
nmnm
zdnm
if the criterion is Adopted during normal operation or external fault, the existence of load current will not have a huge
impact protection, protection reliably can not cut off breaker, but in the case of an internal asymmetric fault or sending
out large load by big electric resistance, the protection will doesn’t action, and reduce its sensitivity.
(2) The criterion of fault components:
nmnm
zdnm
IIKII
III
....
...
The criterion of phase constituted differential protection is maid of mutations current after system failures in each phase
current volume, due to adopt a fault component currents, it eliminates the impact of load current from the principle, the
capability of transit resistance has been markedly strengthened, and higher sensitivity of the action. However, we need
some time to eliminate the DC component, it has not higher speed.
On the basis of criteria similar to the birth:
(3) The criterion of normalization:
.
.
.
.
.
.
.
.
n
n
m
m
n
n
m
m
I
I
I
IKI
I
I
I
By simulation the criterion is applicable to the all conditions for import as fault components, it respond quickly in the
region, and has certain the high reliability to external region.
(4) The fault component criteria based on the instantaneous value:
kk
k
t
tkn
t
tkm
dzn
t
tkm
kikki
Ekiki
00
0
)()(
)()(
The criterion maid use of instantaneous value can be avoided as the complex Fourier calculate, and reduce the time of
action, at the same time it has the actions properties of against time. The more internal fault is serious, the more the
current fault component is greater, and the speed is more faster that the fault was judged, it replenish the insufficiency to
the serious fault for failures of rapid response to, the differential protection in internal fault has the best sensitivity.
Different criterion has itself expertise, in order to enhance the protection of UHV, We designed a agent architecture from
the perspective of artificial intelligence, the agent architecture can dynamically choose different criteria in different fault
region, it can coordinate each other and choose reasonable, it can effectively improve the reliability and sensitivity in
the UHV transmission lines.
2. Intelligent Agent "Agent" is also known as act on behalf of someone in a responsible position, in a sense, it has the characteristics of
commercial activities with factor, it has the ability of their own reaction, coordination and decision-making according to
environmental changes. The technology of Intelligent Agent has become one of the tasks of the fastest-growing in
artificial intelligent field, it is a collection of autonomy, social response, adaptability and coordination of integrated, an
intelligent entity formed by the hardware or software. Their identity is mainly manifested in the following aspects:
(1) Autonomy: Agent operation is noninterference directly by human or other agent, its implementation is different from
ordinary procedures controlled entirely by outside, not as objects, the definition of its internal transfer from the outside,
Agent has a certain extent for the state of their internal and the action;
(2) Society: Agent can achieve coordination and interaction with the external environment or other agents through a

5
Modern Applied Science
certain language (e.g. KQML);
(3) Response: Agent has the ability of perceiving the environment and responding and impacting on the environment in
time;
(4) The nature of adaptation: Agent has the character of opening, it enable to adapt the inference activities gradually ,
and expand, restrict or amend their own state of local knowledge, keep the target at the right time;
(5) Coordination: with the environment or with other Agent: consultations, cooperation and coordination work.
3.The individual Agent Architecture applied to differential protection According to the features of differential protection, we have built a differential protection Agent with intelligent
behavior; it can automatically choose different criteria of differential protection according to the different fault to
achieve the greatest sensitivity and reliability. Its structure is as follows:
Figure 1. Structure of individual agent
The structure consists of six modules, each module fulfills its task as commitment, here there are some main functions:
(1) Interface Module
Interface Module includes perception interface module, human interface module and communication interface module
three parts.
Perception interface module which is the interface between Individual Agent and the surrounding environment, it is
used to Percept the changes for the environment around; the man-machine interface module is the interface between
Individual Agent and the user interaction, it is used to receive user information or instructions and return to the results
of implementation; Communication Interface module is used to exchange the information with other agent, help each
other, and accomplish a tasks with cooperate.
(2) Fault diagnosis module
Fault diagnosis module analysis the fault information transmitting by perception interface module for calling the
knowledge base and rule base, and find out the cause of the malfunctions, identify faults component and judge fault
types. This is very important to select accurate criterion for decision criterion module at the back;
Oth
er Ag
ent
Interface module
Fault Diagnosis module
Decision criterion module
criterion 1 Criterion 3
Executive module
Co
mm
unicatio
n
in
terface
Hu
man
interface
Hu
man
interface
perception
interface module
Kn
ow
ledg
e
base
rule b
ase

Modern Applied Science
6
(3) Decision criterion module
There are many criterions in the decision criterion module, as: the whole current action criteria, the fault component
criteria based on the instantaneous value and the criterion of normalization. They can select correctly relevant criterion
through diagnosing different fault type by Fault diagnosis module, (e. g fault in or out), carry out correct action result,
the sensibility and the credibility of protect get valid exertive.
(4) Executive module
Executive module carry out the correspond behavior according to the result performance of the decision criterion
module.
The protect model makes use of a forerunner artificial intelligence technique research result, feels fault of transmission
line passing by perception interface module on the basis of extensive use for fixed fault position[10] and fault
diagnosis[11]
, delivers the possession information that has been diagnosed by fault diagnosis module to decision criterion
module, then selects relevant action criterion by Decision criterion module. While examining a fault to break down and
may take place in the area, it chooses the fault component criteria based on the instantaneous value (4) as lord
protection, so it can raise the sensitivity of protection in the area; While examining a fault to break down and may take
place out the area, it chooses the whole current action criteria (1) as lord protection, it may raise the credibility of the
action when tremendous exaltation exterior break down. The criterion of normalization (3) is look on as near protection
backup for this line, after it is delayed, if lord protection can act credibility, the protection return, otherwise it breaks
down this line after certain time, it can achieve the greatest sensitivity and reliability.
4. Emulate result Following fig is a emulate model:
` `
Figure 2. The simulate model in 1000KV power transmission
The paper has calculated to a power system of 1000KV by making use of a ATP emulate procession for electromagnetic
transient status. Electric source is expressed with concentrate parameter, line is expressed with LCC, and concrete
parameter is as follows:
Power: EM=1000 0 kV, EN=1000 kV; ZM1=0.4225+j29.85 , ZM0=0.1865+j26.71 , ZN1=0.4225+j29.85 ,
ZN0=0.1865+j26.71 .
LCC model using lines: about 50m high towers, three-phase horizontal arrange in a row, 22m of an average height to
earth, 24m of the distance between the two phase, 45.5m of an altitude on average and 34.6m of the distance for two
overhead ground wire, protection angle is 24 ° ~ 28 °. voltaic wire are maid of eight separatist wire, each of wire
diameter is 35mm and 400mm between them, diameter of the entire split wire is about 1000mm.
In addition, there is compensation in tandem with the capacitor and Shunt Reactors compensation. The compensation
will reach 110%. Total installed capacity of compensation 25800MVAr shunt reactor, 13500MVAr series capacitor.
The simulation results show that: when the fault break down inside the sanctuary at f1 point, the lord protection criterion
which is constituted of the instantaneous value and the fault component can rapid cut off breakers at the two ends of
lines; When the fault occurred outside the sanctuary at f2 point, the lord protection criterion which is constituted of
whole current action criteria can refuse to cut off the line. Intelligent Protection realized in different regions of the fault,
will automatically, and the dynamic select the different criterion, the sensitivity and reliability of the protection have
been effectively raised. But the coordination among different segments and protections on Transmission line will be the
contents for next step to study.
References [1] Barabanov, Yoriy. (2001). Protection Relays of 750kv Transmission Line in Russia. (He Jiali,Trans In: Report of
Academic Workshop of Beijing Society of Electrical Engineering ). Beijing.
[2] Fan, Zhanfeng, Li, Rui-sheng, Zhang Hong-xia and Li Zheng-feng. (2005). Research on UHV transmission line
f1
f2
Ind
ivid
ual A
gen
t
com
mu
nicatio
n
Co
mm
un
ication
Ind
ivid
ualA
gen
t

7
Modern Applied Science
protection pilot differential protection. Relay. Vol.33. No.3. February 1.
[3] Zhu, Shengshi. (1995). Principle and Technology of Protective Relaying in HV System. Beijing: China Electric
power Press.
[4] Li, Zhe. (2000). Discuss the Application of Split-phase Current-Differential Protection in EHV Transmission Lines.
Plan and design.
[5] The Prospect of Developing UHV Transmission System in China. UHV technology. Beijing: 2002.
[6] Dong, Xinzhou, Su, Bin, Bo Zhiqian and He Jiali. (2004). Study of Special Problems on Protective Relaying of
Transmission Line. Automation of Electric Power Systems. Vol.28, No.22. Nov. 25. No. 4.
[7] Wang, Haigang, Dong Xinzhou, Bo, Zhiqian. (2006). A Sensitive and Operational Criterion for Current Differential
Protection of Transmission Line. Power system technology. Vol. 30. No.10. 5.
[8] Qian, Feng. (2005). The Outline and Application of the New Fault Place Theory and Technology on Line. TheSupervise Equipment and Fault Diagnosis in power System. 11.
[9] Nie, Qinwu. (2004). Research on Distributed Intelligence Fault Diagnosis Model & Implementation Which Based
on MAS. Engineering and application of computer. 10
[10] Bo, Z. Q. (2002). Adaptive non-communication protection for power lines BO scheme I - the delayed operation
approach. IEEE Trans on Power Delivery, 17(1): 85-91.
[11] Li, Yan, Chen, De-shu, Zhang Zhe, et al. (2001). The emulation analysis for the influence of capacitance current of
UHV transmission line on differential current protection and compensating countermeasure. Relay. 29(6):6-9.
[12] Coury, D. V., Thorp, J. S., Hopkinson, K. M. et al. (2002). An Agent-based current differential relay for use with a
utility Intranet. IEEE Trans on Power Delivery. 17(1): 47-53.

Science News
8
'Biological Pump' Overestimated: Study Challenges
How Life in the Oceans Removes Carbon from the Atmosphere
University of Southampton
Science Daily, June 29, 2007
Dr Andrew Yool of the National Oceanography Centre, Southampton, working with colleague Dr Adrian Martin and
researchers from the University of Concepcion in Chile and Plymouth Marine Laboratory (Camila Fernandez and
Darren Clark) calls into doubt one of the most popular means of assessing the strength of the so-called 'biological
pump’, which removes carbon dioxide from the air to the deep ocean.
Writing in the science journal Nature this week (Thursday 21 June, 2007) Dr Yool, a research fellow at the University of
Southampton’s School of Ocean and Earth Science, says: “For more than 20 years scientists have been using a simple
formula to calculate how much ‘marine snow’ – dead plankton and detritus – leaves the upper, sunlit ocean waters and
sinks to the deep ocean. When studying climate change, knowing how much carbon reaches deep water this way is
important for understanding how much more can be stored in the oceans. Because it is difficult and time-consuming to
measure sinking in the open ocean, the strength of the biological pump has routinely been estimated using a simple
formula known as the f-ratio.”
Dr Yool’s team has demonstrated that a key assumption often made in using the formula is incorrect. The formula was
first published in Nature in 1979 and has since been used extensively by scientists to extrapolate from small-scale
experimental results estimates of what happens in the wider ocean. By making use of both research cruise data from
around the world and an ecological model of the ocean’s nitrogen cycle, Dr Yool’s team was able to look more carefully
at this assumption.
Phytoplankton (microscopic plants that have been dubbed the ‘grass of the sea’) require both nitrogen and carbon to
grow. When they die gravity causes them to sink – the biological pump effect. In surface waters nitrogen mostly exists
as one of two forms, nitrate or ammonium, traditionally thought to have different sources: ‘new’ nitrate arriving in
surface waters by the upwelling of deep, nutrient-rich water, while ‘recycled’ ammonium is being produced when
plankton die and decompose in surface waters. This means that by quantifying the amount of nitrate taken up by
phytoplankton to grow scientists can estimate the sinking flux, since at equilibrium what goes down must come up. The
f-ratio, which compares this nitrate-fuelled production to total production (including that fuelled by ammonium) is
routinely used by oceanographers for the above reason.
But, according to Dr Yool, making this measurement might be a waste of time. He says: “Upwelling of deep water is not
the only source of nitrate. There are two groups of bacteria that, by a process known as nitrification, convert ammonium
into nitrate. It’s only recently been discovered that they do this throughout the water column, from top to bottom.
Previously it was thought to be relatively unimportant in surface waters and was largely ignored.”
Since the f-ratio was first devised scientists have been improving their techniques to measure nitrification, and its
importance has begun to be reassessed. If near-surface nitrification is significant then the f-ratio cannot be used to
estimate the strength of the biological pump.
To examine the importance of nitrification, the group lead by Dr Yool brought together almost all of its oceanic
measurements. They then used these to configure a global ocean model which contained a simple representation of the
plankton ecosystem, and “ran” this model for 20 years. By using a double-accounting trick this simulation found that
throughout much of the world ocean a substantial fraction of the nitrate taken up in primary production is actually
generated through recent nitrification near the surface, and not through the re-supply of nitrate from the deep ocean.
At the global scale, they found nitrification to be responsible for around half of the nitrate consumed by growing
phytoplankton. For scientists working on research cruises this means that more difficult measurements of sinking
‘marine snow’ itself may have to replace the simpler f-ratio experiments.
Dr Yool concludes: “These results suggest that it is not possible to quantify accurately the biological pump using only
nitrate and the f-ratio. Since many scientists predict that the pump's strength may decrease in the future in response to
climate change or ocean acidification, this work highlights the importance of developing more accurate ways to
measure it.”

Vol. 1, No. 2
July 2007
9
Modern Applied Sciencewww.ccsenet.org/mas.html
SR Analysis with Computer Algebra
Zongyan Xu & Dongwei Huang
School of Science, Tianjin Polytechnic University, tianjin 300160, China
Hongli Wang
School of Mechanical Engineering Tianjin University, tianjin 300072, China
Tel: 86-22-2452 8453 Email: [email protected]
AbstractIn this paper, Hurst exponent is applied to study Shenzhen Stock component (SSC), which shows that the market is a
chaotic system and Hurst exponent is valuable in stock market. The program package presented can be used in
calculating SR .
Keywords: Chaos, Hurst exponent, SR1. Introduction Generally, one of the most commonly used indicators to study the fractal and chaos theory is the Hurst exponent based
on the analysis of rescaled range. Hurst discovered that instead of following Brown motion and Gauss distribution, the
most of nature phenomena, including river levels, temperatures, rainfalls, and sunspots do follow biased random walk.
Hurst extended Einstein’s work on Brownian motion that the distance that a random particle covers increases with the
square root of time used to measure it:
5.0TR (1)
Where R is the distance covered, T a time index. He found that the following was a more general form of equation (1):
HN bNSR )()( (2)
Where SR is rescaled range, b is a constant, N is time index of a time series ),,2,1(}{ Ntxt , H is called as Hurst
exponent. Equivalently, in logarithm, equation (2) becomes
)ln(ln)log( bNHSR (3)
/R S analysis is a nonparametric method raised by Hurst studying ample empirical analysis. The procedure for
calculating /R S is as follow:
Step1: For a given time series }{ tx of length M , divide this time period into A contiguous subperiods of length N ,
such that MAN . Label each subperiod aI , with Aa ,,2,1 . Each element in aI is labeled akx , such
that Nk ,,2,1 . For each aI of length N , the average value is defined as:
N
kaka x
Ne
1
,
1
Where ae is average value of the M contained in subperiod aI of length N .
Step2: The time series of accumulated departures aky , from the mean value for each subperiod aI is defined as:
),,2,1()(1
,, Nkexyk
iaaiak
Step3: The range is defined as the maximum minus the minimum value of aky , within each subperiod aI :
}{min}{max ,1
,1
akNkakNka yyR
Step4: The sample standard deviation calculated for each subperiod aI :
2
1
1
2, ])(
1
1[
N
kaaka ex
NS

Modern Applied Science
10
Step5: Each range,aR , is now normalized by dividing by the aS corresponding to it. Therefore, the rescaled range for
each aI subperiod is equal to aa SR . From step1 above, we get A contiguous subperiods of length N . Therefore, the
average SR value for length N is defined as:
A
aaaN SR
ASR
1
)(1
)(
We can now apply equation (3) by performing an ordinary least squares regression on )ln(N as the independent
variable and NSR )ln( as the dependent variable. The slope of the equation is the estimate of the Hurst exponent H .
Simple discussions are given as follows: If 0 0.5H , the time series is anti-persistent. If 0.5H , the time series is
standard Brownian motion. If 0.5 1H , the time series is persistent. Let the measure of the length of the cycle V
be ( )NN
R SV
N.
2. Design ideas With applied computer algebra system Mathematica, we get some program packages as follows:
Hrra [ndata_,num_]:the average SR value for each length N .
Hurstzh [ ndata_]:the estimate of the Hurst exponent.
Where the variable ndata is the original data, the variable num is the length N for each aI .
And the module hurstzh [ndata_] contains the module hrra[ndata_,num_].
3. Results In this study, total 2392 Shenzhen stock components from 1992 to 2000 are used. From figure 2, we can easily observethe sequence data has a strong linear correlation. In order to eliminate the linearly dependence,applying (1)AR regression to the component, we have
1( )t t ty x a bx
Where a and b is the coefficient of the (1)AR regression model.
0 500 1000 1500 2000time
0
1000
2000
3000
4000
5000
6000
tnenopmocx t
Figure1. Stock component original time series diagram
0 1000 2000 3000 4000 5000 6000xt 1
0100020003000400050006000
x t
Figure 2. 1t tx x Phase diagram

11
Modern Applied Science
0 500 1000 1500 2000time
-300-200-100
0100200300
y t
Figure 3. The sequence data after adjusting component to eliminate trend According to the above theory, we get )998925.042191.4( 1ttt xxy . And 84.3)2377,1(41441.9 05.0FF shows that
there exists the dependency significant between tx and 1tx (figure 2). However, 93.1DW shows that the series
{ }ty is not clear dependency, that is to say, the linearly dependency of stock component series has been removed. Thus,
we get ideal results by /R S analysis method.
We obtain the values ( )NR S and N (table 1) to be carried out fitting. Hence we get the fitted curve: xxf 659262.0520362.0)( , thus, Hurst exponent 5.0659262.0H indicates that Shenzhen stock market has distinct fractal characteristics.
Table 1. The value NSR )( and NV of Shenzhen stock component series
N NSR )( NV N NS
R )( NV N NSR )( NV
2 0.707107 0.50000 24 5.12472 1.04608 108 13.1557 1.26591
3 1.10077 0.635527 27 5.5742 1.07285 132 15.7062 1.36705
4 1.42804 0.714022 33 6.09506 1.06101 198 19.5645 1.39039
6 1.95637 0.798834 36 6.55034 1.09172 216 20.7775 1.41373
8 2..43735 0.861734 44 7.40883 1.11692 264 24.9546 1.53585
9 2.65252 0.884173 54 8.43224 1.14748 297 23.3234 1.35336
11 3.0429 0.917468 66 9.78581 1.20455 396 29.0291 1.45877
12 3.22352 0.930551 72 10.4268 1.22881 594 33.6387 1.38021
18 4.28143 1.00914 88 11.9419 1.27301 792 46.8194 1.66365
22 4.81813 1.02723 99 12.3931 1.2355 1188 59.1688 1.71666
As shown in table 1, it is easily observed that the average orbital period of the system is 264 trade days (It can be judged by the Hurst exponent declining for the first time). To a certain extent, the objective of the state continued existence and the long-term memory cycle of Shenzhen stock market (SSMS) can be verified through this result.
4. Conclusion Hurst exponent 5.0659262.0H shows the fractal characteristics of SSMS. The calculations of Hurst exponent shows that the average orbital period of SSC is about 264 days(approximately 53 weeks), which shows SSMS has state persistence and long-term memory, and the memory cycle is 53 weeks, which means Hurst exponent is valuable in the investment in stock market. This is broadly consistent with the conclusion of some literature on SSMS. Furthermore, this conclusion confirmed the objective existence of the fractal characteristics of SSMS.
Acknowledgements The authors gratefully acknowledge the support of the National Natural Science Foundation of China (NNSFC) through grants Nos. 10472077 and 50375107.
References Chen, Zhao and Wang, Guochen. (2005). The study and application of chaos theory and fractal dimension. HLJ Foreign Economic Relations & Trade. Vol.7. pp.75-76.
Ma, Junhai. (2005). Reconstruction of complex systems. TianjinUniversity Press, p.
Yang, Yiwen and Yang, Chaojun. (2003). Short term forecasting of stock market based on R/S analysis and fuzzy neural networks. Proceedings of the IEEE International Conference on Systems, Man and Cybernetics. Vol.3. pp.2827-2832.
Ye, Zhongxing and Cao, Yijian, (2001). Application of Hurst Exponent in Analysis of Stock Market’s Efficiency. Systems Engineering. Vol.3. No.19. pp 21-24.
Yang, Yiwen and Liu, Guizhong. Empirical analysis on fractal market hypothesis in shanghai and Shenzhen stock markets, Modern Economic Science. Vol.24, No.1. pp.75-70.

Modern Applied Science www.ccsenet.org/mas.html
Vol. 1, No. 2
July 2007
12
Design Concept for Future Autos
Wen Chen
Law School, Heilongjiang University, Heilongjiang 150080, China
Tel: 86-451-8807 4959 E-mail: [email protected]
Abstract As the primary transportation tools for modern people, Autos are facing a tremendous transform. With shortcomings
which couldn’t be overcome, Ancient animal-drawn vehicle had been replaced by motor vehicles. However, motor
vehicles still have inextricable malpractices such as lower security, lower speed, dependent for energy sources, lacking
of environmental protection, single purpose, lower efficiency, single directional and manual control etc. Future autos
will settle these problems out and out. In the design concept, future autos will take multiple comprehensive values such
as security, high speed, self-supporting power, environmental, all-purpose, high efficiency, multiple directional and
intelligent controls etc., which will bring profoundly influences for human lives in many respects.
Keywords: Future Autos, Environmental Autos, All-purpose Autos
As the primary transportation tools for modern people, Autos are facing a tremendous transform. Auto industry is
entering into the most important phase of “optimizing the integrated relationships from people to auto to environment”.
( Liang, 2006, p.22). Electronic technology of autos is developing for the direction of network and intelligence, in which
electronic controlled equipment will offer stable, reliable and low-cost network connections by the CAN bus unit,
engine, switches and sensors will be connected through LIN network and the intelligent control will completed. (Kang,
2007, p.60). In the future soon, when the traditional autos become the items on display in museum, people will feel the
same feelings to the luxury autos such as Benz and BMW just like moderns feel to the ancient animal-drawn vehicles.
With shortcomings which couldn’t be overcome, Ancient animal-drawn vehicle had been replaced by motor vehicles.
However, motor vehicles still have inextricable malpractices such as lower security, lower speed, dependent for energy
sources, lacking of environmental protection, single purpose, lower efficiency, single directional and manual control etc.
Future autos will settle these problems out and out. In the future, computer network or artificial intelligence will replace
drivers to drive autos, in the process of driving drivers only need input the address of destination to automatic drive
system in the car and the car will automatically run, and the vehicle collision avoidance and intelligent control system
timely identifies the safe running distance through ultrasonic ranging, radar ranging or laser ranging and automatically
avoids barriers in virtue of automatic brake protection system, the computer network connected with satellites
continually offers navigational information for car, in the critical fork or on the point of destination, intelligent system
will remind drivers to select or resume “manual control” through sound hints, then the car will automatically bear off
intelligent driveway and arrive at the destination. With the development of ITS, various intelligent autos will be applied
broadly. (Xiao, 2006, p.52). From the strict meanings, future intelligent autos have exceeded head and shoulders above
the implemental meanings which are included in the traditional word “auto”. In the design concept, future autos will
take multiple comprehensive values such as security, high speed, self-supporting power, environmental, all-purpose,
high efficiency, multiple directional and intelligent controls etc. This article will introduce these characteristics of future
autos in the following text.
The first characteristic is the strong security. The high sensitive detector with collision avoidance will be installed in the
car. When some dangerous things appear in the precautionary scope from every directions during driving, the vehicle
detector will make rapidly reaction and perform the control orders for avoiding crash, so the bodywork can
automatically avoid collision successfully. So, there are no cause troubles in the traffic, unless some most occasional
accidents happen. Driving safety factor can be described by no risk at all. The approach which lets car predict
forthcoming crash, and then adopts automatically measures to stop crash mainly is in virtue of a sort of technology
which is called “V2V’ to make effective communications among autos. Increasingly advanced and well-rounded GPS
will make you accurately know where your car is in any time. The control system can track your speed and directions,
input these information into your vehicle computer, so the computer can automatically control your car. In this aspect,
General Autos did better than Volkswagen. They install the equipments of “special short-range communication” in their

13
Modern Applied Science
cars of Cadillac, which can predict the front car with the same equipment, the vehicle computer will automatically brake
without driver’s operation, and the effect is very excellent. (Ke, 2007, p.8). In future, more advanced and scientific
equipment with avoiding crash and stable and safe control will come out in succession. The VIOS and PRIUS produced
by Japanese Toyota equip the automatic parking system which indicates driver enter into the parking space through the
radium facility. A new type of 18-wheelers super vehicle equips eyeball scan system which can record the driver’s blink
times even monitor the activity status of pupils through recorder to judge driver’s tiredness extent and alcohol
concentration and keep driving safe. A type of HYBRID auto produced by Honda can assist driver automatically modify
the right way when the car departures the driveway. New type of Acura ML car equips bran-new GPS, except for
directing way for driver, and offering traffic status in time. (Zhou, 2006, p.10). At present, ABS, REF, ASR, AFU, ESP
and fixed speed cruise system have be applied broadly in middle and super level autos.
The second one is the higher speed. Instant starting speed can achieve hundred or hundreds kilometers, and moving
speed is still can not be gained at all by traditional autos. The mph of the future high-capability autos can correspond
with velocity of sound or light.
The third one is the self-supporting power. Future autos will not depend on biologic energy or mineral energy any more.
The non-renewable resources such as petroleum will quit market for ever, and which will be replaced by new
reproducible clean energy sources such as electric energy, wind energy, sun energy and nuclear energy. Future auto only
needs equip a generating set with little volume and storing electricity set with big capability. The generating set only
offers energy for auto’s start, after that during the running with high speed, frictions which are produced in bodywork
and atomies, ions in air will generate tremendous static which will be collected by vehicle set and stored in the storing
electricity set. At the same time, some instant energy such as sun energy and wind energy surrounding the bodywork
will be transformed and stored, which can ensure however far the car goes, the storing electricity set all can offer
ceaseless energy. The traditional autos only can supply energy from outside, but intending autos can live up to supply
energy from itself and even can have a little remnants.
The fourth one is the environmental protection. Because the traditional autos let exhaust gas, waste residue which
pollute environment seriously, so many countries all pay more attention to the R&D of “green autos”, for example, the
American General Autos and German Opel autos had manufactured the fuel cell cars of “hydrogen power No.1” in the
year before last. And Daimler-Chrysler had manufactured the fuel cell cars of “new energy No.5” based on the “A”
series of Benz. (Liu, 2006, p.61). Future autos use green and environmental clean energy sources which will not
produce any pollution and threaten to the surroundings during driving. By way of many years’ research, we can obtain
the possible energy sources including electricity energy, hydrogen, carbinol, ethanol, CNG, LNG, LPG, twain methyl
aether, sun energy, and biologic energy etc. which can replace petroleum. (Huang, 2006, p.38). The R&D of new
environmental cars and new energy cars has become the new area where famous domestic and foreign auto
manufactures compete. The General Autos’ strategy of environmental cars in America is divided into three steps: the
first one is to improve the present fuel cars, the second one is to develop mixed power cars, and the third one is to

14
Modern Applied Science

15
Science News
New Approach to Fixing Spreadsheet Errors Could Save Billions
Oregon State University
Science Daily, June 28, 2007
Computer scientists at Oregon State University have created a new, much simpler approach to fixing errors in
spreadsheets, a system that is easy to use and might help businesses around the world reduce mistakes and save billions
of dollars.
The advances - which allow a non-specialist to identify and fix a problem by selecting from a short list of change
suggestions -- were announced today at the International Conference on Software Engineering in Minneapolis, Minn.
The new system, called "GoalDebug," is being licensed to a spinoff company in Oregon.
Spreadsheets, a standard bookkeeping and accounting tool used by businesses to track everything from payroll to
accounts receivable, are one of the most common of all computer software programs. In the U.S. it has been estimated
that 11 million people create about 100 million spreadsheets a year, which in turn might be managed by up to 60 million
users. But they are notoriously prone to errors, experts say.
"Most users of spreadsheets are overconfident, they believe that the data is correct," said Martin Erwig, an associate
professor of computer science in the OSU College of Engineering. "But it has been observed that up to 90 percent of the
spreadsheets being used have non-trivial errors in them. In fact, one auditor has said he never inspected a single
spreadsheet during his entire career that was completely accurate."
Sometimes the result is a paycheck delayed or a few dollars misplaced. But often the costs or financial
misrepresentations are far more serious, and companies have lost millions or billions of dollars, Erwig said,
occasionally drawing notice and ridicule in the national press. The overall problem for business and industry is
sufficiently large that OSU's work has already drawn the attention of some large financial institutions.
Part of the problem, Erwig said, is that spreadsheet use and development is so common that it is frequently being done
by people with very limited training or interest in computer software programming. These "end users" of computer
software don't have the background to investigate codes, programs or formulas, they just want the program to work, and
often erroneously assume that it does.
"There are dozens of places an error can be made," Erwig said. "A person can click their mouse in the wrong spot, a
simple mechanical error. They could use a plus instead of a minus, add a row at the end of a data area instead of in the
middle, and get a completely different result. And these errors can be awfully difficult to spot, especially with large
spreadsheets that have thousands of cells."
What the new OSU systems do is try to identify the ways that humans commonly make mistakes and then suggest what
the correct approach might have been. For instance, if someone sees a figure in a spreadsheet that seems suspicious or is
clearly incorrect, they can plug in the correct number, and the OSU system can suggest several programming mistakes
that might have created the error - which the user can then sort through and use to identify the problem. A study
performed by Robin Abraham, a recent OSU doctoral graduate, has shown that in 80 percent of the cases, the needed
change is among the top five suggestions produced by the system, and in 72 percent of the cases it is among the top two
suggestions.
"With this approach, people still have ultimate control over the spreadsheet programs," Erwig said. "What we do is give
them a prioritized list of where the problem most likely is. They can literally start at the top of the list, see if that's what
went wrong, and if not, move down to the second option on the list."
OSU's GoalDebug system, which stands for "Goal Directed Debugging of Spreadsheets," gives end users a chance to
explore, apply, refine, or reject suggested changes. This much simpler and systematic approach allows people with
comparatively little training in computer programming to identify and repair errors, Erwig said, by looking at a short list
of possible problems instead of combing through hundreds or thousands of cells.
Software engineers spend 70-80 percent of their time testing and debugging programs, a recent study concluded - and
even for these professionals, finding and fixing errors took an average of 17 hours."Spreadsheet debugging problems
are huge," Erwig said. "We believe there will be a significant demand for these products, a large market."
This work, he said, is one part of the EUSES Consortium - End Users Shaping Effective Software - that OSU leads, in
collaboration with Cambridge University, Carnegie Mellon University, Drexel University, IBM, Pennsylvania State
University, and the University of Nebraska. The consortium, directed by OSU computer science professor Margaret
Burnett, in funded in part by the National Science Foundation, and is part of a national effort to help the users of
computer software - often non-specialists without extensive formal training - better identify and solve problems.

Modern Applied Science www.ccsenet.org/mas.html
Vol. 1, No. 2
July 2007
16
Application of MIGA to Multi-objective
Optimization in Active Vibration Control
Xiangzhong Meng
College of Marine, Northwestern Polytechnical University, Xi’an 710072, China
Tel: 86-29-8847 4122 E-mail: [email protected]
Xiuhua Shi & Xiangdang Du
College of Marine, Northwestern Polytechnical University
127 West YouYi Road, Xi’an 710072, China
The research is supported by graduate starting seed foundation of Northwestern Polytechnical University. No. Z200510 Abstract Based on the system reserve energy index as objective optimization function of the structure vibration system, sets up
the multi-objective optimal disposition mathematical model which refer to the system control gain and the sensors and
actuators placements, quantities, lengths of the active vibration control system, adopts the multi-island genetic
algorithm (MIGA) as optimization strategy. Experiments with intelligent cantilever beam as an example, the vibration
control effect is very distinct. Hence, approves the method correctness and feasibility.
Keywords: Vibration mode, MIGA, Intelligent structure, Optimal disposition, Multi-objective optimization
At present, the active control is most applicable for the low frequency vibration in the structure vibration system. To an
ill control system, signal noise ratio maybe is very small or the vibration mode is unobservable and uncontrollable if the
sensors located in nodal line of the controlled mode, and the system maybe could not be controlled if the actuators
located in nodal line. The control gain and the sensors and actuators placements, quantities, lengths are effected to the
control performance and cost in the active vibration control system. The sensor disposition target is maximizing the
signal power of the definite structure excitation, and the actuator disposition target is minimizing the control force to
exciting the structure.
Genetic algorithm (GA) is a random search algorithm borrowing ideas from natural selection and genetic mechanism of
living nature. GA searches the optimal solution by simulating natural evolution, using code technology to act on the
numeric string called chromosome, and simulating the evolution process of the population made up of the stings. As a
parallel, random and self-adapting search strategy, GA has the global optimization advantage and very fits for treating
the complex nonlinear optimization including the hybrid variable, such as discrete, continuous and integer variable.
Multi-island Genetic Algorithm (MIGA), developed based on traditional GA (TGA), is a class of general-purpose
search method providing a remarkable balance between exploration and exploitation of the results that is characteristics
of GA. The main feature of MIGA that distinguishes it from the TGA is the fact that each population of individuals (i.e.
set of probable solutions) is divided into several sub-populations called “islands.” All traditional genetic operations,
such as selection, crossover and mutation, are performed separately on each island. Some individuals are then selected
from each island and are migrated to different islands periodically. The migration operation in MIGA keeps the diversity
of probable solutions and hence increases the chance of obtaining the global optimal solution.
1. The sensors and actuators optimal disposition mathematic model The system response is described based on the system modal, the intelligent cantilever beam vibration differential
equation is:
2( ) 2 ( ) ( )i i i i i i iz t z t z t BU (1.1)
where T
1 2( ) ( ) ( )nz z t z t z t is modal coordinate vector, i is the order i structure damping ratio, i is the order i
nature frequency.

17
Modern Applied Science
Given state vector TT T( ) ( ), ( )X t z t z t , then, in the state space, the equation (1.1) becomes:
0 ,X A X BU Y X (1.2)
where the parameters 0
A is system state matrix, B is system control matrix and is output matrix:
21 11
22 22
0 21 22
21 22
2
0, ,
2
n n n n
n nn
IA A A
A A (1.3)
11 12 1
21 22 2 ' '
2 1
1 2
0, , [ ( ) ( )]
m
mn mij a i j i j
n n nm
B B BB B B
B B B K x xB
B B B
(1.4)
110 , [ ( ) ( )]n m nmL L (1.5)
where the parameters aK is piezoelectric coupling coefficient, i and n denoting mode orders, j and mdenoting piezoelectric piece quantities.
The system reserve energy index is the integral of the sum of the system vibration energy and the weighted control
energy:
T T
0 0
1 1( ) ( )
2 2n mJ W W dt X QX U RU dt (1.6)
where the parameters nW is the system vibration energy, mW is the weighted control energy, U is the actuators
input voltage, Q is the state weighted positive semi definite matrix, R is the control weighted positive definite
matrix, and 21 0
0
AQ
I, R I , and , , are weighted coefficients. The actuators input voltage
U GCX , where the parameters G is the control gain, C is the weighted matrix, and 1
2
m
GG
G
G
,
0m nC C ,11 12 1
21 22 2
1 2
n
n
m m mn
C C CC C C
C
C C C
, ' '
2 1[ ( ) ( )]ji s i j i jC K x x .
The control system is a linear quadratic performance index system, it satisfied the Riccati matrix differential equation,
and it has progressive stability, G is the optimum control gain.
Given the initial condition (0)X , then, ( ) (0)AtX t e X , and 21 22
0
2
n n n nIA
A BGC A, so, the system reserve energy
index is:
TT T T
0
1(0)[ ( ) ] (0)
2
A t AtJ X e Q C G RGC e dt X (1.7)
The active vibration control aim is attenuated the vibration energy as quickly as possible using less control energy. So,
the system reserve energy index is objective optimization function of the structure vibration system. Obviously, the
objective optimization function depended on the initial condition, which affects the optimal result directly. To avoid the
initial state effect, the effective means is taken out the initial condition. Then, the objective optimization function is:

Modern Applied Science
18
T T T
0
1[ ( ) ]
2
A t AtJ tr e Q C G RGC e dt (1.8)
2. The optimal disposition of sensors and actuators in the intelligent cantilever beamThe intelligent cantilever beam sketch map is shown in figure 1. The intelligent cantilever beam and the piezoelectric
pieces parameters are given in table 1.
1jx and 2jx are the j
th pair of sensor and actuator coordinate value of start point and end point. aK is the
piezoelectric coupling coefficient, sK is the electromechanical coupling coefficient, and 2 31 2 1 2
1( )
2aK b d E h h ,
2 1 31 2
2s
p
b h d EK
C, where, pC is the piezoelectric pieces capacitance, and 2 2
2
plb e
Ch
,2
e is the piezoelectric pieces
capacitance inductivity, and 12
27.3 10e .
Table 1. The intelligent cantilever beam and the piezoelectric pieces parameters
Parameter/unit The intelligent cantilever beam The piezoelectric piece
Length/m L 0.475 l xj2-xj1
Width/m b1 3.5e-2 b2 3.5e-2
Thickness/m h1 1.5e-3 h2 1 e-3
Density/(kg*m-3) d1 2.7e3 d2 7.6e3
Young’s Modulus/Pa E1 7.47e10 E2 6.0e10
Piezoelectric Constant/C*N-1 d31 1.86e-10
2.1 The nature frequency calculation of the intelligent cantilever beam The intelligent cantilever beam system vibration equation is:
1 2 3 4( ) sin cos sinh coshx Y x Y x Y x Y x (2.1)
The intelligent cantilever beam boundary conditions of the fixed end and the free end are (0) 0 , '(0) 0 and
''( ) 0 , '''( ) 0L L . Put the boundary conditions into equation (2.1), then:
2 4
1 3
1 2 3 4
1 2 3 4
0
0
sin cos sinh cosh 0
cos sin cosh sinh 0
Y YY Y
Y L Y L Y L Y LY L Y L Y L Y L
(2.2)
In equation (2.2), the former two equations are put into the latter two equations, expressed in matrix:
1
2
sin sinh cos cosh 0
(cos cosh ) sin sinh 0
YL L L LYL L L L
(2.3)
Given the determinant of coefficient equate zero in order to the coefficient 1
Y and 2
Y don’t all equate zero. Then,
2 2cos cosh 0L L . The transcendental equation solution is:
CANTILEVER BEAM
ACTUATOR ACTUATOR
SENSOR SENSOR
x
y
Figure 1. The beam sketch map
2h
1jx
2jxL
1h

19
Modern Applied Science
11.8751L ,
24.6941L ,
37.8548L , ( 0.5) , ( 4)nL n n (2.4)
The intelligent cantilever beam system nature frequency:
2 1 1
1
i iE Im
(2.5)
where, 1
m is the intelligent cantilever beam unit weight, 1
I is the intelligent cantilever beam moment of inertia of
cross-section to axis y, and 1 1 1 1
m d b h ,3
1 11
12
b hI .
From equation (2.2) and equation (2.3), we obtain the expression with 1
Y :
2 1
sin sinh
cos cosh
L LY YL L
,3 1
Y Y ,4 1
sin sinh
cos cosh
L LY YL L
Assumed value 1
1Y , then:
To the first order vibration mode, 1
1.8751L ,2
1.3622Y ,3
1Y ,4
1.3622Y ;
To the second order vibration mode, 2
4.6941L ,2
0.9819Y ,3
1Y ,4
0.9819Y ;
To the third order vibration mode, 3
7.8548L ,2
1.0008Y ,3
1Y ,4
1.0008Y .
2.2 The vibration node position calculation of the intelligent cantilever beam According to the intelligent cantilever beam system vibration differential equation, the vibration equation corresponding
to the order i nature frequency is:
( , ) [ (cosh cos ) (sinh sin )]cos( )i i i i i i i i iy x t E x x F x x t (2.6)
where,
sin sinh
cos cosh
i ii i
i i
L LF E
L L (2.7)
The transverse vibration total displacement is superimposed of all the vibration, then
1
( , ) ( ) cos( )i i i ii
y x t E Y x t (2.8)
where,
sin sinh( ) cosh cos sinh sin
cos cosh
i ii i i i i
i i
L LY x x x x x
L L (2.9)
The node position of the order i mode can be calculate according to equation (2.9), if ( ) 0iY x , then
cosh cos cos cosh
sin sinh sinh sin 0
i i i i
i i i i
x x L L
L L x x (2.10)
The transcendental equation solution is:
To the first order vibration mode, 1
0x ;
To the second order vibration mode, 1
0x ,2
0.7739x L ;
To the third order vibration mode, 1 0x ,
2 0.5001x L ,3 0.8672x L .
The calculation results are coincident with the MATLAB simulation results in figure 2.

Modern Applied Science
20
Figure 2. The cantilever beam principal mode
2.3 The maximum amplitude calculation of the intelligent cantilever beam According to solid mechanics, the amplitude differential equation is:
2
2
( )
z
d y M xdx EI
(2.11)
The intelligent cantilever beam system displacement boundary condition is:
0, 0
0, 0
xy x
(2.12)
Then, the maximum amplitude of the intelligent cantilever beam is:
3
1 13
FLyE I
(2.13)
where the parameter F is exciting force.
2.4 The optimal disposition mathematic model and constraint conditions The optimal disposition mathematic model is:
T T T
0
1min [ ( ) ]
2
A t AtJ tr e Q C G RGC e dt
where, 61 10 , 1 , 21 10i
The constraint conditions are:
1 2
2 ( 1)1
11 2
0 1,2,
0 1,2, 1
0 1,2,
0,
j j
j j
j
m
x x j mx x j mG j mx x L
(2.14)
3. The simulation calculation 3.1 Optimization strategy The optimization strategy is multi-island genetic algorithm (MIGA), the parameters selected followed as: the initial
population is [x11, x12, x21, x22, G], the initial scope is [0.0125, 0.2364, 0.3041, 0.4083, 0.001], and the initial range is
[(0, 0.475), (0, 0.475), (0, 0.475), (0, 0.475), (0, 0.01)]; J>0; the number of sub population is 5; the sub population size
is 15; the roulette wheel selection probability is 0.8; the crossover form is intermediate, and the crossover probability is
0.8; the mutation function is Gaussian, and the mutation probability is 0.01, and the migration probability is 0.2. The
simulation calculation controls the former two orders vibration mode.
3.2 Analysis of the simulation result According to the parameters, the optimal results are shown in table 2, and the relational curve of object function value

21
Modern Applied Science
to generations is shown in figure 3. From table 2, we can conclude that there is only one pair of sensor and actuator, and
the piezoelectric piece length is l=x12-x11=0.3547m; the piezoelectric piece start point located 0.074m; and the control
gain is 4.5e-6.
Table 2. The optimal result
Optimization Parameters Data Type Optimal Result
x11 REAL 0.0743599054984189
x12 REAL 0.429058973981081
x21 REAL 0.0001656285411831
x22 REAL 0.0003864043097445
G REAL 4.50291833945152e-6
J REAL 0.039199e14
In MIGA, every design point has a fitness value, and fitness value based on the object function value and the constraint
penalty function value. The migration probability keeps the diversity of global search and hence evolves much enough
generations. After local convergence, such as the generation 230 and the generation 640, there is a phase step, and the
local convergence direction is accordant to the global convergence, which avoids the precocity.
Figure 4. The control effect of the intelligent cantilever beam active vibration control system
4. Conclusions

22
Modern Applied Science
According to the intelligent cantilever beam active vibration control system optimal solution procedure and simulation
experiment, obtained the optimal result, which includes the system control gain and the sensors and actuators
placements, quantities, lengths. In conclusion, the optimal disposition mathematic model and the optimization strategy
are correct and feasible, and the control affect in evidence in active vibration control.
References Fason, J L and Caughey, T K. (1990). Positive position feedback control for large space structures. AIAA Journa1. 28(4)
717-724.
Kang, Y. K. (1996). Optimum placement of piezoelectric sensor/actuator for vibration control of laminated beams. AIAAJournal. 34(9), 1921-1926.
Bo, Hong, Tze-Yun Soh and Lay-Peng Pey. (2004). Development of a helicopter blade FE model using MIGA
optimization. AIAA Journal. 1915, 1-8.
Chen, Bing. (2006). Single- and Multi-objective Optimization of Scramjet Components Using Genetic Algorithms
Based on a Parabolized Navier-Stokes Solver. AIAA Journal. 4686, 1-18.
Cao, Zongjie, Wen, Bangchun and Chen, Suhuan. (2001). A topological optimal approach for placements of distributed
piezoelectric sensor/actuator for vibration control of intelligent structures. Journal of vibration Engineering. 14(1),
90-95.
Chen, Xi and Lin, Tao. (2004). Study on parameter designing and performance for genetic algorithm. ComputerEngineering and Design. 25(8), 1309-1319.
Liu, Shu’an and Yin, Xin. (1999). Genetic algorithms based approach for bilevel linear programming problem. Journalof systems Engineering. 14(3), 280-285.
H.,Baruh. (2001). Control of the Elastic Motion of Lightweight Structures. AIAA Journal. 1304, 1-9.
H-S., Tzou. (1991). Distributed modal identification and vibration control of continua: piezoelectric finite element
formulation and analysis. J. Dyn. Syst. Meas. Cont. 113, 500-505.
Ren, Jianting and Jiang, Jiesheng. (2001). Actuator quantity and placement optimal design of vibration control. Chinesejournal of applied mechanics. 18(3), 64-69.

23
Science News
Radio Frequency Ablation Vaporizes
Inoperable Kidney and Liver Tumors
Cedars-Sinai Medical Center
Science Daily, June 29, 2007
Hollywood talent manager Louis Bershad, 68, whose clients include many top actors in town, recently underwent a
routine MRI for kidney stones only to learn from his urologist that he also had a tumor in his left kidney. The tumor
turned out to be malignant.
Facing a new diagnosis of kidney cancer, Bershad recalls, “The room seemed to go black, then I could only envision a
long treatment journey that would likely require open surgery, and intensive chemotherapy, both of which can have
complications and result in a lot of missed time from work.”
Bershad’s physician discussed treatment options with him, and based on several factors, including his general health,
the extent and location of his tumor, and the stage of the cancer, he recommended a new, non-surgical procedure called
radio-frequency ablation (RFA). “I considered my options carefully – and the choice was clear, says Bershad, I didn’t
want to go through an operation or the loss of my kidney.”
When Bershad met Peter J. Julien M.D., chief of Thoracic Imaging and director of the Radio-frequency Ablation
Program at Cedars-Sinai Medical Center’s S. Mark Taper Foundation Imaging Center, the cloud lifted. Julien, an
interventional radiologist, is one of the pioneers of RFA. The procedure requires only local anesthesia and avoids the
scars and complications associated with traditional open surgery. Because RFA involves no cutting, it is also a viable
option for individuals previously thought to be too old or sick to withstand surgery.
During RFA, an interventional radiologist carefully guides an ablation needle into the center of the tumor using imaging
techniques such as ultrasound or CT scan. The probe is connected to a radio-frequency generator that delivers
alternating electrical current (radio-frequency energy) to the tumor producing heat up to 140 degrees Fahrenheit. This
causes cancerous cells to shrink and die, but healthy tissue is spared because the probe cools as it is removed. “My
doctor asked me to come back for an MRI in three months, so that he could make sure the tumors were gone,” Bershad
explained.
Bershad was diagnosed with stage II renal cell carcinoma. In adults, the most common type of kidney cancer is renal
cell carcinoma (renal adenocarcinoma), which begins in the cells that line the small tubes within the kidney. According
to the Kidney Cancer Association, renal cell carcinoma affects more than 32,000 people per year, and the exact cause of
the disease is unknown. It is most common in people between 50 and 70 years old, affecting men more often than
women.
Typically, surgical removal of kidney tumors (nephrectomy), which has been the standard of care for kidney cancers,
results in hospital admissions of 7 to 10 days and postoperative recovery time of 6 to 8 weeks. By comparison, RFA is
not only minimally invasive with a short recovery time, but it also allows for the kidney to be preserved. RFA also
avoids postoperative complications such as pain, pneumonia, injury to the organs and scars.
Although the procedure is new and more data are needed, it appears to result in survival rates that are comparable to
those of radical or partial nephrectomies. Beyond that, it may well offer hope for patients with liver cancer.
“RFA has emerged as an alternative treatment for inoperable liver cancer, and has been shown to vaporize tumors as
well as slow cancer progression in larger tumors,” said Julien who explains that preliminary results in patients with liver
lung and kidney cancer are promising. “It is possible that this procedure may someday completely replace surgery for
kidney cancers in many patients,”.
Bershad, who underwent the procedure at Cedars-Sinai Medical Center six months ago, said that he returned to work
and resumed his daily activities only one day after the procedure. Today, he remains cancer free.
Looking back, he expresses relief that the cancer was in an accessible place and caught in time. He says, with a sparkle
in his eye, “I feel very lucky. My lifestyle remains untouched: I’m active and I work, swim and play with my
Dobermans as if it never happened. If you have a cold, you lose more time than this.”
“Thanks to Dr. Julien, the RFA procedure worked out brilliantly, Bershad concludes, “I want people to know that this
procedure is available, effective and painless.”

Modern Applied Science www.ccsenet.org/mas.html
Vol. 1, No. 2
July 2007
24
Application of Vandermonde
Determinant in Combination Mathematics
Changzhou Dong & Junqing Wang
Mathematics Department, Tianjin Polytechnic University, Tianjin 300160, China
Email:[email protected]
Abstract Given an application of Vandermonde determinant in Combination mathematics, that is, proved several important
combinatorial identities by using Vander monde determinant.
Keywords: Vandermonde determinant, Application, Combinatorial identities
1. Introduction There are many methods about the proof of the combinatorial identities , such as direct checking computations , making
use of exponential and generating function , permanent , number theory , differential and integration . In this paper, we
proved several important combinatorial identities with Vandermonde determinant by using algebraic method, which is
simple and clear than any other methods.
2. Lemmas Lemma 1 Assume nD be a Vandermonde determinant with order n composed by n,,2,1 .
jM be confactor of nDdeleting row n and column j .
Then
,!2
1
1
n
m
jnnj CmM nj ,,2,1 (1)
Proof when 1j ; equality (1) is right.
When nj1 ;
n
jm
n
jm
n
m
n
mj nnjm
jj
jm
j
m
j
mM
2
32 )]1([)1()1(
)1(
2
)2(
1
)1(
)!1(
!1!2)!1()!1()!2()!1(
jjnjnnn
2
1 )!1()!1(
)!1(!
n
m njnm
.!2
1
1
n
m
jnnCm
Equality (1) is right.
When j n ; it is easy to see that equality (1) is right .
Hence: equality (1) is right .
Lemma 2 Assume nD be a Vandermond determinant with order n composed by n,,2,1 . jS be cofactor of nD
deleting row 1 and column j .
Then
1
1
! , 1,2, .n
jj n
mS m C j n (2)

25
Modern Applied Science
Proof 1
1
2
1
1 .!!!! n
m
jn
n
m
jnnjj CmCm
jnM
jnS
3. Theorems
Theorem 1: !.)1( 1
1
nCj jn
nn
j
jn (3)
Proof assume that
,!
21
21
21
111
1
1
11
22n
m
nn
n m
n
nn
D (4)
expand nD along row n , from Lemma 1 we can derive :
2
1
2
1
122
1
1
1
1 !2)1(!)1(n
m
nn
nnn
m
nn
nn CmCmD
2
1
0
1
1122
1
1
1 !)1(!)1(n
mn
nnn
m
jnn
njn CmnCmj
2
1
1
1
1!)1(
n
m
jnn
n
j
njn Cmj
1
1
!n
m
m (from equality (4)),
Thus
!.)1(
1
1
nCj jn
nn
j
jn
Theorem 2: 1)1(
1
1 jn
n
j
j C . (5)
Proof Assume nD be a Vandermond determinant with order n composed by n,,2,1 .expand nD along row 1 ,
from Lemma 1 we can derive :
nn
jj
n SSSSD 11
2
21
1 )1()1()1(
1
1
11
1
11
1
2211
1
1 !)1(!)1(!)1(!n
m
nn
nn
m
jn
jn
mn
n
mn CmCmCmCm
1
1
1
11
1 !!)1(n
m
n
m
jn
n
j
j mCm (from equality (4)),
Therefore
1)1(
1
1 jn
n
j
j C .
Theorem 3: ,0)()1(
1
0
in
j
jn
j jnC ).1( ni (6)
Proof Assume nD be a Vandermond determinant with order n composed by n,,2,1 .The sum of the product of
both the element of row 1 of nD and the algebra cofactor of the corresponding element of row n of nD is zero,
from Lemma 1 we can derive:
.!)1()1(0 12
1
1
1
1
1
in
m
knn
n
k
knik
n
k
kn KCmKM
Let ,knj from equality (2) we can derive:

26
Modern Applied Science
,)(!)1(0 12
1
1
1
1
2 in
m
jn
n
j
jn jnCm
Thus
.)()1(0 1
1
1
0
ijn
n
j
j jnC (7)
Since
,)!(!
!
)!1(!
)!1(1
jn
jn C
njn
njn
jnjn
jnjnC (8)
Substitute (8) into (7) we can derive:
,0)()1(
1
0
in
j
jn
j jnC ).1( ni
References Brualdi, R. A. (1977). Introductory Combinatorics. New York: North-Holland. pp.1 50.
Ke, Zh, Wei, W. D. (1981). Combinatorial Theory. Beijing: Science Publishing.
Lu, K. C., Lu, K. M. (1991). Combinatorial Mathematics. Beijing: Tsinghua University Publishing.
Tongji University. (1993). Advanced Mathematics. Beijing: High Education Publishing.

Vol. 1, No. 2
July 2007
27
Modern Applied Sciencewww.ccsenet.org/mas.html
Interface between the Embedded Processor
Nios and the TDC Module and its Application
Jiawei Zhang, Shengjun Zhai, Jiuling Lin
College of Science, Tianjin Polytechnic University, Tianjin 300160, China
Email: zjw0128 @tom.com
Abstract This paper introduces a design method for SOPC (System on Programmable Chip) based on embedded Nios II soft-core
processor. The interface between the soft-core processor Nios II and the TDC module is given, and the initial
programming technique and Nios II application programme is explained at the same time.
Keywords: Nios II, FPGA, SOPC, TDC
Introduction High-resolution time interval measurement has been widely applied in the aerospace, communications, digital television
broadband radar, logic analyzer, Digital Storage Oscilloscope modern testing equipment etc. With public transportation,
technology, defense of the rapid development and awareness of precision measuring instruments growing, the
demanding of ultra short optical pulses between narrow time interval and pulses high-precision measurement have
become a remarkable research projects .TDC exclusive use of time-to-digital converter chip with Nios II soft-core
processor time interval is a measurement system to achieve high precision measurement of the effective methods. The
advantage is: High accuracy, debugging simple, low power consumption, real-time data processing, human-machine
interface humanity, remote operation and owning embedded operating system. This work focuses on the following
embedded Nios II soft-core processor and TDC–GP1 time-to-digital converter chip interface circuit and programming
technology.
1. NIOSII Soft-Core Processor A Nios II processor system is equivalent to a microcontroller or “computer on a chip” that includes a processor and a
combination of peripherals and memory on a single chip. The term “Nios II processor system” refers to a Nios II
processor core, a set of on-chip peripherals, onchip memory, and interfaces to off-chip memory, all implemented on a
single Altera device. (Altera, 2005)Like a microcontroller family, all Nios II processor systems use a consistent
instruction set and programming model.
1.1Nios II Processor System Basics The Nios II processor is a general-purpose RISC processor core providing:
Full 32-bit instruction set, data path, and address space
32 general-purpose registers
32 external interrupt sources
Single-instruction 32 ?32 multiply and divide producing a 32-bit result
Dedicated instructions for computing 64-bit and 128-bit products of multiplication
Floating-point instructions for single-precision floating-point operations
Single-instruction barrel shifter
Access to a variety of on-chip peripherals, and interfaces to off-chip memories and peripherals
Hardware-assisted debug module enabling processor start, stop, step and trace under integrated development
environment (IDE)control
Software development environment based on the GNU C/C++ tool chain and Eclipse IDE

Modern Applied Science
28
Integration with Altera®'s Signal Tap® II logic analyzer, enabling realtime analysis of instructions and data along with
other signals in the FPGA design
Instruction set architecture (ISA) compatible across all Nios II processor systems
Performance up to 250 DMIPS
Altera’s SOPC Builder design tool fully automates the process of configuring processor features and generating a
hardware design that you program into an FPGA. The SOPC Builder graphical user interface (GUI) enables you to
configure Nios II processor systems with any number of peripherals and memory interfaces. You can create entire
processor systems without performing any schematic or hardware description-language (HDL) design entry. SOPC
Builder can also import HDL design files, providing an easy mechanism to integrate custom logic into a Nios II
processor system. After system generation, you can download the design onto a board, and debug software executing on
the board. To the software developer, the processor architecture of the design is set. Software development proceeds in
the same manner as for traditional, on-configurable processors.
2 NiosII and TDC–GP1 Module Interface 2.1 TDC-GP1 chip brief Introduction TDC - GP1 chip is a dual-channel Universal time-to-digital converter chip, with the largest range of 200ms and
accuracy of 125 ps. Chip supports two working range and kinds of work patterns and it has flexible work practices.
TDC-GP1 use 44 pin TQFP package with TDC measurement unit, 16-ALU, RLC measurement unit and eight processor
interface modules. The pin names and functions are listed in Table 1(Acam, 2001)
Table 1. TDC-GP1 pin description
Symbol Pin I/O Description Symbol Pin I/O Description
RST_N 1 I Reset(low active) VCC_CORE 5,28,44
Core
supply
voltage
TEST 2 I Test pin, must be
connected to GND GND_CORE 6,27,43
Core
Ground
CLK_REF 3 I Input external
reference clock VCC_IO 17,35,39
Supply
voltage IO
ports
CHARGE 4 O Charge pin for RLC
measurements GND_IO 12
Ground of
IO Ports
SENSE 7 I
Schmitt trigger
input
RLC-measurements
GND_IO 18,40 Ground IO
ports
RLC_P4 8 O Port 4 for
RLC-measurement DATA0-DATA3 13-16 I/O Data bus
RLC_P3 9 O Port 3 for
RLC-measurement DATA4-DATA7 19-22 I/O Data bus
RLC_P2 10 O Port2 for
RLC-measurement ADR0-ADR4 23-26 I
Address
bus
RLC_P1 11 O Port 1 for
RLC-measurement INTFLAG 34 O
Interrupt
flag (high
active)
ALE 29 I Address latch
enable START 36 I Start input
RDN 30 I Read (low active) EN_STOP2 37 I enable stop
input 2

29
Modern Applied Science
WEN 31 I WRN Write (low
active) STOP2 38 I
Stop input
2
CSN 32 I Chip select (low
active) STOP1 41 I
Stop 1
input
PHASE 33 O Phase Phase out for
regulation EN_STOP1 42 I
enable stop
input 1
Features:
2 measuring channels with a resolution of 250ps
4-fold multi-hit capability per channel, double pulse resolution 15ns, retriggerable
2 measurement ranges ---a: 2 ns -7.6 μs --- b: 60 ns-200 ms
The 8 events of the two channels can arbitrarily be measured against one another. Negative times can also be measured.
The resolution can be adjusted accurately via software in the 'resolution adjust' mode.
Ports to measure capacities, coils or resistors
Variable edge sensitivity of the measuring inputs
Internal ALU for the calibration of the measurement result. A 24-Bit multiplication unit enables the results to be scaled.
Wide range for the reference clock: 500 KHz - 35 MHz
Surface mount TQFP44 package.
Extremely low power consumption, fully battery operation possible
8-bit processor-interface
TDC-GPl provides with the external processor interface, including eight data buses, 4 bit can operate 16 Registers
address line, read, write, film elections, and so on. Another, to simplify the interface design, also provided the address
latches line (ALE). The internal chip has 7 only write registers, 4 can write value control registers, 8 only read results
registers. External processor control to write control registers and value registers through the address line, writing, film
elections, latches, etc. By controlling different addresses on the value of the control register, the chip can initialize,
choose different working conditions and adjust the edge signal sensitivity. After measuring, the chip interruption
activate the external processor to start reading the results register, the results are worth reading to further optimize the
processor computation, storage and output display. Application of the range1 Register is set to: Reg0:0x44; Regl: 0x4D;
Reg2:0x01; Reg3:0xXX: Reg4: OxXX; Reg5:0xXX; Reg6:Ox02; Reg7:0x01; Reg8:0x00; Reg9:0x00; Regl0:0x80.
2.2 NiosII and TDC-GPl interface circuit Embedded Processor NiosII put TDC -GPl module interface equipment as PIO for the general operation. Therefore
TDC data module |, address, the election unit, literacy signals are included in the PIO Bus. Its interface circuit shown in
figure 1,which TDC_DB [7 .. 0] of the eight data lines, control will be responsible for order entry to the control registers
and results data from the results registers were read out; TDC_AD [3 .. 0] to address data line; TDC_ALE to address
latches; TDC_CEN signal for the election unit; TDC_WRN to enable writing; TDC_RDN to enable reading; INTFLAG
signs of disruption; START signal to begin; STOP 1 received no signal delay; STOP 2 received signal delay.
Figure 1. Interface between the Embedded Processor Nio and theTDC Module

Modern Applied Science
30
3. NiosII and TDC interface chip Nios II processor uses modular structure software, including;(1)TDC-GPl initialization,(2) setting TDC-GPl chip
channel,(3) working mode setting, (4)measurement the results,(5)measurement data display,(6)measurement data
storage. For example, TDC - GPl can work in precision adjustable model. After the measurement, the results will be
shown as the following a series of manipulations:(1) TDC chip be set in the state of writing through the assignment
Control Register 7 shielding all of the input signal STOP.(2) Write control register 11, initialize the TDC and ALU.(3)
Pointer at the control register 0, the chip work in a range 1, self-calibration mode characterized by a number of
functions. Then write control register 1, the chips achieve precision adjustable, adjustable work on the accuracy of
mode l.(4) Write control register 2.The result is that, The first pulse of channel two rise time and the access an article a
pulse rise time for the poor.(5) Write control register 7, the abolition of the two channels on the STOP input signal
shielding. Read measurements, circuit is SCM inquiries TDC - GPl chip interrupted output pins, chip interrupted when
issued, that is, enter the break in service procedures in the home TDC chip in the reading of the state, NiosII processor
visits the results register and read the results. (Liu, 2004).Then niosII processor computate and show the results, the
following is the main part of the NiosII interface procedures.
3.1 Initialization TDC–GPl As Embedded Processor NioslI put TDC–GPl module interface as ordinary operate equipment PIO; blocks all the data
through IOWR_ALTERA_AVALON_PIO_DIRECTIO N (PIO base address, data) order to register for the PIO write,
IORD_ALTERA_AVALON_PIO_DATA (PIO base address) orders reading operation. Below is the initialization
procedures:
Void Initial_TDC( ) // Initialization
{IOWR_ALTERA_AVALON_PIO_DATA (TDC_ALE_BASE, 1); // ALE write for 1
IOWR_ALTERA_AVALON_PIO_DATA (TDC_CS_BASE, 0); // Chip selected TDC
IOWR_ALTERA_AVALON_PIO_DATA (TDC_WR_BASE, 0); //Write effective signal
IOWR_ALTERA_AVALON_PIO_DATA (TDC_AD_BASE, 0x7); //Write control register 7
IOWR_ALTERA_AVALON_PIO_DATA (TDC_DB_BASE, 0x00); //Shield all stop importation
IOWR_ALTERA_AVALON_PIO_DATA (TDC_AD_BASE, 0xb); // Write register 11
IOWR_ALTERA_AVALON_PIO_DATA (TDC_DB_BASE, 0x07); // Initialization of TDC and ALU
IOWR_ALTERA_AVALON_PIO_DATA (TDC_AD_BASE, 0x0); // Write register 0
IOWR_ALTERA_AVALON_PIO_DATA (TDC_DB_BASE, 0x44); // Choice range 1 to work
// Both Automatic Calibration
Mode and Multiply fuction
IOWR_ALTERA_AVALON_PIO_DATA (TDC_AD_BASE, 0x3) // Write register 3
IOWR_ALTERA_AVALON_PIO_DATA(TDC_DB_BASE,0x64) // DIV_CLK_PLL=100
IOWR_ALTERA_AVALON_PIO_DATA (TDC_AD_BASE, 0x4) // Write register 4
IOWR_ALTERA_AVALON_PIO_DATA(TDC_DB_BASE,0x16)
// SEL_CLK_PLL =64NEG_PH_PLL
// => Res = 50ns*64/120/100 = 1/3.75 ns
Float resolution = 1.0/3.75;
IOWR_ALTERA_AVALON_PIO_DATA (TDC_AD_BASE, 0x1); // Write register 1
IOWR_ALTERA_AVALON_PIO_DATA (TDC_DB_BASE, 0xCD); // Work in the precision adjustable mode
IOWR_ALTERA_AVALON_PIO_DATA (TDC_AD_BASE, 0x2); // Write register 2
IOWR_ALTERA_AVALON_PIO_DATA (TDC_DB_BASE, 0x19); //
Channel 2 first rising edge – Channe1 1 first rising
edge }
//Initialization finished
3.2 Measurement showed unit Void measure_TDC ()
{Int valid = 0;

31
Modern Applied Science
Float nk0, nk1;
IOWR_ALTERA_AVALON_PIO_DATA (TDC_AD_BASE, 0x2); // Write register 7
IOWR_ALTERA_AVALON_PIO_DATA (TDC_DB_BASE, 0x09); // open Stop1 and Stop2
IOWR_ALTERA_AVALON_PIO_DATA (TDC_AD_BASE, 0xb); // Write register 11
IOWR_ALTERA_AVALON_PIO_DATA (TDC_DB_BASE, 0x07); // Initialization of TDC and ALU
// Start measuring signal
While (valid==0)
{
Valid=IORD_ALTERA_AVALON_PIO_DATA (TDC_INT_BASE); //Inquiries interrupted signs spaces
}
IOWR_ALTERA_AVALON_PIO_DATA (TDC_WR_BASE, 1); // Write enable
IOWR_ALTERA_AVALON_PIO_DATA (TDC_WR_BASE, 1); // Read enable
IOWR_ALTERA_AVALON_PIO_DATA (TDC_AD_BASE, 0x00); // Read addresses enable 0
nk0= IORD_ALTERA_AVALON_PIO_DATA (TDC_AD_BASE, 0x00); // Read low results
nk1= IORD_ALTERA_AVALON_PIO_DATA (TDC_AD_BASE, 0x00);// Read high results
nk1 = nk1 * 256; // Backspace
nk1 = nk1 | nk0; //Merger
result = resolution * (float)(nk1); // Calculate the final results
printf("result = %6.3fns\n",result); // Standard output results displayed on the LCD
}
3.3 Data Storage Processing Unit Void Save_result( float result )
{
alt_flash_fd* fd;
int ret_code;
Float TDC_SAVE [100];
TDC_SAVE[k] =result; // K is the storage location counter
fd = alt_flash_open_dev("/dev/ext_flash"); // Open FLASH memory
If (fd)
{ printf("open flash device successfully\n");
// LCD Display as standard output
ret_code = alt_write_flash(fd, k*32,TDC_SAVE, 32);
// storage data to the FLASH device
If (!ret_code)
{ printf("save result on %d\n",k\n");} // Show storage location
alt_flash_close_dev (fd);
printf("save result successfully\n");
// close the FLASH
}
Else
{printf("Cant open flash device\n");
}

32
Modern Applied Science
Return 0;
}
4. Conclusion The work uses NiosII soft-core processor to design TDC-GPl time-to-digital converter chip interface circuits and
interfaces driver. As NiosII soft-core processor design can use a lot of nuclear molding IP, and Nios II processors can
link the external memory, LCD display, ethernet controller and USB, peripherals for the coordination and sharing of
data. So we therefore based on the Nios II TDC module interface flexibility in the configuration of any treatment based
on the Nios II Components of the products design, with the advantages of flexible and easy, low power consumption,
simply debugging, testing of high precision and accuracy, real-time data processing, human-machine interface
humanized, remote operation and embedded operating systems, etc.
References Liu, Guofu and Liu, Bo. (2004). TDC-GP1 time interval measurement precision chip and its Application.
Microcontroller and Embedded Systems. 11. 38-40.
Nios II Processor Reference Handbook. (2005). Altera Corp.
TDC-GP1 fuctional description Handbook. (2001). Acam Corp.
Nios II Software Developer’s Handbook. (2005). Altera Corp.

33
Science News
Angioplasty Procedure Has Potential to Damage Kidneys
Wake Forest University Baptist Medical Center
Science Daily, June 30, 2007
The most common procedure for clearing blocked kidney arteries can also release thousands of tiny particles into the
bloodstream that can impair kidney function, according to researchers from Wake Forest University Baptist Medical
Center and colleagues.
"This is the first data in humans to show that debris released during angioplasty and stenting of the kidney arteries can
be harmful to kidney function," said Matthew Edwards, M.D., M.S., lead researcher and an assistant professor of
surgery. "It raises important questions about how to most safely perform this very common procedure."
Edwards said that understanding more about potential complications from the procedure can lead to improved
treatments. The study, reported in the current issue of the Journal for Vascular Surgery, suggests that having patients
stop aspirin use before the procedure may lead to worse results. It also shows that stent size is important and raises
questions about whether blocking or filtering out the debris, known as emboli, may be effective in improving results.
"New devices exist that may prevent the passage of this debris into the kidney and may lead to better patient outcomes,"
said Edwards. "We are currently conducting a clinical trial to explore this question."
As many as 3.5 million Americans over age 65 years have blocked kidney arteries that can lead to severe high blood
pressure and kidney failure. These patients have a greater risk of having heart attacks or strokes, becoming dependent
on dialysis, or dying.
In some cases, blockages are cleared by inflating a balloon-like device inside the vessel (angioplasty) and inserting a
stent to keep the vessel open. The procedure is performed on about 40,000 to 80,000 people a year. Bypass surgery on
the arteries is also an option, but few centers offer the complex surgery.
Based on laboratory studies, researchers have suspected that angioplasty releases particles into the bloodstream --
presumably made up of bits of clot and fatty plaque material from the blockage. The goal of the current study was to
count the particles and determine if they are associated with impaired kidney function after the procedure.
In 28 angioplasty cases, researchers used a protection device to temporarily block the vessel at the site of the
angioplasty and stenting. After the procedure, and while the protection system was still in place, researchers took a
small sample of blood trapped by the protection device. The artery was then aspirated and flushed out to remove any
remaining particles.
Laboratory analyses found a mean of 2,000 particles captured per blood sample -- many of them large enough to block
the small vessels in the kidney.
"The more particles collected from a patient, the worse their kidney function," said Edwards. "Patients with higher
levels of particles in their blood were more likely to have decreased kidney function after the procedure. Poor kidney
function after kidney artery stenting has been previously demonstrated by our group to be associated with increased risk
of heart attack, stroke or death in the future."
The results raise an important question: since the protection device was in place for the procedures, and it is designed to
remove particles from the vessel, why did patients who had high particle counts before the artery was flushed also have
worse kidney function afterwards" The researchers theorize that some blockages are more prone to releasing particles
than others and that just putting the protection device in place releases particles that reach the kidneys.
"The study raises many questions, including how well the protection device works and can we predict which plaques
are more prone to release debris," said Edwards. "We are currently conducting a clinical trial to try and answer these
questions."
The new study, funded by the National Institutes of Health, will compare results in procedures performed with and
without a protection device. The goal of the research is to determine the best way to conduct angioplasty so that results
are comparable to or better than surgery. The current research was supported by the National Institutes of Health.
Co-researchers were J. Kimberley Hansen, M.D., Randolph Geary, M.D., Matthew Corriere, M.D., Jeffrey Pearce, M.D.
and medical student Nicholas Mertaugh from Wake Forest and Joseph Rapp, M.D., and Xianmeng Pan, Ph.D., from the
University of California at San Francisco.

Modern Applied Science www.ccsenet.org/mas.html
Vol. 1, No. 2
July 2007
34
A Study on the Quality systems-Modal
for Quality Management of Manufacturing
Qi Liang & Yukan Hou
Northwestern Polytechnical University, Xi’an 710072, China
E-mail: [email protected]
Abstract This paper outlines a study of the quality systems-model for quality management and quality assurance of
manufacturing. The study presents as processes being closed-loop in nature. Comprehensive studies were made in
connection with the general and practical ways of the quality management to deal with design of advanced making
system. The thrifty quality management system may be simplified shall be structured and adapted to the activities and
size of the particular organization.
Keywords: Quality management; Improvement model; organization; Process management
With the rapid development of advanced making, the study on the quality systems-model has become a new topic of
project management domain.
The various quality systems-models are must introduced for various field and style and size project.
Problems associated with the quality failure have been caused by the quality systems-model itself and by the failings of
the people charged with development.
Academic investigation is constrained by similar intellectual inadequacies. The following paragraphs therefore
represent a modest but synoptic attempt not to resolve completely, but to clearly enunciate this problem. Using the
‘quality’ concept as a fulcrum for discussion, we trace lines of argument from its existence as a management fact,
backward to its origins within systems-model and forward to its effects on quality.
In recent years many making factories of our county have been faced with the problem of how to introduce new quality
systems-model and to make product higher.
The reasons for the failure that quality systems have sustained stable quality conformity are varied. The first and most
obvious result is that improvement in quality assurance will never be unable to keep up with the free market’s appetite.
Second, as procedures process model need depend upon the complexity closes the loop of the work, improvement of
process model will usually need a period even a few period. And finally, a large system will result in raising greatly
costs. Some people claim that the solution is to pass ISO certification. But certification does not full lead to higher
quality.
Because the needs of organizations vary, it is not the purpose of this International Standard to imply uniformity of
quality management systems. The model of an organization's quality management system should be configured in a
manner that is appropriate to its unique activities.
In recent years, China has experienced development boom in quality certification of ISO that has impetus to many
technological fields and especially to the quality management. The ISO 9000 family of standards has been developed to
help organization improve quality, communication and competitiveness in national, regional and international trade.
Sine the document is generic in nature and intent, only generic guidance is presented. An organization doesn’t be
stressed to implement unnecessary requirement under this International Standard. For each organization, it is intended
that all requirements of this International Standard be applied. However, tailoring may be acceptable in certain
situations. Each organization will need to select and employ the most appropriate methods and tools from the content of
this International Standard. The organization shall establish a quality management as a means of ensuring that the
product and/or service conform to requirements. The quality management system shall be structured and adapted to the
activities and size of the particular organization.
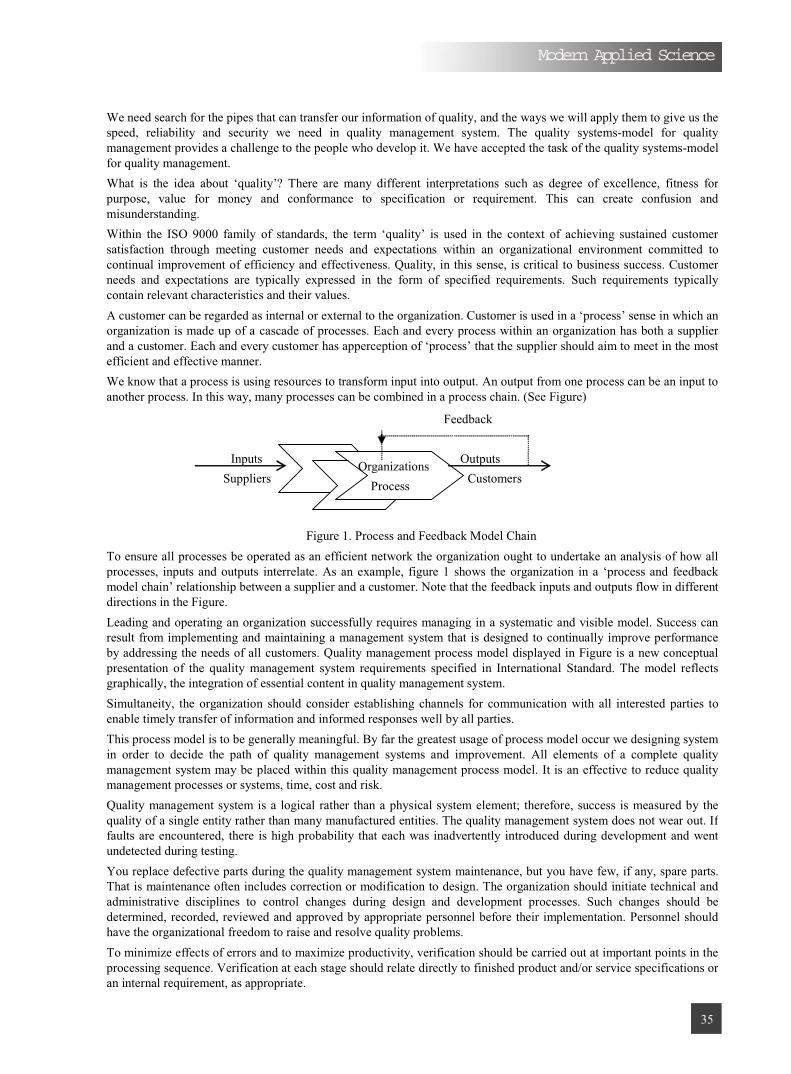
35
Modern Applied Science
We need search for the pipes that can transfer our information of quality, and the ways we will apply them to give us the
speed, reliability and security we need in quality management system. The quality systems-model for quality
management provides a challenge to the people who develop it. We have accepted the task of the quality systems-model
for quality management.
What is the idea about ‘quality’? There are many different interpretations such as degree of excellence, fitness for
purpose, value for money and conformance to specification or requirement. This can create confusion and
misunderstanding.
Within the ISO 9000 family of standards, the term ‘quality’ is used in the context of achieving sustained customer
satisfaction through meeting customer needs and expectations within an organizational environment committed to
continual improvement of efficiency and effectiveness. Quality, in this sense, is critical to business success. Customer
needs and expectations are typically expressed in the form of specified requirements. Such requirements typically
contain relevant characteristics and their values.
A customer can be regarded as internal or external to the organization. Customer is used in a ‘process’ sense in which an
organization is made up of a cascade of processes. Each and every process within an organization has both a supplier
and a customer. Each and every customer has apperception of ‘process’ that the supplier should aim to meet in the most
efficient and effective manner.
We know that a process is using resources to transform input into output. An output from one process can be an input to
another process. In this way, many processes can be combined in a process chain. (See Figure)
Feedback
Inputs Outputs
Suppliers Customers
Figure 1. Process and Feedback Model Chain
To ensure all processes be operated as an efficient network the organization ought to undertake an analysis of how all
processes, inputs and outputs interrelate. As an example, figure 1 shows the organization in a ‘process and feedback
model chain’ relationship between a supplier and a customer. Note that the feedback inputs and outputs flow in different
directions in the Figure.
Leading and operating an organization successfully requires managing in a systematic and visible model. Success can
result from implementing and maintaining a management system that is designed to continually improve performance
by addressing the needs of all customers. Quality management process model displayed in Figure is a new conceptual
presentation of the quality management system requirements specified in International Standard. The model reflects
graphically, the integration of essential content in quality management system.
Simultaneity, the organization should consider establishing channels for communication with all interested parties to
enable timely transfer of information and informed responses well by all parties.
This process model is to be generally meaningful. By far the greatest usage of process model occur we designing system
in order to decide the path of quality management systems and improvement. All elements of a complete quality
management system may be placed within this quality management process model. It is an effective to reduce quality
management processes or systems, time, cost and risk.
Quality management system is a logical rather than a physical system element; therefore, success is measured by the
quality of a single entity rather than many manufactured entities. The quality management system does not wear out. If
faults are encountered, there is high probability that each was inadvertently introduced during development and went
undetected during testing.
You replace defective parts during the quality management system maintenance, but you have few, if any, spare parts.
That is maintenance often includes correction or modification to design. The organization should initiate technical and
administrative disciplines to control changes during design and development processes. Such changes should be
determined, recorded, reviewed and approved by appropriate personnel before their implementation. Personnel should
have the organizational freedom to raise and resolve quality problems.
To minimize effects of errors and to maximize productivity, verification should be carried out at important points in the
processing sequence. Verification at each stage should relate directly to finished product and/or service specifications or
an internal requirement, as appropriate.
Organizations
Process

36
Modern Applied Science
Upper–level managers with no background in quality systems-model for quality management are often given
responsibility for system development. If he or she is willing to learn the ways that can be used to quality
systems-model for quality management, apply effective methods of control, disregard mythology, and become
conversant in a rapidly changing technology.
A manager of quality management should be appointed for the purpose of coordinating quality activities, awareness of
interested parties’ expectations and reporting to the top management. The manager should be informed of all quality
problems, monitoring and reporting on the level of achievements against the quality objective, determining
opportunities for quality improvement, monitoring and reporting on quality-related customer relations, managing the
internal audit system, aggregating customer needs and expectations that are not part of their explicit requirement,
participating in all management meetings where quality matters are discussed. Top management shall demonstrate that
customer needs and expectations have been determined and translated into applicable customer requirements. The
manager must communicate with all constituencies involved with system development-customer, system developers,
support staff, and others. Communication can break down because the special characteristics of the quality
systems-model for quality management and the particular problems associated with its development are misunderstood.
When this occurs, the problems associated with the quality systems-model for quality management crisis are
exacerbated
To leverage this power of quality management, we’ll need to make our quality systems-model considerably easier to
use than they are today. Quality should be built in to all organizational processes. Inadequate planning and operation of
any process could lead to deterioration of capability and potential loss of efficiency.
Therefore, the top management, at defined intervals sufficient to ensure its continuing suitability, adequacy and
effectiveness, should review the quality management system.
The development of quality systems-model for quality management compels us to accept responsibilities or give up.
The final outcome, people would run a speed, reliability and security quality world.
References ISO/TC207/SC1, ISO14001: 2004
ISO/TC176/SC1, ISO9000: 2000; ISO/TC176/SC2, ISO9001: 2000
Thiry M. (2003). For DAD: A programme management life-cycle process. International Journal of ProjectManagement. 2003, 22(3).

Vol. 1, No. 2
July 2007
37
Modern Applied Sciencewww.ccsenet.org/mas.html
A Primary Research on the Validity of Enterprise Encouraging
System Based on the Paradigm of Strategic Ecology Management
Yanling Jia & Wei Guo
School of Management, Xi’an Polytechnic University, Xi’an 710048, China
Tel: 86-29-8233 1050 E-mail: [email protected]
Abstract Aiming at the research results put forward by some Chinese scholars who claim that encouraging invalidations exist in
Chinese enterprises. This article advances the following opinions. Some certain encouraging factors have no strong
relativity with the enterprise performance, which cannot prove that the encouraging invalidation exists in the
investigative sample enterprise. The present researches of the relationships between encouragement and enterprise
performance are short of the systemic integration to the numerous influencing factors. But in the strategic ecology
paradigm, when we design the interior mechanism between encouraging system and its validities, we should use the
latest research results of ecologically behavioral economics for references, especial for analyzing the interior
relationships between the enterprise strategy and the validity of the enterprise encouraging system. This article’s
research possesses guiding values for enterprise’s governing and its further development.
Keywords: Encourage, Encouraging system, Strategy, Ecological management paradigm
1. Do encouraging invalidations exist in Chinese enterprises? As early as in 2000, Chinese scholar Li Zengquan selected data about senior managers’ annual salaries published by 748
listed companies in 1998, and carried through practical research on them for encouraging mechanism and enterprise
performance of Chinese listed corporations. He took senior managers’ annual salaries and their stock proportion as
salary variable, ROE as variable of enterprise performance, to test the sample collectivity according to the proportion of
asset scale, industry and state stock, and the area where the corporation was located. The results showed that the
managers’ annual salaries of Chinese listed companies was not correlative with enterprise performance, but closely
correlative with enterprise scale, and put up obvious differences of district. In 2000, Yang Ruilong and Liujing took
1999 year’s Chinese listed companies in household appliance industry as the samples of measuring research, sales
incomes and ROE of corporation as enterprise’s performance variable, and managers’ salaries as dependent variable,
carried through practical research to manager’s salary, enterprise performance and stock structure, and found that the
managing performance of enterprise was independent of the stock structure in household appliance industry. In 2005,
Liling chose 2003 finance year’s finance data of 38 listed companies in Chinese electronic industry, adopted the method
of econometrics, and obtained that the changes of senior managers’ salaries would arouse ROE the change of 0.62% at
the same direction, and EPS the change of 0.940 at the same direction. This showed that the encouragement to senior
managers had strong relativities with enterprise performances. To domestic corporations, the research of the
relationships between senior managers’ salaries and enterprise performance indicated that the encouragement of senior
managers had no obvious relativities with enterprise performances. This result was different with the theoretic analysis
and the Occident’s scholars’ opinions which thought these both aspects had strong relativities, or had this conclusion
achieved the area of “ ” in the encouragement of the “X” model? Of course it had not. If encouragement had not
strong relativities with enterprise performances, and the above research was tenable, so did it prove the encouraging
invalidation existed in the sample enterprises which were researched? And how should we implement encouragement to
enhance its validities? If these problems cannot be solved, the performance of encouraging measure in Chinese listed
companies will seem eyeless and disordered.
2. Should we start with whether measures or system to enhance the validity of the encouragement?
Most present articles which research the validity of encouragement all engage in qualitative research from the view of
management, psychics and economics, and few establishes model to quantificationally analyze the validity of

Modern Applied Science
38
encouraging system from the view of the systematology. The foreign researches demonstrate the relationships between
employee encouragement and enterprise performance mostly from the aspect of senior managers’ encouragement of
salaries. The increase of stockholders’ benefits can obviously reflect the improvement of enterprise performance in the
finance index. In 2006, Liu Xinmin and Liyuan discussed the necessity of combination of material encouragement and
immaterial encouragement implemented by entrepreneurs, and analyzed the dynamic optimum combinative conditions
by which owners obtained the maximal encouraging effect with minimal encouraging costs through using the fussy
optimum theory. In 2005, Zhang Dansong and Niu Wenxue studied the encouraging management of human capital in
enterprise management by a measuring model of encouraging effect. They divided encouraging means into encouraging
effect factor and protective effect factor, and pointed out the key factors in managers’ encouraging management and
made out the strategic guidance of encouragement based on the analysis of model. In 2006, Zhao Yanyan and Wang
Huaiming analyzed the actualities of senior encouragement at the present in China, and discussed the relationship
between the encouragement of senior managers and enterprise performances by means of describing statistics and
multiple nonlinear regression method. The practical research showed that the enterprise performance took on positive
correlation with managing layer’s stock proportion, but it was not obvious, and the enterprise performance presented
obvious positive correlation with managing layer’s annual salary. In 2007, Shen Minghao and Su Xiaohua found that
enterprise’s finance risk presented minus linear relation with senior managers’ stock tendency, and their shares took on
nonlinear relation with the encouraging effect of enterprise (the managing layer’s endeavoring level), making use of the
practical research on listed companies. In the present restructuring of Chinese enterprises, because the managing layers
went short of buying capitals, they are not likely to stock enterprises. So a realistic hypo-excellent proportion must exist
in the present circumstance and it can inspire the managing layers’ enthusiasms most effectively.
The encouraging system of enterprise is an important subsystem to form the enterprise system, but it is also an
independent system. From the view of static state, the encouraging system consists of factors such as actuator,
encouraging object, encouraging factors and encouraging method. From the view of strategic ecological management, it
consists of five subsystems which include the subsystem of encouraging environment which means what conditions we
implement the encouragement under, the subsystem of encouraging factors which means what we implement the
encouragement by, the subsystem of encouraging implement which means how we carry through the encouragement,
and the feedback subsystem of encouraging effect which means how to test and estimate the encouragement. In these
subsystems, the connotation of the subsystem of encouraging object has extended to the group which consists of
enterprises and their benefit relatives in the whole value chain under the guidance of the strategically ecological
management paradigm. The final running state of the system lies on the running state of the every part and the mutual
relations among parts. But how to evaluate the validity of the system across-the-board is still to be further discussed, so
the measuring research to the validity of the encouraging system redound us to measure the encouraging system with
the more scientific attitudes, identify its contributions to the actualization of strategic objects, improve the state of the
whole system to the special object and make the whole ecological system of enterprise develop more stable and
sustainable.
3. Whether should we start with the base of strategic ecology paradigm to enhance the validity of theencouragement? With the increasingly more dynamic environment of the industry, more quickening of the technology innovation, more
globalization of the competition, and more diversification of the consumers’ requirements, enterprises gradually realizes
that if they want to develop, they must create new value which is interested by consumers with other companies no
matter what increasing their own abilities, or developing their new market. Enterprises must foster synergic economic
groups taking the development as guidance. The theory of ecology and its ecologic thinking is the bridge to solve the
strategic complexity problems. The advance of strategic ecological paradigm is a sort of breach of strategy managing
paradigm, which is the strategic paradigm of facing future sustainable development and obtaining sustaining superior
performance, and is the group which consists of enterprises and their benefit relatives, and is a complicated ecological
system. The paradigm of strategic ecological management includes a series of relations of enterprise, which include not
only the vertical relations with its providers, consumers, market intermediary agencies, but also the horizontal relations
with its competitors, the enterprises of other industries, governmental departments, higher institutions, research
institutions and benefit relatives etc.
From the view of the production function in the traditional economics, outputs are decided by the two basic factors
including capitals and labor forces. In the condition that the restriction of capitals is not the key problem, the core of the
enterprise management is which people are selected be the employees of the enterprise and how to perform
encouragement and enhance employees’ performances. The validity of the enterprise encouraging system directly
decides whether the objects of enterprise developing strategies can come true. The strategic objects or actual objects of
the organization all are implemented by human longtime activities and short-term activities. The behaviors which
incline to the object are continually strengthened by human motivations and the requirements which induce the
motivations. Numerous coherent behaviors finally achieve the object of the organization and the enterprise, so the
human requirement and the fulfillment of the requirement in enterprise is the original start of the encouragement.

39
Modern Applied Science
The value of ecological concept rests with that we can use it identify and foster whole set mutually interlaced relations,
and make it possessing more strong increasing potentials of benefit, but we shouldn’t stickle on the scale (the
strategically ecological system can mean small competitive space of enterprise, or big one). So, under the guidance of
strategically ecological paradigm, the encouraging system of enterprises also should emphasize the source of the
resources of ecological system and relative resources, and it must integrate exterior forces to foster and enhance its own
core abilities, and exert the leverage of the core abilities. The research to the corporate encouraging system, fastens on
the research of the factors, implement of the encouragement and their relations with the enterprise performances, and
localizes the interior encouraging system of enterprise. But the research and application of problems which include
dynamic encouragement, encouraging combination, exterior cooperation of the encouragement and measure of the
encouraging validity etc. are less at present. The traditional view of strategic managing paradigm has not explained the
problems such as encouraging invalidation, the weak relative of salary and stock encouragement with enterprise
performances. So, from the view of ecological system, we study the encouraging problems, that possess some certain
values of academic research and meaning of realistic guidance.
When we think about the problem from the view of strategically ecological managing paradigm, the providers,
consumers and middlemen are not only copartners but also competitors. The subsystem of encouraging object will be
endowed a new connotation, so the benefit relatives all become the factors included by the encouraging system of
enterprise, and the integrality of systematic research will directly influence whether the validity of encouraging system
can be reflected objectively.
4. How should we develop the research of validity of enterprise encouraging system in strategic ecologyparadigm? The research about how to evaluate the encouraging system of enterprise, that is to say the validation of the validity of
the encouraging system, has three defects at the present time.
The first defect is to be short of the integration of numerous influencing factors. Due to the different view of the
research, the present influencing factors of encouraging system are distributed in the multi-layers and multi-dimensions,
and form a big and complex factor group. But the interior relations among numerous factors lack systemic cleaning up,
which neither makes against theoretic research, nor practical operation. This article thinks it should integrate the
contributions of the researches on the validity of encouraging system, establish a theoretic frame which has interior
logic relations and can reflect the influencing factors of the validity in encouraging system. To solve this problem, firstly
we should integrate the research results such as agent theory, corporate governing theory and autonomy theory of
encouraging system, establish the integrated factor frame which can reflect agent costs, governing structure and
behavior space of encouraging system, and take it as the concept model. Secondly, we should adopt effective research
methods and technical means to testify the hypothesis relation of the concept model based on the practical research.
The second defect is that it can not effectively answer the influencing relations and conditions between performance and
validity. In theory, corporate performance should have a positive circulation relation with the validity of encouraging
system, that is to say, generally speaking, good performance must present higher validity, and higher validity must
induce the improvement of performance. But in practice, the beneficial circulation between corporate performance and
the validity of encouraging system may be disturbed by exterior factors and occur breaking phenomenon. For example,
in the old system of state-owned enterprises, the validity of encouraging system may have irrelevance with corporate
performance, and in the management responsibility system, the validity of encouraging system obviously lies on the
corporate performance.
Under the present corporate system in China, it needs data to judge the relation between performance and validity.
Obviously, the simple relative relation can not offer satisfied explanations. The practical research by means of structural
equation model offers the support of method to further open out the interior consequences.
The third defect is that most samples used in the domestic researches at present are traversal data of single year, without
considering the time series effect of multiyear. Everyone knows that the validity of encouraging system has a close
relation with many developing aspects of macro-economy, and the period which the company is developing in is an
important variable. There are two methods to solve this problem. The first one is to adopt time series data which are the
lengthways data distributed according to years. The second one is to adopt panel data which is the combination of time
series data and traversal data.
The measure of performance is a complex systems engineering. The simple combination of indexes can not reflect the
corporate performance level, so it must adopt reasonable systems frame. Some scholars’ researches provide help for us.
The famous systems frame models include the model of Sink & Tuttle, the PIMM model and the Family of Measures
model (FOM).
Under the direction of strategically ecological managing paradigm, the corporate encouraging system should emphasize
the resources of ecological system and relation system which are the sources of the competitive predominance of the

40
Modern Applied Science
enterprise, must integrate exterior forces to foster and enhance its own core abilities and exert its own leverage of core
abilities. So, the research of encouraging system based on the strategically ecological paradigm must break through the
analyzing frame of traditional encouraging system, start with the view of ecology and systems engineering, use the
relative research results of behavioral economics as references, study the operative mechanism between strategically
ecological managing paradigm and encouraging system, and carry through all-sided discussion from various layers and
orientations to the managing encouragement.
It can use the data envelopment analysis and structural equation model to discuss the intergrowth mechanism among
benefit relatives, search the ecologically relative conditions among factors in the system, and open out the structural
relations between the validity of encouraging system and its influencing norms, between the governing factors and
dependent factors. Through establishing the encouraging systems in Chinese corporations, researching their validities
and give the measuring method of validity, testifying the relative consequences between the encouraging system and
corporate performance which include unilateral influencing hypothesis, bidirectional influencing hypothesis and
irrelevance hypothesis, it can realize the conversion from “traditional encouraging system” to “effective encouraging
system”. It also can use the methods such as the measuring analysis of statistical data and the statistical analysis of
fieldwork questionnaires of enterprises to testify some conclusions coming from the above theoretic analysis, and
further improve the establishment of the encouraging system.
5. Conclusions The present researches to the relations between encouragement and the enterprise performances are short of the
integration of numerous influencing factors.
Some certain encouraging factors have no strong relativity with enterprise performance, which can not prove the
encouraging invalidity of sample enterprises which are investigated.
Under the strategically ecological paradigm, when we design the interior mechanism between encouraging system and
its validities, we should use the latest research results of ecologically behavioral economics for references, especial for
analyzing the interior relationships between the enterprise strategy and the validity of the enterprise encouraging system
This article demonstrates this research possesses guidance value for corporate governing and development.
Through the design of corporate encouraging system, and testifying the positive influences of corporate encouraging
system to corporate development based on the strategically ecological paradigm by the means of practical method, we
hope the results can offer references for the reform of Chinese corporate development pattern.
References Camerer, Colin F. (2003). Behavioral game theory: Experiments on strategic interaction. Princeton: Princeton
University Press.
Lazear, E. (2000). Performance pay and productivity. American Economic Review. No.90.
Li, Chunqi and Shilei. (2001). A review on the encouraging theory in foreign enterprises. Economic Perspectives. No.6.
pp.61-63.
Li, Chunqing. (2003). Research on the new paradigm of enterprise strategic management. Enterprise Economy. No.11.
Nierui and Zhangyi. (2003). New strategy mode: strategic ecology management. Journal of China University of Mining& Technology (Social Sciences). No.3.
Nie, Zilong. (2002). Strategic paradigm and its evolvement. Business Economics and Administration. No.10.
Peng, Changqing and Zhu, Yonghong. (2000). Enterprise strategic management based on the concept of ecological
balance. Management and Administration. No.7.
Richard, G Best. (2001). Intrinsic motivation at work: building energy and commitment. Personnel Psychology.Autumn 2001.
Zhou, Sanduo and Zhoujian. (2002). Times characteristics for new economy and transformation of strategic paradigm of
the firm. Nankai Business Review. No.1.

Vol. 1, No. 2
July 2007
41
Modern Applied Sciencewww.ccsenet.org/mas.html
Strongly Convergence Theorem of m-accretive Operators
Yujun Liu & Sumei Xu
Department of Mathematics, Tianjin Polytechnic University, Tianjin 300160, China
Department of Mathematics and Applied Mathematics, Anyang Normal University, Anyang 455000, China
E-mail: [email protected]
Abstract Let X be a real Banach space, we will introduce a modifieations of the Mann iterations in a uniformly smooth Banach
space, 1
( (1 ) ) (1 )n n n n r nx u x J x , Where { },n satisfied some conditions, then we will prove the strongly
convergence of the sequence { }nx to a zero of accretive operators. This theorem extend (Kim and Xu, Nonlinear
Analysis) results. (Kim, 2005, pp.51-60)
Keywords: Strong convergence, Non-expansive mapping, Accretive operator
1. Preliminaries
Recall that a (possibly multivalued) operator A with domain D(A) and R(A) in X is accretive if for each ( )ix D A , and
i iy Ax (i=0,1,2), there exits a 2 1
( )j J x x such that 2 1( , ) 0y y j . An accretive operator A is m-accretive if
R(I+rA)=X, for each r>0. The set of zero of A is denoted by F. Hence 1{ ( ) : 0 ( )} (0)F z D A A z A . We denote by
rJ the resolvent of A. Note that if A is m-accretive then :rJ X X is nonexpansive and F(rJ )=F.
In order to prove our results, we need the following lemmas:
Lemma 1: Assume { }nis a sequence of nonnegative numbers such that (Xu, 2002, pp.240-256)
1(1 ) ,n n n n n 0n , where { }n
is a sequence in (0,1) and { }nis a sequence in such that
(i) 1
;ni
(ii) limsup 0n nor
1 n ni.
Then lim 0n n .
Lemma 2: Let X be a smooth real Banach space and let J be the duality map of X. Then there holds the inequality
2 22 , ( )x y x x J x y , ,x y X .
Lemma 3: Let { }nx and { }ny be bounded sequence in a Banach space X such that (Suzuki, 2005, pp.103-123)
1(1 )n n n n nx x y , 0n . Where { }n
is a sequence in [0,1] such that 0 lim inf limsup 1n nn n
, assume
1 1limsup( ) 0n n n n
ny y x x .
Then lim 0n n ny x .
2. Main results Theorem: Let X be a uniformly smooth Banach space, C a closed convex subset of X and :T C C a nonexpansive

Modern Applied Science
42
mapping such that ( )Fix T . For any given sequence { }nin [0,1], (0,1) and
0,u x C , defined { }nx by the
iterative algorithm1
( (1 ) ) (1 )nn n n n r nx u x J x , (2.1)
(i) lim 0n n (ii)
0 ni. Then { }nx convergens strongly to a zero of A.
Proof: We first show that { }nx is bounded. Indeed, take a point ( )p Fix T to get, using the nonexpansive of rJ ,
1 (1 ) (1 )n n n n n r nx p u p x p J x p
(1 ) (1 )n n n n nu p x p x p
(1 )n n nu p x p
So we have for all 0n ,0
max{ , }nx p u p x p , (2.2)
So { }nx is bounded, and also { }nr nJ x . We have
1(1 ) 0
n nn r n n n r nx J x u x J x ( )n (2.3)
From (2.1) we have 1 (1 ) (1 )n n n n n r nx x u J x
(1 )(1 ) [1 (1 )]
1 (1 )
n n r nn n n
n
u J xx
We set 1 (1 )n nand 1n n
n r nn n
y u J x
Then we get 1
(1 )n n n n nx x y (2.4)
It easily to get { }ny (since 0, 1n nand { }nx is bounded).
1 1 11 1
1 1 1
1 1 1( ) ( ) ( )n n n n n
n n r n r n r nn n n n n
y y u J x J x J x
Since rJ is nonexpansive and 1
1
1 n
n
<1, we get
1 11 1
1 1
1 1( ) ( )n n n n
n n n n r nn n n n
y y x x u J x
Since 0, 1n n, so
1 1lim sup 0n n n n
ny y x x
Applying Lemma 3, we have lim 0n nny x , (2.5)
since 0n, we get lim lim 0n
n r n r nn nn
y J x u J x (2.6)
from (2.5) and (2.6) we get lim 0n r nnx J x (2.7)
since tz is the unique solution to the equation (1.1), we can write
(1 )( ) ( )t n r t n nz x t J z x t u x

43
Modern Applied Science
Apply lemma 2 to get
2 22(1 ) 2 , ( )t n r t n n t nz x t J z x t u z J z x
22(1 ) (2 )r t n r n n t n r n nt J z x J x x z x J x x
22 , ( ) 2t t n t nu z J z x t z x (2.8)
Since { },{ }t nz x are bounded, there exists a constant M>0,
, ( ) ( )r n n
t n t
J x xu z J x z t M
t (2.9)
So we get lim sup , ( )t n tn
u z J x z tM (2.10)
Put 0
( ) lim ttp Q u s z
Since J is uniformly continuous on bounded sets of X, we find that
( ) ( )n t n tJ x z J x p , uniformly on n. (2.11)
Where 0t and
0lim 0,tt
Let 0 satisfy tu z and
tz p
For all (0,1)t and n. We have
, ( ) , ( ) , ( ) ( ) , ( )n t n t t n n t t nu p J x p u z J x z u z J x p J x z z p J x p
, ( ) ( )t n t tu z J x p z p
It follows (2.10) that, for all (0,1)t ,
lim sup , ( ) ( )n t tn
u p J x p tM z p
Let 0t , we can get lim sup , ( ) 0nn
u p J x p (2.12)
Finally, we claim that nx p in norm. Apply Lemma 2 to get
2 2
1 (1 )( ) (1 )( ) ( )n n n n r n nx p x p J x p u p
2
1(1 )( ) (1 )( ) 2 , ( )n n n r n n nx p J x p u p J x p
2
1(1 ) 2 , ( )n n n nx p u p J x p (2.13)
Applying lemma 1, and from (2.12) and (2.13) we conclude that 0nx p .
So the proof is completed. References Kim, Tae-Hwa and Xu, Hongkun. (2005). Strong convergence of modified Mann iterations, Nonlinear Analysis, 61, pp.51-60. Xu, H. K. (2002). Interactive algorithms for nonlinear operators. Math. Soc. 66. pp.240-256. Suzuki, T. (2005). Strong convergence theorem for infinite families of no expansive mappings in general Banach spaces.Fixed Point Theory Appl. No. 1. pp.103-123.

Modern Applied Science www.ccsenet.org/mas.html
Vol. 1, No. 2
July 2007
44

45
Modern Applied Science
2.2 Monomer synthesis 2, 6-bis ( -naphthoxy) benzonitrile (BNOBN) was synthesized as shown in scheme 1 by nucleophilic aromatic
substitution reaction of 2,6-difluorobenzonitrile with beta-naphthol in the presence of KOH and K2CO3 in high boiling
solvent NMP under N2 atmosphere.
F F+
KOH/K2CO3
NMP, 185-200 oC
OH2
CN
O O
CN
(DNOBN)
Scheme 1. Synthesis of BNOBN
To a 100ml, round-bottomed flask equipped with a mechanical stirrer, a thermometer, and nitrogen inlet and out tubes,
and a Dean-Stark trap, 72 mmol of beta-naphthol, 60 mmol of KOH, 12 mmol of K2CO3, 35 ml of
N-methyl-2-pyrrolidone (NMP) and 25 ml of tolune were added. The reaction mixture was heated to 140 until no
further water was azeotropically distilled from the reaction mixture, and then temperature was raised to 170 to
remove tolune. After being cooled to 40 , 30mmol of 2, 6-difluorobenzonitrile was added and the reaction mixture
was heated to185~200 and stirred at this temperature for 6h.After cooling to room temperature, the product was
precipitated from water. The solid product was washed with water and recrystallized from the mixture of ethyl alcohol
and 1,2-dichloroethane three times to give 8.073g of 2,6-bis( -naphthoxy)benzonitrile(DNOBN). Yield 69%;Purity
97%; m.p.169~171 ; IR(KBr): v 3053, 2227, 1576, 1457, 1253cm-1
; H-NMR (CDCl3): 6.54~6.56 (m,2H)
7.25~7.55(m,9H),7.47~7.55(m,5H),7.79~7.93(m,6H); Elemental Analysis calculated for C27H17NO2; C, 79.45; H, 4.88;
N, 4.53. Found: C, 79.22; H, 4.93; N, 4.35.
2.3 Polymer synthesis The multiblock copolymers composed of poly (aryl ether ketone ketone) (PEKK) and 2, 6-bis
( -naphthoxy)benzonitrile(BNOBN) were synthesized as shown in scheme 2. A typical preparative procedure for
polymer is described hereafter. Other polymers were also obtained in similar manner.
O +AlCl3/DCE/NMP
- 1 5 ~ 2 0 ?C C=O =OCl O C C=O =O Cl
nC C=O =O ClCl
C C=O =O
Cl O C C=O =O
Cln
C C=O =O
O C C=O =O
n
AlCl3/DCE/NMP
O
CN
O
O
CN
O
x
Scheme 2. Synthesis of polymers
To a 100ml, round-bottomed flask equipped with a mechanical stirrer, a thermometer, nitrogen inlet and out tubes. 8.01g
(60mmol) of anhydrous AlCl3 and 20ml of 1, 2-dichloroethane (DCE) were added. The flask was cooled to 0 using an
ice-water bath, then a solution of 2.5mlof N-Methyl-2-pyrrolidone(NMP) in 5ml DCE was added dropwise with stirring
over a period of 30min,and the mixture was stirred for 30min and then cooled to -15 .Into the resulting suspension
were added 2.030(10mmol)TPC,1.617g(9.5mmol)DPE with stirring and the reaction mixture was warmed to 20 over
0.5h and then the reaction was continued at this temperature for 2.5h.Then 0.1935g (0.5mmol)DNOBN was added into
the reaction mixture and the reaction was continued at 20 for 5~6h.Lastly, a little diphenyl ether (DPE) was added to
terminate the polymer. The reaction mixture was quenched with methanol (50ml) at 0 and the precipitated was
crushed, washed with methanol and extracted with boiling methanol for 24h and allowed to dry in air. The air-dried
product was heated at 100 overnight under vacuum to give the polymer .
2.4 Characterization Elemental analysis was performed with Perkin-Elmer Model 2400 CHN analyzer. The inherent viscosities( inh) of
polymers were measured in a 01wt% H2SO4 solution at 30 .The FT-IR spectra of the polymers in KBr pellets (2%)
were recorded using a Nicolet FT-IR (510P) spectrophotometer.13
C and 1H NMR spectra of the monomer were recorded
using a Bruker PC-A400 (400Hz) using CDCl3 as a solvent and TMS as an internal standard. Differential scanning

Modern Applied Science
46
calorimetry (DSC) curves were run on a Perkin-Eml er Pyris system with a N2 gas flow, heating rate of 10 /min
ranging from 50 to 400 ,and sample weight of 5.0~7.0mg.Thermogravimetric analysis (TGA) was carried out on a
Perkn-Emler 7 Series thermal analysis system with an increasing rate of 10 /min,N2 atmosphere at the flow rate of
40ml/min,scanning scope ranging from 50 to 750 ,and sample weight of 5.0~7.0mg.Wide angle X-ray diffraction
(WAXD) was measured with a Rigaku D/MAX- A X-ray diffractometer, using CuKa radiation, at 30KV and
20mA.The diffractogramas were recorded at room temperature over the rang of 2 =10~40º.
3. Results and discussion PEKK oligomers with various molecular weight were first synthesized by controlling the molar ratio of DPE to TPC,
according to the modified Carothers equation [20]
, i.e., Xn= (1+r)/ (1–r), where Xn is the number-average degree of
polymerization and r is the molar ratio of DPE to TPC. The calculated Xn and Mn of PEKK oligomers have been listed
in Table 1. While in the synthesis of the multiblock copolymers composed of PEKK and 2, 6-bis ( -naphthoxy)
benzonitrile (BNOBN), different molar ratios of BNOBN to DPE were controlled to obtain the copolymers. But the sum
of moles of BNOBN and DPE should be equal to that of terephthaloyl chloride (TPC). The molar ratios and inherent
viscosities of the polymers are also given in Table 1. Inherent viscosities ( inh) reveal that the high molecular weight
polymers were obtained in the given reaction medium since the inh values of the polymers were higher than the
critical inh value of the macromolecule. Thus, the polycondensation route is appropriate.
Table 1. Compositions and viscosities of the polymers
Polymer BPOBN/DPE Xn Mn Elemental analysis, % inh
(PEKK) (PEKK) C H N copolymer
(oligomer) (oligomer) (Dl/g)
0/100 79.87(80.00) 3.87(4.00) 0.83
5/95 39 11700 80.14(80.10) 3.99(3.97) 0.21(0.23) 0.78
10/90 19 5700 80.23(80.20) 3.97(3.95) 0.41(0.44) 0.76
15/85 12.3 3690 80.33(80.29) 3.95(3.92) 0.60(0.63) 0.74
20/80 9 2700 80.40(80.37) 3.93(3.90) 0.79(0.82) 0.73
25/75 7 2100 80.49(80.45) 3.92(3.88) 0.97(0.99) 0.69
30/70 5.7 1710 80.56(80.53) 3.89(3.86) 1.13(1.15) 0.65
The elemental analysis values, i.e., C, H, and N content of polymers I~VII (Table1) are in close agreement with
theoretical values confirming the proposed structure. The FT-IR spectra of all polymers show no absorption in the
1850~1720 cm-1
region indicating the absence of –COCl groups. All the spectra have a 1655 cm-1
stretching vibration
for the C=O group, a 1586cm-1
stretching vibration for the C=C bonds of the aryl ring, 1494 cm-1
for the C=C
asymmetrical stretching vibration, 1241 cm-1
for the ether group asymmetrical vibration of—Ar—O—Ar—, and 2231
cm-1
stretching vibration for CN group, except for polymer I where characteristic absorption for cyano group was
absent.
Figure 1. WAXD analysis of polymer I, III and VII

47
Modern Applied Science
The WAXD patterns of polymers I, III and VII are shown in Figure 1. Polymer I (p-PEKK) had five major diffraction
peaks at 2 that are 15.5º, 17.9º, 22.5º and 27.8º. Copolymers III and VII kept nearly the same diffraction peaks as
polymer I, but the diffraction peaks decreased in intensity with increasing BNOBN content. The degree of crystallinity
of the copolymers was lower than that of the p-PEKK homopolymer and decreased with increasing BNOBN content
because of the pendant cyano groups and 1,3-connected meta-phenylene linkages. The results above indicated that
copolymers III and VII had the chain similar to that of p-PEKK to form the crystal that was included in the
orthorhombic system with the p-PEKK.
Figure 2. The typical DSC curves of the polymers
The glass transition temperatures (Tgs), the melting points (Tms), and the crystallization temperatures (Tcs) of the
polymers were determined by DSC and the results are given in Table 2. Although the polymer I (p-PEKK) had a higher
TG (16 ), its Tm (38 ) was too high, which made it difficult to process. The Tg values of the copolymers increased
with increase in concentration of BNOBN in the copolymer when the molar ratio of DPOBN to DPE ranged from 5/95
to 30/70. This gradual increase in Tg may be due to the gradual increase in concentration of cyano pendant groups and
inflexible -naphthalene rings, which hinders the free rotation of aromatic ring. As shown in table II, the melting points
(Tms) of the polymers gradually decreased with increase in concentration of DPOBN in the polymer because of the
pendant cyano groups and 1,3-connected meta-phenylene linkages. The crystallization temperatures (Tcs) of the
polymers also decreased with increase in concentration of DPOBN in the polymers. The results agreed with the WAXD
results The T of the p-PEKK homopolymer (38 ) can be reduced to 33 when the molar ratio of DPOBN to

Modern Applied Science
48
Figure 3. Typical TGA curves of polymer , and
The thermal stabilities of the polymers were investigated by TG.. The thermal decomposition temperatures (Tds) of the
polymers are also listed in Table 2. All the polymers are thermally stable up to 533 . The thermal stability of the
materials is affected by the content of BNOBN in the polymer. Polymer I (p-PEKK), without cyano and m-phenylene
groups, has the highest thermal decomposition temperature (548 ), the thermal decomposition temperatures (Tds) of
the copolymers with 5-30 mol% BNOBN are observed between 533 and 545 . The small variations in the Tds of the
resultant copolymers make the copolymers II-VII acceptable for heat-resistance applications. The typical TG curves of
the polymers , and are illustrated in Figure 3. The temperature difference between Tm and Td of polymer and
was large, thus the fusion processing can be accomplished.
The solubility behavior of the polymers prepared in this study was determined for powdery samples in excess solvents
at room temperature for 24 h and the results are listed in Table 3. It is shown that all the polymers are soluble in strong
protic acid, such as aqueous sulfuric acid and in CHCl3/CF3COOH mixtures. The high molecular weights of the
copolymers were verified by inherent viscosity measurements in concentrated sulfuric acid. A CDCl3/CF3COOH
mixture was found to be a convenient solvent for NMR measurements. The content of BNOBN in the copolymers
affects the solubility of the copolymers in organic solvents. It is known that polymer ~ shows poor solubility in
NMP, DMSO and DMF. Polymer ~ can be only swelled in NMP, DMSO and DMF. Polymer (30mol% DNOBN
can be dissolved in NMP, but only swelled in DMF, DMSO. However, all polymers prepared were insoluble in common
solvents, such as THF, CHCl3, DCE and so on. Thus, from the results above, we concluded that the multiblock
copolymers have good resistance to common organic solvents.
Table 3. Solubility of the polymers
Polymer H2SO4 CF3COOH/CHCl3 NMP DMSO DMF THF CHCl3 DCE
+ + - - - - - -
+ + + - + - + - - - -
+ + + - + - + - - - -
+ + + - + - + - - - -
+ + + - + - + - - - -
+ + + - + - + - - - -
+ + + + - + - - - -
+: soluble, + -: swollen, -: insoluble
The inh values of the copolymers and when heated at (350±10) for different times are shown in Table 4. We
concluded that no significant change in the inh values took place compared with that of the original sample. Thus, no
cross linking took place when the copolymers of or were heated for 2 h, respectively. The results showed that the
copolymers and appeared to have good thermal stability and also to have potential for fusion processing.

49
Modern Applied Science
Table 4. inh values of the copolymers VI and VII at (350±10)
Heat time (min) inh(Polymer ) inh(Polymer )
0 0.69 0.65
15 0.68 0.66
30 0.70 0.67
60 0.68 0.68
90 0.69 0.66
120 0.70 0.67
4. ConclusionsThe conclusions that can be drawn from the present study are as follows:
1. PEKK oligomers containing acyl chloride groups were first prepared by condensation of excessive terephthaloyl
chloride (TPC) and diphenyl ether (DPE) for three hours. Then a series of multiblock copolymers composed of poly
(aryl ether keotne ketone) (PEKK) and 2, 6-bis ( -naphthoxy) benzonitrile (BNOBN) were synthesized by
poly-condensation of PEKK oligomers with BNOBN.
2. All the resulting polymers are semi-crystalline and the crystallinity and melting temperature of the copolymers were
found to decrease with increase in concentration of 2, 6-bis ( -naphthoxy) benzonitrile (BNOBN) units in the polymers.
The thermal decomposition temperatures (Tds) of the copolymers with 5-30 mol% BNOBN are observed between 533
and 545 . The small variations in the Tds of the resultant copolymers make the copolymers - I acceptable for
heat-resistance applications.
3. The copolymer with 25~30 mol% DPOBN has a high Tg (187~192 ), a high Td (533~535 ), and moderate Tm
(332~337 ), which is very acceptable for melt processing, and the copolymers with 25~30% mol BNOBN units
exhibit excellent thermo stability at (350±10) .
References [1] Jones DP, Leach DC, Moore DR. Polymer 1985; 26:1385.
[2] Khan S, Pratte JF, Chang IY, et al. Int SAMPE Symp Exhib 1990; 35:1579.
[3] Nguyen HX, Ishida H. Polym Compos 1987; 8:57.
[4] Kelsey DR, Union Carbide Corp, USA.EP 211 693 (1987); Chem Abstr 107, 7846(1987).
[5] Jennings BS, Jones MEB, Rose JB.J Polym Sci Polym Symp 1967; 16:715.
[6] Ward MV, Nield E, Staniland PA, Imperial Chemical Industries plc,Uk. EP 125 816(1984); Chem Abstr 102, 96524
(1985).
[7] Jamsons V, Dahl K. Makromol Chem Macromol Symp 1991; 51:87.
[8] Wijers MC, Jin M, Wessling M, et al. J Membr Sci 1998; 147:117.
[9] Rose JB.NATO ASI Ser SerC 1987; 215:207.
[10] Hergenrother PM, Jensen BJ, Havens SJ. Polymer 1988; 29:358.
[12] Kricheldorf HR, Delius U, Tonnes KU. New Polym Mater 1988; 1:127.
[13] Kricheldorf HR, Bier G. Polymer 1984; 25:1151.
[14] Risse W, Sogah DY. Macromolecules 1990; 23:4029.
[15] Feng Wang, Tianlu Chen, Jiping Xu, et al. Polymer 2006; 47:4148.
[16] Yaming Miu, Xiaoliang Zhu, Lingzhi Liu, et al. Reactive & Functional Polymers 2006; 66:559.
[17] Katsuya M Maeyama, Shugo Maeda, Kenji Ogino, et al. Reactive & Functional Polymers 2005; 65:229.
[18] Zhaoqiang Lu, Yunyang Liu, Jingui Qin, et al. Reactive & Functional Polymers 2004; 61:379.
[19] V.L.Rao, P.U.Sabeena, Akanksha Saxena, et al. European Polymer Journal 2004; 40:2645.
[20] Cao Jk, Su WC, Piao MJ, et al. Chem J Chin Univ 1992; 12:1327.

Modern Applied Science www.ccsenet.org/mas.html
Vol. 1, No. 2
July 2007
50
Eventually Strong Wrpp Semigroups
Whose Idempotents Satisfy Permutation Identities
Xiaomin Zhang
Department of Mathematics, Linyi Normal University, Shandong 276005, China
E-mail: [email protected]
Abatract The aim of this paper is to study eventually strong wrpp semigroups whose idempotents satisfy permutation identities,
that is, so-called PI-strong wrpp semigroups. After some properties are obtained, the structure of such semigroups are
investigated. In particular, the structure of special cases are established.
Keywords: eventually strong wrpp, normal band, eventually PI-strong wrpp, spined product
1. Introduction and preliminaries Let S be a semigroup, A a subset of S and let
1, 2 , ,
(1), (2 ), , ( )
nn
(*)
A non-identity permutation on n objects. Then A is said to satisfy the permutation identity determined by (in
short, to satisfy a permutation identity if there is no ambiguity) if
1 2 1 2 (1) (2) ( )( , , , ) ,n n nx x x A x x x x x x
Where 1 2 nx x x is the product of
1 2, ,x x and nx in S . If A S , then S is called a PI-semigroup.
In connection with this, regular semigroup whose idempotents satisfy permutation identities were investigated by
Yamada (1967, P.371). Strong wrpp semigroup whose idempotents satisfy permutation identities were investigated by
Guo(1996, P.1947) Eventually strong wrpp semigroup whose idempotents satisfy permutation identities were studied
by Du et al.(2001,P.424).
Du(2001, P.5)introduced the relation (**)L which generalizes the relation **L , and the concept of eventually wrpp
semigroup was introduced.
Let ,a b S . Then (**)baL axRay if and only if bxRby for all ,x y S .we write as (**)
aL with respect to (**)L - class
containing a for any a S . Clearly, ** (**)L L . In particular, we have ** (**)L L when 1S S .
We denote
{ ( ) | ( ) , and }aI e E S x S eax ax xae xafor all ( )a E S .
A semigroup is called eventually stong wrpp semigroup if each (**)L -class of S contains an idempotent, and(**)| | 1a aL I for all a S . Here, denotes unique idempotent by a .
A eventually strong wrpp semigroup S is called eventually PI-strong wrpp semigroup if idempotents of S satisfy a
permutation identity.
Throughout this paper, the terminologies and notations are not defined can be found in Howie(1976).
Lemma1.1 (Yammada, 1967, PP.371-392) let B be a band. Then the following conditions are equivalent:
(1) B Satisfy a permutation identity;
(2) B is a normal band;
(3) B is a strong semilattice of rectangular bands.

51
Modern Applied Science
Lemma 1.2(Tang, 1997, PP.1499-1504) Let Y be a semilattice, and ,[ ; , ]aS Y S a strong semilattice of semigroup
S . If for any ,a S , ( , ) , then b S a b R .
Definition 1.3 A semigroup S is called R -cancellative monoids,if for any , ,a b c S , ( , )ca ab R ( , )a b R and
( , ) ( , )ac bc R a b R .
2. Some lemma In what follows S is always a eventually strong semigroup whose idempotents satisfy permutation identity(*). Let
1{ | ( ) }, ( ),k min i i i m kthen ( )k k . For any ( )e E S , we let
{ | }eS a S a e .
Lemma 2.1 The following conditions hold:
(1) A subsemigroups of S satisfy formula (*);
(2) ( )E S is a normal band;
(3) ( ) | ( )TL S L T for any a subsemigroup T of S ;
(4) ab aa b ab b aba b a b ab For any ,a b S .
Proof. Proof of (1) and (2) refer to Yammada(1967,PP.371-392). (3) is trivial. We only show that (4). According to
, and xaa xa a ax ax a a aa ,we have ab aa b ab b .
By S satisfying equation (*), we have
( ) ( )( ) ( ) ( ) ( )k m k n m kab aa bb a a a a bb b b a a bb a b aba b .
Dually, we have ab a b ab .
Lemma2.2 ( )ab a b holds for any ,a b S .
Proof. Let all ,x y S . Then
(* *)
( ) ( 1 ) ( ) ( 1 )
( , )
( is a le f t co n g ru en ce )
( ) ( ) ( ) ( ) ( ) ( )
+ + +
k m k n m k m k n m
a b xR a b y a b b R a b b a L a a b = a b bb a b b xR b a b b y Rb a b b b xR b a b b b y
b a b(** )
+
( sa tis fie s (* ) )
( )
( = )
x b b a b xR b b a b y b a b y Sb a b xR b a b y b L ba b xR a b ya b xR a b y a b a b a b
Consequently, ( )aba b L E S . By lemma 2.1(4), we know that ( )ab a b .
Lemma 2.3 Let ( )e E S . Then eS is an inflation of commutative R -cancellative monoids.
Proof. According to lemma 2.2, we know that eS is a subsemigroup of S . Noticed that
2 { | , } { | , }e e e e e eeS S e S ab a b S abe a b S S e .
Thus 2
e e eeS S e S , so 2
eS contains a identity element e , and satisfies (*). For any 2, ea b S , we have
1 ,k m k n mab e ae be ebae baThat is, 2
eS is commutative. For any 2
ec S such that caRcb , by cL e ,we have Rea ea b b . Thus 2
eS is R left
cancellative, so 2
eS is a R -cancellative monoid. The mapping e defined by the following rule:
2: , ,e e eS S x exThen for any , ex y S , we have
e exy = exy = exey = x y . So eS is an inflation of commutative R -cancellative monoids
2
eS .
Lemma 2.4 Let B be a normal band, and the least semilattice congruence on B . Then B is a eventually PI- strong
wrpp semigroup and ( )L B .
Proof. Let ,[ ; , ]Y E be a strong semilattice decomposition of B with structure homomorphism , , where Y is a
semilattice, and ( )E Y is a rectangular band. For any a B , we have (**)
a aa L I . If (**)
a ae L I , then we have
eax = ax xae = xa and ea = ae for any x B . By (**) ( )eL B a and ae = ea = = eaa aa a , we have e = eeRea = a .
Therefore, e = ae = a , so a = a . According to lemma 1.1, we know that B is a eventually PI- strong wrpp
semigroup.

Modern Applied Science
52
Let , ( , ),a E b E Y and (**)aL b .By ,ab = a b ,we Have
,b = bbRb b . According to lemma1.2, ,
similarly, . Therefore (**) ( )L B .
Conversely, let a b . Then , and for any ,x E y E , we have
, , , ,
, , , ,
a x R a y a x R a y
b x R b yb x R b y
Thus aL b , so (**) ( )L B .
Lemma 2.5 the following conditions are equivalent:
(1) ( )E S is a rectangular band;
(2) S is (**)L -single;
(3) S is an inflation of the semidirect product of a commutative R -cancellative monoids and a rectangular band.
Proof. (1) (2). Let ( )E S be a rectangular band. For any , , ,a b S x y S ,
We have
(**) ( )
( is a le ft co n g ruen ce)
(b y lem m a 2 .1(4 )
( ( ) is a rec tan g u lar b an d )
+ +
+ + + +
+
axR a y a xR a y a L ab a xR b a y R
b a x xR b a y y b x xR b y y E Sb
(**)
(b y lem m a 2 .1( 4 ))
( )
+
+
xR b y b xR by b L b
Therefore, (**)aL b .
(2) (3). Let S is (**)L -single. By lemma 2.1 (2)and (3), we know that ( )E S
is a normal band, and (**)
( ) ( )| |E S E SL . So ( )E S is a rectangular band since (**)
( )|E SL is the least semilattice
congruence on ( )E S . According to lemma 2.1(4) and lemma 2.2, we have 2
( )e E S eS S e . The mapping defined by the
following rule:
2: , ,S S x xxBy lamma 2.3 and its proof, we know that definition of is good. For any
,a b S , we have + +ab = aa bb = a b . Thus S is an inflation of 2S . We select a fixed ( )e E S , The mapping defined by
the following rule:
2 2: ( ), ( , )eS S E S x exe x
Let 2,x y S such that x y . Then + +x = y , and + + + +x = x ex xx ex + + + += x exex = y eyey = y . Therefore is injective. For any 2( , ) ( )ex f S E S ,
We have ( ) = ( , )fxf x f . Thus is surjective. On the other hand, for any
2,x y S , we have
+( ) = ( , ( ) ) = ( , )
= ( , )
= ( , )
= .
+ + + +
+ + + +
+ +
xy exye xy exx ey ye x yexx eey ye x yexe eye x y
x y
Therefore, is a isomorphic mapping.
(3) (1). It is trivial.
Lemma 2.6 Let {( , ) | }a b S S a b . Then is a semilattice congruence on S ,and each class of S is a

53
Modern Applied Science
(**)L -single eventually PI-strong wrpp semigroup.
Proof. Let {( , ) | }a b S S a b . Then by lamma 2.2, we know that is a congruence of S , and such
that / ( )S E S . Let
is the least semilattice congruence on /S . We
Easily verify that left side graph is commutative. Therefore is a semilattice congruence. Let T is
A class of S . Then ( )E T is a rectangular band, and ( )e E T eT S . For any a T , by lemma 3(3), we
have ( * * ) +a L a . If for any ( )e E T such that (**) ( )eL T a , and for all x T , , ,eax ax xae xa then ,ae ea and for
any ( )f E T , we have ( )+ +ea f = eaf = + +( ) = , = ( )+ +af a f fa e fae+ + =( ) = fa fa . Thus, +e = a , so T is an eventually PI-strong wrpp semigroup.
By lemma 2.5, T is L -single.
We easily show that the following:
Lemma 2.7 the following conditions are equivalent:
(1) T is a strong semilattice of the direct product of commutative
R cancellative monoids and rectangular bands
(2)T is a spined product of strong semilattice of commutative R cancellative monoids and normal band with respect
to its the common
Greatest homomorphism image.
3. Main results and its proof Next we give main results in this paper.
Theorem 3.1 the following conditions are equivalent:
(1) S is an eventually PI-strong wrpp semigroup;
(2) S is a strong semilattice of inflation on the direct product
commutative R cancellative monoids and rectangular band;
(3) S is an inflation of strong semilattice on the direct product
commutative R cancellative monoids and rectangular band;
(4) S is a inflation of spined product of strong semilattice of commutative R cancelative monoids and normal band
with respect to its the common

Modern Applied Science
54
Noticed that for any , , ,a S b S Y , we have
, , , , , ,
, ,
, ,
=
=( )( )
=
+ + + + + + + + + + + + +
+ + + + +
+ +
ab = aa b a b bb a b = aa b a bb a baa b a bb a b
aa bba b
Thus is a structure homomorphism, where , Y , and .
(2) (3). Let ,
[ ; , ]S Y S is a strong semilattice of S , where , Y , S is an inflation of the direct product of
a commutative R cancellative monoid M and a rectangular band E with respect to the mapping .
Then 2S M E , and for , we have
2
, ,( )M E S M ETherefore,
YM M E forms a subsemigroup of S , and
,[ ; , | ] ( , )M EM Y M Y
Let , and , denote the mapping which M onto M elicited by ,|M E and the mapping E onto E ,
respectively, identity element of M write as e , and '
, ,[ ; , ], [ ; , ]M Y M B Y E . According to lemma
9, 'M M B . For any ( )x S Y such that ( , )x a e M E . Then let * ( , )x e e . For any Y ,and ,
then * *
, ,( )x x . If not, then
* *
, , , , ,( ) ( , ) ( , ) ( , )x e f e e e e x .
So
* * * * * *
, , , , , ,
* * *
, , , ,
( ( ) ) ( ) ( ) ( , )
( , ) ( ) ( ( ) )
x x x x x x e fe
e e f x x x x
This is contrary to * * * *x x x x x x x xx . For any ( )y S Y ,
We have
* * * *
, , , , , , , ,( ) ( ) ( ) ( )xy x y x x y y xx yyTherefore, S is an inflation of M with respect to the mapping *: ,S M x xx .
(4) (5). Let S is an inflation of spined product of a strong semilattice of a commutative R cancelative monoid Mand a normal band B with respect to it’s the common greatest homomorphism image under the mapping . Then S is
also an inflation of a strong semilattice 'M of commutative R cancelative monoids and a normal band B with respect
to the mapping . Let the greatest semilattice decomposition of M and B be
, ,[ ; , ] , [ ; , ]M Y M B Y E
Let , ,a , b x y S , and such that
( , ) , ( , ) , ( , )a k e M E x l f M E b m g
, ( . ) ,YM E y n h M E e is an identity element of M . Then
( , ) ( , )
( , ) ( , )
( , ) ( , ), ( is a cancellative m oniod)
( , ) ( , )
axR ay kl ef R kn ehke ef R ke n eh
e l ef R e n eh = M R e e xR e e y
Thus ( , )+aL e e . Clearly, ( , ) = , ( , )xa e e xa e e ax = ax . Let ( , ) ( )e u M E Y
Such that ( , ) +e u L a , and ( , ) = ( , )xa e u xa; e u ax = ax .Then we imply that by ( , )xa e u = xa .
Let . Then . So . Again ,
( , ) ( , ) ( , )=e u a = e u a = a e u ,( , )a e u u), where , is a structure
homomorphism of a strong semilattice 'M of a commutative R commutative monoid and a rectangular band, so
,( , )e u is an identity element of a in M E . Thus ,( ) = ( )e ,u e ,e . Noticed that( , ) ( , )( , ) ( , )( , )e e e e e e e u e e ,
so ( , ) ( , )( , ) ( , )( , ) ( , )e e e u e e e u e u e u , consequently, ( , )e e a , S is an eventually strong wrpp semigroup. According to
M is a commutative

55
Modern Applied Science
R cancellative monoid and B is a normal band, we obtain
( , ) ( , ) axyb = klnm efgh = knlm egfh = ayxb .
Therefore, (5) holds.
Definition 3.2 A wrpp semigroup S is called to satisfy conditions (L).if there exist a unique ** ( )e L E S such that
eae = a for all a S .
Corollary3.3 an eventually PI-strong semigroup S is a semigroup with satisfying the conditions (L) and satisfying the
permutation identity (*)
If and only if 2S S .
Proof. Let S be an eventually PI-strong wrpp semigroup. By theorem 3.1, we know that S is an inflation of the
spined product of a commutative R cancellative monoid M and a normal band B with respect to its common
greatest semilattcice homomorphism imageY . If 2S S , thenYS M B . According to the proof of theorem 3.1, for
any ( , )k e M E , ( , ) ( , )S k e e e and + +( , ) ( , )( , ) = ( , )k e k e k e k e , we can imply that S is a semigroup with satisfying the
conditions (L) and satisfying the permutation identity (*). Conversely, if S is a semigroup with satisfying the
conditions (L) and satisfying the permutation identity (*), then we have +a a = a for any a S . Therefore 2S = S .
Corollary3.4 the following conditions are equivalent:
(1) S is a semigroup with satisfying the conditions (L) and satisfying the permutation identity (*);
(2) S is an eventually PI-strong wrpp semigroup, and 2 = S S ;
(3) S is a strong semilattice of the direct product of a commutative R cancellative monoid and a rectangular band;
(4) S is a spined product of a strong semilattice of commutative R cancellative monoid and a normal band;
(5) S is a semigroup with satisfying the conditions (L) and satisfying a permutation identity 1 2 3 4 1 3 2 4x x x x = x x x x .
ReferencesDu,Lan. (2001). On eventually C-wrpp. Journal of Ningxia University. 22, 5-7.
Du,Lan and He,Yong, (2001). On eventually PI-strong rpp semigroup. Journal of Mathematics Study. 34, 424-430.
Guo, Xiaojiang. (1997). Abundant semigroups whose idempotents satisfy permutation idemtities. Semigroup Forum. 54,
317-326.
Guo,Xiaojiang. (1996). The structure of PI-strong rpp. Chinese Science Bulletin. 41, 1647-1650.
Howie J. M. (1976). An Introduction to semigroup theory. London:Academic Press, Lomdon.
Tang, Xiangdong. (1997). On a theorem of C-wrpp semigroups. communication in Algebra. 25, 1499-1504.
YAMADA, M. (1967). Regular semigroups whose idempotents satisfy permutation identi-ties. Pacific Journal ofMathematics. 21, 371-392.

Modern Applied Science www.ccsenet.org/mas.html
Vol. 1, No. 2
July 2007
56
Reconstruction of Video Electromagnetic Leakage from Computer
Bo Hu
Department of Physics and Electronics, Binzhou University, Binzhou 256603, China
Tel: 86-543-319 1767 E-mail: [email protected]
Abstract TEMPEST technology has been concerned much more in recent years. Video Displayer Unit, which is one of the
most import parts that may result in computer information leakage, offers the interface for man-machine conversation
directly and its video electromagnetic radiation contains the displaying information. The interception and recovery
system of video electromagnetic information leakage of the computer is designed. After the electromagnetic leakage
is intercepted, the method to recover the word image is presented using the reconstruction techniques such as
synchronization, related filtering, phase lock on etc. This means that the original useful information can be
reconstructed by the electromagnetic leakage under certain conditions, and this will menace information security. It is
one of the most important factors that should be concerned in information security and electronic antagonism fields.
Keywords: TEMPEST, Electromagnetic Radiation, Electromagnetic leakage, Filtering, Information Reconstruction
1. Introduction Electronic equipments deal with data information by controlling the changes of electric current (or voltage). But the
time-variant electric current will bring electromagnetic radiation which contains abundant frequency spectrum and
information that can be unscrambled.
According to the investigation and analysis from the domestic and aboard if the radioactive electromagnetic wave is
detected and intercepted the digit signal can be abstracted. As a result, it will cause information leaking by means of
reproduce the original information. Therefore, it is one of the key technologies to reduce or remove the problem of
information leaking caused by electromagnetic radiation .The video information radiation from electromagnetic
radiation coming with the working computer can received the transmitting signals can be monitored .The emission of
electromagnetism has two main influences on the information technologic equipment: the first one is the
electromagnetic disturbing and information leaking caused by the electromagnetic emission of their own ,the other
the disturbing and destroying from outside. The two kinds of influences have not only the problem of electromagnetic
disturbing but also the problem of information leaking. TEMPEST, advanced during 1980s is a technology based on
computer information leaking. It is a new technique developed from the field of electromagnetic annexation bringing
great threaten to the information safety. Acquiring the intelligence from the leakage from TEMPEST is one of
important methods used by ELINT to get information .In the Bay-War happened in 1991, America used the most
advanced TEMPEST technique to intercept and capture the intelligence about politics ,military affairs and economy
of Iraq and Bay area. Although the TEMPEST technique is based on the principle of electromagnetic radiation, it
pays more attention to abstract useful information handling and identifying to deal with this useful information. The
computer system is the most important component of various information technique devices, so it is the primary
research objective among all the TEMPEST technique problems. The computer’s make up circuits are complex and
contain many kinds of clock information, all of which exist electromagnetic radiation to a certain degree. The sources
of radiation can be divided into CPU, communication circuits, and transform equipments, output devices and so
on...All of them will lead to information leaking phenomenon. These leakages contain synchronism signal, clock
signal, digit signal, being processing and information being displayed on the screen.
From the middle age of 1980s, our country has begun to research on TEMPEST. In the early age of 1990s, several
internal units researched some key-pointing problems of TEMPEST technique and got many important achievements
on many subjects, for example: computer information leakage and principle of protection from it, the technique of

57
Modern Applied Science
receiving and receiving and restoring micro-mini computer radioactive information, safety evaluation, the test of
technical production, laboratory and scene testing, distinguishing from red and black signals, the technique of
electromagnetic leakage protection in micro-mini computer system, and so on. In 1980s in the nationwide exhibition
of computer application, the department of public security demonstrated that they reappeared the showing content of
micro-mini computer’s screen on TV’s screen by using TV receiving antenna to aim at the computer. Xi’an electronic
technique university and so on used black-and-white television to receive screen information. Changchun light
machine office of Chinese Academy of Science carried out the interception and reappearance about the video leaking
information of the computer whose showing method is CGA. The receiving scope is usually limited to about 3 meters
for reappearing display text information by means of black-and-white television structure. But Van.Eck came up in
his thesis that it can receive and deoxidize the video frequency information among 1000 meters. During 1990s,
English reported that they can receive and deoxidize information in 1600m.In comparison, Beijing Postal and label
services university carried out a receiving machine which realized the reappearance of computer word leakage and
got word reseen picture located at far range. In 2004, the university completed a simulation platform, which was used
to reappearance computer video electro magnetic linking information and realize the ration evaluation about the
leaking threshold of information and the reinforcing function of computer.
Through the video frequency channel we can realize the communication between man and computer directly. The
reason why the video frequency signal is a main scores of information leakage is that the electromagnetic leakage
caused by video signal radiation including useful information that can be recognized an abstract easily. Regarding the
character information, they are random digit signal can produce electromagnetic radiation easily an take on wide
frequency spectrum area owning to there are more causes and components caused information leakage this article
have design the system method for the computer electromagnetic leakage. Dealing with the real data use many
technique like synchronism, related filtering, phase lock and so on to obtain the word and image reappearance from
electromagnetic leakage.
From the research we can discovery the electromagnetism radiation caused by digit pulse video frequency signal
processing a wide frequency spectrum area. In addition, owning to the effect of muti-patches effect will be neglected
under strong noise when transmitting through the wireless channel. At the same time the signal has been deformed.
Because the received video signal radiation has low S/N, wide spectrum and will be deformed, so to capture and deal
with the electromagnetism leakage information is different from to receive and do with the classical communication
signal either in theory or in technique. In this article, when the electromagnetic leakage from computer captured, the
technique of abstracting the filed synchronism signal and row synchronism signal, phase clock, related filtering, be
used to reappear the word image of common song-character displaying on the computer screen away from 10 miters.
It’s a breakthrough to the recorder of the distance researched about the leakage information.
2. The Distill of the Synchronous Signal in Electromagnetic Leakage The references [21,22] gave the metrical results of the Electromagnetic Leakage. In this paper, we designed the frame
of interception and rebuild of the Electromagnetic Leakage information. After the interception with the help of the
wide-band antenna, the information was transferred into digital. The signal processing was finished by software
applications. The sample rate of the system is 60M.
In the near filed, to output though amplify, demodulation and detector after digital sampling, we could get the
character signal of Electromagnetic Leakage when computer display character information near the receive center
frequency. Which sketch 2(a (b) is field synchronous information and row synchronous information of
Electromagnetic Leakage information separately, sketch 2(c)(d) is field synchronous signals and row synchronous
signals which is abstracted by Electromagnetic Leakage information. Sketch 2(e) is one row of the video signal of
Electromagnetic Leakage information; sketch 2(f) is the abstracting video signal after signal processing.
corresponding to sketch 2(e) which vertical is relative amplitude of the Electromagnetic Leakage information after
signal processing, horizontal is the number of sampling point corresponding to the time is 16.7 ns.
the row synchronous character information of the Electromagnetic Leakage information.

Modern Applied Science
58
the filed synchronous character information of the Electromagnetic Leakage information.
the row synchronous signal abstracted from Electromagnetic Leakage information.
the filled synchronous signal abstracted from Electromagnetic Leakage information.
The video signal leaked from character information and picture information.
The video signal abstracted after signal processing.
3. The Technology of Signal Processing 3.1 The principle of phase lock on
The recovery technology of get field synchronous signals and row synchronous signals though signal processing of

59
Modern Applied Science
the collected Electromagnetic Leakage from Computer is one of the key technology of Electromagnetic Leakage’s
Reconstruction. To make the field synchronous signals and row synchronous signals steady ,we adopt the digital
phase lock on: technology, make use of phase lock on loop circuit accurate fix the output synchronous signals
position. The basic of the structure of phase lock on such as the sketch 3.It consist of 3 base component part:
comparer, LPF, and synchronous signals producer (synchronous circuit), the input signals is the field synchronous
signals and row synchronous signals which is picked up by receiver. The comparer compare the input signals Si(t)and
the output synchronous signals So(t) which pass the circuit. Product error voltage Se(t) corresponding to two
signals. The function of LPF is filter the high frequency component and noise of the error voltage Se(t), the purpose is
to ensure the functions which is needed by the loop, and enhance the stability of system. The synchronous circuit is
controlled by the control voltage Sd(t). make the synchronous signals approach to the input signals, until clearing the
error to lock on.
Sketch 3 digital look on principle
3.2 correlate filter wave We could adopt the measure called shifting of function enhance the SNR to reduce noise. Assume the signal include
noise is
( ) ( ) ( )x t s t n t (1)
Which s(t) is the signal whose circle is T, n(t) is the independent white noise whose average value is 0, square
different is .The input signal SNR is :
2/iSNR W (2)
Assume the frame frequency of monitor is M, so the output of the system after following operation as following:
1 1
1( ) ( ) ( ) ( ) ( ) ( )
M M
k ky t x t kT s t n t kT s t N t
M (3)
Which N(t) is measure err Its average value is obvious 0.its square err is
22
1
1( ) ( )
M
k
D N t E n t TM M (4)
Now, the processed SNR is
o iWSNR M SNR
(5)
It is thus clear that SNR increase M times. It is easy to protect the pass function is
0
0
sin( / )1 1 1( )
1 sin( / )
jNM t
jN t
MeHM e M (6)
it is thus clear that the gain of pass function of the filter when w=kw0,This process is equal to comb filter whose
central frequency is w=kw0, called correlate filter.
3.3 matching filter Matching filter could be considered one correlate device which accurate input signals correlate function. The shape of
wave become autocorrelation integral shape after passing match filter, and it is symmetrical about point t=t0.
t0 is also the maximum point of the output signal. Consider the output signal is so(t) :
duutKsutsts )()()( 00 (7)
Se(t)L P F Comp
synchro
Si(t)
So(t)
Sd(t)

Modern Applied Science
60
