modern methods of data analysis - physikalisches institutmenzemer/stat10/statistik_27... · modern...
TRANSCRIPT

Modern Methods of Data Analysis - SS 2010 Stephanie Hansmann-Menzemer
Modern Methods of Data Analysis
Lecture II (27.04.10)
● Characterize data samples● Characterize distributions● Correlations, covariance
Contents:

Modern Methods of Data Analysis - SS 2010 Stephanie Hansmann-Menzemer
● arithmetic mean of data set:
● weighted mean of data set:
● mode – most prob. value (peak in distribution, not unique)
● median – smallest value which is ≥ 50% of events better use median than mean, more robust against outliers!
● similar defined Quantile: Median = 50% Quantil
● truncated mean: useful if the underlying distribution is
expected to be asymmetric
Reminder: Average of a Sample

Modern Methods of Data Analysis - SS 2010 Stephanie Hansmann-Menzemer
Measure the Spread of a Sample
● How to characterize width/spread?
● First thought .... mean deviation from the mean:
● Could consider average absolute deviation: However hard to handle mathematically.

Modern Methods of Data Analysis - SS 2010 Stephanie Hansmann-Menzemer
Sample Variance● Way better quantity:
mean square deviation called sample variance s² or V
● For any random variable :

Modern Methods of Data Analysis - SS 2010 Stephanie Hansmann-Menzemer
Sample Variance● For data analysis, preferably loop only once over data:
mean square – square of the mean
Modern Methods of Data Analysis - SS 2010 Stephanie Hansmann-Menzemer
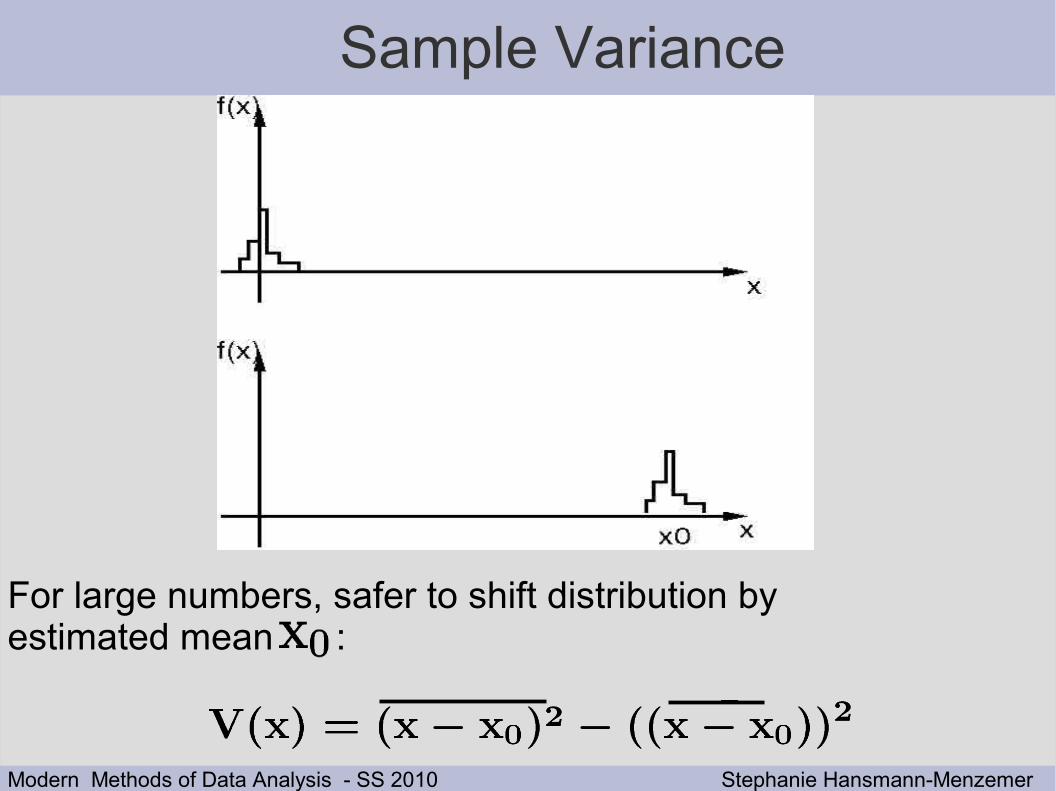
Sample Variance
For large numbers, safer to shift distribution by estimated mean :

Modern Methods of Data Analysis - SS 2010 Stephanie Hansmann-Menzemer
Standard Deviation (RMS), FWHM● standard deviation σ or RMS: root mean squared
[“standard ” is a joke, there are several standards in literature ...]
● FWHM: full width at half maximum more robust against outliers, fluctuations harder at low statistics; for Gaussian distributed events: FWHM = 2.35σ

Modern Methods of Data Analysis - SS 2010 Stephanie Hansmann-Menzemer
Example:
● Give sample variance, RMS and FWHM:
Modern Methods of Data Analysis - SS 2010 Stephanie Hansmann-Menzemer
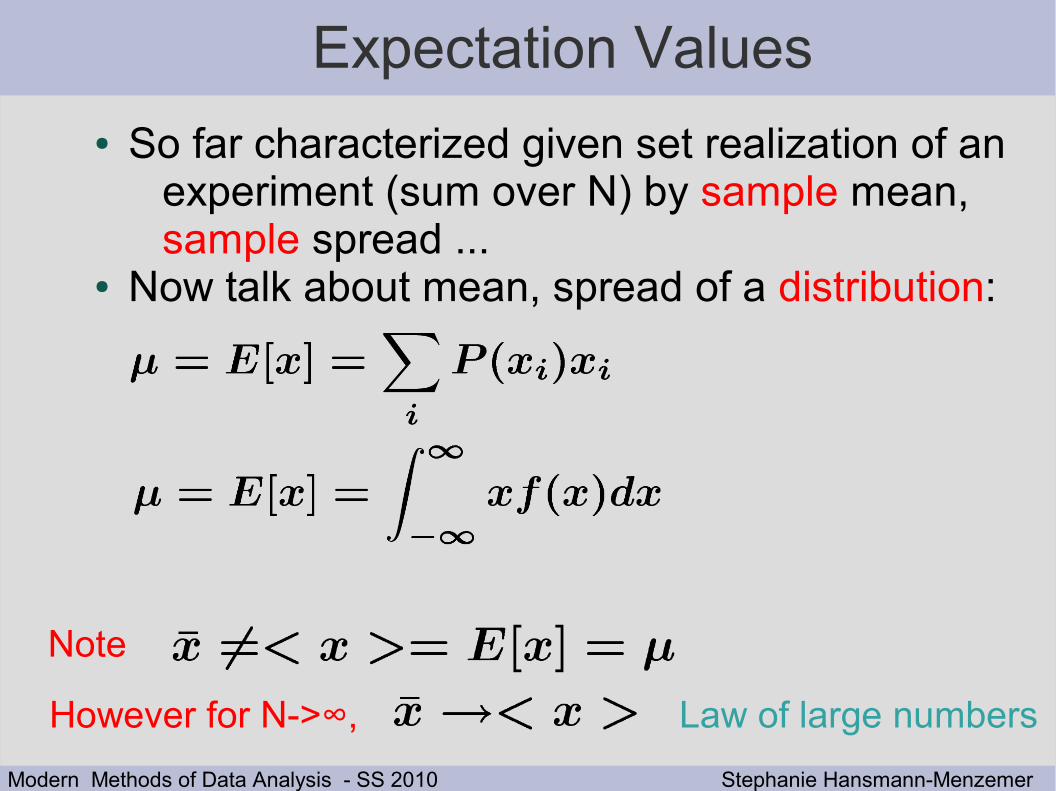
Expectation Values● So far characterized given set realization of an
experiment (sum over N) by sample mean, sample spread ...
● Now talk about mean, spread of a distribution:
Note
However for N->∞, Law of large numbers

Modern Methods of Data Analysis - SS 2010 Stephanie Hansmann-Menzemer
Variance of a Distribution:
● V[x] = E[(x-μ)²] =
● V[x] =
● V[x] = E[x²] – µ²
V[x] is the measure of the spread of the distribution,not how well the mean is measured!
f(x): PDF

Modern Methods of Data Analysis - SS 2010 Stephanie Hansmann-Menzemer
Example:
N = 100
N = 10000
N = 1000
µ = 5σ = 1

Modern Methods of Data Analysis - SS 2010 Stephanie Hansmann-Menzemer
How to determine uncertainty on the mean?
● E[ x ] = ???● V[ x ] = ???

Modern Methods of Data Analysis - SS 2010 Stephanie Hansmann-Menzemer
Expectation Value of sample mean

Modern Methods of Data Analysis - SS 2010 Stephanie Hansmann-Menzemer
Variance of the Sample Mean

Modern Methods of Data Analysis - SS 2010 Stephanie Hansmann-Menzemer
● CDF has a mass resolution of 16 MeV: the reconstructed mass of a single B meson is spread around the true B mass with σ=16 MeV
● The B mass can be measured with way better precision
m(B0) = 5279.63 ± 0.53 (stat) ± 0.33 (sys)

Modern Methods of Data Analysis - SS 2010 Stephanie Hansmann-Menzemer
Unbiased Estimators:
Unbiased Estimator “erwartungstreuer Schätzer”
unbiased estimator for true mean µ is :
for n data points, we estimate the true variance V(x) by the“sample variance s²” - if true mean µ is known!
- If the true mean is unknown, then an unbiased estimator for the variance σ² is the “sample variance s²”:
beware of N-1!
“One single value is not enough to determine mean and spread.”
Modern Methods of Data Analysis - SS 2010 Stephanie Hansmann-Menzemer
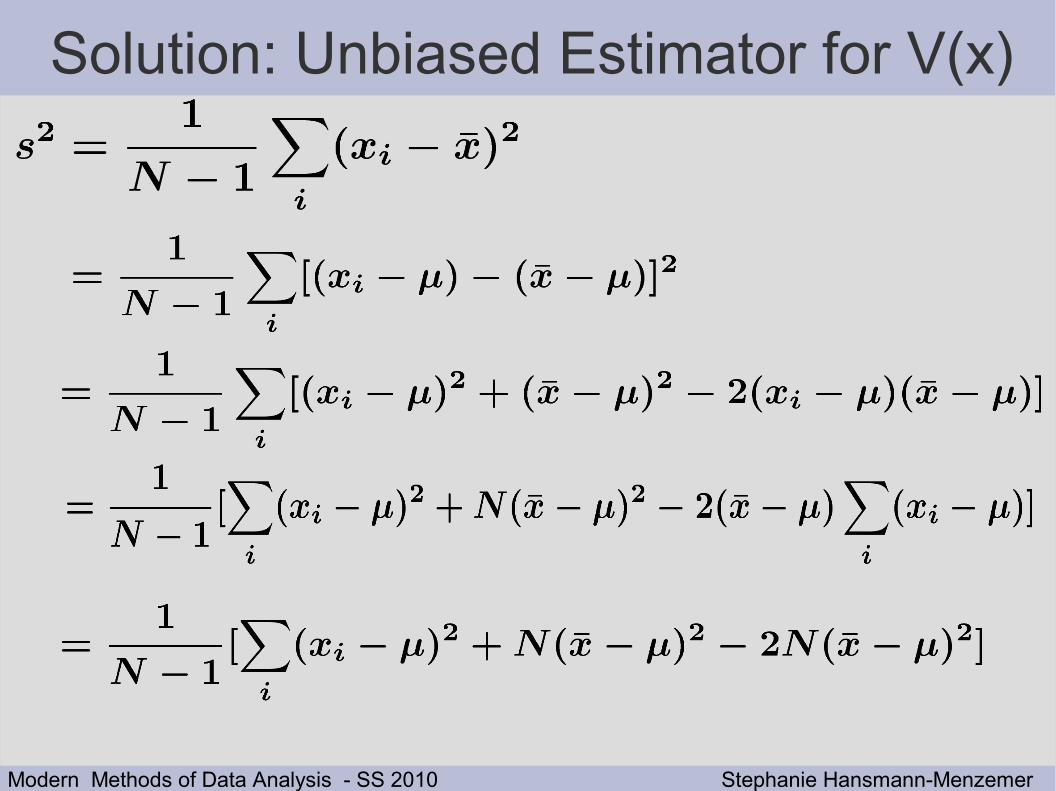
Solution: Unbiased Estimator for V(x)

Modern Methods of Data Analysis - SS 2010 Stephanie Hansmann-Menzemer
Solution: Unbiased Estimators for V(x)
Modern Methods of Data Analysis - SS 2010 Stephanie Hansmann-Menzemer
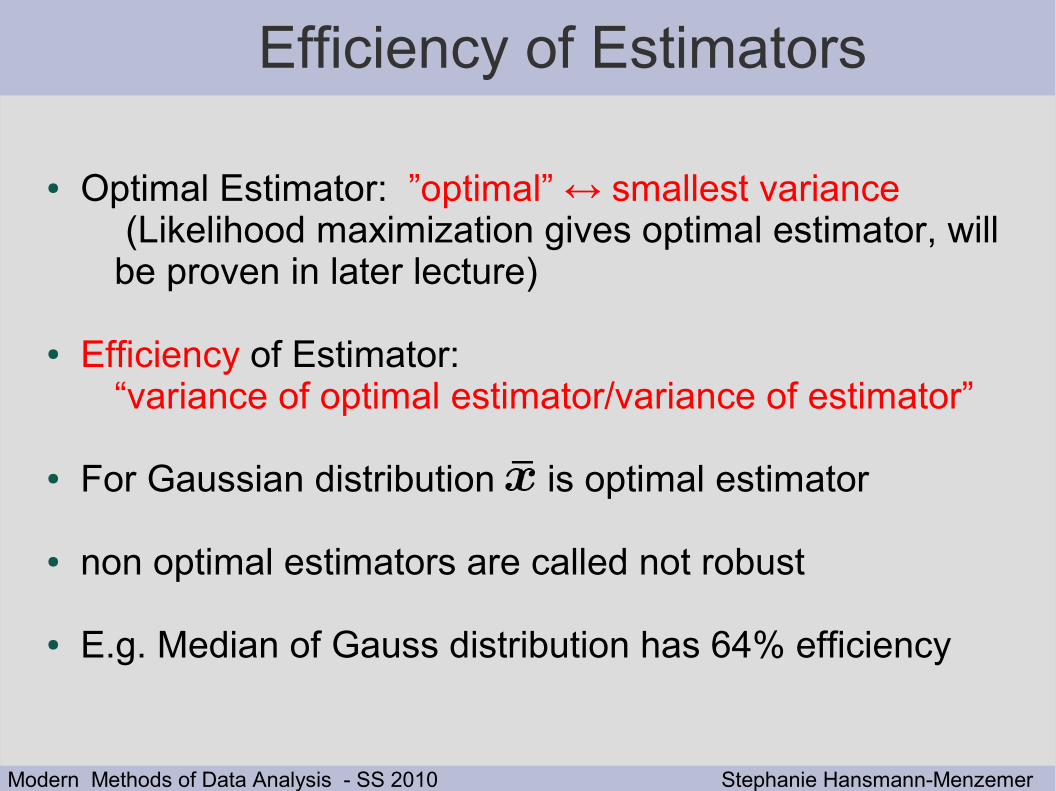
Efficiency of Estimators
● Optimal Estimator: ”optimal” ↔ smallest variance
(Likelihood maximization gives optimal estimator, will be proven in later lecture)
● Efficiency of Estimator: “variance of optimal estimator/variance of estimator”
● For Gaussian distribution is optimal estimator
● non optimal estimators are called not robust
● E.g. Median of Gauss distribution has 64% efficiency

Modern Methods of Data Analysis - SS 2010 Stephanie Hansmann-Menzemer
Symmetric truncated Mean
● truncated mean (“getrimmter Mittelwert”): – e.g. r = 40% truncated mean:
● 10% lowest and 10% highest values ignored, calculate mean of 80% central values
– r = 50% truncated mean -> arithmetic mean
– r -> 0% -> median

Modern Methods of Data Analysis - SS 2010 Stephanie Hansmann-Menzemer
Cauchy
Laplace ordouble exponential
r = 0.23 truncatedmean best estimatorfor unkown sym. distribution
effic
ienc
y
r
Modern Methods of Data Analysis - SS 2010 Stephanie Hansmann-Menzemer
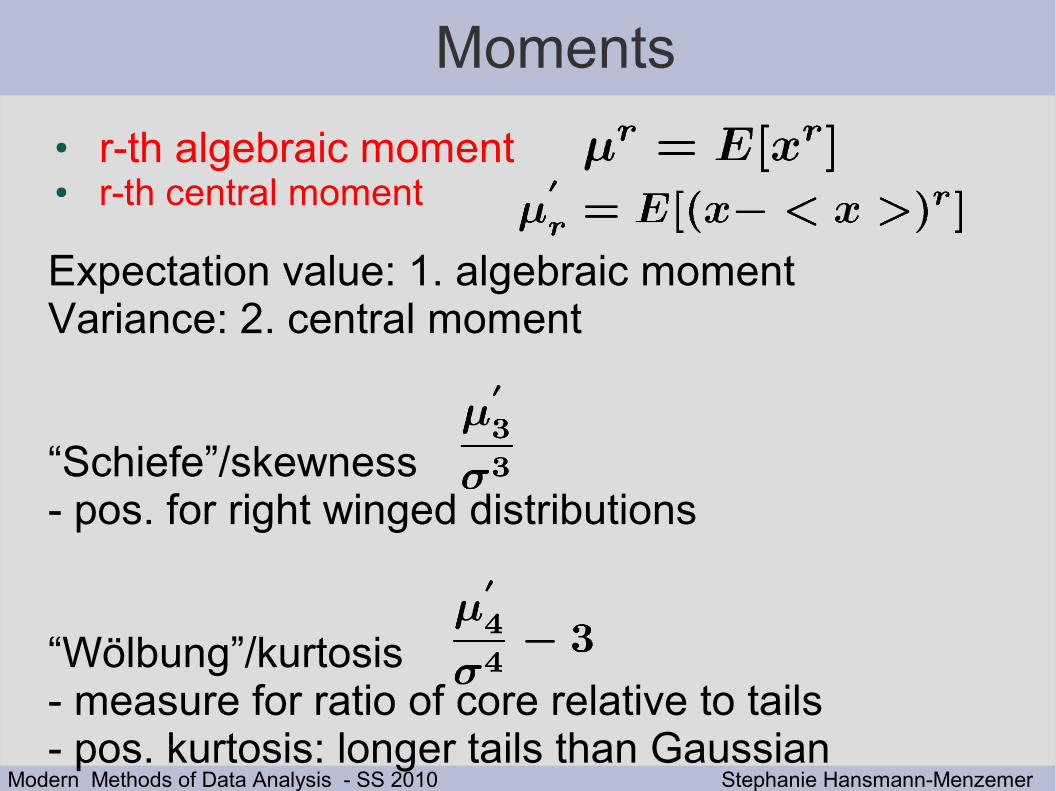
Moments
● r-th algebraic moment ● r-th central moment
Expectation value: 1. algebraic momentVariance: 2. central moment
“Schiefe”/skewness- pos. for right winged distributions
“Wölbung”/kurtosis- measure for ratio of core relative to tails- pos. kurtosis: longer tails than Gaussian
Modern Methods of Data Analysis - SS 2010 Stephanie Hansmann-Menzemer
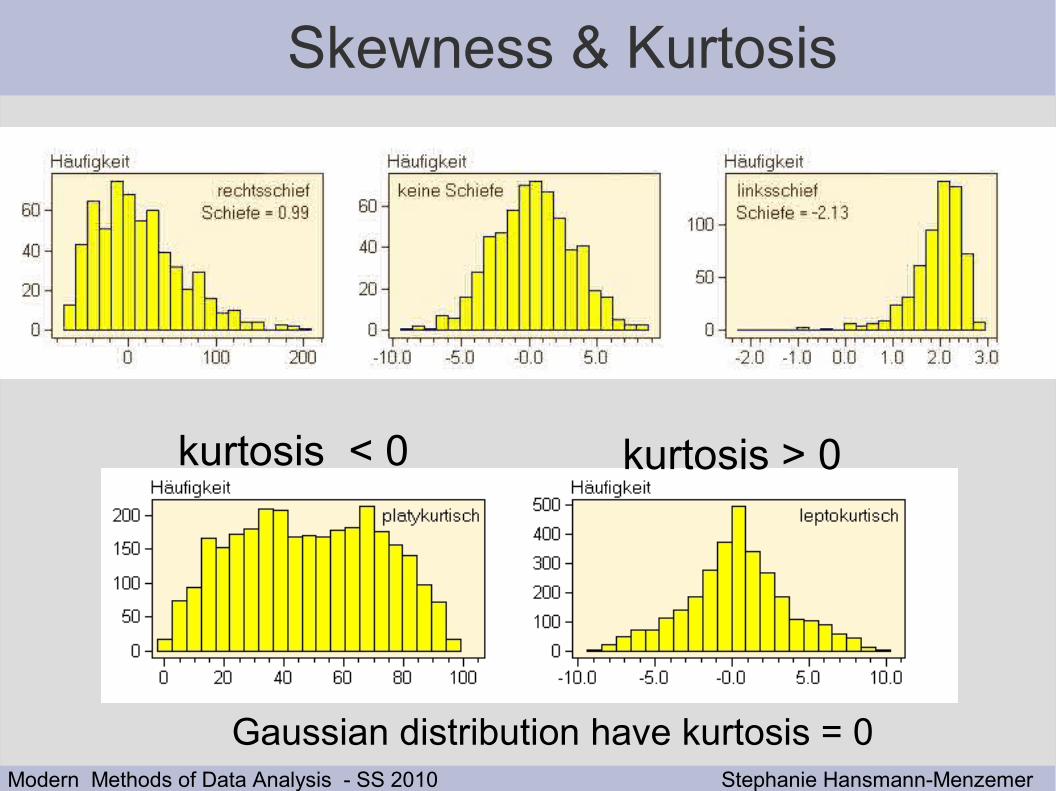
Skewness & Kurtosis
kurtosis < 0 kurtosis > 0
Gaussian distribution have kurtosis = 0

Modern Methods of Data Analysis - SS 2010 Stephanie Hansmann-Menzemer
Which fraction of events is within 1,2,3 σ
4σ3σ
1σ
2σ
This is only true for Gaussian distributions!
Modern Methods of Data Analysis - SS 2010 Stephanie Hansmann-Menzemer
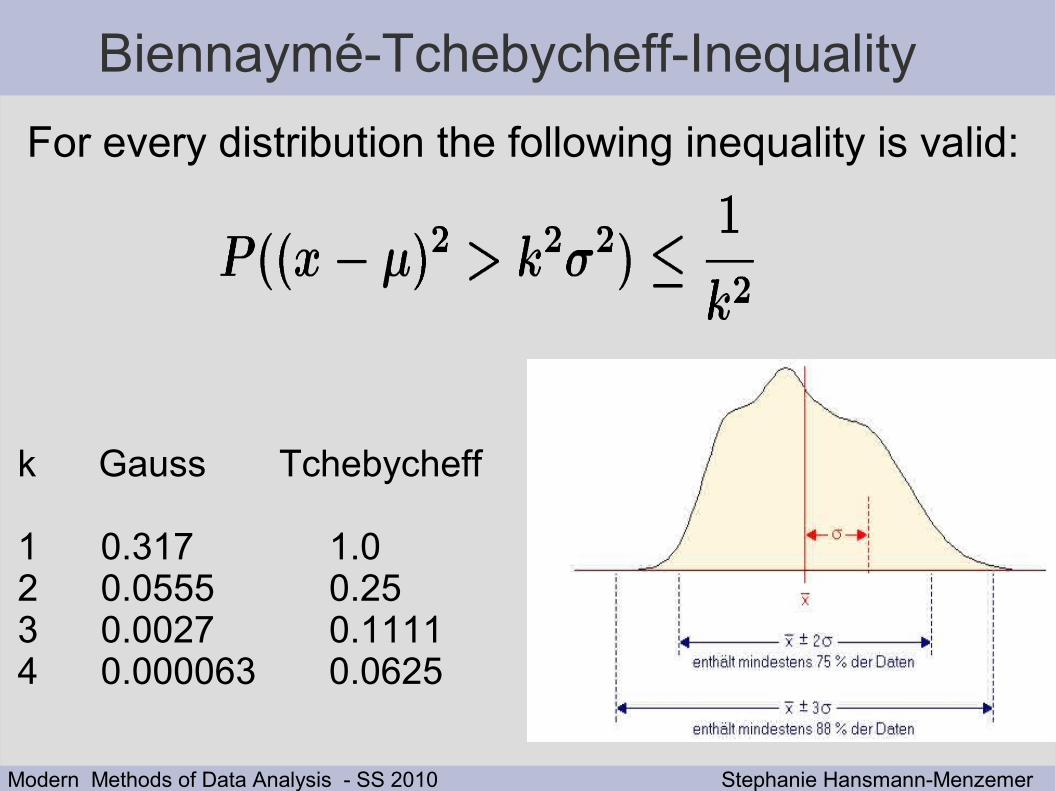
Biennaymé-Tchebycheff-Inequality
For every distribution the following inequality is valid:
k Gauss Tchebycheff
1 0.317 1.02 0.0555 0.253 0.0027 0.11114 0.000063 0.0625

Modern Methods of Data Analysis - SS 2010 Stephanie Hansmann-Menzemer
Solution: Biennaymé-Tchebycheff-Inequality
Given a PDF f(x) and a function positive w(x)≥0:
with :

Modern Methods of Data Analysis - SS 2010 Stephanie Hansmann-Menzemer
Two Dimensional Distributions
● box plot● lego plot● surface plot● numbers● scatter plot● color map● contour plot● ...
Multiple ways to visualize 2-dim distributions

Modern Methods of Data Analysis - SS 2010 Stephanie Hansmann-Menzemer
Two dimensional Distributions
● straight generalization of 1-dim PDFs
A 2-dim PDF is a function f(x,y)≥0 with
Modern Methods of Data Analysis - SS 2010 Stephanie Hansmann-Menzemer
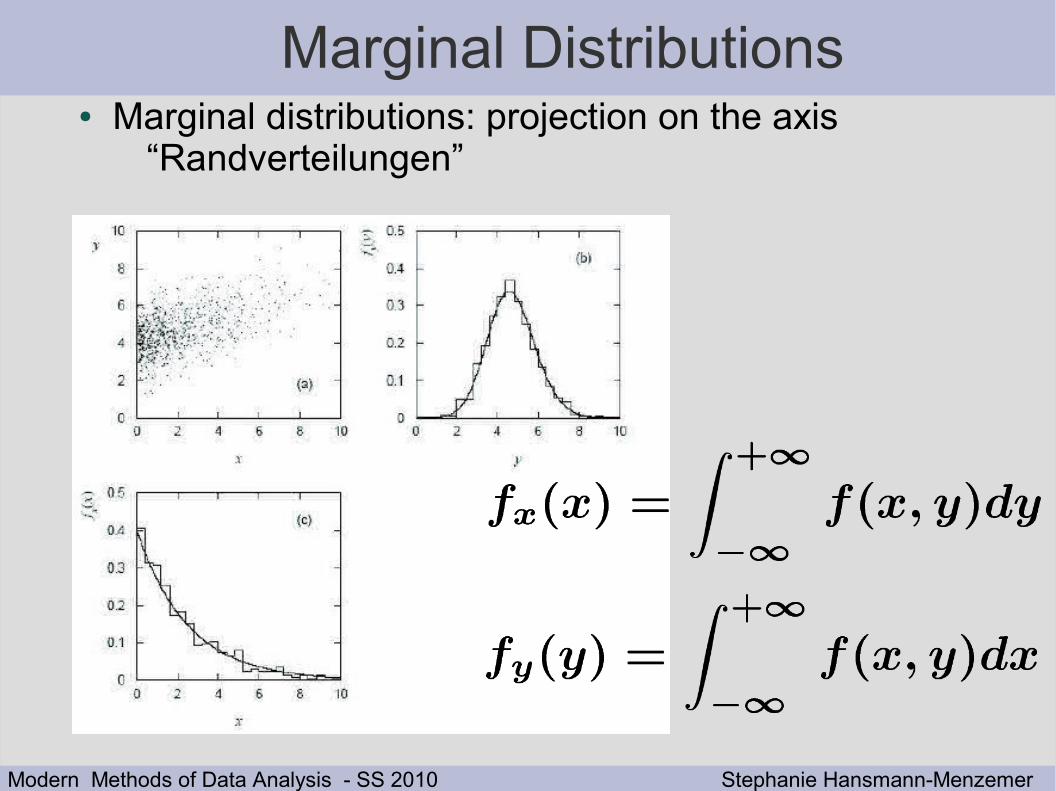
Marginal Distributions● Marginal distributions: projection on the axis
“Randverteilungen”

Modern Methods of Data Analysis - SS 2010 Stephanie Hansmann-Menzemer
Conditional Probability ●

Modern Methods of Data Analysis - SS 2010 Stephanie Hansmann-Menzemer
Exercise:
●
● Compute
● Compute