modern sea piracy - hb.diva-portal.org
TRANSCRIPT
This thesis comprises 15 ECTS credits and is a compulsory part in the Master of Science Major in Industrial Engineering-Logistics Management, 60 ECTS credits
No. 13/2011
Page | i
Modern Sea piracy Modus operandi and economical and development state
backgrounds
Farzad Jannati1 and Mahdi Salimi
2
1. MSc student in industrial engineering/logistics management, School of Engineering, University of Borås, E-mail: [email protected]
2. MSc student in industrial engineering/logistics management, School of Engineering, University of Borås, E-mail: [email protected]
October 2011
Examiner: Daniel Ekwall

Sea piracy University of Borås, Sweden
Farzad Jannati October 2011 Mahdi Salimi
Page | ii
Sea Piracy – Modern modus operandi and zone ranking
Farzad Jannati: [email protected]
Mahdi Salimi, [email protected]
Master thesis
Subject Category: Technology
University College of Borås
School of Engineering
SE-501 90 BORÅS
Telephone +46 033 435 4657
Examiner: Dr Daniel Ekwall
[email protected], +46 33 435 4657
Date: 2011
Keywords: Sea piracy, sea transportation, International Maritime Organization
(IMO), Somalia and East Africa piracy, piracy parameters and
development factors

Sea piracy University of Borås, Sweden
Farzad Jannati October 2011 Mahdi Salimi
Page | iii
Dedication
To pirates of our hearts
Mahtab and Artin, Sahand and Soren (Sören)
Angels
Mahsa Faranak
Goddesses
Ali and Mahin Hossein and Safiieh

Sea piracy University of Borås, Sweden
Farzad Jannati October 2011 Mahdi Salimi
Page | iv
Foreword
At the end of this project, yet we are thinking that we are at the beginning of understanding of the sea piracy: a highly complicated, multidisciplinary and illusive. When we read, watched or heard something related to the piracy we convinced ourselves that we knew everything. However, in the digesting era of newly learned concept we usually came up with another point of view, illustrating another aspect supplementary or in contradiction with the previous. Although it was a long journey, sea piracy converted us to be its lovers as we could communicate with its different aspects. It was something adventurous as its multidisciplinary nature had us to have a look into many issues no matter it was related to our project or not. However, this subjective behavior was not free of charge! The challenge of putting it in the boundaries of research question was a troublesome but highly fruitful. As the science has penetrated to the minds of humankind within generations and one cannot quarrel against the nature. Here, what we could do was putting facts together made doubts and looked for other supports; even if they were not in agree with each other. It is in the contrasting of different ideas that the reader can make his/her decision to reject, follow, be in between, or give his contributions and we did so.
Acknowledgments Being one- year- program, Logistics Management in Borås University was really an informative program with wonderful courses and innovative teachers in 2011. We appreciate Agnes Andersson, Bo Månsson, for their Logistics support systems, Professor Dag Ericsson for his Value chain management and finally, Professor Kenth Lumsden for the invaluable course in Logistics and Transportation Economy. It seemed attractive when Dr. Daniel Ekwall introduced sea piracy among other subjects. Thank you Daniel.
Farzad Jannati Mahdi Salimi

Sea piracy University of Borås, Sweden
Farzad Jannati October 2011 Mahdi Salimi
Page | v
Abbreviations
Abbreviation Stands for
DWT Death Weight Ton
GDP Gross Domestic Product
GNI: Gross National Income
GNI per capita: GNI per person, GNI divided by the population
ICC: International Chamber of Commerce
IMB: International Maritime Bureau
IMO: International Maritime Organization
NATO: North Atlantic Treaty Organization
OECD: Organization for Economical and Commercial Development
TI: Transparency Index
UNESCO: United Nations Educational, Scientific, and Cultural Organization
Definitions- Geographic1
Region Description
Arab world: 22 Arabic speaking countries including Somalia
Arabian Peninsula
The largest peninsula in the world including countries located in south of Persian Gulf, Oman, Yemen and Saudi Arabia.
Arabian Sea
A part of Indian Ocean that from the north ended to Iran, Pakistan, from the East to India and the south line is between Cape Guardafui in the eastern edge of Horn of Africa (north eastern of Somali) and Kankumari of India (the most southern port of India)
Bab-el-Mandeb: Passage between Red Sea and Gulf of Aden
Gulf of Aden Sea between Bab-el-Mandeb, Somalia Yemen and Arabian Sea
Horn of Africa Djibouti, Sudan, Somalia, Eritrea, Kenya,
Indian Ocean Ocean between Antarctic from the south, from the east to west Australia East of Africa and from the north to South China Sea
1 Sources: World Geography (2011) , National Geography (2011) and World Bank (2011)

Sea piracy University of Borås, Sweden
Farzad Jannati October 2011 Mahdi Salimi
Page | vi
Least developed countries
According to UN classification, it includes the 49 most under developed countries and Somalia together with all Horn of Africa is among them.
Malacca Strait: Connecting water passage, approximately 1000 km, between South China Sea and Indian Ocean, namely between West Malaysia and Indonesia, it was used to be the most important commercial path between far east and west as far as Venice, Italy. A search in the National Geography gave 64 results all in combination with pirates on 2011-07-06.
OECD countries A group of UN defined countries including 33 most developed countries of the world, (World Bank 2011).
Oman Sea: A Sea between Hormoz Strait in the west, Iran and Pakistan in the north, India in the east, Arabian Sea and Oman in the south.
Peninsula: a big land surrounded the most by sea and from one side to another land
Red sea: Sea between Suez Canal and Bab-el-Mandeb
Somali: Geographically it is located in the East of Africa and in a strategic part of it, in the edge of Horn of Africa. It is one of the Arab world and Sub-Saharan countries. There was no stable government within the last two decades after it civil war and involved in many challenges in the region, (CIA 2011), and had the most corrupted government in the world, (TI 2010). Nowadays its people challenge with drought and hunger. It has long coast lines in the East Africa that has troubled the ships within the late 2000s.
Suez Canal A strategic water canal that connects Red sea to Mediterranean Sea, in another way, Europe to Asia. Each year around 20000 ships passing this canal, (Kraska and Wilson 2009), transport around 90% of commercial commodities between Europe and Asia, (Karjel 2009), 14% of world trade and 26% of oil export, (Kamola 2009).
Definitions- IMO
Expression Description
Anchor When the ship decides to stay in a place, usually outside of the port areas either in territorial or in international waters, that is vulnerable to risks like pirate attacks, although they can save money by not paying to ports, but deprive themselves from security services they could get from the ports.
Attempt It is an incident that the pirates could not succeed to get onboard.
Committed According to IMO, getting on board and hijacking are classified as committed.
Death weight ton It is the difference of the weight of a ship when it is completely empty and when it is full of cargo, fuel supplies, crew and passengers, (Rowlett 2001).
Sea piracy University of Borås, Sweden
Farzad Jannati October 2011 Mahdi Salimi
Page | vii
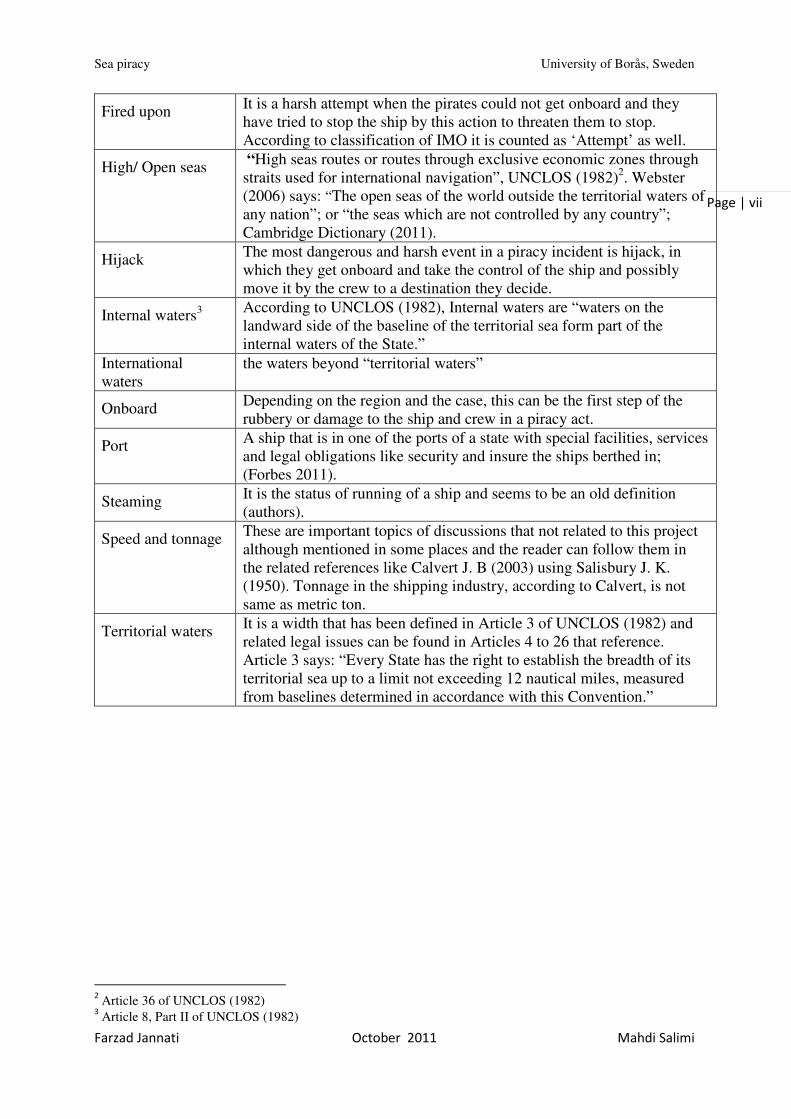
Fired upon It is a harsh attempt when the pirates could not get onboard and they have tried to stop the ship by this action to threaten them to stop. According to classification of IMO it is counted as ‘Attempt’ as well.
High/ Open seas “High seas routes or routes through exclusive economic zones through straits used for international navigation”, UNCLOS (1982)2. Webster (2006) says: “The open seas of the world outside the territorial waters of any nation”; or “the seas which are not controlled by any country”; Cambridge Dictionary (2011).
Hijack The most dangerous and harsh event in a piracy incident is hijack, in which they get onboard and take the control of the ship and possibly move it by the crew to a destination they decide.
Internal waters3 According to UNCLOS (1982), Internal waters are “waters on the landward side of the baseline of the territorial sea form part of the internal waters of the State.”
International waters
the waters beyond “territorial waters”
Onboard Depending on the region and the case, this can be the first step of the rubbery or damage to the ship and crew in a piracy act.
Port A ship that is in one of the ports of a state with special facilities, services and legal obligations like security and insure the ships berthed in; (Forbes 2011).
Steaming It is the status of running of a ship and seems to be an old definition (authors).
Speed and tonnage These are important topics of discussions that not related to this project although mentioned in some places and the reader can follow them in the related references like Calvert J. B (2003) using Salisbury J. K. (1950). Tonnage in the shipping industry, according to Calvert, is not same as metric ton.
Territorial waters It is a width that has been defined in Article 3 of UNCLOS (1982) and related legal issues can be found in Articles 4 to 26 that reference. Article 3 says: “Every State has the right to establish the breadth of its territorial sea up to a limit not exceeding 12 nautical miles, measured from baselines determined in accordance with this Convention.”
2 Article 36 of UNCLOS (1982)
3 Article 8, Part II of UNCLOS (1982)

Sea piracy University of Borås, Sweden
Farzad Jannati October 2011 Mahdi Salimi
Page | viii
Piracy definition4 “Piracy consists of any of the following acts: a) Any illegal acts of violence or detention, or any act of
depredation, committed for private ends by the crew or the passengers of a private ship or a private aircraft, and directed:
i. on the high seas, against another ship or aircraft, or against persons or property on board such ship or aircraft;
ii. against a ship, aircraft, persons or property in a place outside the jurisdiction of any State;
b) Any act of voluntary participation in the operation of a ship or of an aircraft with knowledge of facts making it a pirate ship or aircraft;
c) Any act inciting or of intentionally facilitating an act described in sub-paragraph (a) or (b)."
Armed robbery against ships5
“means any of the following acts: a) any illegal act of violence or detention or any act of
depredation, or threat thereof, other than an act of piracy, committed for private ends and directed against a ship or against persons or property on board such a ship, within a State's internal waters, archipelagic waters and territorial sea;
b) Any act of inciting or of intentionally facilitating an act described above".
4 Source:1982 United Nations Convention on the Law of the Sea (UNCLOS) (article 101)
5 Source: the Code of Practice for the Investigation of the Crimes of Piracy and Armed Robbery Against Ships
(resolution A.1025(26), Annex, paragraph 2.2)

Sea piracy University of Borås, Sweden
Farzad Jannati October 2011 Mahdi Salimi
Page | ix
Preface
The more sea piracy was investigated the more it was understood that it would be a highly multidisciplinary and complicated. In the sea piracy, transparency index or equivalently corruption of the country’s government, economical, cultural, historical, globalization, and many other factors can be discussed. The authors not only have investigated the way the pirates do their attacks in the sea, but also studied some of the mentioned groups of factors. However, many missing links of the project are who were the land pirates? Who were the beneficiaries or losers of this act? Moreover, how eliminate this act? In this project, after historical briefing of the piracy, chapter one has started the project by some examples of the real piracy events that has happened in the last decade. Sea transportation as an inevitable channel of conveying the material and merchandise and many other activities done in the sea was followed. Sea piracy definition and objectives of the project are the last sections in the chapter. Second chapter has outlined the methodology of the project that has approached to achieve its goals. The third chapter devoted to scrutinize in the sea piracy reports within 1998-2010. These reports were chosen from the website of the International Maritime Organization (IMO). Indeed, the chapter started by the introduction of IMO, its duties and addressed the reports used. Different variations as timely, geographically, equipment wise, behavior, consequences, ship type and tonnage were analyzed and discussed. Furthermore, it has proceeded with monthly reports of piracy incidents in 2009 to study variations of more factors the over the year. In the fourth chapter, a supportive literature review was done to illustrate some dark sides of the phenomenon. The ideas from valid sources were chosen and set as facts with a primary analysis and discussion in the chapter. A survey on economical, social and governmental characteristics of some relevant countries was done and seen in the chapter.
A supplementary chapter as 4A was outlined to complete the process of understanding the modern sea piracy. Learning from chapter three and four, Somalia was focused and introduced in brief there from the state and sea piracy point of views.
Chapter five is the arena for final analyses and discussion. In that chapter all the findings about phenomenon has been utilized to draw a framework of understanding of the authors and a little on the possible causes of the sea piracy. Comments and critiques on the IMO reports are other important issues that was discussed. We have concluded in this chapter as a summary of all the process of project.

Sea piracy University of Borås, Sweden
Farzad Jannati October 2011 Mahdi Salimi
Page | x
Abstract
Purpose - The objective of this study is to enhance the understanding of modus operandi of modern sea piracy by data existed in the relevant sources. A simple framework of understating the subject is brought as the authors’ contribution. Design/methodology/approach – Analysis was done through constructing a database according to sea piracy reports of International Maritime Organization (IMO) website. It has continued by investigating in some of the economical, social and other parameters of some countries with coastlines. In the end, it has introduced a framework of understanding of the modern sea piracy.
Findings – Piracy has a long history, as an easy way of achieving commodities. In the last decade, there was an outbreak trend in East Africa region emerging Somalia pirates. In the beginning of 2000s, there were South China Sea and Malacca Straits regions that were the important arena of pirates. Besides a weak and powerless government, bad economical situation, the main issue in East Africa piracy was the volume of the commodities that was (and is) transported via coasts of Horn of Africa. Practical implications- In this study, two research questions were followed: how the piracy attacks have been done and observing how some related countries look like. Research limitations/implications – Being a literature review, this thesis project is not responsible for the correctness of the sources and not by any means if a company or an organization uses its results or recommendations. Originality/value –Using valid sources, it is a unique work of authors; not manipulating others’ work; that has investigated those reports and addressed supplementary points that enhance the understanding of the modus operandi and some state backgrounds of sea pirates in 2000s. Paper type – Case study / literature review
Key words: Sea piracy, sea transportation, International Maritime Organization (IMO), Somalia and East Africa piracy, piracy parameters and development factors

Sea piracy University of Borås, Sweden
Farzad Jannati October 2011 Mahdi Salimi
Page | xi
Table of Contents
Foreword ................................................................................................................................................ iv
Abbreviations .......................................................................................................................................... v
Definitions- Geographic .......................................................................................................................... v
Definitions- IMO .................................................................................................................................... vi
Piracy definition ................................................................................................................................... viii
Armed robbery against ships ................................................................................................................ viii
Preface .................................................................................................................................................... ix
Abstract ................................................................................................................................................... x
1 Introduction .................................................................................................................................. 1-1
1.1 History of piracy ................................................................................................................... 1-1
1.2 Background .......................................................................................................................... 1-1
1.3 Sea transportation ................................................................................................................. 1-2
1.4 Sea piracy ............................................................................................................................. 1-3
1.5 Objectives ............................................................................................................................. 1-3
2 Methodology ................................................................................................................................ 2-4
3 IMO sea piracy Reports and Preliminary Analysis ...................................................................... 3-5
3.1 IMO - the International Maritime Organization ................................................................... 3-5
3.1.1 IMO Piracy Reports ...................................................................................................... 3-5
3.2 Global Sea Piracy Trend ....................................................................................................... 3-6
3.3 Local Sea Piracy Trend ........................................................................................................ 3-6
3.3.1 Piracy Trend in Hot Zones ........................................................................................... 3-7
3.3.2 Cumulative Piracy Trend in Hot Zones: ....................................................................... 3-8
3.4 Attacker Numbers................................................................................................................. 3-9
3.4.1 Global Piracy-Attacker Status ...................................................................................... 3-9
3.4.2 Attacker numbers in hot zones ................................................................................... 3-10
3.5 Ship Location ..................................................................................................................... 3-12
3.5.1 Global Ship Location .................................................................................................. 3-12
3.5.2 Hot Zones and piracy in different locations ............................................................... 3-13
3.6 Ship status .......................................................................................................................... 3-14
3.6.1 Global Status – Ship Status ........................................................................................ 3-14
3.6.2 Ship Status – Local Trend .......................................................................................... 3-15
3.7 Weapon status..................................................................................................................... 3-17
3.7.1 Weapon and Global Piracy ......................................................................................... 3-17
3.7.2 Weapon trend in hot zones: ........................................................................................ 3-18

Sea piracy University of Borås, Sweden
Farzad Jannati October 2011 Mahdi Salimi
Page | xii
3.8 Pirates’ success status: ........................................................................................................ 3-20
3.8.1 Success and Global Piracy.......................................................................................... 3-20
3.8.2 Local Success Status .................................................................................................. 3-21
3.9 Consequences ..................................................................................................................... 3-23
3.9.1 Consequences-Global Piracy ...................................................................................... 3-23
3.9.2 Consequences in hot zones ......................................................................................... 3-24
3.10 Sea Piracy - Monthly Trend ............................................................................................... 3-25
3.10.1 Global Piracy- 2009 Monthly Trend .......................................................................... 3-25
3.10.2 Piracy Monthly trend in Hot Zones – 2009: ............................................................... 3-26
3.11 Ship types attacked ............................................................................................................. 3-26
3.11.1 Ship Types were attacked – Global Piracy (2009) ..................................................... 3-26
3.11.2 Ship Types Status in Hot Zones ................................................................................. 3-27
3.12 Ship Capacity ..................................................................................................................... 3-28
4 Literature review ........................................................................................................................ 4-30
4.1 Study Elements ................................................................................................................... 4-30
4.2 Population Clusters............................................................................................................. 4-31
4.2.1 Population ................................................................................................................... 4-32
4.2.2 Population pyramid .................................................................................................... 4-33
Population Clusters – concluding discussion ................................................................................. 4-34
4.3 Development features ......................................................................................................... 4-34
4.3.1 Employment issues ..................................................................................................... 4-35
4.3.2 Literacy ....................................................................................................................... 4-36
4.3.3 Life expectancy .......................................................................................................... 4-37
4.3.4 Urban and rural development ..................................................................................... 4-37
4.3.5 Child mortality ........................................................................................................... 4-37
4.3.6 Poverty........................................................................................................................ 4-37
Development Features - Conclusion .............................................................................................. 4-38
4.4 Economical Features .......................................................................................................... 4-39
4.4.1 Gross National Income (GNI) .................................................................................... 4-39
4.4.2 GNI per capita ............................................................................................................ 4-39
4.4.3 Transparency Index (TI) ............................................................................................. 4-40
4.5 Length of coast lines ........................................................................................................... 4-41
4.6 Ship traffic .......................................................................................................................... 4-41
Economical and length of coastline Features – Concluding discussion ......................................... 4-42
A little more of Somalia ..................................................................................................................... 4-43
Somalia ........................................................................................................................................... 4-43

Sea piracy University of Borås, Sweden
Farzad Jannati October 2011 Mahdi Salimi
Page | xiii
Somali piracy .................................................................................................................................. 4-43
Combat against Somali piracy ........................................................................................................ 4-45
5 Final Analysis, discussion and conclusion ................................................................................. 5-46
5.1 Project up to now ................................................................................................................ 5-46
5.2 Sea piracy and its parameters: ............................................................................................ 5-46
5.2.1 Global Sea Piracy ....................................................................................................... 5-46
5.2.2 Piracy in hot zones and its parameters ....................................................................... 5-47
5.2.3 Critiques and comments on IMO reports of piracy incidents ..................................... 5-48
5.3 Connection of piracy with different factors ........................................................................ 5-50
5.3.1 Critiques of studies in chapter four ............................................................................ 5-52
5.4 Somalia ............................................................................................................................... 5-53
5.5 Framework ......................................................................................................................... 5-53
5.6 Generalization .................................................................................................................... 5-54
6 Conclusion .................................................................................................................................. 6-56
7 Future Study ............................................................................................................................... 7-57
References ................................................................................................................................................ a
List of Figures ......................................................................................................................................... d
List of Tables ............................................................................................................................................ e
Farzad Jannati October 2011 Mahdi Salimi
Page | 1-1
Chapter 1
1 Introduction
n this chapter, the project is started by some examples of the real piracy incidents that have been happened in the last decade. Sea transportation as an inevitable channel of
conveying the material and merchandise and many other activities done in the sea is followed. Sea piracy definition and objectives of the project are the last sections in the chapter. Sections of this chapter are:
• History of Piracy • Background • Sea transportation • Sea piracy • Objectives of the project
1.1 History of piracy
Around 2000 years ago piracy emerged by attacking the first pirates to the Roman vessels in the commercial routes of ancient Greece. Centuries later, Vikings were their followers attacking running and berthed ships in the ports. The so called “the golden age of piracy” was between 1620 and 1720. It was during sixteenth and nineteenth centuries that various types of pirates like privateers emerged. “letters of marquee” authorized these to attack the ships of enemy and share the benefit with the government, (Royal Naval Museum Library 2002 and Pike 2006). Francis Drake, the most famous privateer in England, attacked the Spanish ships and shared the earnings with Elizabeth I. Buccaneers were another type of pirates worked in Caribbean attacking Spanish ships. Having religious base and acquiring their authorization from their government, Corsairs, on the other hand, were active in Mediterranean Sea and attacked to the ships of countries of enemies within sixteenth and nineteenth centuries, (Royal Naval Museum Library 2002). 1.2 Background
SIRIUS STAR, a Liberian flagged oil tanker, transporting Saudi Arabia oil to United States, with gross tonnage more than 162000, was hijacked in the East Africa on 15 Nov 2008, (IMO 2009, MSC.4/Circ.135 and 128). LE CONG, a general cargo ship with china’s flag, was attacked on November 18th 2010 by pirates armed with guns and ‘rocket propelled grenades’. One crewmember was injured but they could manage by evasive maneuvers and rescued from harsh consequences of this attack.
Four pirates chased PISTIS, with a tonnage of approx. 40.000, on a boat, in Indian Ocean, attempting to board. On time, reaction of Master could rescue the ship by increased speed and the pirates run away. These are two samples of IMO report on piracy against ships in November 2010 that has reported 37 attacks, 1.2 attacks per day.
I

Sea piracy University of Borås, Sweden
Farzad Jannati October 2011 Mahdi Salimi
Page | 1-2
Ban Ki-moon, UN Secretary-General, emphasizing on urgent response, denoted the phenomenon as “completely unacceptable” when he was talking in the IMO’s London Headquarters on 3 February 2011. He considered the solution with the strategy of development, governance of law security and avoidance and emphasized on the sustainability of response to piracy. He had emphasized on the root causes of the problem in the land in spite of its revealing arena that occurs in sea. Independent of its causes, piracy is a criminal act that is run in "economic hardship" and thrives with the lack of effective legal actions. His idea the economic hardship as the initiation driver of sea piracy is a motivation to discuss some economic and development factors of societies as well. Piracy definitions and scope were presented on the definitions. However, for traceability, we are talking about sea piracies that annoy ships in the sea. Now, we need to know in brief the reasons we do use of the sea as a transportation channel. 1.3 Sea transportation
Admiral Mark Stanhope in the introduction of Lloyd’s MIU Handbook of Maritime Security (2009) emphasizing on the inevitability of sea transportation and trade in the globalization, counted maritime security as crucial importance to the business and governments. Offences like sea piracy have awakened the interested parties. Around 71% of surface of our planet is covered by water of which 65% is oceans, (Pidwirny 2010). In the era of globalized economy, as a consensus among authors, sea transportation is inevitable. Moreover, it is the most economical and environmental friendly way of transportation; (Lumsden 2011). Other drivers reveal its importance and existence.
• Being source of food, sea has been the arena of fishing, shipping, and ship producing industry.
• There are millions of passengers and tourists utilize cruise ships circling around lakes, open seas, oceans and even round the globe as an adventure or any other reason every year. As an example, the number of passengers exceeded 12 million in 2006 compared with 500 thousands in 1970. This was more than 2.4 million passengers in 2007 only for Arctic destinations; (AMSA 2009).
• It is a channel to control, govern or attack to other country even in another continent. • Transportation over sea consumes less energy, and thereby the most environmental
friendly and together with other parameters the most economical way of transporting more than 80% of all commodities, products, semi-finished, sub-assembled or even raw materials worldwide; Lumsden (2011).
These are drivers, and possibly, more, that has produced the traffic of various kinds of ships from size and duty point of views all over the world seas. Vessel types can be bulk carrier, container ship, fishing, general cargo, government vessel, tanker, pleasure craft, tug, barge and many others. The capacity can go several 100’000 tones. However, some people have abused this phenomenon and became a trouble for many sea activists over the centuries that has been called ‘pirates’ and the act named as ‘sea piracy’. These people usually have been hated by most of the people and governments unless they do serve for government/s, which in that case they have been famous to ‘privateers’ or those who were/are the beneficiaries of the act.
Sea piracy University of Borås, Sweden
Farzad Jannati October 2011 Mahdi Salimi
Page | 1-3
1.4 Sea piracy
Piracy is a result of gaps of globalization due to ambiguity of authority and pirates utilize the isolated ships from any country. (Kraska and Wilson 2009). Refer to an old definition, pirates were known as hostis humani generis (≈ enemy of all mankind), (Kamola 2009). According to a general knowledge, pirates were in the sea to utilize the opportunity existed out there to their own benefit to possess everything were in the ships; to take the people in the ship as hostages with potential ransom expectation, to take the control of the ship as ransom expectation as well or their own future use, to benefit of any money possibility that can be existed in it. On the other hand, there were groups of crew that have been employed by the governments to assist in attacking the ships and ports of their enemies. Sir Francis Drake, Captain Cook and Henry Morgan were of those who assisted England to conquer Spain; (Pike 2006). History of piracy and privateers is full of events and actions that look interesting to read. For the purpose of this project, those incidents mentioned in the IMO reports as pirate attacks were taken to the account and the investigation built upon them. 1.5 Objectives
In this project, sea piracy, as one of the international threats of the logistics and transportation has been investigated. Modus operandi of a modern piracy and the most dangerous piracy zone has been depicted as well by the relevant characteristics. Some supplementary articles and valid documents were used to support some notions related to the purpose. The basic research questions for the project are:
1- Modus operandi of sea piracy within 1998-2010 2- To examine some social and economical parameters of the states that piracy incidents
have happened around those countries in 2010.
By understanding different circumstances of the piracy phenomenon, a framework of sea piracy is introduced in chapter 5.

Sea piracy University of Borås, Sweden
Farzad Jannati October 2011 Mahdi Salimi
Page | 2-4
Chapter 2
2 Methodology
his chapter introduces the methodology and a list of obtained outcomes in the end. For the purpose of this project, after doing a primary study on the thousands of IMO
circulars, the authors chose circulars of MSC4 that were focused on the sea piracy and selected the annual reports within 1998-2010 and monthlies of 2009 to develop a database of modern sea piracy. First part of the study, chapter three, was according to the analyses from the database. By the study conducted in chapter four, we went deep inside the state development factors to learn if there were any backgrounds in the states that could cause initiation of such phenomena. Thanks to invaluable databases like World Bank, Transparency Index and CIA that enlightened and served the project adequately that facilitated the review and analyses of the chapter four. Learning the hottest modern piracy zone from chapter three, East Africa, continuing in state factors to follow degree of development of the highest modern piracy stricken country led us to scrutinize a country named Somalia in chapter 4 A. The methodology of the project is illustrated in Figure 1.5-1 as well. To simplify, in general, three interdependent clusters of facts and factors were studied as:
• Apparent facts of piracy incidents according to IMO; • Socio-economical and other development factors of the states ; • Studying the modern king of pirates.
So, this project has not introduced any theory, formula or concept. It has utilized the existed literature and data to increase understanding of the modern sea piracy.
Figure 1.5-1: Methodology of the project
Analysis of
Piracy facts
Source:
IMO
Evolution of modern
piracy
Modus operandi of
modern piracy
The hot and hottest
piracy zones/zone
Analysis of state factors
Sources :
World Bank, CIA …
Study of Somalia:
• Degree of development
• Modus operandi of
Somalia sea piracy
Goal of the project:
Enhance the understanding of modern sea piracy
T
Sea piracy University of Borås, Sweden
Farzad Jannati October 2011 Mahdi Salimi
Page | 3-5
Chapter 3
3 IMO sea piracy Reports and Preliminary Analysis
like any event, the modern sea piracy as one the important event in 21st century which make more than billions of dollars of loss in year to global and local
transportation system (IMO, 2011), has its own characteristics and parameters. By studying the relevant parameters, one can have a clear view from modern sea piracy; and governmental and international societies can have a better and less controversial confronting strategy/method against this important issue in global trade. In this chapter, after introducing the IMO and its piracy reports’ frames, the sea piracy is reviewed and analyzed based on the IMO piracy reports.
3.1 IMO - the International Maritime Organization
According to the high variety of different raw material and final products in different continents and considering the continents locations, more than 90% of global trades are carried and shipped through sea transportation. Ships of each countries move between different locations and spend their most of times on the seas and different jurisdictions. Unifying the shipping rules to prevent any unwanted problem and any chaos, it was needed an international standard and rules which can be accepted by all to be followed by ships. According to IMO, The first maritime treaties were prepared on 19th century and then considering the Titanic disaster on 1912, the first international safety of life at sea (SOLAS) were prepared. To develop and to promote the safety at the sea, some countries proposed an international organization should be established to follow and supervise in this regard. Refer to IMO web site, based on an international conference in Geneva in 1948 the IMO organization was established to be responsible for the safety and security of shipping and preventing of marine pollution by ships. It should be noted this organization was named” Inter-Governmental Maritime Consultative Organization (IMCO)” but in 1982 it renamed to existing name. 3.1.1 IMO Piracy Reports
There are 42 Different report titles in the IMO website. Each title points to different safety and security aspects of sea piracy. There are different reports, procedures and safety manuals in each title. The numbers of contents of each title vary from 1 to 300. To analyze the sea piracy and its parameters (globally and locally) the IMO annual reports (1998 to 2010) and monthly reports (2009) which are available on, http://www.imo.org/OurWork/Circulars/Pages/Home.aspx have been reviewed and all records were entered to an unique database via Microsoft excel to perform the prescribed analysis. It should be noted there are some contradiction in IMO piracy reports. For example, different number of annual sea piracy is achieved considering different parameters on the same year or when the monthly report is summarized to annual report the result in some cases is differ from annual report. As being certain of data accuracy is an important issue in the analysis and
A

Sea piracy University of Borås, Sweden
Farzad Jannati October 2011 Mahdi Salimi
Page | 3-6
conclusion, the reader is invited to see the comments to IMO data gathering and presentation in chapter 5. 3.2 Global Sea Piracy Trend
The first and the most important subject in sea piracy is its global and local trend. How is global piracy trend? In which zones pirates attacked the ships? Answer to these two simple and general questions clear the general piracy situation. Based on the IMO annual report (from 1998 to 2010) the global piracy trend is as Figure 3.2-1:
Figure 3.2-1: Global Piracy Trend
Refer to the above graph the following subjects can be concluded:
a) 2010 had the maximum piracy for 489 in studying period; b) 1998 had the minimum piracy for 210 in studying period; c) The Average piracy in studying period was 346.9 per year; d) Trend classification:
i. 1998 to 2000: An increasing trend for 124% (from 210 to 471); ii. 2001 to 2003: No specific trend;
iii. 2003 to 2006: Decreasing trend, for 54% (from 442 to 240); iv. 2006 to 2010: Increasing trend for 104% (from 240 to 489);
It should be noted the real trend could be calculated by comparison of piracies with total volume of ships, which were on the routs. But, as the IMO reports include only the piracy data, the piracy trend is calculated using annual piracy reports. 3.3 Local Sea Piracy Trend
As it was told before, about 71% of the earth is water and more than 80% of all consignments are transported by the sea. The piracy trend in different zones is one of the most important subjects in sea piracy. The annual IMO piracy reports points to 18 different zones in studying period (1998-2010). As the zones “south America Atlantic”, ”south America Pacific” and
1998 1999 2000 2001 2002 2003 2004 2005 2006 2007 2008 2009 2010
Sum 210 309 471 370 383 442 330 266 240 282 306 406 489
% 4.7% 6.9% 10.5% 8.2% 8.5% 9.8% 7.3% 5.9% 5.3% 6.3% 6.8% 9.0% 10.9%
0
100
200
300
400
500
600
Ob
serv
ati
on
s
Global Piracy
Sea piracy University of Borås, Sweden
Farzad Jannati October 2011 Mahdi Salimi
Page | 3-7
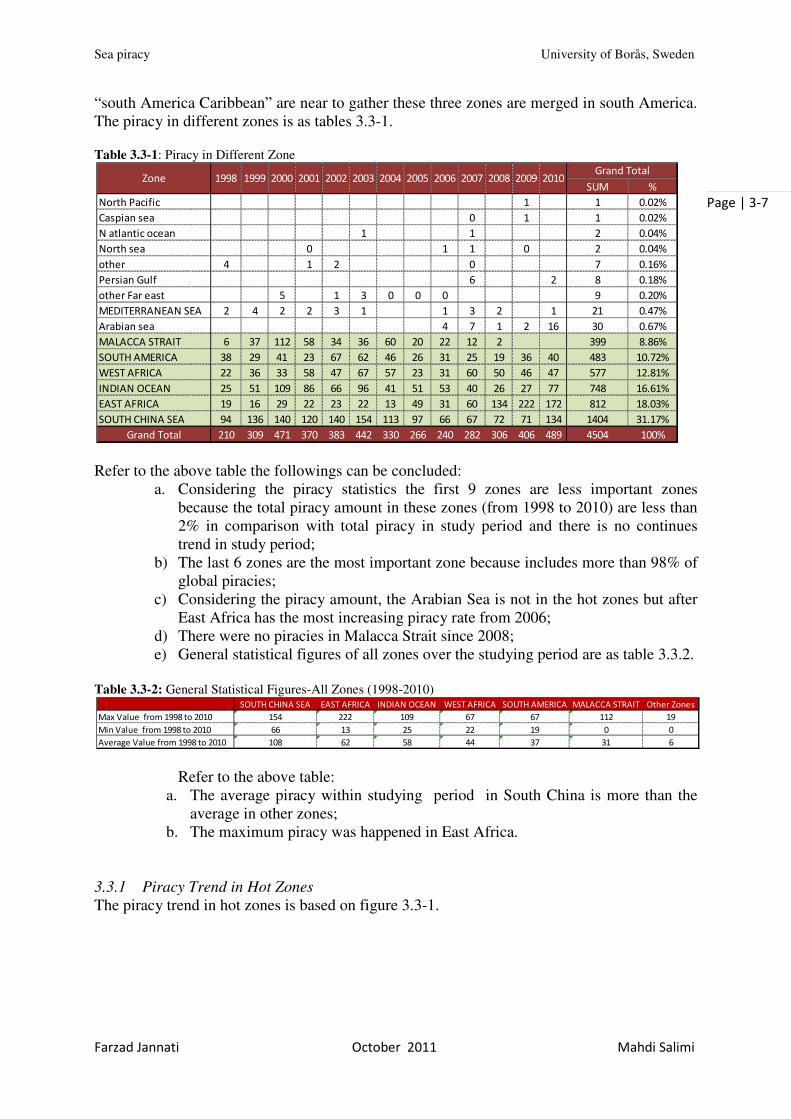
“south America Caribbean” are near to gather these three zones are merged in south America. The piracy in different zones is as tables 3.3-1. Table 3.3-1: Piracy in Different Zone
Refer to the above table the followings can be concluded:
a. Considering the piracy statistics the first 9 zones are less important zones because the total piracy amount in these zones (from 1998 to 2010) are less than 2% in comparison with total piracy in study period and there is no continues trend in study period;
b) The last 6 zones are the most important zone because includes more than 98% of global piracies;
c) Considering the piracy amount, the Arabian Sea is not in the hot zones but after East Africa has the most increasing piracy rate from 2006;
d) There were no piracies in Malacca Strait since 2008; e) General statistical figures of all zones over the studying period are as table 3.3.2.
Table 3.3-2: General Statistical Figures-All Zones (1998-2010)
Refer to the above table:
a. The average piracy within studying period in South China is more than the average in other zones;
b. The maximum piracy was happened in East Africa.
3.3.1 Piracy Trend in Hot Zones
The piracy trend in hot zones is based on figure 3.3-1.
SUM %
North Pacific 1 1 0.02%
Caspian sea 0 1 1 0.02%
N atlantic ocean 1 1 2 0.04%
North sea 0 1 1 0 2 0.04%
other 4 1 2 0 7 0.16%
Persian Gulf 6 2 8 0.18%
other Far east 5 1 3 0 0 0 9 0.20%
MEDITERRANEAN SEA 2 4 2 2 3 1 1 3 2 1 21 0.47%
Arabian sea 4 7 1 2 16 30 0.67%
MALACCA STRAIT 6 37 112 58 34 36 60 20 22 12 2 399 8.86%
SOUTH AMERICA 38 29 41 23 67 62 46 26 31 25 19 36 40 483 10.72%
WEST AFRICA 22 36 33 58 47 67 57 23 31 60 50 46 47 577 12.81%
INDIAN OCEAN 25 51 109 86 66 96 41 51 53 40 26 27 77 748 16.61%
EAST AFRICA 19 16 29 22 23 22 13 49 31 60 134 222 172 812 18.03%
SOUTH CHINA SEA 94 136 140 120 140 154 113 97 66 67 72 71 134 1404 31.17%
Grand Total 210 309 471 370 383 442 330 266 240 282 306 406 489 4504 100%
2010Grand Total
Zone 2004 2005 2006 2007 2008 20091998 1999 2000 2001 2002 2003
SOUTH CHINA SEA EAST AFRICA INDIAN OCEAN WEST AFRICA SOUTH AMERICA MALACCA STRAIT Other Zones
Max Value from 1998 to 2010 154 222 109 67 67 112 19
Min Value from 1998 to 2010 66 13 25 22 19 0 0
Average Value from 1998 to 2010 108 62 58 44 37 31 6

Sea piracy University of Borås, Sweden
Farzad Jannati October 2011 Mahdi Salimi
Page | 3-8
Figure 3.3-1: Piracy Trend in Hot Zones
According to this figure: a. 1998 till 2003: South China sea has the most piracy and East Africa has the
minimum rate among other hot zones; b. 2004 till 2007: A decreasing trend is started for South China sea and east Africa
starts an increasing trend from; c. 2007 and upward: there is a considerable increasing trend for east Africa.
3.3.2 Cumulative Piracy Trend in Hot Zones:
The figure 3.3.-2 shows cumulative piracy trend during study period. This graph helps to have a more clear view regarding the hot zones.
Figure 3.3-2: Cumulative Piracy Trend
Refer to above figure and figure 3.3-1: a. South China Sea has most cumulative piracy over the studying period;
0
50
100
150
200
250
1998 1999 2000 2001 2002 2003 2004 2005 2006 2007 2008 2009 2010
Piracy Trend in Hot Zones
EAST AFRICA
INDIAN OCEAN
MALACCA STRAIT
SOUTH AMERICA
SOUTH CHINA SEA
WEST AFRICA
1998 1999 2000 2001 2002 2003 2004 2005 2006 2007 2008 2009 2010
EAST AFRICA 19 35 64 86 109 131 144 193 224 284 418 640 812
INDIAN OCEAN 25 76 185 271 337 433 474 525 578 618 644 671 748
MALACCA STRAIT 6 43 155 213 247 283 343 363 385 397 399 399 399
SOUTH AMERICA 38 67 108 131 198 260 306 332 363 388 407 443 483
SOUTH CHINA SEA 94 230 370 490 630 784 897 994 1060 1127 1199 1270 1404
WEST AFRICA 22 58 91 149 196 263 320 343 374 434 484 530 577
0
200
400
600
800
1000
1200
1400
1600
Piray in Hot Zones - Cumulative TrendPiracy in Hot Zones – Cumulative Trend

Sea piracy University of Borås, Sweden
Farzad Jannati October 2011 Mahdi Salimi
Page | 3-9
b. Before 2007, East Africa had the minimum cumulative piracy over the studying period. However, according to the accelerated increasing piracy trend after 2007, this zone is the second zone respect to the cumulative piracy over the studying period and has the most piracy amount.
To review and analyze the sea piracy there is different piracy parameters as follows should be taken under consideration:
a. The location which the ships were attacked; b. The gun types which were used by pirates; c. The consequences; d. Attacker numbers; e. Ship status when were attacked.
Each of these parameter points to specific sea piracy characteristics. These parameters will be analyzed on the next chapters. 3.4 Attacker Numbers
This parameter can show the pirates organization on the water and can talk about the pirate strategy to attack to ships. 3.4.1 Global Piracy-Attacker Status
The figure 3.4-1 shows the attacker number in global piracy.
Figure 3.4-1: Global Piracy and Attacker Numbers (1998-2010)
According to the above figure, the medium group (5≤ attacker numbers ≤10) had the highest rate in global piracy. The figure 3.4-2 shows the global distribution of attacker number on the studying period.
Attackers < 55 =< Attackers =<
10 Attackers >10
Attackers Not
stated
Sum 1064 1111 298 2044
% 23.56% 24.60% 6.60% 45.25%
0
300
600
900
1200
1500
1800
2100
Global Piracy
Attackers Number

Sea piracy University of Borås, Sweden
Farzad Jannati October 2011 Mahdi Salimi
Page | 3-10
Figure 3.4-2: Global Piracy and Attacker Numbers Trend
According to the above figure, the studying period can be divided to the following three sections respect to the attacker numbers:
a. 1998-2001: the medium group (attacker number between 5 and 10) has the most rates; b. 2002-2007: the small group (attackers less than 5) has the most rates; c. 2008-2010: the medium group has the most rate again; d. The large group (attackers more than 10) has the minimum rates over the studying
period. But has a unique increasing rate from 2007. 3.4.2 Attacker numbers in hot zones
To have a more clear view from piracy in the hot zones the attacker number trend and its statistical notes are discussed in this chapter. The global status of attacker numbers in hot zones is as table 3.4-1 in which:
a) The rate of “5=<Attackers=<10” is more than other attacker numbers in all hot zones except West Africa and South America;
b) The rate of “Attacker<5” is more the other attacker numbers in West Africa and South America.
Table 3.4-1: Global Piracy and Attacker Number Status in Hot Zones
The trend of attacker numbers in Hot Zones on the studying period is as figure 3.4-3.
1998 1999 2000 2001 2002 2003 2004 2005 2006 2007 2008 2009 2010
Attackers < 5 - Sum 41 29 95 81 117 137 102 94 73 75 67 60 93
Attackers < 5 - % 19.5% 9.4% 20.2% 21.8% 30.5% 30.3% 30.9% 35.3% 30.4% 26.5% 21.9% 14.8% 19.0%
5 =< Attackers =< 10 - Sum 35 45 121 92 105 109 98 68 67 58 68 125 120
5 =< Attackers =< 10 - % 16.7% 14.6% 25.7% 24.7% 27.4% 24.1% 29.7% 25.6% 27.9% 20.5% 22.2% 30.8% 24.5%
Attackers >10 - Sum 12 12 34 27 26 27 26 6 16 15 24 29 44
Attackers >10 - % 5.7% 3.9% 7.2% 7.3% 6.8% 6.0% 7.9% 2.3% 6.7% 5.3% 7.8% 7.1% 9.0%
Attackers Not stated - Sum 122 223 221 172 135 179 104 98 84 135 147 192 232
Attackers Not stated - % 58.1% 72.2% 46.9% 46.2% 35.2% 39.6% 31.5% 36.8% 35.0% 47.7% 48.0% 47.3% 47.4%
0
50
100
150
200
250
Global Piracy
Attackers Number Trends
Sum % In Zone Sum % In Zone Sum % In Zone Sum % In Zone
SOUTH CHINA SEA 1404 361 25.7% 366 26.1% 48 3.4% 629 44.8%
INDIAN OCEAN 748 152 20.3% 185 24.7% 72 9.6% 339 45.3%
EAST AFRICA 814 77 9.5% 175 21.5% 69 8.5% 493 60.6%
WEST AFRICA 577 192 33.3% 136 23.6% 56 9.7% 193 33.4%
SOUTH AMERICA 493 191 38.7% 131 26.6% 21 4.3% 150 30.4%
MALACCA STRAIT 399 68 17.0% 109 27.3% 25 6.3% 197 49.4%
Attackers < 5 5 =< Attackers =< 10 Attackers >10 Not statedTotal

Sea piracy University of Borås, Sweden
Farzad Jannati October 2011 Mahdi Salimi
Page | 3-11
Figure 3.4-3: Attacker Number Trend in Hot Zones Note: For better comparison between different zones, the Y axis range is same for all figures.
Based on the above figure, a summary of attack numbers in hot zones is available in table 3.4-2:
Table 3.4-2:Interval and region of highest attacker groups
Interval Region Group 1998-1999 South China Sea 5 ≤ Attackers ≤ 10 2000 Malacca Strait 5 ≤ Attackers ≤ 10 2001-2002 South China Sea Attackers < 5 2003-2004 South China Sea 5 ≤ Attackers ≤ 10 2005-2007 South China Sea Attackers < 5 2008-2009 East Africa 5 ≤ Attackers ≤ 10 2010 South China Sea Attackers < 5
1998 1999 2000 2001 2002 2003 2004 2005 2006 2007 2008 2009 2010
Attackers < 5 2 0 8 2 4 4 2 10 3 4 15 13 10
5 =< Attackers =< 10 3 1 6 5 5 2 5 15 8 9 26 61 29
Attackers >10 0 1 4 8 4 0 3 1 3 2 14 12 17
0
10
20
30
40
50
60
70
Attackers Number - East Africa
1998 1999 2000 2001 2002 2003 2004 2005 2006 2007 2008 2009 2010
Attackers < 5 14 10 27 34 49 38 34 37 25 23 15 20 35
5 =< Attackers =< 10 14 15 30 19 38 56 45 19 17 18 19 30 46
Attackers >10 4 1 6 3 3 5 4 1 2 3 5 4 7
0
10
20
30
40
50
60
70
Attackers Number - South China Sea
1998 1999 2000 2001 2002 2003 2004 2005 2006 2007 2008 2009 2010
Attackers < 5 5 5 20 11 16 26 6 17 9 8 11 5 13
5 =< Attackers =< 10 5 3 29 29 20 13 9 18 20 9 5 6 19
Attackers >10 2 5 9 10 4 11 3 2 6 4 3 6 7
0
10
20
30
40
50
60
70
Attackers Number - Indian Ocean
1998 1999 2000 2001 2002 2003 2004 2005 2006 2007 2008 2009 2010
Attackers < 5 3 7 9 21 11 27 27 12 15 18 21 7 14
5 =< Attackers =< 10 5 7 8 13 16 13 12 5 6 10 9 18 14
Attackers >10 4 4 2 1 8 7 4 0 3 4 2 7 10
0
10
20
30
40
50
60
70
Attackers Number - West Africa
1998 1999 2000 2001 2002 2003 2004 2005 2006 2007 2008 2009 2010
Attackers < 5 12 5 13 6 25 33 20 15 15 12 3 15 17
5 =< Attackers =< 10 7 11 9 8 20 15 12 6 8 6 9 10 10
Attackers >10 2 1 4 0 3 1 8 0 1 0 0 0 1
0
10
20
30
40
50
60
70
Attackers Number - South America
1998 1999 2000 2001 2002 2003 2004 2005 2006 2007 2008
Attackers < 5 2 1 16 6 10 8 13 3 4 5 0
5 =< Attackers =< 10 1 7 38 17 5 10 15 5 8 3 0
Attackers >10 0 0 9 5 1 3 4 2 1 0 0
0
10
20
30
40
50
60
70
Attackers Number - Malacca Strait
Attackers<5
5=<Attackers=<10
Attackers>10

Sea piracy University of Borås, Sweden
Farzad Jannati October 2011 Mahdi Salimi
Page | 3-12
3.5 Ship Location
Ship location (Port area, Territorial water, International Water) is one of the piracy parameters that points to pirates’ abilities. This parameter helps us to understand what remedy actions or safety measures should be taken to confront the piracy. 3.5.1 Global Ship Location
The global piracy distribution based on different ship location is as figure 3.5-1
Figure 3.5-1: Global Piracy and Ship Location Status (1998-2010)
The distribution of global piracy in different locations on studying period is as follows.
Figure 3.5-2: Global Piracy Trend and Different Location
International waters Territorial waters Port area
Sum 1451 1419 1634
% 32.2% 31.5% 36.3%
0
200
400
600
800
1000
1200
1400
1600
1800
Global Piracy
Different Locations
1998 1999 2000 2001 2002 2003 2004 2005 2006 2007 2008 2009 2010
International waters - Sum 17 38 136 79 49 122 97 65 61 89 154 250 294
International waters - % 8.1% 12.3% 28.9% 21.4% 12.8% 27.6% 29.4% 24.4% 25.4% 31.6% 50.3% 61.6% 60.1%
Territorial waters - Sum 132 201 224 125 72 88 60 66 78 121 81 102 69
Territorial waters - % 62.9% 65.0% 47.6% 33.8% 18.8% 19.9% 18.2% 24.8% 32.5% 42.9% 26.5% 25.1% 14.1%
Port area - Sum 61 70 111 166 262 232 173 135 101 72 71 54 126
Port area - % 29.0% 22.7% 23.6% 44.9% 68.4% 52.5% 52.4% 50.8% 42.1% 25.5% 23.2% 13.3% 25.8%
0
50
100
150
200
250
300
Piracy and Different Locations
Global Trend

Sea piracy University of Borås, Sweden
Farzad Jannati October 2011 Mahdi Salimi
Page | 3-13
According to the figure3.5-2, the studying period can be divided to four different sections:
a. 1998 – 2000 : the territorial water has the most and increasing trend; b. 2000 – 2002 : the territorial water has a decreasing trend and port area has a
increasing; c. trend so that on 2002 the port area has the most rate; d. 2002 – 2006: the port area has a decreasing trend but still has the most rate among
other locations; e. 2006 – 2010: a considerable increasing trend for piracy in international water.
As it is clear from figure 3.5-2, the global piracy location is switched to international water. It can be for following reasons:
a. International water means more distance and in the other the pirates become more equipped with faster ships, bigger ships;
b. Less guard security; c. More security Guard in ports and territorial water; d. More support by their government.
3.5.2 Hot Zones and piracy in different locations
What is the location trend in the hot zones? Which location do pirates prefer to attack to ships in hot zones? The global status of different locations in hot zones is as tables 3.5-1. According to this table:
a) The international water rate was more than the other locations in east Africa and Malacca Strait;
b) Port Area rate is less than the other locations in East Africa, Malacca Strait and South China Sea;
c) East Africa has the maximum rate for “international water” and South China Sea has the maximum rate for “territorial water” among the hot zones.
Table 3.5-1: Statistical review of different ship locations in Hot Zones (1998-2010)
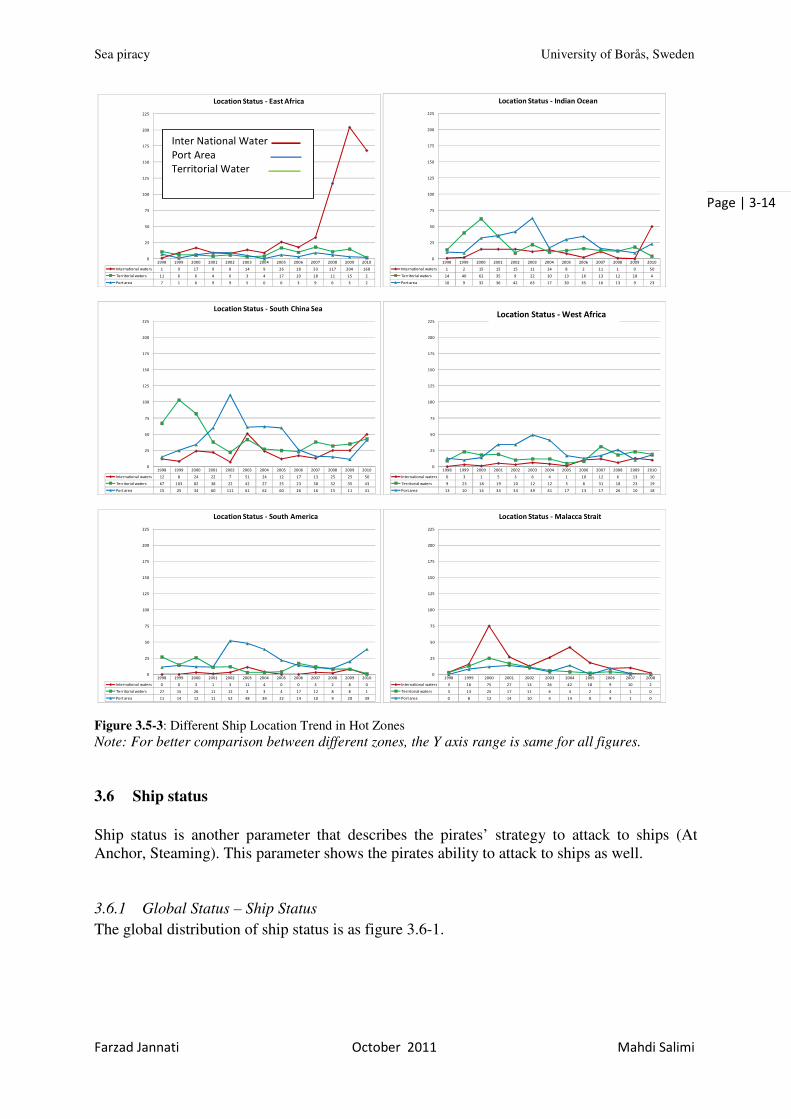
The different location trend in hot zones on the studying period is as figure 3.5-3. According to the above figure the studying period can be divided to three sections as follows
i. 1998 – 2000: the piracy in south China Sea – territorial water has the most rates but is has decreasing trend from 1999;
ii. 2001 - 2006: the piracy in south China sea- in port area has the most rates. But, its trend starts decreasing after 2002;
iii. 2007 – 2010: the piracy in East Africa-international water has the highest rate with a considerable increasing trend.
Sum % Sum % Sum % Sum %
EAST AFRICA 812 100% 633 78% 113 14% 66 8%
SOUTH CHINA SEA 1404 100% 290 21% 577 41% 537 38%
MALACCA STRAIT 399 100% 241 60% 86 22% 72 18%
INDIAN OCEAN 748 100% 145 19% 268 36% 335 45%
WEST AFRICA 577 100% 74 13% 207 36% 296 51%
SOUTH AMERICA 483 100% 35 7% 147 30% 301 62%
Total International waters Territorial waters Port area
Sea piracy University of Borås, Sweden
Farzad Jannati October 2011 Mahdi Salimi
Page | 3-14
Figure 3.5-3: Different Ship Location Trend in Hot Zones Note: For better comparison between different zones, the Y axis range is same for all figures.
3.6 Ship status
Ship status is another parameter that describes the pirates’ strategy to attack to ships (At Anchor, Steaming). This parameter shows the pirates ability to attack to ships as well. 3.6.1 Global Status – Ship Status
The global distribution of ship status is as figure 3.6-1.
1998 1999 2000 2001 2002 2003 2004 2005 2006 2007 2008 2009 2010
International waters 1 9 17 9 8 14 9 26 18 33 117 204 168
Territorial waters 11 6 6 4 6 3 4 17 10 18 11 15 2
Port area 7 1 6 9 9 5 0 6 3 9 6 3 2
0
25
50
75
100
125
150
175
200
225
Location Status - East Africa
1998 1999 2000 2001 2002 2003 2004 2005 2006 2007 2008 2009 2010
International waters 1 2 15 15 15 11 14 8 2 11 1 0 50
Territorial waters 14 40 62 35 9 22 10 13 16 13 12 18 4
Port area 10 9 32 36 42 63 17 30 35 16 13 9 23
0
25
50
75
100
125
150
175
200
225
Location Status - Indian Ocean
1998 1999 2000 2001 2002 2003 2004 2005 2006 2007 2008 2009 2010
International waters 12 8 24 22 7 51 24 12 17 13 25 25 50
Territorial waters 67 103 82 38 22 42 27 25 23 38 32 35 43
Port area 15 25 34 60 111 61 62 60 26 16 15 11 41
0
25
50
75
100
125
150
175
200
225
Location Status - South China Sea
1998 1999 2000 2001 2002 2003 2004 2005 2006 2007 2008 2009 2010
International waters 0 3 1 5 3 6 4 1 10 12 6 13 10
Territorial waters 9 23 18 19 10 12 12 5 8 31 18 23 19
Port area 13 10 14 34 34 49 41 17 13 17 26 10 18
0
25
50
75
100
125
150
175
200
225
Location Status - South China Sea
1998 1999 2000 2001 2002 2003 2004 2005 2006 2007 2008 2009 2010
International waters 0 0 3 1 3 11 4 0 0 3 2 8 0
Territorial waters 27 15 26 11 12 3 3 4 17 12 8 8 1
Port area 11 14 12 11 52 48 39 22 14 10 9 20 39
0
25
50
75
100
125
150
175
200
225
Location Status - South America
1998 1999 2000 2001 2002 2003 2004 2005 2006 2007 2008
International waters 3 16 75 27 13 26 42 18 9 10 2
Territorial waters 3 13 25 17 11 6 4 2 4 1 0
Port area 0 8 12 14 10 4 14 0 9 1 0
0
25
50
75
100
125
150
175
200
225
Location Status - Malacca Strait
Inter National Water Port Area Territorial Water
Location Status - West Africa
Sea piracy University of Borås, Sweden
Farzad Jannati October 2011 Mahdi Salimi
Page | 3-15
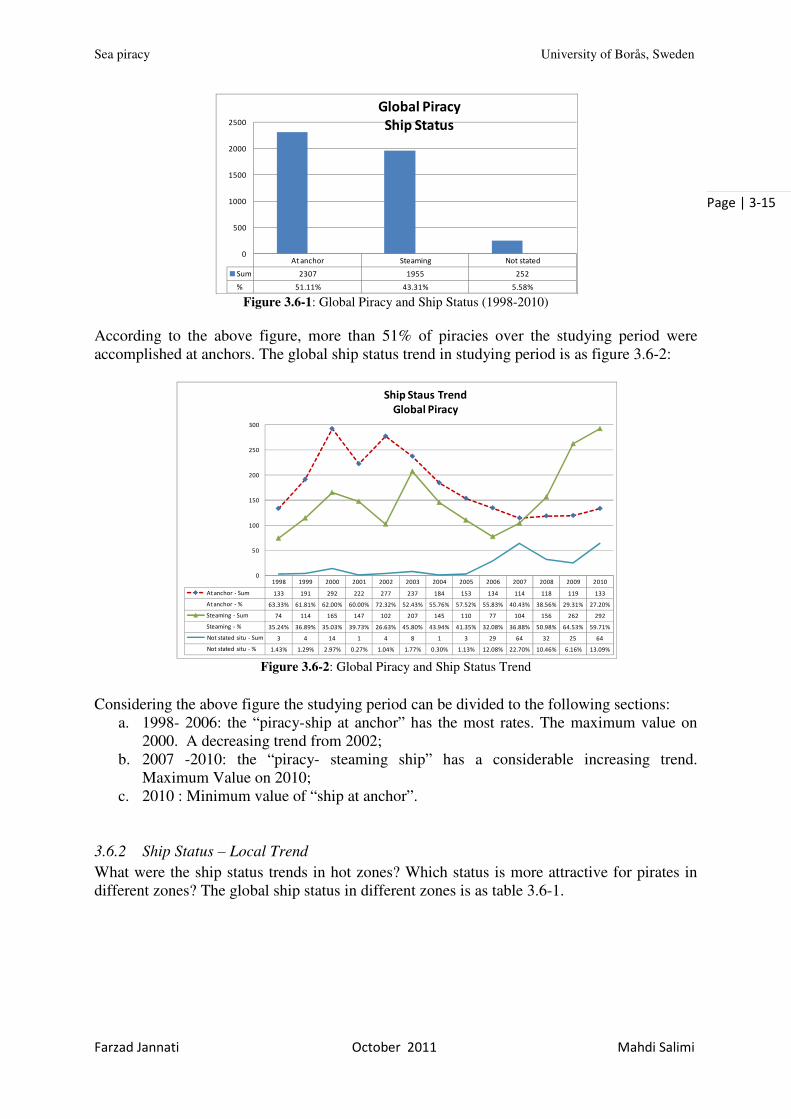
Figure 3.6-1: Global Piracy and Ship Status (1998-2010)
According to the above figure, more than 51% of piracies over the studying period were accomplished at anchors. The global ship status trend in studying period is as figure 3.6-2:
Figure 3.6-2: Global Piracy and Ship Status Trend
Considering the above figure the studying period can be divided to the following sections: a. 1998- 2006: the “piracy-ship at anchor” has the most rates. The maximum value on
2000. A decreasing trend from 2002; b. 2007 -2010: the “piracy- steaming ship” has a considerable increasing trend.
Maximum Value on 2010; c. 2010 : Minimum value of “ship at anchor”.
3.6.2 Ship Status – Local Trend
What were the ship status trends in hot zones? Which status is more attractive for pirates in different zones? The global ship status in different zones is as table 3.6-1.
At anchor Steaming Not stated
Sum 2307 1955 252
% 51.11% 43.31% 5.58%
0
500
1000
1500
2000
2500
Global Piracy
Ship Status
1998 1999 2000 2001 2002 2003 2004 2005 2006 2007 2008 2009 2010
At anchor - Sum 133 191 292 222 277 237 184 153 134 114 118 119 133
At anchor - % 63.33% 61.81% 62.00% 60.00% 72.32% 52.43% 55.76% 57.52% 55.83% 40.43% 38.56% 29.31% 27.20%
Steaming - Sum 74 114 165 147 102 207 145 110 77 104 156 262 292
Steaming - % 35.24% 36.89% 35.03% 39.73% 26.63% 45.80% 43.94% 41.35% 32.08% 36.88% 50.98% 64.53% 59.71%
Not stated situ - Sum 3 4 14 1 4 8 1 3 29 64 32 25 64
Not stated situ - % 1.43% 1.29% 2.97% 0.27% 1.04% 1.77% 0.30% 1.13% 12.08% 22.70% 10.46% 6.16% 13.09%
0
50
100
150
200
250
300
Ship Staus Trend
Global Piracy

Sea piracy University of Borås, Sweden
Farzad Jannati October 2011 Mahdi Salimi
Page | 3-16
Table 3.6-1: Statistical Review of Ship Status in Hot Zones (1998-2010)
According to the above table:
a) The steaming rate is more than “at anchor” rate in East Africa and Malacca Strait; b) East Africa has the maximum rate for “steaming” and West Africa has the maximum
rate for “at anchor” among the hot zones. The ship status trend in hot zones on the studying period is as figure 3.6-3.
Figure 3.6-3: Ship Status Trend in Hot Zones Note: For better comparison between different zones, the Y axis range is same for all figures.
Sum % in Zone Sum % in Zone Sum % in Zone
EAST AFRICA 812 664 81.8% 94 11.6% 54 6.7%
SOUTH CHINA SEA 1406 544 38.7% 793 56.4% 69 4.9%
MALACCA STRAIT 397 267 67.3% 118 29.7% 12 3.0%
INDIAN OCEAN 748 217 29.0% 496 66.3% 35 4.7%
WEST AFRICA 577 138 23.9% 394 68.3% 45 7.8%
SOUTH AMERICA 493 83 16.8% 382 77.5% 28 5.7%
Total Steaming At anchor Not stated
1998 1999 2000 2001 2002 2003 2004 2005 2006 2007 2008 2009 2010
Steaming 9 14 18 10 13 16 8 39 24 42 116 206 149
At anchor 10 1 11 12 10 5 5 7 4 7 11 7 4
Not stated 0 1 0 0 0 1 0 3 3 11 7 9 19
0
25
50
75
100
125
150
175
200
225
Ship Status - East Africa
1998 1999 2000 2001 2002 2003 2004 2005 2006 2007 2008 2009 2010
Steaming 44 57 37 49 23 87 51 32 28 16 29 31 60
At anchor 48 79 99 70 116 63 62 65 32 36 33 36 54
Not stated 2 0 4 1 1 4 0 0 8 15 10 4 20
0
25
50
75
100
125
150
175
200
225
Ship Status - South China Sea
1998 1999 2000 2001 2002 2003 2004 2005 2006 2007 2008 2009 2010
Steaming 2 13 4 13 9 22 12 2 7 13 4 17 20
At anchor 20 21 28 45 38 45 45 21 17 31 37 25 21
Not stated 0 2 1 0 0 0 0 0 7 16 9 4 6
0
25
50
75
100
125
150
175
200
225
Ship Status - West Africa
1998 1999 2000 2001 2002 2003 2004 2005 2006 2007 2008 2009 2010
Steaming 4 5 19 30 22 29 22 16 5 13 2 2 48
At anchor 21 45 88 56 44 65 18 35 43 19 20 23 19
Not stated 0 1 2 0 0 2 1 0 5 8 4 2 10
0
25
50
75
100
125
150
175
200
225
Ship Status - Indian Ocean
1998 1999 2000 2001 2002 2003 2004 2005 2006 2007 2008 2009 2010
Steaming 9 3 9 11 14 17 7 3 1 3 2 3 1
At anchor 28 26 30 12 52 55 39 23 29 13 15 28 32
Not stated 1 0 2 0 1 0 0 0 1 9 2 5 7
0
25
50
75
100
125
150
175
200
225
Ship Status - South America
1998 1999 2000 2001 2002 2003 2004 2005 2006 2007 2008
Steaming 5 22 76 34 20 32 45 18 7 6 2
At anchor 1 15 34 24 12 3 15 2 8 4 0
Not stated 0 0 2 0 2 1 0 0 5 2 0
0
25
50
75
100
125
150
175
200
225
Ship Status - Malacca Strait
Steaming At Anchor Not Stated

Sea piracy University of Borås, Sweden
Farzad Jannati October 2011 Mahdi Salimi
Page | 3-17
According to the above figure: i. 1998-2005: “South China Sea-ship at anchor” had the highest rate among other zones
and statues. (On 2003 the “South China Sea-steaming ship” had the highest rates); ii. 2006-2010: the East Africa –steaming ship had a considerable increasing trend.
More attack to steaming ships can mean:
- More equipped pirates; - Faster ships and more fuels (more support).
3.7 Weapon status
Another parameter that defines pirates’ treatment and can be considered as their ability is weapon types used by them. More powerful weapon means more threaten from more distance and more dangerous situation. 3.7.1 Weapon and Global Piracy
The global weapon histogram is as figure 3.7-1:
Figure 3.7-1: Global Weapon Status (1998-2010)
According to the above figure the gun and knives had same using rates globally. Unfortunately for more than 53% of cases “no weapon” was assigned in the IMO report and it can affect the relevant analysis. The weapon trend over studying period is as figure 3.7-2 :
Guns Knives Other None/Not stated
Sum 944 952 175 2412
% 21.06% 21.24% 3.90% 53.80%
0
500
1000
1500
2000
2500
Global Piracy
Weapon Status

Sea piracy University of Borås, Sweden
Farzad Jannati October 2011 Mahdi Salimi
Page | 3-18
Figure 3.7-2: Global Piracy and Weapon Trend
According to the above figure the studying period can divided to three sections as follows: a. 1998-1999: the gun usage are more than knives but whit a little difference; b. 2000-2006: the knives trend is more than gun. The difference is not high. This trend
decreases from 2004; c. 2007-2010: the gun trend increase considerably and always are more than knives; d. 2009: gun has the most rates for 160 within studying period; e. 2010: knives have the most rates for 101 within studying period.
The weapon trend in hot zones and pirates priority to select the weapon is another important parameter, which is discussed in, continues.
3.7.2 Weapon trend in hot zones: What are the weapon statuses in hot zones? The global weapon status in hot zones is as table 3.7-1 Table 3.7-1:Global Piracy and Weapon Status in Hot Zones (1998-2010)
According to the above table:
a) “Gun” rate is more than the other weapons rate in the East Africa and Malacca Strait; b) The Gun/knife ratio in East Africa is very high and considerable (8.4) while this ratio
in Malacca Strait is 1.1.
1998 1999 2000 2001 2002 2003 2004 2005 2006 2007 2008 2009 2010
Guns - Sum 47 53 45 65 67 83 84 65 44 59 86 160 86
Guns - % 22% 17% 10% 18% 18% 19% 25% 24% 18% 21% 29% 39% 18%
Knives - Sum 38 41 104 85 102 107 78 70 60 57 52 57 101
Knives - % 18% 13% 22% 23% 27% 25% 24% 26% 25% 20% 17% 14% 21%
Other - Sum 9 3 18 12 12 23 21 7 4 9 4 15 38
Other - % 4% 1% 4% 3% 3% 5% 6% 3% 2% 3% 1% 4% 8%
None/Not stated - Sum 118 212 304 208 201 214 147 124 132 157 157 174 264
None/Not stated - % 56% 69% 65% 56% 53% 50% 45% 47% 55% 56% 53% 43% 54%
0
50
100
150
200
250
300
350
Global Piracy and Weapon Status
Sum % In Zone Sum % In Zone Sum % In Zone Sum % In Zone
EAST AFRICA 812 313 38.5% 38 4.7% 35 4.3% 426 52.5%
SOUTH CHINA SEA 1399 195 13.9% 374 26.7% 48 3.4% 782 55.9%
MALACCA STRAIT 401 85 21.2% 80 20.0% 5 1.2% 231 57.6%
INDIAN OCEAN 746 72 9.7% 179 24.0% 45 6.0% 450 60.3%
WEST AFRICA 552 152 27.5% 172 31.2% 24 4.3% 204 37.0%
SOUTH AMERICA 491 102 20.8% 106 21.6% 12 2.4% 271 55.2%
TotalGuns Knives Other None/Not stated

Sea piracy University of Borås, Sweden
Farzad Jannati October 2011 Mahdi Salimi
Page | 3-19
The Weapon trend in hot zones on the studying period is as figure 3.7-3. According to this figure:
a) 1998: Gun (South China Sea) had the highest rate; b) 1999-2005: Knives (South China Sea) had the most rates. c) 2006 and 2007: Knives had the highest rated respectively in the Indian Ocean and
West Africa; d) 2008-2010: Gun (East Africa) hast the most and considerable using rate.
Figure 3.7-3: Weapon Trends in Hot Zones Note: For better comparison between different zones, the Y axis range is same for all figures.
The gun to knives ratio in hot zones over the studying period is important index to analyze the weapon status. The trend of this ratio in hot zones on studying period is as figure 3.7-4. Refer to that:
a. The East Africa had the most “gun to knives” ratio, this ratio started an increasing trend from 2007;
b. This ratio in other hot zones over the studying period was almost less than 3.25;
1998 1999 2000 2001 2002 2003 2004 2005 2006 2007 2008 2009 2010
Guns 6 10 0 5 5 9 6 21 8 12 67 117 47
Knives 2 0 4 4 3 0 2 2 4 3 7 6 1
Other 1 0 1 0 2 0 2 0 0 1 1 9 18
None/Not stated 10 6 24 13 13 13 3 26 19 44 59 90 106
0
20
40
60
80
100
120
Weapon Trend - East Africa
1998 1999 2000 2001 2002 2003 2004 2005 2006 2007 2008 2009 2010
Guns 22 14 6 16 13 34 28 14 14 9 8 11 6
Knives 14 20 34 20 42 42 32 31 15 16 26 27 55
Other 3 1 8 4 6 8 6 4 0 4 0 1 3
None/Not stated 55 101 92 80 79 70 47 48 37 38 33 32 70
0
20
40
60
80
100
120
Weapon Trend - South Chna Sea
1998 1999 2000 2001 2002 2003 2004 2005 2006 2007 2008 2009 2010
Guns 4 13 7 9 14 17 9 4 6 17 8 28 16
Knives 8 7 11 23 19 17 16 13 7 21 12 4 14
Other 0 0 1 2 2 4 6 1 1 1 1 3 2
None/Not stated 10 16 14 24 12 4 26 5 17 21 29 11 15
0
20
40
60
80
100
120
Weapon Trend - West Africa
1998 1999 2000 2001 2002 2003 2004 2005 2006 2007 2008 2009 2010
Guns 2 3 10 19 5 4 4 14 1 1 1 0 8
Knives 5 6 23 14 17 24 11 9 25 11 5 12 17
Other 2 2 5 2 1 7 3 1 2 3 2 2 13
None/Not stated 16 40 71 51 43 61 23 25 25 25 18 13 39
0
20
40
60
80
100
120
Weapon Trend - Indian Ocean
1998 1999 2000 2001 2002 2003 2004 2005 2006 2007 2008 2009 2010
Guns 8 11 13 10 14 5 11 4 10 8 2 3 3
Knives 9 2 4 5 14 17 9 13 5 4 2 8 14
Other 1 0 2 1 1 3 3 1 0 0 0 0 0
None/Not stated 20 16 22 7 38 47 23 8 16 13 13 25 23
0
20
40
60
80
100
120
Weapon Trend - South Amedrica
1998 1999 2000 2001 2002 2003 2004 2005 2006 2007 2008
Guns 3 2 8 5 15 14 26 8 3 1 0
Knives 0 5 28 18 7 7 8 2 4 1 0
Other 0 0 0 3 0 1 1 0 0 0 0
None/Not stated 3 30 76 32 12 14 25 12 15 10 2
0
20
40
60
80
100
120
Weapon Trend - Malacca Strait
Gun
Knives
Other
None/None Stated

Sea piracy University of Borås, Sweden
Farzad Jannati October 2011 Mahdi Salimi
Page | 3-20
c. After East Africa the maximum Gun to Knives ratio belongs to : i. West Africa for 7 on 2009;
ii. South America for 5.5 on 1999.
Figure 3.7-4: Gun/Knife Rate in Hot Zones
3.8 Pirates’ success status:
The success status is an important parameter, which can define the pirates’ behavior and talk about what they are looking for.
3.8.1 Success and Global Piracy
The figure 3.8-1 shows the global success status.
Figure 3.8-1: Global Piracy and Success Status (1998-2010)
According to the above figure: a. 30% of piracies had no success and were aborted; b. For more than 43% of cases the pirates could access to cargo and storeroom.
1998 1999 2000 2001 2002 2003 2004 2005 2006 2007 2008 2009 2010
SOUTH CHINA SEA 1.57 0.70 0.18 0.80 0.31 0.81 0.88 0.45 0.93 0.56 0.31 0.41 0.11
EAST AFRICA 3.00 0.00 1.25 1.67 3.00 10.50 2.00 4.00 9.57 19.50 47.00
INDIAN OCEAN 0.40 0.50 0.43 1.36 0.29 0.17 0.36 1.56 0.04 0.09 0.20 0.00 0.47
WEST AFRICA 0.50 1.86 0.64 0.39 0.74 1.00 0.56 0.31 0.86 0.81 0.67 7.00 1.14
SOUTH AMERICA 0.89 5.50 3.25 2.00 1.00 0.29 1.22 0.31 2.00 2.00 1.00 0.38 0.21
MALACCA STRAIT 0.40 0.29 0.28 2.14 2.00 3.25 4.00 0.75 1.00
0.00
5.00
10.00
15.00
20.00
25.00
30.00
35.00
40.00
45.00
50.00
Gun / Knife Ratio
Cargo & Store
roomEngine Room
Master & crew
accomodationNot Boarded Not Stated
Sum 1968 131 672 1360 379
% 43.64% 2.90% 14.90% 30.16% 8.40%
0
500
1000
1500
2000
Global Piracy
Succes Status

Sea piracy University of Borås, Sweden
Farzad Jannati October 2011 Mahdi Salimi
Page | 3-21
The global success trend on studying period is as Figure 3.8-2:
Figure 3.8-2: Global Piracy and Success Trend
According to the above figure: a. 1998-2008: The “cargo and store room” has the most rates and the “not boarded”
almost has the second place in this period; b. 2009-2010: the “not boarded” has the maximum rate and the “cargo and store room”
has the second place; c. The “not boarded” has a considerable increasing trend from 2007.
Increasing of “Not boarded” case can be result of:
i. More local/international security; ii. The ships are more equipped against piracy;
iii. The ships are more attentive against piracy; iv. The pirates become bolder. They attack to every ships and don’t take under
consideration if they can be succeed or not.
How much were the pirates successfulness in their attack to the ships and what do they gain in this way? The success status in hot zones is important and can describe the pirated vision and their ability in attacking to ships. 3.8.2 Local Success Status
The global success status in hot zones is as table 3.8-1. According to that: a) “Engine Room”: had the lowest rates among other subjects in all zones; b) “Cargo & Store room”: had the highest rate in the South China Sea, South America,
West Africa and Indian Ocean respectively; c) “Not stated”: had the highest rate in the East Africa; d) “Master and crew accommodation” : had the highest rates in Malacca Strait, West
Africa and South China Sea respectively; e) “Not boarded” has the highest rate in East Africa.
1998 1999 2000 2001 2002 2003 2004 2005 2006 2007 2008 2009 2010
Cargo & Store room - Sum 88 153 198 151 189 238 172 148 123 158 136 93 121
Cargo & Store room - % 41.90% 49.51% 42.04% 40.37% 49.35% 52.65% 52.12% 55.64% 51.25% 56.03% 44.88% 22.91% 25.00%
Master & crew accomodation - Sum 75 85 84 78 36 66 63 36 36 26 31 21 35
Master & crew accomodation - % 35.71% 27.51% 17.83% 20.86% 9.40% 14.60% 19.09% 13.53% 15.00% 9.22% 10.23% 5.17% 7.23%
Engine Room - Sum 10 9 20 17 11 4 5 2 14 11 17 5 6
Engine Room - % 4.76% 2.91% 4.25% 4.55% 2.87% 0.88% 1.52% 0.75% 5.83% 3.90% 5.61% 1.23% 1.24%
Not Boarded - Sum 37 60 150 107 89 114 88 69 67 76 100 196 207
Not Boarded - % 17.62% 19.42% 31.85% 28.61% 23.24% 25.22% 26.67% 25.94% 27.92% 26.95% 33.00% 48.28% 42.77%
Not Stated - Sum 0 2 19 21 58 30 2 11 0 11 19 91 115
Not Stated - % 0.00% 0.65% 4.03% 5.61% 15.14% 6.64% 0.61% 4.14% 0.00% 3.90% 6.27% 22.41% 23.76%
0
50
100
150
200
250
Success Status
Global Piracy

Sea piracy University of Borås, Sweden
Farzad Jannati October 2011 Mahdi Salimi
Page | 3-22
Table 3.8-1: Global Success Status in Hot Zones (1998-2010)
The success trend in hot zones on the studying period is as figure 3.8-3. According to the above figure, the studying period can be divided in two different sections as follows:
a. 1998-2007: Cargo and store room-South China Sea has the most rate; b. 2008-2010: Not boarded-East Africa has the most rates with a considerable increasing
trend. The Cargo and store room-South China Sea has the second place of rank.
Figure 3.8-3: Success Trend in Hot Zones Note: For better comparison between different zones, the Y axis range is same for all figures.
Sum % In Zone Sum % In Zone Sum % In Zone Sum % In Zone Sum % In Zone
EAST AFRICA 811 504 62% 104 13% 12 1% 69 9% 122 15%
SOUTH CHINA SEA 1408 312 22% 678 48% 86 6% 234 17% 98 7%
INDIAN OCEAN 748 206 28% 424 57% 9 1% 57 8% 52 7%
MALACCA STRAIT 399 156 39% 99 25% 8 2% 115 29% 21 5%
WEST AFRICA 571 91 16% 336 59% 3 1% 100 18% 41 7%
SOUTH AMERICA 492 62 13% 311 63% 12 2% 72 15% 35 7%
Total Not Boarded Cargo & Store room Engine Room
Master & crew
accomodationNot Stated
1998 1999 2000 2001 2002 2003 2004 2005 2006 2007 2008 2009 2010
Not Boarded 4 7 20 10 9 11 6 27 17 33 73 163 124
Cargo & Store room 5 3 5 6 9 4 4 8 11 17 25 6 1
Engine Room 0 0 1 0 0 0 0 0 0 0 11 0 0
Master & crew accomodation 10 6 3 3 2 4 3 13 3 7 12 2 1
Not Stated 0 0 0 3 3 3 0 1 0 3 12 51 46
0
20
40
60
80
100
120
140
160
180
Succes Trends - East Africa
1998 1999 2000 2001 2002 2003 2004 2005 2006 2007 2008 2009 2010
Not Boarded 21 30 41 32 28 40 27 16 16 12 10 14 25
Cargo & Store room 32 60 72 48 73 73 59 67 24 42 47 21 60
Engine Room 10 8 10 14 9 3 3 2 7 9 2 4 5
Master & crew accomodation 31 37 11 26 7 28 24 6 19 4 10 12 19
Not Stated 0 1 6 4 23 10 0 6 0 0 3 20 25
0
20
40
60
80
100
120
140
160
180
Succes Trends - South China Sea
1998 1999 2000 2001 2002 2003 2004 2005 2006 2007 2008 2009 2010
Not Boarded 0 7 7 7 8 8 14 2 5 8 8 12 5
Cargo & Store room 12 17 17 41 26 45 31 17 22 40 34 16 18
Engine Room 0 0 0 0 0 0 0 0 1 0 2 0 0
Master & crew accomodation 10 12 8 7 6 12 12 2 3 8 2 6 12
Not Stated 0 0 1 3 7 2 0 2 0 4 3 12 7
0
20
40
60
80
100
120
140
160
180
Succes Trends - West Africa
1998 1999 2000 2001 2002 2003 2004 2005 2006 2007 2008 2009 2010
Not Boarded 9 8 32 30 20 19 10 12 15 8 3 3 37
Cargo & Store room 14 38 63 34 33 63 26 29 34 27 21 23 19
Engine Room 0 0 1 3 1 0 1 0 1 0 1 0 1
Master & crew accomodation 2 5 10 15 1 7 4 8 3 2 0 0 0
Not Stated 0 0 3 4 11 7 0 2 0 3 1 1 20
0
20
40
60
80
100
120
140
160
180
Succes Trends - Indian Ocean
1998 1999 2000 2001 2002 2003 2004 2005 2006 2007 2008 2009 2010
Not Boarded 1 0 5 6 14 12 6 2 4 2 2 2 6
Cargo & Store room 24 17 16 7 37 48 39 24 21 22 9 26 21
Engine Room 0 0 5 0 0 1 0 0 5 0 1 0 0
Master & crew accomodation 13 11 10 8 12 7 1 0 1 1 6 1 1
Not Stated 0 1 5 2 4 4 0 0 0 0 0 7 12
0
20
40
60
80
100
120
140
160
180
Succes Trends - South America
1998 1999 2000 2001 2002 2003 2004 2005 2006 2007 2008
Not Boarded 2 8 44 22 10 21 25 10 6 6 2
Cargo & Store room 0 16 23 15 11 4 13 3 11 3 0
Engine Room 0 1 3 0 1 0 1 0 0 2 0
Master & crew accomodation 4 12 40 17 3 7 19 7 5 1 0
Not Stated 0 0 2 4 9 4 2 0 0 0 0
0
20
40
60
80
100
120
140
160
180
Succes Trends - Malacca Strait
Not Boarded
Cargo & Store Room
Engine Room
Master & Crew Accommodation
Not Stated

Sea piracy University of Borås, Sweden
Farzad Jannati October 2011 Mahdi Salimi
Page | 3-23
As the different items of “success” (except “not boarded”) should be reviewed financially and as there is no financial data on the IMO reports the “not boarded” item is reviewed in more detail. The ”not boarded” ratio to total piracy distribution on studying period is as figure 3.8-4 in which East Africa had the highest rate among other hot zones.
Figure 3.8-4: "Not Boarded" rate in Hot Zones
3.9 Consequences
What has happened to the ships, which were attacked? What happened to their crews? How was the attitude of pirates against the crews? The piracy consequences status is another piracy parameter, which is discussed in this chapter. 3.9.1 Consequences-Global Piracy
The global consequences status is as figure 3.9-1
Figure 3.9-1: Global Piracy and Consequence Status (1998-2010)
1998 1999 2000 2001 2002 2003 2004 2005 2006 2007 2008 2009 2010
EAST AFRICA 21% 44% 69% 45% 39% 50% 46% 55% 55% 55% 55% 73% 72%
INDIAN OCEAN 36% 16% 29% 35% 30% 20% 24% 24% 28% 20% 12% 11% 48%
MALACCA STRAIT 33% 22% 39% 38% 29% 58% 42% 50% 27% 50% 100%
SOUTH AMERICA 3% 0% 12% 26% 21% 17% 13% 8% 13% 8% 11% 6% 15%
SOUTH CHINA SEA 22% 22% 29% 26% 20% 26% 24% 16% 24% 18% 14% 20% 19%
WEST AFRICA 0% 19% 21% 12% 17% 12% 25% 9% 16% 13% 16% 26% 12%
0%
10%
20%
30%
40%
50%
60%
70%
80%
90%
100%
"Not Boarded to Total Piracy "Ratio in Hot Zones
Actual violence Threat of violence Ship hijacked Ship missing None/not stated
Sum 1272 928 295 45 1975
% 28.2% 20.6% 6.5% 1.0% 43.7%
0
500
1000
1500
2000
Global Piracy
Consequrnces Global Piracy - Consequences

Sea piracy University of Borås, Sweden
Farzad Jannati October 2011 Mahdi Salimi
Page | 3-24
According to the above figure, the actual violence had the highest rate. The consequence status within studying period is as figure 3.9-2.
Figure 3.9-2: Global Piracy - Consequence Trend
According to the above figure: a. Except 2000, 2001 and 2002 the actual violence had the most rates in the other years; b. The hijacking had a considerable increasing trend after 2006. The ratio of hijacking
until 2006 is less than 7% but after 2007, this ratio increased to 16% in 2008. It should be noted the consequences study could be more effective in case existing the financial data regarding the consequences. IMO reports merely describe the type of consequences. The consequences type in hot zones is described and studied in the following chapter. 3.9.2 Consequences in hot zones
The summary view of consequences in the hot zones is as table 3.9-1: Table 3.9-1: Global Pracy and Consequence Status in Hot Zones (1998-2010)
According to the above table:
a. Actual Violence was the dominant behavior in all regions;
1998 1999 2000 2001 2002 2003 2004 2005 2006 2007 2008 2009 2010
Actual violence - Sum 77 95 105 90 78 121 123 71 74 80 57 152 149
Actual violence - % 36.7% 30.7% 22.3% 24.3% 20.4% 26.8% 37.3% 26.7% 30.8% 28.4% 18.6% 37.4% 30.5%
Threat of violence - Sum 60 43 129 129 123 78 50 60 33 20 55 41 107
Threat of violence - % 28.6% 13.9% 27.4% 34.9% 32.1% 17.3% 15.2% 22.6% 13.8% 7.1% 17.9% 10.1% 21.9%
Ship hijacked - Sum 13 9 2 16 12 14 21 18 9 17 51 56 57
Ship hijacked - % 6.2% 2.9% 0.4% 4.3% 3.1% 3.1% 6.4% 6.8% 3.8% 6.0% 16.6% 13.8% 11.7%
Ship missing - Sum 3 7 3 2 8 6 1 0 0 0 1 2 12
Ship missing - % 1.4% 2.3% 0.6% 0.5% 2.1% 1.3% 0.3% 0.0% 0.0% 0.0% 0.3% 0.5% 2.5%
None/not stated - Sum 57 155 232 133 162 233 135 117 124 165 143 155 164
None/not stated - % 27.1% 50.2% 49.3% 35.9% 42.3% 51.5% 40.9% 44.0% 51.7% 58.5% 46.6% 38.2% 33.5%
0
40
80
120
160
Global Piracy
Consequrnces
Sum % In Zone Sum % In Zone Sum % In Zone Sum % In Zone Sum % In Zone
SOUTH CHINA SEA 1404 327 23.3% 319 22.7% 58 4.1% 15 1.1% 685 48.8%
EAST AFRICA 814 254 31.2% 123 15.1% 169 20.8% 2 0.2% 266 32.7%
WEST AFRICA 576 249 43.2% 120 20.8% 10 1.7% 1 0.2% 196 34.0%
INDIAN OCEAN 748 161 21.5% 161 21.5% 22 2.9% 6 0.8% 398 53.2%
SOUTH AMERICA 492 138 28.0% 104 21.1% 17 3.5% 10 2.0% 223 45.3%
MALACCA STRAIT 399 122 30.6% 90 22.6% 15 3.8% 10 2.5% 162 40.6%
TotalActual violence Threat of violence Ship hijacked Ship missing None/not stated
Global Piracy – Consequences ( in studying period) Global Piracy – Consequences Trend

Sea piracy University of Borås, Sweden
Farzad Jannati October 2011 Mahdi Salimi
Page | 3-25
b. Threat of violence: is the second case in all zone (Except East Africa) after actual violence;
c. Hijacking: i. The most case is happened in East Africa (21% of all attacks);
ii. This rate is more than 5 times of other hot zones; iii. According to the above table, more than 58% of hijacking in the studying
period is happened in East Africa. According to the table 3.8-1 68% of hijacking is happened within 2005 to 2010 and 75% of this case is related to East Africa.
The parameters of sea piracy were reviewed in chapters 3.1 to 3.9. this review is done based on IMO annual piracy report and as it was told on the chapter 3 there is no record regarding the ship types and ships capacity in the IMO annual reports, these parameters (ship types and ship capacity) should be reviewed based on monthly reports. According to the high volume of monthly reports and as the monthly report 2009 was the last completed report during data gathering, the monthly reports of 2009 were selected to review the piracy monthly trend and ship types status.
3.10 Sea Piracy - Monthly Trend
Does the piracy rate differ in different months? What is sea piracy trend in different month? This chapter reviews the piracy monthly trend based. As the2009 piracy monthly reports was the last one on the IMO website during analyzing the piracy, the piracy monthly trend is analyzed based on the piracy monthly reports-2009. 3.10.1 Global Piracy- 2009 Monthly Trend
The piracy monthly trend for 2009 is as figure 3.10-1.
Figure 3.10-1: Global Sea Piracy-2009 Monthly Trend
According to the above figure: a. 45% of piracies in 2009 were happened during March - June (4 months). These four
months have the highest piracy rates among 2009; b. April with 14% has the maximum piracy rate and July with 3% has the minimum
piracy rate.
Jan Feb Mar Apr May Jun Jul Aug Sep Oct Nov Dec
Sum 30 25 42 57 49 36 14 20 33 34 33 29
% 7% 6% 10% 14% 12% 9% 3% 5% 8% 8% 8% 7%
0
10
20
30
40
50
60
Sea Piracy - 2009Global Sea Piracy - 2009
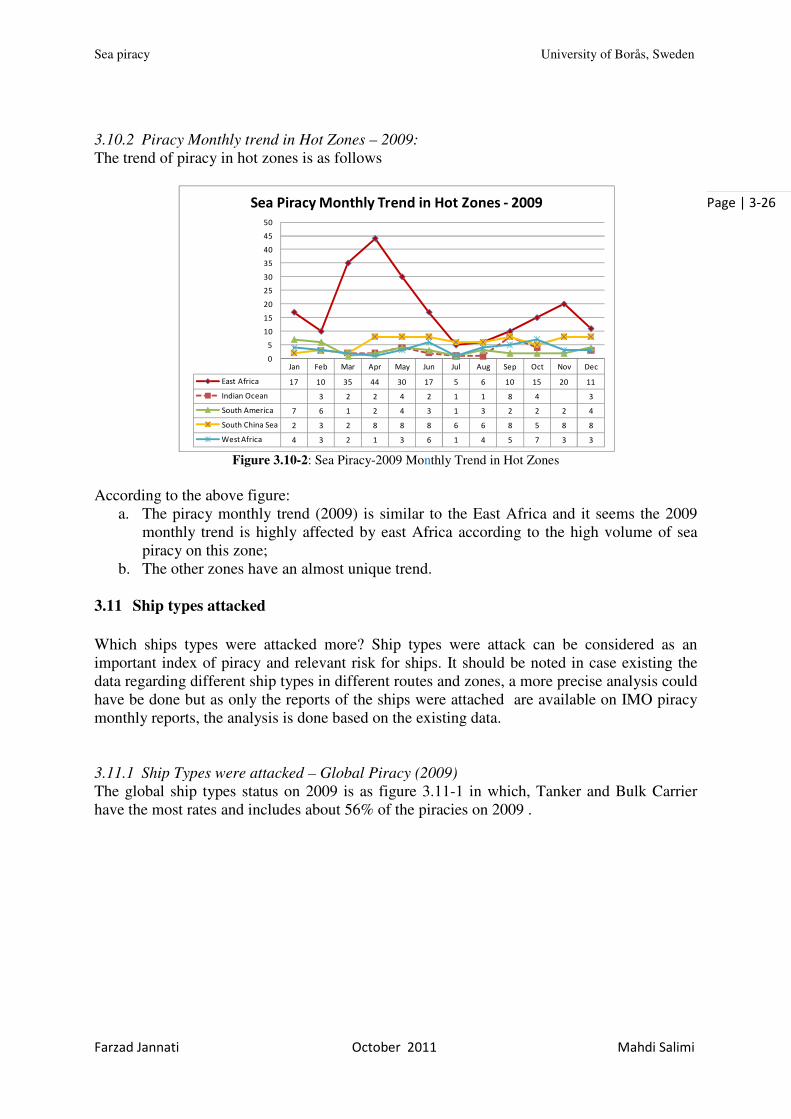
Sea piracy University of Borås, Sweden
Farzad Jannati October 2011 Mahdi Salimi
Page | 3-26
3.10.2 Piracy Monthly trend in Hot Zones – 2009:
The trend of piracy in hot zones is as follows
Figure 3.10-2: Sea Piracy-2009 Monthly Trend in Hot Zones
According to the above figure:
a. The piracy monthly trend (2009) is similar to the East Africa and it seems the 2009 monthly trend is highly affected by east Africa according to the high volume of sea piracy on this zone;
b. The other zones have an almost unique trend.
3.11 Ship types attacked
Which ships types were attacked more? Ship types were attack can be considered as an important index of piracy and relevant risk for ships. It should be noted in case existing the data regarding different ship types in different routes and zones, a more precise analysis could have be done but as only the reports of the ships were attached are available on IMO piracy monthly reports, the analysis is done based on the existing data. 3.11.1 Ship Types were attacked – Global Piracy (2009)
The global ship types status on 2009 is as figure 3.11-1 in which, Tanker and Bulk Carrier have the most rates and includes about 56% of the piracies on 2009 .
Jan Feb Mar Apr May Jun Jul Aug Sep Oct Nov Dec
East Africa 17 10 35 44 30 17 5 6 10 15 20 11
Indian Ocean 3 2 2 4 2 1 1 8 4 3
South America 7 6 1 2 4 3 1 3 2 2 2 4
South China Sea 2 3 2 8 8 8 6 6 8 5 8 8
West Africa 4 3 2 1 3 6 1 4 5 7 3 3
0
5
10
15
20
25
30
35
40
45
50
Sea Piracy Monthly Trend in Hot Zones - 2009

Sea piracy University of Borås, Sweden
Farzad Jannati October 2011 Mahdi Salimi
Page | 3-27
Figure 3.11-1: Ship types were attacked on 2009
The monthly trend of different ships is as Figure 3.11-2.
Figure 3.11-2: Monthly Trend of Different Ship Types were Attacked on 2009
Refer to above graph: a. Tanker:
i. May has the maximum number (20). July and August the Minimum number (4). Average 10 ships;
ii. January, May, Jun, September and December- the tanker number s are more than the other ships;
iii. The tanker rate is two times of the other ships. b. Bulk Carrier:
i. Maximum Number (13) in March, April and November. The minimum numbers in July and December for 3. The average is p ships per months;
ii. February, March, April, August, October and November are more than the other ship types.
3.11.2 Ship Types Status in Hot Zones
The ship types were attacked in all zones is as figure 3.11-3.
TankerBulk
CarrierCargo
Containe
r shipOther Tug
Not
stated
Sum 119 106 67 60 32 14 4
% 30% 26% 17% 15% 8% 3% 1%
0
20
40
60
80
100
120
140
Ship Types were Attacked - 2009
Jan Feb Mar Apr May Jun Jul Aug Sep Oct Nov Dec
Tanker 13 5 9 10 20 12 4 4 11 8 12 11
Bulk Carrier 6 9 13 13 10 11 3 7 9 9 13 3
Cargo 5 3 5 12 10 9 5 5 5 4 4
Container ship 5 5 6 10 7 2 4 1 7 5 3 5
0
5
10
15
20
25
Ship Types Were Attacked on 2009
Monthly Trend

Sea piracy University of Borås, Sweden
Farzad Jannati October 2011 Mahdi Salimi
Page | 3-28
Figure 3.11-3: Ship Types were attacked in different zones (2009)
According to the above graph: a. Except Tug, the volume of ships were attacked in East Africa are more than the other
zones; b. All typos of ships were attacked in East Africa; c. Tanker, Bulk Carrier, Cargo and Container ship were attached in all hot zones in 2009.
3.12 Ship Capacity
Pirates need special equipments to attack and enter to the bigger ships. The global status of ship capacity were attacked by pirates is as figure 3.12-1.
Figure 3.12-1: Global Piracy and Ship Capacity (2009)
According to the above figure:
a. Wide ranges of ships (capacities from 10 to 170 thousand tons) were attacked on 2009.
b. the ships under 10 thousand tons have the most rate for 35% c. The ships under 30 thousand tons include 76% of all ships were attacked on 2009.
Different ship capacity status in different zones is as table 3.12-1
Tanker Bulk Carrier Cargo Container ship Other Tug Not stated
East Africa 61 64 41 25 27 1 1
South China Sea 25 14 7 11 3 12
West Africa 21 10 9 1 1
South America 7 6 7 15 2
Indian Ocean 5 12 3 8 1 1
Caspian sea 1
0
10
20
30
40
50
60
70
Ship Types were Attacked - 2009
10 20 30 40 50 60 70 80 90 100 150 160 170
Sum 139 79 83 42 18 14 6 4 6 2 2 5 2
% 35% 20% 21% 10% 4% 3% 1% 1% 1% 0% 0% 1% 0%
020406080
100120140160
Global Piracy - 2009
Ship Capacity

Sea piracy University of Borås, Sweden
Farzad Jannati October 2011 Mahdi Salimi
Page | 3-29
Table 3.12-1: Ship Capacity in Hot Zones (2009)
According to the above table: a. All ship capacities were attacked in East Africa; b. Except some exceptional case there is no attack to ships more 60,000 tons in other
zones; c. In East Africa 68% of ships were attached are less than 30,000 tons and in other
zones are more than 73%.
Chapter Summary
In this chapter, according to a database produced from the data taken from IMO reports on sea piracy (annual reports 1998 – 2010 and monthly reports of 2009), the modus operandi of modern piracy was studied. Location and functional situation of ships when attacked, number of attackers, weapon used, consequences, success of pirate band, ships types and tonnages and monthly variations of attacks in 2009 was studied. From these studies, hot pirate zones were illustrated.
1000 tons Sum % Sum % Sum % Sum % Sum % Sum % Sum %
10 65 30% 35 49% 20 48% 9 24% 9 30% 1 100% 139 35%
20 43 20% 14 19% 9 21% 7 19% 6 20% 0% 79 20%
30 40 18% 11 15% 8 19% 17 46% 7 23% 0% 83 21%
40 29 13% 3 4% 2 5% 2 5% 6 20% 0% 42 10%
50 11 5% 4 6% 1 2% 1 3% 1 3% 0% 18 4%
60 8 4% 3 4% 1 2% 1 3% 1 3% 0% 14 3%
70 5 2% 1 1% 0% 0% 0% 0% 6 1%
80 4 2% 0% 0% 0% 0% 0% 4 1%
90 6 3% 0% 0% 0% 0% 0% 6 1%
100 1 0% 1 1% 0% 0% 0% 0% 2 0%
150 2 1% 0% 0% 0% 0% 0% 2 0%
160 4 2% 0% 1 2% 0% 0% 0% 5 1%
170 2 1% 0% 0% 0% 0% 0% 2 0%
Grand Total 220 100% 72 100% 42 100% 37 100% 30 100% 1 100% 402 100%
East Africa South China West Africa South America Indian Ocean Caspian sea Total

Sea piracy University of Borås, Sweden
Farzad Jannati October 2011 Mahdi Salimi
Page | 4-30
Chapter 4
4 Literature review
n this chapter, a supportive literature review is done to illustrate some dark sides of the phenomenon. The ideas were chosen from valid sources and set as facts with no
discussion in the chapter. A survey on economical, social and governmental characteristics of some relevant countries was done and seen in the chapter. This chapter includes following topics.
• A comprehensive study on the different factors of some countries • Somalia piracy
As mentioned in chapter one, Ban Ki Moon believed that the economical hardship could lead to those actions as many others did emphasize on the poverty as a motive to the piracy. With no judgment, we bring some support and examine their assumption. In the following section, some economic factors of the countries with the most piracy attacks around, without assigning the acts to the citizens of those countries, and some other countries with coastlines but no piracy incidents around. 4.1 Study Elements
Chosen countries for the study are as follows. The criterion for choosing to analysis of a country here was to have a relation with piracy. Some countries with coastlines that have witnessed piracy incident were brought here; others like some of NATO members were included to see how other factors affect occurrence of the piracy act, Saudi-Arabia was important because of it was situated in the Red Sea, near to Horn not far from the Aden Gulf with those controversial piracy acts around.
Bangledesh Colombia Eritrea India Nigeria Singapore USA
Belgium Congo D. R. Finland Indonesia Norway Somalia Venezuela
Benin Congo France Italy Oman Spain Vietnam
Brazil Côte d'Ivoire Germany Kenya Peru Sweden Yemen
Cameroon Denmark Guinea Malaysia Philipines Tanzania
Canada Djibouti Guyana Mozambique Russia F. Thailand
China Ecuador Haiti Netherlands Saudi Arabia UK
Objectives of the study The aim of multilateral study is to examine the role of economical situation in the piracy directly or indirectly, as Ban KI-Moon (IMO 2011) or Kraska and Wilson (2009) has mentioned as the base for occurrence of piracy. An important thing that the authors follow is to depict the situations of different parameters of the states, mentioned above, with piracy increment. One thing is to be remembered: even if we find some statistical dependence between any parameter with piracy, we can only interpret the results and this study cannot for 100% say the last words in the role of studied parameters with piracy.
I

Sea piracy University of Borås, Sweden
Farzad Jannati October 2011 Mahdi Salimi
Page | 4-31
The classification in this chapter is different from chapter 3 based on table 4.1-1. Table 4.1-1: Description of some expressions in the study Piracy on 2010 (=P) (ICC 2011)
Number of piracy attacks allocated to a country that occurred within the 200 km from the coastlines. To emphasize the situation of East Africa, besides the above criterion, all the incidents of the region is allocated to Somalia as well.
Welfare Denotes welfare states that the governments have implemented some program to decrease the poverty and maintain different level of welfare in their countries. There are variety of policies in those countries that is not discussed here, (Garfinkel and Smeeding 2010)
Other This group denotes Saudi- Arabia and Russian Federation. East Africa Includes those countries in the east of Africa that have coast lines and
have witnessed piracy attacks in their coasts. These countries were Oman, Yemen, Eritrea, Djibouti, Somalia, Kenya, Tanzania and Mozambique.
South America Peru, Colombia, Venezuela, Guyana, Brazil, Ecuador and Haiti were categorized in this group, although the last one is in the Caribbean.
West Africa They are Congo D. R., Congo, Nigeria, Benin, Cote d’Ivoire and Guinea.
East Asia Includes countries with the piracy involved coast lines. These are India, Bangladesh, Thailand, Vietnam, China, Malaysia, Indonesia and Singapore.
Max, Min, Avg Maximum, minimum and average 4.2 Population Clusters
In this section the role of population and some related categories like growth, rural ratio, and population pyramid are analyzed and their relation with piracy or any behavior that can be related are evaluated. This part attempts to give understanding of piracy in relation with population, rural ratio, and population growth.
Table 4.2-1: Population Clusters for countries mentioned in the table 4.1-1(a part of main table)
Group Country Code Population 106 Pop Rates of 2009 % Pop.
Growth (2010)
Piracy incidents 2008 2009
Rural pop
0-14 years
15-64 Years
>65
Welfare Belgium BEL 11 11 3 17 66 17 0.7% 0
Welfare Canada CAN 33 34 20 17 70 14 1.3% 0
East Africa Yemen YEM 23 24 69 44 54 2 2.9% 67
East Africa Somalia SOM 9 9 63 45 52 3 2.5% 265
East Asia India IND 1 140 1 155 70 31 64 5 1.3% 4
East Asia Philippines PHL 90 92 34 34 62 4 1.8% 5
S. America Guyana GUY 1 1 72 30 64 6 -0.1% 1
West Africa Guinea GIN 10 10 65 43 54 3 2.5%
West Africa Nigeria NGA 151 155 51 43 54 3 2.3
…

Sea piracy University of Borås, Sweden
Farzad Jannati October 2011 Mahdi Salimi
Page | 4-32
4.2.1 Population
At this part, variety of population parameters and their contrast with piracy are illustrated and analyzed. Population, its growth and pyramid, and rural population are analyzed to see their behavior with piracy incidents of 2010. The calculated average and its down turn trend in the Figure 4.2-1 might indicate a reverse proportion between piracy and population, meaning that it happened in the countries mostly with low population. The linear trend line shows a decrease in the population with the increase of piracy. However, the correlation between these two and the scatter diagram in Figure 4.2-3 rejected any relation if the population could have affected piracy incidents. Geographically, African countries had the minimum populations and the maximum was of East Asian countries in the analysis, Figure 4.2-1. On the other hand, the linear trend of average of population growth has a positive slope with piracy increase meaning the higher the piracy incidents there the more growth, Figures 4.2-4 and 4.2-5.
Figure 4.2-1: Population by piracy variation (2010) the linear trend line is for the average.
Figure 4.2-2: population by geography of piracy(2010)
Figure 4.2-3: Scatter diagram of population of countries and piracy incidents attacks in 2010.
Figure 4.2-4: Population growth by piracy variation. Figure 4.2-5:Population growth by Geography of piracy
0
200
400
600
800
1 000
1 200
1 400
Piracy=0 P>0 P>5 P>10 P>20 P>30 P>50 Somali
Popu
latio
n in
Mill
ions
Max
AVG pop 2010
0
500
1 000
1 500
Welfare other S. America East Asia West Africa East Africa
Max
Avg pop 2010
Min
0
10
20
30
40
50
60
70
0 50 100 150 200
Population in 2010 (Millions)
Piracy incidents in
2010
-1,00%
0,00%
1,00%
2,00%
3,00%
4,00%
Piracy=0 P>0 P>5 P>10 P>20 P>30 P>50 Somali
Max pop growth (2010) AVG Min Linear (AVG )
-1,0%
0,0%
1,0%
2,0%
3,0%
4,0%
Welfare other S. America
East Asia West Africa
East Africa

Sea piracy University of Borås, Sweden
Farzad Jannati October 2011 Mahdi Salimi
Page | 4-33
Figure 4.2-6: Rural Population rate by piracy variation.
Figure 4.2-7: Rural Population by Geography of piracy
Note: For “X” axis description of figure 4.2-2, Refer to table 4.1-2 and the trend lines are related to
the averages in the above figures 4.2-1, 4.2-4 and 4.2-6.
Another feature of the population studies is to see the variation of rate of rural population of countries and country groups based on piracy increase and geography of piracy. Figure 4.2-6 shows the coastal countries with high rate of rural population were more vulnerable to the piracy risk. By looking at the trend line, this graph is clearly indicating to the increase of rural population rate with the increase of piracy. Figure 4.2-7 shows the minimum average of rural parts in welfare countries followed by South American countries of study. The highest average was of East African countries.
4.2.2 Population pyramid
The age distribution, so called population pyramid, by variation of piracy and geography of piracy has proved that piracy prone countries have younger people than the welfare areas. According to the World Bank for 2009, as seen in the Figures 4.7 and 4.8, for countries with zero piracy and welfare there were 18, 67 and 15% and for Somali there were 45, 52 and 3% for age groups <15, between 15 and 64, and higher than 65 years old respectively. There are interesting trends in these figures as by increasing the piracy the population of first group, <15, is increasing from 18% in the regions with zero piracy to 45% in the hot piracy zone, Somalia. Ages above 15, both groups, have decreasing trends as seen in Figure 4.2-8 and comparatively in Figure 4.2-9. Another important issue in the age pyramid is the variation of the middle group. The difference of 67% in zero piracy zone and 52 in the hottest zone for this range can play essential role in the development of related societies.
0%
20%
40%
60%
80%
100%
Piracy=0 P>0 P>5 P>10 P>20 P>30 P>50 Somali
Max rural pop rate AVG Min Linear (AVG)
0%
20%
40%
60%
80%
100%
Welfare other S. America E. Asia W. Africa E. Africa
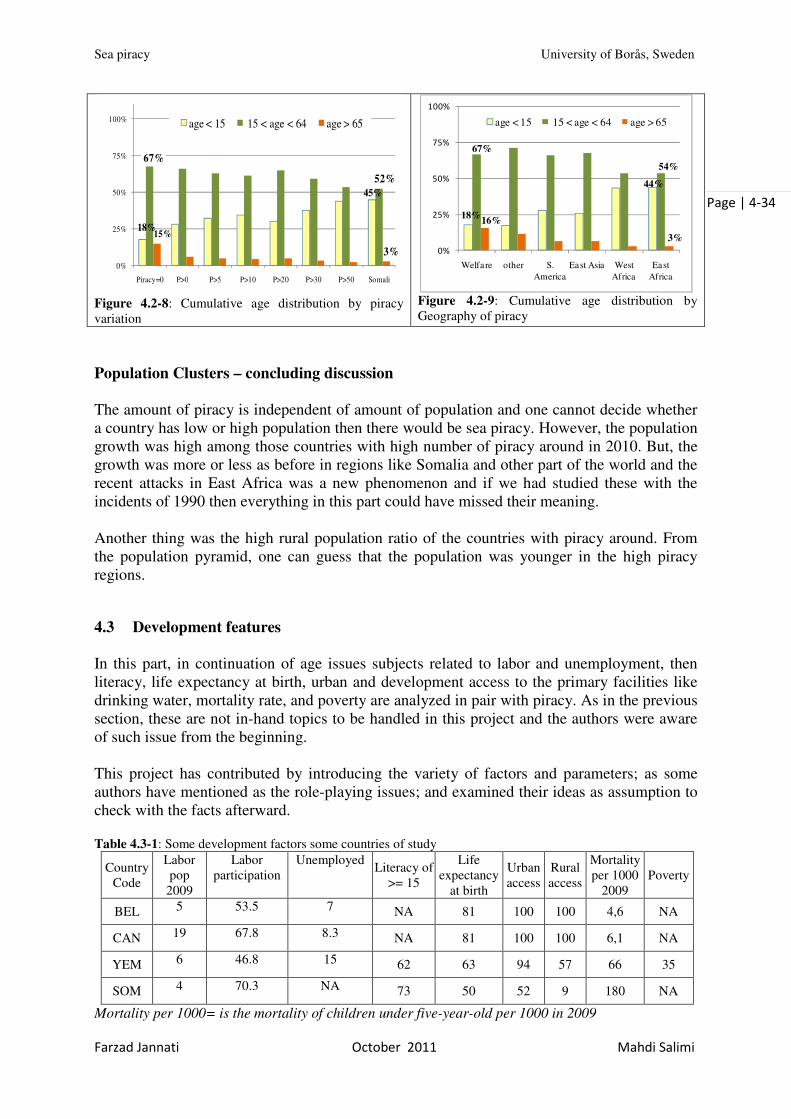
Sea piracy University of Borås, Sweden
Farzad Jannati October 2011 Mahdi Salimi
Page | 4-34
Figure 4.2-8: Cumulative age distribution by piracy variation
Figure 4.2-9: Cumulative age distribution by Geography of piracy
Population Clusters – concluding discussion
The amount of piracy is independent of amount of population and one cannot decide whether a country has low or high population then there would be sea piracy. However, the population growth was high among those countries with high number of piracy around in 2010. But, the growth was more or less as before in regions like Somalia and other part of the world and the recent attacks in East Africa was a new phenomenon and if we had studied these with the incidents of 1990 then everything in this part could have missed their meaning. Another thing was the high rural population ratio of the countries with piracy around. From the population pyramid, one can guess that the population was younger in the high piracy regions.
4.3 Development features
In this part, in continuation of age issues subjects related to labor and unemployment, then literacy, life expectancy at birth, urban and development access to the primary facilities like drinking water, mortality rate, and poverty are analyzed in pair with piracy. As in the previous section, these are not in-hand topics to be handled in this project and the authors were aware of such issue from the beginning. This project has contributed by introducing the variety of factors and parameters; as some authors have mentioned as the role-playing issues; and examined their ideas as assumption to check with the facts afterward.
Table 4.3-1: Some development factors some countries of study
Country Code
Labor pop
2009
Labor participation
Unemployed Literacy of
>= 15
Life expectancy
at birth
Urban access
Rural access
Mortality per 1000
2009 Poverty
BEL 5 53.5 7 NA 81 100 100 4,6 NA
CAN 19 67.8 8.3 NA 81 100 100 6,1 NA
YEM 6 46.8 15 62 63 94 57 66 35
SOM 4 70.3 NA 73 50 52 9 180 NA
Mortality per 1000= is the mortality of children under five-year-old per 1000 in 2009
18%
45%
67%
52%
15%
3%
0%
25%
50%
75%
100%
Piracy=0 P>0 P>5 P>10 P>20 P>30 P>50 Somali
age < 15 15 < age < 64 age > 65
18%
44%
67%
54%
16%
3%
0%
25%
50%
75%
100%
Welfare other S. America
East Asia West Africa
East Africa
age < 15 15 < age < 64 age > 65

Sea piracy University of Borås, Sweden
Farzad Jannati October 2011 Mahdi Salimi
Page | 4-35
4.3.1 Employment issues
In this section, labor population ratio, unemployment of people above 15 years old able to work and would like to work, and its correlation with piracy are discussed. According to World Bank, labor participation ratio denotes the percentage of the labor population participating to work. This ratio and proportion of labor participation to total population with their trend lines and their formulas are shown in Figure 4.3-1. According to that, in spite of their varying behavior both have decreasing trends with piracy; although with different slopes. The difference of slopes is related to the population pyramid in which there were different ratios of people in the working age, ages between 15 and 64. This subject is expressed once more in Figure 4.3-2 as East Africa had the highest ratio in labor participation to labor population, followed by South America, East Asia and West Africa groups. Then, in spite of this high intention to work in the countries with piracy around, labor participation to total population is only a little higher than welfare countries, except in West Africa. Unemployment, on the other hand, had a slight increase by variation of piracy, Figure 4.3-3. Furthermore, in geographical variation there are some differences as unemployment is higher in welfare countries than others. A scatter diagram of piracy and unemployment is necessary to explain the relation, if any, clearly. As seen in the Figure 4.3-5, unemployment is independent of piracy. By another test, correlation coefficient between piracy and unemployment is 12%, rejects any significant relation between these two.
Figure 4.3-1:”Labor participation/labor population” and “Labor participation/total population” rates by piracy variation
Figure 4.3-2:”Labor participation/labor population” and “Labor participation/total population” rates by Geography of piracy
Figure 4.3-3:Unemployment ratio among those able to work by piracy variation
Figure 4.3-4:Unemployment ratio among those able to work by Geography of piracy
y = -0,0045x + 0,6726
y = -0,0169x + 0,3575
0%
20%
40%
60%
80%
Piracy=0 P>0 P>5 P>10 P>20 P>30 P>50 Somali
Ready labor/labor rate 2009 Ready labor/pop rate 2009
Trend line (Ready labor/ Labor) Trend line (Ready to pop)
0%
25%
50%
75%
100%
Welfare other S. America E. Asia W. Africa E. Africa
Ready labor/labor rate 2009 Ready labor/pop rate 2009
0%
10%
20%
Piracy=0 P>0 P>5 P>10 P>20 P>30 P>50 Somali
Avg unemployment
Min
Trend of Avg
9% 8% 8%5% 4%
7%
0%
15%
30%
45%
60%
Welfare other S. America
East Asia West Africa
East Africa
Max
Avg unemployment
Min
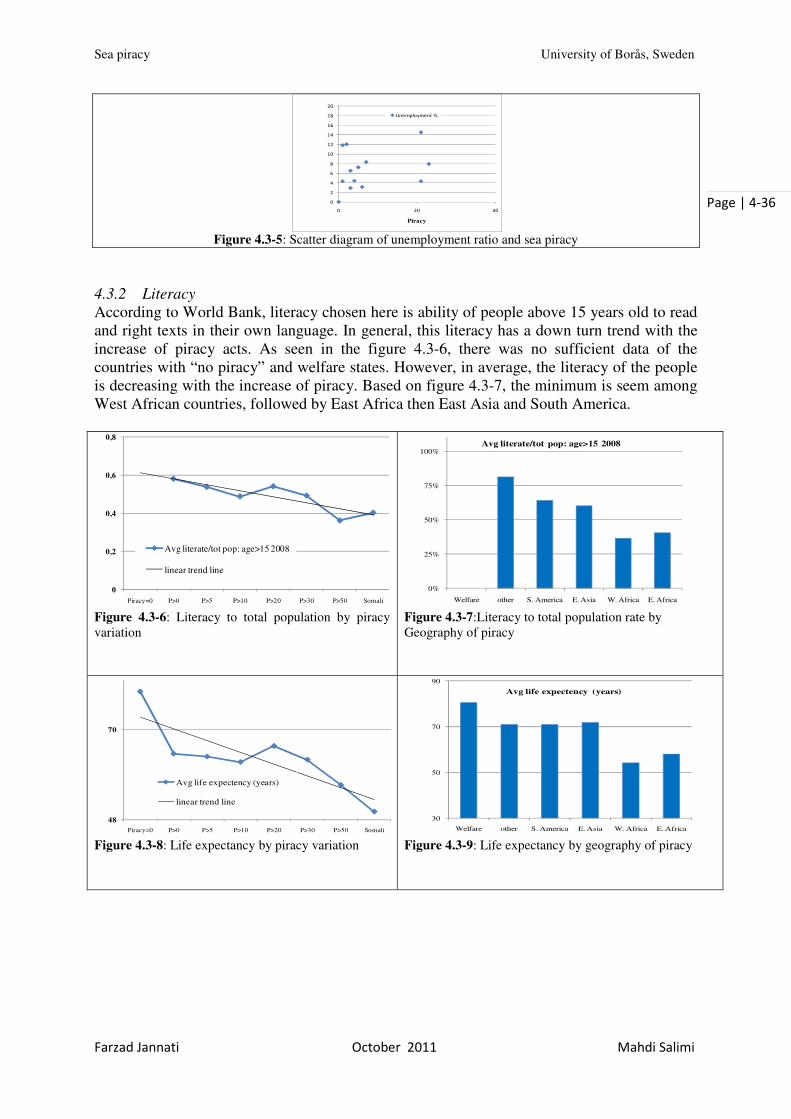
Sea piracy University of Borås, Sweden
Farzad Jannati October 2011 Mahdi Salimi
Page | 4-36
Figure 4.3-5: Scatter diagram of unemployment ratio and sea piracy
4.3.2 Literacy
According to World Bank, literacy chosen here is ability of people above 15 years old to read and right texts in their own language. In general, this literacy has a down turn trend with the increase of piracy acts. As seen in the figure 4.3-6, there was no sufficient data of the countries with “no piracy” and welfare states. However, in average, the literacy of the people is decreasing with the increase of piracy. Based on figure 4.3-7, the minimum is seem among West African countries, followed by East Africa then East Asia and South America.
Figure 4.3-6: Literacy to total population by piracy variation
Figure 4.3-7:Literacy to total population rate by Geography of piracy
Figure 4.3-8: Life expectancy by piracy variation
Figure 4.3-9: Life expectancy by geography of piracy
0
2
4
6
8
10
12
14
16
18
20
0 20 40
Piracy
Unemployment %
0
0,2
0,4
0,6
0,8
Piracy=0 P>0 P>5 P>10 P>20 P>30 P>50 Somali
Avg literate/tot pop: age>15 2008
linear trend line
0%
25%
50%
75%
100%
Welfare other S. America E. Asia W. Africa E. Africa
Avg literate/tot pop: age>15 2008
48
70
Piracy=0 P>0 P>5 P>10 P>20 P>30 P>50 Somali
Avg life expectency (years)
linear trend line
30
50
70
90
Welfare other S. America E. Asia W. Africa E. Africa
Avg life expectency (years)
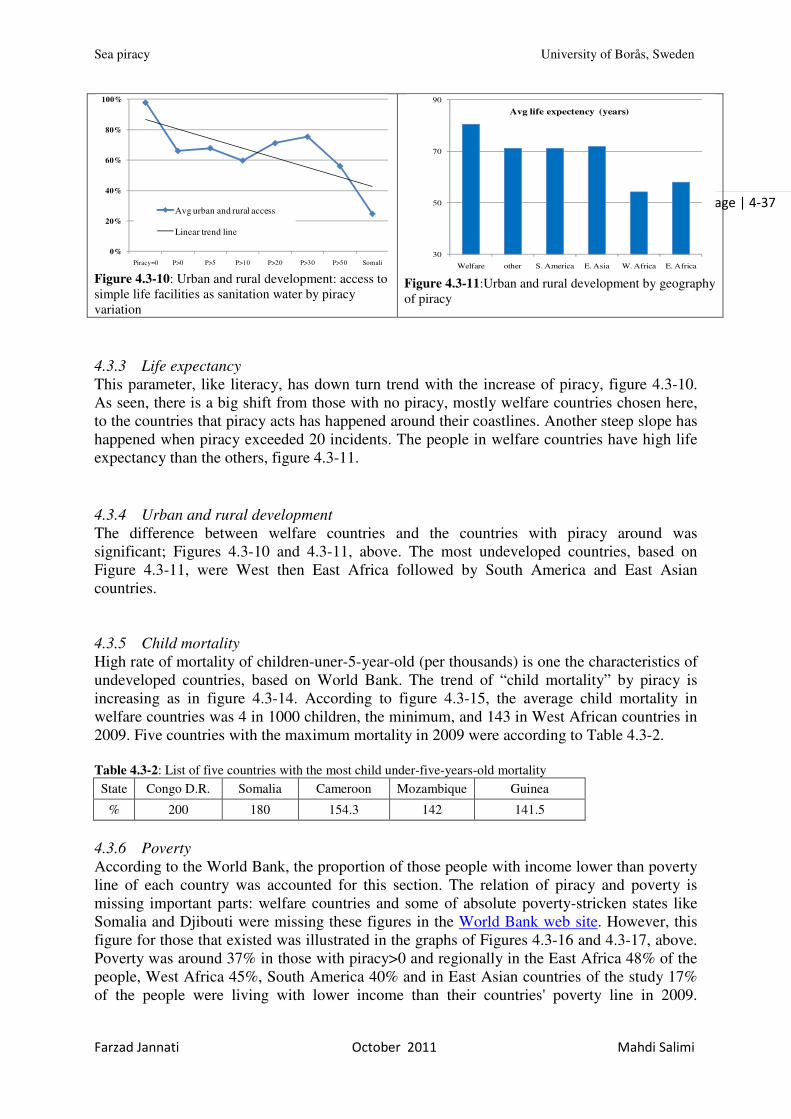
Sea piracy University of Borås, Sweden
Farzad Jannati October 2011 Mahdi Salimi
Page | 4-37
Figure 4.3-10: Urban and rural development: access to simple life facilities as sanitation water by piracy variation
Figure 4.3-11:Urban and rural development by geography of piracy
4.3.3 Life expectancy
This parameter, like literacy, has down turn trend with the increase of piracy, figure 4.3-10. As seen, there is a big shift from those with no piracy, mostly welfare countries chosen here, to the countries that piracy acts has happened around their coastlines. Another steep slope has happened when piracy exceeded 20 incidents. The people in welfare countries have high life expectancy than the others, figure 4.3-11.
4.3.4 Urban and rural development
The difference between welfare countries and the countries with piracy around was significant; Figures 4.3-10 and 4.3-11, above. The most undeveloped countries, based on Figure 4.3-11, were West then East Africa followed by South America and East Asian countries. 4.3.5 Child mortality
High rate of mortality of children-uner-5-year-old (per thousands) is one the characteristics of undeveloped countries, based on World Bank. The trend of “child mortality” by piracy is increasing as in figure 4.3-14. According to figure 4.3-15, the average child mortality in welfare countries was 4 in 1000 children, the minimum, and 143 in West African countries in 2009. Five countries with the maximum mortality in 2009 were according to Table 4.3-2. Table 4.3-2: List of five countries with the most child under-five-years-old mortality State Congo D.R. Somalia Cameroon Mozambique Guinea
% 200 180 154.3 142 141.5
4.3.6 Poverty
According to the World Bank, the proportion of those people with income lower than poverty line of each country was accounted for this section. The relation of piracy and poverty is missing important parts: welfare countries and some of absolute poverty-stricken states like Somalia and Djibouti were missing these figures in the World Bank web site. However, this figure for those that existed was illustrated in the graphs of Figures 4.3-16 and 4.3-17, above. Poverty was around 37% in those with piracy>0 and regionally in the East Africa 48% of the people, West Africa 45%, South America 40% and in East Asian countries of the study 17% of the people were living with lower income than their countries' poverty line in 2009.
0%
20%
40%
60%
80%
100%
Piracy=0 P>0 P>5 P>10 P>20 P>30 P>50 Somali
Avg urban and rural access
Linear trend line
30
50
70
90
Welfare other S. America E. Asia W. Africa E. Africa
Avg life expectency (years)
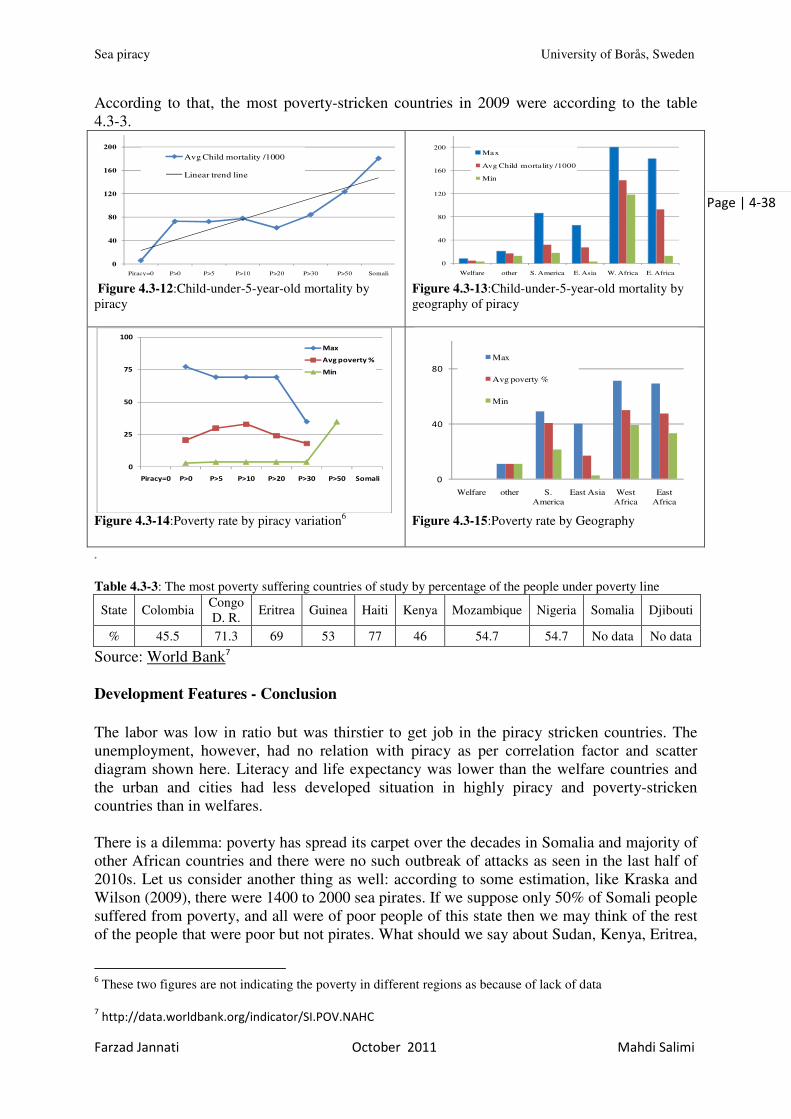
Sea piracy University of Borås, Sweden
Farzad Jannati October 2011 Mahdi Salimi
Page | 4-38
According to that, the most poverty-stricken countries in 2009 were according to the table 4.3-3.
Figure 4.3-12:Child-under-5-year-old mortality by piracy
Figure 4.3-13:Child-under-5-year-old mortality by geography of piracy
Figure 4.3-14:Poverty rate by piracy variation6
Figure 4.3-15:Poverty rate by Geography
.
Table 4.3-3: The most poverty suffering countries of study by percentage of the people under poverty line
State Colombia Congo D. R.
Eritrea Guinea Haiti Kenya Mozambique Nigeria Somalia Djibouti
% 45.5 71.3 69 53 77 46 54.7 54.7 No data No data
Source: World Bank7
Development Features - Conclusion
The labor was low in ratio but was thirstier to get job in the piracy stricken countries. The unemployment, however, had no relation with piracy as per correlation factor and scatter diagram shown here. Literacy and life expectancy was lower than the welfare countries and the urban and cities had less developed situation in highly piracy and poverty-stricken countries than in welfares. There is a dilemma: poverty has spread its carpet over the decades in Somalia and majority of other African countries and there were no such outbreak of attacks as seen in the last half of 2010s. Let us consider another thing as well: according to some estimation, like Kraska and Wilson (2009), there were 1400 to 2000 sea pirates. If we suppose only 50% of Somali people suffered from poverty, and all were of poor people of this state then we may think of the rest of the people that were poor but not pirates. What should we say about Sudan, Kenya, Eritrea,
6 These two figures are not indicating the poverty in different regions as because of lack of data
7 http://data.worldbank.org/indicator/SI.POV.NAHC
0
40
80
120
160
200
Piracy=0 P>0 P>5 P>10 P>20 P>30 P>50 Somali
Avg Child mortality /1000
Linear trend line
0
40
80
120
160
200
Welfare other S. America E. Asia W. Africa E. Africa
Max
Avg Child mortality /1000
Min
0
25
50
75
100
Piracy=0 P>0 P>5 P>10 P>20 P>30 P>50 Somali
Max
Avg poverty %
Min
0
40
80
Welfare other S. America
East Asia West Africa
East Africa
Max
Avg poverty %
Min
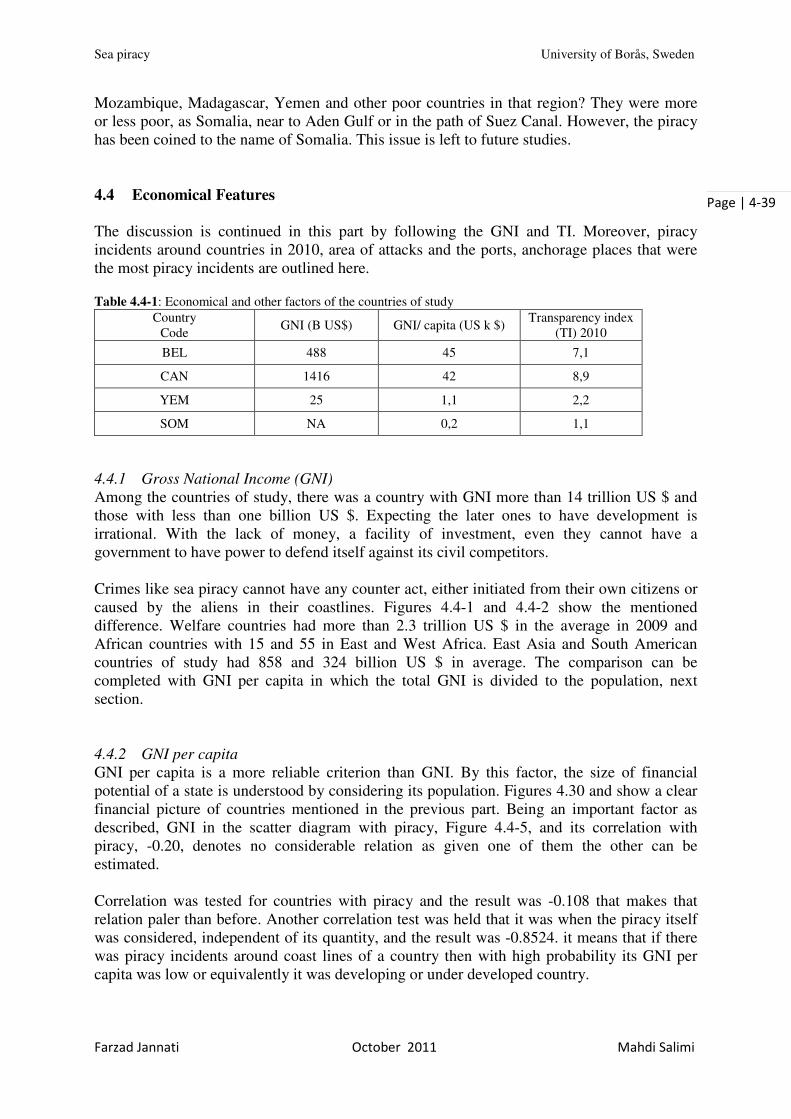
Sea piracy University of Borås, Sweden
Farzad Jannati October 2011 Mahdi Salimi
Page | 4-39
Mozambique, Madagascar, Yemen and other poor countries in that region? They were more or less poor, as Somalia, near to Aden Gulf or in the path of Suez Canal. However, the piracy has been coined to the name of Somalia. This issue is left to future studies. 4.4 Economical Features
The discussion is continued in this part by following the GNI and TI. Moreover, piracy incidents around countries in 2010, area of attacks and the ports, anchorage places that were the most piracy incidents are outlined here. Table 4.4-1: Economical and other factors of the countries of study
Country Code
GNI (B US$) GNI/ capita (US k $) Transparency index
(TI) 2010
BEL 488 45 7,1
CAN 1416 42 8,9
YEM 25 1,1 2,2
SOM NA 0,2 1,1
4.4.1 Gross National Income (GNI)
Among the countries of study, there was a country with GNI more than 14 trillion US $ and those with less than one billion US $. Expecting the later ones to have development is irrational. With the lack of money, a facility of investment, even they cannot have a government to have power to defend itself against its civil competitors. Crimes like sea piracy cannot have any counter act, either initiated from their own citizens or caused by the aliens in their coastlines. Figures 4.4-1 and 4.4-2 show the mentioned difference. Welfare countries had more than 2.3 trillion US $ in the average in 2009 and African countries with 15 and 55 in East and West Africa. East Asia and South American countries of study had 858 and 324 billion US $ in average. The comparison can be completed with GNI per capita in which the total GNI is divided to the population, next section. 4.4.2 GNI per capita
GNI per capita is a more reliable criterion than GNI. By this factor, the size of financial potential of a state is understood by considering its population. Figures 4.30 and show a clear financial picture of countries mentioned in the previous part. Being an important factor as described, GNI in the scatter diagram with piracy, Figure 4.4-5, and its correlation with piracy, -0.20, denotes no considerable relation as given one of them the other can be estimated. Correlation was tested for countries with piracy and the result was -0.108 that makes that relation paler than before. Another correlation test was held that it was when the piracy itself was considered, independent of its quantity, and the result was -0.8524. it means that if there was piracy incidents around coast lines of a country then with high probability its GNI per capita was low or equivalently it was developing or under developed country.
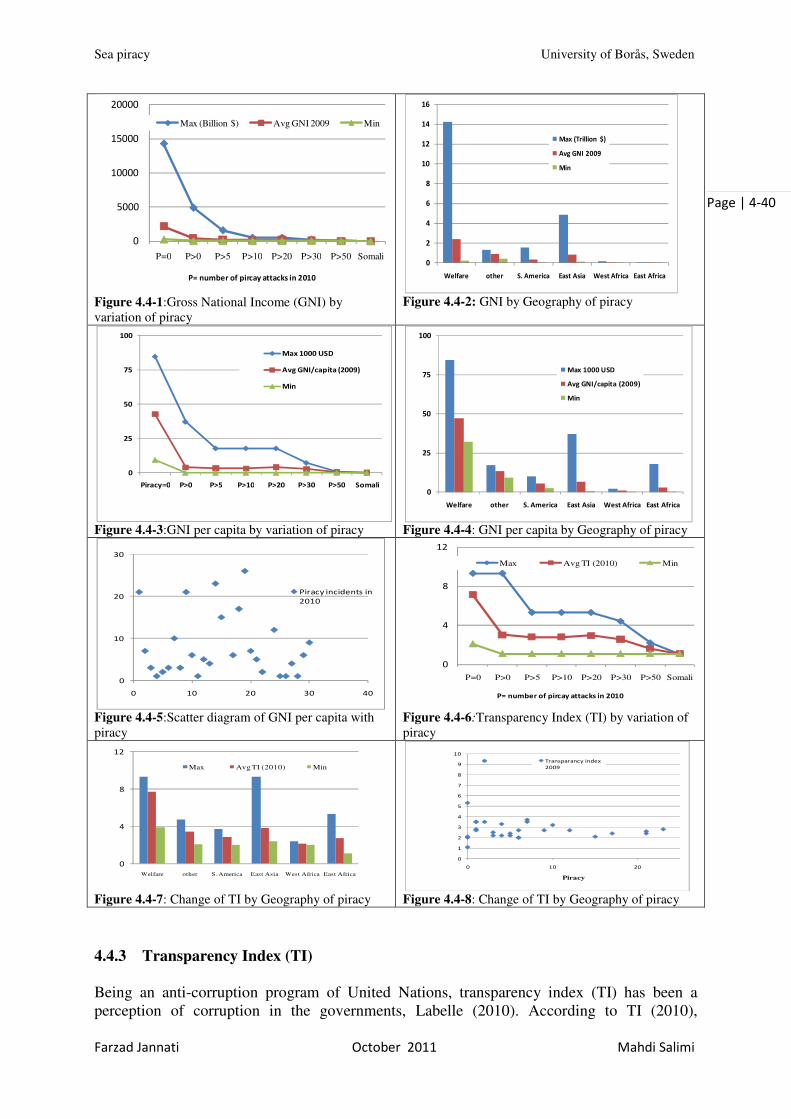
Sea piracy University of Borås, Sweden
Farzad Jannati October 2011 Mahdi Salimi
Page | 4-40
Figure 4.4-1:Gross National Income (GNI) by variation of piracy
Figure 4.4-2: GNI by Geography of piracy
Figure 4.4-3:GNI per capita by variation of piracy
Figure 4.4-4: GNI per capita by Geography of piracy
Figure 4.4-5:Scatter diagram of GNI per capita with piracy
Figure 4.4-6:Transparency Index (TI) by variation of piracy
Figure 4.4-7: Change of TI by Geography of piracy
Figure 4.4-8: Change of TI by Geography of piracy
4.4.3 Transparency Index (TI)
Being an anti-corruption program of United Nations, transparency index (TI) has been a perception of corruption in the governments, Labelle (2010). According to TI (2010),
0
5000
10000
15000
20000
P=0 P>0 P>5 P>10 P>20 P>30 P>50 Somali
P= number of pircay attacks in 2010
Max (Billion $) Avg GNI 2009 Min
0
2
4
6
8
10
12
14
16
Welfare other S. America East Asia West Africa East Africa
Max (Trillion $)
Avg GNI 2009
Min
0
25
50
75
100
Piracy=0 P>0 P>5 P>10 P>20 P>30 P>50 Somali
Max 1000 USD
Avg GNI/capita (2009)
Min
0
25
50
75
100
Welfare other S. America East Asia West Africa East Africa
Max 1000 USD
Avg GNI/capita (2009)
Min
0
10
20
30
0 10 20 30 40
Piracy incidents in
2010
0
4
8
12
P=0 P>0 P>5 P>10 P>20 P>30 P>50 Somali
P= number of pircay attacks in 2010
Max Avg TI (2010) Min
0
4
8
12
Welfare other S. America East Asia West Africa East Africa
Max Avg TI (2010) Min
0
1
2
3
4
5
6
7
8
9
10
0 10 20
Piracy
Transparancy index
2009

Sea piracy University of Borås, Sweden
Farzad Jannati October 2011 Mahdi Salimi
Page | 4-41
Singapore and Denmark with 9.3 TI had the most transparent governments, or the least corrupted, in the world. Somali with 1.1 was the most corrupted government among 178 states. The average of TI among welfare states in 2010 was 7.7 and while the average of none of the other groups in both figures exceeded 3.8. Further analysis in understanding the relation TI and piracy is its correlation with piracy and scatter diagram. Doing correlation analysis, a weak correlation of -28% was acquired. Moreover, when the piracy itself, independent of its quantity8, was considered the result of correlation analysis was as high as -76% that shows a strong reverse relation between piracy and transparency index. 4.5 Length of coast lines
Correlation of this factor with piracy attacks is less than -7% that shows no relation between the length and piracy attacks. By considering countries with piracy around this coefficient is «-3%» that rejects strongly the assumption of relation of coastlines with piracy incidents; (Charts bin 2011). Another example is the comparison between Syria and Singapore with the same size of coastlines that piracy has not happened in the waters of Syria but in Singapore and their economy, GDP per Capita and TI are very different.
Figure 4.5-1:Effect of length of coast lines on piracy
Figure 4.5-2:Effect of length of coast lines by Geography of piracy
4.6 Ship traffic9
There are 200 specific places as passages, straits and capes the ships have to pass through globally that just a few of them are strategic. As per studied, majority of modern sea piracy incidents have happened in the routes of Malacca Straits, Panama Canal and Suez Canal. Malacca Straits Each year 50 thousands vessels, approaching 300 000 DWT, pass through this Strait that accounts for 30% of trade and 11 million barrel petroleum daily. Sunda passage in Indonesia is its nearest alternative.
8 If there was any piracy incident then instead of exact number we substituted with 1 otherwise we put 0, then, the calculated correlation was -0.76357. 9 Rodrigue, J.P (2004), “Straits, Passages and Chokepoints, A Maritime Geostrategy of Petroleum Distribution”,
Cahiers de Géographie du Québec , Vol. 48, Nr. 135, pp. 357-374
0
50 000
100 000
150 000
200 000
P=0 P>0 P>5 P>10 P>20 P>30 P>50 Somali
P= number of pircay attacks in 2010
Max Avg length of coast lines (km) Min
0
50 000
100 000
150 000
200 000
Welfare other S. America East Asia West Africa East Africa
Max Avg length of coast lines (km) Min

Sea piracy University of Borås, Sweden
Farzad Jannati October 2011 Mahdi Salimi
Page | 4-42
Panama Canal
Having decreased 13 thousands km from the route, Panama Canal has played a strategic role in the economy of US. It has the capacity for 50 ships per day that accounts for huge amounts of world and about 12% of US international seaborne commerce. Suez Canal
Suez Canal, or equivalently Bab-el-Mandeb Strait, is the passage of approximately 40 vessels per day and as mentioned before 14% of world trade. It links Indian Ocean to Red Sea and Mediterranean Sea accordingly. As mentioned in chapter one, it is the availability of everything on the sea that stimulate greedy minds to have an eye on it.
Economical and length of coastline Features – Concluding discussion
GNI, GNI per capita, TI and length of coastlines were analyzed together with piracy in this section. An interesting issue was decreasing trend of both GNI and GNI per capita with piracy whilst there were no relation between important development parameters with piracy. It can be interpreted as giving one of them one cannot forecast the other; but according to merely correlation of piracy with GNI per capita and TI one can infer that if there was any piracy act then the country had lower GNI per capita and the government was highly corrupted. However, the GNI per capita was in relation with Transparency Index.

Sea piracy University of Borås, Sweden
Farzad Jannati October 2011 Mahdi Salimi
Page | 4-43
Chapter 4 A
A little more of Somalia
The East Africa in chapter three was introduced as the hottest piracy zone from the number of attacks and other parameters that is summarized later in this chapter. In chapter four, a country stated frequently. Its government was highly corrupted; the country itself was poverty stricken, highly under developed and … named Somalia. In this chapter, based on the previous knowledge, some literature review is done to understand this country more deeply. Somalia
Somalia is located in Africa, in a special region than is named Horn of Africa. It is also one of the Arab countries, World Bank (2011). Total area of Somalia is 637,657 km2, CIA (2011), in a highly strategic and at the same time crisis stricken region; (Lyons 2006). According to World Bank (2011), in 2009 Economy of Arab world was not too bad and had a GNI of 5250 US $ per capita (per person per year) in total that is counted as upper middle income. Sub-Saharan countries are African countries with 1250 US $ per capita all together. Least developed countries are those with 639 US $ per capita. According to World Bank, the population of the country was 9.36 million in 2010 with 2.47% increase compared with 2009. Its growth had an increasing rate in the last five years from 2.2% to the mentioned rate. Being a member of Arab world, Sub-Saharan, and Least developed countries and finally Horn of Africa, Somalia has a GNI of 150 US $ per capita in 1990 as there was no data from that year to date in World Bank (2011), a picture of absolute poor misery of people that only 7% have registered mobile phones. It has 3 internet hosts and ranked as 229th country in the world, while US with around 440 million internet hosts is the number one in the rank, (CIA 2011). From the 1.1 indicator for Transparency Index of the Somalia, one can conclude a highly corrupted government, (TI 2010 and Krath 2009). However, there was a wealth transfer with the amount of 14% of world trade including 26% of all oil exports from Suez Canal, (Kamola 2009). Somali piracy
According to an interview, Gettleman (2008) from New York Times, with the spokesperson of pirates that hijacked a Ukrainian ship with Russian tanks and various warfare weapons, with no previous planning they had just seen a big ship and stopped it and soon learned its value to reach $30 million going to Kenya or Sudan. Spokesperson, Sugule Ali, had emphasized to “money” as what they want and defended of their acts as patrolling in their coastlines to control the region against overfishing and dumping their toxic waste as he

Sea piracy University of Borås, Sweden
Farzad Jannati October 2011 Mahdi Salimi
Page | 4-44
mentioned them the real pirates. Of that entire weapon, they did want nothing, as he believed that it was the weapon that had produced many problems to their country. He has added that they could bargain. Gettleman (2008) has said according Somali officials that “piracy industry” had been started as a response to illegal fishing. Based on a documentary from Krath (2009), in an interview, “Abdirashid”, the most active pirate in Eyl of Somalia, described the characteristics of a successful pirate as, good ability in swimming, drive motor boats, dare to go onboard on the big ships and be able to use AK-47 easily. Moreover, the following dialogue was English talks of Robert Krath and translated from the Swedish subscripts of Abdirashid. A denotes for Abdirashid and R denotes for Robert, the interviewer.
A We need two motor boats and a mother boat. When the boats catch the ship they go up and arrest the captain by guess.
R How much you get for hijacking and what do you do with the money? A 10 to 30000 $. It goes to parties. Such money is spent in stupid things. R Are not you afraid? How is your feeling? A No, I feel victory. A pirate knows nothing unless the hijacking. R How you manage the operations? A We talk in the boat: you go up and climb the ship, you stay here… The more
successful the pirate the less he goes to the sea. It seems very clean business [like fishing] for the pirates in the land.
Answering to “how you get informed that a ship is coming” another pirate replied that it was like hunting and they went there and waited for fortune. In another part, he concluded that the pirates, who used to be fisher in the past, did their crimes with no mercy and care about anything as pirates, there were some land pirates doing supporting activities as a pure business. In his film, Krath (2009) has interviewed with the president of Somalia, some authorities, pirates and common people. A corrupted government, being transient since Somalis civil war in 1991, that was helping the pirates as nobody rejected the assumption of bribery. Kamola (2009), addressing international attention to the piracy especially in Somalia, has addressed several issues regarding critiques concerning this issue. Among them are the following points:
• There is a hypothesis of connection between the Somalia pirates and dangerous terrorist groups like Al-Shabaab that has made it hot topic;
• Various groups of activists pointed it as a out-of-date act that affect economy; • Another evidence, may be best of them, denoted it as a reaction to the extreme poverty
of the region. Or, similarly, a self defense toward sustainability of the region; • Small to medium sized ships had been captured previously; and when it turned out to
ever more with huge ships, global attention come to the scene; • United Nations issued resolutions 1816 letting the ships to chase pirates within their
own territorial waters and 1836 motivating them to bring naval ships air forces to the region. As a result of the above resolutions, a tremendous amount of military equipments and air and naval forces established in that area illustrating international interference against piracy;

Sea piracy University of Borås, Sweden
Farzad Jannati October 2011 Mahdi Salimi
Page | 4-45
• It seems that the emphasize of international law in opposition to piracy is to guarantee the money transfer from the Gulf of Aden while Somalia is just witnessing this flow and suffers from many problems.
• Kamola, (2009) concludes that the internationally emphasized war against pirates is equivalent to handcuff the "shoplifters" and release the massacre.
From the Aden Gulf twenty thousand various vessels, approved by many as (Kraska and Wilson (2009) or US Maritime Industry Report (2008), passed annually that transfer merchandise including 12 percent of daily global oil requirement. Pirates of Somalia, reminding 16th and 17th centuries Barbary attacks inn Mediterranean Sea, were holding 300 hostages from 25 countries. According to Kraska and Wilson (2009), it was estimated that between 1400 and 2000 Somali pirates were active in that region; as hijacking could give US $10000. November 2008 was a fruitful month for pirates as they hijacked a chemical tanker with dozens of Indian crew, Fiana with the flag of Ukraine transporting 33 tanks to Sudan and the Sirus Star, a supertanker carrying USD 100 000 000 oil for the United States five hundred miles off the coasts of Kenya. The area Somalia pirates did operation was 6.48 million square kilometers, including Red Sea, Aden Gulf, Arabian Sea and moreover in the western part of Indian Ocean.
Combat against Somali piracy
As the combat, manage and getting rid of piracy was not in the scope of this project, this section is not going to get in deep in the subject, unless mention to the alliance of international naval cooperation in 2008 was an extraordinary anti-piracy campaign that had not been seen for centuries (Forbes 2011). As a final word, Kraska and Wilson (2009) gave the sustainable solution as ruling of law by a stable government in the land rather than military operations. Regional cooperation among East African countries were required to eliminate the piracy problem to “protect freedom of the seas, which is the basis of international trade and shared economic prosperity.”

Sea piracy University of Borås, Sweden
Farzad Jannati October 2011 Mahdi Salimi
Page | 5-46
Chapter 5
5 Final Analysis, discussion and conclusion
n this chapter all the data and information acquired in previous chapters will be used to give the comprehensive understanding of the how this crime was done, and points to
development and economical indices of countries which have pirate attacks and finally, the Somalia as the eye of the project is studied. These are gathered here and illustrated in a framework according our understanding. The practical limitations and implications like those in IMO reports and some comments and critiques to chapter four are studied as another important issue. We start this chapter with a summary of all the process of project. 5.1 Project up to now
The project started with a historical background of sea piracy and its origination. Then sea transportation was introduced as the channel and media that has facilitated it. Objectives of the project were determined as to increase its understanding by the way the pirates do this act. Some parameters that could be the cause of this act and mentioned on the references was searched to be studied and accounted. According to the methodology, we shuffled all the reports of IMO in general and its periodical reports on the sea piracy and armed robbery on the ships peculiarly. Annual reports of within 1998-2010 together with monthlies’ of 2009 were observed and selected to manipulate. Accordingly, a database was prepared and the primary figures, diagrams and tables and analysis were performed afterward. Next step of understanding was to go in to the states and do a multilateral study on variety of issues. As mentioned before, the aim was to increase understanding by development and other state factors. Chapter four was devoted to this and some social, economical and governmental factors were seen and a simple to thorough study was done and fact based results were highlighted. Somali as the kingpin of the sea piracy in the late 2000s was studied from various media and researcher points of views. Having all the primary investigations done, the aim of this chapter is to have a helicopter view and manipulate the data to consolidate the understanding and shape our vision and contribution on the subject. 5.2 Sea piracy and its parameters:
Global sea piracy, piracy in hot zones and their parameters were summarized and analyzed in this chapter. During studying the IMO reports some discrepancies were found out which can affect the analysis, these items are discussed in chapter as well. 5.2.1 Global Sea Piracy
In chapter 3, the IMO piracy annual reports in a 13 years studying periods (1998-2010) and 12 monthly reports(January till December of 2009) were reviewed and by a preliminary
I

Sea piracy University of Borås, Sweden
Farzad Jannati October 2011 Mahdi Salimi
Page | 5-47
analysis the parameters of sea piracy were reviewed individually in global and local zones. Considering the chapter 3 the global piracy and its parameters can be summarized as following table Table 5.2-1: Global Piracy and its parameters
Parameter Status Reference
Attacker Numbers
From 2007 the “5=<Attackers=<10” (medium group) starts an increasing rate so that on 2008 and upward has the maximum rate within other cases
Figure 3.4-2:
Global Piracy and
Attacker Numbers
Ship Location From 2006 the “international water” starts an increasing rate so that on 2008 and upward has the maximum rate within other locations
Figure 3.5-2:
Global Piracy and
Different Location
Ship Status From 2006 the “steaming” starts an increasing rate so that on 2008 and upward has the maximum rate within other ship status case
Figure 3.6-2:
Global Piracy and
Ships Status
Weapon Type From 2006 the “gun” starts an increasing rate so that on 2008 and upward has the maximum rate within other weapon types
Figure 3.7-2 and
3.7-4
Success Status
From 2006 the “not boarded” starts an increasing rate so that on 2008 and upward has the maximum rate within other success cases
Figure 3.8-2:
Global Piracy and
Success Status
Consequences
From 2006 The “hijacking” starts an increasing rate (400% more than before).
Figure 3.9-2:
Global Piracy-
Consequences on
the studying period
5.2.2 Piracy in hot zones and its parameters
The piracy parameters in hot zones were discussed separately in the chapter 3. To analyze the piracy in hot zones a summary of piracy parameters trend in these zones is brought in table 5.2-2. Considering the table 5.2-1 and the global status of piracy parameters before and after 2006, the piracy parameters in hot zones are analyzed in three periods 1998-2010, 1998-2005 and 2006-2010 locally and globally. According to this table:
1) All parameters rate (except Actual violence and medium group attacker numbers): a. have the maximum global and local average rate in East Africa within 1998-
2010; b. The “average based on global piracy” in 2nd period is about 6 to 9 times more
than first period while in the other zones such an increasing is not observed. 2) Although the global and local average rates of “Actual violence” and “Medium Group
Attacker” in East Africa in studying period are not the maximum within other hot zones but the global and local increasing rate from 1st period to 2nd period in this zone are more than the other zones and can be highlighted.
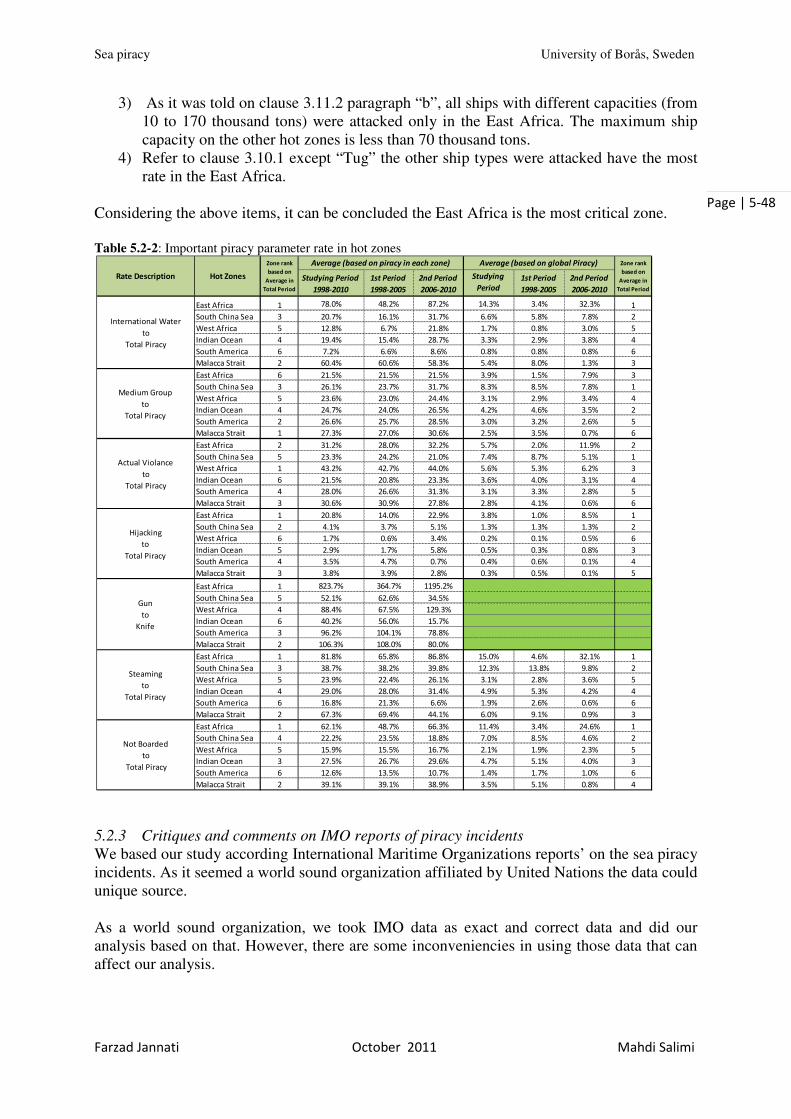
Sea piracy University of Borås, Sweden
Farzad Jannati October 2011 Mahdi Salimi
Page | 5-48
3) As it was told on clause 3.11.2 paragraph “b”, all ships with different capacities (from 10 to 170 thousand tons) were attacked only in the East Africa. The maximum ship capacity on the other hot zones is less than 70 thousand tons.
4) Refer to clause 3.10.1 except “Tug” the other ship types were attacked have the most rate in the East Africa.
Considering the above items, it can be concluded the East Africa is the most critical zone. Table 5.2-2: Important piracy parameter rate in hot zones
5.2.3 Critiques and comments on IMO reports of piracy incidents
We based our study according International Maritime Organizations reports’ on the sea piracy incidents. As it seemed a world sound organization affiliated by United Nations the data could unique source. As a world sound organization, we took IMO data as exact and correct data and did our analysis based on that. However, there are some inconveniencies in using those data that can affect our analysis.
Studying Period
1998-2010
1st Period
1998-2005
2nd Period
2006-2010
Studying
Period
1998-2010
1st Period
1998-2005
2nd Period
2006-2010
East Africa 1 78.0% 48.2% 87.2% 14.3% 3.4% 32.3% 1
South China Sea 3 20.7% 16.1% 31.7% 6.6% 5.8% 7.8% 2
West Africa 5 12.8% 6.7% 21.8% 1.7% 0.8% 3.0% 5
Indian Ocean 4 19.4% 15.4% 28.7% 3.3% 2.9% 3.8% 4
South America 6 7.2% 6.6% 8.6% 0.8% 0.8% 0.8% 6
Malacca Strait 2 60.4% 60.6% 58.3% 5.4% 8.0% 1.3% 3
East Africa 6 21.5% 21.5% 21.5% 3.9% 1.5% 7.9% 3
South China Sea 3 26.1% 23.7% 31.7% 8.3% 8.5% 7.8% 1
West Africa 5 23.6% 23.0% 24.4% 3.1% 2.9% 3.4% 4
Indian Ocean 4 24.7% 24.0% 26.5% 4.2% 4.6% 3.5% 2
South America 2 26.6% 25.7% 28.5% 3.0% 3.2% 2.6% 5
Malacca Strait 1 27.3% 27.0% 30.6% 2.5% 3.5% 0.7% 6
East Africa 2 31.2% 28.0% 32.2% 5.7% 2.0% 11.9% 2
South China Sea 5 23.3% 24.2% 21.0% 7.4% 8.7% 5.1% 1
West Africa 1 43.2% 42.7% 44.0% 5.6% 5.3% 6.2% 3
Indian Ocean 6 21.5% 20.8% 23.3% 3.6% 4.0% 3.1% 4
South America 4 28.0% 26.6% 31.3% 3.1% 3.3% 2.8% 5
Malacca Strait 3 30.6% 30.9% 27.8% 2.8% 4.1% 0.6% 6
East Africa 1 20.8% 14.0% 22.9% 3.8% 1.0% 8.5% 1
South China Sea 2 4.1% 3.7% 5.1% 1.3% 1.3% 1.3% 2
West Africa 6 1.7% 0.6% 3.4% 0.2% 0.1% 0.5% 6
Indian Ocean 5 2.9% 1.7% 5.8% 0.5% 0.3% 0.8% 3
South America 4 3.5% 4.7% 0.7% 0.4% 0.6% 0.1% 4
Malacca Strait 3 3.8% 3.9% 2.8% 0.3% 0.5% 0.1% 5
East Africa 1 823.7% 364.7% 1195.2%
South China Sea 5 52.1% 62.6% 34.5%
West Africa 4 88.4% 67.5% 129.3%
Indian Ocean 6 40.2% 56.0% 15.7%
South America 3 96.2% 104.1% 78.8%
Malacca Strait 2 106.3% 108.0% 80.0%
East Africa 1 81.8% 65.8% 86.8% 15.0% 4.6% 32.1% 1
South China Sea 3 38.7% 38.2% 39.8% 12.3% 13.8% 9.8% 2
West Africa 5 23.9% 22.4% 26.1% 3.1% 2.8% 3.6% 5
Indian Ocean 4 29.0% 28.0% 31.4% 4.9% 5.3% 4.2% 4
South America 6 16.8% 21.3% 6.6% 1.9% 2.6% 0.6% 6
Malacca Strait 2 67.3% 69.4% 44.1% 6.0% 9.1% 0.9% 3
East Africa 1 62.1% 48.7% 66.3% 11.4% 3.4% 24.6% 1
South China Sea 4 22.2% 23.5% 18.8% 7.0% 8.5% 4.6% 2
West Africa 5 15.9% 15.5% 16.7% 2.1% 1.9% 2.3% 5
Indian Ocean 3 27.5% 26.7% 29.6% 4.7% 5.1% 4.0% 3
South America 6 12.6% 13.5% 10.7% 1.4% 1.7% 1.0% 6
Malacca Strait 2 39.1% 39.1% 38.9% 3.5% 5.1% 0.8% 4
Not Boarded
to
Total Piracy
Rate Description Hot Zones
Average (based on piracy in each zone)
International Water
to
Total Piracy
Medium Group
to
Total Piracy
Actual Violance
to
Total Piracy
Hijacking
to
Total Piracy
Average (based on global Piracy)Zone rank
based on
Average in
Total Period
Zone rank
based on
Average in
Total Period
Gun
to
Knife
Steaming
to
Total Piracy
Sea piracy University of Borås, Sweden
Farzad Jannati October 2011 Mahdi Salimi
Page | 5-49
5.2.3.1 Validity of data
One of the concerns of response to piracy is the validity of data. The primary source data till now has been constructed by the International Maritime "Bureau" (IMB) Piracy Reporting Center in Kuala Lumpur, Malaysia, according to IMO on "Reports on piracy and armed robbery"; as it says: "If you are a registered GISIS user, you can create your own piracy reports soon; (http://gisis.imo.org/Public)". The mentioned report is taken as fact-to-figure and become the source of journalists, analysts and consequently a basis for international decision making. Based on Forbes (2011), in the piracy incidents reported to IMB there are two kinds of suspicions as:
• Some ships exaggerates regarding the piracy parameters which they faced with; • Surprisingly, a resistance to not reporting the real cases is another problem that
happens because of avoiding involving in police investigations that can lead to several days of delay in the journey. Apparently, these facts produce some fake data of actual piracy.
5.2.3.2 Delayed reports
By comparing the date of issue and related month or year, one can conclude its punctuality. Examples are Sep 2008 issued on Mar 2009, January 2009 issued on May 2009, January 2010 that issued on April, and January 2011 that issued on Mar 2011. These are not signs of an on-time and interactive system and cannot be used as an action based.
5.2.3.3 Geographical reporting in IMO
In spite of existence of longitude and latitude of incident place in monthly reports, there are some geographical classifications in annual reports that can make problem in understanding the real zone on incident as follows: In America region, in some annual reports they have South America Caribbean, South America Pacific, and South America Atlantic. There were some reports that easily said South America. According to annual report of 2004 on piracy, the South America region has been separated to three regions as mentioned above from the January of 2003. The regions in Somalia area were reported as Red Sea, Aden Gulf, Arabian Sea, East of Africa, and Indian Ocean. As in the “definition” part, Oman Sea is a part of Arabian Sea and this is a part of Indian Ocean. On the other hand, East of Africa that located in the Indian Ocean can be interpreted as part of Arabian Sea. So, in the IMO reports Indian Ocean has a meaning other than its geographical sense. In the East Asia, South China Sea, Indian Ocean, Malacca Straits, Far East, and in some reports “other far east” have been mentioned. These classifications can mislead or confuse the reader as they were not mentioned continuously and cannot be used as traceable regions.
5.2.3.4 Data Contradiction
There are some contradictions in IMO piracy reports. For example different number of annual sea piracy is achieved considering different parameters on the same year (The contradictions are highlighted on table 5.2-1) or when the monthly report is summarized to annual report the result in some cases is differ from annual report.

Sea piracy University of Borås, Sweden
Farzad Jannati October 2011 Mahdi Salimi
Page | 5-50
Table 5.2-1:Contradiction on IMO annual piracy reports
An evidence for contradictions is the column of grand total that varied among different parameters. 5.3 Connection of piracy with different factors
In this section, behaviors of some of different factors with the phenomenon are discussed. Among the possible factors, one can mention globalization, poverty, government's corruption, ship traffic, length of coastlines, military alliances and treaties, political relations, geographical situation of country, geographical situation of ships, civil instabilities. Table 5.3-1: Conclusion for chapter four; a) the situation or trend of the studied factor by having piracy and/or with increase of it; b) understood dependency to other factor in the study
Factor Observed relation
with Piracy Description
Population No It was discussed by various statistical tools that there was no relation between size of population and piracy.
Population growth ����10 Population growth is significantly high in the countries with higher piracy incidents happened around in 2010.
Rural rate ����
The average “rural population rate” in countries with no piracy was 21%. Then, with an increasing trend, it became 67% for countries with more than 50 piracy incident.
Population pyramid
Age <15
15<age<65
Age >65
����
����
����
The more piracy acts happened around the states, the higher was the rate of “<15”, compared with other ages.
Urban or Rural access to simple life facilities (like sanitation water)
���� Based on the study more piracy has happened in the courtiers with lower simple life facilities.
Literacy (for the people above 15-year-old)
���� Ability of reading and writing, the studied parameter, is the minimum level of assigning literacy to a person; that has decreased among courtiers with more piracies.
Unemployed Not
10
This is a holistic view of chapter four by a qualitative sign of ����or ����as indices of increasing or decreasing trend respectively rather than magnitude and specific figures as they were discussed there.
1998 1999 2000 2001 2002 2003 2004 2005 2006 2007 2008 2009 2010 Grand Total
Success 210 309 471 374 383 452 330 266 240 282 303 406 484 4510
Status 210 309 471 370 383 452 330 266 240 282 306 406 489 4514
Gun 212 309 471 370 382 427 330 266 240 282 299 406 489 4483
Consequences 210 309 471 370 383 452 330 266 240 282 307 406 489 4515
Pirates No. 210 309 471 372 383 452 330 266 240 283 306 406 489 4517
Location 210 309 471 370 383 442 330 266 240 282 306 406 489 4504

Sea piracy University of Borås, Sweden
Farzad Jannati October 2011 Mahdi Salimi
Page | 5-51
Factor Observed relation
with Piracy Description
Labor participation ����
The study showed an interesting difference among countries with/without piracy. The total trend was decreasing with the increase of piracy, but geographically it was different. In spite of the fact that the labor was significantly more interested to work in countries other than welfare states, rate of participating labor to total population was just a little more than welfare states.
Life expectancy ���� The hopelessness to life had apparent characteristics of countries with piracy around; and it decreases with the increase of piracy.
Pop. Growth ���� The population growth among those with piracy around was higher.
Poverty No data There was no data for welfare states and Somalia. However, West and East Africa were the poorest countries.
Mortality of children under 5 years old -per 1000 (2009)
����
As poverty, Africa had the highest mortality rate with the maximum in Congo D. R. and Somalia with 180 and 200 respectively. Average mortality rate was 6 in 1000 children in 2009.
GNI (B US$) ����
There was an obvious difference in average among those with piracy incidents around and those with no piracy. Average GNI for welfare states was more than 2 trillion USD and there were countries with less than one billion.
GNI/ capita (US k $) ����
The trend was as the GNI but a little different. Being high or low of GNI and GNI per capita and their different effects on the development of a country is out of the scope of this project. However, different scenarios of GNI, GNI per capita and other possible factors are viable studies and not specific to the sea piracy and a matter of this project.
TI (2010) ���� The governments of piracy stricken states were less transparent in comparison with the other group.
Length of Coast line km No
It was discussed enough before that there is no relation between the length and piracy incidents. Indeed, coastline is necessary to piracy crimes, but this was not discovered as to be affecting factor in direct or reverse relation with piracy incidents.
Ship traffic ������������
Based on our knowledge from chapter one and four this is a significant and highly influencing factor in the piracy.
Sea piracy University of Borås, Sweden
Farzad Jannati October 2011 Mahdi Salimi
Page | 5-52
5.3.1 Critiques of studies in chapter four The constraints of the study held in chapter four can be categorized in three groups as selected countries, parameters and piracy numbers that mainly arouse due to the base of study that adopted its piracy incidents from piracy map of ICC (2011). Countries
As seen, it does not include all the countries with coastlines. This problem statistically can lead to a bias toward the result that researchers may use/abuse it to get their own conclusion. There were many countries with coastlines that not included in the study and can affect the results. Nearly all of countries that piracy incidents happened around them in 2010 were included in the study. Countries with no piracy are OECD members, NATO members, or have high GDP per capita that can and could have affected the results; otherwise could give completely other results.
The reason was a pre-assumption of the effect of the mentioned collaborations in the study. As seen, there were no piracy incidents around these countries; but the study has not included all the countries with coastlines with no piracy. On the other hand, even countries with some piracy around like Egypt or Madagascar that could have a limited effect were not participated.
Factors and parameters
The reader may wonder of the parameters included to understand the piracy. In the World Bank, CIA and other sources one can find thousands of factors and parameters related to a country. Based on the literature review in the previous chapter, economical situation, length of coastlines, government corruption and some other development parameters were chosen and used. We think that some of the chosen parameters were independent and main like GNI; but, there were others that are dependant to these like, poverty or TI that are dependant to GNI per capita. Furthermore, there are factors like ship traffic, coastlines and population that were not dependent to any other factor. A key element like ship traffic together with other factors seems to complete the chain of potential of committing the sea piracy crimes.
Piracy numbers
Another group of critiques is related to the piracy numbers. First, it is related to 2010. In this case, all the analysis could be changed if other year or period had been considered. Moreover, the numbers were different from those in the IMO reports.
Being adopted from ICC, piracy numbers were those piracy incidents in the 200 kilometers of coastlines of states. Other issue was the piracy number around Somalia; in which we allocated all the piracy in that region to it; that can be seen as exaggerating the subject by violating the mentioned distance criterion.
Being valid of these critiques, it was a simple study held to enhance the understanding of modern sea piracy and no more; and incidentally good results were taken out from it. However, these critiques can be solved in a future study by including all the countries with coastlines, considering and discussing the most relevant and effective factors and figures. For the purpose of this project, some top extremes were chosen to give obvious results; as the aim was to increase understanding on the sea piracy.

Sea piracy University of Borås, Sweden
Farzad Jannati October 2011 Mahdi Salimi
Page | 5-53
5.4 Somalia
As a general view of understanding the cradle of the hottest piracy zone, Somalia was studied in previous chapter and summarized here.
Table 5.4-1:Summary about Somalia
Title Description
The country Somalia is a highly undeveloped state with a corrupted government.
Piracy According to chapter three and four A, modus operandi of Somali sea piracy attacks were studied thoroughly. One can say that there is a one of a kind phenomenon that occupied the world with itself.
Other factors
Powerful government, regional alliances of all kind of collaborations, connection with terrorist groups and many possibly others factors are important in increasing or controlling the piracy incidents. However, this project has not dealt with this part, although it was mentioned in some places.
Combat Many methods that has been studied and practiced can be found in the literature. What we included in chapter four A, was to jot down as clues of understanding the subject but not to scrutinize. The reader is invited to follow this issue in the related materials and references out of this project.
5.5 Framework
In this section, we summarize our understanding as depicted in Figure 5.5-1. A common sense tells us that there are internal links between people and government; as the people make the country by forming the government that in turn attempts to develop the state. This product, the country, is an important issue in shaping the image of the people as well. Going further in detail can be studied in another opportunity. However, this circle forms the piracy beliefs: “how it looks like for some people” can make potentials and stimulate toward piracy incidents. One can infer from the studies in the project that it has to be an organized act but not just by going to the sea and do something like fishing. An implication from this project can be the existence of organization for piracy acts; but not its circumstances in detail. As seen in the figure 5.5-1, the attacked ships with existed stuff affect the supply chain. The size of effect and even if it affects the other issues like governments, people’s life and many items were not studied.

Sea piracy University of Borås, Sweden
Farzad Jannati October 2011 Mahdi Salimi
Page | 5-54
Figure 5.5-1: Piracy framework
5.6 Generalization
It was learned that: Being at least 70 % of the area of earth surface, sea has been cradle of majority of businesses to convey, ripen and fetch their commodities to the hands of next customer up to end customer. Moreover, fishing, sailing, sport opportunities, cruise ships, military naval controls, research vessels and possibly other types of seaborne businesses/ and affairs /activities have been conveyed on or in the waters. Beyond territorial waters, high seas, is the area of everybody and nobody; interpreted as all the states can do their businesses on the international seas but at the same time, nobody takes the responsibility of guarding it, in general; unless there are good reasons and having ability. Pirates have had variety of accomplishments in the study period, 1998-2010. In the South America and Caribbean region, only they attacked with the primary equipments, on the ports and anchorages, while the vessel was not in steaming. Their accomplishment was limited to steal something and left the ship. The attacks in the South China Sea were as they were before with a slight increasing trend in some attacking parameters. Malacca Straits was no more the problem for sea transportation in the end of 2000s. There were some limited pirate attacks in the Indian Ocean around countries like Bangladesh, India and others in that region. East Africa was another story. Emerging in the last part of previous decade, namely within 2006-2010, the world experienced sea piracy as a phenomenon. They attacked to any kind of ships, at any size, in a region as big as the area of Europe, (Karjel 2009). High tactical attacks, using GPS and mobile phones, enormous hijacks craving for only ransom money and many others facts, made East Africa, Arabian Sea, Aden Gulf, and Red Sea piracies to be called as phenomenon. The more poverty-stricken countries has seen majority of those attacks. Illiterate people, lower life expectancy, lower level of health care, high rural population rate, dominance of young people, lower incomes were the characteristics of the countries that piracy incidents have been happened around those states; while the attacks occurred ranging from ports up to hundreds of kilometers in the high seas. These evidences were seen based on valid resources and literature. However, statistical dependency cannot mean existence of cause and effect relation between two factors. As an example, if there is a poor country, with an unstable and corrupted government, one cannot expect to witness sea piracy crimes. On the other hand, states with powerful governments and welfare countries were not the arena of such incidents
Pirates
Supply chainOrganize attacks to
the ships with minimum protection
Piracy
beliefs
Country
People
Government
Sea piracy University of Borås, Sweden
Farzad Jannati October 2011 Mahdi Salimi
Page | 5-55
except a few numbers of them. Although coastlines is a necessity to access to waters and do the sea piracy crimes, yet occurring of these acts is independent of length of coastlines.
Ship traffic, however, plays an important role in the occurrence of this phenomenon. Indeed, it can be the flow of variety of nearly everything on waters with minimum protection, as being territory of everybody and nobody, which stimulates greedy minds to think and justify piracy views.
Somalia, on the other hand was a selected land not by authors whereas the results of studies showed that. Somalia pirates have been problematic for supply chain and shipping industry. It has turned out as the concern of many countries. Moreover, it was seen in previous chapters that this country is highly undeveloped, with the most corrupted government.
If one relies on the resources of IMO, World Bank, TI and CIA then he/she may encounter with a mind dilemma of possibility of those attacks by bare hands; as these people have nearly nothing to eat, how got that training to do such a torrent of attacks that has surprised some US navy commanders. Well, this is left to a future study and not a task for here

Sea piracy University of Borås, Sweden
Farzad Jannati October 2011 Mahdi Salimi
Page | 6-56
Chapter 6
6 Conclusion
In this project, the modus operandi of the modern sea piracy was studied. Acquiring data from IMO reports on sea piracy within 1998-2010 and producing a suitable database, the authors learned that the Malacca Strait is no more problem for sea transportation; South China Sea and South America were more or less as before with no special change. However, East Africa representing Somalia pirates has been problematic for ships in the late 2000s. Attacking in international waters to any kinds of ships while the ship was at steaming with the middle-sized group of pirates, between 5 to ten pirates, using various guns and explosives, being the number one in the hijacking of the ships, and craving ransom money were the characteristics of these new emerged pirates. On the other hand, piracy incidents have happened around countries with lower income states, mainly around developing or less developed countries with lower literacy and life expectancy rates, the more corrupted, meaning lower transparent governments, and higher child mortality. These are what was in the databases and statistically are true for those that have been utilized for analysis; but statistics itself cannot necessitate a cause and effect relation between factors and responses. Due to emerging Somalia pirates after 2006, all analysis in the previous chapters were affected which all the study results could be changed by eliminating that region. Statistics within 1998-2006 is very different from 2006-2010 in chapters three and potentially it could be different for chapter four. Piracy incidents have happened mainly on three ship routes: Malacca Straits, Suez Canal, and Panama Canal. So, ship traffic as mentioned in chapter one is a driver and the first necessity to have such phenomenon. On the other hand, the pirates logically have to be inhabitants of a state with coastlines; but there was no relation between the length of coastlines and piracy incidents.

Sea piracy University of Borås, Sweden
Farzad Jannati October 2011 Mahdi Salimi
Page | 7-57
Chapter 7
7 Future Study
Making certain from the process of databases of piracy incidents to assure the validity, punctuality, accessibility and timeliness is a desired item for researchers and other beneficiaries. A missing link in the piracy is to discover their supply chain: how they are equipped, informed, marketing and sale and who are sponsors and supporting them; and finally, what is the role of government in each case. Redoing this study once the previous part is done can give more relevant out puts.Doing the economical studies with all the countries with coastlines and connecting to piracy is suggested in completion and creditability of studies in chapter four. Another line of future studies is the investigation on the losers and beneficiaries of sea piracy. End customers and consumers, insurance companies, governments, ship crew, shipping industry, supply chain members and security and some military groups have to be studied to evaluate their loss or gain. The last but not the least suggested future study is the way to eliminate this act. Many ways have been tried and suggested; a multidisciplinary analysis of methods can enlighten the optimum method for counter piracy operations.

Farzad Jannati October 2011 Mahdi Salimi
Page | a
References
AMSA (2009), “ARCTIC MARINE SHIPPING ASSESSMENT Current Marine Use and the AMSA Shipping Database”, United States Coast Guard. pp. 70-91
Calvert J. B (2003), “The cargo ship”, accessed at http://mysite.du.edu/~jcalvert/tech/fluids/cargo.htm last revised 2003/07/27
Cambridge Dictionary (2011), Definition: High seas”, Cambridge Advanced Learner's Dictionary http://dictionary.cambridge.org/dictionary/british/the-high-seas
CIA (2011),"The world fact book, Somalia, geography", accessed on https://www.cia.gov/library/publications/the-world-factbook/geos/so.html, last updated on 2011/06/14
Charts bin (2011),”Length of Coastline by Country”, last accessed on 2011/09/13 at: http://chartsbin.com/view/ofv
Forbes, A. (2011)," International Law, Naval Cooperation and Piracy, Australia’s Response to Piracy: A Legal Perspective, Papers in Australian Maritime Affairs, No. 31 Copyright Commonwealth of Australia 2011
Garfinkel, I. and Smeeding, T. (2010),”Wealth and Welfare States: What Is the Real Story? Columbia University, Columbia Population Research Center, Institute for Research on Poverty, Discussion Paper no. 1387-10
Gettleman, J. (2008), "Somali Pirates Tell Their Side: They Want Only Money", New York Times, Published: September 30, 2008
ICC (2011),”IMB Piracy Map 2010”, Commercial Crime Services (CCS), a division of International Commercial Chamber (ICC), last accessed on 2011/10/24 at: http://www.icc-ccs.org/index.php?option=com_fabrik&view=visualization&controller=visualization.googlemap&Itemid=219
IMO (2011),"Action Plan to promote the 2011 World Maritime Day theme", last accessed on 2011-06-25 at: http://www.imo.org/About/Events/WorldMaritimeDay/Documents/WMD%20theme%20launch%203%20Feb%202011%20all%20speeches.pdf
Kamola, I. (2009),"Critical investigations into humanitarianism in Africa, “Piracy” in the Gulf of Aden: Profit, Media, and Superpower Redemption? Part I: Pirates in the Gulf of Aden: “The enemies of mankind?” Last edited: 2009/12/15, accessed at: http://blogs.uci.edu/cihablog/2009/12/15/piracy-in-the-gulf-of-aden-profit-media-and-the-superpower-redemption-1/, Filed under Imagining Africa and Africans
Karjel, R. (2009), "UR Samtiden – Piratjakt utanför Somalia, att jaga pirater", A TV program from SVT, last accessed on 2011-06-10 at: Urplay.se/163334
Sea piracy University of Borås, Sweden
Farzad Jannati October 2011 Mahdi Salimi
Page | b
Kraska, J. and Wilson, B. (2009),"Diplomatic Efforts against the Gulf of Aden Pirates, A Model from the Gulf of Guinea", Harvard International Review, last accessed on 2011/08/12 at: http://hir.harvard.edu/diplomatic-efforts-against-the-gulf-of-aden-pirates?page=0,0
Krath, R. (2009), "Världen: Hos Somalia pirater", A TV program from SVT, last accessed on 2011-06-10 at: http://libris.kb.se/bib/12017018
Labelle, H. (2010),"The 2010 Corruption Perceptions Index", a video clip from the Transparency International chair, Last accessed on 2011-09-11 at: http://www.transparency.org/policy_research/surveys_indices/cpi/2010/multimedia
Lloyd’s MIU Handbook of Maritime Security (2009), Edited by Rupert Herbert-Burns, Sam Bateman, Peter Lehr, CRC Press Taylor and Francis Group
Lumsden, K. (2011), “Economy of Transportation systems”, Book, Chalmers University, Göteborg, Sweden
Lyons, T. (2006),"Avoiding Conflict in the Horn of Africa: U.S. policy toward Ethiopia and Eritrea, CSR NO. 21, Council on Foreign Relations
National Geography (2011), "National Geography", accessed on 2011-07-06 at: http://www.nationalgeographic.com,
Pike, J. E. (2006), "Military: privateers", accessed at: http://www.globalsecurity.org/military/agency/navy/privateer.htm, last modified: 2006/07/17
Pidwirny, M (2010),"Encyclopedia of earth, Ocean", Edited by J. Emmett Duffy, Last edited: 2010/12/20 accessed on 2011/06/04 at: http://www.eoearth.org/article/Ocean
Royal Naval Museum Library (2002), “Piracy: A brief history of piracy,” last accessed on: 2011/08/30, at http://www.royalnavalmuseum.org/info_sheets_piracy.htm
Rowlett, R. (2001),”How Many? A Dictionary of Units of Measurement :definition of DWT”, Russ Rowlett and the University of North Carolina at Chapel Hill, revised on 2008/12/8, accessed at: http://www.unc.edu/~rowlett/units/dictD.html
Salisbury, J. K. (1950), “The cargo ship”, Kent's Mechanical Engineer's Handbook, 12th ed. (New York: John Wiley & Sons, 1950). Power Volume, pp. 15-69 to 15-83
TI (2011),”Corruption perceptions index 2010 results”, International Transparency, Last accessed on 2011/10/28 at: http://www.transparency.org/policy_research/surveys_indices/cpi/2010/results
UNCLOS (1982), “Oceans and Law of the Sea: United Nations Convention on the Law of the Sea (UNCLOS) of 10 December 1982,” Division for Ocean Affairs and the Law of the Sea, accessed on 2011/08/26, at: http://www.un.org/depts/los/convention_agreements/texts/unclos/UNCLOS-TOC.htm

Sea piracy University of Borås, Sweden
Farzad Jannati October 2011 Mahdi Salimi
Page | c
US Maritime Industry Report (2008), “Economic Impact of Piracy in the Gulf of Aden on Global Trade,” December 23, 2008, last accessed 2011/08/23 at: http://marad.dot.gov/documents/HOA_Economic%20Impact%20of%20Piracy.pdf
Webster (2006), Definition: High seas”, accessed at http://www.websters-online-dictionary.org/definitions/High%20Sea : by Princeton University.
World Bank (2011),”Data, Topics”, last accessed on 2011/10/30 at: http://data.worldbank.org/topi
World Geography (2011), "World Geography", accessed on 2011-07-06 at: http://world-geography.org/
Periodical reports on sea piracy from 1998 to 2010 used in the project are accessible at: http://www.imo.org/OurWork/Circulars/Pages/Home.aspx with the variants in the table. Annuals
Year Address in IMO website Year Address in IMO website
1998 MSC/Circ.903 - 26/4/2001 2005 MSC.4/Circ.81 - 11/4/2006
1999 MSC/Circ.942 - 26/4/2001 2006 MSC.4/Circ.98 - 16/5/2007
2000 MSC/Circ.991 - 26/4/2001 2007 MSC.4/CiRC.115 - 10/7/2008
2001 MSC.4/Circ.16 - 9/5/2002 2008 MSC.4/Circ.133 - 19/5/2009
2002 MSC.4/Circ.32 - 6/5/2003 2009 MSC.4/Circ.152 - 29/3/2010
2003 MSC.4/Circ.50 - 4/6/2004 2010 MSC.4/Circ.169 - 14/4/2011
2004 MSC.4/Circ.64 - 25/5/2005
Monthly reports
Month Address in IMO website Month Address in IMO website
Sep (2008) MSC.4/Circ.128 - 20/03/2009 Aug 2009 MSC.4/Circ.142 - 12/10/2009
Jan 2009 MSC.4/Circ.130 - 19/5/2009 Sep 2009 MSC.4/Circ.143 - 12/1/2010
Feb 2009 MSC.4/Circ.134 - 19/5/2009 Oct 2009 MSC.4/Circ.145 - 12/1/2010
Mar 2009 MSC.4/Circ.135 - 19/5/2009 Nov 2009 MSC.4/Circ.143 - 12/1/2010
Apr 2009 MSC.4/Circ.136 - 19/5/2009 Dec 2009 MSC.4/Circ.147 - 26/1/2010
May 2009 MSC.4/Circ.137 - 16/7/2009 Jan 2010 MSC.4/Circ.148 - 6/4/2010
Jun 2009 MSC.4/Circ.138 - 16/7/2009 Jan 2011 MSC.4/Circ.167 - 8/3/2011
Jul 2009 MSC.4/Circ.141 - 12/10/2009
Sea piracy University of Borås, Sweden
Farzad Jannati October 2011 Mahdi Salimi
Page | d
List of Figures Figure 1.5-1: Methodology of the project ............................................................................................ 2-4
Figure 3.2-1: Global Piracy Trend ....................................................................................................... 3-6
Figure 3.3-1: Piracy Trend in Hot Zones ............................................................................................. 3-8
Figure 3.3-2: Cumulative Piracy Trend ................................................................................................ 3-8
Figure 3.4-1: Global Piracy and Attacker Numbers (1998-2010) ........................................................ 3-9
Figure 3.4-2: Global Piracy and Attacker Numbers Trend ................................................................ 3-10
Figure 3.4-3: Attacker Number Trend in Hot Zones .......................................................................... 3-11
Figure 3.5-1: Global Piracy and Ship Location Status (1998-2010) .................................................. 3-12
Figure 3.5-2: Global Piracy Trend and Different Location ................................................................ 3-12
Figure 3.5-3: Different Ship Location Trend in Hot Zones ................................................................ 3-14
Figure 3.6-1: Global Piracy and Ship Status (1998-2010) ................................................................. 3-15
Figure 3.6-2: Global Piracy and Ship Status Trend ............................................................................ 3-15
Figure 3.6-3: Ship Status Trend in Hot Zones .................................................................................... 3-16
Figure 3.7-1: Global Weapon Status (1998-2010) ............................................................................. 3-17
Figure 3.7-2: Global Piracy and Weapon Trend ................................................................................ 3-18
Figure 3.7-3: Weapon Trends in Hot Zones ....................................................................................... 3-19
Figure 3.7-4: Gun/Knife Rate in Hot Zones ....................................................................................... 3-20
Figure 3.8-1: Global Piracy and Success Status (1998-2010) ............................................................ 3-20
Figure 3.8-2: Global Piracy and Success Trend ................................................................................. 3-21
Figure 3.8-3: Success Trend in Hot Zones ......................................................................................... 3-22
Figure 3.8-4: "Not Boarded" rate in Hot Zones.................................................................................. 3-23
Figure 3.9-1: Global Piracy and Consequence Status (1998-2010) ................................................... 3-23
Figure 3.9-2: Global Piracy - Consequence Trend ............................................................................. 3-24
Figure 3.10-1: Global Sea Piracy-2009 Monthly Trend ..................................................................... 3-25
Figure 3.10-2: Sea Piracy-2009 Monthly Trend in Hot Zones ........................................................... 3-26
Figure 3.11-1: Ship types were attacked on 2009 .............................................................................. 3-27
Figure 3.11-2: Monthly Trend of Different Ship Types were Attacked on 2009 ............................... 3-27
Figure 3.11-3: Ship Types were attacked in different zones (2009) .................................................. 3-28
Figure 3.12-1: Global Piracy and Ship Capacity (2009) .................................................................... 3-28
Figure 4.2-1: Population by piracy variation (2010) the linear trend line is for the average. ............ 4-32
Figure 4.2-2: population by geography of piracy(2010) .................................................................... 4-32
Figure 4.2-3: Scatter diagram of population of countries and piracy incidents attacks in 2010. ....... 4-32
Figure 4.2-4: Population growth by piracy variation. ........................................................................ 4-32
Figure 4.2-5:Population growth by Geography of piracy .................................................................. 4-32
Figure 4.2-6: Rural Population rate by piracy variation. .................................................................... 4-33
Figure 4.2-7: Rural Population by Geography of piracy .................................................................... 4-33
Figure 4.2-8: Cumulative age distribution by piracy variation .......................................................... 4-34
Figure 4.2-9: Cumulative age distribution by Geography of piracy ................................................... 4-34
Figure 4.3-1:”Labor participation/labor population” and “Labor participation/total population” rates by piracy variation ................................................................................................................................... 4-35
Figure 4.3-2:”Labor participation/labor population” and “Labor participation/total population” rates by Geography of piracy ........................................................................................................................... 4-35
Figure 4.3-3:Unemployment ratio among those able to work by piracy variation ............................. 4-35
Figure 4.3-4:Unemployment ratio among those able to work by Geography of piracy ..................... 4-35
Figure 4.3-5: Scatter diagram of unemployment ratio and sea piracy ................................................ 4-36
Figure 4.3-6: Literacy to total population by piracy variation ........................................................... 4-36
Sea piracy University of Borås, Sweden
Farzad Jannati October 2011 Mahdi Salimi
Page | e
Figure 4.3-7:Literacy to total population rate by Geography of piracy .............................................. 4-36
Figure 4.3-8: Life expectancy by piracy variation ............................................................................. 4-36
Figure 4.3-9: Life expectancy by geography of piracy ...................................................................... 4-36
Figure 4.3-10: Urban and rural development: access to simple life facilities as sanitation water by piracy variation ................................................................................................................................... 4-37
Figure 4.3-11:Urban and rural development by geography of piracy ................................................ 4-37
Figure 4.3-12:Child-under-5-year-old mortality by piracy ................................................................ 4-38
Figure 4.3-13:Child-under-5-year-old mortality by geography of piracy .......................................... 4-38
Figure 4.3-14:Poverty rate by piracy variation ................................................................................... 4-38
Figure 4.3-15:Poverty rate by Geography .......................................................................................... 4-38
Figure 4.4-1:Gross National Income (GNI) by variation of piracy .................................................... 4-40
Figure 4.4-2: GNI by Geography of piracy ........................................................................................ 4-40
Figure 4.4-3:GNI per capita by variation of piracy ............................................................................ 4-40
Figure 4.4-4: GNI per capita by Geography of piracy ....................................................................... 4-40
Figure 4.4-5:Scatter diagram of GNI per capita with piracy .............................................................. 4-40
Figure 4.4-6:Transparency Index (TI) by variation of piracy ............................................................ 4-40
Figure 4.4-7: Change of TI by Geography of piracy .......................................................................... 4-40
Figure 4.4-8: Change of TI by Geography of piracy .......................................................................... 4-40
Figure 4.5-1:Effect of length of coast lines on piracy ........................................................................ 4-41
Figure 4.5-2:Effect of length of coast lines by Geography of piracy ................................................. 4-41
Figure 5.5-1: Piracy framework ......................................................................................................... 5-54
List of Tables Table 3.3-1: Piracy in Different Zone .................................................................................................. 3-7
Table 3.3-2: General Statistical Figures-All Zones (1998-2010) ......................................................... 3-7
Table 3.4-1: Global Piracy and Attacker Number Status in Hot Zones ............................................. 3-10
Table 3.4-2:Interval and region of highest attacker groups ................................................................ 3-11
Table 3.5-1: Statistical review of different ship locations in Hot Zones (1998-2010) ....................... 3-13
Table 3.6-1: Statistical Review of Ship Status in Hot Zones (1998-2010) ........................................ 3-16
Table 3.7-1:Global Piracy and Weapon Status in Hot Zones (1998-2010) ........................................ 3-18
Table 3.8-1: Global Success Status in Hot Zones (1998-2010) ......................................................... 3-22
Table 3.9-1: Global Pracy and Consequence Status in Hot Zones (1998-2010) ................................ 3-24
Table 3.12-1: Ship Capacity in Hot Zones (2009) ............................................................................. 3-29
Table 4.1-1: Description of some expressions in the study ................................................................ 4-31
Table 4.2-1: Population Clusters for countries mentioned in the table 4.1-1(a part of main table) .. 4-31
Table 4.3-1: Some development factors some countries of study ...................................................... 4-34
Table 4.3-2: List of five countries with the most child under-five-years-old mortality ..................... 4-37
Table 4.3-3: The most poverty suffering countries of study by percentage of the people under poverty line ...................................................................................................................................................... 4-38
Table 4.4-1: Economical and other factors of the countries of study ................................................. 4-39
Table 5.2-1:Contradiction on IMO annual piracy reports .................................................................. 5-50
Table 5.3-1: Conclusion for chapter four; a) the situation or trend of the studied factor by having piracy and/or with increase of it; b) understood dependency to other factor in the study .................. 5-50
Table 5.4-1:Summary about Somalia ................................................................................................. 5-53