modified analytic hierarchy process to incorporate ...caseyb/perf measures/modified ahp.pdfint. j....
TRANSCRIPT

int. j. prod. res., 15 september 2004,vol. 42, no. 18, 3851–3872
Modified analytic hierarchy process to incorporate uncertainty
and managerial aspects
R. BANUELASy and J. ANTONYz*
The analytic hierarchy process (AHP) is a powerful multiple-criteria decisionanalysis technique for dealing with complex problems. Traditional AHP forcesdecision-makers to converge vague judgements to single numeric preferences inorder to estimate the pairwise comparisons of all pairs of objectives and decisionalternatives required in the AHP. The resultant rankings of alternatives cannot betested for statistical significance and it lacks a systematic approach that addressesmanagerial/soft aspects. To overcome the above limitations, the present paperpresents a modified analytic hierarchy process, which incorporates probabilisticdistributions to include uncertainty in the judgements. The vector of priorities iscalculated using Monte Carlo simulation. The final rankings are analysed forrank reversal using analysis of variance, and managerial aspects (stake holderanalysis, soft system methods, etc.) are introduced systematically. The focus ison the actual methodology of the modified analytic hierarchy process, which isillustrated by a brief account of a case study.
1. Introduction
The analytic hierarchy process (AHP) has emerged as a successful and practicalmultiple criteria decision analysis (MCDA) technique applied in a variety of areas.Its successful application to a wide range of unstructured and complex problemsis largely published in the literature (Saaty and Kearns 1985, Saaty 1988, 1996,Crowe et al. 1998, Drake 1998, Chuang 2001, Kumar Dey 2001, Korpela et al.2001, Banuelas and Antony 2003). The researchers introduced its potential applica-tion to the concept design selection of a domestic appliance manufacturer. However,after applying traditional AHP to select conceptual design alternatives, a small differ-ence in the rankings of the different design concepts raised the following questions:
. Are the alternatives’ rankings practically and statistically different?
. Can the closeness of the results be attributed to uncertainly that people haveto converge ambiguous judgements to a single point?
. How confident are we to select the right design concept?
. What is the role of managerial aspects in the AHP?
Although traditional AHP is popular for a number of reasons, it forces decision-makers to converge vague judgements to single numeric preferences in order to esti-mate the pairwise comparisons of all pairs of objectives and decision alternatives.
Revision received March 2004.yWarwick Manufacturing Group, School of Engineering, University of Warwick,
Coventry CV4 7AL, UKzDivision of Management, Caledonian Business School, Glasgow Caledonian University,
Glasgow G4 0BA, UK.*To whom correspondence should be addressed. e-mail: [email protected]
International Journal of Production Research ISSN 0020–7543 print/ISSN 1366–588X online # 2004 Taylor & Francis Ltd
http://www.tandf.co.uk/journals
DOI: 10.1080/00207540410001699183
The resultant rankings of alternatives cannot be tested for statistical significance, andvariation due to uncertainty is not contemplated, analysed or quantified (Paulsonand Zahir 1995, Rosenbloom 1996, Scott 2002). In addition, it lacks a systematicapproach that addresses managerial aspects such as the importance of alternativesgeneration, the selection of a group of subject-matter experts or the stakeholders’analysis. The present paper examines and proposes the incorporation of uncertaintyin the AHP and offers an answer to the questions posed above. The proposedmethod has the following objectives:
. To provide a means to test statistical significance of the final rankings.
. To incorporate managerial aspects into the AHP to deal with the relationshipbetween people, understand the context and structure of the problem.
The first part of this paper presents an application of the traditional AHP for con-cept design selection in the design department of a multinational company. Second,a critique of the AHP is offered. Third, the modified analytic hierarchy process(MAHP) is presented and reapplied to the same concept design selection. Thispaper culminates by illustrating a comparison between the traditional AHP andMAHP. The results of this study were encouraging to key personnel in the productdevelopment process and thereby established a greater opportunity to explore theapplication of MAHP in other core business processes.
2. Traditional AHP
Early in the new product introduction process, customer needs are identified anddesigners generate alternative design concepts in response to those needs. A problemfrequently faced during the selection of design concepts is the evaluation of conceptswith respect to customer needs and other criteria, comparing the relative strengthsand weaknesses of the concepts, and selecting one or more concepts for furtherinvestigation or development (Ulrich and Eppinger 1995). To deal with this problem,there are a growing number of both concept design selection and MCDA tools andtechniques applicable to the selection of design concept alternatives (Despontin et al.1983, Ulrich and Eppinger 1995, Aurand et al. 1998, Zanakis et al. 1998, Oslo et al.1999, Otto and Wood 2001, Wang 2002). The MCDA techniques provide someguidelines for sensible decision-making, guidelines which enable a complicated deci-sion process to be broken down further into smaller and simpler parts, whose sepa-rate analyses can be combined to provide a solution of the whole (Lindley 1971).Many of the MCDA tools and techniques provide the decision-maker with theexpected utility of each concept in consideration.
Otto and Wood (2001) propose the use of different methods depending on theinformation available to evaluate the concepts of the designs. They recommend AHPfor decisions where the performance metrics are related hierarchically. AHP providesan understanding and awareness of the problem in consideration. The comparison ofall pairs of objectives and decision alternatives required to calculate the expectedutilities provide the decision-maker with a ranking of alternatives. In addition,it provides a consistency index that is used to measure the coherence that decision-makers have in their judgements. This feature makes AHP a powerful technique todeal with complex situations as they are. The researchers introduced its potential useand application on the concept design selection arena to the collaborative company.
AHP, first developed by Saaty in 1971, involves structuring a problem from themain objective to the subobjectives, forming a hierarchy structure with several levels.
3852 R. Banuelas and J. Antony
AHP then develops priorities among each objective within each level. It is based
on both predetermined measurements and the decision-maker’s judgement through-
out the system, which are calculated through pairwise comparisons. Thus, it can
cope with objectives that have not been effectively quantified using exact measure-
ments. Decision-makers evaluate each objective against each other within each
level; each level is related to the levels above and below it, and the entire system
is connected together mathematically including the options that can solve the
problem. Consequently, a prioritization of the options that could satisfy the
problem or main objective is given. Following the traditional AHP procedure,
a group of decision-makers embarked on the construction of the AHP to select
different design concepts. For more information on the traditional AHP, see Saaty
(1988, 1996).
A team of designers and researchers went through a freewheeling brainstorming
session to list all concepts relevant to the problem without regard to relation or
order, but bearing in mind the main processes of the traditional AHP. The AHP
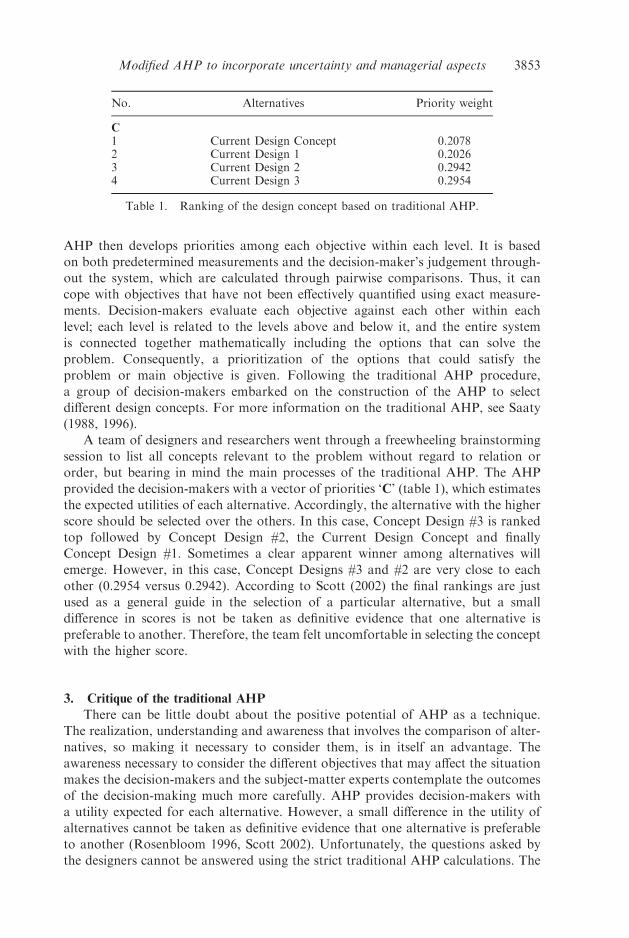
provided the decision-makers with a vector of priorities ‘C’ (table 1), which estimates
the expected utilities of each alternative. Accordingly, the alternative with the higher
score should be selected over the others. In this case, Concept Design #3 is ranked
top followed by Concept Design #2, the Current Design Concept and finally
Concept Design #1. Sometimes a clear apparent winner among alternatives will
emerge. However, in this case, Concept Designs #3 and #2 are very close to each
other (0.2954 versus 0.2942). According to Scott (2002) the final rankings are just
used as a general guide in the selection of a particular alternative, but a small
difference in scores is not be taken as definitive evidence that one alternative is
preferable to another. Therefore, the team felt uncomfortable in selecting the concept
with the higher score.
3. Critique of the traditional AHP
There can be little doubt about the positive potential of AHP as a technique.
The realization, understanding and awareness that involves the comparison of alter-
natives, so making it necessary to consider them, is in itself an advantage. The
awareness necessary to consider the different objectives that may affect the situation
makes the decision-makers and the subject-matter experts contemplate the outcomes
of the decision-making much more carefully. AHP provides decision-makers with
a utility expected for each alternative. However, a small difference in the utility of
alternatives cannot be taken as definitive evidence that one alternative is preferable
to another (Rosenbloom 1996, Scott 2002). Unfortunately, the questions asked by
the designers cannot be answered using the strict traditional AHP calculations. The
No. Alternatives Priority weight
C
1 Current Design Concept 0.20782 Current Design 1 0.20263 Current Design 2 0.29424 Current Design 3 0.2954
Table 1. Ranking of the design concept based on traditional AHP.
3853Modified AHP to incorporate uncertainty and managerial aspects

basic theory of the AHP does not allow decision-makers to draw any statistical
conclusion of the utility of the alternatives. Rosembloom (1996) states:
the only interpretation of say wi>wj is that wi/wj is the ratio of preference of
i over j. Thus, in AHP if two alternatives have scores that are quite close,
it is unclear whether there is a practical significant difference between the
alternatives . . . the discipline of statistics can provide guidance on this issue
of statistical significance.
In addition, traditional AHP as a ‘hard’ operational research technique has
a dominant tendency to look for technical solutions to well-structured problems in
which desirable ends can be easily stated (Checkland 1999). There seems to be only
one problem and the task of the decision-maker is to recognize it and then turn to
handle it by means of hard operational researcher techniques such as AHP.
However, real-world interventions such as the design concept selection involve rela-
tionships between people, and their differential willingness and ability to adjust to
the changed circumstances of the desired state of the problem. In addition, different
people and departmental factions can have different opinions and thoughts regard-
ing the nature of the problem. All these might affect to reach consensus and to
converge ambiguous judgements to single point estimate in order to describe a
pairwise comparison of objectives and alternatives required in the AHP (Hauser
and Tadikamalla 1996). Therefore, it is important to understand the problem and
structure it before attempting to solve it by means of AHP. There are different ‘soft’
methods used to deal with managerial aspects (i.e. problem identification, context
of the problem, etc.). Different authors have highlighted the importance of linking
soft or managerial issues and hard issues in a single real intervention (Jackson and
Keys 1984, Mingers and Gill 1997, Checkland 1999, Rosenhead and Mingers 2001).
Mingers and Gill, for example, developed the concept of multimethodology, which
consists of employing more than one method in tackling real-world problems.
According to Mingers and Brocklesby (1997) combining soft methods, to deal
with managerial aspects, with hard operation research methods is necessary to
deal with different dimensions of the situation.
The AHP literature is vast and has tried to deal with some of the problems
described above. There are some researchers who have incorporated uncertainty in
the AHP using probabilistic judgements (Hauser and Tadikamalla 1996,
Rosenbloom 1996, Levary and Wan 1998), fuzzy sets (Ruoning and Xiaoyan
1992, Chang 1996, Lee et al. 2001) and ranking intervals (Zahir 1991, Arbel and
Vargas 1993). This has produced a means to test statistical significance of the final
score and facilitate consensus when there are a large number of decision-makers.
However, there is not a single approach in the existing literature of AHP that
includes the majority of the issues discussed above (e.g. soft issues, uncertainty,
statistical significance of uncertainty). The authors hence developed an MAHP to
address the above highlighted issues. MAHP is defined as a systematic and stochastic
procedure for identifying and representing the element of problems hierarchically. In
contrast with traditional AHP, it is a stochastic process rather than deterministic,
provides a means to test a difference in the results statistically and incorporates
management issues systematically. As shown in table 2, MAHP has its basis in
parallel areas of investigation and it is grounded in the research carried out by
other authors.
3854 R. Banuelas and J. Antony

Dimension Traditional AHP Other AHP modifications MAHP
Incorporation ofuncertainty
Delphi method using probabilistic judgements(Hauser and Tadikamalla 1996, Rosenbloom1996, Levary and Wan 1998) fuzzy sets(Ruoning and Xiaoyan 1992, Chang 1996,Lee et al. 2001) and intervals (Zahir 1991,Arbel and Vargas 1993)
using probabilistic judgements
Method to estimatethe underlyingrankings
principal eigenvector(without replication)
principal eigenvector (Saaty 1988, Kumar andGanesh 1996), the multiplicative method(Stam and Duarte 2003) and the logarithmicleast-square method (Fichtner 1986, Kwiesielewicz1999)
replicating n times the principaleigenvector using Monte Carlosimulation
Interpretation ofthe results
utility theory, sensitivityanalysis
Fuzzy interpretation (Ruoning andXiaoyan 1992, Chang 1996, Lee et al. 2001),statistical interpretation (Hauser and Tadikamalla1996, Rosenbloom 1996, Levary and Wan 1998)
statistical interpretation usingconfidence intervals, ANOVA andmean square deviation, sensitivityanalysis, etc.
Soft/managerialissues
brainstorming, Delphimethod
barely researched combines several methods (affinitydiagrams, stakeholder analysis,brainstorming, soft system methods)in a systematic way in order to dealwith soft/managerial aspects
Table 2. Comparison of MAHP with traditional AHP and other AHP research.
3855
Modified
AHP
toincorporate
uncerta
inty
andmanageria
laspects

4. Modified analytic hierarchy process (MAHP)
Problems solved using AHP are multidimensional where technical and physicalaspects, social and political aspects, etc. are present. Traditional AHP is focusedon selecting alternatives when the context of this multidimensionality is reducedor eliminated. However, to deal effectively with the full richness of problems, itis necessary to guide people in organizations to deal with the managerial aspects.Some of the benefits of incorporating managerial issues into the AHP are as follows:
. To understand the context of the problem.
. To structure the problem to be solved.
. To manage the relationship between people, and their differential willingnessand ability to adjust to the changed circumstances of the desired state of theproblem.
. To facilitate consensus, generate new insights and provide more confidence inthe results.
. Employing more than one method in tackling real-world problems (i.e. linkingAHP with ‘soft’ system methods).
Accordingly, the researchers decided to incorporate managerial or ‘soft’ issues espe-cially in the planning phase of the concept design selection. It is believed that theaccuracy of the comparisons of all pairs of criteria and decision alternatives may beaffected depending on the information available to the decision-makers and theirunderstanding of the problem under consideration as well as their previous percep-tions (Levary and Wan 1998). These ‘soft’ or managerial aspects may be related toproblems to input preferences in the AHP. Lack of information of objectives, vaguedescription of objectives and alternatives, insufficient information regarding thestakeholder strategies, poor selection of subject-matter experts, are all issues thatneed to be addressed before performing any pairwise comparison. Figure 1 illus-trates a flow chart of modified AHP, which incorporates the managerial (soft) andtechnical (hard) issues.
Regarding the technical or hard issues, one main concern is that the expressedpreferences are assumed to be deterministic rather than probabilistic. Thus, a pref-erence remains fixed and it is assumed that all the decision-makers agree with thatpreference. However, the perception of people inevitably changes from one personto another. Since in many cases this problem is present, a degree of uncertainty willbe associated with the pairwise comparisons (Paulson and Zahir 1995, Levary andWan 1998). Saaty (1988) states that if several people are involved, they can assisteach other in sharpening their judgements in order to attempt consensus and reduceuncertainty. In practice, this approach transforms the AHP preferences ranking ina bargain process in which some people tend to dominate the session.
To manage uncertainty in the judgements, the researchers propose the introduc-tion of such uncertainties in the AHP through the use of probabilistic judgements.The concept of probabilistic judgements was also put forward by Saaty (1988). Inan analysis, Saaty allowed judgements to vary probabilistically. This turns out thatthe gamma distribution is a convenient way of representing variation in judgements.Vargas (1982) studied reciprocal matrices with random coefficients and their impacton the consistency ratio. Rosenbloom (1996) recommended that the pairwise com-parisons be viewed as random variables sij with the provision that the distribution isbounded between 1/9 and 9, sij¼ 1/sij and sii with probability 1, in order to meet theSaaty’s scale of preferences. Therefore, any realization of the pairwise comparison
3856 R. Banuelas and J. Antony

Define the probability distributions & construct the probabilistic A matrix
Replicate n times the eigenvector
Select the alternative
Problem recognition
Select a group of subject matterexperts
Define scope and boundaries of the AHP
Decompose the problem into a hierarchy
Obtain stakeholders strategy analysis
Perform pairwise comparison at eachlevel using scaled responses on the
questionnaire
Is the consistency index< 0.10 for all simulations
replicates
Use sensitivity analysis to determine the source of variation
Eliminate the simulationruns with CI/RI> 0.10
Analyse rank reversal using ANOVA and and F-tests
Use confidence intervals to identify the range within the mean of the rankings
(ci) should fall
Perform “What if” scenarios using sensitivity charts
NO YES
Calculate the impact of variation using Mean square deviation
Perform a confirmatory AHP
Planning
Simulation
Analysis
Confirmation
Figure 1. Modified AHP flow chart.
3857Modified AHP to incorporate uncertainty and managerial aspects

matrix will be reciprocal symmetric. The random variable sji will be dependent on sij.If sij are random variables then the final scores will also be random variables.Consequently, the resultant composite priority vector can be viewed as providinga measure for statistical significant differences between the alternatives usingANOVA. Rosenbloom (1996) also recommended the use of Monte Carlo simulationto calculate the principal eigenvector. Accordingly, each replication would be arealization of all the aijs in the decision hierarchy followed by the standard AHPcalculation. Replicating n times will provide estimates of the probabilities associatedwith the vector of priorities.
The flow chart in figure 1 is divided into four main phases: planning, simulation,analysis and confirmation. Each phase is described in the next section and a briefaccount of a case study is offered.
4.1. Planning phaseThis planning phase involves the appreciation of the situation experienced by the
subject-matter experts and decision-makers. This phase encompasses an initial iden-tification of the problem at hand, identification and selection of the subject-matterexperts, definition of the scope of the study and representation of the design conceptselection system.
4.1.1. Problem recognitionProblem recognition and formulation are critical for the successful implementa-
tion of MAHP in the industry. An initial clear and succinct statement of the problemcontributes to a better understanding of the problem. The problem statement andobjective in this case is ‘to select the most appropriate technology for the new plat-form of domestic appliance’. The traditional AHP and MAHP are generic techni-ques that can be employed in a different set of problems. Some generic problems thatcan be used are as follows:
. Resource allocation.
. Concept design selection.
. Make or buy problem.
. Product pricing decisions.
. Selection of quality strategy.
. Improve or redesign selection.
Once the problem is recognized and formulated, a team that will perform the AHPcan be selected.
4.1.2. Select a group of subject-matter expertsThe selection of the right people to form the MAHP team is vital for the
successful application of this technique. The various data inputs that are requiredfor the MAHP necessitate the use of a multidisciplinary team and subject-matterexperts. The selection of team members requires the usual care in blending skills,knowledge and personalities for optimum effect. Maintaining continuity of the teamthroughout the process maximizes the chances of carrying the benefits of the MAHPtechnique. In this case, 15 people were selected from various departments of thecompany such as marketing, design, manufacturing, quality, engineering, develop-ment, value management and computer-aided design.
3858 R. Banuelas and J. Antony

4.1.3. Define the scope and boundaries of the MAHPSimilar to AHP, MAHP can deal with complex and unstructured problems.
It stops making simplified assumptions to suit the models and deals with complexsituation as they are (Saaty 1988). However, it is important that problems are bothmeaningful and manageable to keep this process simple and focused. Therefore,it is important to limit the AHP bearing in mind time, number of alternatives andresources available. The team decided to constrain the MAHP based on three mainissues: time, product and four concept alternatives.
4.1.4. Decomposition of the problem into a hierarchyThe selection of the proper objectives and the alternatives is vital for the success
of the MAHP. The selection of the right hierarchy elements immensely influencesthe result of meaningful rankings of the MAHP. Therefore, it is important to ensurethat the selected objectives and alternatives really provide the necessary and relevantrepresentation of the system under study. Prior knowledge and experience of thesystem are vital to construct a meaningful hierarchy. If important objectives andalternatives are not considered in the hierarchy, then the information gained fromthe MAHP will not be in a positive sense.
Having established a number of design concept alternatives to the problem athand, these concepts were produced in sketch form to the same level of detail foreach alternative. This is essential in order to compare alternatives on the same basis.Visual representation facilitates comparisons. Thus, it has a positive association withthe meaningful and consistent pairwise comparisons.
The problem decomposition was carried out during a brainstorming session.Affinity diagrams were employed because large numbers of objectives and alter-natives were generated during brainstorming sessions. The decision-makers andsubject-matter experts organize and summarize the natural grouping from a largenumber of objectives and alternatives through the use of affinity diagrams (Bicheno1994). This produced the hierarchy structure shown in figure 2.
4.1.5. Obtain stakeholders strategy analysisThe application of MCDA techniques in the industry involves managerial and
political aspects such as relationships between people, their differential motivationand aptitude to adjust to the changed circumstances of the desired state of theproblem, etc. Multicriteria decision analysis techniques can cope with decision inthe presence of multiple, usually conflicting criteria problems. These potential mul-tiple and conflicting problems need to be addressed in the MAHP by stating clearlywhat is the current state of the problem under consideration and what is the desiredlevel expected. For instance, assembly time was an issue in selecting a design concept,thus, manufacturing and engineering provided the assembly standard time forthe current design and the estimated target for the new concept design. In addition,they addressed further consideration such as automation plans, desired design forassembly scores, etc. All these formed part of the stakeholder strategy analysis.
4.2. Simulation phase4.2.1. Perform pairwise comparisons at each level using scaled responses on the
questionnairePeople without experience on the fundamentals of AHP and MAHP can encoun-
ter difficulties to directly input ambiguous judgement to a matrix. The problems of
3859Modified AHP to incorporate uncertainty and managerial aspects

Level 3:Concept DesignAlternatives
Level 2:Objectives
Level 1: Goal
Reduced Cost
EnhancedSafety
ImprovedReliability
ImprovedPerformance
ImprovedAssemblability
ImprovedRecyclability
Reduced Development Risk
To select the most appropriate technology for the new platform of domestic appliance
Current Design
Concept
DesignConcept
#1
DesignConcept
#2
DesignConcept
#3
Figure 2. Hierarchy structure.
3860
R.Banuela
sandJ.Antony

answering directly from the matrix can be avoided using a simple questionnaire.However, some guidance should be provided in order to avoid ambiguity in thequestionnaire. A carefully designed questionnaire makes the tasks of obtaining theinformation and reducing errors (Sudman 1982). The first step in the question-naire design, after the identification of the objectives, is to decide the questions(Denscombe 1992, Gillham 2000). This step involves setting down the main elementsof the hierarchy at each level and putting them into specific questions.
The next step is to define the type of response envisaged for each question. Theobjective is to obtain the information from the subject-matter experts with minimaldistortion. For the questions put forward, it is important to avoid possible mis-understandings with the respondent, as the phrasing of the questions and recordingof them will influence the final result (Oppenheim 1966). Direction of the objectivesplays an important role in the design of the questionnaire. It is recommended thatall objectives at the same level have the same direction. For example all objectivesneed to have a positive direction, e.g. ‘improve reliability’ and ‘enhanced safety’.This simple recommendation can avoid people assessing objectives in the oppositedirection.
Ranked or scaled responses are the obvious form of answering options for theMAHP case as they ask for prioritizing. This is a subtle way of obtaining preferentialjudgements from people according to their beliefs and personal experiences. Theobjectives and alternatives are then ranked following Saaty’s scale of preferences,as shown in table 3.
The judgements of a group of subject-matter experts and decision-makers canhardly converge to a single point. People perception may change from one person toanother producing different answers in the questionnaire. The ambiguity that occurswhenever numbers are associated with judgements was collected using individualquestionnaires and their answers incorporated to the MAHP producing probabilisticdistributions. However, it is important to discuss each question in order to facilitatethe convergence of judgements.
4.2.2. Define the probability distributions and construct the probabilistic ‘A’ matrixDuring the traditional AHP, the pairwise comparisons represented by aij are
deterministic, where aij indicates how much more important the ith alternative/criteria is than the jth alternative/criteria and this will lead to the construction ofthe composite priority vector of alternatives’ importance. In the MAHP, the aijvalues are represented by the sij probabilistic judgements. The most rigorous andsuitable method to select the appropriate distribution of sij is using the statisticalprinciples. From the central limit theorem, it can be seen that for almost all popula-tions, the sample distribution can be approximated closely by a normal distribution,provided the sample size is sufficiently large (Kiemele et al. 1997). However, it can be
With respect to select the most appropriate technology for the newplatform of domestic appliance:Is more/less relative to improve reliability than to reduced risk?More/Lessby1 2 3 4 5 6 7 8 9Equal Strong Absolute
Table 3. Question example.
3861Modified AHP to incorporate uncertainty and managerial aspects

difficult to obtain a large sample size of subject-matter experts to perform thepairwise comparison.
Another method is to employ the chi-squared goodness-of-fit test to investigatewhether an underlying distribution (or population) from which the data have beentaken is of a specified form or not. Nevertheless, before trying to fit a probabilisticdistribution to the set of judgements collected, it is important to analyse their source.For example, Hauser and Tadikamalla (1996) suggest that in the extreme case thedecision-makers are not only unable to converge to a single estimate of their judge-ments but also their judgements are uniformly distributed across a range, then theuniform distribution can be a suitable representation of the probabilistic judgements.Another scenario is that people may converge to a ‘modal value’ within a range. Thismodal value could be in the centre of the range creating a symmetric triangulardistribution or it could be anywhere in the range creating skewed triangular distri-bution. From the central limit theorem, both distributions, triangular and uniform,create normally distributed priority vectors when replicate ‘n’ times. However,triangular distributions should provide more ‘consistent’ rankings because theyapproximate to the normal distribution sooner than the uniform distribution(Hauser and Tadikamalla 1996). It is important to bear in mind that some distribu-tions obtain infinitive values (e.g. the normal distribution), but Saaty’s scale ofpreferences used to produce the rankings is always equal to or greater than 1/9and not greater than 9. Therefore, some distributions will need to be truncated tomeet the scale proposed by Saaty (1998).
For example, the data collected from the questionnaire were analysed and plottedproducing triangular distributions using Crystal Ball simulation software. For eachsij judgement, the subject-matter experts manage to converge to a modal valuewithin a range producing the probabilistic ‘A’ matrix of objectives shown in figure3. Note that the probabilistic ‘A’ matrix is still a reciprocal and square matrix.
Figure 4 shows that ‘Reduced Cost’ was evaluated against ‘Improved Recycl-ability’. Subject-matter experts and decision-makers expressed their judgements withregard to this pairwise comparison. During the brainstorming session some of themranked between weak importance of ‘Reduced Cost’ over ‘Improved Recyclability’(3 in Saaty’s scale) and absolute more important ‘Reduced Cost’ over ‘ImprovedRecyclability’ (9 in Saaty’s scale). However, most of the subject-matter experts’judgements converge to a modal value of 7. This produces the triangular distributionshown below, which was input to the s16 entry of the probabilistic matrix ‘A’of objectives (figure 3).
4.2.3. Replicate ‘n’ times the principal eigenvector and eigenvaluesto calculate the composite priority vector
Because aij are random variables they cannot be treated by strictly following thetraditional AHP. To calculate the composite priority vector, Rosenbloom (1996)recommended the use of Monte Carlo simulation to estimate the C composite vectorfrom the probabilistic judgements (sij). Accordingly, each replication would be arealization of all the aijs in the decision hierarchy followed by the standard AHPcalculation of eigenvectors and eigenvalues. Replicating n times will provideestimates of the probabilities associated with the composite priority vector ‘C’.
Following Rosenbloom’s recommendations, the sij probability judgements werereplicated 1000 times to estimate the ‘C’ composite priority vector using Crystal Ballsoftware. The probabilistic ‘C’ composite priority vector is represented in figure 5.
3862 R. Banuelas and J. Antony

Enhanced safety
Reduced cost Improved reliability Improved performance
Improved assembability
Improved recyclability
Reduced development risk
Enhanced
safety
1
Reduced
cost
=1/s12
1
Improved
reliability
=1/s13
=1/s23
1
A=
Improved
performance
=1/s14
=1/s24
=1/s34
1
Improved
assemblability
=1/s15
=1/s25
=1/s35
=1/ s45
1
Improved
recyclability
=1/s16
=1/s26
=1/s36
=1/ s46
=1/ s56
1
Reduced development
risk
=1/s17 =1/s27 =1/s37 =1/ s47 =1/ s57 =1/ s67 1
1/9 1/4 1/3
s17
1/5 1/3
s37
1/7 1/3 3.0
s27
1/5 1/2 3.0
s47
1/3 1.0 3.0
s57
1/8 1/7
s67
1/9 1/8 1/6
s12
1/7 1/5
s13
1/8 1/7 1/3
s14
1/8 1/7 1/5
s15
1/5 1.0 3.0
s16
1/2 4.0 5.0
s23
1/3 2.0 5.0
s24
1/4 1.0 3.0
s25
3.0 7.0 9.0
s26
1/3 1/2 1.0
s34
1/3 1.0
s35
3.0 5.0 7.0
s36
1/3 1.0 2.0
s45
5.0 6.0 7.0
s46
3.0 6.0 9.0
s56
Figure 3. ‘A’ matrix using triangular distributions as the input.
Figure 5. Representation of the probabilistic ‘C’ composite priority vector.
7.009.00
3.00 4.50 7.50 9.00
Reduced Cost vs.Improved Recyclability
Triangular distribution with parameters:MinimumLikeliest
3.00
Maximum
Selected range is from 3 to 96.00
Figure 4. S16 probabilistic distribution.
3863Modified AHP to incorporate uncertainty and managerial aspects

Because aij are random variables, the ‘C’ composite priority vector is representedby a probabilistic distribution with dispersion and central parameters. Consequently,different statistical tools and techniques can be used to understand and select themost appropriate concepts with statistical certainty.
4.2.4. Effect on the consistency ratio due to probabilistic judgementsSimilar to the ‘C’ vector, the consistency ratio is represented by a probabilistic
distribution. Thus, the criterion to accept or reject a given level of inconsistencyneeds to be studied. Vargas (1982) studied the reciprocal matrices whose entriesare random variables. He investigated the case where the random variables followa uniform distribution from the scale 1/9 to 9 proposed by Saaty (1988). He foundthat the consistency index follows a truncated normal distribution when uniformdistributions are employed. He associated this to the central limit theorem.Vargas proved this through simulating different size matrices (500 runs) and thenperforming a normality test using the Kolmogorov test. Based on that, he concludedthat given a reciprocal random matrix, an acceptable upper bound of the ratiobetween the consistency of a reciprocal matrix, and its corresponding averagerandom consistency is 10% (Vargas 1982).
More recently, Finan and Hurley (1997) investigated the impact on the reliabilityof the analysis for readjusting the pairwise comparisons matrix having a consistencyratio less than 10%. By employing Monte Carlo simulation, they calculated theconsistency ratio and the root-mean-square error of randomly generated weightswith the true weights for each iteration of the simulation. They concluded that thereis a positive and significant linear relationship between these two variables. Thus,a reduction in the consistency index produces a reduction in the root-mean-squarevalue.
Previous research provides a guidance of how to interpret the consistency indexof the random generated reciprocal matrix. Accordingly, when employing probabil-istic distribution as an input to the ‘A’ matrix, we must investigate the consistencyindex’s probabilistic distribution, which according to the central limit theorem,the sum of n independently distributed random variables will tend to be normallydistributed as n becomes large (Montgomery 2003). In this case a truncated normaldistribution (needs to be truncated because negative inconsistencies are not possible).The consistency index distribution can be verified using a normality test.
To improve the consistency, the causes of the inconsistency need to be investi-gated. The authors recommend the use of sensitivity charts to understand the sourceof variation. Sensitivity charts estimate the overall contribution of the variance of theprobabilistic judgements to the variance of the consistency index indicated by the percent of contribution of variance (Minitab 2000). It can also be employed to analysethe variance on the rankings distributions. Accordingly, through sensitivity analysisit is possible to estimate the sij probabilistic distribution judgement, which has thegreater contribution to the consistency index variation. Therefore, we can concen-trate on specific sij distributions instead of the whole ‘A’ matrix to produce lowerconsistency index, thus lower root-mean-square error.
4.2.5. Sensitivity chartWith the use of sensitivity charts, it is possible to judge the influence that each
probabilistic judgement (sij) has on a particular ranking or consistency index.Therefore, we can rank the probabilistic judgements according to their impact on
3864 R. Banuelas and J. Antony

the consistency index. The sensitivity chart displays these rankings as a bar chart,indicating which judgements are the most important or least important in the model.
The judgements with the highest sensitivity ranking can be considered the mostimportant in the model. We may want to investigate this judgement further, in thehope of reducing its variation, and therefore its effect on the consistency index.The judgements with the lowest sensitivity ranking are the least important in themodel. The effect of them on the consistency index is not as great as the others and,in some cases, could be ignored or discarded altogether. Note that probabilisticentries in the ‘A’ matrix, with little effect on the consistency ratio, may have alarge effect in the final rankings. Because the mean of the consistency ratio isbelow 0.10, and the low standard deviation produces a few outliners of the 0.10upper bound of the consistency index, in this case the team decided not to modifythe sij judgements of the ‘A’ matrix. However, the realizations on the simulation withconsistency index greater than 0.10 were not included in the analysis.
4.3. Analysis phase4.3.1. Confidence intervals
From the deterministic AHP, it was not possible to quantify the error of uncer-tainty in rankings of the AHP. The modified AHP can quantify the possibility thatthe priority vector’s averages are not accurate to prioritize the design concepts. Thisis possible due to the incorporation of the uncertainty through the probabilisticjudgements.
The confidence interval is a range of values, which includes the true value ofthe population parameter (Montgomery 1996). Thus, each value of the ‘C’ compositepriority vector can be represented for the confidence limits (the upper and lowerboundaries of the confidence interval) with a confidence level (the probability that anassertion about the value of the population parameter is correct) (Gryna 1974).
As a result, we can state that based on the probabilistic judgements, if the AHPis carried out several times with a confidence level � of 95% it is expected that theci mean of the ‘C’ composite priority vector will be between the confidence limitsshown in table 5.
4.3.2. Analysis of rank reversalUsing analysis of variance (ANOVA), it can be determined whether there
is statistical significance among the decision alternatives. In the case of two alter-natives, a t-test can be employed. ANOVA is a technique used to determine thestatistical significance of multiple means (Montgomery 1997) and hence ANOVAcould be employed if multiple design alternatives are considered. In this case, thealternatives are statistically different at the 1% significance level. When the nullhypothesis is rejected, we know that some of the alternative means are differentand therefore can be ranked. To test all pairwise mean comparisons for all designalternatives the F-test can be carried out within the ANOVA. Using the F-test, theprobability that alternative i will reverse rank with some other alternative j can becalculated. Thus, the p values calculated during the pairwise mean comparisons forall design alternatives are a measure of the overall instability of the ‘C’ vector giventhe lack of unanimity in the group reflected in the range of responses for eachpairwise comparison. In this case, the p values for these comparisons were approxi-mately zero. Therefore, the design alternatives are considered to be statisticallydifferent and the probability of at least one rank reversal is approximately zero.
3865Modified AHP to incorporate uncertainty and managerial aspects

4.3.3. Mean square deviationDuring the MAHP the utilities represented in figure 5 were estimated.
Traditionally, the rankings will be concept #3, followed by current design, concept#1 and finally concept #2. However, variation also needs to be considered. MAHPprovides decision-makers with a metric of central tendency and spread for the utilityexpected of each alternative. Increasing variation in the rankings due to excessivevariation in the judgements needs to be taken into account when selecting the alter-native. This can be quantified by means of the mean-squared deviation (MSD). MSDis defined as the average of the square of the deviations in the performance char-acteristic of a product from its nominal value (Wheeler 1988, Antony and Kaye2000). Following MSD calculations, the route to rank the probabilistic ci distrib-utions can be easily identified (i.e. reduce the deviation of the ci average from thetop ranked alternative (cimax)). Therefore, the alternatives can also be ranked byequation (1):
MSD ¼ s 2i þ ðci � cmaxÞ2, ð1Þ
where MSD is the mean-square deviation, si is the standard deviation of the ithalternative, ci is the mean of the ith alternative and cmax is the mean of the topranked alternative.
The ranking of alternatives based on the MSD is shown in table 6. The alter-native with minimum mean-square deviation or loss should be selected. It is impor-tant to mention that expected MSDs of alternatives are not stochastic (their sumdoes not add to one after the variation is incorporated).
Target Forecast: CI/RI
S24 12.8%
S27 10.1%
S47 9.3%
S45 7.3%
S36 7.0%
S56 5.5%
S57 4.1%
S26 3.6%
0% 25% 50%
Measured by Contribution to Variance
Table 4. Sensitivity chart.
Concept N Mean SD Z�/2 LCL UCL MSD
Current design 1000 0.2444 0.00419 1.96 0.2438 0.24433 0.00338Concept #1 1000 0.23653 0.00369 1.96 0.23626 0.23672 0.00410Concept #2 1000 0.2189 0.00657 1.96 0.21867 0.21949 0.00677Concept #3 1000 0.3001 0.00826 1.96 0.29987 0.30087 0.00027
LCL, lower confidence limit; UCL, upper confidence limit.
Table 5. Confidence intervals and mean-square deviation.
3866 R. Banuelas and J. Antony

Criteria MAHP Traditional AHP
Uncertainty incorporates uncertainty through probabilistic judgments uncertainty is not taken into accountSoft/managerial issues incorporates soft issues in a systematic and organized
manner (from problem recognition to defining the scopeand boundaries of the study, utilization of the stakeholderanalysis, soft-system methods, etc.)
soft issues have not been thought out properly
Analysis of the results results are analysed statistically statistical significance is overlookedRole of variation mean and variance are analysed in order to rank
the alternativesalternatives are ranked with regard to theirdeterministic utility
Time required forimplementation
longer time is needed for data collection and analysis requires less time for data collection and analysisthan the modified AHP
Complexity involved requires understanding of several disciplines such as statisticsand simulation in addition to the traditional AHP, which leadto high complexity
it has relative complexity when compared withother MCDA techniques; less complex thanthe modified AHP
Consistency index inconsistencies are analysed by identifying their sources andvariation using sensitivity charts
deterministic inconsistencies are estimated
Computational aid high relatively low
Table 6. Modified versus traditional AHP.
3867
Modified
AHP
toincorporate
uncerta
inty
andmanageria
laspects

4.3.4. Sensitivity analysis: ‘what if’
Once the judgements of all levels were made and tested for statistical significance
and consistency, the researchers and designers visualize possible ‘What if’ scenarios
of the problem using sensitivity analysis. The different alternatives were viewed on an
objective-by-objective basis as shown in figure 6.
The x-axis gives the relative priority of modifying an objective’s utility on the
decision, while the y-axis gives the ranking of each design concept (Labid and Shah
2001). The intersection of the vertical line with the diagonal lines indicates the
current ranking of alternatives for the current reduced cost’s weight, 0.26. Moving
the vertical line horizontally, we incorporate ‘what if’ scenarios. Because the rank-
ings’ weights in MAHP are on a probabilistic scale, when the line is moving to the
right, we are actually putting more weight on reduced costs and vice versa. From
figure 6, it can be seen that if the objective reduced cost’s weight increases at around
0.5 of the decision, a rank reversal occurs, where design concept #3 is preferred over
the rest.
4.4. Confirmation phase4.4.1. Confirmation of the AHP
To validate the conclusions from MAHP, a confirmatory MAHP was carried
out. During the confirmation, two subject-matter experts rescored the MAHP.
Because probabilistic judgements were employed, it was expected that the new judge-
ments (individual’s aij) fall within the bounds of the distribution sij. In this case, two
subject-matter expects rescore the MAHP confirming its validity. If the judgements
aij fall outside the range of the sij probabilistic distribution, possible causes must be
identified. This technique is a live document that can be modified as new information
becomes available. The results of this study were encouraging to key personnel in
the product development process and thereby established a greater opportunity to
explore the application of MAHP in other core business processes. Since its first
application, MAHP has been applied within the collaborative company in selecting
three different design concepts, evaluating the value added provided by different
products and in selecting between reengineering and improving a production line.
Cost Sensitivity Analysis
0
0.05
0.1
0.15
0.2
0.25
0.3
0.35
0.4
0 0.2 0.4 0.6 0.8 1
Cost Weight
Ran
king
s Current Design ConceptDesign concept #1Design concept #2Design concept #3
Figure 6. Sensitivity analysis graph.
3868 R. Banuelas and J. Antony

5. Advantages and disadvantages of the MAHP
One of the main advantages of the MAHP is the incorporation of probabilisticjudgement in order to manage uncertainty. The introduction of probabilistic judge-ments allows the incorporation of uncertainty when people cannot converge toa single number (Hauser and Tadikamalla 1996). In addition, this allows the statis-tical interpretation of the results. In the traditional AHP the only interpretation ofthe wi>wj is that wi/wj is the ratio of preference of i over j (Rosenblom 1996).In contrast, in the MAHP the rankings are estimated by the probability that alter-native ‘i ’ is superior at a significance level of � to alternative ‘j ’ (Rosenbloom 1996).Therefore, using ANOVA the probabilistic ranking can be estimated. Further anal-ysis can be done by means of the MSD. The MSD is a performance measure whichtakes into account both mean and standard deviation from its target performance.Many traditional approaches are focused on the mean performance measure andnot on the variability in performance measure. Another important feature of theMAHP is the way that it deals with managerial issues. Their recognition and sys-tematic incorporation represent an uncomplicated way to follow an approach.
Traditional AHP is popular for several reasons. It is a straightforward anddeterministic approach to select alternatives (Forman 1993, Rosenbloom 1996).MAHP seems to be far more complex than the original AHP. However, the subject-matter experts do not require advanced knowledge of either mathematics, statisticsor AHP to construct the hierarchy and perform the pairwise comparisons. The restof this model is recommended to be performed using the appropriate software. Theincorporation of uncertainty through a simulation and statistical approach providesthe MAHP a means to test the final scores table comparing the MAHP with thetraditional AHP.
Practitioners use AHP to help clarify a difficult group decision process. The finalrankings are used as a general guide in the selection of a particular alternative, buta small difference in scores is not to be taken as definitive evidence that one alter-native is preferable to another. Sometimes a clear apparent winner among alterna-tives will emerge, sometimes the process will help a group to reach an intuitiveconsensus even though alternatives appear to be closely matched (Scott 2002). Onthe other hand, MAHP emphasizes not only the evaluation of the problem, but alsothe structure of it, its definition and context and the incorporation of uncertainty.The final rankings are interpreted statistically; therefore, the selection of a particularalternative can be done under a statistical significance. This would enable increasedconfidence in design personnel selecting more reliable and efficient decisions ona particular design alternative from the given choice of alternatives.
6. Conclusions
The research provides some guidelines for sensible design alternatives selectionby incorporating managerial aspects and using probabilistic input in the AHP.A critical evaluation of the traditional AHP dictated the necessity of incorporatinguncertainty in the pairwise comparisons and managerial aspects in order to applythis technique successfully. A simulation approach is recommended to incorporateuncertainty in the AHP, generating probabilistic rankings, which are treated usingstatistical tools and techniques (e.g. ANOVA, MSD, confidence intervals, sensitivitycharts). The MAHP used in the present paper served as one of the techniques formaking concept design evaluations. This technique is capable of taking intoconsideration quantitative, qualitative and multiple dimension information under
3869Modified AHP to incorporate uncertainty and managerial aspects

uncertainty, which are powerful and necessary characteristics for any concept designevaluation. For these characteristics the collaborative company foresaw the appli-cability of MAHP in the industry and promptly adopted and implemented it forevaluating design concepts. Design evaluation is one of the most critical stages of thedesign and development process. It dictates how design concept proceed to detaileddesign optimization and ultimately manufactured products. If the incorrect conceptis selected at the beginning, no amount of design optimization can recuperate theadvantages that were dismissed in the initial decision. Accordingly, the design con-cept selected using MAHP allowed the collaborative company to reduce service callrate (reliability), reduce energy consumption of the domestic appliance by 10% andimprove assembly time by 5%, at the same cost and with the required level of safety.As one of the designers pointed out ‘the systematic and structured way of the MAHPmakes designers and engineers really think about the design concepts under thedifferent criteria which improves the overall product performance’. Some of thebenefits of MAHP over traditional AHP are as follows:
. Facilitates consensus, generates new insights and provides more confidence inthe results.
. Provides a systematic approach to structure the problem and understand itscontext.
. Links several methods (‘soft’ and ‘hard’) to deal with the complexity ofreal-world interventions.
. Provides a method to test the results for statistical significance.
. Incorporates uncertainty using probabilistic distribution as an input.
. Analyses rank reversal using ANOVA.
As with any research effort, there are additional areas to investigate and improve.The next stage of this research is to apply the modified AHP in other industries andcontexts. This will enable one to test the MAHP technique and evaluate its advan-tages and disadvantages under specific conditions. Additional research can be doneto model problems that cannot be arranged hierarchically using a modified analyticnetwork process. Another possible area of research is to treat the uncertainty on thejudgements using fuzzy sets and compare the results with this research.
Acknowledgements
Research was funded by the Mexican Council of Science and Technology,CONACYT. The authors thank the referees, whose constructive suggestionshelped in the improvement of the final version of the manuscript.
References
ANTONY, J. and KAYE, M., 2000, Experimental Quality: A Strategic Approach to Achieve andImprove Quality (Boston: Kluwer).
ARBEL, A. and VARGAS, L., 1993, Preference simulation and preference programming: robust-ness issues in priority derivation. European Journal of Operational Research, 69,200–209.
AURAND, S., ROBERTS, C. and SHUNK, D., 1998, An improved methodology for evaluating theproductivity of partially specified part designs. International Journal of ComputerIntegrated Manufacturing, 11, 153–172.
BANUELAS, R. and ANTONY, J., 2003, Going from six sigma to design for six sigma using AHP.TQM Magazine, 15, 34–44.
BICHENO, J., 1994, The Quality 50 (Buckingham: PICSIE).
3870 R. Banuelas and J. Antony

CHANG, D., 1996, Applications and extent analysis method on fuzzy AHP. European Journalof Operational Research, 95, 649–655.
CHECKLAND, P., 1999, Systems Thinking, Systems Practice (Chichester: Wiley).CHUANG, P. T., 2001, Combining the analytic hierarchy process and quality function deploy-
ment for a location decision from a requirement perspective. International Journalof Advanced Manufacturing Technology, 18, 842–849.
CROWE, T., NOBLE, J. and MACHIMADA, J., 1998, Multi-attribute analysis of ISO-9000 regis-tration using AHP. International Journal of Quality and Reliability Management, 15,205–222.
DENSCOMBE, M., 1992, An Introduction to Questionnaire Design (Leicester: De MontfortUniversity).
DESPONTIN, M., MASCAROLA, H. and SPRONK, J., 1983, A user oriented listing of MCDM.Revue Belge de Reseache Operationelle, 23, 3–11.
DRAKE, P., 1998, Using the analytic hierarchy process in engineering education. InternationalJournal of Engineering Education, 14, 191–196.
FICHTNER, J., 1986, On deriving priority vectors from matrices of pairwise comparisons. Socio-Economic Planning Sciences, 20, 341–345.
FINAN, J. S. and HURLEY, W. J., 1997, The analytic hierarchy process: does adjusting a pair-wise comparison matrix to improve the consistency ratio help? Computers OperationResearch, 24, 749–755.
FORMAN, E., 1993, Facts and fictions about the analytic hierarchy process. Mathematicaland Computer Modelling, 17, 19–26.
GILLHAM, W., 2000, Developing a Questionnaire (London: Continuum).GRYNA, F., 1974, Basic statistics methods. In J. M. Juran, F. M. Gryna and R. S. Bingham
(eds), Quality Control Handbook (New York: McGraw-Hill).HAUSER, D. and TADIKAMALLA, P., 1996, The analytic hierarchy process in an uncertain
environment: a simulation approach. European Journal of Operation Research, 91, 27–37.
JACKSON, M. and KEYS, P., 1984, Towards a system of system methodologies. Journalof Operational Research Society, 35, 473–489.
KIEMELE, M., SCHMIDT, S. and BERDINE, R., 1997, Basic Statistics: Tools for ContinuousImprovement (Colorado Springs: Air Academic Press).
KORPELA, J., LEHMUSVAARA, A. and TUOMINE, M., 2001, An analytic approach to supplychain development. International Journal of Production Economics, 71, 145–155.
KUMAR DEY, P., 2001, Decision support system for risk management: a case study.Management Decision, 39, 634–649.
KUMAR, N. V. and GANESH, L. S., 1996, A simulation based evaluation of the approximate andthe exact eigenvector methods employed in the AHP. European Journal of OperationalResearch, 95, 656–662.
KWIESIELEWICZ, M., 1999, The logarithmic least squares and the generalized pseudoinversein estimating ratios. European Journal of Operational Research, 93, 611–619.
LEE, W., LAU, H. and SAMSON, T., 2001, A fuzzy analytic hierarchy process approachin modular product design. Experts Systems, 18, 32–42.
LEVARY, R. and WAN, K., 1998, A simulation approach for handling uncertainty inthe analytic hierarchy process. European Journal of Operational Research, 106, 116–122.
LINDLEY, D., 1971, Making Decisions (Chichester: Wiley).MINGERS, J. and BROCKLESBY, J., 1997, Multimethodology (Chichester: Wiley).MINGERS, J. and GILL, A, 1997, Multimethodology: towards a framework for mixing
methodologies. International Journal of Management Science, 25, 489–509.MINITAB, 2000, Minitab User’s Guide 1: Data, Graphics, and Macros (PA, USA: Minitab).MONTGOMERY, D., 1996, Introduction to Statistical Quality Control (New York: Wiley).MONTGOMERY, D., 1997, Design and Analysis of Experiments (New York: Wiley).MONTGOMERY, D., 2003, Applied Statistics and Probability for Engineers (New York: Wiley).OPPENHEIM, A. N., 1966, Questionnaire Design and Attitude Measurement (London:
Heinemann).OSLO, D. MEICHTOV, A. I. and MOSKOVICH, H., 1999, Comparison of MCDA paradigms.
In N. Meskens and M. Roubens (eds), Advances in Decision Analysis (Boston: Kluwer).
3871Modified AHP to incorporate uncertainty and managerial aspects

OTTO, K. and WOOD, K., 2001, Product Design Techniques in Reverse Engineering and NewProduct Development (Upper Saddle River: Prentice Hall).
PAULSON, D. and ZAHIR, S., 1995, Consequences of uncertainty in the Analytic HierarchyProcess: a simulation approach. European Journal of Operational Research, 87, 45–56.
ROSENBLOOM, E. S., 1996, A probabilistic interpretation of the final rankings in AHP.European Journal of Operation Research, 96, 371–378.
ROSENHEAD, J. and MINGERS, J., 2001, Rational Analysis for a World Revised (Chichester:Wiley).
RUONING, X. and XIAOYAN, Z., 1992, Extensions of the analytic hierarchy process in fuzzyenvironment. Fuzzy sets and Systems, 52, 251–257.
SAATY, T. L., 1988, The Analytic Hierarchy Process (New York: Pergamon).SAATY, T. L., 1996, The Analytic Network Process (Pittsburgh: RWS).SAATY, T. L. and KEARNS, K. P., 1985, Analytic Planning: The Organisation of Systems
(Oxford: Pergamon).SCOTT, M., 2002, Quantifying certainty in design decisions: examining AHP. In ASME DETC
2002 Design Engineering Technical Conferences, Design Theory and MethodologyConference (DTM), Montreal, Quebec, Canada, September 2002.
STAM, A. and DUARTE, P., 2003, On multiplicative priority rating methods for the AHP.European Journal of Operational Research, 145, 92–108.
SUDMAN, S., 1982, Asking Questions (San Francisco: Jossey-Bass).ULRICH, K. and EPPINGER, S., 1995, Product Design and Development (New York: McGraw-
Hill).VARGAS, L., 1982, Reciprocal matrices with random coefficients. Mathematical Modelling,
3, 69–81.WANG, J., 2002, Improved engineering design concept selection using fuzzy sets. International
Journal of Computed Integrated Manufacturing, 15, 18–27.WHEELER, D. J., 1988, Understanding Industrial Experimentation (Knoxville: Statistical Process
Controls).ZAHIR, S., 1991, Incorporating the uncertainty of decision judgments in the analytic hierarchy
process. European Journal of Operational Research, 53, 206–216.ZANAKIS, S., SOLOMON, A., WISHART, N. and DUBLISH, S., 1998, Multi-attribute decision
making: a simulation approach of selected methods. European Journal of OperationResearch, 107, 507–529.
3872 R. Banuelas and J. Antony