modifications to national energy demand/supply database
TRANSCRIPT

\
MODIFICATIONS TO NATIONAL ENERGYDEMAND/SUPPLY DATABASE
POHNPEIFederated States of Micronesia
SOPAC Miscellaneous Report 339
Prepared by
The Energy UnitSouth Pacific Applied Geoscience Commission
July 1999

2
TABLE OF CONTENTSPage
1.0 Introduction .. .. .. .. .... . ... .. ... ... .. ... .. ... .. ... .. ... . ... .. .. ... . .. .. .. .. .. 3
2.0 Description of the Modified Database 3
2.1 New and Renewables 4
2.2 Petroleum 4
2.3 Power 5
2.4 Energy Balance " 5
3.0 Data Requirement and Possible Sources .. ... .. .. . .. .. .. ... . .. . .. 5
3.1 New and Renewables . .. .. .. .. .. .. .. ... .. .. . .. .. .. . 6
3.2 Petroleum 6
3.3 Power 6
3.4 List of possible sources .. .. . .. .. .. .. .. .. .. ... ... . .. . .. . .. 6
4.0 Annexes 8
Annex 1 Conversion Factors
Annex 2 Short Cuts and Assumptions
Annex 3 Regional Standard Industrial Classifications
Annex 4 Abbreviations used
Annex 5 New and Renewables
Annex 6 Total Petroleum Product, Gas & Oil Companies
Annex 7 Power
Annex 8 Energy Balance

3
The National Energy Demand/Supply Database was established to enable Pacific Island Countries(PICs) to source, record and store energy data for not only to develop their policies but also bemade available to donors and other regional organizations for their appropriate responses.
This was implemented by the Energy Division' of the Forum Secretariat in 1994. Since then, thedatabase work has not been progressing as expected. A request by the PICs to modify the existingstructure so as to reduce complexity, minimize workload in collecting/inputting data and be moreuser friendly have lead SOPAC to carry-out the necessary modifications.
The modification comprises of reducing the desegregation of the Petroleum Sector and combiningthe individual sheets to single workbooks. The annexes provide detail information regardingconversion factors, classification of the end-use sectors, abbreviations used and workbookstructures.
The purpose of this report is to assist the state of Pohnpei's' Energy Planning Unit (EPU) insourcing, collecting and inputting energy data into the modified version of the database.
The Energy Supply/Demand Database is a series of inter-linked worksheets/workbooks. Themodified database is in Microsoft Excel. The basic structure of the database is as follows:
New and Renewables Private Utility
- Solar hot water - P_lpg - Huh_adoe - Alc_adoe- PV - Momi - Ins adoe - Nan adoe- -- Coconut Residue - PTA - Pfc adoe - Nan ror- -- Fuel Wood - Total Petroleum - Pohprv - Pal_adoe- Total Nrse - Poh_utly
- Poh totls.xlsThe above diagram illustrates the linkagesto the Energy Balance. ~.~_.Note' j i .. ·• Nrse @:0)3 fitNrse• : :. __.__ )i_~;?:4• All sheets are protected so as to avoid ! $..~~etrleum j~gl~ Petrleum
accidental tempering with the hidden I ! If'!: pMolmi i~~!~owehbrIXIS
, ; ttl·. _pg ';1:1.1 ~ 0 a.formulae. ; '~ ..fia Pta ~;~
i a..tiJ Power »;)! ~ ..fia Private jt{)~i ! ~.. ;~$~: 00·. Utility ;;ZX~, ft:\-. • • ,",>(x<""
1 physically relocated to SOPAC in January 19982 FSM's national capital

4
2.1 Newand Renewables
The New and Renewables workbook contents are summarized below:
Sheet(s) ContentTotal NRSE summary of consumption of new and renewables by
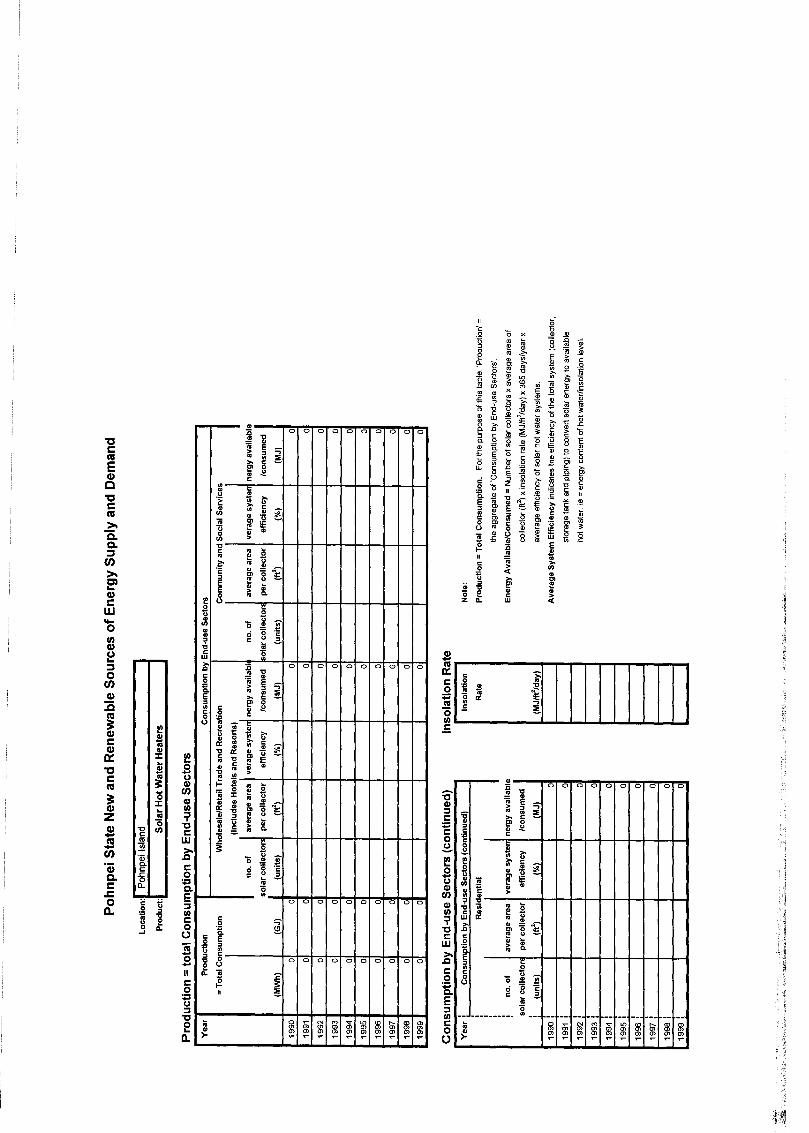
sectors (units = GJ)Solar Hot Water Heaters shows the total energy supplied by SHW systems in
MWhandGJPV shows the energy provided by PVs in MWh and GJCoconut wood & residue calculates the energy obtained from coconut wood &
residue in GJ and teoFuel wood & Woodwaste gives the total consumption in GJ and teo
The end-use sectors' in New and Renewables are: Agriculture, Forestry and Fishing;Manufacturing (produce drying, sawmills, oil processing, etc); Electricity Generation; Wholesale,Retail Trade and Recreation (includes hotels, resorts, restaurants, etc); Transport andCommunication (warehousing, post & telecommunications, etc); Community and Social Services(street lighting, schools/educational institutes, local government administration services, etc); andResidential (Urban & Rural). Annex 5 provides further details of the New and Renewablesworkbook.
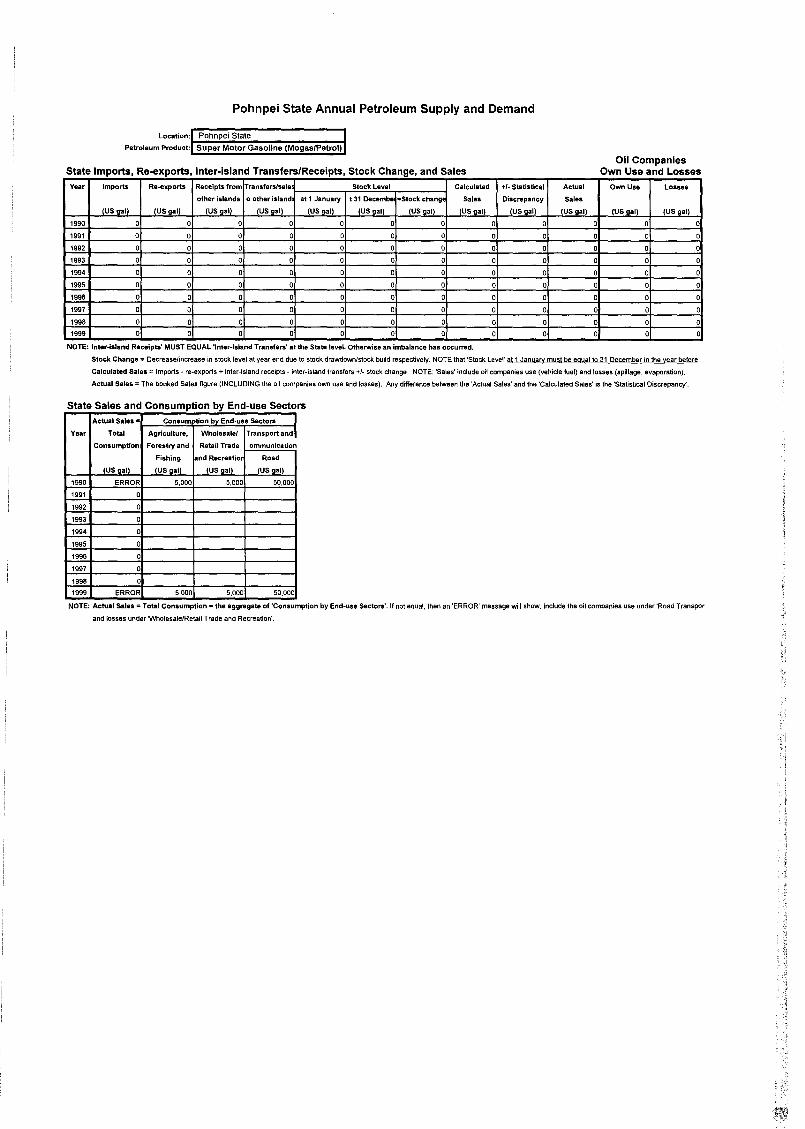
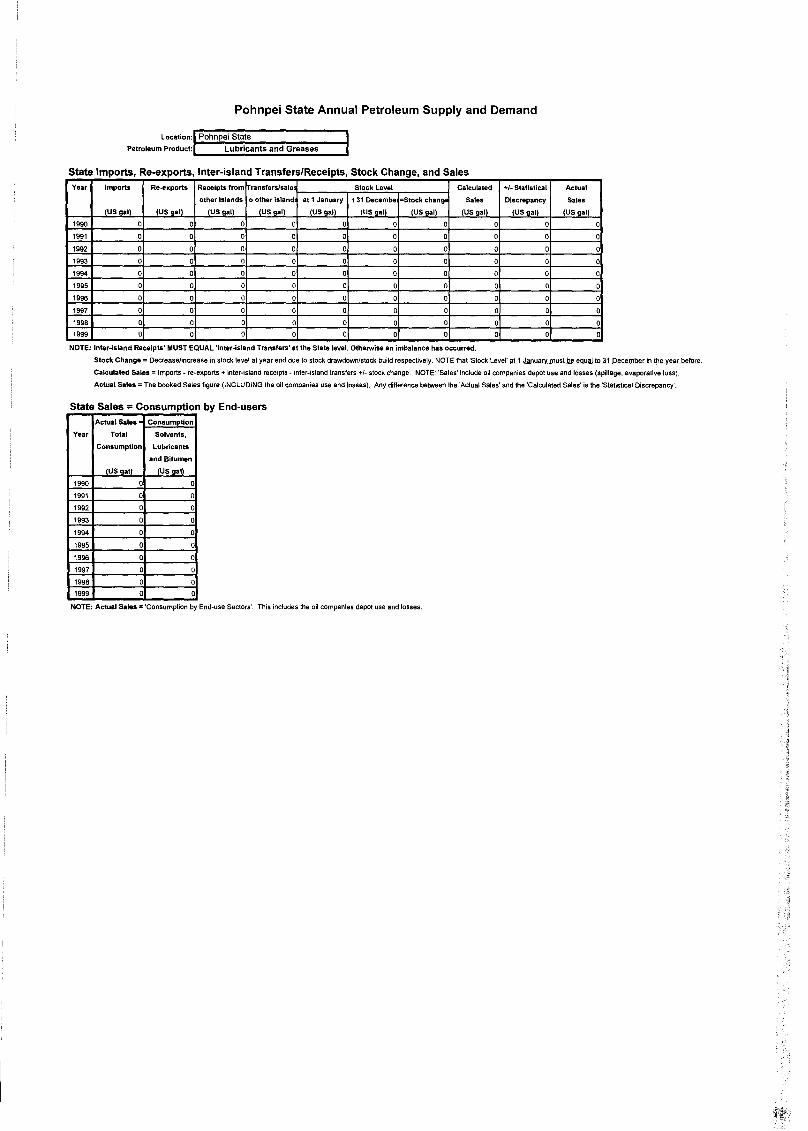
2.2 Petroleum
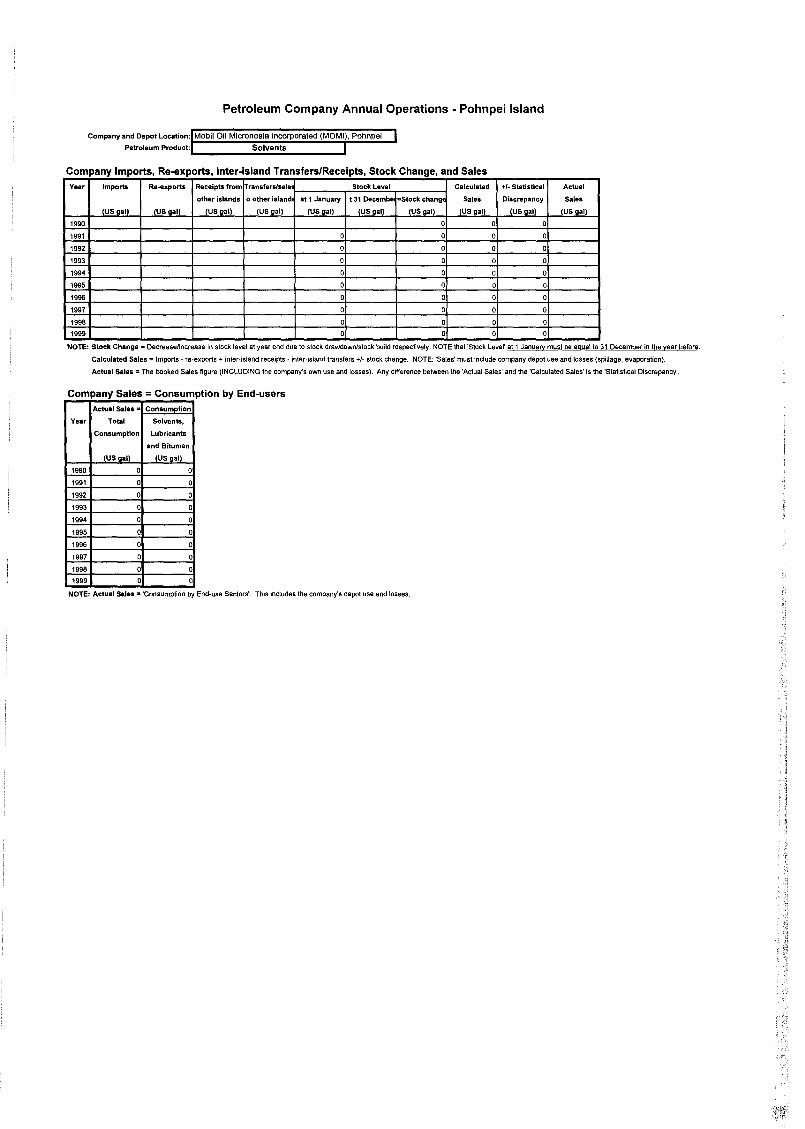
Mobil Oil has been the long-standing supplier of petroleum products to Micronesia with bulk-storage facilities in the main islands Chuuk, Pohnpei and Yap. The Micronesia PetroleumCompany is the lone supplier of petroleum products in Kosrae.
The petroleum sector database structure comprises of the following workbooks: PJpg; Momi;PTA; and Pohpet.xls, Each workbook has a series of interlinked sheets containing data for therespective petroleum products.
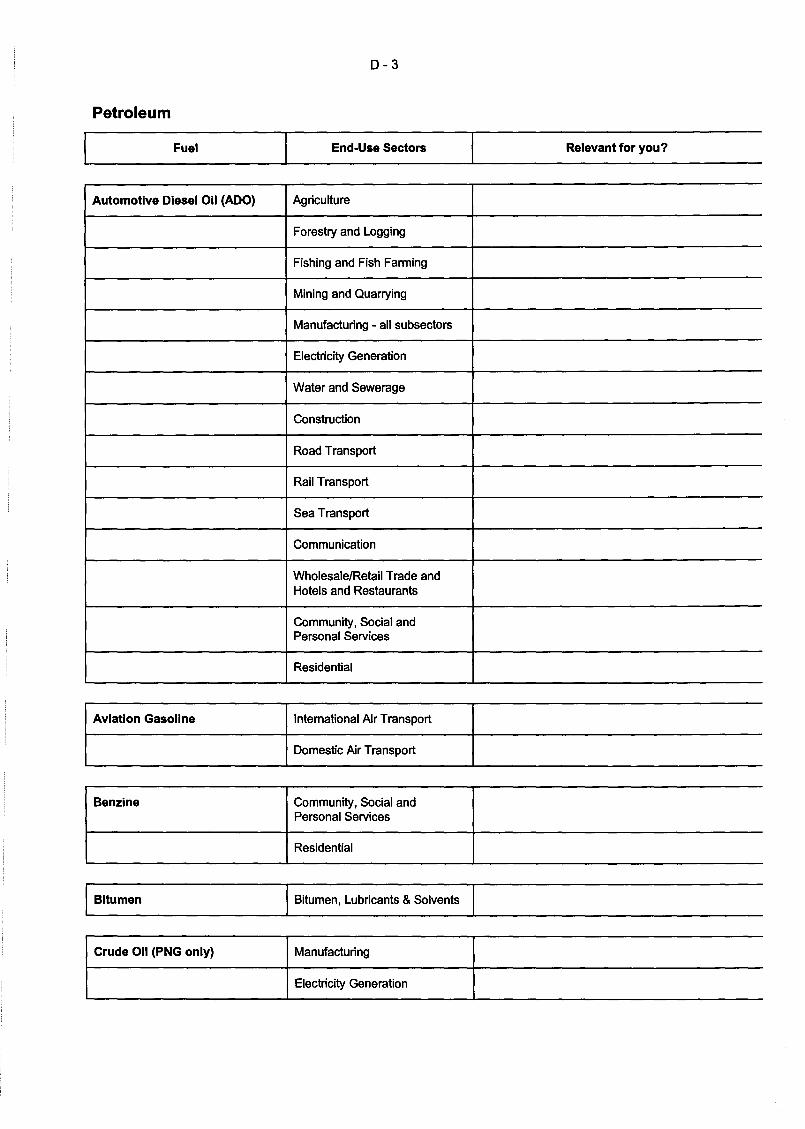
The end-use sectors are categorized according to product type. For example, Avgas will onlyhave Wholesale, Retail Trade & Recreation, and Transport (International Air & Domestic Air);for ADO the end-use sector comprises of Agriculture, Forestry & Fishing, Mining & Quarrying,Manufacturing, Electricity Generation, Water Supply, Construction, Wholesale/ Retail Trade &Recreation and Transport (rail, road & sea). See Annex 6 for a detail structure of the PetroleumSector.
3 see Annex 3 for a detailed classification of the end-use sectors

5
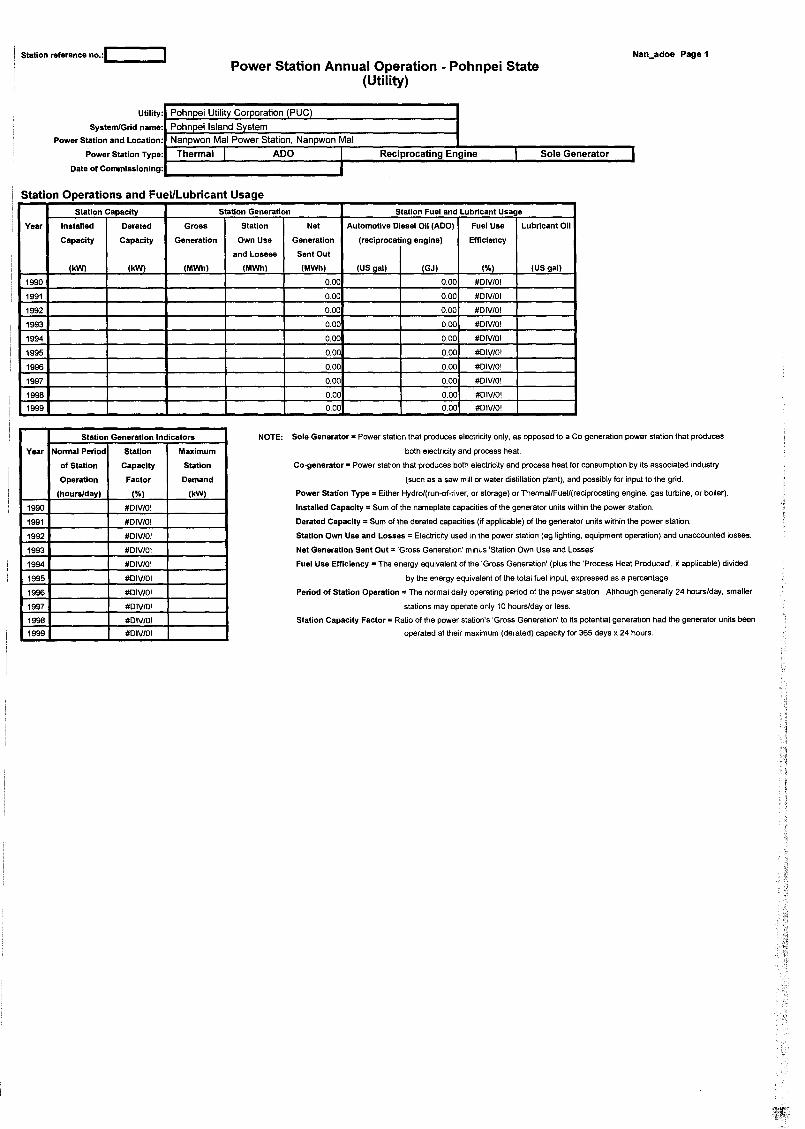
2.3 Power
Electricity generation and distribution in Pohnpei is the responsibility of the state Department ofPublic Works who is also responsible for water and sewerage.
There is no change in the structure of the database in the power sector. It has two componentsnamely Private and Utility. The private generators are located at Harbour View Hotel (Hvh);Isamu Nakasone Store (Ins) and Pohnpei Fishing Corporation (Pfc), The utilities are located atDekehtik - ALCO Power Station (Ale); Nanpwon Mal - Nanpwon Mal Power Station(Nan_adoe); Nanpil - Nanpil Power Station (Nan ror) and Palikir - Palikir Power Station.
The end-use sector comprises of: Agriculture, Forestry and Fishing; Mining and Quarrying;Manufacturing; Water and Sewerage; Construction; Wholesale/Retail Trade and Recreation;Transport and Communication; Finance and Business Services; Community and Social Services;Street Lighting; and Residential. See Annex 7 for more details.
2.4 Energy Balance
The energy balance workbook consists of ten sheets (ten energy balances; e.g., 1990 - 1999).This is the end product of the energy database where it summarises details of individual nationalenergy sources and consumption. The energy balance is inter-linked to the New and Renewables,Petroleum and Power Workbooks (see Annex 8 for Energy Balance structure).
The sub-sections that follow outlines the data required for updating the energy database and theirpossible sources.
3.1 New and Renewables
• number of operating PV modules and solar hot water systems• average area" per module/collector (m')• average system efficiency" (%)• insolation rate (MJ/m2/day)• number of households (urban & rural)• estimated number of persons per household• an average consumption rate of biomass per sector
Biomass consumption": urban - 700 kg/hh/yr (or O.25kg/person/day)rural- 3800 kg/hh/yr (or 1.6 kg/person/day)
% of fuelwood vs % of coconut residue - assume 90%/10% for island environment.
4 typical collector areas: SHW = 2.98 m2 (180 litre system) & 3.98 m2 (300 litre system); PV modules « 2 m2
5 average efficiency values: SHW = 20% - 30%; PV = 10% - 15%6 PREA estimates
6
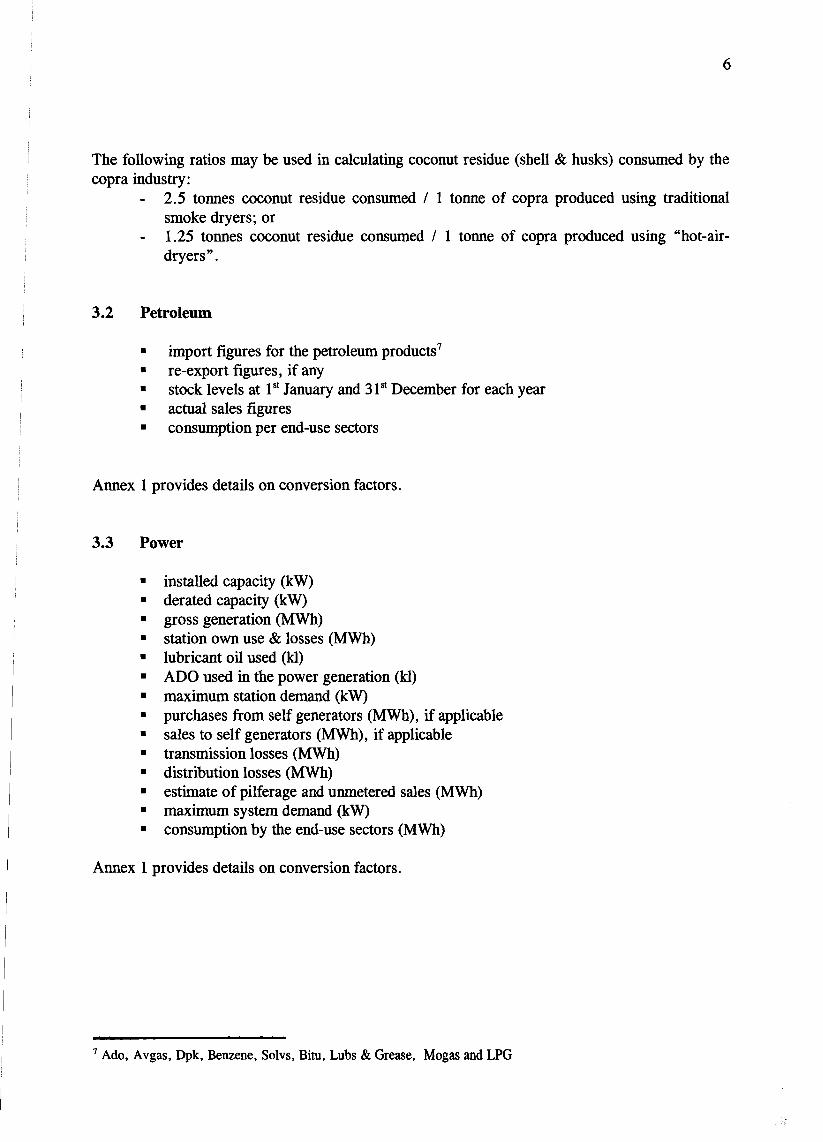
The following ratios may be used in calculating coconut residue (shell & husks) consumed by thecopra industry:
- 2.5 tonnes coconut residue consumed I 1 tonne of copra produced using traditionalsmoke dryers; or
- 1.25 tonnes coconut residue consumed I 1 tonne of copra produced using "hot-air-dryers" .
3.2 Petroleum
• import figures for the petroleum products 7
• re-export figures, if any• stock levels at lSI January and 31 st December for each year• actual sales figures• consumption per end-use sectors
Annex 1 provides details on conversion factors.
3.3 Power
• installed capacity (kW)• derated capacity (kW)• gross generation (MWh)• station own use & losses (MWh)• lubricant oil used (kl)• ADO used in the power generation (kl)• maximum station demand (kW)• purchases from self generators (MWh), if applicable• sales to self generators (MWh), if applicable• transmission losses (MWh)• distribution losses (MWh)• estimate of pilferage and unmetered sales (MWh)• maximum system demand (kW)• consumption by the end-use sectors (MWh)
Annex 1 provides details on conversion factors.
7 Ado, Avgas, Dpk, Benzene, Solvs, Bitu, Lubs & Grease, Mogas and LPG

7
3.4 List of possibledata sources
Oil/Gas Companies Power Utilities AirlinesCustoms Departments Solar Utilities Shipping AgenciesStatistical Publications" Meteorological OfficesStatistics Offices Energy Survey Results
Establishing data sources with a company/organization will generally require a formal and seniorlevel approach. It is crucial that a good work relationship is enhanced and data collection ismaintained on a regular and consistent basis.
8 examples: by the ADB, SPC & UN

8
4.0 ANNEXES

9
ANNEX 1 CONVERSION FACTORS

- 1 - App.3
The following factors are indicative, because a fuel's specifications varies with source, time, place,
temperature, etc. The energy factors measure the gross energy content of the fuel.
1. Liquid Fuels (Note: gallons and tons are US measures)
Megajoules Megajoules L1tres per Gallons Gigajoules Gigajoulesper Litre per Gallon Tonne per Ton per Tonne per Ton
LPG (Propane) 25.3 95.8 1960 469.7 49.6 45.0LPG (Butane) 27.7 104.9 1730 414.6 49.0 44.5Aviation Gasoline (Av Gas) 33.2 125.7 1410 337.9 46.8 42.5Motor/Automotive Gasoline (Mogas) 34.6 131.0 1340 321.1 46.4 42.1Dual Purpose Kerosene (DPK) 36.8 139.3 1260 302.0 46.4 42.1Automotive Diesel Oil (ADO) 38.6 146.1 1180 282.8 45.6 41.4Industrial Diesel Oil (IDa) 39.0 147.6 1150 275.6 44.9 40.7Fuel Oil- high sulphur (Fa) 40.8 154.4 1050 251.6 42.9 38.9Ethanol (PNG only) 23.4 88.6 1266 303.4 29.6 26.9SolventslWhite Benzene 34.0 128.7 1420 340.3 48.1 43.6Lubricants and Greases 38.8 146.9 1120 268.4 43.4 39.4Bitumen 44.0 166.6 980 234.9 42.7 38.7Crude Oil (PNG Kutubu Light) 35.9 135.9 1249 299.3 44.9 40.7Coconut Oil 34.9 132.1 1100 263.6 38.4 34.8
2. Petroleumcrude specific gravities (approximatefigures at 15°C)
Degrees API Specific gravity Litres per Tonne MJ per Litre25 0.903 1108 39.726 0.898 1114 39.527 0.892 1123 39.228 0.886 1129 39.129 0.881 1136 38.930 0.875 1144 38.631 0.870 1150 38.532 0.865 1157 38.333 0.859 1165 38.134 0.854 1172 37.935 0.849 1179 37.736 0.844 1187 37.537 0.839 1193 37.338 0.835 1198 37.239 0.829 1207 37.040 0.824 1215 36.841 0.820 1220 36.642 0.815 1228 36.443 0.810 1235 36.344 0.805 1243 36.1*45 0.801 1249 35.946 0.796 1257 35.747 0.792 1263 35.648 0.788 1270 35.449 0.783 1278 35.250 0.779 1284 35.1
• "Kutubu Light", PNG.
3. Solid Fuels

- 2 - App.3
Gigajoules GigajoulesperTonne perTon
Black Coal- steaming coal (Fiji only) 30.1 27.3Charcoal 30.0 27.2FuelwoodlWoodwaste (40% mcwb}1 10.8 9.8FuelwoodlWoodwaste (13% mcwb}2 17.1 15.5Coconut Palm Wood 11.5 10.4Coconut Residues3:
Shell (15% mcwb harvested) 14.6 13.2Husk (30% mcwb harvested) 12.0 10.9Average (air dry shell and husk}4 14.0 12.7
Palm Oil Residues:Shell 17.5 15.9Fibre 12.5 11.3Average 15.0 13.6Empty Bunches 7.5 6.8
Bagasse 9.7 8.71. Typical moisture content of undried sawmill residue and timber merchant fuelwood.
2. Typical moisture content of air dried fuelwood and residue.
3. Average yield of 2.93 air dry tonnes of residue per tonne of copra produced.
4. Proportion: kemel 33%. shell 23 % and husk 44% by dry weight.
4. Gaseous Fuels
Megajoules Megajoulesper Cubic per CubicMetre Foot
Natural Gas 39.0 1.1Methane 37.7 1.1
• Approximate figures at 15°C.
5. Electricity
MegajoulesperkWh
Electricity 3.6
Sources for the above tables:
• regional specifications.
• Department of Primary Industries and Energy. Australia.
• World Bank PREA reports 1992.
• Energy Data and Conversion Factors (New Zealand Energy R&D Committee 1984).

- 3 - App.3
Compiled from the Petroleum Economist and the Stein muller 'Pocket Book', based on the
international system of units (51). Factors are either exact or correct to six significant figures.
Area
Length
1 square inch
1 inch = 645.16 square millimetres (mm2
)
= 25.4 millimetres (mm)
1 square foot2
1 foot = 0.0929030 square metres (m )
= 12 inches (")
= 0.333333 yard 1 square yard
= 0.3048 metre (m) = 9 square feet2= 0.836127 square metres (m )
1 yard
= 36 inches (") 1 square metre
= 3 feet (') = 10.7639 square feet (squ.ft)
= 0.9144 metre (m) = 1.19599 square yards
1 metre 1 acre
= 39.3701 inches (") = 4,840 square yards2= 3.28084 feet (') = 4,046.86 square metres (m )
= 1.09361 yards = 0.404686 hectares
= 0.001 kilometre (km)
1 hectare
1 kilometre = 10,000 square metres (m2)
= 1,000 metres (m) = 2.47105 acres
= 0.621371 mile = 0.01 square kilometres (km2
)
1 mile 1 square kilometre
= 1,760 yards = 100 hectares
= 1.60934 kilometres (km) = 0.386102 square miles
1 international nautical mile 1 square mile
= 1.85318 kilometres (km) = 640 acres
= 1.15088 miles = 258.999 hectares
= 2.58999 square kilometres (km2)
Volume

- 4 - App.3
1 cubic inch 1 American barrel (bbl)
= 16.3871 cubic centimetres (cm3) = 9,687.95 cubic inches (cu")
= 158.757 litres (I)
1 pint = 42 American gallons
= 0.568261 cubic decimetres (dm3) = 34.9725 Imperial gallons
= 5.60645 cubic feet (cur)
1 litre (I) = 0.158757 cubic metres (m3)
= 61.0238 cubic inches (cu")
= 1.75975 pints 1 cubic metre
= 1 cubic decimetre (dm 3) = 1,000 litres (I)
= 0.264170 American gallons = 264.170 American gallons
= 0.219969 Imperial gallons = 219.969 Imperial gallons
= 0.0353147 cubic feet (cu ft) = 6.29894 American barrels (bbl)
= 35.3147 cubic feet (cu ft)
1 hectolitre
= 100 litres 1 kilolitre (kl)
= 1,000 litres (I)
1 American gallon = 6.29894 American barrels (bbl)
= 231 cubic inches (cu")
= 3.78544 litres (I) 1 gross ton (shipping)
= 0.832679 Imperial gallons = 2.83168 cubic metres or 100 cubic feet
= 0.133681 cubic feet (cu ft) of permanently enclosed space
= 0.0238095 American barrels (bbl)
= 0.00378544 cubic metres (m3)
Mass
1 Imperial gallon
= 277.42 cubic inches (cu") 1 ounce (ozs)
= 4.54609 litres (I) = 28.3495 grams (g)
= 1.20094 American gallons
= 0.160544 cubic feet (cu ft) 1 pound
= 0.0286355 American barrels (bbl) = 0.453592 kilograms (kg)
= 0.00454609 cubic metres (m3) = 0.00892857 hundredweight
1 cubic foot (cu ft) 1 kilogram (kg)
= 28.31681itres (I) = 2.20462 pounds (Ibs)
= 7.48047 American gallons = 0.001 tonne (te)
= 6.22884 Imperial gallons
= 0.178366 American barrels (bbl)
= 0.0283168 cubic metres (m3) 1 hundredweight
= 112 pounds (Ibs)

- 5 - App.3
= 50.8023 kilograms (kg) = 277.778 watt hours (Wh)
= 238,846 calories (IT)
1 American (short) ton = 0.0238846 kilograms of oil equivalent
= 2,000 pounds (Ibs)
= 0.892857 long tons 1 kilogram of oil equivalent (koe)
= 0.907185 tonnes (te) = 41:868 megajoules (MJ)
= 10 megacalories
1 Imperial (long) ton
= 2,240 pounds (Ibs) 1 tonne of oil equivalent (toe)
= 1.12 short tons = 41.868 gigajoules (GJ)
= 1.01605 tonnes (te) = 10 gigacalories
1 tonne (te) 1 kilowatt hour (kWh)
= 2,204.62 pounds (Ibs) = 3,412.14 British thermal units (BTU)
= 1,000 kilograms (kg) = 859.845 kilocalories (IT)
= 1.10231 short tons = 3.6 megajoules (MJ)
= 0.984206 long tons = 1.34102 horsepower hours
1 metric horsepower (Pferdesaerke or Cheval
Energy and Power Vapeur)
= 735.499 watts (W)
1 international table (IT) calorie = 542.476 foot pounds force/second
= 4.1868 joules (J) = 0.986320 Imperial horsepower
1 megacalorie (IT) 1 Imperial horsepower
= 1,000,000 calories = 745.700 watts (W)
= 3968.32 British thermal units (BTU) = 550 foot pounds force/second
= 1163 watt hours (Wh) = 1.01388 metric horsepower
= 4.1868 megajoules (MJ)
1 kilowatt (kW)
1 joule (J) = 737.562 foot pounds force/second
= 0.238846 calories (IT) = 1.35962 metric horsepower
= 1.34102 Imperial horsepower
1 megajoule (MJ)
= 1,000,000 joules (J)
= 947.817 British thermal units (BTU)

10
ANNEX 2 SHORT CUTS AND ASSUMPTIONS

D - 1
This end-use sector disaggregation is assisted by the fact that, for most FICs, some fuels will be
consumed in only one or two end-use sectors. Consequently, valid assumptions can be made
regarding the end-use picture for those fuels. The database reports and the survey forms reflect
these assumptions.
The assumptions are based on the equation:
Total supply/sales = demand in end-use sector A + demand in end-use sector B + .
Consequently, if data for total supply and data for sales to end-use sectors B, C, etc, are known,
then demand in sector A can be derived. For example:
• Total sales of Aviation Gasoline (Av Gas) = Demand in Domestic Air Transport
sector. Consumption of Av Gas for International Air Transport is likely to be negligible.
• Total sales of DPK = Demand in International Air Transport + Demand in Domestic
Air Transport + Demand in Community/Social Services + Demand in Residential.
Demand for DPK in other sectors is likely to be negligible.
• Total sales of LPG = Demand in Hotels/Restaurants + Demand in
Community/Social Services + Demand in Residential. Demand for LPG in other
sectors is likely to be negligible.
• Total sales of Motor Gasoline = Demand in Agriculture/Forestry/Fishing + Demand
in Road Transport + Demand in Community/Social Services + Demand in
Residential. Demand in other sectors is likely to be negligible.
• Total Biomass supply/demand = Demand in specific Agro-industries + Demand in
Community/Social Services + imputed Demand in Residential. Demand in other
sectors is likely to be negligible.
• Total Solar Hot Water Heater supply/demand = imputed contribution of total
number of panels in Hotels/Restaurants + Community/Social Services +
Residential. Demand in other sectors is likely to be negligible.

0-2
• Total Solar Photovoltaic supply/demand = imputed contribution of total number of
panels in Community/Social Services + Residential. Demand in other sectors is
likely to be negligible.
While the above assumptions (and others) will apply to most FIGs, it is essential that they be
examined for their validity on an individual country basis
• a check list of fuels and their likely end-use sectors in which they are consumed is on
the following pages for your consideration and review.


11
ANNEX 3 REGIONAL STANDARD INDUSTRIALCLASSIFICATIONS

- 1 - App.2
Division Sub-division Group SUb-group
A (0000) Agriculture,Forestry,FishingandHunting0100 Agriculture(includescleaningand processingwhen done on
site. Furtherprocessingis partof 'Div. C: Manufacturing')0110 Sugarcanegrowing0120 Coconutgrowing0130 Ricegrowing0140 Oil palmgrowing0150 Tobaccogrowingandcuring0160 Fruit,vegetablesandothercropsgrowing0170 Poultryand egg production0180 Milkandcreamproduction0190 Otherlivestockproduction
0200 Servicesto agriculture0300 Forestryand logging(excludessawmillingwhich is part of
'Div.C- Manufacturing)0310 Forestryexceptlogging0320 Logging
0400 Fishingandfish farming0500 Hunting0600 Subsistenceagriculture,fishingand hunting
B (1000) MiningandQuarrying1100 Metallicore miningand beneficiation1200 Coalmining1300 Oil andgas extraction1400 Constructionmaterialquarrying1500 Otherminingand quarryingnec1600 Geologicaland prospectingactivities
C (2000) Manufacturing2100 Food,beveragesand tobacco
2110 Foods(includesanimalfeeds)2111 Meatproducts2112 Dairyproducts2113 Fruitandvegetableproducts2114 Fishand marinefood products2115 Margarineandoilslfatsnec2116 Grainmill andcerealfood products2117 Bakeryproducts2118 Sugarrefiningand products2119 Otherfood productsnec
2120 Beverages2121 Spiritsandwines2122 Beerandstout2123 Cordialsandcarbonateddrinks
2130 Tobaccoproducts2200 Textiles,clothingandfootwear
2210 Textiles2220 Clothing2230 Footwear2240 Leathergoodsexceptfootwear
2300 Wood,woodproducts,caneand furniture2310 Woodandcane productsexceptfurniture
2311 Sawmillingandotherwood milling2312 Woodenandcanecontainers2313 Woodandcaneproductsnec

- 2 - App.2
Division Sub-division Group Sub-group
2320 Furniture and fixtures, primarily of wood2400 Paper, paper products and printing/publishing
2410 Paper, paper products and paperboard2420 Printing, publishing and allied industries
2500 Chemical, petroleum, coal, rubber and plastics2510 Chemicals and chemical products
2511 Industrial chemicals2512 Paints, varnishes and lacquers2513 Soaps, cosmetics and toilet preparations2514 Chemicals products nec
2520 Petroleum refining2530 Petroleum and coal products nec2540 Rubber products2550 Plastic products
2600 Non-metallic mineral products2610 Glass and glass products2620 Clay products and refractories2630 Cement and cement products2640 Other non-metallic mineral products
2700 Basic metal products2710 Basic iron and steel2720 Basic non-ferrous metals2730 Casting of metals
2800 Fabricated metal products, machinery and equiprnent2810 Fabricated metal products except machinery and
equipment2811 Furniture and fixtures primarily of metal2812 Structural metal products2813 Fabricated metal products except machinery/equipment
nec2820 Machinery and equipment except electrical (includes
manufacture and repair)2821 Agricultural machinery and equipment2822 Machinery and equipment nec
2830 Electrical machinery, equipment and appliances (includesmanufacture and repair)
2840 Transport equipment (includes manufacture and repair)2841 Ship building and repair2842 Transport equipment manufacture and repair nec
2850 Professional and scientific equipment (includesmanufacture and repair)
2900 Other manufacturing2910 Jewellery and related articles2920 Manufacturing nec
D (3000) Electricity, Gas, Water and Sewerage3100 Electricity supply
3110 Public electricity3111 Sole generator, ie produces electricity only3112 Co-generator, ie produces electricity and process heat
3120 Private electricity3121 Sole generator, ie produces electricity only3122 Co-generator, ie produces electricity and process heat
3200 Gas reticulation3300 Water treatment and supply (including water distillation)3400 Sewerage collection, treatment and disposal

- 3 - App.2
Division Sub-division Group Sub-group
E (3500) Construction3510 Building construction, repair and demolition3520 Other construction
F (4000) Wholesale/Retail Trade and Restaurants/Hotels4100 Wholesale trade4200 Retail trade4300 Restaurants/bars and hotels/lodging
4310 Restaurants, cafes, bars and clubs4320 Hotels, resorts and lodging
G (5000) Transport, Storage and Communication5100 Transport
5110 Road transport includes all public and private roadtransport
5111 Bus transport5112 Taxi transport5113 Road freight transport5114 Personal vehicle transport5115 Road transport nec
5120 Rail transport includes all public and private rail transport5130 Water transport, includes all public and private water
transport5131 Sea cruises and tours5132 Ocean, coastal and inland water transport5133 Salvage, towing and stevedoring services
5140 Air transport, includes all public and private air transport5141 International air transport5142 Domestic air transport
5200 Warehousing, cargo handling and services allied to transport5300 Communication services includes post, telecommunications,
etc
H (6000) Finance, Insurance, Real Estate and Business Services6100 Banking, finance and investment services6200 Insurance services6300 Real estate and business services
I (7000) Community, Social and Personal Services7100 Public administration, pubilc order and defence
7110 Central and local government administration services7120 Public order and safety7130 Defence
7200 Street lighting7300 Sanitation, pest control and similar services7400 Social and community related services
7410 Education and education services7411 Schools and general education7412 Technical, vocational, commercial and tertiary
education7413 Education services nec
7420 Medical, dental, veterinary and other health services nec7430 Welfare institutions and services (includes orphanages,
old peoples homes, Salvation Army, Red Cross, etc)7440 Business, professional and labour associations

- 4 - App.2
Division Sub-division Group Sub-group
7450 Religious, social and community services nec (includeschurches, temples, youth organisations (Scouts, YMCS,YWCA, etc)
7500 Recreational, cultural and sporting services (includescinemas, television/radio stations, libraries, museaums,sporting clubs and associations)
7600 Personal and household services nec7700 International and extra-territorial agencies
J (8000) Residential8100 Urban residential8200 Rural residential
K (9000) Solvents, Lubricants and Bitumen
nec = not elsewhere classified.

12
ANNEX 4 ABBREVIATIONS USED

Abbreviations Used
• New and Renewables Sources of Energy (NRSE)- BGSE - bagasse (sugarcane residue)- COCO - coconut wood and residue- PALM - oil palm residue- PV - solar photovoltaics- WATR - solar water heater- WOOD - fuelwood and woodwaste- Tot! - Total
• Petroleum (Petrleum)- ADO - automotive diesel oil- AVGAS - aviation gasoline- BTMN - bitumen- BNZE - white benzene- DPK - dual purpose kerosene- FO - fuel oil- IDO - industrial diesel oil- LPG - liquefied petroleum gas- LUBE - lubricants and greases- MOGS - mogas, motor spirit, petrol- SOL V - solvents- SUPR - super mogas
• Electricity (POWER)- ADOE - automotive diesel oil / reciprocating engine- ADOT - automotive diesel oil / gas turbine engine- FOB - fuel oil / boiler- FOE - fuel oil / reciprocating engine- IDOE - industrial diesel oil / reciprocating engine- ROR - run-of-river / hydro- STR - storage engine- PRIV - private self generator- RURL - government rural generator- UTL Y - utility

13
ANNEX 5 NEW AND RENEW ABLES WORKBOOK


14
ANNEX 6 TOTAL PETROLEUM PRODUCT, GAS & OILCOMPANIES WORKBOOKS


15
ANNEX 7 POWER WORKBOOKS


Nan_adoe Page 2


16
ANNEX 8 ENERGY BALANCE
