modifying electroglottograph- identified intervals of ... · journal of speech and hearing...
TRANSCRIPT

Journal of Speech and Hearing Research, Volume 35, 495-51 1, June 1992
Modifying Electroglottograph-Identified Intervals of Phonation:The Effect on Stuttering
Merrilyn L. GowRoger J. Ingham
University of Cahlfornia, Santa Barbara
Single-subject experiments were conducted with an adolescent and an adult male who stutterto assess the effect on stuttering of changing the frequency of phonation intervals that werewithin prescribed duration ranges during spontaneous speech. Electroglottograph-ldentifiedintervals of phonation were measured using a computer-assisted biofeedback system. Bothsubjects demonstrated that their stuttering could be controlled by modifying the frequency ofphonation intervals within short duration ranges. The experimental effects not only replicatedearlier findings but were demonstrated to be independent of changes in speaking rate, oralterations to other intervals of phonation, and produced little disruption to speech naturalness.The theoretic implications of these findings are discussed.
KEY WORDS: stuttering, phonation, treatment, naturalness, electroglottograph
Much of the current interest in the speech motor behavior of persons who stutterhas emerged from findings concerning the facility with which they are able to initiateand terminate voicing. There is mounting evidence that adults who stutter tend tohave slower voice or laryngeal reaction times than their normally fluent counterparts(see Adams, 1985; Adams, Freeman, & Conture, 1984; Peters & Hulstijn, 1987), andthat this difference is even more pronounced among adults with severe stuttering(Watson & Alfonso, 1983; 1987). The apparent interaction between unusual phona-tory behavior and stuttering may be related to evidence that adults who stutter tendto display relatively longer intervals of phonation during stutter-free speech (Pindzola,1987; Prosek & Runyan, 1982), a characteristic that is less evident among childrenwho stutter (Healey & Adams, 1981b; Zebrowski, Conture, & Cudahy, 1985). Oneplausible explanation is that older persons who stutter may have learned to managetheir disorder, however imperfectly, by using relatively slow initiations of voicing andlonger intervals of phonation (Onslow & Ingham, 1987). If that is the case, then itshould follow that training to control the frequency of short intervals of phonation(presumably they require faster and more frequent initiation/termination of phonation)should control the frequency of stuttering among such speakers.
Interest in the contribution that changes in temporal aspects of phonation make tothe modification of stuttering was largely prompted by Wingate's (1969, 1970, 1976)modified vocalization hypothesis. Numerous attempts to investigate this hypothesishave suggested that many of the alleged "fluency-inducing" procedures, also involveincreases or even decreases in phonated intervals (PIs) in the speech of persons whostutter. For instance, changes in the proportion of phonation time have been foundduring singing (Colcord & Adams, 1979), slow speech (Healey & Adams, 1981a), and
'The notion that procedures that reduce stuttering also produce fluency is misleading. The resulting speech,as Finn and Ingham (1989) point out, may have no resemblance to the conventional concept of fluent speech
i 1992, American Speech-Language-Hearing Association 495 002 -4685/92/3 50 -0495$0 1. 00/
Downloaded From: http://jslhr.pubs.asha.org/ by University of California, Santa Barbara, Roger Ingham on 04/16/2014
496 Journal of Speech and Hearing Research
chorus reading (Adams & Ramig, 1980). The beneficial effecton stuttering of delayed auditory feedback and/or prolongedspeech (Goldiamond, 1965) has also been attributed toincreases in the duration of phonation during speech (Ing-ham, 1984). There is also some evidence that when adultswho stutter receive treatment based on prolonged speech,their posttreatment improved speech is characterized byincreases in phonation time (Mallard & Westbrook, 1985;Robb, Lybolt, & Price, 1985). Similar effects have been foundto occur with other types of treatment (Metz, Samar, &Sacco, 1983; Ramig, 1984; Samar, Metz, & Sacco, 1986).However, the relationship between changes in the duration ofspecific intervals of phonation and reductions in stutteringduring fluency-inducing conditions has not been fully inves-tigated. That relationship may also be unpredictable. An-drews, Howie, Dozsa, and Guitar (1982), for instance, foundthat only 4 of 12 fluency-inducing conditions (chorus reading,shadowing, singing, DAF-induced prolonged speech) pro-duced effects that were associated with consistent alterationsto measures of phonation time.2 Prins and Hubbard (1990),however, also reported that adaptation trends were associ-ated with variable, rather than consistent, changes in pho-nated intervals.
An intriguing feature of recent research on the role ofphonation management and stuttering is the absence ofinterest in studying the effects of directly modifying phonationtime. Investigations of this type help isolate specific param-eters of phonation or related variables that might functionallycontrol stuttering (Ingham, 1990). The sole published inves-tigation of this type was conducted by Ingham, Montgomery,and Ulliana (1983). They assessed the effect of directlyaltering the frequency of specified PIs during the spontane-ous speech of 2 men who stuttered. An accelerometer wasattached to the thyroid prominence for recording PIs, and abiofeedback procedure signalled PIs that were either shorteror longer than specified durations. The selected durationswere functionally identified as the shortest that the subjectcould modify. The results showed that when 1 subjectdecreased (by at least 50%) Ps that were less than 100msec, his stuttering was essentially eliminated. Conversely,when he increased these PIs, his stuttering increased abovebase-rate levels. Similar effects occurred with the othersubject, but with PIs less than 150 msec. The effects of thisprocedure were not associated with changes in speech rate,although they did produce unpredictable changes in speechquality: 1 subject's speech was rated as normal sounding,but the other's was relatively nonnormal sounding.
The Ingham et al. (1983) results suggested that there maybe a functional relationship between certain PI frequenciesduring spontaneous speech and stuttering events. They alsoimplied that one variable that might control stuttering duringsome fluency-inducing conditions is the frequency of rela-tively short, rather than long, PIs. However, the methodologyin this study was rather limited: It was not possible to identifyvariations in PI durations outside of the target range, orwhether changes in other duration ranges might also modify
21t is noteworthy that these findings relied on a relatively crude measure ofphonation time
stuttering frequency. At least two developments now make itpossible to make more extensive analyses of the effects ofmodifying the PI frequency on stuttering. The first s acoupling of electroglottographic (EGG) measures of phona-tion (Childers, Hicks, Moore, Eskenazi, & Lalwan, 1990;Fourcin, 1974) with a computer-based measurement andfeedback system; the second is the use of repeated speechnaturalness ratings (Ingham, Gow, & Costello, 1985; Martin,Haroldson, & Triden, 1984; Onslow & Ingham, 1987) to tracevariations in speech quality during experimental conditions.
The general purpose of the experiments reported belowwas to conduct a systematic replication of the Ingham et al.(1983) study to evaluate the effect of modifying the frequencyof EGG-measured PIs on stuttering and speech naturalness.This study was also influenced by Ingham and Devan's(1987) positive findings during a preliminary application ofthis technology. The present study was designed to identifythe PI durations that showed maximum covariation duringexperimental conditions and to assess the effect of instruct-ing subjects to control the frequency of these covarying Plsduring spontaneous speech.
Method....... .__
SubjectsTwo males who stutter volunteered to be subjects. Subject
T.B. (34 years old) and Subject J.P. (17 years old) wereassessed independently by two experienced speech-lan-guage pathologists who reported that the subjects' speechcontained many of the kernel characteristics described inWingate's (1964) definition of stuttering. Both subjects statedthat their stuttering problem had begun in early childhood.Neither subject had received any formal stuttering treatment,nor training in any procedure that required the use of aspecific speech pattern. Base-rate measures of each sub-ject's stuttering frequency, speech rate, and speech natural-ness were obtained as part of the experimental procedureand are described in the Results.
Apparatus
Throughout the experiment, each subject sat alone In anexperimental sound-treated booth. The subject sat before atable and wore an EGG electrode neckband connected to anEGG (Synchrovoice) unit, plus a headset acoustic micro-phone (Toa HY-1). The microphone signal was routed to atwo-channel reel-to-reel recorder (Revox PR99). The EGGsignal was fed to a high-pass filter (Krohn Hite 3323) and acustom-built signal-shaping unit (J-FET Input OperationalAmplifier). The EGG signal output, therefore, was amplified,high-pass filtered (60 Hz), and then rectified to a positive-going pulse so that it was suitable for the computer system'sA/D conversion system. On the table facing the subject wasa video display terminal (DEC VR241-A), a deck of cardscontaining speech topic headings, a light and tone generatorthat was used to emit a 750-Hz tone and illuminate a 10-mmred light, and a two-way intercom unit.
35 495-511 Jllne 1992
-""-
Downloaded From: http://jslhr.pubs.asha.org/ by University of California, Santa Barbara, Roger Ingham on 04/16/2014

Gow & Ingham: Modifying Intervals of Phonation m Stuttenng 497
The subject was audio recorded and monitored by theexperimenters (Judges 1 and 2) via headphones from anadjacent control room. Judge 1 sat before a VDT to operatethe computer facility that measured, recorded, and stored allthe data from this; experiment. During speaking trials (seebelow) Judge 1 operated an electronic dual button-presscounter. For each syllable spoken by the subject, Judge 1pressed one of the buttons according to whether it wasjudged as stuttered or nonstuttered (see Costello & Ingham,1984). Judge 2 operated a digital rating unit to make speechnaturalness ratings on a 9-point scale (Martin, Haroldson, &Triden, 1984) at 30-sec intervals. When signalled, Judge 2moved the switch on the rating unit to the appropriate number(1-9) according to how natural the subject's speechsounded. Neither judge had access to the other judge'sscores during the course of the experiment. Audio recordingsof the subject's speech were made using the two-channelreel-to-reel recorder that received the microphone signalfrom the booth and simultaneously routed the signal to thejudges' headphones. A tone generator produced a low-frequency audible tone that was routed to Judge 2's head-phones for 5 sec at 30-sec intervals during all 5-min speakingtrials. This tone was a prompt for Judge 2 to assign a speechnaturalness rating based on the preceding 30-sec interval ofspeech.
Data recording and feedback system. The computerfacility was operated with custom-built software that per-formed a variety of functions during and after the experiment.During the experiment, the data recording and feedback wasmanaged by the Real-Time Operation Program (RTOP).After the experiment, data analyses were available from thePost-Experiment Analysis Program (PEAP). The functions ofeach program are as follows:
Real-Time Operation Program (RTOP): This program col-lected the analog signals from the EGG, the subject's head-set microphone, plus the judges' button-press counter andspeech naturalness rating unit. For the purposes of theseexperiments, the EGG signal was digitized at 100 Hz. Whenthe EGG signal was above a noise level criterion (describedbelow), it was recorded as a PI. All PIs and NPIs (nonpho-nated intervals) that were less than 10 msec were ignored.Hence, a period of phonation that was interrupted by anonphonation period of less than 10 msec would be treatedas a continuous phonated interval. Thus, the program mea-sured, in real time, the durations of PIs and NPIs from theEGG signal, syllable counts, and the speech naturalnessratings. These data were recorded, displayed when neces-sary, and archived to magnetic tape at the end of eachrecording session.
The RTOP provided a display of performance informationfor the subjects. Most importantly, it provided rapid (<20msec) visual and audio feedback to the subject of each PIoccurrence via the subject's VDT. Each PI occurrence wasgraphically displayed in real time on the VDT as a small redsquare in one of three display panels according to whether itsduration was within the experimenter-selected target range,
3A complete description of this software and its functions, redeveloped for aPC-based system, is available from the authors
or above or below that range. The Ps were displayedcumulatively in relevant panels while the subject was speak-ing. Light and tone signals were prescribed to accompany theoccurrence of PIs within one of the three panels. Counts ofsyllables stuttered and nonstuttered were also displayed onthe VDT as short cumulative red marks along a continuousgreen line. Speech naturalness ratings (1-9) were shownnumerically at the base of the screen and could be changedby Judge 2 at 30-sec intervals. Elapsed speaking time wasdisplayed graphically at the base of the VDT screen. Thenumber of Ps, syllables stuttered, and syllables spokenduring each 30-sec interval were tallied and displayed for aperiod of 5 sec. The cumulative PI data plus the means forpercent syllables stuttered, syllables per minute, and speechnaturalness ratings during the 5-min speaking trial weredisplayed at the end of the trial.
Post-Experimental Analysis Program (PEAP): This pro-gram was used to analyze the distribution of PIs obtainedfrom each subject to identify the phonation duration (msec)ranges for experimental manipulation and to assess theeffects of those manipulations. This procedure differed fromthat of Ingham et al. (1983), in which PI duration ranges wereprescribed 50-msec intervals. In such intervals, the subject'sbase-rate PI frequencies in similar size duration ranges (e.g.,0-50 msec, 50-100 msec, etc.) differ substantially. Conse-quently, the frequency of PIs that the subject would receiveas feedback with each experimental shift in the durationrange would vary quite dramatically within and across sub-jects. The solution introduced in the present study was toproduce individualized and equivalent PI frequency durationranges from the subject's PI frequency/duration pattern dur-ing base-rate. The advantage of this method is that thesubject's PI frequency distribution then determines the sizeof each duration range. Hence, each subject's PI distributionwas divided into decile ranges. This method identified dura-tion ranges that contained almost equivalent frequencies ofPls for experimental manipulation and analysis for eachsubject's experiment. For example, in the present study,subject T.B. produced PIs that ranged from 30 to 3200 msecduring the base-rate speaking trials. The PEAP determinedthat the decile ranges for his Ps were as follows: 30-100,100-140, 140-200, 200-260, 260-320, 320-400, 400-490,490-640, 640-920, 920-3200 msec. Each of these 10ranges included approximately the same number of Plsduring base-rate. In a 5-min trial, T.B. produced approxi-mately 58 PIs in each decile range. 4
The PEAP was also used to conduct a Monte Carlosampling analysis (Rubinstein, 1981) of the distribution of Plsin different experimental phases. The purpose of this analysissystem within PEAP was to identify PI ranges in which thesubject's PI frequencies showed maximum differences be-tween different experimental phases within Stage II of theexperiment (see Results). The analysis system randomlysampled 200-2,000 Ps from the PI distributions in eachphase and then determined the duration range where the two
4One artifact of our system is that the program may assign an unequal numberof Ps to a particular range This is a function of the sampling rate and thedecision algorithm.
Downloaded From: http://jslhr.pubs.asha.org/ by University of California, Santa Barbara, Roger Ingham on 04/16/2014

498 Journal of Speech and Hearinng Research
distributions showed maximum and significant differences.The particular duration range that showed maximum differ-ence is referred to hereafter as the Monte Carlo Range. Theapplication of this system to identify the Monte Carlo Rangeis described in the Results section for each subject's exper-iment.
Procedure
Each subject's experiment was conducted over a numberof twice weekly 2-hour sessions with from 5-14 five-minutespeaking trials per session. For each 5-min speaking trial, thesubject was instructed to speak spontaneously on topics thatwere self-generated or suggested by topic cards. Each trialwas separated from the next by a 3-min rest period.
At the beginning of each session, a routine procedure wasused to fit the subject with the microphone and EGG appa-ratus. The headset was positioned so that the microphonewas 3 in. in front of the subject's chin. The microphone signallevel was set to peak at 0 on the audiorecorder's VU meter.The EGG neckband (a 2-in. collar that incorporated theactive and grounding surface electrodes) was positionedcomfortably on the subject's neck so that the active elec-trodes surrounded the thyroid prominence and the resultingsignal was most clearly related to voicing. Neither subjectreported that the neckband caused discomfort despite beingworn for as long as 2 hr.
Immediately before each 5-min speaking trial, the EGGsignal was tested by two methods to identify and removeartifactual signals. First, if the signal level exceeded a pre-scribed resting voltage level while the subject sat quietly, theneckband was refitted or a wrist strap was attached as agrounding device. Second, the RTOP conducted a 5-secnoise level test on each data-gathering channel to establishan operating signal-to-noise-level ratio for each trial. Duringthe 5-sec noise-level test, the subject sat quietly and avoidedexcessive laryngeal movements (e.g., coughing, swallow-ing). The noise-level criterion was established by recordingthe EGG signal level and then adding a 25% margin to thatlevel. Any EGG signal above this noise-level criterion duringa trial was recorded as a PI.
Immediately after the noise-level test was set for theRTOP, Judge 2 activated the tape recorder, announced thetrial number over the intercom, and pressed the tone switchto signal the subject to commence speaking. The RTOP wassimultaneously activated and continued for 5 min, whenanother tone signalled the subject to cease speaking. Thesubject could also monitor the trial time from the VDT.
Each subject's experiment was composed of base-rateand experimental phases (see below). During all 5-minspeaking trials in these phases, the subject was instructed tospeak spontaneously. During base-rate phases, the subject'sVDT displayed only the elapsed time for the trial. During theexperimental phases, the subject was provided with relevantPI feedback on the VDT plus audio tones for specified Ps. Inthese phases, the subject was instructed to control thefrequency of Ps within a prescribed decile range (targetrange). Prior to each experimental phase the subject wasalso given 1-min practice trials designed to familiarize him
with the PI feedback display. The subject was told that eachPI was computer-recorded and immediately displayed as asmall square in one of the three panels according to itsduration. He was instructed to focus on the PIs that occurredin a specific panel because they represented Ps within atarget range that he was expected to control. He was alsotold the minimum and maximum msec durations for thisrange.
Prior to all experimental phases (except those in Stage III,described below), the subject was told the mean number oftarget range PIs that were produced during base-rate trials.He was then told that in the following trials he should try toeither decrease or increase by 50% his mean base-ratefrequency of PIs in the target range. The within-trial criterionfor each 30-sec speaking interval, therefore, was either 50%of the mean base-rate (divided by 10), or 150% of the meanbase-rate (divided by 10). This number was displayed inwriting above the subject's VDT. A brief practice trial wasthen conducted. Typically, the subject's practice trial wascomposed of short utterances such as counting, sustainingvowels, and reciting short sentences or familiar phrases. Thesubject was never instructed to adopt a particular manner ofspeech to reduce his target range PI counts.
Dependent variables. Four speech performance mea-sures collected during each speaking trial were converted tothe dependent variables for each subject's experiment. Per-cent syllables stuttered (%SS) and syllables spoken perminute (SPM) scores were derived from Judge 1's scores inaccordance with the procedure described by Ingham et al.(1983). The speech naturalness ratings were made by Judge2 and followed the procedure described by Ingham, Martin,Haroldson, Onslow, and Leney (1985). On this rating scale, 1equals highly natural-sounding speech and 9 equals highlyunnatural-sounding speech. Mean speech naturalness rat-ings were derived from the ten 30-sec ratings per trial. Thefourth measure was frequency of Ps produced within thedecile ranges derived from the subject's base-rate phase orPls from ranges derived via the Monte Carlo analysis (seebelow).
Experimental Design
The two single-subject experiments employed unfoldingtime-series designs (Barlow & Hersen, 1984), with fourstages in each experiment. Each stage incorporated a seriesof withdrawal and reversal phase-change designs (Barlow &Hersen, 1984). Experimental phase changes within eachstage were based on data trends that were used to determinewhether the subject could manipulate the specified speechperformance measures. Trials were continued in each phaseuntil either (a) the subject's speech performance was withinthe predetermined criterion for three consecutive trials, or (b)the subject was unable to complete three consecutive trialsto criterion within a maximum of nine trials per phase. Allphase changes occurred during a 2-hr session so as to avoidthe confound of between-session effects. Hence, the first twostages in this experiment essentially replicated the Ingham etal. (1983) experimental design, whereas the last two stageswere designed to test whether obtained experimental effects
3.5 495SS51 une 1992
Downloaded From: http://jslhr.pubs.asha.org/ by University of California, Santa Barbara, Roger Ingham on 04/16/2014

Gow & Ingham: Modifymg Intervals of Phonation in Stuttenng 499
were associated with changes in other speech performancemeasures.
Stage I. The purpose of this stage was to establishbase-rate (A phase) data trends and identify the smallestcombination of decile ranges in which the subject could bothreduce (by 50%) his mean base-rate PI frequency and hisfrequency of stuttering. As in Ingham et al. (1983), a series ofA/B-/A experimental phases5 was used to identify the short-est decile range in the B- phase that the subject couldmodify and produce associated effects on his stutteringfrequency. When it was established that this correlated effectoccurred, then that particular decile range(s) became thetarget range for Stage II.
Stage II. This stage was designed to assess the effect onstuttering frequency when a subject systematically increased(by 50%) and then decreased (by 50%) the frequency of PIcounts in the target duration range identified in Stage I. Thisstage incorporated a B-/B+/B-/B+ experimental design.During B- conditions, the subject was instructed to reducePI counts in the target range to the level established in StageI for B- conditions. In the B+ phase the subject wasinstructed to increase his PI counts to 50% above thefrequency recorded in the target range during the A phase.
An additional aim in Stage II was to identify the PI rangethat showed maximum changes in PI counts (the MonteCarlo Range) across the B- and B+ phases (i.e., where thesubject's target range PI counts were maximally increased ordecreased). The Monte Carlo sampling analysis was per-formed by the PEAP (see above) to locate the PI range thatthe subject might have actually manipulated in order tocontrol PI frequencies in his target range.
Stage 111. This stage was designed to determine whetherthe subject could control and then perhaps decrease Plswithin the Monte Carlo Range identified during Stage II. Theinitial part of this stage involved a B-/C/B- experimentaldesign. The B- phase replicated the conditions that appliedin previous B- phases and served to establish the frequencyof Pis that occurred in the Monte Carlo Range.
The C phase was introduced with a practice trial in whichthe subject was told that during this phase he would receivePI counts for a range that he had "appeared to controlwithout feedback," during the previous sessions. The targetPI count during the C phase was identical to the mean PIcount that the subject had achieved in the Monte CarloRange during the Stage II B- conditions. In order to deter-mine that the subject was able to control his PI counts it wasfirst necessary to demonstrate that he could continue toproduce similar frequency counts of Monte Carlo Range Pls(with the assistance of feedback), and that this frequencywould continue to control his stuttering frequency counts. If Ccondition control was established, it was planned to introducea C- phase.
Stage IV. This stage was planned to evaluate the effect ofcontrolling variables that might have confounded changes inthe relationship between the independent (PI frequency) and
5The "-" or "+" notation is attached to phase labels throughout this paper toindicate that the subject was required to decrease PI counts (e.g., B-) or toincrease PI counts (e.g, B+).
dependent (stuttering frequency) variables. For instance, itwas anticipated that subjects might slow their speech rate ordecrease speech naturalness in order to control PI counts. Ifthere was evidence that such variables might have con-founded treatment effects produced by the target variables,then it was planned to replicate the Stage II experimentalprocedure using appropriate controls.
Reliability
The reliability of the speech performance measures ob-tained throughout these experiments involved an indepen-dent verification of the duration of PIs as measured by theRTOP and the assessment of the reliability of the judges'%SS, SPM, and mean speech naturalness ratings.
The accuracy with which the RTOP measured the durationof Ps was estimated by comparing a series of RTOP-measured Ps with measures obtained by an independentacoustic analysis. The Interactive Laboratory System (ILS)software package (V 6.0, Signal Technology Inc., 1986) wasused for this purpose. The data for this comparison werederived from a nonexperimental speaking session with onesubject (T.B.), with the RTOP's operation dentical to thatused during the experiments. Subject T.B. orally read arandomly ordered list of 30 single-syllable words, one wordper 15-sec interval. This method was chosen so that eachword could be unambiguously isolated and then its PI deter-mined via the PEAP. Because the sampling rate of the RTOPis 100 Hz, errors of plus or minus 10 msec are to beexpected. Voiced segments (PIs) in the acoustic waveformwere then identified with the ILS program using a samplingrate of 20 kHz and the following operational definition: Thevoice onset was the point at which the first period's positive-going peak crossed the zero amplitude line; the offset wasthe point at which the last positive-going peak of the lastperiod crossed the zero line (the duration was then automat-ically calculated).
The results of this comparison showed that 24 of the 30(80%) intervals measured by both systems differed by 10msec or less. The remaining 6 PIs differed by 19-27 msec.Hence, it was concluded that the RTOP measured theduration of PIs with satisfactory accuracy for the purposes ofthis study.
The reliability of each judge's scores was assessed byarranging for two independent judges (who were also unfa-miliar with the experiment) to perform the same measure-ment tasks on randomly selected trial recordings. At least two5-min speaking trial recordings were selected from withinrelevant phases of each subject's experiment. The indepen-dent judges were enrolled graduate students who had com-pleted theory and practicum courses in stuttering. The se-lected trials were dubbed in random order onto a master tapeand introduced by a sample number. Each judge thenlistened to the master tape via headphones and used thesame procedures as the original judges to record data. Oneindependent judge's measures were used to calculate %SSand SPM scores, and the other judge provided mean speechnaturalness ratings for the selected trial. The extent to whichthe original and independent judges' measures agree can be
Downloaded From: http://jslhr.pubs.asha.org/ by University of California, Santa Barbara, Roger Ingham on 04/16/2014

500 Journal of Speech and Heanng Research
assessed by inspecting the data trends in the Results sec-tion. The data trends were considered to be reliable if theindependent judges' data trends were consistent with theoriginal trends (Hawkins & Dotson, 1975).
Results
The results of the two single-subject experiments arepresented in Figures 1, 2, 4, and 5. These figures show theexperimental phases in each subject's experiment and theeffect of those changes on four dependent variables: percentsyllables stuttered, syllables per minute, mean speech natu-ralness ratings, and the frequency of Pls within specifiedduration ranges. The reliability data for each subject's exper-iment are displayed in Figures 3 and 6 and are describedfollowing the results for each subject's experiment.
I
Subject T.B.
The data for T.B.'s experiment are presented in Figures 1and 2. The four stages of T.B.'s experiment were completedin 11 sessions and involved a total of 92 five-minute trialswith a variable number of trials per session. The results foreach of the four stages of T.B.'s experiment are summarizedbelow.
Stage I. The first phase (A) in Figure 1 shows T.B.'sbase-rate data. During this phase, T.B. completed nine trialsbefore a relatively nonsystematic data trend was observedacross all speech performance measures. The data acrossthese trials show that T.B.'s speech naturalness ranged from3.0 to 4.0 and his speech rate from 151.6 SPM to 175.4 SPM;his stuttering frequency stabilized around 3 0 %SS (therange was 0.7-3.5 %SS).
After the A phase, the PEAP divided T.B.'s entire base-rate
SUBJECT T. B.I
A B- B* B- B B- C B-· ·0 · · · ·
B- RC RC*
I
i~~ ~~~~~~~~~~~~ i
20
4
30 40 60 70 80
8 9 10
90
II
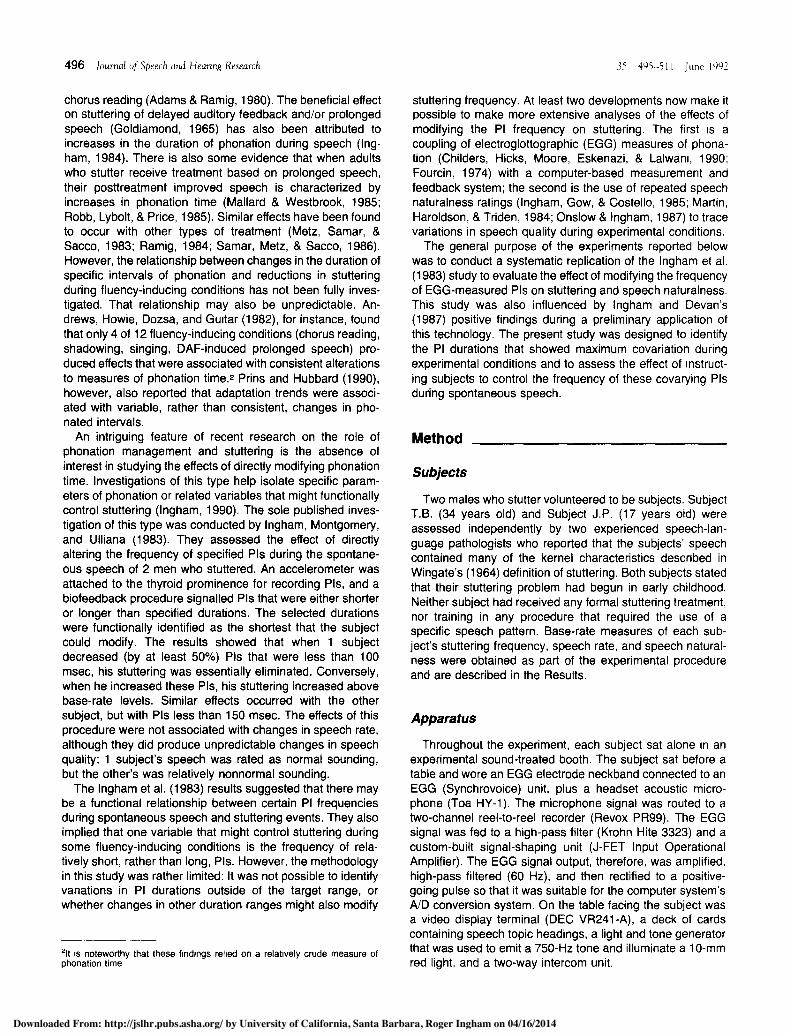
FIGURE 1. Speech performance measures for each 5-min speaking trial for the four stages (I-IV) of T.B.'sexperiment. The top row shows mean speech naturalness ratings (1 = highly natural- and 9 = highlyunnatural-sounding speech). The second row shows the mean number of syllables spoken per minute. The thirdrow shows percent syllables stuttered. The lowest row shows the number of phonation intervals (PIs) that werewithin the target decile ranges: 30-100 msec (A), 30-140 msec (), and 30-210 msec (). The phases arelabelled with symbols to identify the target P range. Note that all phase changes occurred within, rather thanbetween, the 11 speaking sessions.
A B- B-A 0
2
wcrWCuXW
W
-Jm-J-J
u,-J
-J(A'
Ui.0
CaUI
z
C 8u 7z 6
44'.~ 4
2
200-- 150
Wi 1005 50
O.
8-7
O 6
43
0' 2
0-200-1801601z 40
o 120I.->_< 100
0- 604020
0-5-MIN
TRIALS
SPEAKINGSESSION
'5 45 51 i IL t V 1'9'
Downloaded From: http://jslhr.pubs.asha.org/ by University of California, Santa Barbara, Roger Ingham on 04/16/2014

Gow & Ingham: Modfyng Intervals of Phonaton mn Stuttenng 501
PI frequency distribution into decile ranges. That is, all Plsproduced during the nine trials were divided so that each of10 ranges contained approximately the same number of Pis.The lowest of these ranges (the lowest 10% of T.B.'sbase-rate decile distribution) was 30-100 msec, and thesecond lowest decide range was 100-140 msec. Hence, thecombination of these two decile ranges formed the lowest20% of the base-rate distribution. The PI distributions foreach trial were then reconfigured to show the PI frequencieswithin each of the ranges identified by the decile configura-tion. The frequencies of Ps in the lowest decile rangesthroughout the A phase trials are shown in Figure 1. Thesedata trends were considered sufficiently stable not to con-found signs of treatment effects in subsequent experimentalconditions. The mean number of A phase Pis in the 30-100-msec decile range was 57.7; in the 30-140-msec range itwas 104.3.
In the subsequent B-(30-100) phase, T.B. was instructedto try to reduce the frequency of 30-100 msec PIs (the decilerange with the shortest PI durations) by 50% of the meanbase-rate frequency. The criterion for a 50% reduction of PIcounts in the 30--100-msec range was 29 per trial. Hence,T.B. was instructed to try to produce no more than two30-100-msec Pis per 30-sec interval during each B-(30-100) phase trial. In Figure 1, the data trend in the B-(30-100) phase shows that T.B. reduced his 30-100-msec PIcounts, but the reduction failed to reach criterion level and hisstuttering frequency was essentially unaffected.
In the next phase, B-(30-140), T.B. was instructed toreduce the frequency of Pis in the lowest 20% of base-ratedecile distribution (that is, 30-140-msec decile range). In thefirst two phases, the PI data for the 30-100- and 30-140-msec ranges show a generally stable trend. The criterionlevel for a 50% reduction in the 30-140-msec range wascalculated from the A and B-(30-100) phase data andaveraged 52 PI counts per trial. Hence, T.B. was instructed tospeak with no more than five PI counts in this range per30-sec interval. Tlhe B-(30-140) phase data show that T.B.slightly reduced his PI counts in this range and achieved thecriterion level for three consecutive trials by the sixth trial.Figure 1 shows that the reduction in his 30-140-msec Plsduring the B-(3D-140) phase was accompanied by animmediate and marked reduction in stuttering frequency.
At the end of Stage I, it was concluded that T.B. couldcontrol his 30-140-msec range PI counts and that variationsin these counts might serve to control his stuttering fre-quency. Hence, this range became the target range for StageII. Variations in T.B.'s stuttering frequency during Stage Iwere unrelated to any obvious changes in his speech natu-ralness ratings. However, it can be seen in the SPM data forthis stage (Figure 1) that T.B.'s speech rate tended to declinewhenever his PI counts in either the 30-100- or 30-140-msec range were reduced. In other words, T.B.'s speech ratemay have been responsible for PI count reductions duringthese phases and, by implication, associated reductions instuttering frequency.
The frequencies of Pis within the eight other decile ranges(140-200 msec, 200-260 msec, etc.) identified from theentire base-rate distribution are shown for each trial of StageI on the ordinate of Figure 2 above the "5-minute trials" line.
(The PI counts in the duration ranges that appear below thisline were derived by the Monte Carlo analysis and arediscussed later). There were no obvious trends in most decileranges during the A, B-(30-100) or B-(30-140) phases.However, the 30-100- and 100-140-msec PIs were reducedin the Stage I phases (see Figures 1 and 2). Thus T.B.evidenced some control over the frequency of PI countswithin a discrete duration range (30-140 msec) and withoutchanging his PI counts in other decile ranges.
Stage II. Initially, base-rate or A conditions were reintro-duced in order to test for the effect of removing the precedingB-(30-140) phase conditions. Figure 1 shows that T.B.'s30-140-msec PIs immediately returned to Stage I A phaselevels, accompanied by increases in stuttering frequency,speech rate, and speech naturalness ratings (i.e., towardsmore unnatural-sounding speech).
The next four phases of Stage II assessed the effect ofinstructing T.B. to decrease (B- phases) and then increase(B+ phases) 30-140-msec PI counts. In the B- phases, thecriterion was the same as in the Stage I B-(30-140) phase:T.B. was instructed to speak with no more than five 30-140-msec PI counts per 30-sec interval for the three consecutivetrials. Figure 1 shows that in the first B- phase of Stage II,T.B. immediately reduced his target range PI counts (reach-ing criterion performance by the eighth trial), and his stutter-ing frequency was concomitantly reduced. There was also adecrease in speech rate, but no alteration in speech natural-ness ratings.
In the subsequent B+(30-140) phase, T.B. was instructedto increase his target range PI counts by 50% above theirbase-rate frequency. This meant that T.B. was to produce aminimum of 160 target range PI counts per trial, i.e., 16 per30-sec interval. Figure 1 shows that T.B. could not achievethis goal; he only managed to increase his target range PIcounts to base-rate frequency levels. His stuttering fre-quency did increase during this phase, but only to base-ratelevels, which was also true for his speech rate. There was aslight increase in his mean speech naturalness ratings (to-wards more unnatural-sounding speech) across this phase,but this increase was not distinguishable from the precedingB- phase data trend.
In the final B- and B+ phases of Stage II, T.B. producedalmost identical data trends to those in the first B- and B+phases. This trend replication also occurred in T.B.'s stutter-ing frequency and speech rate data. In these last two phases,however, T.B.'s speech naturalness appeared to improveduring B- and then worsen during B+.
The results of Stage II of T.B.'s experiment are relativelystraightforward. They show that T.B. could reduce the fre-quency of his target range PI counts, but not increase themabove base-rate levels. They also show that decreases inthese PI counts were consistently associated with reductionsin stuttering frequency and decreases in speech rate. Hence,any reductions in T.B.'s stuttering frequency during Stage IIcould be due to either reductions in his speech rate orreductions in his 30-140-msec PI counts.
In an attempt to resolve the apparent confound betweenchanges in PI frequencies and speech rate, a modifiedreplication of the Stage II experimental procedure wasplanned for Stage IV. However, it may also have been the
Downloaded From: http://jslhr.pubs.asha.org/ by University of California, Santa Barbara, Roger Ingham on 04/16/2014
502 Journal of Speech and Heanng Research
SUBJECT T. B.
A B- B+
0 0B- B'0 *
·low.o%0o 0 0 %O 00 %
00~o I·~00·0~4P~O(OD( ~%0
. 1 1
to
B- C 8-a* 0
00000
0000
%000Acp
00%
30-100N-MINUTE TRIALS
20io 30 40 50 60
B- RC B- RC0
TREATMENT TARGETSA 30 - 100* 30 - 140* 30-210
70 s0 90MONTE CARLO
RANGE (mOec)
210-260
30 - 2 10
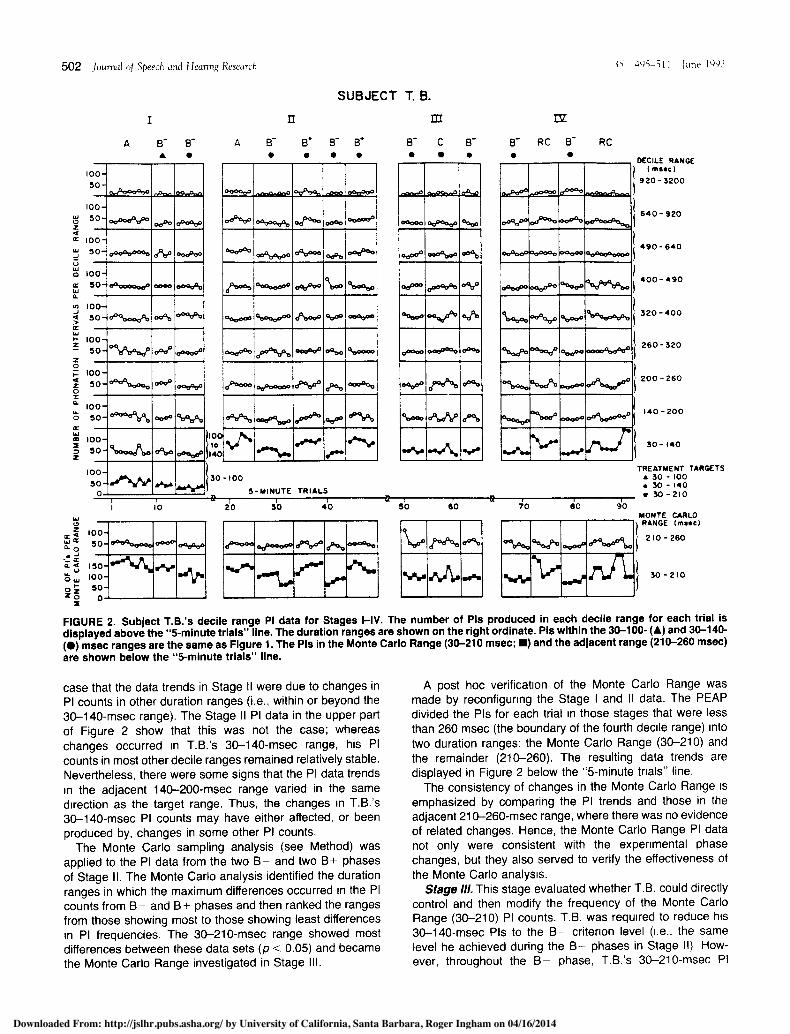
FIGURE 2. Subject T.B.'s decile range PI data for Stages I-IV. The number of Pls produced in each decile range for each trial isdisplayed above the "5-minute trials" line. The duration ranges are shown on the right ordinate. Pls within the 30-100- (A) and 30-140-(S) msec ranges are the same as Figure 1. The Pis in the Monte Carlo Range (30-210 msec; *) and the adjacent range (210-260 msec)are shown below the "5-minute trials" line.
case that the data trends in Stage II were due to changes inPI counts in other duration ranges (i.e., within or beyond the30-140-msec range). The Stage II PI data in the upper partof Figure 2 show that this was not the case; whereaschanges occurred In T.B.'s 30-140-msec range, his Picounts in most other decile ranges remained relatively stable.Nevertheless, there were some signs that the PI data trendsIn the adjacent 140-200-msec range varied in the samedirection as the target range. Thus, the changes In T.B.'s30-140-msec PI counts may have either affected, or beenproduced by, changes in some other PI counts.
The Monte Carlo sampling analysis (see Method) wasapplied to the PI data from the two B- and two B+ phasesof Stage II. The Monte Carlo analysis identified the durationranges in which the maximum differences occurred In the PIcounts from B-- and B+ phases and then ranked the rangesfrom those showing most to those showing least differencesIn PI frequencies. The 30-210-msec range showed mostdifferences between these data sets (p < 0.05) and becamethe Monte Carlo Range investigated in Stage III.
A post hoc verification of the Monte Carlo Range wasmade by reconfigurinng the Stage I and II data. The PEAPdivided the Pis for each trial In those stages that were lessthan 260 msec (the boundary of the fourth decile range) intotwo duration ranges: the Monte Carlo Range (30-210) andthe remainder (210-260). The resulting data trends aredisplayed in Figure 2 below the "5-minute trals" line.
The consistency of changes in the Monte Carlo Range isemphasized by comparing the PI trends and those in theadjacent 210-260-msec range, where there was no evidenceof related changes. Hence, the Monte Carlo Range PI datanot only were consistent with the experimental phasechanges, but they also served to verify the effectiveness ofthe Monte Carlo analysis.
Stage 111. This stage evaluated whether T.B. could directlycontrol and then modify the frequency of the Monte CarloRange (30-210) PI counts. T.B. was required to reduce his30-140-msec Pis to the B- criterion level (i.e., the samelevel he achieved during the B- phases in Stage II) How-ever, throughout the B- phase, T.B.'s 30-210-msec PI
I
A B- 8-A 0
100-50-
02
J-JWW
JU
W
!M
W
0.
0
4
20
IZ0
20T
00o-o0-
oo-50-
00-50-
00-so-
00-s0-
00-50-
00-50-
00-50-
ooooa%00
*0000 000 .9
0%0000~b000
Ro
. oi~
000000
ooda.o
0000O%
o0act
000O
o%4%%Q%
00%d
o_%
.00
.oop
i 10
_ _ _eo%
II -do 0 % ooooo
%~~0o %_ -I
k0 4 00 _oe
0°°°.d°
DECILE RANGE(miec }
920-3200
640- 920
490-640
400-490
320-400
260 - 320
200 - 260
140-200
30- 140
100-50-
0 0l 00
-%N~
I
OU o0 4 IC
0I
1O-10-
50-0-
o0-0-
- - -
[J uli 0 I I
..
l l
i 4" i 1 ltt e 1092
f
II
D00600 000
10%00
dp%
I
000%OOQC -0
WA
Downloaded From: http://jslhr.pubs.asha.org/ by University of California, Santa Barbara, Roger Ingham on 04/16/2014
Gow & Ingham: Modifying Intervals of Phonation in Stuttenng 503
counts were monitored to identify his mean 30-210-msec Plsin that phase. In the immediately following C(30-210) phase,therefore, T.B. was merely required to sustain the frequencyof 30-210-msec PI counts at the same level as occurredduring the preceding phase. The difference between thesetwo phases, therefore, was the PI range on which feedbackwas made contingent. That is, in the B-(30-140) phase,feedback was provided for PIs in the 30-140-msec range. Inthe subsequent phase, C(30-210), the feedback was givenfor 30-210-msec Ps, the PI range that appeared to befunctional during the B- conditions. The rationale for thisprocedure was that if T.B. was expected to reduce 30-210-msec Ps (in a subsequent C- phase), then, at the veryleast, he should have been able to maintain the frequency of30-210-msec PIs he produced in the B- phases when givenfeedback for occurrences of these Pis. The mean number of30-210-msec PIs that T.B. produced during the B- phasetrials of Stage II was 83. Hence, T.B. was instructed toensure that his 3-210-msec PIs did not exceed eight per30-sec interval during C(30-210) phase trials.
The results of Stage Ill, as shown in Figure 1, reveal thatT.B. could not consistently maintain the criterion level 30-210-msec PI count in the C phase. However, Figure 1 showsthat T.B.'s 30-140-msec PI counts did remain at the B-(30-140) phase levels during the C phase. It is also apparent thathis stuttering frequency showed increased variability acrossthis phase. In the following B-(30-140) phase, T.B. againdemonstrated that he could achieve criterion level 30-140-msec PI counts (i.e., with feedback for 30-140-msec Plsrather than 30-210-msec PIs), and his stuttering frequencyreturned to the B- levels after the second trial. Hence, T.B.failed to control the frequency of his Monte Carlo Range PIcounts even though their rate of occurrence was controlledwhen he received 30-140-msec PI count feedback.
The data trends across Stage III for the remaining speechperformance measures (Figures 1 and 2) show the following:T.B.'s speech rate remained stable and at levels similar to theB- phases of Stage II; his speech naturalness ratings in theB- phases resembled those produced during the Stage II B-phases, though they did not decrease during the C phase; andhis PI counts in the eight other decile ranges (Figure 2) showedno evidence of change in either trend or level.
In summary, the Stage III findings show that T.B. was notable to control directly the frequency of his Monte CarloRange PIs despite evidence that he could indirectly controlthat range when modifying his 30-140-msec PI counts.
Stage IV. An obvious finding from the first three stages ofT.B.'s experiment was that whenever the target range PIcounts were modified, there were concomitant changes in hisspeech rate. Consequently, the final stage of T.B.'s experi-ment sought to test whether his reduced speech rate duringB- conditions was necessary for him to control his 30-140-msec PI counts and reduce his stuttering frequency. Hence,Stage IV was a rate control (RC) phase change experiment(B-/RC/B-/RC) in which T.B. was required to speak at arate close to the mean SPM rate that he used in the finalB-(30-140) phase of Stage III.
In the initial B- phase of this stage, T.B. was required toreduce his 30-140-msec Ps to the previously establishedcriterion levels for the B-(30-140) phases. However, through-
out this phase, speech rate data were added to T.B.'s VDTdisplay. During the last 5 sec of each 30-sec interval, the RTOPtallied the number of syllables spoken (from Judge 1's button-press counts) during the previous interval and displayed thetotal on the VDT for the next 30 sec. At the end of each 5-mintrial, the total number of syllables spoken was displayed. Noadditional instructions were provided for this phase. T.B. wassimply informed that the numeric display referred to his speechrate while he attempted to reduce his 30-140-msec PIs. Figure1 shows that in the first B-(30-140) condition of Stage IV T.B.reduced his 30-140-msec PI counts, but with virtually nochange to the speech rate he displayed during the Stage III B-phases. His stuttering frequency in this phase also resembledlevels achieved in the previous B- phases. Hence the effect ofadding speech rate information did not appear to influenceT.B.'s speech performance during B- conditions. Conse-quently, the speech rate feedback procedure was identical in allfour phases of Stage IV.
In the following RC phase, the subject's VDT displayed onlythe number of syllables spoken per 30-sec interval and theelapsed trial time. No PI data were displayed nor PI feedbacksignalled. T.B. was told the mean number of syllables that he hadspoken, per 30-sec interval, during B- phase trials. He was theninstructed to maintain this rate by speaking so that the number ofsyllables per 30-sec interval was within plus or minus 5% of themean number. The mean number of syllables and the plus orminus 5% range were clearly displayed in writing above the VDT.It was hypothesized that if T.B.'s speech rate was responsible forcontrolling his 30-140-msec PIs and stuttering frequency dataduring B- phase trials of his experiment, then his 30-140-msecPls and stuttering should remain reduced whenever T.B.'sspeech rate was similar to the rate he used during the B-(30-140) phase levels.
The data for Stage IV in Figure 1 show that T.B. main-tained a relatively constant speaking rate during both RCphases. There were essentially no marked differences be-tween SPM data trends across the B-/RC/B-/RC phases.In the initial RC phase, his SPM data marginally exceededhis previous B- phase level, but in the second RC phase hisSPM data were generally the same as in the two previous B-phases. It was also clear that the data trends for T.B.'s30-140-msec Ps in the RC phases were generally higherthan they were in the B- phases. Similarly, T.B.'s stutteringfrequency increased and became more variable in the RCphases than it was in the B- phases.
In summary, the reduced speech rate that T.B. maintainedin the RC phases was not sufficient to maintain reductions inhis stuttering and target range PI counts. It follows, therefore,that reductions in T.B.'s 30-140-msec PIs in the B- phasesdid not depend on reductions in his speaking rate. Further-more, T.B.'s stuttering frequency during Stage IV once againcovaried with changes in his target range PI counts. It isnoteworthy that T.B.'s 30-140-msec PI counts overlappedthe levels that were observed in the A and B+(30-140)phases of Stage II, but his stuttering frequency in the RCphases did not approach the levels they displayed in thoseStage II phases. This suggests that variations in T.B.'s30-140-msec PI counts were not entirely responsible forvariations in his stuttering frequency.
Downloaded From: http://jslhr.pubs.asha.org/ by University of California, Santa Barbara, Roger Ingham on 04/16/2014

504 Journal of Speech and Heanng Research
A supplementary analysis determined whether T.B. alsocontinued to alter PI counts in the Monte Carlo Range duringStage IV. Thus Figure 2 also shows his 30-210-msec and210-260-msec range data and confirms that whenever T.B.modified his 30-140-msec Pls, similar changes occurred inthe Monte Carlo Range. This result suggests that T.B. couldmodify his 30-140-msec PI frequency only by also changingPI counts beyond that range.
Reliability
Figure 3 shows the reliability data for subject T.B. The figurecompares the original experimental data, using randomly se-lected trials within each phase, with data obtained from the twoindependent judges who scored recordings of those trials. Thedata trends for stuttering frequency and speech rate producedby the independent judge closely follow Judge 1's scores (theoriginal scores). The only evidence of a departure between theoriginal and reliability data for stuttering frequency occurs in theC(30-210) phase. The independent judge appeared to countslightly more stutterings than Judge 1. However, this is notproblematic because critical treatment effects were not ob-served in this phase. In summary, the stuttering frequency and
SUBJECT T.B.UI
winzzo
JZW -i z wI-a
a .4 W .- IrX Z
knw
Vt;
- Z
V)
I
W -A W
-Jw4 w
-U-in-*in
9-8-7-6-5-43-2-I-
200-150 -100 -50 -o-876 5 -43-
05-MIN i
TRIALS
A B- B-* S
K
10
A B- B* B- B** * *
speech rate data trends and levels in T.B.'s experiment appearto be reliable.
The reliability of the original speech naturalness ratingsappears to be less satisfactory. In Stages I and IV, the datatrends appear to be relatively similar. However, in Stages IIand III, there were some discrepancies between Judge 2 andthe second independent judge's ratings. When T.B. alter-nately decreased and increased his PI counts in the targetrange (B-/B+/B-/B+), it appears that Judge 2 and theindependent judge may have based their ratings on differentaspects of speech quality; their data trends moved in oppo-site directions across some trials in the B- and B+ phases.In Stage Ill, the independent judge consistently rated T.B.'sspeech as more unnatural sounding; however, the two setsof data did differ by more than one rating point (Martin,Haroldson, & Triden, 1984).
In general, however, the reliability data for T.B.'s experi-ment show that the original experimental trends were repro-duced by the two independent judges.
Subject J.P.
The data for J.P.'s experiment are presented in Figures 4and 5. The four stages of J.P.'s experiment were completed
m
B- C B- RC B-* * * *
V 415
RC
8A8H1 H FhHe1r
iF,20 30 40
* ORIGINAL SCORESo INDEPENDENT JUDGE'S SCORES
I &50 60
A 30- 100* 30- 210
I · I;I0 1*30-140
FIGURE 3. Subject T.B.'s original and independent judges' data for speech naturalness ratings, syllables per minute, andpercent syllables stuttered. Each of the randomly selected 5-min trials In the four stages (-IV) of the experiment was reratedby the independent judges (0). The original judges' scores are also shown (4).
q-· -----
l r l
35 495-511 June 1992
,1t0--Q-% e
Downloaded From: http://jslhr.pubs.asha.org/ by University of California, Santa Barbara, Roger Ingham on 04/16/2014

Gow & Ingham: Modifying Intervals of Phonation in Stuttering 505
in 13 sessions and included 112 five-minute speaking trialswith a variable number of trials per session. The results ofJ.P.'s experiment were similar to T.B.'s, and are summarizedaccordingly.
Stage I. The first phase (A) in Figure 4 shows J.P.'sbase-rate data. Over the six A phase trials, J.P.'s speechnaturalness ratings consistently increased from 6.0 to 7.9,that is, towards more unnatural-sounding speech. This verylikely occurred because his stuttering frequency graduallyincreased from '18.3 to 29.8 %SS and his speech rategradually increased from 72.2 to 103.8 SPM.
After the sixth base-rate trial, the PEAP divided J.P.'sentire base-rate P'I frequency distribution into decile ranges.The three lowest decile ranges were 15-80, 80-140, and140-200 msec. When combined, the two lowest decileranges formed the lowest 20% of the distribution (15-140msec), and the three lowest decile ranges together formedthe lowest 30% of the distribution (15-200 msec). Thenumber of PI counts produced in the lowest decile and thenext two combinations of decile ranges for each trial areshown in the A phase of Figure 4. The mean number of Pls
across the A phase trials was 39.8 for the 15-80-msec decilerange; 81.5 for the 15-140-msec range; and 122.0 for the15-200-msec range. These ranges and their PI frequencycounts are also displayed in Figure 5 (above the "5-minutetrials" line) along with the remaining eight decile ranges andthe PI counts in those ranges for each trial.
The principal data trends, shown in Figure 4, indicate thatJ.P.'s 15-80-msec PIs were relatively stable throughout theA phase. However, J.P.'s 15-140- and 15-200-msec Plstended to decrease. The A phase of Figure 5 shows that the140-200- and 200-260-msec Ps also decreased and thedata in the 640-960-msec decile range increased. Therewere no systematic data trends in the remaining decileranges.
In the following B-(15-80) phase, J.P. was instructed totry to reduce the frequency of PI counts in the lowest decilerange (15-80 msec) by 50% of the mean base-rate fre-quency. The criterion for a 50% reduction was nineteen15-80-msec Ps per trial (i.e., no more than 2 per 30-secinterval). Figure 4 shows that J.P. was unable to reduce hisPI frequency counts below base-rate levels by the sixth trial.
SUBJECT J.P.I m
A B- B- 8' B- A 1 B- A B B- BA s a U a a a a -* n -
B' RC B-
s- -
7" /lz z 4
.4LU 2 2 -IyL
20 0 -
00
C[W 20
51Z to -J iilol -l4 Y 50
U0-
~25-20
I10
;5tn 5*O- - '
* 15 - 200a 75 -210
I I8 I
15- 200
-so so0o II
FIGURE 4. Speech performance measures for each 5-min speaking trial for the four Stages (-IV) of J.P.'s experiment. The top rowshows mean speech naturalness ratings (1 = highly natural- and 9 = highly unnatural-sounding speech). The second row shows themean number of syllables spoken per minute. The third row shows percent syllables stuttered. The lowest row shows the number ofphonation intervals (Pls) that were within the target decile ranges: 15-80 msec (A), 15-140 msec (), 15-200 msec (0), and 75-210msec (). The phases are labelled with symbols to Identify the target PI range. Note that all phase changes occurred within, rather thanbetween, the 13 speaking sessions.
RC
2C18
-
mwzIoZ, SZ
I1
II
42
5-MI1TRIAL
SPEAKISESSIC
o12 1
I1 ' I$
... r ...
I
11 X Il 1 1· I ·
S£SSIO~
Downloaded From: http://jslhr.pubs.asha.org/ by University of California, Santa Barbara, Roger Ingham on 04/16/2014

506 Journal of Speech and Heanring Research
u-S
.5.
'S.
SUBJECT J.P.
A B` a* K- S
- I-P%- ~~.%. -.%%
40 so50
mr c B-
0 ·
5%.
5%. 5*
%S. - 5 .
55% -
45** . s*
A.
TI
9- RC *BS
-5-
S.-.
5S.
.92
.5-.--
RC
-5-
l-l060 - 5400
H40-g60
470-·40
0 -470
320- ,50
oo- t0o
200- Z0
1 -200
IONTE CLO
210o-500
75-210
FIGURE 5. Subject J.P.'s decile range PI data for Stages -IV. The number of Pls produced in each decile range for each trial isdisplayed above the "5-minute trials" line. Note that the scaling for the number of Pls on the left ordinate changes for the 15-200-msecrange from the second A phase of Stage I. The duration ranges are shown on the right ordinate. Pls within the 15-80-msec (A),15-140-msec (U), and 15-200-msec (A) ranges are the same as Figure 4. The Pls in the Monte Carlo Range (75-210 msec, L) and theadjacent range (210-260 msec) are shown below the "5-minute trials" line.
However, there was a marked reduction in his stutteringfrequency and speech naturalness ratings (towards morenatural-sounding speech), plus a slight increase in speechrate. Figure 5 shows that these changes in stuttering wereunrelated to changes in other PI decile ranges except for anincrease In the 80-140- and 140-200-msec Pls. These datatrends were not in the expected direction.
In the next phase, B-(15-140), J.P. was instructed toreduce 15-140-msec Pls. J.P.'s A and B-(15-80) phase PIdata trends in the 15-140-msec range (see Figure 4) wererelatively unchanged. The criterion for a 50% reduction in hisPls was forty 15-140-msec Pls per trial, that is, no more than4 Pls per 30-sec interval.
The data in the B-(15-140) phase show that J.P. reducedhis 15-140-msec Pls to the criterion level by the fourth trialand that this reduced his stuttering frequency. However,during the fourth trial, it became obvious to the experimenterthat J.P. had adopted a rhythmic speech pattern in order toreach the PI criterion level. The effect of this unnaturalspeech pattern is reflected in J.P.'s stuttering frequency (itreached zero), his speech rate (it dropped to 70 SPM), andhis speech naturalness ratings (they increased sharply). Wechose to prevent the subject from completing the experimentusing this well-known speech pattern: We simply asked himto try to meet the criterion without using rhythmic speech.The data for the remaining B-(15-140) trials show that J.P.slightly reduced his 15-140-msec PI counts, but not tocriterion level; they also show he complied with this request.
For these trials his stuttering frequency and speech rate wererelatively unchanged and his speech naturalness ratingsincreased slightly.
Figure 4 shows that although J.P.'s 15-140-msec Plsfailed to reach the criterion level in the B-(15-140) phase,his stuttering frequency was obviously reduced well belowthe levels observed in the A and B-(15-80) phases. To testwhether some variation in J.P.'s 15-140-msec PI countsmight functionally control his stuttering frequency, a B+(15-140) phase was introduced. In the B+(15-140) phase, J.Pwas instructed to increase 15-140-msec Pls by 50% abovetheir base-rate frequency (i.e., 120 per trial). The data forB+(1 5-140) show that J.P. again failed to reach the critenonlevel by the sixth trial but did increase his PI counts relativeto his B-(15-140) phase levels. At the same time, J.P.'sstuttering frequency increased, whereas his speech natural-ness ratings and speech rate remained essentially un-changed relative to the B-(15-140) phase.
In the subsequent B-(15-140) phase, however, J.P. failedto reduce 15-140-msec Pls to either the criterion level oreven below A and B-(15-80) phase levels. Figure 5 showsdata trends in the remaining eight decile ranges were notdistinctive across these three phases. Therefore, despitesome covariation in stuttering and 15-140-msec Pls, theoverall data trends did not show experimental control.
The next phase of Stage I investigated attempts to reducePI counts in the three lower decile ranges, that is, 15-200msec. An A phase, reintroduced to identify a 15-200-msec PI
A B 8-£ U
*
8* B A -
-J
10050-
100-50-
100-50
100-50-
100-lO0-SQO-I00-50'
100-I0-
100-50-
100
50100 -50-
100'50.Io 00-
o00-
'-5-.
-.
559
I1,40
\°1S -80
40 -zoo
15rnn - 40
50
Nt4"*5 .9- - -
o o 1o0 lo
E~
.9%
|-. ||| |- - -l --
II l- I- - t ! -
,.%. Cm
·INr
*E i· i r' X |l
iP be
_ _·b)· . .
15 ·I i-ili lunt·i !
_ _ _nMeli f
L
3 c
r
tf
'jc
3I
c a. .- - --- l ,%.%.. /.-
W _ %*.**
, i 1LI IV ~1
Downloaded From: http://jslhr.pubs.asha.org/ by University of California, Santa Barbara, Roger Ingham on 04/16/2014

Gow & Ingham: Modifying Intervals of Phonation mn Stuttenng 507
base-rate, showed J.P.'s stuttering frequency, speech rate,and speech naturalness returned to levels found in theB+(15-140) phase. In the following B-(15-200) phase, J.P.was instructed to reduce 15-200-msec Ps by 50% to nomore than 60 Pls per 5-min speaking trial or 6 per 30-secinterval; and met this control criterion by the fourth trial. Hisstuttering frequency was reduced to essentially zero %SS,and his speech naturalness ratings showed a slight de-crease. A slight decrease in speech rate was also observed.(N.B. In Figure .5, the scaling for Ps in the 15-200-msectarget range changes in the last two phases of Stage I and isdifferent from other decile ranges). Hence, the 15-200-msecPls became the target PI range for the next stage of J.P.'sexperiment.
Stage II. The first phase of this stage (A) actually com-pleted an A/B-/A sequence (the last two phases of Stage Iand first in Stage II). The data trends in Figure 4 show thatJ.P.'s 15-200-msec Pis returned to almost the initial A phaselevels of Stage I, with concomitant increases in his stutteringfrequency and speech naturalness ratings. There was someevidence, though, that his speech rate did decrease.
The next four phases of Stage II (B-/B+/B-/B+) as-sessed the effect of instructing J.P. to decrease (B- phases)and then increase (B+ phases) 15-200-msec Pis. As in theprevious B-(15-200) phase of Stage I, J.P.'s PI criterionwas no more than six 15-200-msec Pis per 30-sec intervalfor three consecutive speaking trials. Figure 4 shows thatJ.P. immediately met this criterion. His stuttering frequencywas reduced to near-zero levels, and his speech was ratedas relatively more, natural sounding. However, J.P.'s speechrate continued to decline as it had throughout the precedingA phase.
In the subsequent B+(15-200) phase, J.P. tried to in-crease his 15-200-msec PIs to a minimum of 183 per trial or18 per 30-sec interval. Figure 4 shows that he increased hisPI counts to near base-rate levels, but not to the highercriterion level. There were concomitant increases in hisstuttering frequency and his speech naturalness ratings, butthey overlapped the levels he had achieved in his A phasewhen no feedback was provided. There was, however, aslight but distinguishable increase in his speech rate.
The repeated EB-(15-200) and B+(15-200) phases thatcompleted Stage II virtually replicated the effects that J.P.produced during the initial B- and B+ phases in this stage.In the B-(15-200) phase, J.P.'s PI counts met the criterionby the seventh trial, but in the subsequent B+(15-200)phase he failed to increase his 15-200-msec Ps to thecriterion level, although they exceeded the level produced inthe previous B-(15-200) phase. His stuttering frequencyand speech rate did vary as in the initial B-/B+ phases,while his speech naturalness ratings were unaffected by thephase changes.
The results of Stage II show that J.P. consistently alteredthe frequency of his 15-200-msec Ps and, like T.B.'s, hisstuttering frequency and speech rate covaried with thesechanges. J.P.'s speech naturalness ratings did seem tocovary across the A/B-/A phase change sequence thatoverlapped Stage I and II, but they were virtually unchangedin the rest of Stage II. Hence, as for T.B., variations in J.P.'sspeech rate may have controlled his stuttering frequency and
target PIs, so the resolution to this confound was reserved forStage IV. J.P.'s PI counts in the 15-200-msec and sevenremaining decile ranges for Stage II are shown in the upperpart of Figure 5. It is not immediately obvious from this figurethat the changes observed in his 15-200-msec Ps werereflected in other decile ranges. A Monte Carlo analysisperformed with the PI data from the two B- and two B+phases sought the duration range that reflected the mostsubstantial PI changes across the Stage II experimentalconditions. This analysis showed that the maximum changesin Ps occurred in the 75-210-msec range (p < 0.05).Consequently, the effect of feedback of Ps in this MonteCarlo Range (75-210 msec) was investigated in Stage III.
The PEAP's reconfiguring of the Stage I and II PI datadisplayed in the panels below the "5-minute trials" line ofFigure 5 show the Monte Carlo Range (75-210 msec) andthe 210-260-msec PIs. The Monte Carlo Range PI data inStage I did show some evidence of change in the samedirection as the 15-140-msec Pis, and these changes weremore pronounced in Stage II. By contrast, the adjacentranges (15-75 and 210-260 msec) show relatively stabletrends in PIs across Stages I and II.
Stage III. Using a B-/C/B- phase change experiment,J.P. first reduced his 15-200-msec Ps to the B-(15-200)criterion level (i.e., the same level achieved during B-(15-200) conditions in Stage II). Concurrently, his 75-210-msecPls were monitored to identify their mean frequency. Hence,in the following C(75-210) phase, J.P. was only instructed tocontinue to control the frequency of 75-210-msec PI countsto the same level he achieved during the B-(15-200)phases, but with feedback contingent on the Monte CarloRange.
Figure 4 shows that J.P. could not maintain 75-210-msecPI counts at the criterion level. His 15-200-msec PIs slightlyexceeded the levels that were produced in the previousB-(15-200) phases. When the B-(15-200) phase wasreintroduced, he was still able to reduce his 15-200-msecand Monte Carlo Range PIs despite the absence of feedbackfor Pis in the latter range.
Figure 4 shows that throughout the B-/C/B- phasechanges, J.P.'s stuttering frequency, speech rate, and natu-ralness ratings remained close to the levels he produced inall B-(15-200) conditions. Figure 5 shows that J.P.'s PIcounts in the seven remaining decile ranges were relativelystable throughout Stage III.
In summary, like subject T.B., J.P. failed to control directlythe frequency of Pis in the Monte Carlo Range, but they wereindirectly controlled when he held his 15-200-msec PIs to thecriterion level frequency.
Stage IV. As in T.B.'s experiment, Stage IV sought todetermine whether J.P.'s 15-200 msec PIs covaried with hisspeech rate. The rate control experimental design (B-/RC/B-/RC) was identical to that used with T.B. Figure 4 showsthat J.P. maintained a relatively constant speaking rateacross all Stage IV phases. In the RC phases, when 15-200-msec PI feedback was removed, J.P.'s stuttering frequencywas more variable than in the B-(15-200) phases. Thevariations in J.P.'s stuttering frequency were closely relatedto variations in his 15-200 msec PI counts, and thesechanges were unrelated to variations in his speech rate.
Downloaded From: http://jslhr.pubs.asha.org/ by University of California, Santa Barbara, Roger Ingham on 04/16/2014

508 Journal ot Speech and Heanng Research
The lower panels of Figure 5 show that J.P.'s Monte CarloRange PI counts also vaned with changes in his 15-200-msec Pis. Furthermore, these changes were not reflected inthe adjacent ranges. Hence, the changes in the Monte CarloRange Pis were associated with changes in J.P.'s 15-200-msec Pis and not because of alterations to his speech rate.
Reliability
Figure 6 shows the reliability data for J.P. The data trendsfor stuttering frequency and speech rate show that, in gen-eral, the independent judge's scores closely follow the orig-inal judge's (Judge 1) scores for all phases of J.P.'s experi-ment.
A comparison of the second independent judge's speechnaturalness ratings with those produced by Judge 2 showsthat the trends were similar in most phases of the experi-ment, but they show a less precise relationship in Stages IIIand IV. However, it should be recalled that there was littleevidence of a systematic change n speech naturalnessratings across the entire experiment.
In general, therefore, the original experimental trends werereproduced by the two independent judges (with the excep-tion of Judge 2's Stage III and IV speech naturalnessratings). The other speech performance measures producedduring Stages I, II, and IV gave a reliable account of J.P.'sactual performance The trends observed in J.P.'s speechnaturalness ratings, however, were not quite as conclusive.
I
A B- B B B A B- A* ~ * *
Discussion
The two single-subject experiments demonstrated that anadolescent and an adult who stutter could modify the fre-quency of prescribed Ps during spontaneous speech andthat these modifications influenced their stuttering frequency.The method used to measure the distribution of Ps andfeedback-prescribed target range Ps during these experi-ments revealed that both subjects concomitantly changedthe frequency of PIs outside the target PI range. The PI rangein which these changes were most prominent was identifiedby a Monte Carlo analysis, although it was found that neithersubject could directly control PIs within that range. However,for both subjects, the effect of modifying target range PIs onstuttering frequency was independent of changes in speak-ing rate and did not seriously disrupt speech naturalnessratings. The experiments' data trends for stuttering frequencyand speech rate were essentially reproduced by independentjudges. The independent judge's speech naturalness ratings,however, were not always consistent with those produced bythe original judge.
Generally, the findings are consistent with those reportedby Ingham, Montgomery, and Ulliana (1983) and Ingham andDevan (1987). In these studies, all subjects demonstratedthat, with feedback, they could modify Ps within a 0-200-msec range. It was also demonstrated that when these targetPls were reduced by 50% (or more) during spontaneousspeech, then stuttering, regardless of its frequency, wasreduced to almost zero. Both the Ingham et al. (1983) and the
SUBJECT J.P.
II
* SB- B B Be
0 0
m
.
0
%J
M 1~I
RC B- RC
f- 2 i3025-20-
JO5 -ON :O J J A A 95-UIN ' 'I 2oo
TRIALS* ORIGINAL SCORESo INDEPENDENT JUDGE'S SCORES
H1
40 S0 60 70
A 15-80· 15- 140
,.4jV8o 90 100o lO
* 15- 200o 75- 210
FIGURE 6. Subject J.P.'s original and independent judges' data for speech naturalness ratings, syllables per minute, and percentsyllables stuttered. Each of the randomly selected 5-min trials in the four stages (-IV) of the experiment was rerated by theindependent judges (). The original judges' scores are also shown ().
U)UJA U)0
JØJ1- u10ZZo
wrIJx4I I
-t
W
_i
U)
W<W
- a-
lo cI
I rin
-
..-. t
35 495-ll l June 1992
B C e a
,-- N
-~------ _"
e4 P "4e__*-L
Downloaded From: http://jslhr.pubs.asha.org/ by University of California, Santa Barbara, Roger Ingham on 04/16/2014
Gow & Ingham: Modifying Intervals of Phonation in Stuttering 509
present studies demonstrate that the experimental effects donot depend on changes in speech rate. There was consider-able variation in speech quality because only 1 of the 4subjects across these studies appeared to achieve com-pletely normal-sounding speech. Another similarity was thatall subjects showed a lack of carryover of any treatmenteffect in withdrawal phases.
The present findings did differ from the other studies insome rather important ways. In the present study, subjectsfailed to increase the frequency of target range PIs to 50%above their base-rate frequencies. On the other hand, thepresent study provides a much more extensive description ofthe effect of manipulating target range Ps on the subject'sentire P distribution, plus the effect of these manipulationson speech naturalness ratings. The present study alsoincorporated some unique features that may explain thesedifferences: the method used to select target range PIs as theindependent variable (i.e., from a decile distribution), the useof an EGG (rather than an accelerometer) to measurephonation duration, and the measurement of speech natu-ralness. The most pertinent issues arising from this study arediscussed below.
Selection of the Independent Variable
In this study, the shortest PI range that the subjects couldreduce (and concomitantly reduce stuttering) was identifiedby a stepwise procedure; that is, by incremental increases inthe size of the target P range, beginning with the shortestrange. The incremental steps in the size of the target rangewere based on decile divisions of each subject's entirebase-rate PI distribution. Hence, the first step was the rangeoccupied by the lowest 10% of the subject's PI distribution.Perhaps other effects might have occurred if the subjects hadattempted to decrease or increase PI counts within ranges ofmuch longer duration, maybe starting with the longest decilerange.
The decision to modify short-duration Ps stemmed fromthe clinical orientation in the Ingham et al. (1983) study.These authors argued that the use of extended intervals ofphonation was probably the most common feature amongstuttering treatment procedures that employ prolongedspeech (Goldiamond, 1965; Perkins, 1973). They concluded,therefore, that the proportion of short-duration Ps in thespeech of a person who stutters should result in the use oflonger phonation intervals. Ingham et al. (1983) recognizedthat it was not clear just how much phonation extension wasboth necessary and sufficient in order to modify stuttering. Byidentifying this interval size, they argued, it might be possibleto control stuttering without producing unnatural-soundingspeech. In the present study, therefore, it was of interest thatboth subjects did alter the frequency of PIs in slightly longerduration ranges when they modified their target range PIs,although this was not a consistent effect. The present studydid not determine whether directly modifying Pis in relativelylonger ranges might produce similar effects.
A related issue concerns the possible contribution to thesefindings of variation in pauses or, more particularly, NPIs.Although NPIs were not investigated in these experiments,
the subjects' control over their target range PIs may actuallyhave been produced by modifications to NPIs. Ingham andDevan (1987) provided some evidence that this could be thecase. They found that changes in short-duration Ps mayreflect changes in the NPI distribution. Hence, in the presentexperiments, the subjects may have also reduced the fre-quency of their target range Ps by altering the frequencydistribution of NPIs. Relevant to this issue are data showingthat the stutter-free speech of persons who stutter maycontain significantly more short pauses than is the case in thespeech of persons who do not stutter (Love & Jeffress, 1971).Future research will determine whether persons who stutterare able to reduce the frequency of such pauses, andwhether this produces functional control of stuttering.
Another issue of interest was the nature of the relationshipbetween changes in PI frequencies within the selectedranges and stuttering frequency. The findings of the mostrelevant previous studies (Ingham et al., 1983; Ingham &Devan, 1987) suggested that there is a strong relationshipbetween changes in certain Ps and changes in stuttering.The results of the present study were not as compelling. Bothsubjects reduced their stuttering when target range PIs werereduced, but their stuttering did not always increase whentarget range Ps increased. Interestingly, neither subjectcould increase his target range Ps above base-rate (Aphase) levels, which means they might not have achievedsatisfactory control over their target range PIs. In the presentstudy, control/ meant that subjects could speak with PI countsbetween 50% above and below base-rate P frequencies.The fact that the subjects could not manipulate their targetrange PIs beyond a criterion level may, of course, mean thatthe criterion level was a critical factor. The criterion may havebeen stringent, but it was essentially an arbitrary criterion.Further research may determine the amount of variation in PIcounts that is necessary to modify stuttering.
Speech Rate Factors
The interpretation of the experimental effects in the presentstudy may be clouded by the way speech rate was mea-sured. Speech rate is an extremely complex phenomenon(Starkweather, 1985) and, as yet, there is no standardprocedure for measuring it validly. In the present experi-ments, for instance, the SPM data included occurrences ofstuttering and pauses of unspecified length, variables thatinteract with speech rate measurement. This interactionmight have been important when subjects displayed rela-tively more stuttering. However, if the SPM data had beenadjusted to exclude stutterings then, in all probability, thiswould have actually exaggerated some of the observedchanges in speech rate. During Stage II, for example, whenspeech rate appeared to decrease and increase, with con-comitant changes in PI counts, then these changes mighthave been even more apparent.
What is more important, though, is that during the ratecontrol experiments (Stage IV), a relatively constant speechrate was claimed to have been present across phases whenstuttering increased and decreased. If stuttering had beenomitted from these intervals, then it is possible that both
Downloaded From: http://jslhr.pubs.asha.org/ by University of California, Santa Barbara, Roger Ingham on 04/16/2014

510 Iournal o Speech and Hearnng Research
subjects might not have displayed a stable speaking rateacross the Stage IV phases. It is the case, though, that bothsubjects showed relatively little stuttering across the RCphases. Consequently, if their speech rate data had excludedstutterings, the omission would have had little impact on theirSPM data. It is worth noting, incidentally, that when Inghamet al. (1983) recalculated their SPM data so that theyexcluded moments of stuttering they found that their originaltreatment effects were unchanged.
Changes in the Monte Carlo Range
A notable finding was that neither subject could directlycontrol the frequency of his Monte Carlo Range PIs despitereliable evidence that this was the P range that changedwhen subjects modified their target range Pls. There are anumber of possible explanations for this finding.
Perhaps the most obvious explanation relates to the phasechanges that subjects experienced during Stage ilI. Prior tothat stage, they had to reduce their Monte Carlo Range PIs,but in Stage Ill they simply had to maintain a range that theyhad been producing during other treatment conditions. Inretrospect, perhaps this experiment might have yielded aneven more conclusive result if the subjects had been requiredto manipulate, rather than maintain, their Monte Carlo RangePIs.
Another explanation for the experimental noneffect InStage III s that the Monte Carlo analysis of each subject'sStage II PI data did not identify the controlling variable. Forinstance, the concomitant changes In the subjects' NPIdistributions may have yielded a more accurate Monte CarloRange. The fact that a PI range shows change, does not, ofcourse, mean that that range is always responsible forchanges in stuttering frequency
Additional Considerations
An issue that emerged during the course of subject J.P.'sexperiment relates to his Stage I B-(15-140) phase data(see Figure 4). During this phase J.P. was instructed toreduce his 15-140-msec PI counts, and in one trial he beganto use rhythmic speech. The experimenters then decided notto allow J.P. to continue with this speech pattern, although ifhe had persisted with this pattern he may have ultimatelyproduced a normally fluent speech pattern. However, theexperimenters decided to see whether J.P. could achievestutter-free speech without adopting any obviously unusualspeech pattern. The same decision, incidentally, would havebeen made if the subject had decided to sing, count, useprolonged voicing, or whisper so as to reduce PI counts.
This incident serves to highlight the need for an indepen-dent method for verifying that the subject's manner of speechis appropriate for a particular experiment. That methodshould also be capable of identifying speech patterns suchas singing and counting. In the present case such a methodis needed so as to recognize patterns that lack the featuresnecessary to achieve normal speech. The speech natural-ness ratings may, at least, provide some indication of depar-tures from natural-sounding speech.
One of the more innovative features of this study was theapplication of computer-assisted feedback to the modifica-tion of phonatory behavior. The use of the EGG and thecomputer system made it possible, for virtually the first time,to investigate the changes that might occur in a subject's PIand NPI distribution. That system also made it possible toisolate the precise changes that occur in a subject's PIdistribution during experimental conditions.
ConclusionIt has often been reported that stuttering may be reduced
when persons who stutter extend their customary phonatedintervals during speech. Manipulations to phonation havealso been implicated as the mechanisms responsible for thefluency-inducing effects of rhythmic speech, masking, sing-ing, chorus-reading, shadowing and prolonged speech andits variants (Ingham, 1984). However, very few studies haveendeavored to investigate systematically the precise vari-ables responsible for these effects. This study makes acontribution by reporting an attempt to identify a precisecontrolling variable at the level of phonation interval frequen-cies. With some qualifications, the findings do demonstratethat stuttering can be brought under control by modifying adurational feature of phonation. They show that it is possibleto modify a component of the surface structure of the speechmotor control system, a component that may be a necessary,even sufficient, condition of phonatory behavior n the speechmotor control systems of persons who stutter.
AcknowledgmentsAuthorship of this paper is equal. Parts of this paper were originally
presented to the Annual Convention of the American Speech-Language-Hearing Association, St. Louis, Missouri, November 16,1989.
We gratefully acknowledge the assistance of Don Devan for thedevelopment of the computer software, Richard Moglia and SkipRoyston for their technical assistance, and Patrick Finn and CanSaben, who served as the independent judges.
ReferencesAdams, M. R. (1985). The speech physiology of stutterers. Present
status. Seminars in Speech and Language, 6, 177-196.Adams, M. R., Freeman, F. J., & Conture, E. G. (1984). Laryngeal
dynamics of stutterers. In W. H. Perkins & R. F. Curlee (Eds.),Nature and treatment of stuttenng New directions (pp 89-129)San Diego: College-Hill.
Adams, M. R., & Ramig, P. (1980). Vocal characteristics of normalspeakers and stutterers during choral reading. Journal of Speechand Heanng Research, 23, 457-469.
Andrews, G., Howie, P. M., Dozsa, M., & Guitar, B. E. (1982).Stuttering: Speech pattern characteristics under fluency-inducingconditions. Journal of Speech and Hearing Research. 25, 208-216.
Barlow, D. H., & Hersen, M. (1984). Single case experimentaldesigns: Strategies for studying behavior change (2nd ed.). NewYork: Pergamon.
Childers, D. G., Hicks, D. M., Moore, G. P., Eskenazi, L., &Lalwani, A. L. (1990) Electroglottography and vocal fold physiol-ogy Journal of Speech and Hearing Research, 33, 245-254
35 495-511 lone 1992
Downloaded From: http://jslhr.pubs.asha.org/ by University of California, Santa Barbara, Roger Ingham on 04/16/2014

Gow & Ingham: Modifying Intervals of Phonation in Stuttering 511
Colcord, R. D., & Adams, M. R. (1979). Voicing duration and vocalSPL changes associated with stuttering reduction during singing.Journal of Speech and Hearing Research, 22, 468-479.
Costello, J. M., & Ingham, R. J. (1984). Assessment strategies forstuttering. In R. F. Curlee & W. H. Perkins (Eds.), Nature andtreatment of stuttering: New direction (pp. 303-333). San Diego:College-Hill.
Finn, P., & Ingham., R. J. (1989). The selection of "fluent" samplesin research on stuttering: Conceptual and methodological consid-erations. Journal of Speech and Hearing Research, 32, 401-418.
Fourcin, A.J. (1974). Laryngographic examination of vocal foldvibration. In B. Wyke (Ed.), Ventilatory and phonatory controlsystems (pp. 315--333). London: Oxford University Press.
Goldiamond, I. (1'965). Stuttering and fluency as manipulatableoperant response classes. In L. Krasner & L. P. Ullman (Eds.),Research in behavior modification (pp. 106-156). New York: Holt,Rinehart & Winston.
Hawkins, R. P., & Dotson, V.A. (1975). Reliability scores thatdelude: An Alice in Wonderland trip through the misleadingcharacteristics of interobserver agreement scores in interval re-cording. In E. Ramp & G. Semb (Eds.), Behavior analysis: Areasof research and application. Englewood Cliffs, NJ: Prentice-Hall.
Healey, E. C., & Adams, M. R. (1981a). Rate reduction strategiesused by normally fluent and stuttering children and adults. Journalof Fluency Disorders, 6, 1-14.
Healey, E. C., & Adams, M. R. (1981b). Speech timing skills ofnormally fluent and stuttering children and adults. Journal ofFluency Disorders, 6, 233-246.
Ingham, R.J. (19834). Stuttering and behavior therapy: Currentstatus and experimental foundations. San Diego: College-Hill.
Ingham, R. J. (1990). Stuttering. In A. S. Bellack, M. Hersen, & A. E.Kazdin (Eds.), International handbook of behavior modificationand therapy (2nd ed., pp. 599-631). New York: Plenum.
Ingham, R.J., & Devan, D. (1987, November). Phonated andnonphonated interval modifications in the speech of stutterers.Paper presented at the Annual Convention of the AmericanSpeech-Language-Hearing Association, New Orleans, LA.
Ingham, R. J., Gow, M., & Costello, J. M. (1985). Stuttering andspeech naturalness: Some additional data. Journal of Speech andHearing Disorders, 50, 217-219.
Ingham, R. J., Martin, R. R., Haroldson, S. K., Onslow, M., &Leney, M. (1985). Modification of listener-judged naturalness inthe speech of stutterers. Journal of Speech and Hearing Re-search, 28, 495-504.
Ingham, R. J., Montgomery, J., & Ulliana, L. (1983). The effect ofmanipulating phonation duration on stuttering. Journal of Speechand Hearing Research, 26, 579-587.
Love, L. R., & Jeffress, L. A. (1971). Identification of brief pauses inthe fluent speech of stutterers and nonstutterers. Journal ofSpeech and Hearing Research, 14, 229-240.
Mallard, A. R., & Westbrook, J. B. (1985). Vowel duration instutterers participating in precision fluency shaping. Journal ofFluency Disorders, 10, 221-228.
Martin, R. R., Haroldson, S. K., & Triden, K. A. (1984). Stutteringand speech naturalness. Journal of Speech and Hearing Disor-ders, 49, 53-58.
Metz, D. E., Samar, V. J., & Sacco, P. R. (1983). Acoustic analysisof stutterers' fluent speech before and after therapy. Journal of
Speech and Hearing Research, 26, 531-536.Onslow, M., & Ingham, R. J. (1987). Speech quality measurement
and the management of stuttering. Journal of Speech and HearingDisorders, 52, 2-17.
Perkins, W. H. (1973). Replacement of stuttering with normalspeech: II. Clinical procedures. Journal of Speech and HearingDisorders, 38, 295-303.
Peters, H. F. M., & Hulstijn, W. (1987). Speech motor dynamics instuttering. Vienna: Springer-Verlag.
Pindzola, R. H. (1987). Durational characteristics of the fluentspeech of stutterers and nonstutterers. Folia Phoniatrica, 39,90-97.
Prins, D., & Hubbard, C. P. (1990). Acoustical durations of speechsegments during stuttering adaptation. Journal of Speech andHearing Research, 33, 494-504.
Prosek, R. A., & Runyan, C. M. (1982). Temporal characteristicsrelated to the discrimination of stutterers' and nonstutterers'speech samples. Journal of Speech and Hearing Research, 25,29-33.
Ramig, P. R. (1984). Rate changes in the speech of stutterers aftertherapy. Journal of Fluency Disorders, 9, 285-294.
Robb, M. P., Lybolt, J. T., & Price, H. A. (1985). Acoustic mea-sures of stutterers' speech following an intensive therapy program.Journal of Fluency Disorders, 10, 269-279.
Rubinstein, R. Y. (1981). Simulation and the Monte Carlo method.New York: John Wiley & Sons.
Samar, V.J., Metz, D.E., & Sacco, P.R. (1986). Changes inaerodynamic characteristics of stutterers' fluent speech associ-ated with therapy. Journal of Speech and Hearing Research, 29,106-113.
Starkweather, C. W. (1985). The development of fluency in normalchildren. Stuttering therapy: Prevention and intervention withchildren (pp. 9-42). Speech Foundation of America.
Watson, B. C., & Alfonso, P. J. (1983). Foreperiod and stutteringseverity effects on acoustic laryngeal reaction time. Journal ofFluency Disorders, 8, 183-205.
Watson, B.C., & Alfonso, P.J. (1987). Physiological bases ofacoustic LRT in nonstutterers, mild stutterers, and severe stutter-ers. Journal of Speech and Hearing Research, 30, 434-447.
Wingate, M. E. (1964). A standard definition of stuttering. Journal ofSpeech and Hearing Disorders, 29, 484-489.
Wingate, M. E. (1969). Sound and pattern in "artificial" fluency.Journal of Speech and Hearing Research, 12, 677-686.
Wingate, M. E. (1970). Effect on stuttering of changes in audition.Journal of Speech and Hearing Research, 13, 861-873.
Wingate, M. E. (1976). Stuttering: Theory and treatment. New York:Irvington.
Zebrowski, P. M., Conture, E. G., & Cudahy, E. A. (1985). Acous-tic analysis of young stutterers' fluency: Preliminary observations.Journal of Fluency Disorders, 10, 173-192.
Received April 1, 1991Accepted August 9, 1991
Contact author: Merrilyn L. Gow, Speech and Hearing Sciences,University of California, Santa Barbara, Santa Barbara, CA 93106.
Downloaded From: http://jslhr.pubs.asha.org/ by University of California, Santa Barbara, Roger Ingham on 04/16/2014