modis atmosphere validation plan - nasa · pdf filecomparisons with land validation sites in...
TRANSCRIPT
MODIS Atmosphere Validation Plan
MODIS Atmosphere Discipline Team
Michael D. KingEarth Sciences Directorate
Goddard Space Flight Center, Greenbelt, MD
Yoram J. KaufmanLaboratory for Atmospheres
Goddard Space Flight Center, Greenbelt, MD
W. Paul MenzelNOAA/NESDIS
University of Wisconsin, Madison, WI
Didier TanréUniversité des Sciences et Technique de Lille
Villeneuve d’Ascq, France
Bo-Cai GaoNaval Research Laboratory, Washington, DC
MODIS Validation Collaborators
Steve AckermanBryan BaumRich Ferrare
Andrew HeymsfieldBrent HolbenMerv LynchGerald Mace
Alexander MarshakChris Moeller
Steven PlatnickLorraine Remer
Si-Chee TsayTaneil Uttal
August 8, 2000
i
TABLE OF CONTENTS
EXECUTIVE SUMMARY............................................................................................... IV
1.0 INTRODUCTION.....................................................................................................1
1.1 Scientific Objectives ..........................................................................................1
1.2 Missions ............................................................................................................2
1.3 Science Data Products .....................................................................................2
2.0 VALIDATION OVERVIEW ....................................................................................2
2.1 Overall Approach..............................................................................................2
2.2 Terra Validation Investigations.......................................................................5
2.3 Sampling Requirements ...................................................................................6
2.4 Measures of Success .........................................................................................7
3.0 VALIDATION SITES................................................................................................7
3.1 University of Utah Facility for Atmospheric Remote Sensing (FARS).........8
3.2 Continental Integrated Ground Site Network (CIGSN) .............................11
3.3 Surface Measurements for Atmospheric Radiative Transfer (SMART) ....12
3.4 Raman Lidar ...................................................................................................15
3.5 Radar and Lidar Measurements....................................................................15
4.0 PRE-LAUNCH ACTIVITIES.................................................................................18
4.1 Field Experiments ...........................................................................................18
4.1.1 ARMCAS ...............................................................................................20
4.1.2 SCAR-B ..................................................................................................20
4.1.3 SUCCESS ..............................................................................................21
4.1.4 TARFOX................................................................................................22
4.1.5 WINCE and WINTEX .........................................................................23
4.1.6 FIRE Arctic Cloud Experiment.............................................................23
MODIS Atmosphere Validation Plan ii
ii
4.1.7 CALVEX-N ...........................................................................................24
4.2 Operational Surface Networks ......................................................................25
4.3 Existing Satellite Data....................................................................................25
4.4 Instrument Development ...............................................................................25
5.0 POST-LAUNCH ACTIVITIES...............................................................................26
5.1 Field Campaigns..............................................................................................26
5.1.1 WISC-T2000 ..........................................................................................28
5.1.2 PRIDE ....................................................................................................29
5.1.3 SAFARI 2000 .........................................................................................30
5.1.4 Antarctica...............................................................................................30
5.1.5 CLAP-T2001 and CLAP-A2001...........................................................31
5.1.6 COVE .....................................................................................................32
5.1.7 California Stratus and Valley Fog ........................................................32
5.1.8 MOBY ....................................................................................................33
5.1.9 ACE-Asia ...............................................................................................33
5.1.10 CRYSTAL-FACE and CRYSTAL-TWP ...........................................34
5.2 Other Satellite Data........................................................................................34
5.3 In Situ Measurement Needs at Calibration/Validation Sites......................34
5.4 Needs for Instrument Development ..............................................................35
5.5 Geometric Registration Site ...........................................................................36
5.6 Intercomparisons ............................................................................................36
5.7 Modeling Studies and Quality Assessment ..................................................37
6.0 IMPLEMENTATION OF VALIDATION RESULTS ...........................................38
6.1 Approach .........................................................................................................38
6.2 Role of EOSDIS ..............................................................................................38
MODIS Atmosphere Validation Plan iii
iii
6.3 Archival, Processing, and Distribution of Validation Data ........................38
7.0 SUMMARY..............................................................................................................38
8.0 REFERENCES .........................................................................................................40
9.0 WORLD WIDE WEB LINKS FOR VALIDATION..............................................43
10.0 ACRONYMS ...........................................................................................................44
iv
Executive Summary
The MODIS Atmosphere Team will use several validation techniques to developuncertainty estimates for its various data products. The methods include (i)comparisons with in situ data collected over a distributed network of groundvalidation sites, (ii) comparisons with data and products from other airborne andspaceborne sensors, and (iii) analysis of trends in atmosphere data products.
The primary validation techniques include collection of, and comparison with,field experiment data collected from collocated airborne field experiments, andintercomparison with long time series of ground-based observations at a se-lected set of ground validation sites worldwide. The imagery, data analysis, andfield experiment data will be archived at either the Goddard or Langley DAAC,and made available to the outside scientific community.
MODIS Atmosphere validation work will involve:
� Comparisons with land validation sites in Africa, North America, andAustralia
� Close cooperation with EOS validation investigators to meet specificproduct validation needs
� Interaction with established data networks (e.g., ARM, AERONET, ra-diosondes)
� Participation in community field campaigns (e.g., FIRE ACE, SAFARI2000) and EOS-targeted field campaigns (e.g., WISC-T2000)
� Collaboration with other Terra, ADEOS II, and Aqua instrument teams
� Collaboration with a worldwide effort to derive column precipitable wa-ter from a network of surface GPS receivers
Taken together, these activities provide the foundation for operational productvalidation, and outlines the planned validation activities of the MODIS Atmos-phere Discipline Team and collaborators from 1995 through 2002.
1
1.0 Introduction
This document describes the activities of the MODIS Atmosphere team and prin-cipal validation investigators aimed at assessing the accuracy, reliability, and rep-resentativeness of the atmosphere data products routinely derived from MODISsatellite data. It reviews recent activities as well as activities planned through2002.
1.1 Scientific Objectives
We intend to collect a well-calibrated data set of high spectral and spatial resolu-tion measurements to support radiometric calibration of the MODIS shortwaveand longwave channels and the development of the following MODIS atmos-phere algorithms:
� Cloud mask for distinguishing clear sky from clouds
� Cloud radiative and microphysical properties
– cloud top pressure, temperature, and effective emissivity
– cloud optical thickness, thermodynamic phase, and effective radius
– thin cirrus reflectance in the visible
� Aerosol optical properties
– optical thickness over the land and ocean
– aerosol size distribution (parameters) over the ocean
� Atmospheric moisture and temperature gradients
� Column water vapor amount
� Gridded time-averaged (level-3) atmosphere product
– daily (1° × 1°)
– 8-day (1° × 1°)
– monthly (1° × 1°)
– mean, standard deviation, marginal probability density function, jointprobability density functions
A summary of these algorithms can be found in King et al. (1992), as well as indetailed descriptions of each algorithm, to be found in Algorithm Theoretical Ba-sis Documents (ATBDs) available at http://eospso.gsfc.nasa.gov/atbd/pg1.html.
MODIS Atmosphere Validation Plan 2
1.2 Missions
MODIS will be carried onboard the first EOS spacecraft, designated Terra, to belaunched December 1999. In addition to Terra, MODIS will fly aboard Aqua inDecember 2000. These two spacecraft will likely be repeated in the morning andafternoon orbits with advanced operational versions of MODIS, providing a con-sistent data set equivalent to MODIS from 2000-2018. In order to validate theMODIS atmospheric products to be derived from these data, it is necessary tovalidate specific geophysical parameters under a wide variety of atmosphericconditions from arctic stratus clouds in the summertime arctic, multi-layer cloudsystems in the polar night, convective cloud systems in the intertropical conver-gence zone, aerosol properties over the ocean and several land surface coversfor different aerosol types, precipitable water over a wide range of atmosphericconditions from the dry arctic to the humid tropics, total ozone content, atmos-pheric temperature and moisture profiles, and atmospheric stability.
1.3 Science Data Products
This MODIS atmosphere validation plan addresses the MODIS cloud mask aswell as investigator science products characterizing cloud top properties, cloudradiative and microphysical properties, aerosol optical thickness and (over theocean) aerosol size distribution, precipitable water vapor over the land andocean sun glint regions, and atmospheric profiles of moisture and temperature.Validation of the shortwave and longwave radiances will also be assessed anddiscussed in this validation plan.
2.0 Validation Overview
2.1 Overall Approach
In order to validate MODIS atmosphere data products, it is necessary to validatespecific atmosphere parameters under a wide variety of atmospheric conditionsand solar illumination angles, and over a wide variety of ecosystems worldwide.The MODIS atmosphere team will use a wide variety of validation techniques todevelop uncertainty information on its products. These include (i) coordinationand collocation with higher resolution aircraft data, (ii) intercomparison withground-based and aircraft in situ observations, (iii) intercomparisons with otherTerra, ADEOS II, and Aqua instruments (e.g., MISR, AIRS, AMSR, GLI), and (iv)analysis of trends over time and consistency across boundaries (e.g., land vsocean, day vs night).
Our validation approach relies heavily on the sources of the data that were usedin the algorithm development, which consisted primarily of the MAS, a fiftychannel visible, near-infrared, and thermal infrared imaging spectrometer with50 m resolution at nadir (King et al. 1996), HIS, a 2 km resolution nadir-viewing(now modified for scanning, S-HIS) Michelson interferometer, AVIRIS, a 224
MODIS Atmosphere Validation Plan 3
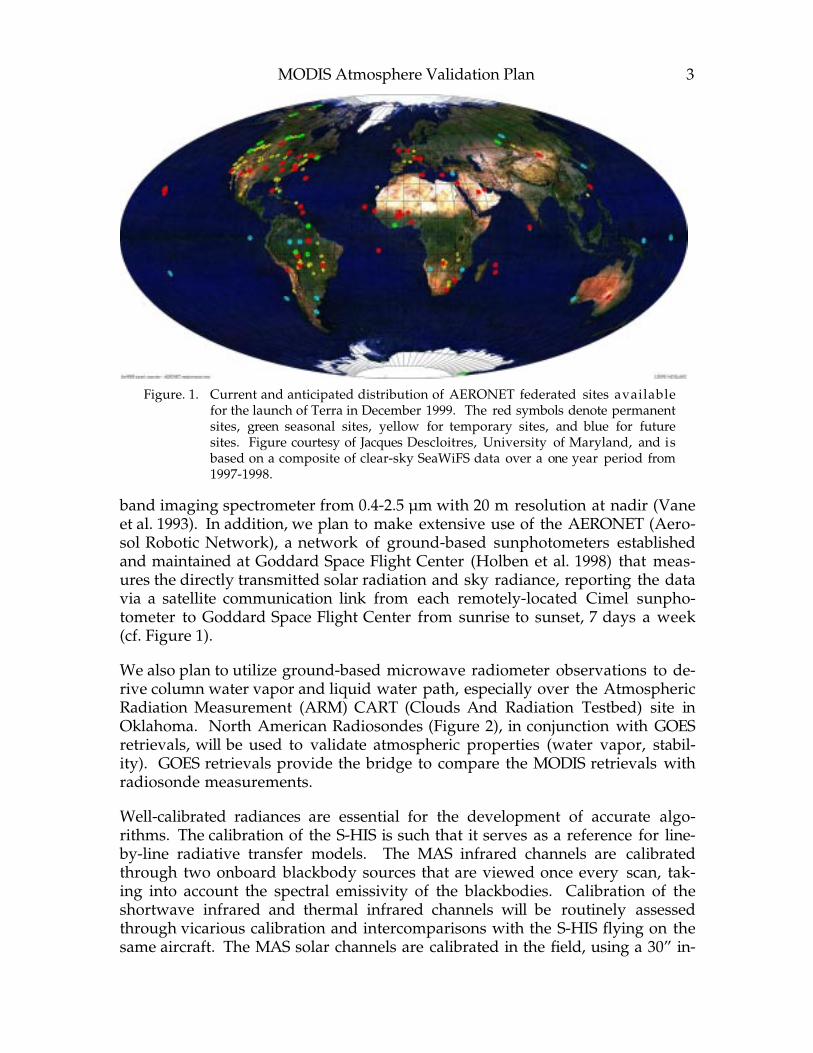
band imaging spectrometer from 0.4-2.5 µm with 20 m resolution at nadir (Vaneet al. 1993). In addition, we plan to make extensive use of the AERONET (Aero-sol Robotic Network), a network of ground-based sunphotometers establishedand maintained at Goddard Space Flight Center (Holben et al. 1998) that meas-ures the directly transmitted solar radiation and sky radiance, reporting the datavia a satellite communication link from each remotely-located Cimel sunpho-tometer to Goddard Space Flight Center from sunrise to sunset, 7 days a week(cf. Figure 1).
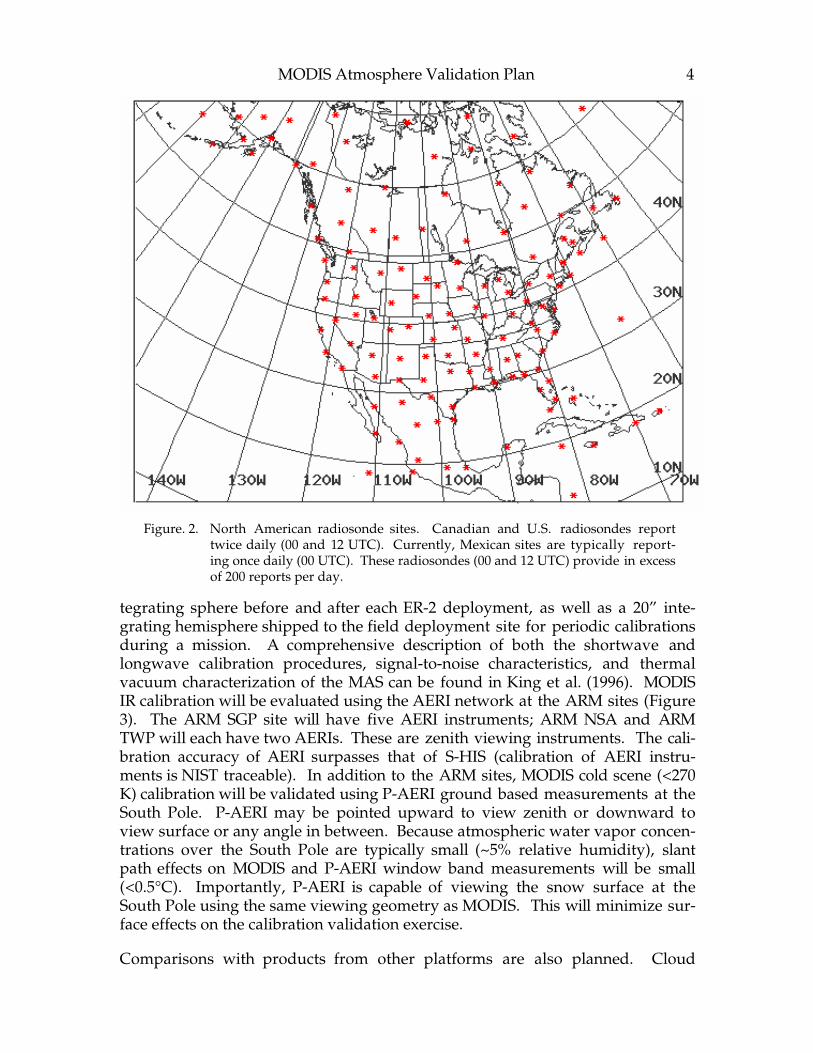
We also plan to utilize ground-based microwave radiometer observations to de-rive column water vapor and liquid water path, especially over the AtmosphericRadiation Measurement (ARM) CART (Clouds And Radiation Testbed) site inOklahoma. North American Radiosondes (Figure 2), in conjunction with GOESretrievals, will be used to validate atmospheric properties (water vapor, stabil-ity). GOES retrievals provide the bridge to compare the MODIS retrievals withradiosonde measurements.
Well-calibrated radiances are essential for the development of accurate algo-rithms. The calibration of the S-HIS is such that it serves as a reference for line-by-line radiative transfer models. The MAS infrared channels are calibratedthrough two onboard blackbody sources that are viewed once every scan, tak-ing into account the spectral emissivity of the blackbodies. Calibration of theshortwave infrared and thermal infrared channels will be routinely assessedthrough vicarious calibration and intercomparisons with the S-HIS flying on thesame aircraft. The MAS solar channels are calibrated in the field, using a 30” in-
Figure. 1. Current and anticipated distribution of AERONET federated sites availablefor the launch of Terra in December 1999. The red symbols denote permanentsites, green seasonal sites, yellow for temporary sites, and blue for futuresites. Figure courtesy of Jacques Descloitres, University of Maryland, and isbased on a composite of clear-sky SeaWiFS data over a one year period from1997-1998.
MODIS Atmosphere Validation Plan 4
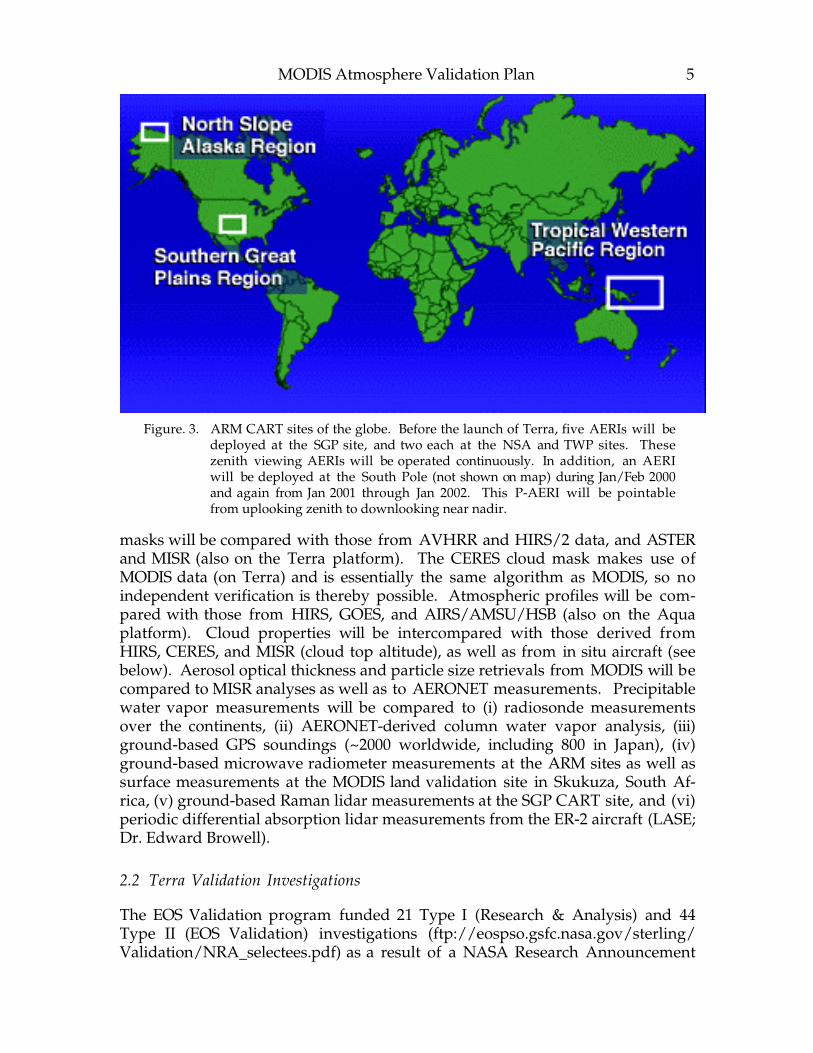
tegrating sphere before and after each ER-2 deployment, as well as a 20” inte-grating hemisphere shipped to the field deployment site for periodic calibrationsduring a mission. A comprehensive description of both the shortwave andlongwave calibration procedures, signal-to-noise characteristics, and thermalvacuum characterization of the MAS can be found in King et al. (1996). MODISIR calibration will be evaluated using the AERI network at the ARM sites (Figure3). The ARM SGP site will have five AERI instruments; ARM NSA and ARMTWP will each have two AERIs. These are zenith viewing instruments. The cali-bration accuracy of AERI surpasses that of S-HIS (calibration of AERI instru-ments is NIST traceable). In addition to the ARM sites, MODIS cold scene (<270K) calibration will be validated using P-AERI ground based measurements at theSouth Pole. P-AERI may be pointed upward to view zenith or downward toview surface or any angle in between. Because atmospheric water vapor concen-trations over the South Pole are typically small (~5% relative humidity), slantpath effects on MODIS and P-AERI window band measurements will be small(<0.5°C). Importantly, P-AERI is capable of viewing the snow surface at theSouth Pole using the same viewing geometry as MODIS. This will minimize sur-face effects on the calibration validation exercise.
Comparisons with products from other platforms are also planned. Cloud
Figure. 2. North American radiosonde sites. Canadian and U.S. radiosondes reporttwice daily (00 and 12 UTC). Currently, Mexican sites are typically report-ing once daily (00 UTC). These radiosondes (00 and 12 UTC) provide in excessof 200 reports per day.
MODIS Atmosphere Validation Plan 5
masks will be compared with those from AVHRR and HIRS/2 data, and ASTERand MISR (also on the Terra platform). The CERES cloud mask makes use ofMODIS data (on Terra) and is essentially the same algorithm as MODIS, so noindependent verification is thereby possible. Atmospheric profiles will be com-pared with those from HIRS, GOES, and AIRS/AMSU/HSB (also on the Aquaplatform). Cloud properties will be intercompared with those derived fromHIRS, CERES, and MISR (cloud top altitude), as well as from in situ aircraft (seebelow). Aerosol optical thickness and particle size retrievals from MODIS will becompared to MISR analyses as well as to AERONET measurements. Precipitablewater vapor measurements will be compared to (i) radiosonde measurementsover the continents, (ii) AERONET-derived column water vapor analysis, (iii)ground-based GPS soundings (~2000 worldwide, including 800 in Japan), (iv)ground-based microwave radiometer measurements at the ARM sites as well assurface measurements at the MODIS land validation site in Skukuza, South Af-rica, (v) ground-based Raman lidar measurements at the SGP CART site, and (vi)periodic differential absorption lidar measurements from the ER-2 aircraft (LASE;Dr. Edward Browell).
2.2 Terra Validation Investigations
The EOS Validation program funded 21 Type I (Research & Analysis) and 44Type II (EOS Validation) investigations (ftp://eospso.gsfc.nasa.gov/sterling/Validation/NRA_selectees.pdf) as a result of a NASA Research Announcement
Figure. 3. ARM CART sites of the globe. Before the launch of Terra, five AERIs will bedeployed at the SGP site, and two each at the NSA and TWP sites. Thesezenith viewing AERIs will be operated continuously. In addition, an AERIwill be deployed at the South Pole (not shown on map) during Jan/Feb 2000and again from Jan 2001 through Jan 2002. This P-AERI will be pointablefrom uplooking zenith to downlooking near nadir.
MODIS Atmosphere Validation Plan 6
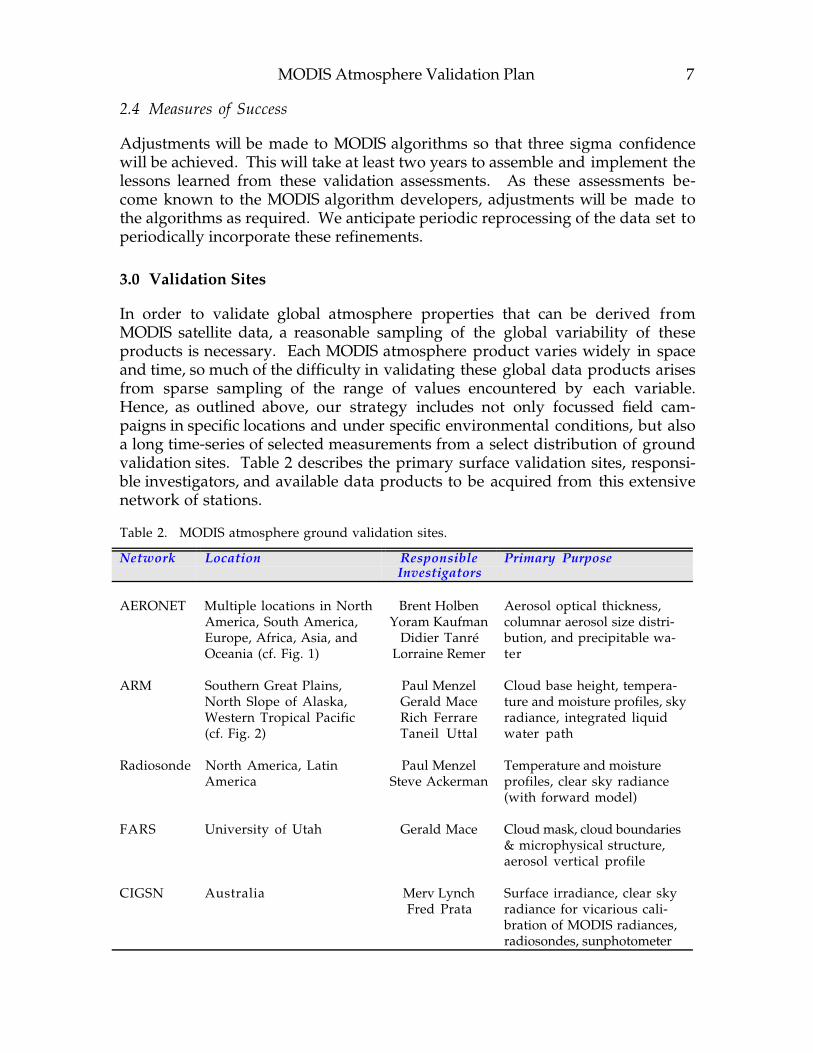
issued in 1997. Six of these investigations are especially relevant to validation ofMODIS atmosphere data products. In addition, international collaboration fromAustralia will play a valuable role in assessing the accuracy and reliability ofMODIS atmosphere and land products at three surface sites on the Australiancontinent. Table 1 lists the validation investigations that are especially relevant tothe MODIS atmosphere products.
Table 1. EOS Validation Investigations of relevance to the MODIS atmosphere data products.
Investigator Organization Investigation
Richard Ferrare NASA Langley Validation of aerosol and water vapor profilesby Raman lidar
Andrew Heymsfield NCAR In-situ and remote sensing measurements in sup-port of the EOS/MODIS retrieval algorithmvalidation program
Merv Lynch Curtin University Temperature and moisture profiles, surface ra-diation budget, and spectral radiance at thesensor (vicarious calibration sites)
Gerald Mace University of Utah Cloud property and surface radiation observa-tions and diagnostics in support of EOSCERES, MODIS, and MISR validation efforts
Alexander Marshak Univ. of Maryland Validation of cloud optical depths retrievedfrom EOS/MODIS data
Steven Platnick Univ. of Maryland A study of uncertainties for MODIS cloud re-trievals of optical thickness and effective ra-dius
Taneil Uttal NOAA/ETL Validation of CERES cloud retrievals over theArctic with surface-based millimeter-waveradar
2.3 Sampling Requirements
Comparison of MODIS radiances and products with those from other instru-ments should be made periodically (perhaps annually) in different seasons indaytime and nighttime conditions. We anticipate numerous opportunities, un-specified, in which scientists worldwide will intercompare MODIS-derived at-mospheric, land, and ocean data products with local measurements of the geo-physical property of interest. This wide-scale synthesis of data sets from scien-tists from Australia, Japan, China, Europe, South America, and Africa will greatlyenhance the confidence that we place in the MODIS-derived products, and will,with time, aid our ability to assess the quality of the data products from a widevariety of climatic conditions and seasons. This would not be possible, nor ap-propriate, for the small MODIS Science Team to accomplish entirely on its own.
MODIS Atmosphere Validation Plan 7
2.4 Measures of Success
Adjustments will be made to MODIS algorithms so that three sigma confidencewill be achieved. This will take at least two years to assemble and implement thelessons learned from these validation assessments. As these assessments be-come known to the MODIS algorithm developers, adjustments will be made tothe algorithms as required. We anticipate periodic reprocessing of the data set toperiodically incorporate these refinements.
3.0 Validation Sites
In order to validate global atmosphere properties that can be derived fromMODIS satellite data, a reasonable sampling of the global variability of theseproducts is necessary. Each MODIS atmosphere product varies widely in spaceand time, so much of the difficulty in validating these global data products arisesfrom sparse sampling of the range of values encountered by each variable.Hence, as outlined above, our strategy includes not only focussed field cam-paigns in specific locations and under specific environmental conditions, but alsoa long time-series of selected measurements from a select distribution of groundvalidation sites. Table 2 describes the primary surface validation sites, responsi-ble investigators, and available data products to be acquired from this extensivenetwork of stations.
Table 2. MODIS atmosphere ground validation sites.
Network Location ResponsibleInvestigators
Primary Purpose
AERONET Multiple locations in NorthAmerica, South America,Europe, Africa, Asia, andOceania (cf. Fig. 1)
Brent HolbenYoram Kaufman
Didier TanréLorraine Remer
Aerosol optical thickness,columnar aerosol size distri-bution, and precipitable wa-ter
ARM Southern Great Plains,North Slope of Alaska,Western Tropical Pacific(cf. Fig. 2)
Paul MenzelGerald MaceRich FerrareTaneil Uttal
Cloud base height, tempera-ture and moisture profiles, skyradiance, integrated liquidwater path
Radiosonde North America, LatinAmerica
Paul MenzelSteve Ackerman
Temperature and moistureprofiles, clear sky radiance(with forward model)
FARS University of Utah Gerald Mace Cloud mask, cloud boundaries& microphysical structure,aerosol vertical profile
CIGSN Australia Merv LynchFred Prata
Surface irradiance, clear skyradiance for vicarious cali-bration of MODIS radiances,radiosondes, sunphotometer
MODIS Atmosphere Validation Plan 8
Table 2. MODIS atmosphere ground validation sites (continued).
Network Location ResponsibleInvestigators
Primary Purpose
P-AERI South Pole Paul MenzelVon Walden
A. Heymsfield
Clear sky radiance (IR) andsurface measurements forMODIS validation of coldscenes; videosondes on teth-ered balloons for cloud parti-cle sizes & shapes
SMART Skukuza, South Africa (cf.Fig. 5)
Si-Chee TsayJeff Privette
Surface radiation budget, pre-cipitable water and inte-grated liquid water path,cloud base altitude
Balloon North America A. Heymsfield Balloon-borne ice crystal rep-licators for size distributionand habit of ice crystals inupper atmosphere
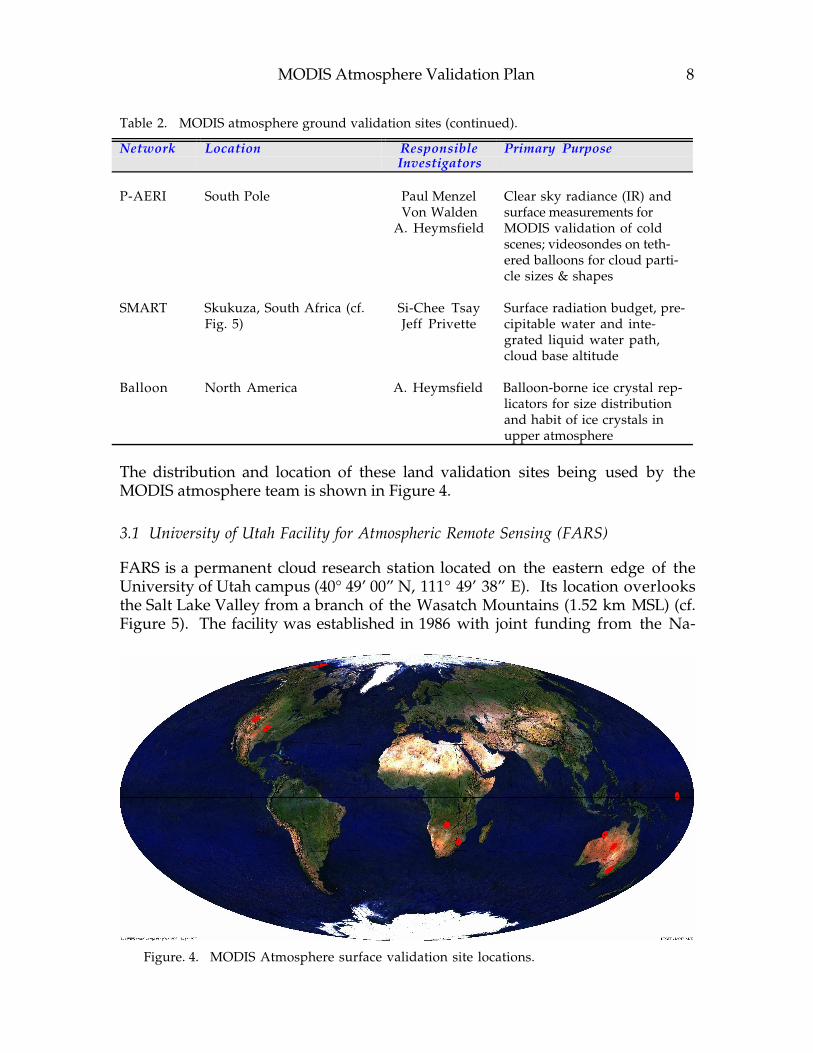
The distribution and location of these land validation sites being used by theMODIS atmosphere team is shown in Figure 4.
3.1 University of Utah Facility for Atmospheric Remote Sensing (FARS)
FARS is a permanent cloud research station located on the eastern edge of theUniversity of Utah campus (40° 49’ 00” N, 111° 49’ 38” E). Its location overlooksthe Salt Lake Valley from a branch of the Wasatch Mountains (1.52 km MSL) (cf.Figure 5). The facility was established in 1986 with joint funding from the Na-
Figure. 4. MODIS Atmosphere surface validation site locations.
MODIS Atmosphere Validation Plan 9
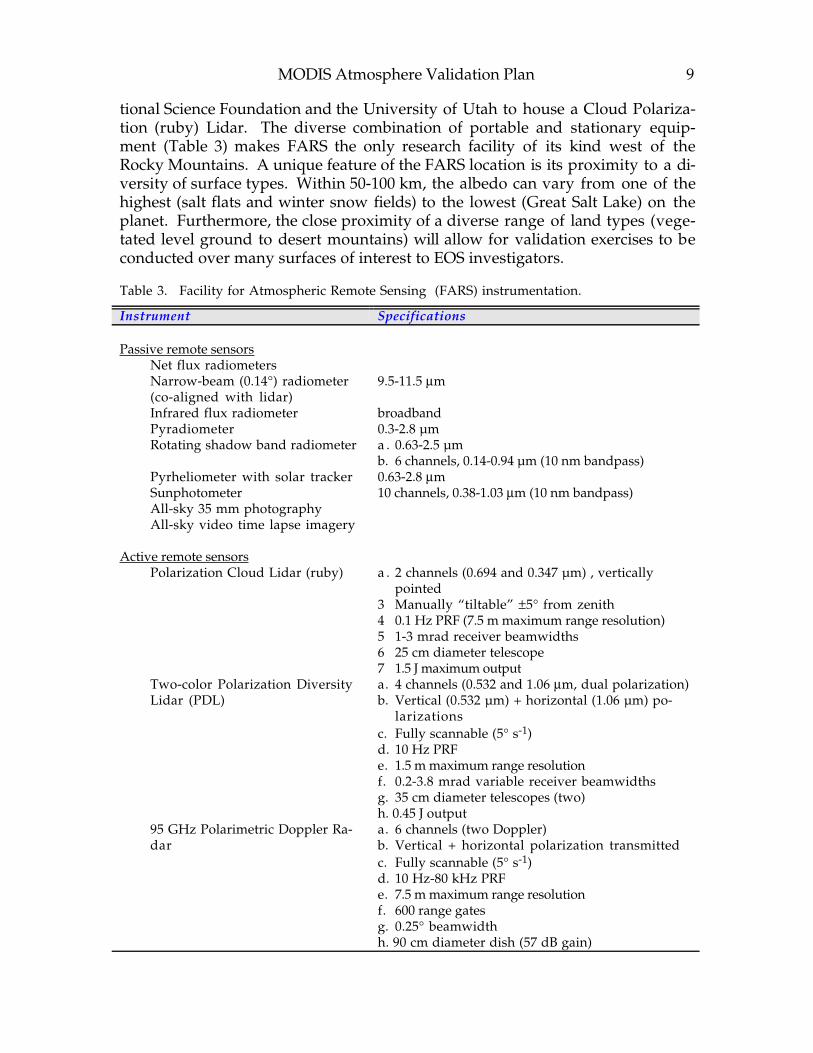
tional Science Foundation and the University of Utah to house a Cloud Polariza-tion (ruby) Lidar. The diverse combination of portable and stationary equip-ment (Table 3) makes FARS the only research facility of its kind west of theRocky Mountains. A unique feature of the FARS location is its proximity to a di-versity of surface types. Within 50-100 km, the albedo can vary from one of thehighest (salt flats and winter snow fields) to the lowest (Great Salt Lake) on theplanet. Furthermore, the close proximity of a diverse range of land types (vege-tated level ground to desert mountains) will allow for validation exercises to beconducted over many surfaces of interest to EOS investigators.
Table 3. Facility for Atmospheric Remote Sensing (FARS) instrumentation.
Instrument Specifications
Passive remote sensorsNet flux radiometersNarrow-beam (0.14°) radiometer(co-aligned with lidar)
9.5-11.5 µm
Infrared flux radiometer broadbandPyradiometer 0.3-2.8 µmRotating shadow band radiometer a . 0.63-2.5 µm
b. 6 channels, 0.14-0.94 µm (10 nm bandpass)Pyrheliometer with solar tracker 0.63-2.8 µmSunphotometer 10 channels, 0.38-1.03 µm (10 nm bandpass)All-sky 35 mm photographyAll-sky video time lapse imagery
Active remote sensorsPolarization Cloud Lidar (ruby) a . 2 channels (0.694 and 0.347 µm) , vertically
pointed3 Manually “tiltable” ±5° from zenith4 0.1 Hz PRF (7.5 m maximum range resolution)5 1-3 mrad receiver beamwidths6 25 cm diameter telescope7 1.5 J maximum output
Two-color Polarization DiversityLidar (PDL)
a. 4 channels (0.532 and 1.06 µm, dual polarization)b. Vertical (0.532 µm) + horizontal (1.06 µm) po-
larizationsc. Fully scannable (5° s-1)d. 10 Hz PRFe. 1.5 m maximum range resolutionf. 0.2-3.8 mrad variable receiver beamwidthsg. 35 cm diameter telescopes (two)h. 0.45 J output
95 GHz Polarimetric Doppler Ra-dar
a. 6 channels (two Doppler)b. Vertical + horizontal polarization transmittedc. Fully scannable (5° s-1)d. 10 Hz-80 kHz PRFe. 7.5 m maximum range resolutionf. 600 range gatesg. 0.25° beamwidthh. 90 cm diameter dish (57 dB gain)

MODIS Atmosphere Validation Plan 10
Table 3. Facility for Atmospheric Remote Sensing (FARS) instrumentation (continued).
Instrument Specifications95 GHz Polarimetric Doppler Ra-dar (continued)
i. 1.2 kW peak power
Passive remote sensorsTemperatureRelative humidity
The FARS site possesses extensive active and passive remote sensing instrumen-tation. Active systems include the vertically pointing ruby lidar (0.694 µmwavelength, with 7.5 m maximum range resolution; Sassen 1997), a portablehigh resolution two-color (0.532 and 1.06 µm, with 1.5 m maximum range resolu-tion) Polarization Diversity Lidar (Sassen 1994), and a 6 channel 3.2 mm po-larimetric Doppler radar (with 7.5 m maximum range resolution; Sassen andChen 1995). The passive systems include a narrow-beam infrared (IR) radiome-ter (PRT-5, 9.5-11.5 µm), a broadband infrared radiometer (PIR), global visiblepyranometer (PSP, 0.3-2.8 µm), normal incidence pyrheliometer (NIP, 0.63-2.8µm), and a rotating shadowband radiometer (RSR, 0.63-2.8 µm). Recent addi-tions to the site include a 9-channel sunphotometer, a multifilter rotating shad-owband radiometer (MFRSR; Harrison et al. 1994) and a two-channel microwaveradiometer.
The scientific objective of FARS has been the study of middle and high level
FARS
Figure. 5. Landsat image of the Salt Lake City region and the FARS location.
MODIS Atmosphere Validation Plan 11
clouds for basic research, as well as supporting the satellite validation effort ofthe FIRE project’s extended time observation (ETO) component. To this end,over 2200 hours of ruby-lidar and supporting data have been collected throughthe end of 1996.
The capability of FARS, like the ARM sites, is nearly ideal for use in validation ofthe EOS-derived cloud and radiation parameters. The particular combination ofactive and passive sensors will allow for a direct intercomparison of derived pa-rameters, and, when combined with in situ data, will enable a thorough valida-tion of many algorithms. The EOS validation program has funded approxi-mately 20 hours of in situ data collection per year over the FARS instruments.Presently, we are subcontracting with Dr. Paul Lawson of SPEC Inc. to performthe in situ data collection. Our goal is to use the surface-based remote sensingobservations validated by in situ data to derive a suite of products tailored forefficient use by the EOS science teams and to deliver these products along withany in situ data to the appropriate science team members or archival locations.Our scientific objective is to sequentially examine the assumptions underlying thesurface and satellite retrievals with the ultimate goal being the convergence ofthe end results.
To this end, we will operate the FARS site in clear and cloudy conditions for peri-ods bracketing satellite overpasses. The length of operation in each situation willbe determined on a case by case basis but will in general consist of 1-3 hour peri-ods. We are prepared to support roughly 15 overpasses each month. The over-passes we will support (high and low angle, day or night) will be determined inconsultation with the EOS team scientists. In cloudy conditions, the full suite ofFARS instrumentation will be operated. In clear conditions, the radiometric in-strumentation and ruby lidar will be operated to map the vertical properties ofaerosol layers. Additionally, we will perform one extended observing periodeach quarter where we will collect data for at least 12 hours centered on an over-pass so as to characterize a representative cloud system.
3.2 Continental Integrated Ground Site Network (CIGSN)
Australia’s Continental Integrated Ground Site Network (CIGSN) currently hastwo operational sites - one is 50 km E of Hay (New South Wales) on the Uardrysheep station, referred to hereafter as the Uardry site, and the other is 100 kmWNW of Alice Springs (Northern Territory) on the Amburla brahman cattlestud, referred to hereafter as the Amburla site. The CIGSN is producing accurateand long time series data of surface radiative fluxes and meteorological parame-ters such as surface temperature, air temperature, relative humidity, wind speedand surface pressure. A third site is situated on Thangoo station, 40 km SSE ofBroome in the Kimberley region of Western Australia. This site should be opera-tional by mid 1999.
The Uardry site has been providing near-continuous surface measurements sinceJuly 1992. This site is near the center of the largest and most uniform plain on
MODIS Atmosphere Validation Plan 12
the Australian continent. The layout consists of a central data logging and proc-essing site coupled with 8 “satellite” sites that telemeter data via a radio commu-nications link to the central site up to 6 times per minute. The solar powered,low maintenance, autonomous data collection system can handle up to 48 chan-nels of 16-bit resolution data stored onto a computer hard disk. Upward anddownward shortwave and longwave irradiances are monitored. The upwellingirradiances are obtained from instruments mounted on a boom extending froma 15 m tower. Air and ground temperatures are monitored at points across a 1km2 area.
The Amburla site has been providing near-continuous surface measurementssince March 1995. This instrumentation is on a 12 x 12 km2 plain, which issparsely covered with grass tufts. The layout consists of a central data loggingsite coupled with 6 ”satellite” sites. Electronics, communications and geophysicalvariables monitored are similar to those at the Uardry site.
The Thangoo site lies about 3 km from the coastal plain surrounding RoebuckBay, SSE of Broome. The landcover for the region varies from broad mud flatsnear the coast on which little grows, often under water during the wet seasonand because of the large tidal range (typically 8 - 10 m), to mangrove swamps,grassy plains and extensive coverage of acacia bush (wattle) which grows up to 5m in height. The soil is typically sandy and red-colored. The layout consists of acentral data logging site coupled with ”satellite” sites in a similar fashion to theother two sites. Electronics, communications and geophysical variables moni-tored are also similar to those at the other sites.
For all three sites, measurements of the surface irradiances and surface tempera-ture are made at a spatial scale that matches the resolution of satellite imagerssuch as MODIS, the Along-Track Scanning Radiometer (ATSR), and the Ad-vanced Very High Resolution Radiometer (AVHRR). Therefore the CIGSNmeasurements constitute a highly valuable data set with which to calibrate andvalidate satellite remote sensing data. The CIGSN data set has greatly assistedefforts in developing algorithms for land surface temperature (LST) and also sur-face-leaving shortwave (SW) irradiance from ATSR 1.6 µm top-of-the-atmosphere (TOA) radiances.
The CIGSN was designed to provide ground-truth temperature data for com-parison with satellite-derived LSTs. Results from measurements made at Uardryhave been published (Prata 1994).
Further information can be found at the CSIRO Division of Atmospheric Re-search web site: http://www.dar.csiro.au; follow links to the Atmospheric Proc-esses-Surface Processes page.
3.3 Surface Measurements for Atmospheric Radiative Transfer (SMART)
Si-Chee Tsay has developed suite of surface radiation and remote sensing in-
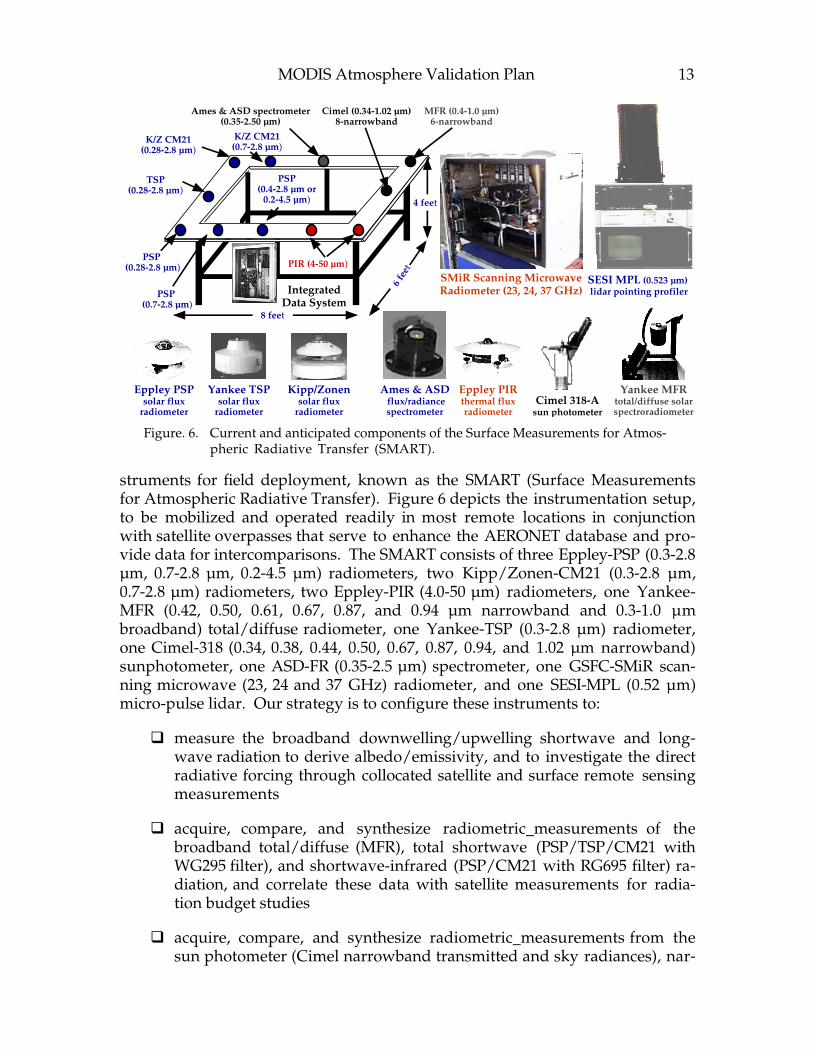
MODIS Atmosphere Validation Plan 13
struments for field deployment, known as the SMART (Surface Measurementsfor Atmospheric Radiative Transfer). Figure 6 depicts the instrumentation setup,to be mobilized and operated readily in most remote locations in conjunctionwith satellite overpasses that serve to enhance the AERONET database and pro-vide data for intercomparisons. The SMART consists of three Eppley-PSP (0.3-2.8µm, 0.7-2.8 µm, 0.2-4.5 µm) radiometers, two Kipp/Zonen-CM21 (0.3-2.8 µm,0.7-2.8 µm) radiometers, two Eppley-PIR (4.0-50 µm) radiometers, one Yankee-MFR (0.42, 0.50, 0.61, 0.67, 0.87, and 0.94 µm narrowband and 0.3-1.0 µmbroadband) total/diffuse radiometer, one Yankee-TSP (0.3-2.8 µm) radiometer,one Cimel-318 (0.34, 0.38, 0.44, 0.50, 0.67, 0.87, 0.94, and 1.02 µm narrowband)sunphotometer, one ASD-FR (0.35-2.5 µm) spectrometer, one GSFC-SMiR scan-ning microwave (23, 24 and 37 GHz) radiometer, and one SESI-MPL (0.52 µm)micro-pulse lidar. Our strategy is to configure these instruments to:
� measure the broadband downwelling/upwelling shortwave and long-wave radiation to derive albedo/emissivity, and to investigate the directradiative forcing through collocated satellite and surface remote sensingmeasurements
� acquire, compare, and synthesize radiometric_measurements of thebroadband total/diffuse (MFR), total shortwave (PSP/TSP/CM21 withWG295 filter), and shortwave-infrared (PSP/CM21 with RG695 filter) ra-diation, and correlate these data with satellite measurements for radia-tion budget studies
� acquire, compare, and synthesize radiometric_measurements from thesun photometer (Cimel narrowband transmitted and sky radiances), nar-
Yankee MFRtotal/diffuse solarspectroradiometer
Eppley PSPsolar flux
radiometer
Eppley PIRthermal fluxradiometer
Cimel 318-Asun photometer
SESI MPL (0.523 µm) lidar pointing profiler
PSP (0.28-2.8 µm)
PSP (0.7-2.8 µm)
TSP (0.28-2.8 µm)
IntegratedData System
Cimel (0.34-1.02 µm)8-narrowband
PSP(0.4-2.8 µm or
0.2-4.5 µm)
PIR (4-50 µm)
8 feet
6 fe
et
4 feet
MFR (0.4-1.0 µm)6-narrowband
SMiR Scanning MicrowaveRadiometer (23, 24, 37 GHz)
Yankee TSPsolar flux
radiometer
Ames & ASD flux/radiance spectrometer
Ames & ASD spectrometer (0.35-2.50 µm)
K/Z CM21 (0.28-2.8 µm)
K/Z CM21 (0.7-2.8 µm)
Kipp/Zonensolar flux
radiometer
Figure. 6. Current and anticipated components of the Surface Measurements for Atmos-pheric Radiative Transfer (SMART).
MODIS Atmosphere Validation Plan 14
rowband total/diffuse irradiance (MFR), transmitted and reflected spec-tral radiance (FR) and 22-36 GHz microwave emission (SMiR), focusingon the retrieval of atmospheric parameters (e.g., column water vaporamount, aerosol loadings, aerosol size distribution, etc.) and to seek thecorrelation between the broadband and narrowband radiation meas-urements
� measure the lidar backscattering intensity to infer the vertical profiles ofaerosols and cloud parameters for comparison with the retrieved resultsfrom radiometric measurements, and to initialize the atmospheric aero-sol profile in the forward computation of radiation models
This SMART can be easily transported to field sites of interest throughout the du-ration of Terra and Aqua, and will be collocated with the EOS Validation site inSkukuza, South Africa, during Austral Spring 2000 (SAFARI 2000 period, see be-low).
Currently, the Eppley-PSP, Kipp/Zonen-CM21, Eppley-PIR, Yankee-TSP radi-ometers, Yankee-MFR total/diffuse radiometer, Cimel-318 sunphotometer,GSFC-SMiR scanning microwave radiometer, and the SESI micro-pulse lidar areoperational and continuously operated at all time. In most field deployments,this system requires two operators to set up and field calibrate the system withinabout 8 working hours. Then, it can run in automatic mode, but requires data tobe downloaded about once a month for the radiometers and micro-pulse lidar.The sunphotometer has satellite-link transmission (like all AERONET systems).Only the ASD-FR spectrometer is operated. A brief summary of the instrumentspecifications and processing status is given in Table 4.
Table 4. Summary of surface remote sensing and radiation measurements in the SMART.
Instrument Specifications Processing Status
PSP ShortwaveRadiometers
a. 0.3 - 2.8 µmb. 0.7 - 2.8 µm
Calibrated for dark current and off-set corrections
CM21 ShortwaveRadiometers
a. 0.3 - 2.8 µmb. 0.7 - 2.8 µm
Calibrated for dark current and off-set corrections
TSP Shortwave Ra-diometer
0.3 - 2.8 µm Calibrated for dark current and off-set corrections
PIR LongwaveRadiometer
4.0 - 50 µm Calibrated for dark current, off-set and tempera-ture (preliminary) corrections
MFR/7 ShadowbandRadiometer
0.4-1.0 µm, 416,502, 616, 674, 869,and 938 nm
Calibrated against laboratory light source andconstant field monitoring with Li-Cor calibratorlight source
ASD-FR ShortwaveSpectrometer
0.35 - 2.5 µm Calibrated against laboratory Mercury-Argonsource with 0.1 nm bandpass monochromator
MODIS Atmosphere Validation Plan 15
Table 4. Summary of surface remote sensing and radiation measurements in the SMART (con-tinued).
Instrument Specifications Processing Status
Cimel Sunphotome-ter
340, 380, 440, 670,870, 940, and 1020nm
Calibrated against laboratory light source andthin-cloud screening
Micro-pulse lidar 0.52 µm Calibrated for dead-time, after-pulse, and overlapcorrections
Scanning MicrowaveRadiometer
22.8, 23.8, 37.0GHz
Cryogenic calibration, 77 K to ambient temperature
3.4 Raman Lidar
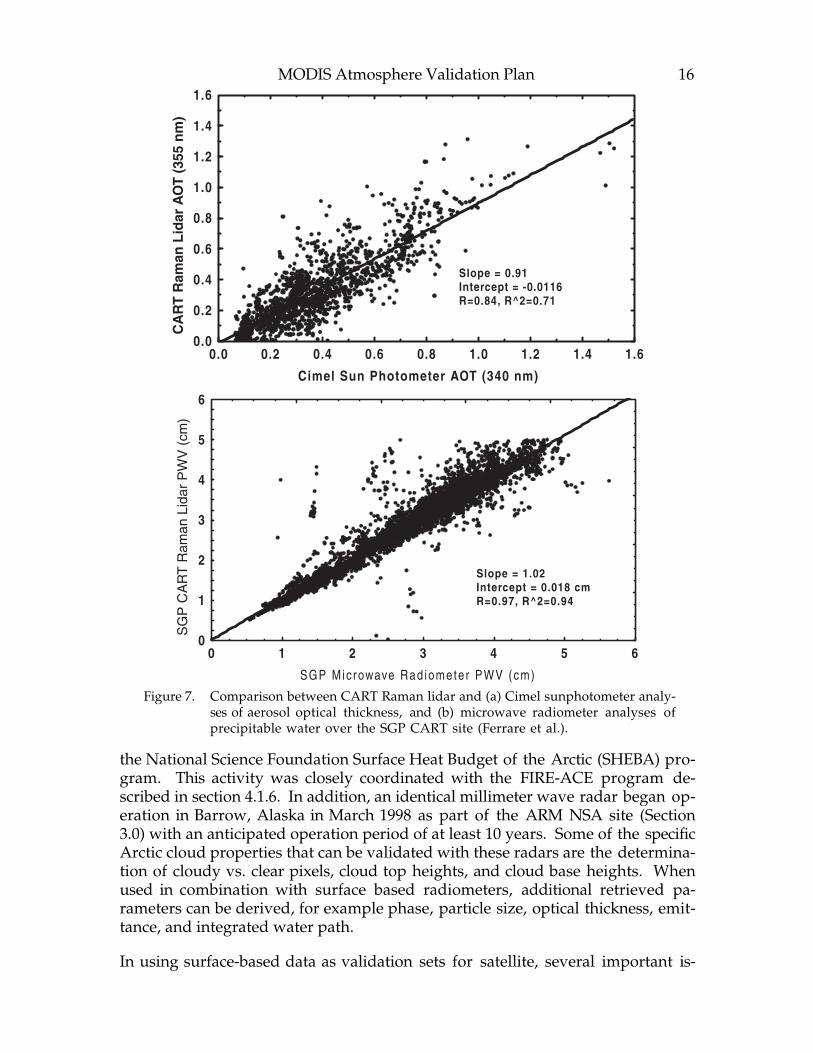
The Department of Energy ARM program has developed and operates a Ramanlidar system at the SGP CART site. Rich Ferrare leads an investigation that usesdata from this lidar system as well as the Goddard Scanning Raman lidar toevaluate the aerosol retrieval algorithms used by MODIS and MISR and, in par-ticular, to investigate over an extended period of time the (i) vertical variabilityof aerosol extinction and backscattering, (ii) relative humidity effects on aerosolproperties, and (iii) effects of clouds on aerosol properties. The SGP CART Ra-man lidar system operates in the vertical mode only, and is in nearly continuousoperation (~60% of the time since March 1998). A 3-phase uninterruptible powersource (UPS), which was installed in February 1999, should significantly increasethe operating time of this Raman lidar. It measures vertical profiles of aerosolextinction and backscatter (355 nm), depolarization (355 nm), and water vapormixing ratio (from Raman shifted backscattering at 408 nm); these profiles ofaerosol extinction and water vapor mixing ratio are integrated to derive meas-urements of aerosol optical thickness and precipitable water vapor.
Figure 7a shows a correlation with CART Raman lidar analyses of aerosol opticalthickness and nearly coincident Cimel sunphotometer measurements and Fig. 7bshows a correlation with CART Raman lidar analyses of precipitable water vaporand coincident microwave radiometer measurements. These figures show thecapabilities for validation of aerosol optical thickness and precipitable water va-por. Perhaps more importantly, Raman lidar also provides detailed informationon the vertical distribution of aerosols and water vapor that cannot be obtainedfrom either the sunphotometer or microwave radiometer alone. In addition, thislidar provides information on the correlation between aerosol extinction andrelative humidity.
3.5 Radar and Lidar Measurements
Between September 1997 and September 1998, a ground-based millimeter waveradar and depolarization lidar were operated on the Arctic ice pack as a part of
MODIS Atmosphere Validation Plan 16
the National Science Foundation Surface Heat Budget of the Arctic (SHEBA) pro-gram. This activity was closely coordinated with the FIRE-ACE program de-scribed in section 4.1.6. In addition, an identical millimeter wave radar began op-eration in Barrow, Alaska in March 1998 as part of the ARM NSA site (Section3.0) with an anticipated operation period of at least 10 years. Some of the specificArctic cloud properties that can be validated with these radars are the determina-tion of cloudy vs. clear pixels, cloud top heights, and cloud base heights. Whenused in combination with surface based radiometers, additional retrieved pa-rameters can be derived, for example phase, particle size, optical thickness, emit-tance, and integrated water path.
In using surface-based data as validation sets for satellite, several important is-
Cimel Sun Photometer AOT (340 nm)
CA
RT
Ram
an L
idar
AO
T (
355
nm
)
0.0
0.2
0.4
0.6
0.8
1.0
1.2
1.4
1.6
0.0 0.2 0.4 0.6 0.8 1.0 1.2 1.4 1.6
Slope = 0.91Intercept = -0.0116R=0.84, R^2=0.71
SGP Mic rowave Rad iomete r PWV (cm)
SG
P C
AR
T R
aman
Lid
ar P
WV
(cm
)
0
1
2
3
4
5
6
0 1 2 3 4 5 6
Slope = 1.02Intercept = 0.018 cmR=0.97, R^2=0.94
Figure 7. Comparison between CART Raman lidar and (a) Cimel sunphotometer analy-ses of aerosol optical thickness, and (b) microwave radiometer analyses ofprecipitable water over the SGP CART site (Ferrare et al.).

MODIS Atmosphere Validation Plan 17
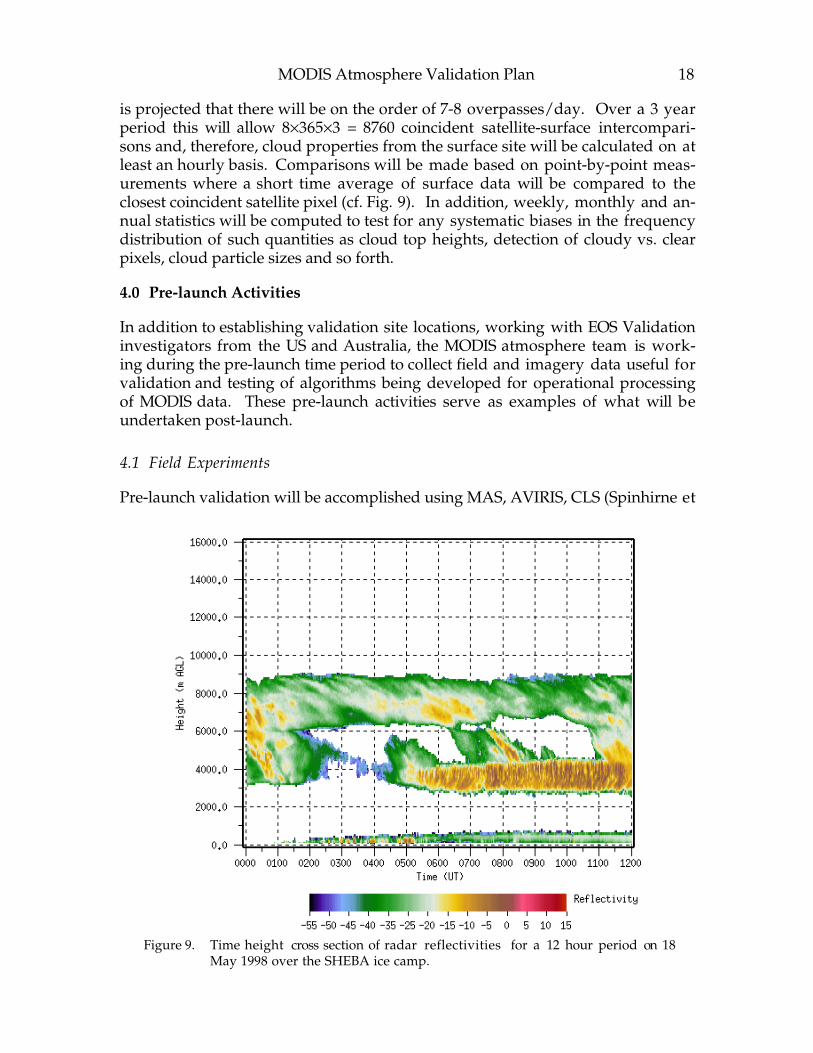
sues need to be addressed. First, the absolute accuracy of the surface data setsmust be determined before they can be useful. For instance, it has been shownthat radar and lidar often do not agree on observed cloud boundaries (Uttal et al.1995). Also, radar-radiometer retrieval methods for detecting cloud microphysi-cal properties utilize a number of assumptions (such as the shape of the particlesize distribution) that have yet to be tested extensively with in situ data. TheFIRE-ACE program conducted over 30 research flights over the SHEBA surfacesite, which will allow detailed comparisons between in situ cloud properties andthose remotely detected with the radars. Given the difficulties that satellites havein determining cloud properties over cold snow and ice surfaces in the Arctic, it isexpected that these measurements will be invaluable for testing the ground-based data sets that will be used to evaluate the performance of MODIS over theArctic. Figure 8 shows an example of a time height cross-section of the often-complex cloud structure over the SHEBA ice station during one of the FIRE-ACEaircraft campaigns.
After some knowledge is obtained about the accuracy of the cloud retrievals forArctic clouds, the radar and radiometer data from the ARM NSA site will beprocessed through an automated cloud processing procedure to generate a con-tinuous ground-based cloud data set for the life time of the Terra satellite. Be-cause Terra is a high altitude satellite, and Barrow, Alaska is a high latitude site, it
Figure 8. Comparison of cloud particle sizes from radar-radiometer techniques, in situaircraft, and AVHRR satellite retrievals.
MODIS Atmosphere Validation Plan 18
is projected that there will be on the order of 7-8 overpasses/day. Over a 3 yearperiod this will allow 8×365×3 = 8760 coincident satellite-surface intercompari-sons and, therefore, cloud properties from the surface site will be calculated on atleast an hourly basis. Comparisons will be made based on point-by-point meas-urements where a short time average of surface data will be compared to theclosest coincident satellite pixel (cf. Fig. 9). In addition, weekly, monthly and an-nual statistics will be computed to test for any systematic biases in the frequencydistribution of such quantities as cloud top heights, detection of cloudy vs. clearpixels, cloud particle sizes and so forth.
4.0 Pre-launch Activities
In addition to establishing validation site locations, working with EOS Validationinvestigators from the US and Australia, the MODIS atmosphere team is work-ing during the pre-launch time period to collect field and imagery data useful forvalidation and testing of algorithms being developed for operational processingof MODIS data. These pre-launch activities serve as examples of what will beundertaken post-launch.
4.1 Field Experiments
Pre-launch validation will be accomplished using MAS, AVIRIS, CLS (Spinhirne et
Figure 9. Time height cross section of radar reflectivities for a 12 hour period on 18May 1998 over the SHEBA ice camp.
MODIS Atmosphere Validation Plan 19
al. 1989), CAR (King et al. 1986) and HIS data already gathered in various fieldcampaigns; data that are especially valuable in combination with nearly coinci-dent airborne in situ microphysical measurements. A sampling of data sets al-ready in-hand, along with key sensors and responsible investigators are given inTable 5.
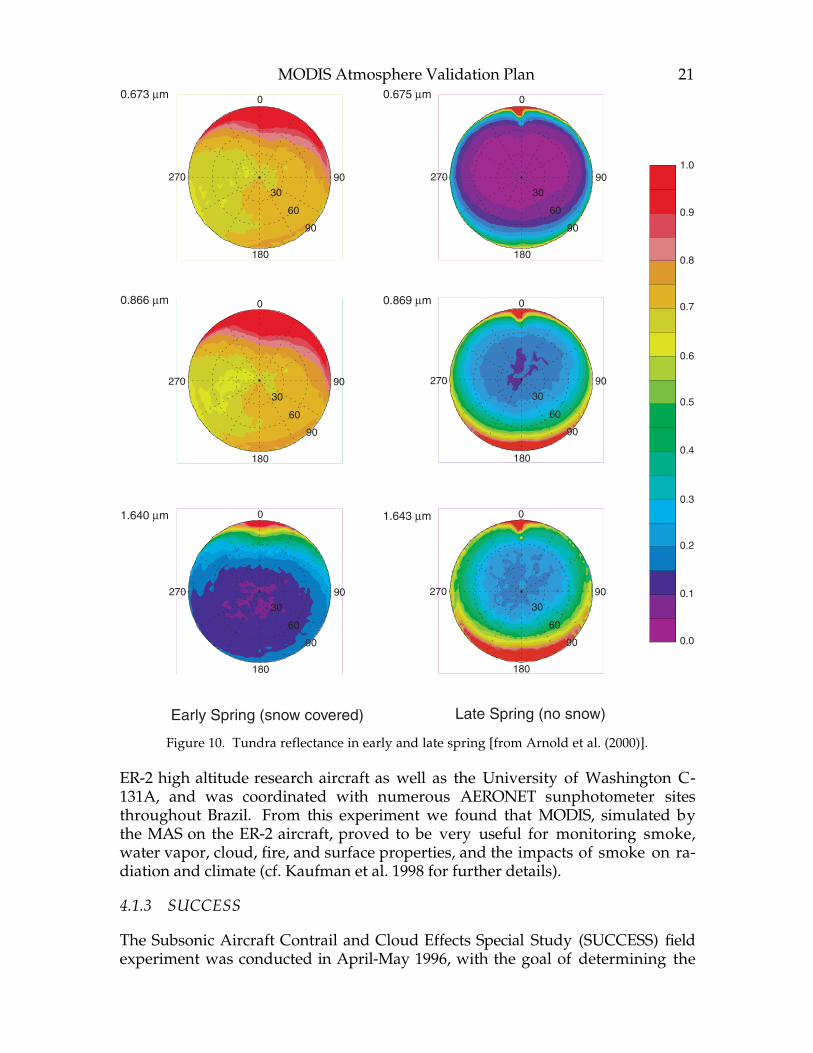
In addition, numerous data sets obtained with the CAR of the internal scatteredradiation field in smoke (Kuwait oil fires), clouds (FIRE marine stratocumulusexperiment, ARMCAS), and many additional measurements of the bidirectionalreflectance function of natural surfaces such as tundra, sea ice, oceans, smoke,cerrado, rainforest, desert, and the Great Dismal Swamp, add immeasurably to adata set on the surface reflectance characteristics of natural surfaces. The analy-ses of these data sets are being conducted by Michael King, Si-Chee Tsay, TomArnold, Peter Soulen, and Jason Li. Examples of BRDF measurements thus farobtained can be found in King (1992), Tsay et al. (1998), Curry et al. (2000),Soulen et al. (2000), and Arnold et al. (2000). An example of BRDF measurementsobtained over tundra in early spring (subfreezing) conditions and late spring(melting) conditions can be found in Fig. 7 (for three CAR bands). Spectral al-bedo has also been computed for each BRDF case and compared to the nadir re-flectance.
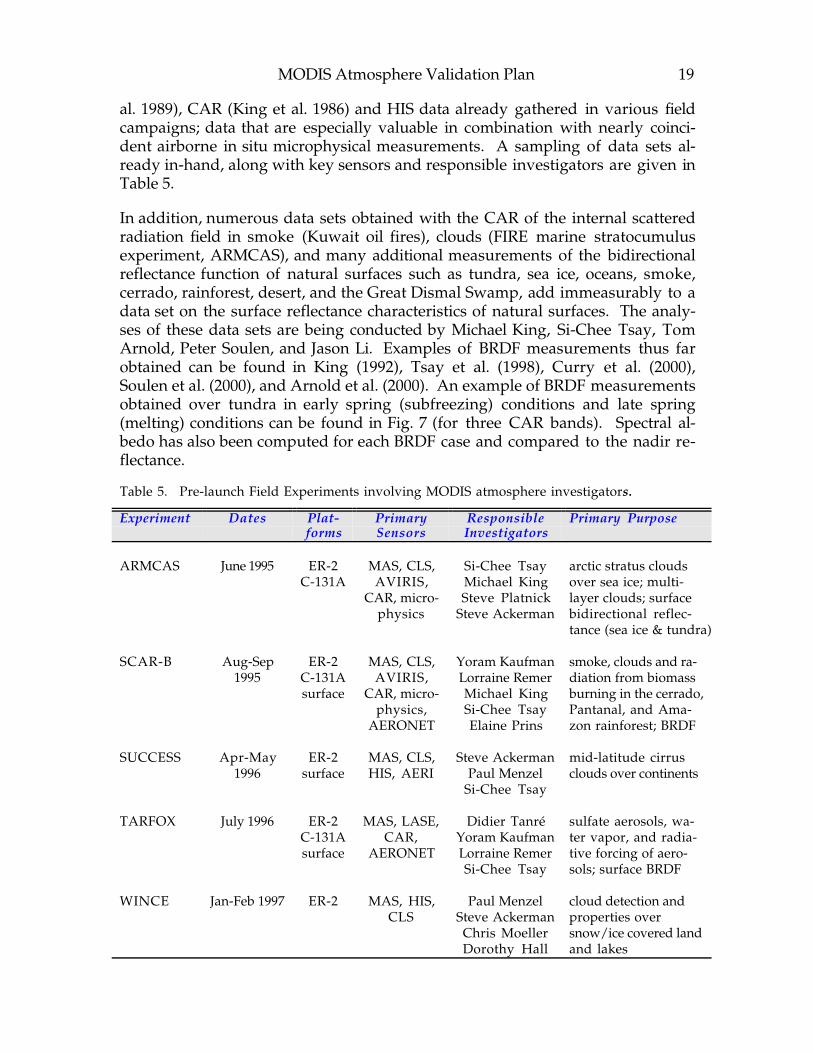
Table 5. Pre-launch Field Experiments involving MODIS atmosphere investigators.
Experiment Dates Plat-forms
PrimarySensors
ResponsibleInvestigators
Primary Purpose
ARMCAS June 1995 ER-2C-131A
MAS, CLS,AVIRIS,
CAR, micro-physics
Si-Chee TsayMichael KingSteve Platnick
Steve Ackerman
arctic stratus cloudsover sea ice; multi-layer clouds; surfacebidirectional reflec-tance (sea ice & tundra)
SCAR-B Aug-Sep1995
ER-2C-131Asurface
MAS, CLS,AVIRIS,
CAR, micro-physics,
AERONET
Yoram KaufmanLorraine RemerMichael KingSi-Chee TsayElaine Prins
smoke, clouds and ra-diation from biomassburning in the cerrado,Pantanal, and Ama-zon rainforest; BRDF
SUCCESS Apr-May1996
ER-2surface
MAS, CLS,HIS, AERI
Steve AckermanPaul Menzel
Si-Chee Tsay
mid-latitude cirrusclouds over continents
TARFOX July 1996 ER-2C-131Asurface
MAS, LASE,CAR,
AERONET
Didier TanréYoram KaufmanLorraine RemerSi-Chee Tsay
sulfate aerosols, wa-ter vapor, and radia-tive forcing of aero-sols; surface BRDF
WINCE Jan-Feb 1997 ER-2 MAS, HIS,CLS
Paul MenzelSteve AckermanChris MoellerDorothy Hall
cloud detection andproperties oversnow/ice covered landand lakes
MODIS Atmosphere Validation Plan 20
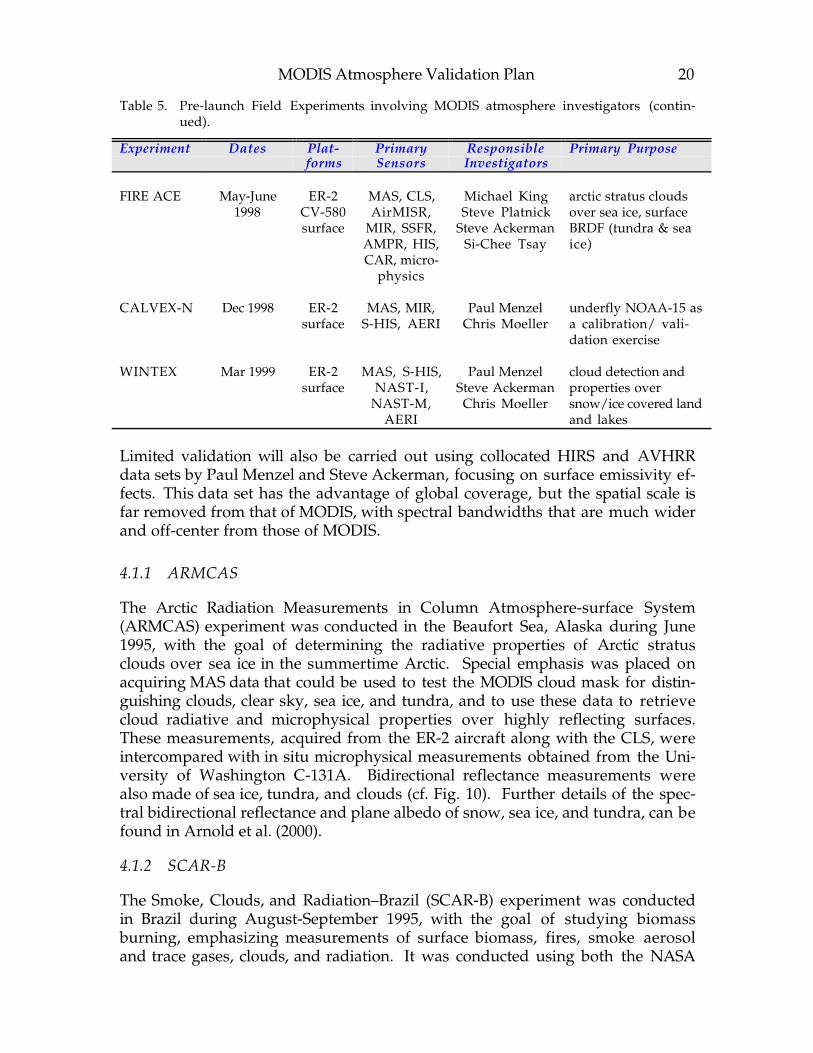
Table 5. Pre-launch Field Experiments involving MODIS atmosphere investigators (contin-ued).
Experiment Dates Plat-forms
PrimarySensors
ResponsibleInvestigators
Primary Purpose
FIRE ACE May-June1998
ER-2CV-580surface
MAS, CLS,AirMISR,
MIR, SSFR,AMPR, HIS,CAR, micro-
physics
Michael KingSteve Platnick
Steve AckermanSi-Chee Tsay
arctic stratus cloudsover sea ice, surfaceBRDF (tundra & seaice)
CALVEX-N Dec 1998 ER-2surface
MAS, MIR,S-HIS, AERI
Paul MenzelChris Moeller
underfly NOAA-15 asa calibration/ vali-dation exercise
WINTEX Mar 1999 ER-2surface
MAS, S-HIS,NAST-I,
NAST-M,AERI
Paul MenzelSteve AckermanChris Moeller
cloud detection andproperties oversnow/ice covered landand lakes
Limited validation will also be carried out using collocated HIRS and AVHRRdata sets by Paul Menzel and Steve Ackerman, focusing on surface emissivity ef-fects. This data set has the advantage of global coverage, but the spatial scale isfar removed from that of MODIS, with spectral bandwidths that are much widerand off-center from those of MODIS.
4.1.1 ARMCAS
The Arctic Radiation Measurements in Column Atmosphere-surface System(ARMCAS) experiment was conducted in the Beaufort Sea, Alaska during June1995, with the goal of determining the radiative properties of Arctic stratusclouds over sea ice in the summertime Arctic. Special emphasis was placed onacquiring MAS data that could be used to test the MODIS cloud mask for distin-guishing clouds, clear sky, sea ice, and tundra, and to use these data to retrievecloud radiative and microphysical properties over highly reflecting surfaces.These measurements, acquired from the ER-2 aircraft along with the CLS, wereintercompared with in situ microphysical measurements obtained from the Uni-versity of Washington C-131A. Bidirectional reflectance measurements werealso made of sea ice, tundra, and clouds (cf. Fig. 10). Further details of the spec-tral bidirectional reflectance and plane albedo of snow, sea ice, and tundra, can befound in Arnold et al. (2000).
4.1.2 SCAR-B
The Smoke, Clouds, and Radiation–Brazil (SCAR-B) experiment was conductedin Brazil during August-September 1995, with the goal of studying biomassburning, emphasizing measurements of surface biomass, fires, smoke aerosoland trace gases, clouds, and radiation. It was conducted using both the NASA
MODIS Atmosphere Validation Plan 21
ER-2 high altitude research aircraft as well as the University of Washington C-131A, and was coordinated with numerous AERONET sunphotometer sitesthroughout Brazil. From this experiment we found that MODIS, simulated bythe MAS on the ER-2 aircraft, proved to be very useful for monitoring smoke,water vapor, cloud, fire, and surface properties, and the impacts of smoke on ra-diation and climate (cf. Kaufman et al. 1998 for further details).
4.1.3 SUCCESS
The Subsonic Aircraft Contrail and Cloud Effects Special Study (SUCCESS) fieldexperiment was conducted in April-May 1996, with the goal of determining the
1.0
0.9
0.8
0.0
0.1
0.2
0.3
0.4
0.5
0.6
0.70
30
60
90
180
270 90
0.869 µm0
30
60
90
180
270 90
0.866 µm
Early Spring (snow covered) Late Spring (no snow)
1.640 µm 0
30
60
90
180
270 90
0
30
60
90
180
270 90
0.673 µm 0.675 µm 0
30
60
90
180
270 90
1.643 µm 0
30
60
90
180
270 90
Figure 10. Tundra reflectance in early and late spring [from Arnold et al. (2000)].
MODIS Atmosphere Validation Plan 22
radiative properties of cirrus contrails, and of contrasting them with naturallyoccurring cirrus. To assess the radiative impact of these clouds required a well-calibrated set of radiation measurements and “ground (or in situ) truth” obser-vations. We acquired MAS and HIS multispectral observations along with CLScloud height measurements from the NASA ER-2 aircraft by coordinating overflights of the ER-2 with in situ aircraft and ground based measurements. TheMAS and HIS measurements were employed to address the very important rela-tionship between cirrus radiative properties and the thermodynamic environ-ment (atmospheric temperature and moisture conditions) wherein cirrus cloudsform and are maintained. The HIS provided accurate measurements of thethermodynamical properties supporting the cirrus life cycle and the MAS meas-ured the cirrus areal extent and radiative properties. Additional emphasis wasplaced on developing and validating methods of detecting upper troposphericclouds and defining their areal extent with infrared (e.g., 13.9 µm) and near infra-red (e.g., 1.88 µm) channels; these being similar to the MODIS channels andhence the MAS cirrus detection, thereby having direct relevance to the MODIScloud mask algorithm. The CLS data were used to validate MAS upper tropo-spheric clouds.
Several studies have demonstrated the sensitivity of spectral radiances to cloudparticle size and shape distributions. The MAS and HIS instruments provide ac-curate spectral measurements that can be used to assess differences in the radia-tive signatures between contrails and naturally occurring cirrus clouds. One dif-ficulty in assessing the impact of high-altitude subsonic aircraft on cirrus forma-tion and modification is the natural variability of the atmosphere and the poten-tially small signal of the radiative perturbation. Variations in the atmosphericspectral properties for contrail and natural cirrus conditions will be assessed withthe two ER-2 instruments in conjunction with in situ and ground-based observa-tions.
4.1.4 TARFOX
The Tropospheric Aerosol Radiative Forcing Observational Experiment(TARFOX, 10-31 July 1996) campaign measured atmospheric aerosols emanatingfrom industrial centers in North America transported over the Atlantic Ocean.Their extent, radiative properties, and transport mechanisms were studied fromsatellite, aircraft, ship, and ground-based sensors. The MAS on the NASA ER-2aircraft and the GOES Imager on GOES-8 were the primary sensors of interest tothe atmosphere group (Didier Tanré, Yoram Kaufman, Paul Menzel). The moni-toring effort focused on the corridor extending from Wallops Island, Virginia toBermuda. In situ aircraft (UK Meteorological Office C-130H, University ofWashington Convair C-131A, Naval Postgraduate School Pelican, and NASA ER-2), ground measurements (Lidar, AEROCE, AERONET), and satellite observa-tions (AVHRR, ATSR-2, GOES) were used to measure the direct effects of tropo-spheric aerosols on regional radiation budgets of the cloud-free ocean-atmosphere system, while simultaneously measuring the chemical, physical, and
MODIS Atmosphere Validation Plan 23
optical properties of the predominant aerosols. The suite of measurementsmade during TARFOX and subsequent collaborative analyses will provide a bet-ter understanding of the impact of these aerosols over the US eastern seaboardand western Atlantic Ocean and will be used to assess the degree of closure (con-sistency) between aerosol radiative forcing calculations and various measure-ments of aerosol properties and other satellite-derived parameters. This studyprovided a means to validate current and future satellite remote sensing meth-ods and products (aerosol optical thickness τa, aerosol size distribution nc(r), andearth radiation budgets), as demonstrated by Tanré et al. (1999). Observationswere also acquired of the spectral bidirectional reflectance of the Atlantic Oceanand Great Dismal Swamp, as reported in Soulen et al. (2000).
4.1.5 WINCE and WINTEX
The Winter Cloud Experiment (WINCE; January-February 1997) and Winter Ex-periment (WINTEX; March 1999) investigated the difficulties in detecting cloudsand estimating their properties in winter conditions (Steve Ackerman, Paul Men-zel, Chris Moeller). These field campaigns were conducted from Madison, WI.During WINCE, cirrus and thin clouds over frozen tundra and lakes in thenorthern US and Canada were measured with the MAS, HIS, and CLS, alongwith the GOES-8, AVHRR, and surface AERI measurements. One of the missionsinvestigated the product stability under nighttime conditions (infrared only). Inaddition, two ground sites in New England measured snow and ice cover duringMAS/HIS overflights in clear sky condition (in collaboration with Dorothy Halland George Riggs working on the MODIS snow/ice product). Examples of theMAS cloud mask were distributed to science team members so that they can de-termine its effect on their MODIS products.
During WINTEX, the ER-2 will be instrumented with MAS, S-HIS, NAST-I,NAST-M, and a camera system (RC-10), which will overfly ground-based in-strumentation that includes uplooking lidar, AERI, and radiosondes. DuringWINTEX, the ER-2 will fly from six to eight missions over snow, bare ground,and vegetated surfaces with and without partial cloud cover. Day and nightflights will be conducted. Plans also include collecting cloud microphysical pro-files (dropped from aircraft) to supplement the ER-2 measurements of clouds.The ER-2 measurements will be used to continue assessment of the MODIS cloudmask and cloud top properties as well as evaluate absolute calibration of the in-terferometers (S-HIS, NAST-I); S-HIS and NAST-I will be used to validate MODISIR calibration after the Terra launch in July 1999. WINTEX missions will be flownin southern Canada (winter scenes), over the Great Lakes (snow and bareground), and around the midwest (spring greening phase) including the SGPCART site (calibration validation).
4.1.6 FIRE Arctic Cloud Experiment
FIRE, the First ISCCP (International Satellite Cloud Climatology Project) Re-
MODIS Atmosphere Validation Plan 24
gional Experiment, has previously conducted four successful field missions fo-cused on cloud remote sensing and modeling studies as they relate to climate.FIRE Phase III (Arctic Cloud Experiment, or ACE) was conducted in the Arcticbetween April and July 1998, with the component of interest to the MODIS sci-ence team being confined to a 5 week period consisting of the University ofWashington CV-580 along with a 3 week period of high-altitude ER-2 overflights(cf. Curry et al. 2000 for further details). The CV-580 was equipped with an ex-tensive set of PMS cloud microphysics probes, a Gerber PVM-100A liquid watercontent and effective radius probe, Johnson-Williams and King hot wire probes,a newly developed Gerber cloud integrating nephelometer (g-meter) for meas-uring extinction coefficient and asymmetry factor, thermodynamic state variablemeasurements, and a SPEC Inc. Cloud Particle Imager (CPI). In addition, the ER-2 participated as the upper level aircraft from May 18-June 6, with the MAS, CLS,HIS, a multispectral along-track scanning radiometer (AirMISR), a MicrowaveImaging Radiometer (MIR), a Solar Spectral Flux Radiometer (SSFR), and an Ad-vanced Microwave Precipitation Radiometer (AMPR). All of these ER-2 sensorsare of interest to Goddard Space Flight Center (Michael King, Si-Chee Tsay,Steve Platnick), as well as the CAR on the CV-580 and numerous in situ micro-physics probes that will be invaluable in accessing the accuracy of cloud retrievalsof the microphysical and radiative properties of Arctic stratus clouds over abright (sea ice) surface. This valuable data set is being used by the University ofWisconsin group for testing the cloud mask algorithm for readiness at-launch.The suite of measurements made during FIRE ACE and subsequent collaborativeanalyses will provide a means to validate current and future satellite remotesensing methods and products (cloud optical thickness τc, effective radius re, sin-gle scattering albedo ω0), the cloud mask, and precipitable water.
4.1.7 CALVEX-N
CALVEX-N, the Calibration/Validation Experiment – NOAA-15, was an earlyeffort in a series of ER-2 activities focused on validating infrared band calibrationof MODIS. CALVEX-N, conducted in December 1998 from Dryden Flight Re-search Center (DFRC), used NOAA-15 underflights to exercise the instrumenta-tion and strategies that will be used to validate MODIS IR calibration duringWISC-T2000 (first effort underflying MODIS on Terra in March 2000). The ER-2instrumentation included MAS, S-HIS, MIR, and a high-resolution video camerasystem. During the three NOAA-15 missions (December 18, 21, and 22), the ER-2flew along the sub-orbital track of NOAA-15 collecting scenes of clear ocean anduniform low stratus cloud. To characterize the atmosphere, special radiosondelaunches along the southern California coast were coordinated with the ER-2flights. A ground-based AERI instrument capable of upward and downwardviewing was deployed on Rogers dry lakebed at Edwards AFB for comparisonswith the ER-2 instrumentation. The MAS and S-HIS data sets are highly com-plementary. The high spectral resolution S-HIS provides accurately calibrated IRradiances for each nominal 2 km spatial resolution footprint; MAS provides thehigh spatial resolution data in the visible through thermal infrared. Through this
MODIS Atmosphere Validation Plan 25
synergism, data to characterize spatial (MAS) and spectral (S-HIS) dependenciesof MODIS calibration were collected. The data collection phase of CALVEX-Nwas successfully completed. Of particular interest, the MIR 183 GHz radianceswill be compared to the AMSU-B 183 GHz observations to gain insight intoAMSU-B absolute calibration and the calibration dependence on scan angle. Fi-nally, and perhaps most importantly, the CALVEX-N data analysis will be usedto expose any weaknesses in the instrumentation or data collection procedures,and will provide insight into how one might address special MODIS IR calibra-tion challenges (e.g. PC band crosstalk correction) during WISC-T2000 activities.
4.2 Operational Surface Networks
Data from various surface observing networks are incorporated into pre-launchvalidation activities, as well as selected data from the ARM site. These are col-lected and archived daily at the University of Wisconsin on the Man-computerInteractive Data Access System (McIDAS), which is connected to Paul Menzel’sScience Computing Facility (SCF). In addition, data from the AERONET are ar-chived at Goddard Space Flight Center by Brent Holben and are invaluable tothe aerosol pre-launch validation activities of Yoram Kaufman and Didier Tanré.
4.3 Existing Satellite Data
All of the MODIS pre-launch studies at the University of Wisconsin (Paul Menzel)rely on AVHRR, HIRS, and GOES data for field experiment support and valida-tion. These data are archived at the University of Wisconsin and accessible onMcIDAS. Additional AVHRR data collected in support of MAST, ARMCAS, andvarious other pre-launch validation activities are available to Goddard SpaceFlight Center through the archive appropriate to that experiment (Langley Re-search Center DAAC, Goddard Space Flight Center DAAC, or the Naval Post-graduate School). Finally, pre-launch activities that are coordinated with Land-sat-TM data sets are archived at Goddard by Yoram Kaufman.
4.4 Instrument Development
New improvements/additions to the SMART suite of surface radiation and re-mote sensing instruments are currently under development:
� a sun-sky-surface sensor (S4) head to replace the Cimel sunphotometer,consisting of 14 spectral channels (without filter-wheel) ranging from 0.30to 2.5 µm (including linear polarization) and using Si (UV-Vis-NIR) andInGaAs (SWIR, not cooled) for detectors
� collocated measurements of surface moisture and temperature with SMiRbrightness temperature (22.8. 23.8 and 37.0 GHz) of the surface aresought for characterizing various types of surface emissivity. A futureaddition of tunable frequencies at 60 GHz (oxygen resonance line) for re-
MODIS Atmosphere Validation Plan 26
trieving temperature profiles is also planned
� an upgrade of solar power for passive SMART instruments and largerdata logging memory are planned
The S4 project is scheduled to produce prototypes for testing in the SAFARI 2000campaign in August-September 2000.
5.0 Post-launch Activities
The validation strategies and experience gained from pre-launch activities willguide the activity after launch. The pre-launch field activities have been usedmost effectively for testing MODIS-like algorithms in a wide variety of atmos-pheric and environmental conditions. Post-launch validation will apply these les-sons to future field work and to the intercomparisons with actual MODIS data,both from Terra and Aqua (2001 and beyond).
5.1 Field Campaigns
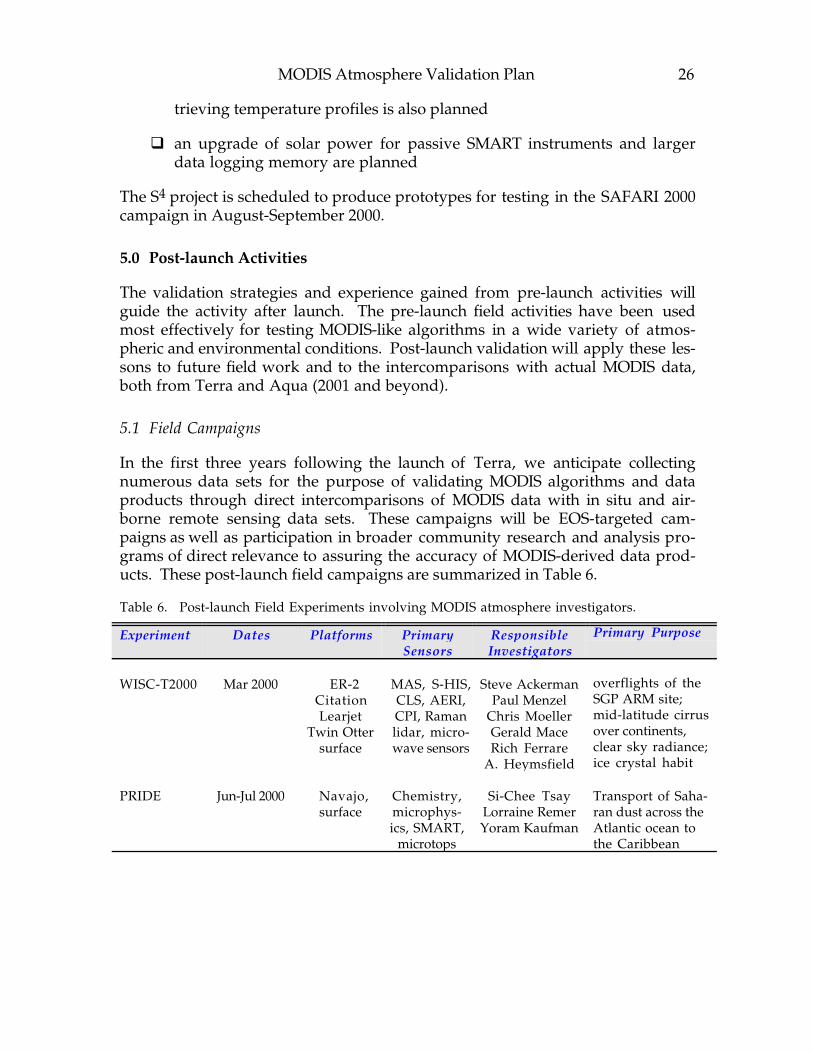
In the first three years following the launch of Terra, we anticipate collectingnumerous data sets for the purpose of validating MODIS algorithms and dataproducts through direct intercomparisons of MODIS data with in situ and air-borne remote sensing data sets. These campaigns will be EOS-targeted cam-paigns as well as participation in broader community research and analysis pro-grams of direct relevance to assuring the accuracy of MODIS-derived data prod-ucts. These post-launch field campaigns are summarized in Table 6.
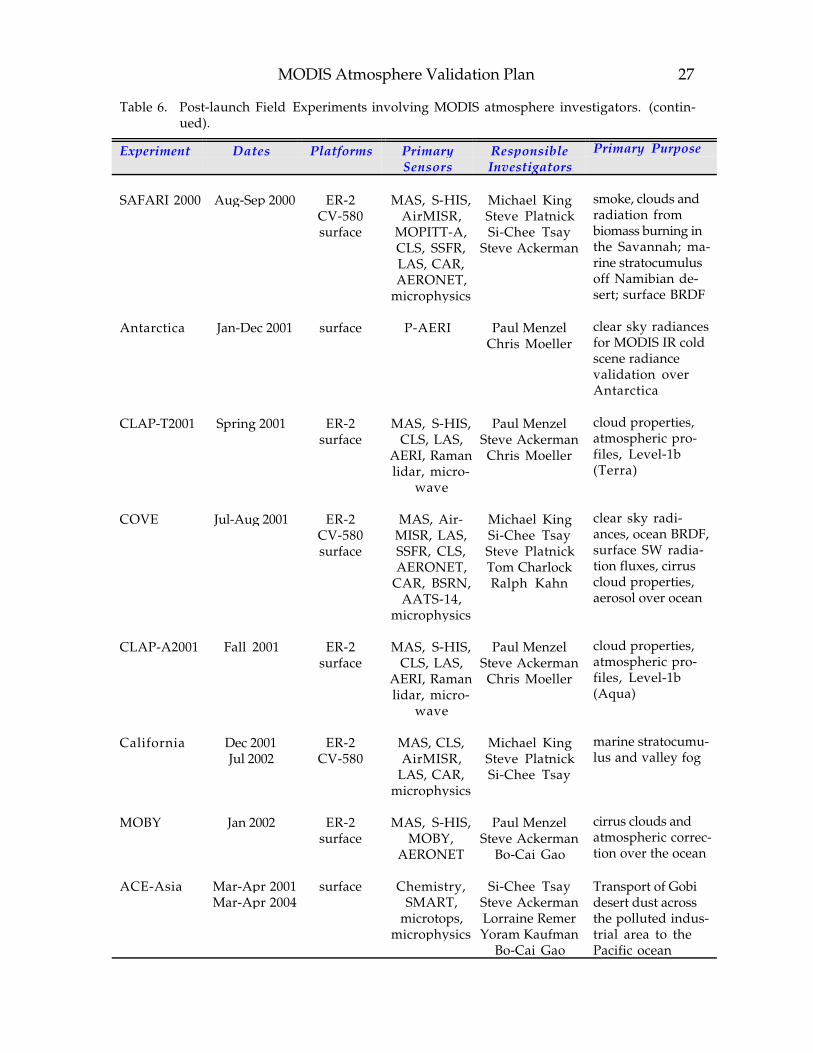
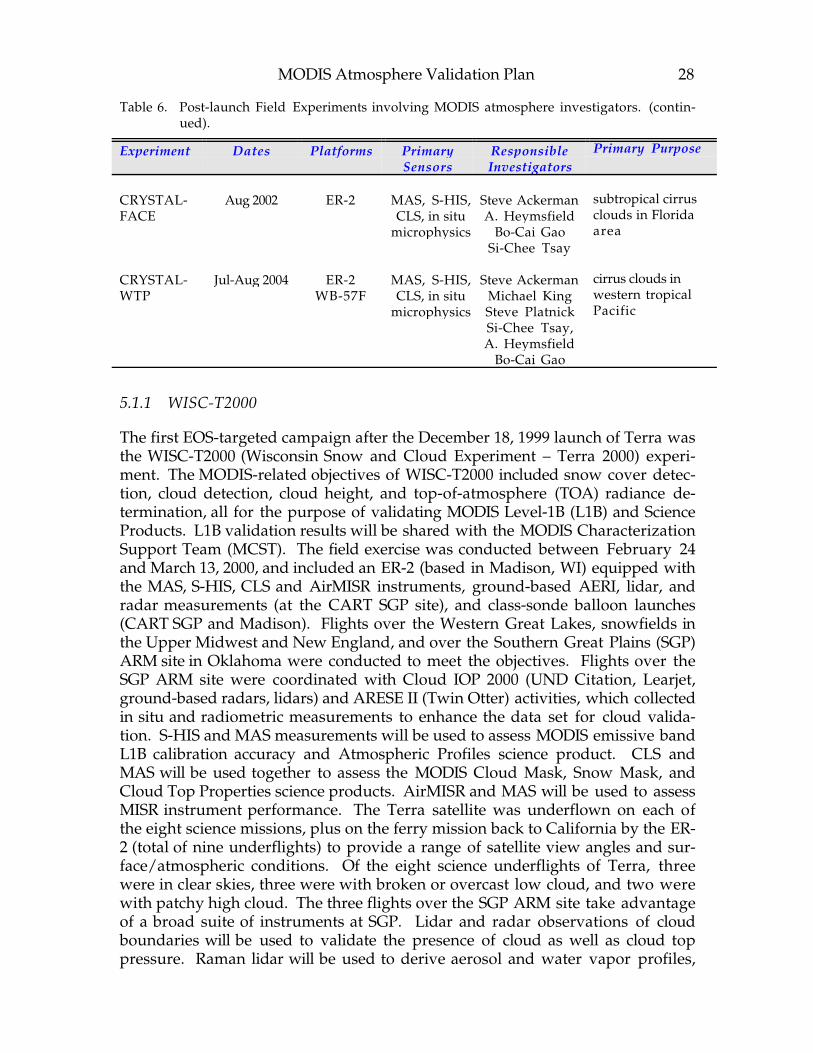
Table 6. Post-launch Field Experiments involving MODIS atmosphere investigators.
Experiment Dates Platforms PrimarySensors
ResponsibleInvestigators
Primary Purpose
WISC-T2000 Mar 2000 ER-2CitationLearjet
Twin Ottersurface
MAS, S-HIS,CLS, AERI,CPI, Ramanlidar, micro-wave sensors
Steve AckermanPaul Menzel
Chris MoellerGerald MaceRich Ferrare
A. Heymsfield
overflights of theSGP ARM site;mid-latitude cirrusover continents,clear sky radiance;ice crystal habit
PRIDE Jun-Jul 2000 Navajo,surface
Chemistry,microphys-ics, SMART,
microtops
Si-Chee TsayLorraine RemerYoram Kaufman
Transport of Saha-ran dust across theAtlantic ocean tothe Caribbean
MODIS Atmosphere Validation Plan 27
Table 6. Post-launch Field Experiments involving MODIS atmosphere investigators. (contin-ued).
Experiment Dates Platforms PrimarySensors
ResponsibleInvestigators
Primary Purpose
SAFARI 2000 Aug-Sep 2000 ER-2CV-580surface
MAS, S-HIS,AirMISR,
MOPITT-A,CLS, SSFR,LAS, CAR,AERONET,
microphysics
Michael KingSteve PlatnickSi-Chee Tsay
Steve Ackerman
smoke, clouds andradiation frombiomass burning inthe Savannah; ma-rine stratocumulusoff Namibian de-sert; surface BRDF
Antarctica Jan-Dec 2001 surface P-AERI Paul MenzelChris Moeller
clear sky radiancesfor MODIS IR coldscene radiancevalidation overAntarctica
CLAP-T2001 Spring 2001 ER-2surface
MAS, S-HIS,CLS, LAS,
AERI, Ramanlidar, micro-
wave
Paul MenzelSteve AckermanChris Moeller
cloud properties,atmospheric pro-files, Level-1b(Terra)
COVE Jul-Aug 2001 ER-2CV-580surface
MAS, Air-MISR, LAS,SSFR, CLS,AERONET,
CAR, BSRN,AATS-14,
microphysics
Michael KingSi-Chee TsaySteve PlatnickTom CharlockRalph Kahn
clear sky radi-ances, ocean BRDF,surface SW radia-tion fluxes, cirruscloud properties,aerosol over ocean
CLAP-A2001 Fall 2001 ER-2surface
MAS, S-HIS,CLS, LAS,
AERI, Ramanlidar, micro-
wave
Paul MenzelSteve AckermanChris Moeller
cloud properties,atmospheric pro-files, Level-1b(Aqua)
California Dec 2001Jul 2002
ER-2CV-580
MAS, CLS,AirMISR,
LAS, CAR,microphysics
Michael KingSteve PlatnickSi-Chee Tsay
marine stratocumu-lus and valley fog
MOBY Jan 2002 ER-2surface
MAS, S-HIS,MOBY,
AERONET
Paul MenzelSteve Ackerman
Bo-Cai Gao
cirrus clouds andatmospheric correc-tion over the ocean
ACE-Asia Mar-Apr 2001Mar-Apr 2004
surface Chemistry,SMART,
microtops,microphysics
Si-Chee TsaySteve AckermanLorraine RemerYoram Kaufman
Bo-Cai Gao
Transport of Gobidesert dust acrossthe polluted indus-trial area to thePacific ocean
MODIS Atmosphere Validation Plan 28
Table 6. Post-launch Field Experiments involving MODIS atmosphere investigators. (contin-ued).
Experiment Dates Platforms PrimarySensors
ResponsibleInvestigators
Primary Purpose
CRYSTAL-FACE
Aug 2002 ER-2 MAS, S-HIS,CLS, in situ
microphysics
Steve AckermanA. Heymsfield
Bo-Cai GaoSi-Chee Tsay
subtropical cirrusclouds in Floridaarea
CRYSTAL-WTP
Jul-Aug 2004 ER-2WB-57F
MAS, S-HIS,CLS, in situ
microphysics
Steve AckermanMichael KingSteve PlatnickSi-Chee Tsay,A. Heymsfield
Bo-Cai Gao
cirrus clouds inwestern tropicalPacific
5.1.1 WISC-T2000
The first EOS-targeted campaign after the December 18, 1999 launch of Terra wasthe WISC-T2000 (Wisconsin Snow and Cloud Experiment – Terra 2000) experi-ment. The MODIS-related objectives of WISC-T2000 included snow cover detec-tion, cloud detection, cloud height, and top-of-atmosphere (TOA) radiance de-termination, all for the purpose of validating MODIS Level-1B (L1B) and ScienceProducts. L1B validation results will be shared with the MODIS CharacterizationSupport Team (MCST). The field exercise was conducted between February 24and March 13, 2000, and included an ER-2 (based in Madison, WI) equipped withthe MAS, S-HIS, CLS and AirMISR instruments, ground-based AERI, lidar, andradar measurements (at the CART SGP site), and class-sonde balloon launches(CART SGP and Madison). Flights over the Western Great Lakes, snowfields inthe Upper Midwest and New England, and over the Southern Great Plains (SGP)ARM site in Oklahoma were conducted to meet the objectives. Flights over theSGP ARM site were coordinated with Cloud IOP 2000 (UND Citation, Learjet,ground-based radars, lidars) and ARESE II (Twin Otter) activities, which collectedin situ and radiometric measurements to enhance the data set for cloud valida-tion. S-HIS and MAS measurements will be used to assess MODIS emissive bandL1B calibration accuracy and Atmospheric Profiles science product. CLS andMAS will be used together to assess the MODIS Cloud Mask, Snow Mask, andCloud Top Properties science products. AirMISR and MAS will be used to assessMISR instrument performance. The Terra satellite was underflown on each ofthe eight science missions, plus on the ferry mission back to California by the ER-2 (total of nine underflights) to provide a range of satellite view angles and sur-face/atmospheric conditions. Of the eight science underflights of Terra, threewere in clear skies, three were with broken or overcast low cloud, and two werewith patchy high cloud. The three flights over the SGP ARM site take advantageof a broad suite of instruments at SGP. Lidar and radar observations of cloudboundaries will be used to validate the presence of cloud as well as cloud toppressure. Raman lidar will be used to derive aerosol and water vapor profiles,
MODIS Atmosphere Validation Plan 29
precipitable water vapor, and aerosol optical thickness under clear sky condi-tions. Class-sonde and AERI measurements will be used to define atmospherictemperature and moisture profiles. Whole sky imagers can be compared to ER-2and Terra observations of cloud amount. Finally, optical depth measurementsderived from lidar will aid in specifying the limit of thin cirrus detection in thecloud mask algorithm.
5.1.2 PRIDE
The field experiment on and near the island of Puerto Rico, known as PRIDE(Puerto Rico Dust Experiment), was designed to measure the properties of Saha-ran dust transported across the Atlantic Ocean to the Caribbean. PRIDE, con-ducted between June 26 and July 24, 2000, was a collaborative endeavor with theOffice of Naval Research and the University of Miami. It involved a twin enginePiper Navajo aircraft carrying the Ames Airborne Tracking Sunphotometer(AATS), SSFR, and microphysics probes (PCASP and FSSP), a well-equippedground-based site containing the SMART radiometer and lidar system, and theUniversity of Puerto Rico oceanographic research vessel that included both sun-photometer measurements of the aerosol and bio-optical observations of seawater and chlorophyll.
In the summer months moderate quantities of desert dust are observed in theCaribbean. AVHRR and AERONET typically report mid-visible aerosol opticalthicknesses of 0.2-0.7 in July. Puerto Rico is the first significant landfall for thedust travelling across the ocean from Africa. Dust arriving on the eastern end ofthe island should not be affected by other types of man made aerosol pollutants.This will minimize complications in the analysis.
We will determine the extent to which properties of dust particles and the spec-tral surface reflectance of the ocean need to be known before remote sensingsystems can accurately determine optical thickness and radiative flux. Currentlyour knowledge of transported Saharan dust is extremely limited. Even basiccharacteristics of gross physical properties such as horizontal and vertical extentand horizontal homogeneity have never been measured on the western side ofthe Atlantic. We also have a poor understanding of dust optical, microphysicaland chemical properties. Dust single scattering albedo and nonsphericity are es-pecially significant parameters.
Our main purpose in PRIDE was to make simultaneous aerosol optical thicknessand precipitable water vapor measurements from the SMART, oceanographicresearch vessel, and low flying aircraft at the time of the MODIS overpass, andthen to compare these ground-based observations with the MODIS retrievalsover both land and ocean. PRIDE gives us the opportunity to test the MODISocean aerosol optical thickness algorithms. The inclusion of flux measurementsallows for the determination of dust aerosol radiative flux in addition to meas-urements of loading and optical thickness. We intend to use the data acquired inPRIDE to develop new, experimental, MODIS remote sensing algorithms in-
MODIS Atmosphere Validation Plan 30
cluding retrieval of dust single scattering albedo.
5.1.3 SAFARI 2000
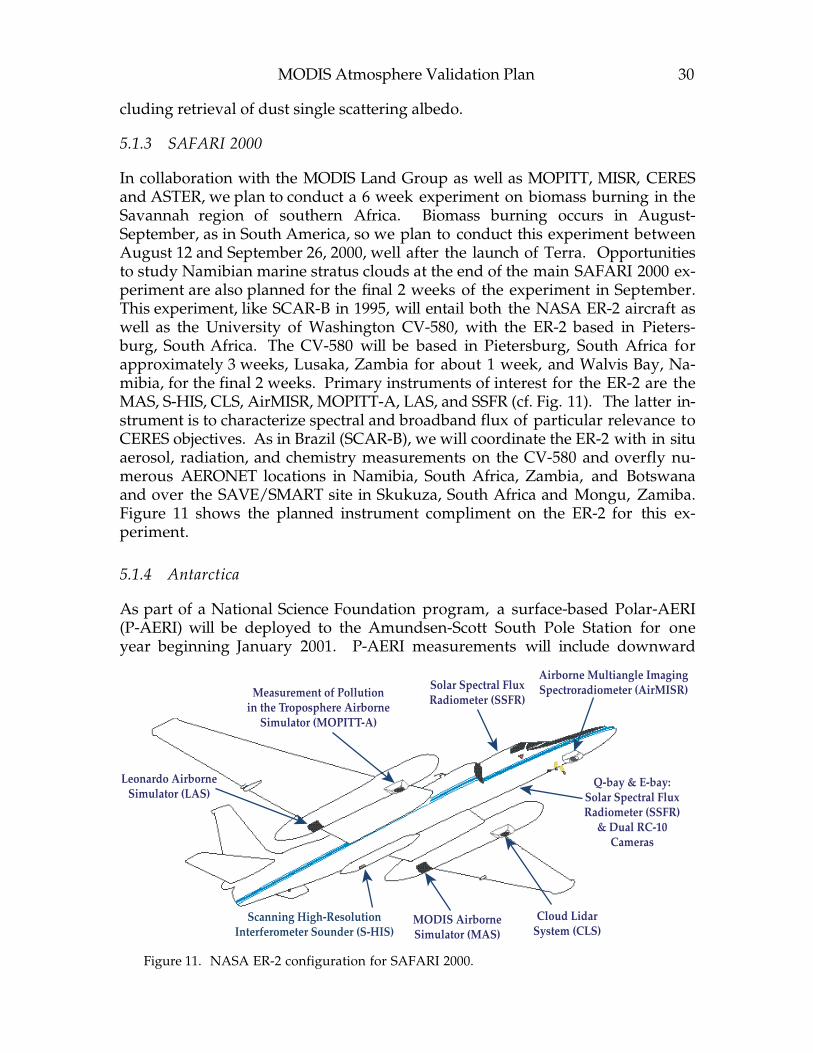
In collaboration with the MODIS Land Group as well as MOPITT, MISR, CERESand ASTER, we plan to conduct a 6 week experiment on biomass burning in theSavannah region of southern Africa. Biomass burning occurs in August-September, as in South America, so we plan to conduct this experiment betweenAugust 12 and September 26, 2000, well after the launch of Terra. Opportunitiesto study Namibian marine stratus clouds at the end of the main SAFARI 2000 ex-periment are also planned for the final 2 weeks of the experiment in September.This experiment, like SCAR-B in 1995, will entail both the NASA ER-2 aircraft aswell as the University of Washington CV-580, with the ER-2 based in Pieters-burg, South Africa. The CV-580 will be based in Pietersburg, South Africa forapproximately 3 weeks, Lusaka, Zambia for about 1 week, and Walvis Bay, Na-mibia, for the final 2 weeks. Primary instruments of interest for the ER-2 are theMAS, S-HIS, CLS, AirMISR, MOPITT-A, LAS, and SSFR (cf. Fig. 11). The latter in-strument is to characterize spectral and broadband flux of particular relevance toCERES objectives. As in Brazil (SCAR-B), we will coordinate the ER-2 with in situaerosol, radiation, and chemistry measurements on the CV-580 and overfly nu-merous AERONET locations in Namibia, South Africa, Zambia, and Botswanaand over the SAVE/SMART site in Skukuza, South Africa and Mongu, Zamiba.Figure 11 shows the planned instrument compliment on the ER-2 for this ex-periment.
5.1.4 Antarctica
As part of a National Science Foundation program, a surface-based Polar-AERI(P-AERI) will be deployed to the Amundsen-Scott South Pole Station for oneyear beginning January 2001. P-AERI measurements will include downward
Solar Spectral Flux Radiometer (SSFR)
Airborne Multiangle Imaging Spectroradiometer (AirMISR)
Q-bay & E-bay: Solar Spectral Flux Radiometer (SSFR)
& Dual RC-10 Cameras
Measurement of Pollution in the Troposphere Airborne
Simulator (MOPITT-A)
Leonardo Airborne Simulator (LAS)
Scanning High-Resolution Interferometer Sounder (S-HIS)
MODIS Airborne Simulator (MAS)
Cloud Lidar System (CLS)
Figure 11. NASA ER-2 configuration for SAFARI 2000.
MODIS Atmosphere Validation Plan 31
looking surface measurements from a platform about 5 meters above the snowsurface as well as uplooking measurements to document the clear sky downwel-ling radiance. During MODIS overpasses the downward-looking and upward-looking measurements can be collected for the angular viewing geometry ofMODIS. Balloon launches will be used to complete the atmospheric characteriza-tion. These measurements are useful to evaluate MODIS (on both Terra andAqua) emissive band calibration accuracy at temperatures typical of cold clouds.Clear sky Antarctica top-of-atmosphere (TOA) brightness temperatures arecomparable to tropospheric cloud top temperatures in the mid-latitudes andtropics.
5.1.5 CLAP-T2001 and CLAP-A2001
The SGP ARM site and Gulf of Mexico are the targets of choice for the Cloudsand Atmospheric Profiles - Terra 2001 {CLAP-T2001) experiment slated forSpring 2001. The objectives of CLAP-T2001 are validation of MODIS cloud, at-mospheric properties, and emissive band L1B products. This activity is timed tooccur within about one year of MODIS first light, after the transfer from pre-launch to post-launch calibration has been completed. The ER-2 payload includesMAS, S-HIS, LAS, and CLS to provide calibration accuracy and thin cloud defini-tion. All flights (SGP ARM and Gulf of Mexico) will be coordinated with MODIS(on Terra) overpasses. Overflights of SGP CART will take advantage of ongoingground-based measurements (class-sonde, AERI, tower measurements of tem-perature and moisture, microwave moisture measurements, uplooking lidar andradar observations, whole sky imagers) for cloud and atmospheric profiles vali-dation. An ARM SCM is also tentatively scheduled for next spring in coordina-tion with the International H2O Project (IHOP). The Gulf of Mexico is an impor-tant uniform scene background for assessing MODIS emissive band performanceand characterization in the L1B algorithm (e.g., scan mirror performance, opticalcrosstalk, etc.). Thin single layer cloud will be sought for cloud top propertiesand cloud mask validation. Fine-tuning of cloud mask thresholds will resultfrom this validation activity. Clear sky profiles will be validated using the abun-dant atmospheric moisture and temperature characterization at the SGP CART.An important goal of CLAP-T2001 will be to measure atmospheric profiles undervarying atmospheric moisture content. The turbid coastal zone of Louisiana willbe overflown to assess the impact of in-water turbidity on the MODIS cloudmask.
The Cloud and Atmospheric Profiles - Aqua2001 {CLAP-A2001) experiment isdesigned very much like that of CLAP-T2001, except the focus is on the Aquasatellite with MODIS and AIRS onboard. The SGP ARM site and Gulf of Mexicoare the planned targets for the ER-2 flights. The ER-2 payload of MAS, S-HIS,LAS, and CLS provides accurate high spectral resolution emissive band calibra-tion and thin cloud definition for radiometric, cloud top property, and atmos-pheric profile validations. Overflights of SGP CART will take advantage of theexcellent atmospheric water vapor characterization provided by ground based
MODIS Atmosphere Validation Plan 32
instruments (class-sonde, AERI, tower measurements of temperature and mois-ture, microwave moisture measurements, radar) while uplooking lidar andwhole sky imagers contribute to cloud product validation. Clear sky flights overthe Gulf of Mexico provide a uniform background for MODIS and AIRS radio-metric evaluation; cloud validation over water will benefit from cirrus cloudscenes over the Gulf. Although CLAP-A2001 is focused on Aqua, Terra can alsobe underflown to assess synergism between Terra and Aqua.
5.1.6 COVE
The CERES Ocean Validation Experiment (COVE) is planned between July andAugust 2001, and its focus is on verifying cloud-free aerosol retrievals over anocean background. It is coordinated with both the CERES and MISR teams, andcenters on the Chesapeake Bay Lighthouse located about 25 km off the coast ofVirginia Beach, Virginia. The primary purpose of this CERES validation site is tocollect Baseline Surface Radiation Network (BSRN) measurements of downwel-ling shortwave radiation at the ocean surface, together with AERONET sunpho-tometer measurements and a micropulse lidar, all over as uniform and dark abackground as possible. This will allow careful discrimination of surface and at-mospheric radiation, and to assess the impact of clouds, aerosols, water vapor,and surface temperature on the radiation budget. CERES funds the ChesapeakeBay Lighthouse from its EOS validation funds. The focus of the COVE field cam-paign is to coordinate MODIS, CERES, and MISR observations of aerosol overthe ocean with coincident surface measurements from the Lighthouse and air-borne measurements from the NASA ER-2 and University of Washington CV-580 aircraft. The ER-2 payload of interest for this experiment is the MAS, Air-MISR, CLS, SSFR, and the recently developed LAS, which enables studies of theMODIS cloud mask, aerosol retrieval over ocean, and surface reflectance charac-terization. The CV-580 should contain both its standard in situ aerosol micro-physics (PCASP, FSSP, etc.) and chemistry measurements, and carry the CAR in-strument for bidirectional reflectance measurements over the ocean and nearbyland surfaces, and the SSFR and AATS-14 instruments from Ames Research Cen-ter for spectral flux and aerosol optical thickness measurements.
5.1.7 California Stratus and Valley Fog
Once the MODIS is in orbit and returning regular data, we envision two focusedperiods of ER-2 overflights, to be coordinated with the Terra orbit, in California(the first one over valley fog in the central valley of California in December 2001,and the second over marine stratocumulus clouds located over the ocean be-tween Monterey and San Diego in July 2002). These experiments would entailER-2 flights from home base in California (Dryden Flight Research Center), andwould consist, once again, of the MAS, AirMISR, LAS, and CLS, together withcoordinated underflights by the University of Washington CV-580 with its in situmicrophysics probes. This data set, of special interest to Goddard Space FlightCenter (Michael King, Steve Platnick, Si-Chee Tsay) would help to validate the
MODIS Atmosphere Validation Plan 33
cloud optical thickness and effective radius between MODIS and the smaller spa-tial resolution airborne sensors on the ER-2.
5.1.8 MOBY
The MOBY (Marine Optical Buoy) positioned near Lanai, Hawaii will be used inJanuary 2002 to validate MODIS sea surface temperature (SST) and VNIR waterleaving radiances. Emissive band L1B, cloud mask, and cloud top properties willalso be validated for cirrus over ocean. The cloud mask validation will be an im-portant component of validating SST. The effect of elevated water leaving radi-ances (caused by suspended materials or sub-aqueous bottom reflectance) on thecloud mask will be investigated. MOBY will validate these products for MODISon both the Terra and Aqua platforms.
5.1.9 ACE-Asia
The International Global Atmospheric Chemistry program has organized a se-ries of aerosol characterization experiments (ACE) to acquire data sets neededfor assessing aerosol effects in major regions of the globe. ACE-Asia is designedto study the compelling variability in spatial and temporal scale of both pollu-tion-derived and naturally-occurring aerosols, which often exist in high concen-trations over eastern Asia and along the rim of the western Pacific. The phase-Iof ACE-Asia will be conducted from March-April 2001 in the vicinity of the Gobidesert, east coast of China, Yellow Sea, and Japan, along the pathway of Kosa(severe events that blanket East Asia with yellow desert dust, peaked in theSpring season).
Although central Asia is one of the most important dust sources, its climatic im-pact is less well studied than that of Saharan dust. Asian dust typically originatesin desert areas far from polluted urban regions. During transport, dust layerscan interact with anthropogenic sulfate and soot aerosols from heavily pollutedurban areas. Added to the complex effects of clouds and natural marine aero-sols, dust particles reaching the marine environment can have drastically differ-ent properties than those from the source. Thus, understanding the unique tem-poral and spatial variations of Asian dust is of special importance in regional-to-global climate issues such as radiative forcing, the hydrological cycle, and pri-mary biological productivity in the mid-Pacific Ocean.
In collaboration with international chemists, our main goals in ACE-Asia are tomeasure continuously aerosol optical/radiative properties, column precipitablewater amount, and surface reflectivity over homogeneous areas from theSMART. The inclusion of flux measurements permits the determination of dustaerosol radiative flux in addition to measurements of loading and optical thick-ness. At the time of the MODIS overpass, these ground-based observations canprovide valuable data to compare with MODIS retrievals over land. Even with-out dust events, the homogeneity of the Gobi desert serves as an excellent cali-
MODIS Atmosphere Validation Plan 34
bration target. Thus, SMART observations in the vicinity of dust sources are ourfirst priority. A less instrumented SMART version will be set up in the marineenvironment.
5.1.10 CRYSTAL-FACE and CRYSTAL-TWP
The Cirrus Regional Study of Tropical Anvils and Layers (CRYSTAL) experiment,planned to be conducted in two phases, the Florida Area Cloud Experiment(FACE) in August 2002 and the Western Tropical Pacific (TWP) in August 2004,focuses on modeling and observing tropical cirrus cloud systems and their role inregional and global climate. As with the previous FIRE field experiments, re-mote sensing is a central theme of both CRYSTAL-FACE and CRYSTAL-TWP,and validation of satellite retrievals of cloud properties is a focus of CRYSTAL.The validation approach is to combine the satellite observations with in situ ob-servations from field campaigns and continuous ground-based observations.Comparison of the satellite observations with the continuous ground-based dataprovide a statistical meaningful sample for assessing the retrievals over a longtime period. Comparisons with in situ measurements provide detailed casestudies with cloud macrophysical and microphysical properties to assess cloudalgorithm performance. This experiment includes observations from the NASAER-2 aircraft as well as in situ aircraft. Primary instruments of interest for theER-2 are the MAS, S-HIS, and CLS. This experiment will focus on the validationof cirrus properties including: detection by cloud mask algorithm, cloud topheight, cloud water phase, and cloud microphysical properties. An emphasis willbe on retrieving the properties of thin cirrus often observed near the tro-popause.
5.2 Other Satellite Data
MODIS retrievals will be compared to those determined from in situ radiosondemeasurements, the NOAA HIRS operational retrievals, the GOES sounder opera-tional retrievals, NCEP analysis of all available data, and retrievals from the At-mospheric Infrared Sounder (AIRS) on the Aqua platform. Total ozone will becompared to Total Ozone Mapping Spectrometer (TOMS) measurements as wellas the operational NOAA ozone estimates from HIRS. In addition, MODIS aero-sol retrievals will be compared to POLDER and ILAS II on ADEOS II.
5.3 In Situ Measurement Needs at Calibration/Validation Sites
In order to assure that the cloud, aerosol and water vapor products are properlyderived from our satellite-based data processing algorithms, it is necessary tocoordinate many of the above-specified airborne campaigns with in situ cloudmicrophysics, aerosol sampling, and meteorological sampling. For this purposewe plan to make use of our long-standing collaboration with Prof. Peter V.Hobbs, University of Washington, and coordinate many of our cloud and aero-sol campaigns from the ER-2 and Terra with in situ sampling from the University
MODIS Atmosphere Validation Plan 35
of Washington CV-580 aircraft.
In addition, we envision intercomparing MODIS-derived column aerosol prod-ucts with AERONET and ARM sites, as appropriate. These are all surface net-works with long-term measurements that will enable long-period assessments ofour derived products through intercomparisons with these data (aerosol opticalthickness, aerosol size distribution, and precipitable water). Precipitable watervapor will be also validated using ground-based microwave radiometers, WMOradiosonde sites, Raman lidar systems, and a global network of GPS stations(~2000 worldwide). Some of the AERONET sites will be equipped with micro-pulse lidars to measure the vertical distribution of aerosol and their optical prop-erties (extinction coefficient and backscattering).
5.4 Needs for Instrument Development
We envision no need to further develop any airborne or in situ instruments, butrather to continually assess the performance of the MODIS Airborne Simulatorand to perform regular calibration and characterization experiments, upgradingthe spectrometer as required. Based on recent operational experience, we antici-pate a number of improvements, enhancements of capability, and laboratorytests. Laboratory measurements planned for the near future include: (i) meas-uring and characterizing the polarization sensitivity of the MAS as a function ofwavelength, (ii) measuring the modulation transfer function and point spreadfunction of the MAS, (iii) viewing a calibrated high-temperature blackbodysource, and (iv) characterizing the spectral response functions periodically withhigh spectral resolution interferometric sources. Finally, we plan to improve thestability of the 20 in integrating hemisphere that accompanies the MAS on fielddeployments by incorporating variable power supplies that are servo-controlledby reference detectors.
Similarly, the CAR and HIS will be upgraded or have parts replaced, as neces-sary, to maintain their usefulness in field validation activities. For example, theHIS has been upgraded to have scanning capability in 1998 (S-HIS), and the CARwill have the following improvements: (i) addition of two UVA channels at 0.34and 0.38 µm (like TOMS), (ii) replacing the filter wheel with simultaneous chan-nels in a linear array (upgrading the instrument from 8 to 15 simultaneous chan-nels), and (iii) upgrading the data system from 10 bit to 12 bit with the higherdata rate necessary to support the additional channels.
In addition to the airborne radiometers mentioned above, there is a continuingneed to develop new instruments for better measurements of the aerosol singlescattering albedo, CCN spectrum, size dependent chemical composition, andphase function of ice crystals. We plan to collaborate with other groups in thisregard, and not to initiate or develop this capability ourselves.
MODIS Atmosphere Validation Plan 36
5.5 Geometric Registration Site
None are required for validating MODIS atmosphere algorithms.
5.6 Intercomparisons
Post-launch validation of the thermal infrared cloud phase product with otherMODIS products will consist of close inspection of sections of data representingdiffering cloud regimes and surface types, including cross checks during the daymode with the visible reflection function technique of King et at. (ATBD-MOD-05) and consistency with the cloud top properties results.
Validation of the MODIS cloud products will also be done post-launch usingproducts derived from the ASTER, CERES, and MISR sensors on the Terra,CERES on TRMM, and GLI on ADEOS II.
The MODIS Cloud Mask will be compared to the ASTER Polar Cloud Mask toensure consistent classification of polar cloud cover. The ASTER product will in-clude a classification for each pixel poleward of 60°N or 60°S using a bit map withthe following bit flags: unknown, ice cloud, water cloud, shadow, land, ice, wetice, and water. The high spatial resolution of the ASTER data (30 m at nadir) willhelp to ensure that sub-pixel effects are properly accounted for in the MODISdata. Because the ASTER channels are mostly located in atmospheric windowregions, however, it will still be difficult to correctly identify thin cirrus cloudsover polar regions from ASTER data. The 1.38 µm MODIS channel should easilyallow the detection of thin cirrus clouds over polar regions during the daytime,and this comparison with the ASTER cloud mask may prove invaluable to bothalgorithms.
The MODIS Cloud Mask and Cloud Properties (cloud top pressure and tempera-ture, effective emissivity, cloud optical thickness, thermodynamic phase, and ef-fective radius) products will be compared to the CERES Single Satellite Footprint(SSF) and Single Satellite Gridded products that include cloud top pressure andtemperature, cloud optical thickness, effective radius and phase, and cloud cate-gory (lower, lower-middle, upper-middle, high). CERES is heavily dependent onMODIS observations for cloud detection, so it will be important to ensure thatthe MODIS and CERES-derived cloud products are consistent. The MODIS CloudMask and Cloud Properties (cloud top pressure) products will also be comparedto the MISR Top-of-Atmosphere/Cloud Product. The components of the MISRproduct that will be used are Reflecting-Level Reference Altitude (retrieved usingMISR stereo imagery), Angle-by-angle cloud masks, Cloud shadow mask, andAltitude-binned cloud fraction. The MODIS and MISR Cloud Masks will be com-pared to ensure consistency of cloud identification, and the MISR stereo cloudheights will be compared with the MODIS cloud top heights to geometricallyvalidate the MODIS radiometrically derived cloud height data.
We plan to compare the MODIS aerosol product with the aerosol product de-

MODIS Atmosphere Validation Plan 37
rived from MISR (MIS05). Using field experiments as well as AERONET, we planto investigate the relative success of each of these techniques as a function ofaerosol type, season, surface cover, and view and illumination directions. Thiswill be an ongoing research endeavor involving Yoram Kaufman and DidierTanré of the MODIS Team, and Jim Conel, Ralph Kahn, John Martonchik, andDave Diner of the MISR Team.
For atmospheric water vapor, the MODIS precipitable water product will becompared to column water vapor derived from numerous AERONET sunpho-tometers worldwide, as well as with precipitable water estimates derived frompassive microwave and Raman lidar measurements at the SGP (Oklahoma) ARMCART site, North American radiosondes, microwave measurements from theSMART, and surface GPS soundings, where available.
5.7 Modeling Studies and Quality Assessment
Steve Platnick and Robert Pincus plan to use model calculations and analysis ofMODIS and MAS data to assess the accuracy of the MODIS Cloud Product re-trievals of liquid water cloud optical thickness and effective radius (MOD06). Acomponent of their investigation includes the effects of vertical stratification ofcloud droplet sizes on the retrievals, especially discrepancies between retrievedeffective radii made from reflection measurements in different near-infraredbands. They also plan to develop forward models for assessing biases due tohorizontal inhomogeneity. Results should provide quantitative guidance for theassessment of quality assurance parameters for the MODIS cloud retrieval algo-rithm. It is anticipated that in situ cloud measurements from planned MODISAtmosphere Team validation campaigns will help in the modeling of realisticclouds, as well as for retrieval validation. They are especially interested in suffi-cient vertical profiling of clouds and long horizontal legs. To this end, relativelyplane-parallel like marine stratus clouds are desired as a starting point in theirinvestigation. This includes the California stratus and valley fog deployments, aswell as opportunities such as Namibian stratus off the coast of Namibia duringSAFARI 2000.
In situ validation of cloud optical thickness fields is quite limited with current sur-face and aircraft capabilities. We need some validation tools for the optical thick-nesses retrieved from MODIS data at locales where no other in situ measure-ments are available. Alexander Marshak proposes to use a theoretical methodthat should provide important information on how accurate operational cloudretrievals are. As a first step, this investigation will be applied to stratocumulusclouds. This method will help to better understand errors related to cloud hori-zontal inhomogeneity in operational cloud retrievals and set error bounds on theinferred values, especially for the 250 m pixel data. The method is based on es-timating the effect of photon horizontal fluxes on the retrieval of cloud opticalproperties. To validate this theoretical model, microwave radiometer data attwo ARM sites (SGP and TWP) will be used. Marshak will also use 15 m spatial
MODIS Atmosphere Validation Plan 38
resolution ASTER VNIR (visible and near-infrared) data set of stratocumulusclouds over these two ARM sites.
6.0 Implementation of Validation Results
6.1 Approach
The MODIS atmosphere algorithms for the cloud mask, cloud properties, aerosolproperties, precipitable water, and atmospheric profiles will evolve in the firstyear after MODIS is launched in accordance with seasonal changes and validationresults. Thereafter, algorithm changes will be restrained to occur once per yearas needed. We anticipate assessing the performance of the MODIS algorithmsinitially by processing every other day, as well as specific time periods with vali-dation experiments of special relevance, as outlined above. After initially lookingat one year’s data, consistency checks, quality assessment flags, validation cam-paigns, as appropriate, and intercomparisons with other instruments (especiallyon Terra), we will begin whole-scale reprocessing, including every month. Thisinitial stage may take in excess of one year, during which time the MODIS cali-bration algorithm will likely undergo additional refinement. Continual refine-ment of the MODIS “operational” algorithms will largely be conducted at theTeam Members SCF as well as at the Atmosphere Group’s Computing Facility(Windhoek), as many of the algorithms are dependent on results from other al-gorithms (like calibration). Only periodically (after say 1.5 years followinglaunch), the first reprocessing at the MODIS Data Processing System (MODAPS)will be initiated.
6.2 Role of EOSDIS
To investigate algorithm changes, past data sets (covering different seasons andecosystems) will be necessary. We expect that these data will be archived andavailable through EOSDIS. The bulk of the data sets that we have thus far ob-tained (including CAR, MAS, and University of Washington C-131A in situ data)have been archived and are available through relevant EOS DAACs. The specificpoint of data distribution for MAS data is clearly identified as part of the browseimagery archive portion of the MAS World Wide Web site (see Section 9).
6.3 Archival, Processing, and Distribution of Validation Data
The MODIS Science Team plans to gather all relevant data from various valida-tion exercises and make these data available through EOSDIS. We anticipate thatthe MODIS home page on World Wide Web will soon establish a link to the loca-tion and availability of all MODIS-related validation data sets.
7.0 Summary
This plan represents the thought process of all MODIS atmosphere team mem-
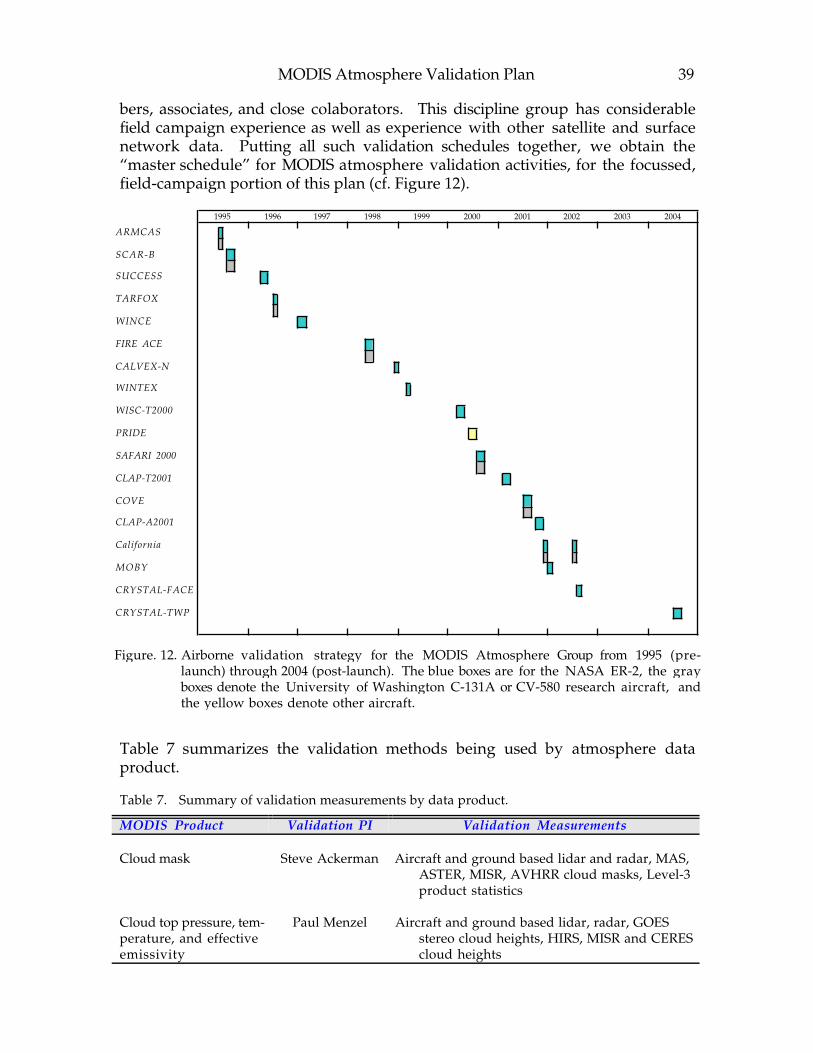
MODIS Atmosphere Validation Plan 39
bers, associates, and close colaborators. This discipline group has considerablefield campaign experience as well as experience with other satellite and surfacenetwork data. Putting all such validation schedules together, we obtain the“master schedule” for MODIS atmosphere validation activities, for the focussed,field-campaign portion of this plan (cf. Figure 12).
Table 7 summarizes the validation methods being used by atmosphere dataproduct.
Table 7. Summary of validation measurements by data product.
MODIS Product Validation PI Validation Measurements
Cloud mask Steve Ackerman Aircraft and ground based lidar and radar, MAS,ASTER, MISR, AVHRR cloud masks, Level-3product statistics
Cloud top pressure, tem-perature, and effectiveemissivity
Paul Menzel Aircraft and ground based lidar, radar, GOESstereo cloud heights, HIRS, MISR and CEREScloud heights
ARMCAS
SCAR-B
SUCCESS
TARFOX
WINCE
FIRE ACE
CALVEX-N
WINTEX
WISC-T2000
PRIDE
SAFARI 2000
CLAP-T2001
COVE
CLAP-A2001
California
MOBY
CRYSTAL-FACE
CRYSTAL-TWP
2003 20041999 2000 2001 20021995 1996 1997 1998
Figure. 12. Airborne validation strategy for the MODIS Atmosphere Group from 1995 (pre-launch) through 2004 (post-launch). The blue boxes are for the NASA ER-2, the grayboxes denote the University of Washington C-131A or CV-580 research aircraft, andthe yellow boxes denote other aircraft.
MODIS Atmosphere Validation Plan 40
Table 7. Summary of validation measurements by data product (continued).
MODIS Product Validation PI Validation Measurements
Cloud optical thicknessand effective radius
Michael King In situ aircraft, remote sensing aircraft andground based lidar and radar, MISR andCERES cloud optical thickness
Cloud particle phase Steve Ackerman Aircraft based in situ measurements, dual polari-zation lidar, CERES cloud phase
Cirrus reflectance in thevisible
Bo-Cai Gao Aircraft remote sensing with multispectral radi-ometers (MAS and AVIRIS)
Aerosol optical thick-ness and size distribu-tion
Yoram KaufmanDidier Tanré
Surface measurements from AERONET sun/skyradiometers, aircraft based in situ measure-ments
Atmospheric moistureand temperature gradi-ents
Paul Menzel CART microwave and in situ measurements,CIGSN network of Australian soundings,North American radiosonde network, HIRS,GOES, AIRS, LASE
Atmospheric stability Paul Menzel CART temperature and moisture measurements,CIGSN network of Australian soundings,North American radiosonde network, HIRS,GOES, AIRS
Precipitable water Bo-Cai GaoYoram Kaufman
Paul Menzel
AERONET, CART microwave and Raman lidarmeasurements, North American radiosondenetwork, ground-based GPS network, SMiR
Gridded level-3 atmos-phere product
Al l Intercomparisons and consistency checks
Additional contributions from the wider scientific community are described inthis document. Other opportunities are widely sought.
8.0 References
Arnold, G. T., S. C. Tsay, M. D. King, J. Y. Li and P. F. Soulen, 2000: Airbornespectral measurements of surface-atmosphere anisotropy for Arctic sea iceand tundra. Int. J. Remote Sens., submitted.
Curry, J. A. P. V. Hobbs, M. D. King, D. A. Randall, P. Minnis, G. A. Isaac, J. O.Pinto, T. Uttal, A. Bucholtz, D. G. Cripe, H. Gerber, C. W. Fairall, T. J. Garrett,J. Hudson, J. M. Intrieri, C. Jakob, T. Jensen, P. Lawson, D. Marcotte, L.Nguyen, P. Pilewskie, A. Rangno, D. C. Rodgers, K. B. Strawbridge, F. P. J.Valero, A. G. Williams, and D. Wylie, 2000: FIRE Arctic Clouds Experiment.Bull. Amer. Meteor. Soc., 81, 5–30.
Holben, B. N., T. F. Eck, I. Slutsker, D. Tanré, J. P. Buis, A. Setzer, E. Vermote, J.
MODIS Atmosphere Validation Plan 41
A. Reagan, Y. J. Kaufman, T. Nakajima, F. Lavenu, I. Jankowiak and A.Smirnov, 1998: AERONET—A federated instrument network and data ar-chive for aerosol characterization. Remote Sens. Environ., 66, 1–16.
Kaufman, Y. J., P. V. Hobbs, V. W. J. H. Kirchhoff, P. Artaxo, L. A. Remer, B. N.Holben, M. D. King, D. E. Ward, E. M. Prins, K. M. Longo, L. F. Mattos, C. A.Nobre, J. D. Spinhirne, Q. Ji, A. M. Thompson, J. F. Gleason, S. A. Christo-pher and S. C. Tsay, 1998: The Smoke, Clouds, and Radiation—Brazil (SCAR-B) experiment. J. Geophys. Res., 103, 31783–31808.
King, M. D., 1992: Directional and spectral reflectance of the Kuwait oil-firesmoke. J. Geophys. Res., 97, 14545–14549.
King, M. D., M. G. Strange, P. Leone and L. R. Blaine, 1986: Multiwavelengthscanning radiometer for airborne measurements of scattered radiationwithin clouds. J. Atmos. Oceanic Technol., 3, 513–522.
King, M. D., Y. J. Kaufman, W. P. Menzel and D. Tanré, 1992: Remote sensing ofcloud, aerosol, and water vapor properties from the Moderate ResolutionImaging Spectrometer (MODIS). IEEE Trans. Geosci. Remote Sens., 30, 2–27.
King, M. D., W. P. Menzel, P. S. Grant, J. S. Myers, G. T. Arnold, S. E. Platnick, L.E. Gumley, S. C. Tsay, C. C. Moeller, M. Fitzgerald, K. S. Brown and F. G. Os-terwisch, 1996: Airborne scanning spectrometer for remote sensing ofcloud, aerosol, water vapor and surface properties. J. Atmos. Oceanic Tech-nol., 13, 777–794.
Prata, A. J., 1994: Land surface temperatures derived from AVHRR and ATSR. II:Experimental results and validation of AVHRR algorithms. J. Geophys. Res.,99, 13025–13058.
Sassen, K., 1994: Advances in polarization diversity lidar for cloud remote sens-ing. Proc. IEEE, Remote Sensing Instruments for Environmental Research, 82,1907–1914.
Sassen, K., 1997: The lidar dark band: An oddity of the radar bright band anal-ogy. Geophys. Res. Lett., 22, 3505–3508.
Sassen, K., and T. Chen, 1995: Contrail cirrus and their potential for regional cli-mate change. Bull. Amer. Meteor. Soc., 78, 1885–1903.
Smith, W. L., H. E. Revercomb, R. O. Knuteson, F. A. Best, R. Dedecker, H. B.Howell and H. M. Woolf, 1995: Cirrus cloud properties derived from thehigh spectral resolution infrared spectrometry during FIRE II. Part I: TheHigh Resolution Interferometer Sounder (HIS) system.. J. Atmos. Sci., 52,4238–4245.
Soulen, P. F., M. D. King, S. C. Tsay, G. T. Arnold and J. Y. Li, 2000: Airborne
MODIS Atmosphere Validation Plan 42
spectral measurements of surface-atmosphere anisotropy during the SCAR-A, Kuwait oil fire, and TARFOX experiments. J. Geophys. Res., 105,10203–10218.
Spinhirne, J. D., R. Boers and W. D. Hart, 1989: Cloud top liquid water from lidarobservations of marine stratocumulus. J. Appl. Meteor., 28, 81–90.
Tanré, D., L. A. Remer, Y. J. Kaufman, S. Mattoo, P. V. Hobbs, J. M. Livingston, P.B. Russell, A. Smirnov, 1999: Retrieval of aerosol optical thickness and sizedistribution over ocean from the MODIS Airborne Simulator duringTARFOX. J. Geophys. Res., 104, 2261–2278.
Tsay, S. C., M. D. King, G. T. Arnold, and J. Y. Li, 1998: Airborne spectral meas-urements of surface anisotropy during SCAR-B. J. Geophys. Res., 103,31943–31954.
Uttal, T., E. E. Clothiaux, T.P. Ackerman, J. M. Intrieri and W.L. Eberhard, 1995:Cloud boundary statistics during FIRE II. J. Atmos. Sci., 52, 4276–4284.
Vane, G., R. O. Green, T. G. Chrien, H. T. Enmark, E. G. Hansen, and W. M. Por-ter, 1993: The Airborne Visible/Infrared Imaging Spectrometer (AVIRIS).Remote Sens. Environ., 44, 127–143.
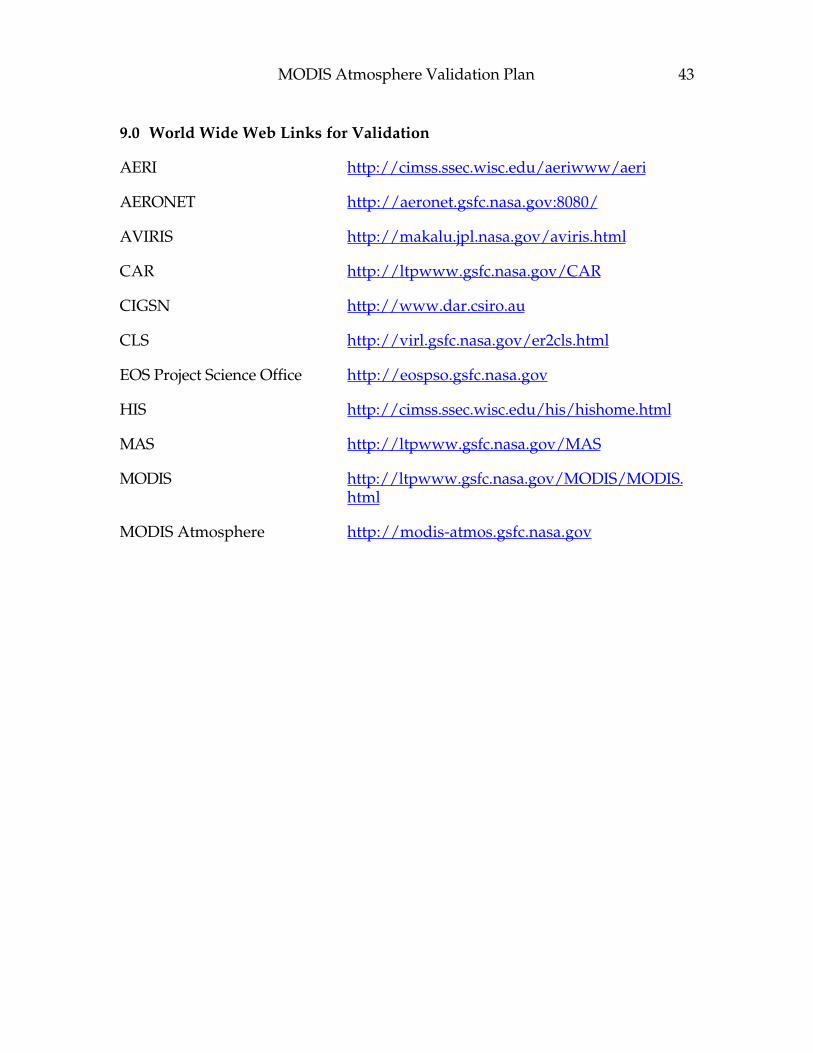
MODIS Atmosphere Validation Plan 43
9.0 World Wide Web Links for Validation
AERI http://cimss.ssec.wisc.edu/aeriwww/aeri
AERONET http://aeronet.gsfc.nasa.gov:8080/
AVIRIS http://makalu.jpl.nasa.gov/aviris.html
CAR http://ltpwww.gsfc.nasa.gov/CAR
CIGSN http://www.dar.csiro.au
CLS http://virl.gsfc.nasa.gov/er2cls.html
EOS Project Science Office http://eospso.gsfc.nasa.gov
HIS http://cimss.ssec.wisc.edu/his/hishome.html
MAS http://ltpwww.gsfc.nasa.gov/MAS
MODIS http://ltpwww.gsfc.nasa.gov/MODIS/MODIS.html
MODIS Atmosphere http://modis-atmos.gsfc.nasa.gov
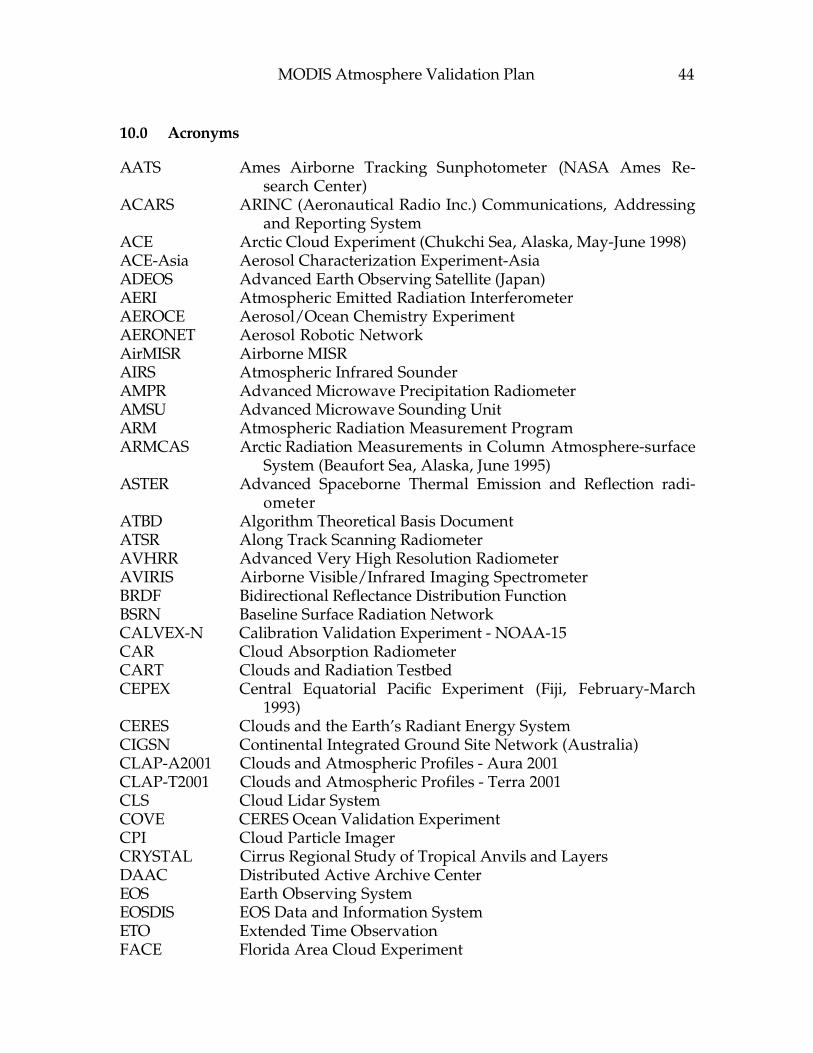
MODIS Atmosphere Validation Plan 44
10.0 Acronyms
AATS Ames Airborne Tracking Sunphotometer (NASA Ames Re-search Center)
ACARS ARINC (Aeronautical Radio Inc.) Communications, Addressingand Reporting System
ACE Arctic Cloud Experiment (Chukchi Sea, Alaska, May-June 1998)ACE-Asia Aerosol Characterization Experiment-AsiaADEOS Advanced Earth Observing Satellite (Japan)AERI Atmospheric Emitted Radiation InterferometerAEROCE Aerosol/Ocean Chemistry ExperimentAERONET Aerosol Robotic NetworkAirMISR Airborne MISRAIRS Atmospheric Infrared SounderAMPR Advanced Microwave Precipitation RadiometerAMSU Advanced Microwave Sounding UnitARM Atmospheric Radiation Measurement ProgramARMCAS Arctic Radiation Measurements in Column Atmosphere-surface
System (Beaufort Sea, Alaska, June 1995)ASTER Advanced Spaceborne Thermal Emission and Reflection radi-
ometerATBD Algorithm Theoretical Basis DocumentATSR Along Track Scanning RadiometerAVHRR Advanced Very High Resolution RadiometerAVIRIS Airborne Visible/Infrared Imaging SpectrometerBRDF Bidirectional Reflectance Distribution FunctionBSRN Baseline Surface Radiation NetworkCALVEX-N Calibration Validation Experiment - NOAA-15CAR Cloud Absorption RadiometerCART Clouds and Radiation TestbedCEPEX Central Equatorial Pacific Experiment (Fiji, February-March
1993)CERES Clouds and the Earth’s Radiant Energy SystemCIGSN Continental Integrated Ground Site Network (Australia)CLAP-A2001 Clouds and Atmospheric Profiles - Aura 2001CLAP-T2001 Clouds and Atmospheric Profiles - Terra 2001CLS Cloud Lidar SystemCOVE CERES Ocean Validation ExperimentCPI Cloud Particle ImagerCRYSTAL Cirrus Regional Study of Tropical Anvils and LayersDAAC Distributed Active Archive CenterEOS Earth Observing SystemEOSDIS EOS Data and Information SystemETO Extended Time ObservationFACE Florida Area Cloud Experiment
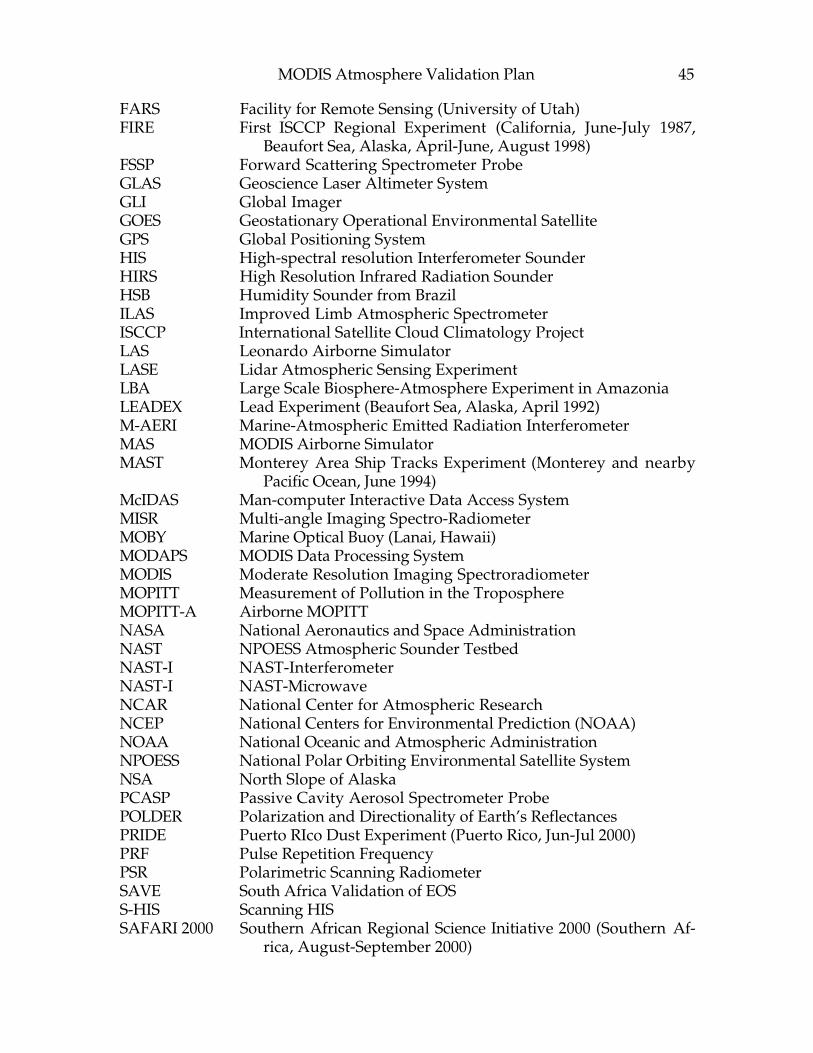
MODIS Atmosphere Validation Plan 45
FARS Facility for Remote Sensing (University of Utah)FIRE First ISCCP Regional Experiment (California, June-July 1987,
Beaufort Sea, Alaska, April-June, August 1998)FSSP Forward Scattering Spectrometer ProbeGLAS Geoscience Laser Altimeter SystemGLI Global ImagerGOES Geostationary Operational Environmental SatelliteGPS Global Positioning SystemHIS High-spectral resolution Interferometer SounderHIRS High Resolution Infrared Radiation SounderHSB Humidity Sounder from BrazilILAS Improved Limb Atmospheric SpectrometerISCCP International Satellite Cloud Climatology ProjectLAS Leonardo Airborne SimulatorLASE Lidar Atmospheric Sensing ExperimentLBA Large Scale Biosphere-Atmosphere Experiment in AmazoniaLEADEX Lead Experiment (Beaufort Sea, Alaska, April 1992)M-AERI Marine-Atmospheric Emitted Radiation InterferometerMAS MODIS Airborne SimulatorMAST Monterey Area Ship Tracks Experiment (Monterey and nearby
Pacific Ocean, June 1994)McIDAS Man-computer Interactive Data Access SystemMISR Multi-angle Imaging Spectro-RadiometerMOBY Marine Optical Buoy (Lanai, Hawaii)MODAPS MODIS Data Processing SystemMODIS Moderate Resolution Imaging SpectroradiometerMOPITT Measurement of Pollution in the TroposphereMOPITT-A Airborne MOPITTNASA National Aeronautics and Space AdministrationNAST NPOESS Atmospheric Sounder TestbedNAST-I NAST-InterferometerNAST-I NAST-MicrowaveNCAR National Center for Atmospheric ResearchNCEP National Centers for Environmental Prediction (NOAA)NOAA National Oceanic and Atmospheric AdministrationNPOESS National Polar Orbiting Environmental Satellite SystemNSA North Slope of AlaskaPCASP Passive Cavity Aerosol Spectrometer ProbePOLDER Polarization and Directionality of Earth’s ReflectancesPRIDE Puerto RIco Dust Experiment (Puerto Rico, Jun-Jul 2000)PRF Pulse Repetition FrequencyPSR Polarimetric Scanning RadiometerSAVE South Africa Validation of EOSS-HIS Scanning HISSAFARI 2000 Southern African Regional Science Initiative 2000 (Southern Af-
rica, August-September 2000)
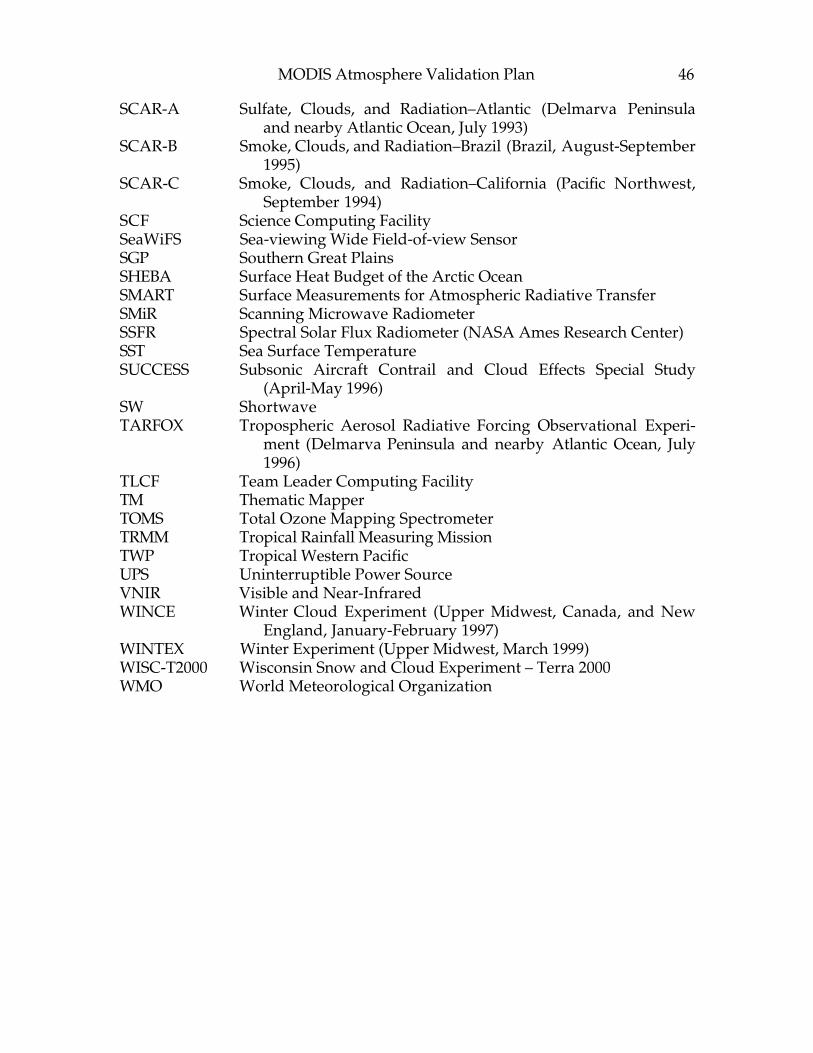
MODIS Atmosphere Validation Plan 46
SCAR-A Sulfate, Clouds, and Radiation–Atlantic (Delmarva Peninsulaand nearby Atlantic Ocean, July 1993)
SCAR-B Smoke, Clouds, and Radiation–Brazil (Brazil, August-September1995)
SCAR-C Smoke, Clouds, and Radiation–California (Pacific Northwest,September 1994)
SCF Science Computing FacilitySeaWiFS Sea-viewing Wide Field-of-view SensorSGP Southern Great PlainsSHEBA Surface Heat Budget of the Arctic OceanSMART Surface Measurements for Atmospheric Radiative TransferSMiR Scanning Microwave RadiometerSSFR Spectral Solar Flux Radiometer (NASA Ames Research Center)SST Sea Surface TemperatureSUCCESS Subsonic Aircraft Contrail and Cloud Effects Special Study
(April-May 1996)SW ShortwaveTARFOX Tropospheric Aerosol Radiative Forcing Observational Experi-
ment (Delmarva Peninsula and nearby Atlantic Ocean, July1996)
TLCF Team Leader Computing FacilityTM Thematic MapperTOMS Total Ozone Mapping SpectrometerTRMM Tropical Rainfall Measuring MissionTWP Tropical Western PacificUPS Uninterruptible Power SourceVNIR Visible and Near-InfraredWINCE Winter Cloud Experiment (Upper Midwest, Canada, and New
England, January-February 1997)WINTEX Winter Experiment (Upper Midwest, March 1999)WISC-T2000 Wisconsin Snow and Cloud Experiment – Terra 2000WMO World Meteorological Organization