modular formation dynamics tester (mdt) · pdf file5.4 modular formation dynamics tester (mdt)...
TRANSCRIPT

AHNdoc. id.: 25/8-KB.DCD.2JPage 34 of 87
SIDETRACK 25/8-9A FINAL WELL REPORT Rev. 0Valid from Oi.09.97
5.4 Modular Formation Dynamics Tester (MDT) Analysis
Tool type Schlumberger MDTGauge Quartz gauge BSG1Resolution 0.040PSIRT 25m
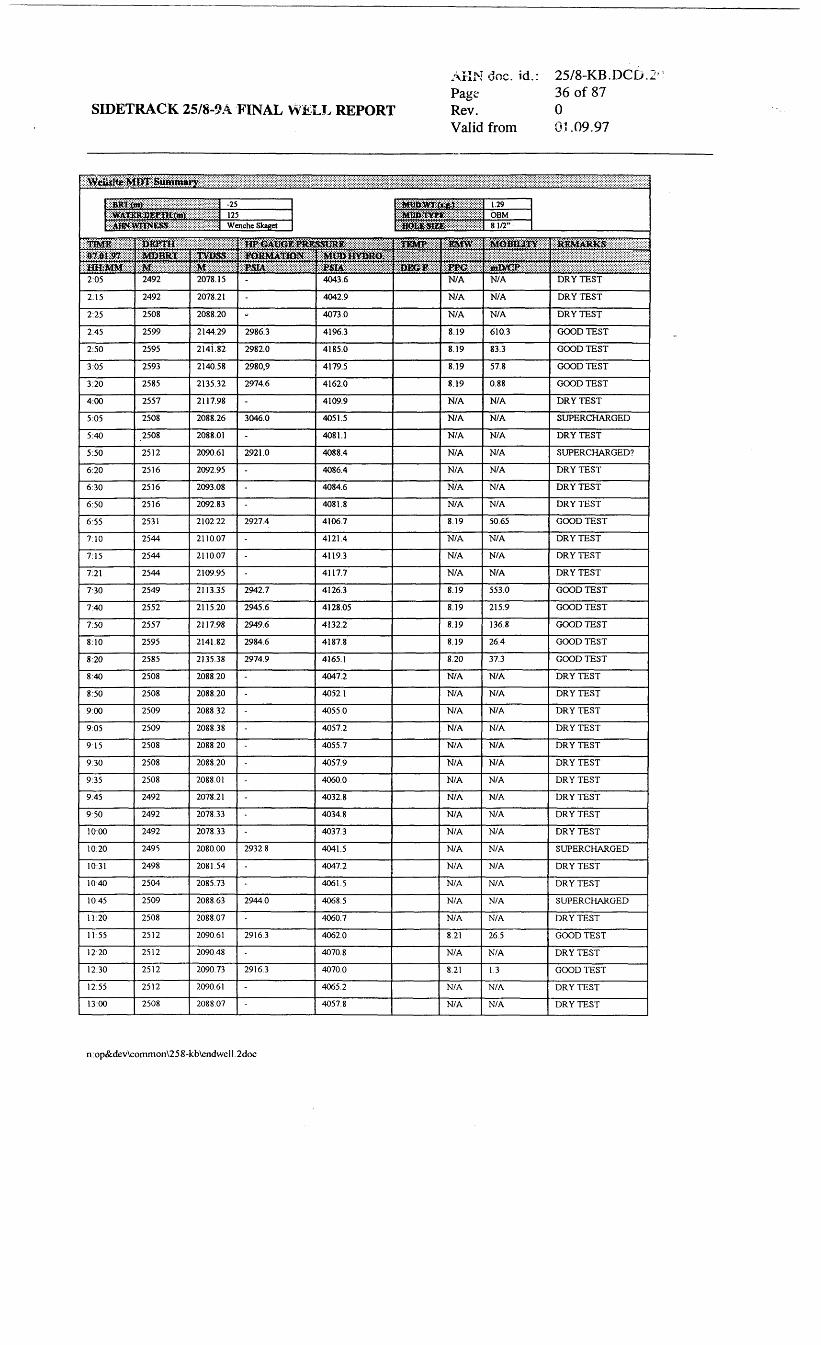
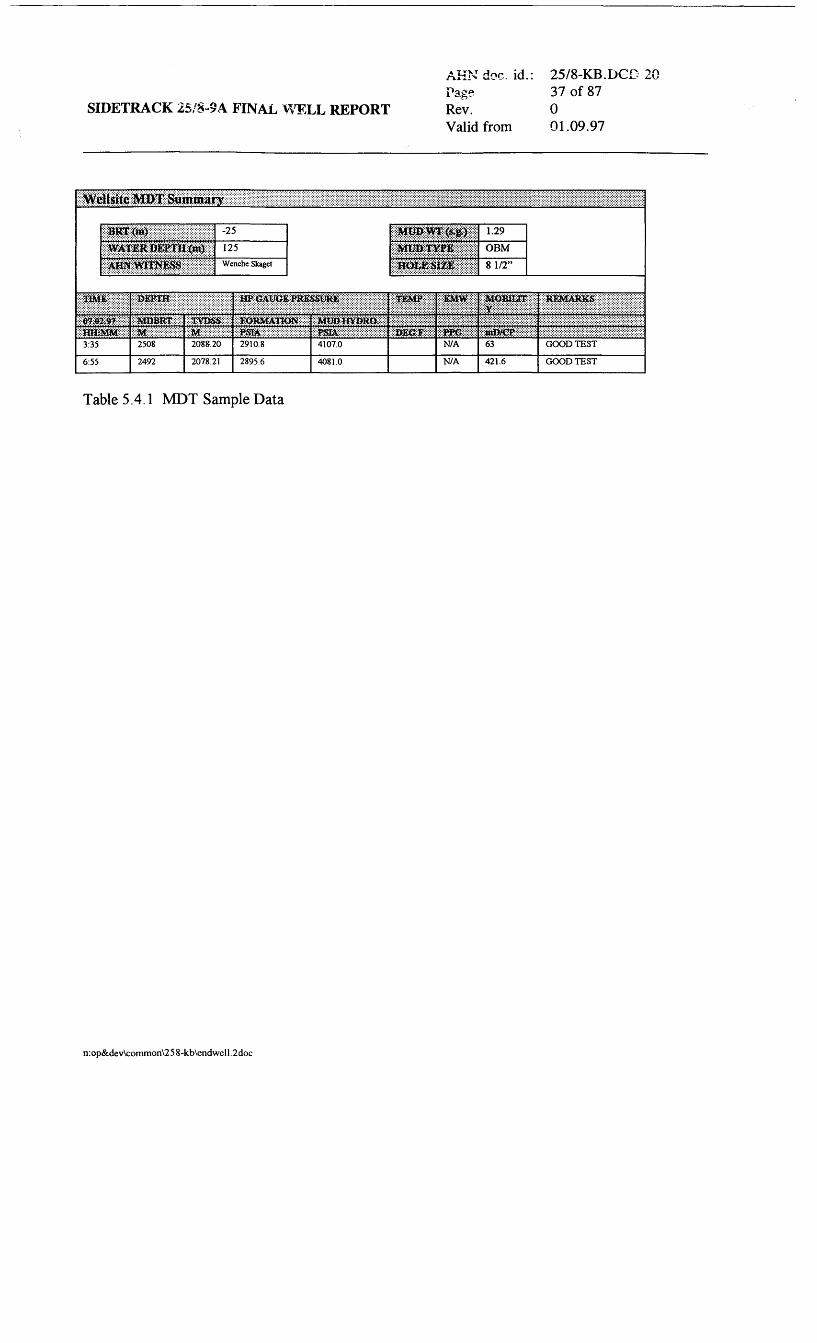
Two MDT runs were performed, and 12 valid pre-test measurements taken, resulting inhigh quality pressure data. In the second MDT run two fluid samples were taken at 2492.1mBRT (oil) and 2508.3 mBRT (water)
n:op&dev\common\258-kb\endwell.2doc
AHN doc. id.: 25/8-KB.DCD 20Page 35 of 87
SIDETRACK 25/S-9A FINAL WELL REPORT Rev. 0Valid from 01.09.97
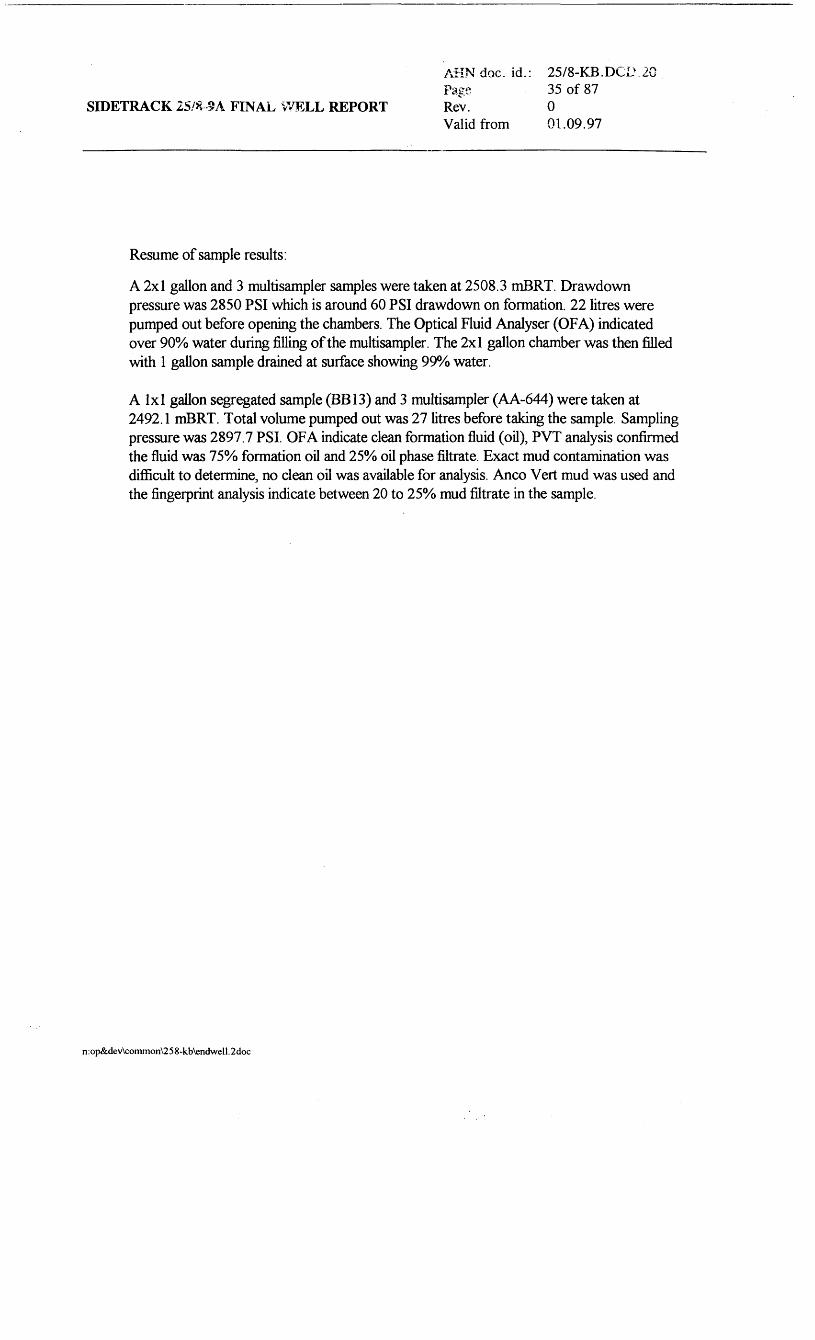
Resume of sample results:
A 2x1 gallon and 3 multisampler samples were taken at 2508.3 mBRT. Drawdownpressure was 2850 PSI which is around 60 PSI drawdown on formation. 22 litres werepumped out before opening the chambers. The Optical Fluid Analyser (OFA) indicatedover 90% water during filling of the multisampler. The 2x1 gallon chamber was then filledwith 1 gallon sample drained at surface showing 99% water.
A 1x1 gallon segregated sample (BB13) and 3 multisampler (AA-644) were taken at2492.1 mBRT. Total volume pumped out was 27 litres before taking the sample. Samplingpressure was 2897.7 PSI. OF A indicate clean formation fluid (oil), PVT analysis confirmedthe fluid was 75% formation oil and 25% oil phase filtrate. Exact mud contamination wasdifficult to determine, no clean oil was available for analysis. Anco Vert mud was used andthe fingerprint analysis indicate between 20 to 25% mud filtrate in the sample.
n: op&de v\common\2 5 8-kb\endwell. 2doc
SIDETRACK 25/8-9A FINAL WELL REPORT
AKNdoc. id.:PageRev.Valid from
25/8-KB. DCD.2 *36 of 870Ol .09.97
3£&i$itiimmmmm **• -25SliljføiSÉ^SS^^ S* 125SijS^S jrøJj SiSSSSSS Vff Wenche Skaget
3$B&smtm:tfå$i$&$mWs^^^m
2:05
2:15
2:25
2:45
2:50
3:05
3:20
4:00
5:05
5:40
5:50
6:20
6:30
6:50
6:55
7:10
7:15
7:21
7:30
7:40
7:50
8:10
8:20
8:40
8:50
9:00
9:05
915
9:30
9:35
9:45
9:50
10:00
10:20
10:31
10:40
1045
11:20
11:55
12:20
12:30
12:55
13:00
SJDEKPHS;:*:SSrøBSæp'<j&M888i8:
2492
2492
2508
2599
2595
2593
2585
2557
2508
2508
2512
2516
2516
2516
2531
2544
2544
2544
2549
2552
2557
2595
2585
2508
2508
2509
2509
2508
2508
2508
2492
2492
2492
2495
2498
2504
2509
2508
2512
2512
2512
2512
2508
m&mtm^fy&ssmiiljSjE; mm
2078.15
2078.21
2088.20
2144.29
2141.82
2140.58
2135.32
2117.98
2088.26
2088.01
2090.61
2092.95
2093.08
2092.83
2102.22
2110.07
2110.07
2109.95
2113.35
2115.20
2117.98
2141.82
2135.38
2088.20
2088.20
2088.32
2088.38
208820
2088.20
2088.01
2078.21
2078.33
2078.33
2080.00
2081.54
2085.73
2088.63
2088.07
209061
2090.48
2090.73
2090.61
2088.07
^E^^&^llSOSS^SB^^^m^SSSaSÉ^TfifflS;:::;-:;®gs$Mmm%&
----2986.3
2982.0
2980,9
2974.6
-3046.0
-2921.0
-
-
-2927.4
-
-
-
2942.7
2945.6
2949.6
2984.6
2974.9
-
-
-
-
-
-
-
-
2932.8
-
-
2944.0
2916.3
2916.3
-
-
'SSM&tåit&sifåm;ÉgJÉÉsÉIÉÉiÉ
4043.6
4042.9
4073.0
4196.3
4185.0
4179.5
4162.0
4109.9
4051.5
4081.1
4088.4
4086.4
4084.6
4081.8
4106.7
4121.4
4119.3
4117.7
4126.3
4128.05
4132.2
4187.8
4165.1
4047.2
4052.1
4055.0
4057.2
4055.7
4057.9
4060.0
4032.8
4034.8
4037.3
4041.5
4047.2
4061.5
4068.5
4060.7
4062.0
4070.8
4070.0
4065.2
4057.8
mmmmmzmWfå88i8&&fåms$&^^^t^K^mmA
1.29OEM81/2"
SSS&iffiSSJ:-:*:¥:*;-:?:$38*:ESESI&E;:
SSSafiSi::::::&:-S:-:S::S:::i::::
w&fåmN/A
N/A
N/A
8.19
8.19
8.19
8.19
N/A
N/A
N/A
N/A
N/A
N/A
N/A
8.19
N/A
N/A
N/A
8.19
8.19
8.19
8.19
8.20
N/A
N/A
N/A
N/A
N/A
N/A
N/A
N/A
N/A
N/A
N/A
N/A
N/A
N/A
N/A
8.21
N/A
8.21
N/A
N/A
SSiOBBEiJifc ;:;?;
^ji^f^jK^gSjwN/A
N/A
N/A
610.3
83.3
57.8
0.88
N/A
N/A
N/A
N/A
N/A
N/A
N/A
50.65
N/A
N/A
N/A
553.0
215.9
136.8
26.4
37.3
N/A
N/A
N/A
N/A
N/A
N/A
N/A
N/A
N/A
N/A
N/A
N/A
N/A
N/A
N/A
26.5
N/A
1.3
N/A
N/A
SiKii&ai iS^ ;;
DRY TEST
DRY TEST
DRY TEST
GOOD TEST
GOOD TEST
GOOD TEST
GOOD TEST
DRY TEST
SUPERCHARGED
DRY TEST
SUPERCHARGED?
DRY TEST
DRY TEST
DRY TEST
GOOD TEST
DRY TEST
DRY TEST
DRY TEST
GOOD TEST
GOOD TEST
GOOD TEST
GOOD TEST
GOOD TEST
DRY TEST
DRY TEST
DRY TEST
DRY TEST
DRY TEST
DRY TEST
DRY TEST
DRY TEST
DRY TEST
DRY TEST
SUPERCHARGED
DRY TEST
DRY TEST
SUPERCHARGED
DRY TEST
GOOD TEST
DRY TEST
GOOD TEST
DRY TEST
DRY TEST
n: op&de v\common\2 5 8 -kb\end we 11.2 doc
AKN doc. id.:Page
25/8-KB.DCD 2037 of 87
SIDETKACK 25/8-3'A FINAL WELL REPORT Rev.Valid from
001.09.97
liiii
iSifiSiKivi Sg;: ;!|Zfåfå&fåM* £1
3:35
6:55
it^jssi Ejiiii-iit-iis^iiiliiiiilii
-25125Wenche Skaget
SfljSSSxW SaSrøSSS::::mmmmztitmm*2508 2088.20
2492 2078.21
wi^i^^i^^i^^^^.iSiifiSiiiSS-EEiKSffiiS&SStSS^SHfflgg
2910.8
2895.6
j-iiJ^^Bp^RiGElsi ffi ^^^^^
4107.0
4081.0
1.29OEM8 1/2"
ilÉ^ÉIgll ÉÉigssiÉ;:SfiES3fS;S isRSfeiS??::;
N/A
N/A
Ells-issgss;SJffi0!ii|EE;:*Sfi:
63
421.6
5
5 ^ ^ ^ ^ ^ ^|: ^ ^ ^ ^ ^ ^
GOOD TEST
GOOD TEST
Table 5.4. l MDT Sample Data
n:op&dev\common\258-kb\endwell.2doc

Oil Base Drilling Fluids Properties, daily record
Operator: Amerada Hess
Well: 25/8-9A
Rig: Byford Dolphin
FSRno..
Ill24252627232930313233
Dato1066.mi
28-0129-0130-0131-0101-0202-0203-0204-0205-0206-02
D«pth
mliBl
1097157021872494252326032687268726872687
MW
to«'IVIUiU^WrwlfllffiSKr
1291291.311.31i.3i1.321.311.311,311.31
FlowTemp
oCilrtifWelllS
21' "35404424
1 1 5107171717
F.Vto
S jBflOJi1459210492i 251 1 596115140140
VO-matar raadlng* O SO C«00rprn
Mtt' "as "
8110582o5939698106100
300rpmffift"53526855556161626665
200 100 60 30r pni r pm fpffl f P^ 'llBiflfiHilillliiBi
43 31 25 2142 30 24 2052 37 27 2042 30 24 19•14 32 25 IS46 33 26 2049 35 26 2046 35 25 1854 39 25 1952 39 25 18
6 3jrrjfprn'iliiS'16 1416 1418 1515 13i5 1 416 1417 1516 1418 1718 16
AV
cPIjjliljl143415341
434748495350
PV
cP
32293727303235363635
YP Gal10 sec
Pa cPISSililli10,5 20.011.5 17.015.5 20.014,0 14,0I2.5 1S,014.5 18,013.0 16,013.0 15.015,0 16.015.0 15.0
Gal10mm
iiifii41.039,040,035,035.036,040.038.040.039.0
ES
volttiijljjlljjjj
825918892860669800926895895871
HTHPiWC
mli!;|||!:!pi
3.42.82.82.82.63.03.03,03.03.0
Mp
••ii'JM'".' ."3,002.503,803.003.203,103.103,003.003^0
EXOWMLimaKg/m3
>!-l:!';!i!!:i!1 1 , 19,314.11 1 . 1n. e1 1 . 51 1 . 51 1 . 11 1 . 11 1 , 8
C«CI2
ko/m3;:|;.i;!|!J!jl>ji
2192312572782S3268268273257268
WFSactMty
!;i!i!!illl!lli0.850.840.810.790.810.810.810.790.810.80
Solids
vol%
14.015.015.516.0'.5.018.016.016.015,516.0
on
vol%Siiiiiinii65,066.063.564.064,061.063,063,063,563,0
Water
vol%
•ill21.019,021.020,021,021.021.021.021.021.0
O/W HOSRATIOvol% K
Illlllllllllllllllllllii
flTn3•II
76-24 46978-22 43775-2576-2475-2574-2675-2575-2575-2575-25
424408474333401401424427
LOS
kO/m3
••I49971 1 513971237143143115127
Sand
voir.Ill» III0250,751.000.750.7C0.751,000*50.75C.75
OOC
_D/xglillillllll!
13910813C1421 1 5
H»
rtjfl/'liilill!
c600c00000
11.1

GEOLAB NOR ASPO Box 5740 FossegrendaN-7002 TrondheimNorway
Tel: (47) 73 964000Fax: (47) 73 965974Tlx: 65706 geono n
Internet: [email protected] noX.400: S=firmapost, O=geolab-nor, A=telemax, C=no
CLIENT:
AMERADA HESSNORGE-—————
REF(S)
1 5 MAI 1998
I ll_l \VJ/ • *» * 9 y-VJi
Knut BakkenOUEDfflcKTORATET
TITLE
Correlation of 25/8-9 (9A) Oils with Oils andOondensate from blocks 25/5,25/6, 25/7 and 25/8
AUTHOR(S)
Peter Barry Hall
GEOLAB PROJECT NO.
62426
DATE
03.04.98
PROJECT MANAGER
Peter Barry Hall, Snr. Scientist Sunil Bharati, Snr. Scie
REPORT NOVFILE PAGE
1 Of 1
Csiiipter l
INTRODUCTION
1.1 General Comments
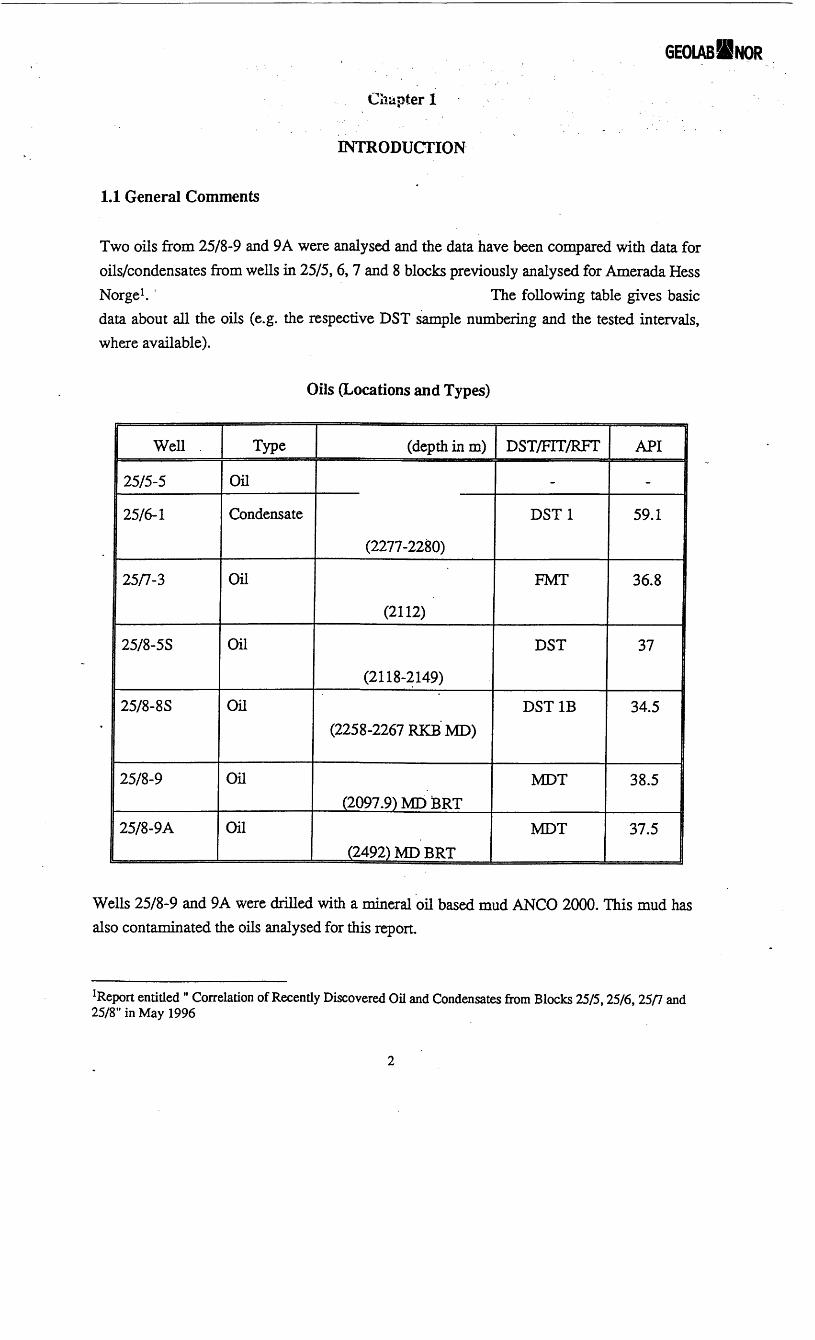
Two oils from 25/8-9 and 9A were analysed and the data have been compared with data foroils/condensates from wells in 25/5, 6, 7 and 8 blocks previously analysed for Amerada HessNorge1. The following table gives basicdata about all the oils (e.g. the respective DST sample numbering and the tested intervals,where available).
Oils (Locations and Types)
Wells 25/8-9 and 9A were drilled with a mineral oil based mud ANCO 2000. This mud hasalso contaminated the oils analysed for this report.
Report entitled " Correlation of Recently Discovered Oil and Condensates from Blocks 25/5,25/6, 25/7 and25/8" in May 1996
Well
25/5-5
25/6-1
25/7-3
25/8-5S
25/8-8S
25/8-9
25/8-9A
Type
Oil
Condensate
Oil
Oil
Oil
Oil
Oil
(depth in m)
(2277-2280)
(2112)
(2118-2149)
(2258-2267 RKBMD)
(2097.9) MD 1BRT
(2492) MD BRT
DST/FTT/RFT
-
DST1
FMT
DST
DST1B
MDT
MDT
API
-
59.1
36.8
37
34.5
38.5
37.5
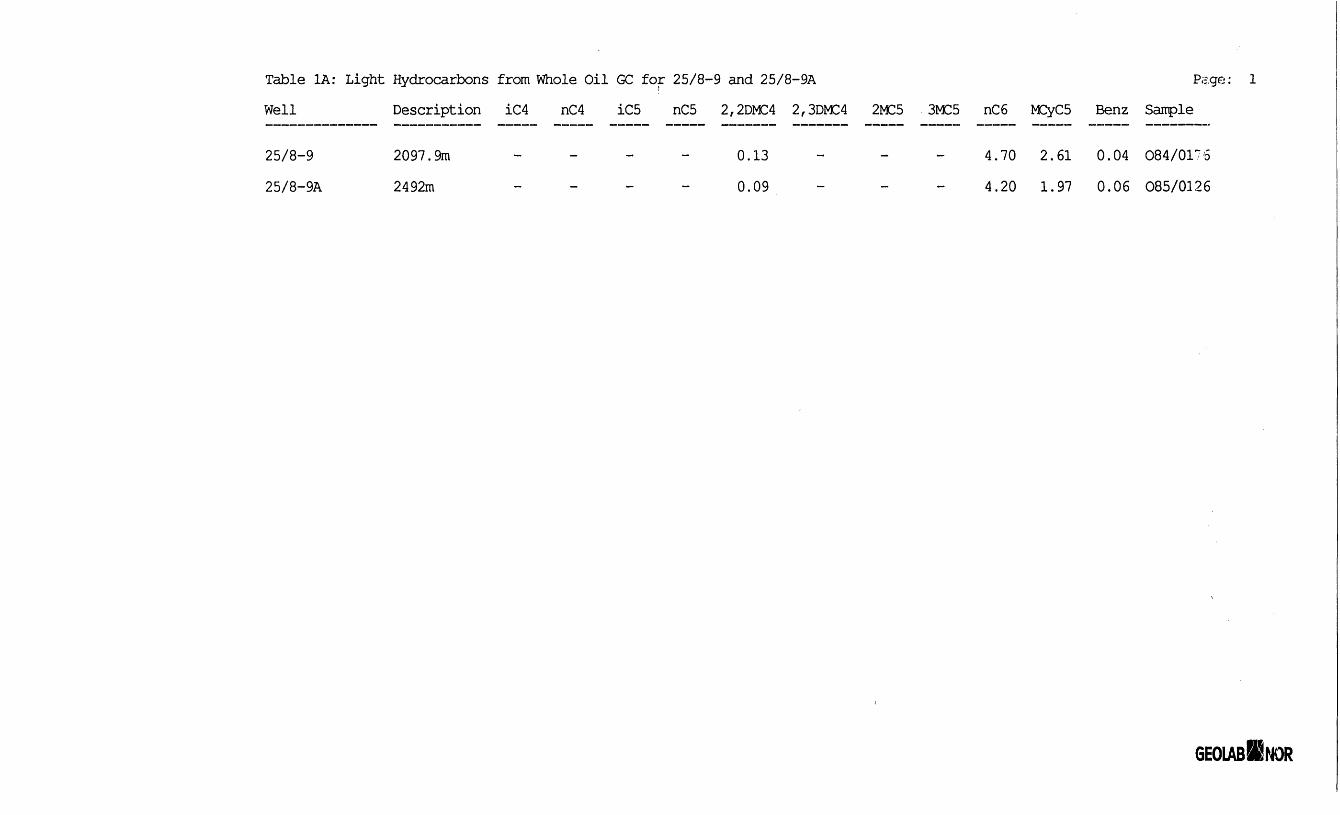
Table 1A: Light Hydrocarbons from Whole Oil GC for 25/8-9 and 25/8-9A Page: 1Well Description iC4 nC4 iC5 nC5 2,2DMC4 2,3DMC4 2MC5 3MC5 nC6 MCyCS Benz Sample
25/8-9 2097.9m - - - - 0.13 - - - 4.70 2.61 0.04 084/017625/8-9A 2492m - 0 .09 - 4.20 1. 9 7 0.06 085/0126
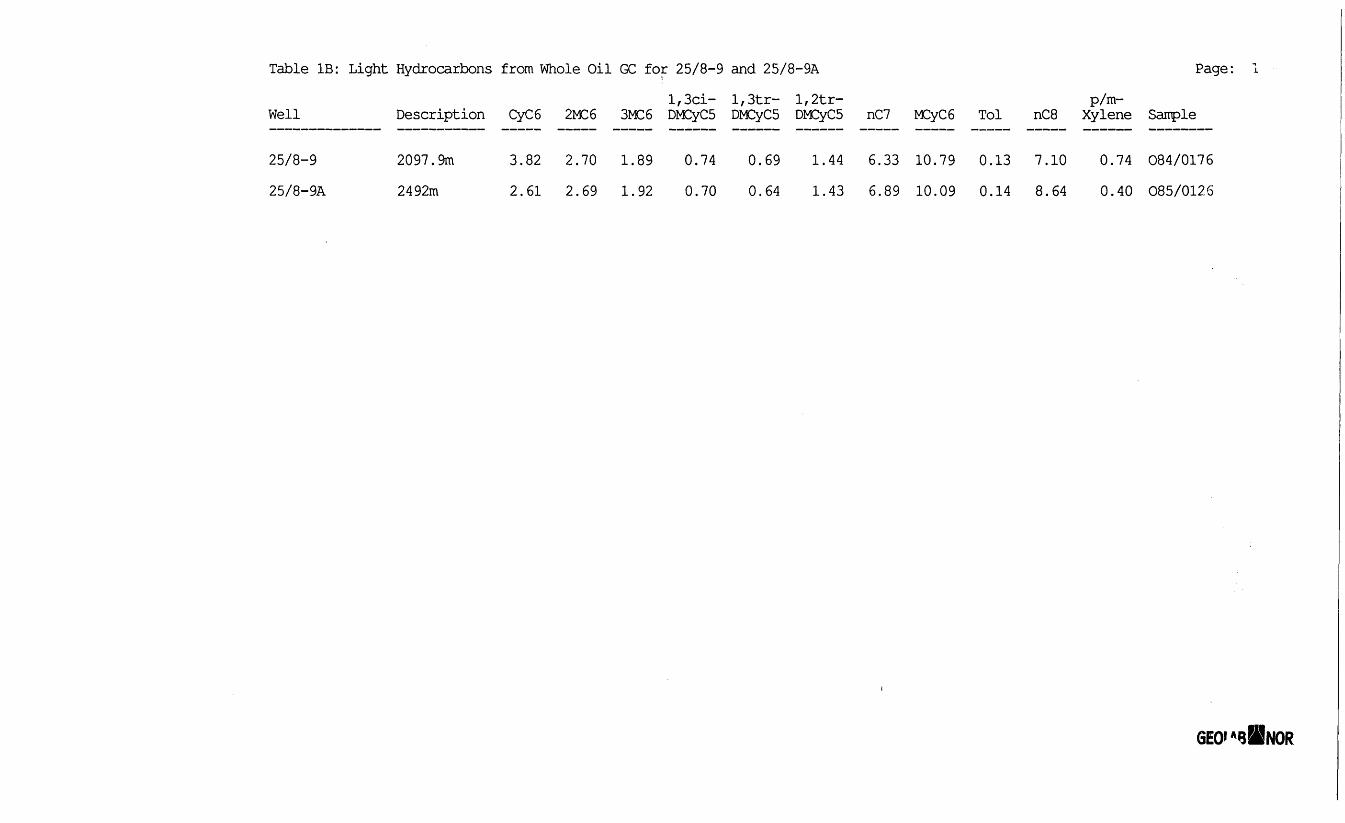
Table IB: Light Hydrocarbons from Whole Oil GC for 25/8-9 and 25/8-9A Page:i- l,3tr- l,2tr- p/m-
Well Description CyC6 2MC6 3MC6 DMCyCS DMCyCS DMCyCS nC7 MCyC6 Tol nC8 Xylene Sample
25/8-9 2097.9m 3.82 2.70 1.89 0.74 0 . 6 9 1.44 6.33 10.79 0.13 7.10 0.74 084/017625/8-9A 2492m 2.61 2 . 6 9 1 . 9 2 0.70 0.64 1.43 6 . 8 9 10.09 0.14 8.64 0.40 085/0126
GEO'*B!BNOR

THOMPSON'S INDICES
Benzene Toluene p/m-xylene Benzene * 10A = ————— B = ————— X = ——————— W = ————————
nC6 nC7 nC8 CyC6
nC6 + nC7 2MC6 + 3MC6 nC7v«* ""* •—•—««•—•^—•—— ^ _„ ————————.———• _..«_.».««.«.___ «_««. - _ ^2 — - - " '
CyC6 + MCyC6 l,3ciDMCyC5 + !,3trDMCyC5 + l,2trDMCyC5 MCyC6
nC7 * 100TI __ ___________..______________________________mm_____.___________._____________________._____._________________________.______________________.._____.
CyC6 + 2MC6 + 2,3DMC4 + 3MC6 + !,3ciDMCyC5 + !,3trDMCyC5 + l,2trDMCyC5 + nC7
CyC6 nC7 nC6_ ____ D _ ._.___ C _ _——.___— —————— j.^ — ————— « — ——————.__
MCyCS 2MC6 2,2DMC4
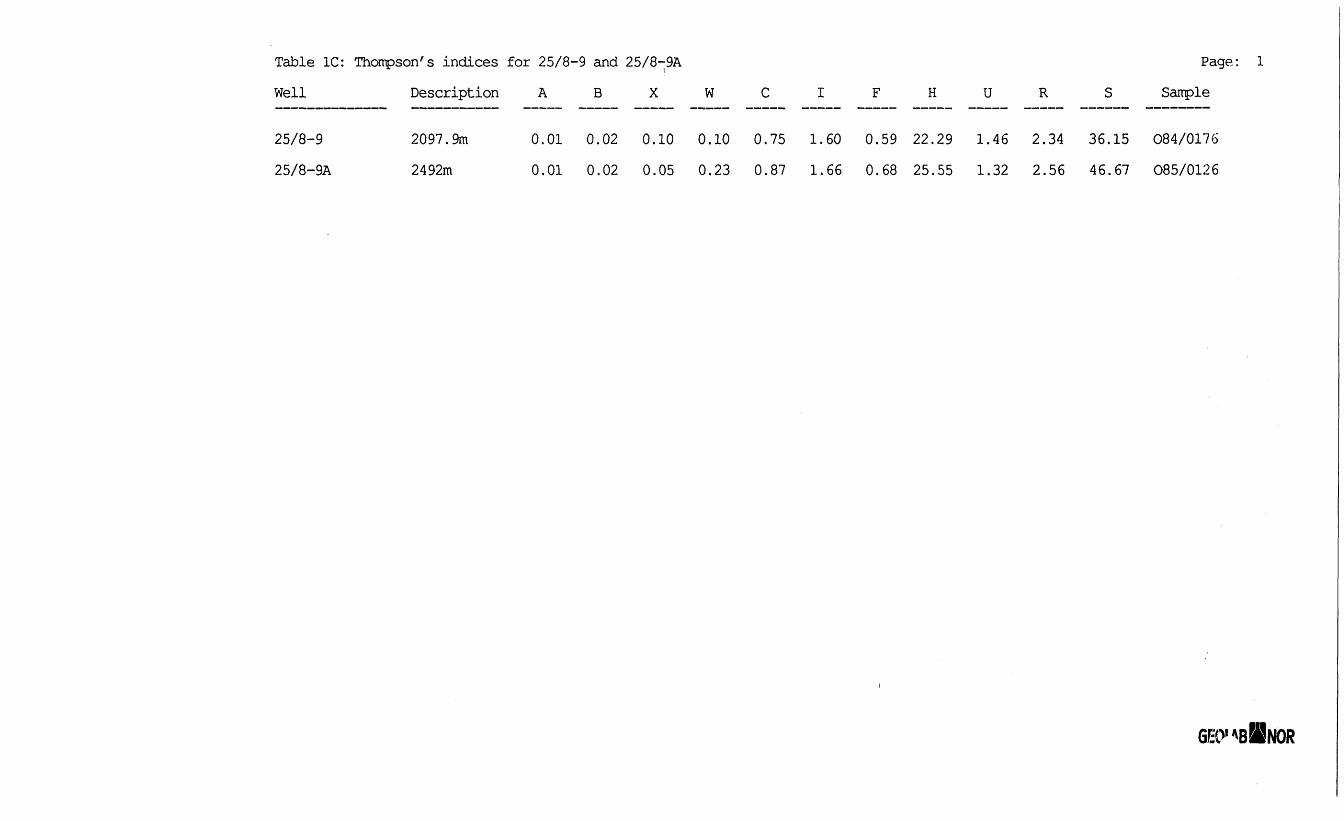
Table 1C: Thonpson's indices for 25/8-9 and 25/8-9A Page: 1
Well Description A B X W C I F H U R S Sample
25/8-9 2097.9m 0.01 0.02 0.10 0.10 0.75 1.60 0.59 22.29 1.46 2.34 36.15 084/0176
25/8-9A 2492m 0.01 0.02 0.05 0.23 0.87 1.66 0.68 25.55 1.32 2.56 46.67 085/0126
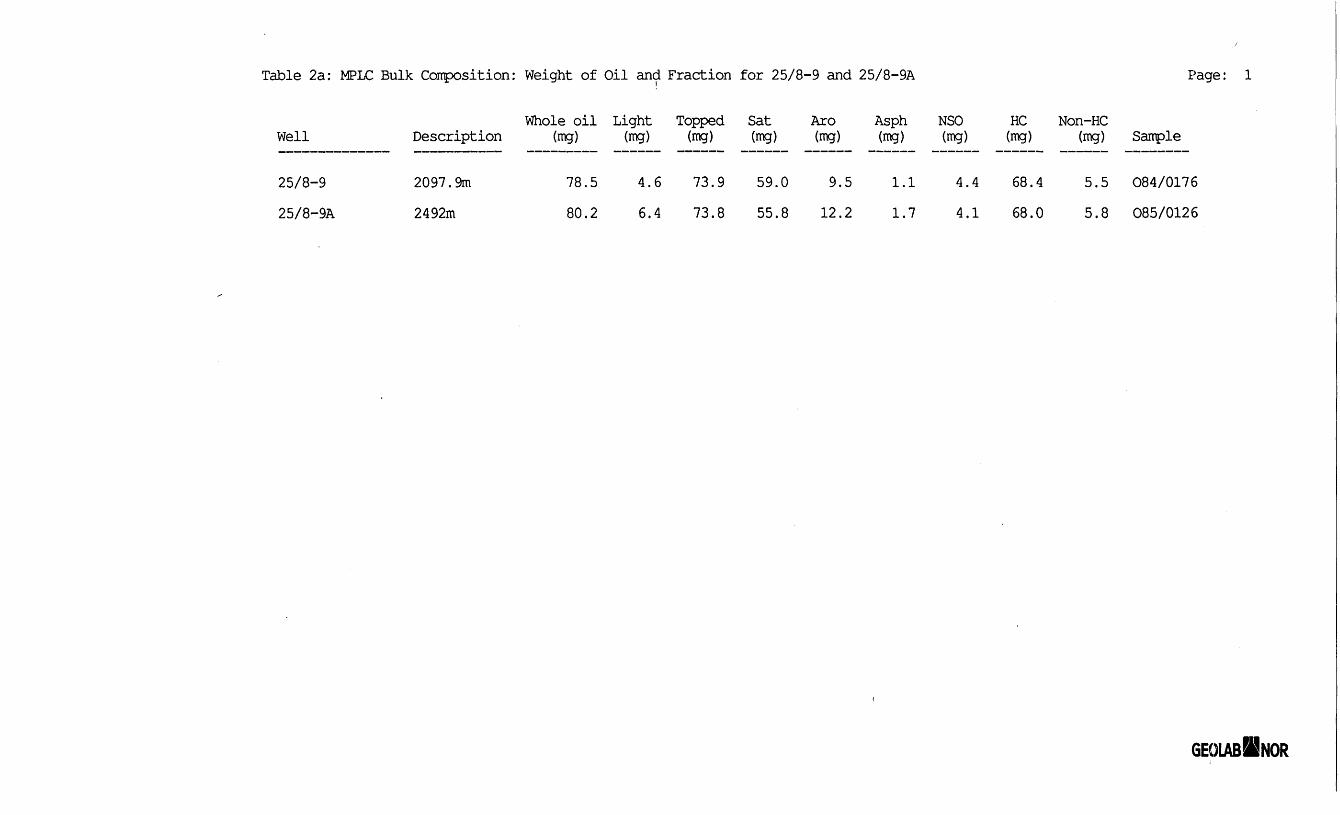
Table 2a: MPLC Bulk Composition: Weight of Oil and Fraction for 25/8-9 and 25/8-9A Page: 1
Well
25/8-925/8-9A
Description
2097.9m2492m
Whole oil I(mg)
78.580.2
Aght(mg)
4 . 66 . 4
Topped(mg)
73.973.8
Sat(mg)
59.055.8
Aro Asph(mg) (mg)
9. 5 1 . 112.2 1.7
NSO HC 1(mg) (mg)
4.4 68.44.1 68.0
fon-HC(mg) Sample
5.5 084/0175.8 085/012
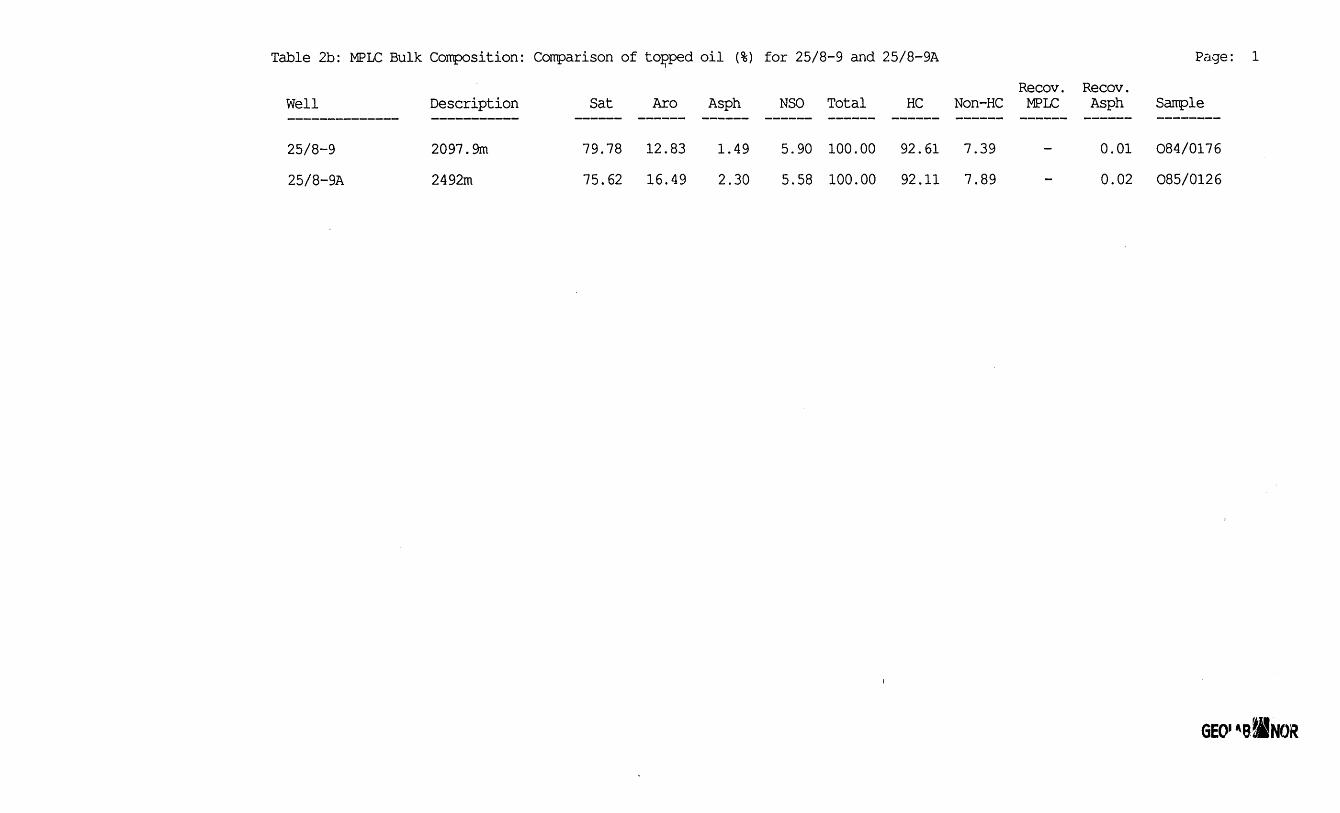
Table 2b: MPLC Bulk Composition: Comparison of topped oil (%) for 25/8-9 and 25/8-9A Page: 1Recov. Recov.
Well Description Sat Aro Asph NSO Total HC Non-HC MPLC Asph Sample
25/8-9 2097.9m 79.78 12.83 1.49 5.90 100.00 92.61 7 .39 - 0.01 O84/017625/8-9A 2492m 75.62 1 6 . 4 9 2.30 5.58 100.00 92.11 7.89 - 0.02 085/0126

Table 2c: MPLC Bulk Composition: Ratios in topped oil for 25/8-9 and 25/8-9A PageSat HC Asp
Well Description Aro Non-HC NSO Sanple
25/8-9 2097.9m 6.22 12.53 0.25 084/017625/8-9A 2492m 4.58 11.68 0.41 085/0126
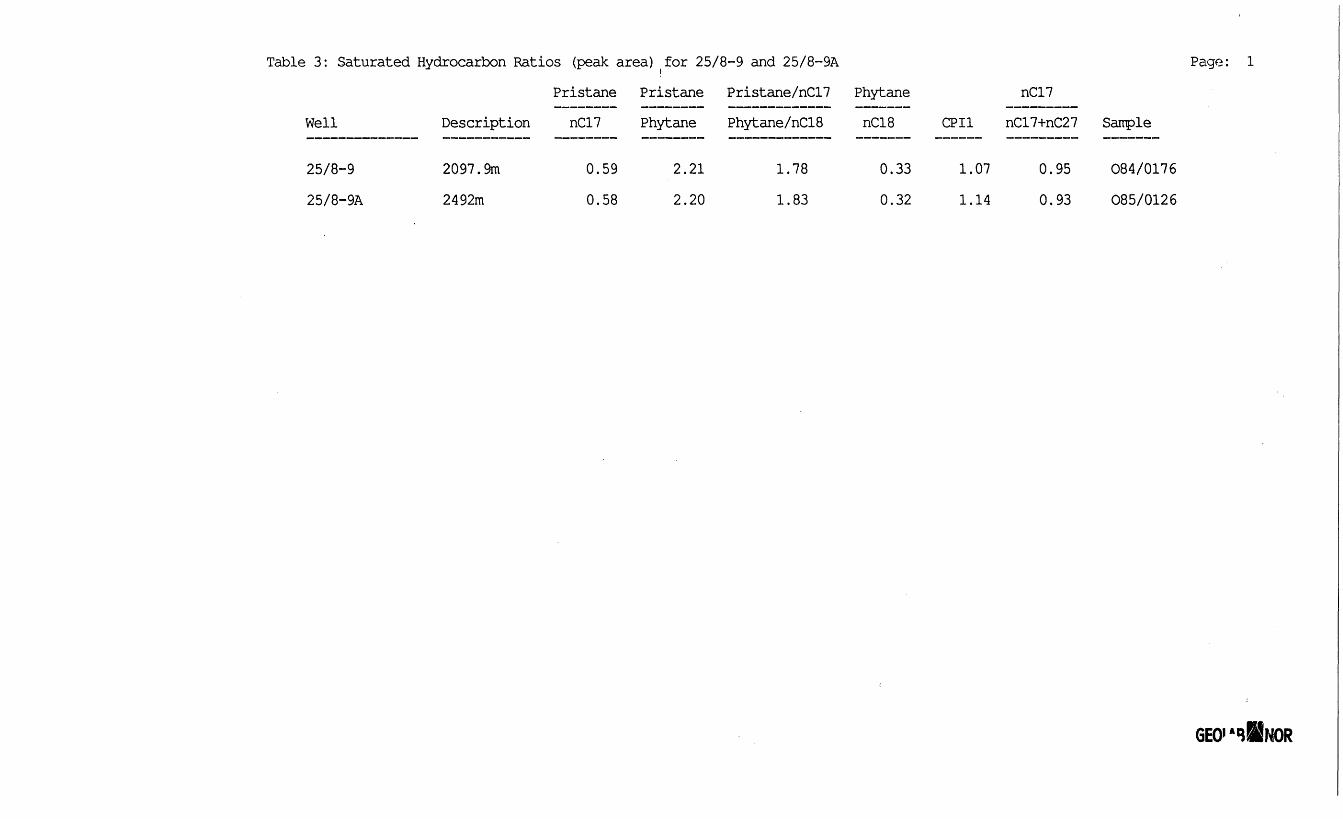
Table 3: Saturated Hydrocarbon Ratios (peak area) for 25/8-9 and 25/8-9A Page: I
Pristane Pristane Pristane/nC17 Phytane nC17Well
25/8-925/8-9A
Description
2097.9m2492m
nC17 Phytane Phytane/nC18
0.590.58
2.212.20
1.781.83
nC18
0.330.32
CPU nC17+nC27
1.071.14
0.950.93
Sample
084/0176085/0126
GEO'*B8fiNOR

Table 4a: Aromatic Hydrocarbon Ratios (peak area)(for 25/8-9 and 25/8-9A Page: 1(3+2)
Well Description MNR DMNR BPhR 2/IMP MPI1 MPI2 Re DBT/P 4/1MDBT /1MDBT Sample
25/8-9 2097.9m 1.83 3.63 0.23 2.17 1 . 6 6 2.35 1.40 - - - 084/017625/8-9A 2492m 1. 9 8 3.93 0.30 2.60 0.80 1.14 0.88 - - - 085/0126
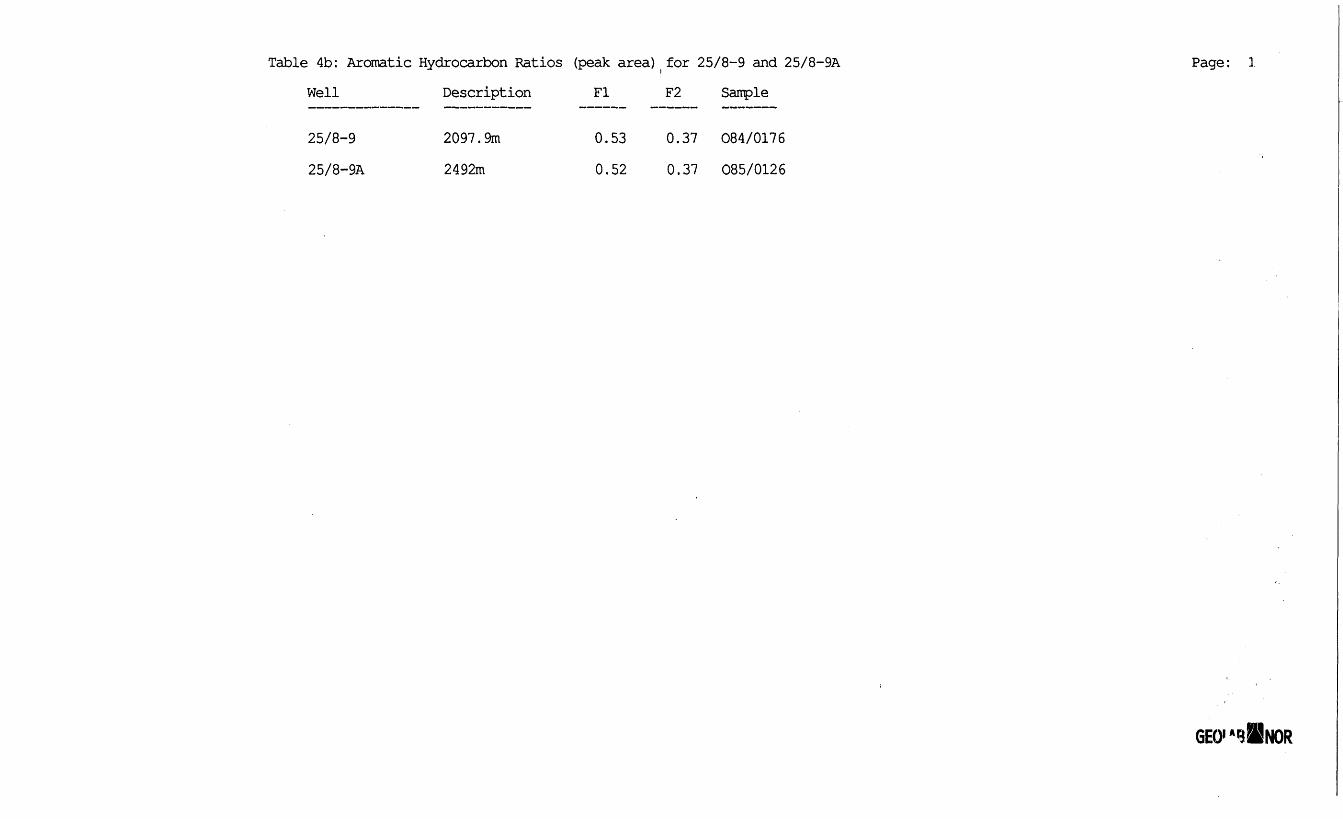
Table 4b: Aromatic Hydrocarbon Ratios (peak area)|for 25/8-9 and 25/8-9A Page: 1Well Description Fl F2 Sample
25/8-9 2097.9m 0.53 0.37 084/017625/8-9A 2492m 0.52 0.37 085/0126
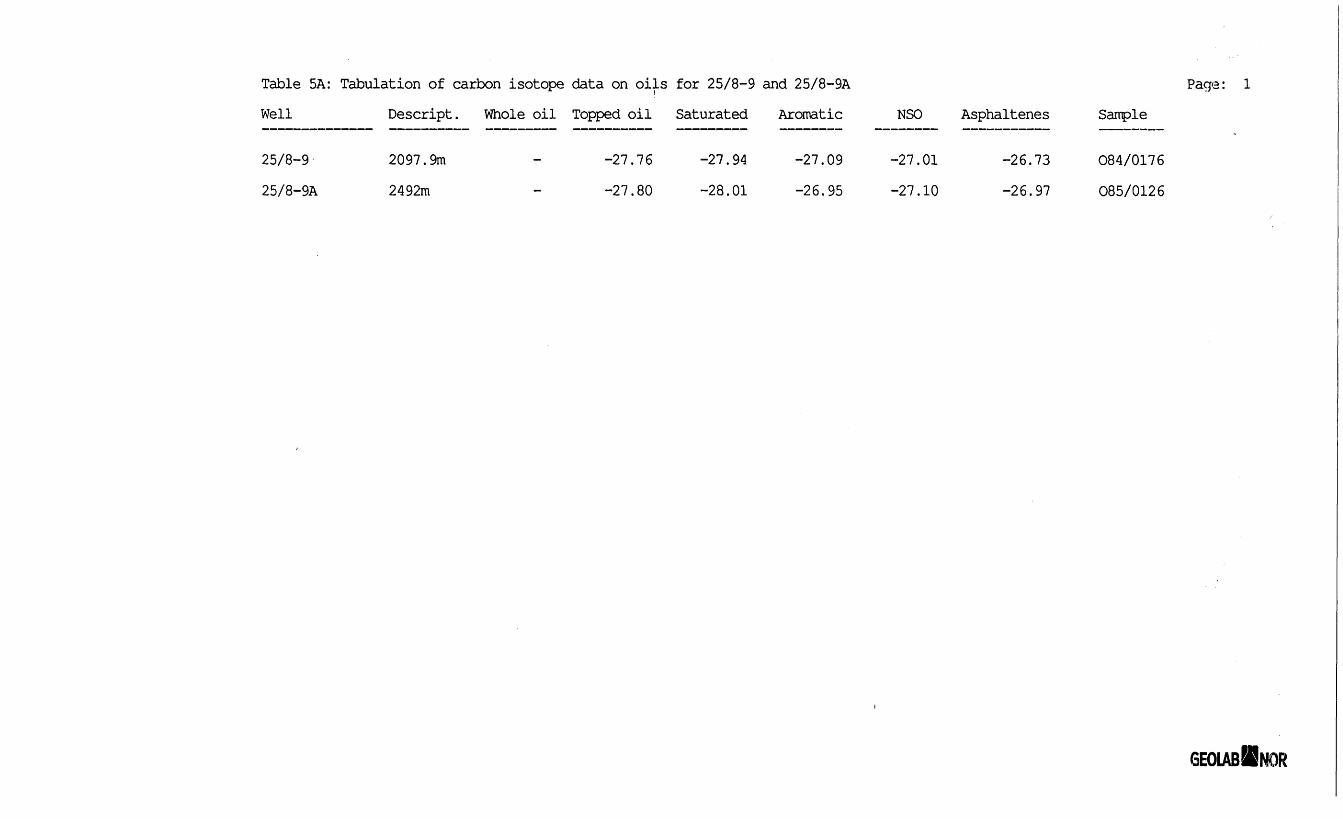
Table 5A: Tabulation of carbon isotope data on oils for 25/8-9 and 25/8-9A Page: 1Well Descript. Whole oil Topped oil Saturated Aromatic NSO Asphaltenes Sample
25/8-925/8-9A
2097.9m2492m
-27.76-27.80
-27 . 94-28.01
-27.09-26.95
-27.01-27.10
-26.73-26.97
084/0176085/0126

Table 5B: Tabulation of cv values from carbon isotope data for 25/8-9 and 25/8-9A Page: 1Well Descript. Saturated Aromatic cv value Sample
25/8-9 2097.9m -27.94 -27.09 -1.10 084/017625/8-9A 2492m -28.01 -26.95 -0.61 085/0126
GEOIAR!E!NOR

Table 6A : Isotope GC of Whole Oil for 25/8-9 and( 25/8-9A2,3DMC4
Well Description iC4 nC4 iC5 nC5 2,3DMC4 CyC5 +CyC5 2MC5 3MC5
Page: 1
nC6 Sample
25/8-925/8-9A
2097.9m2492m
-28.00 -28.70-29.70 -29.30
-28.50 -28.50 -27.50 084/0176-28.30 -29.00 -28.10 C85/0126

Table 6B : Isotope GC of Whole Oil for 25/8-9 andi25/8-9A Page: 1
Well Description MCyCS Benz CyC6 2MC6 3MC6 !,3ciDMCyC5 l,3trDNCyC5 !,2trDMCyC5 Sample
25/8-9 2097.9m -25.80 - -24.60 -27.90 -27.80 - - -26.10 084/017625/8-9A 2492m -26.30 - -26.30 -28.30 -28.30 - - -27.30 085/0126
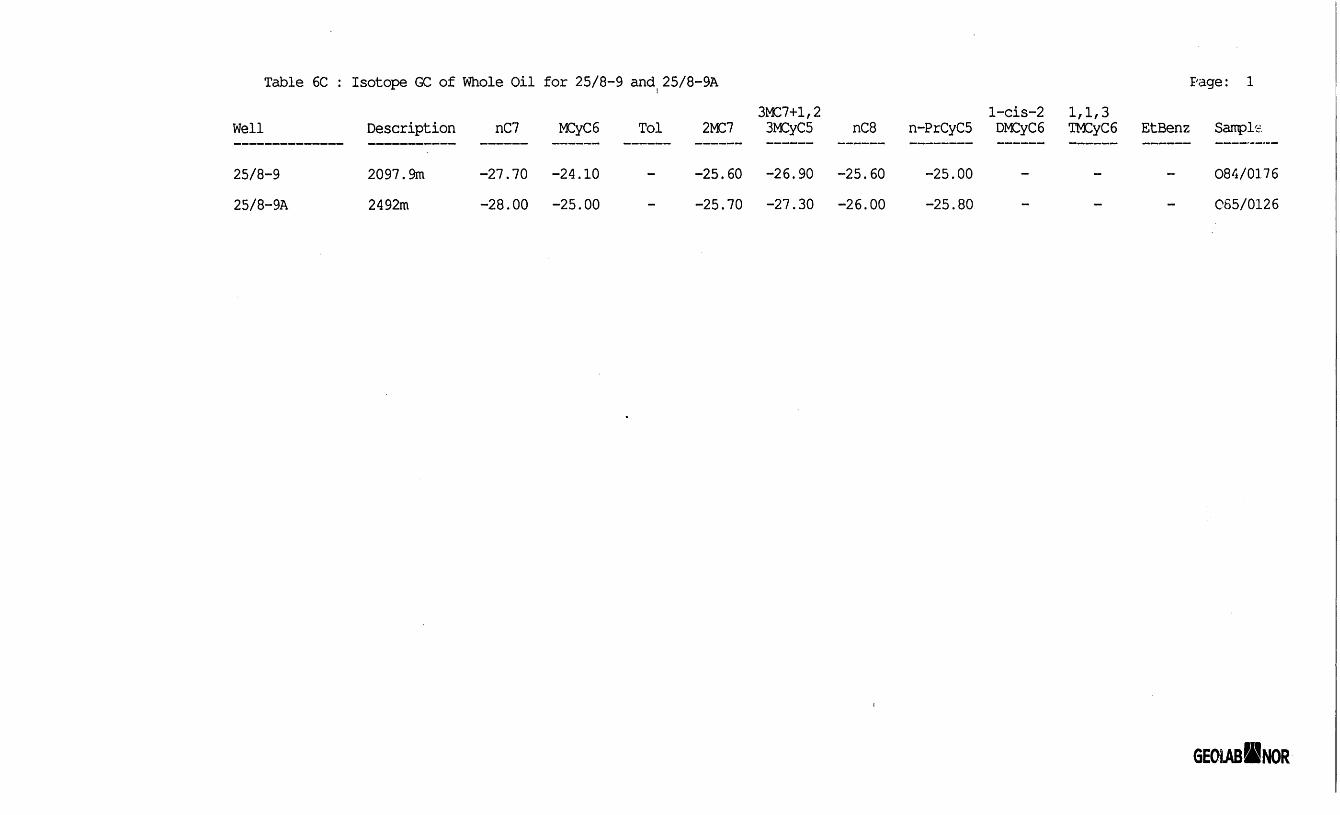
Table 6C : Isotope GC of Whole Oil for 25/8-9 and 25/8-9A Page: 13MC7+1,2 l-cis-2 1,1, 3
Well Description nC7 MCyC6 Tol 2MC7 3MCyC5 nC8 n-PrCyC5 DMCyC6 TMCyC6 EtBenz Sample.
25/8-9 2097.9m -27.70 -24.10 - -25.60 -26.90 -25.60 -25.00 - - - 084/017625/8-9A 2492m -28.00 -25.00 - -25.70 -27.30 -26.00 -25.80 - - - 085/0126
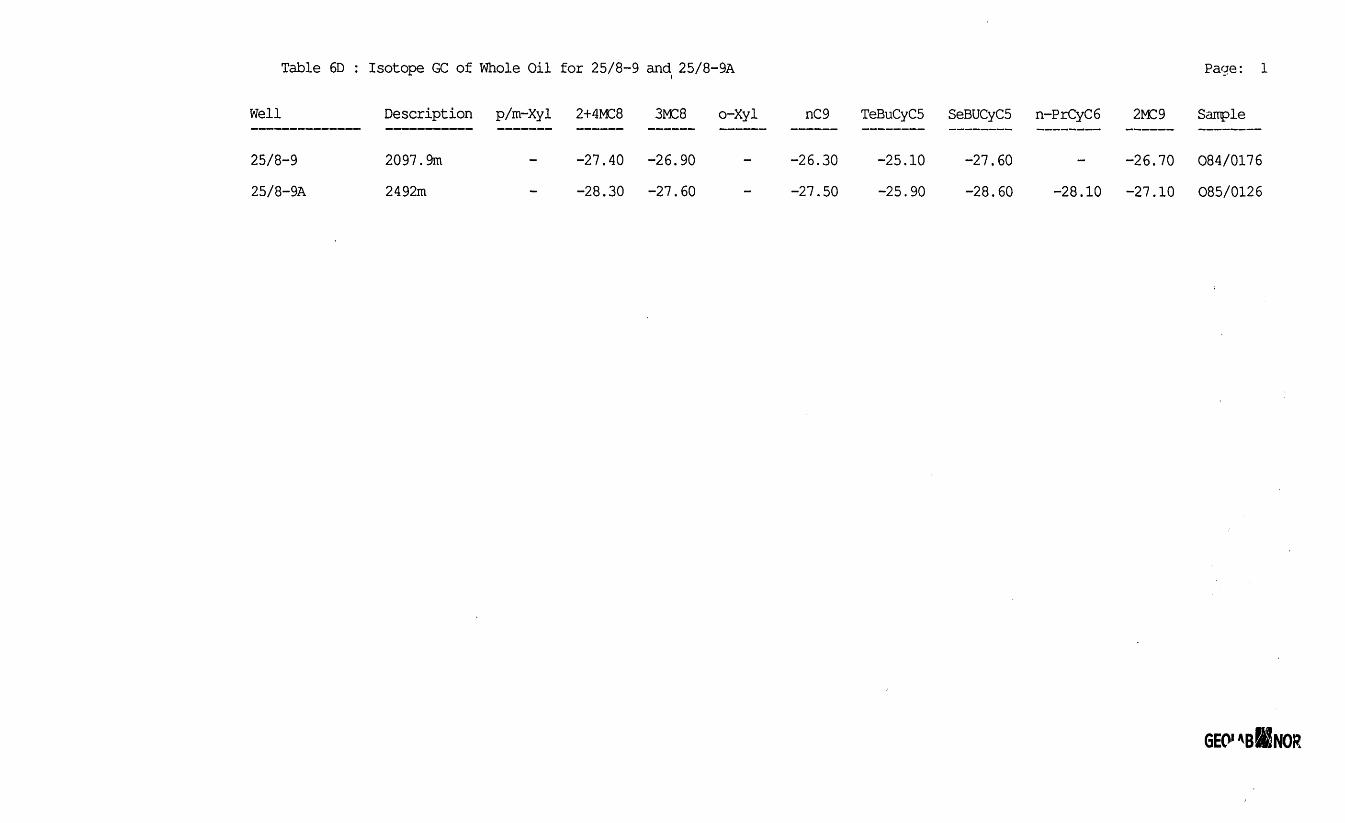
Table 6D : Isotope GC of Whole Oil for 25/8-9 and 25/8-9A Page: 1
Well Description p/m-Xyl 2+4MC8 3MC8 o-Xyl nC9 TeBuCyCS SeBUCyCS n-PrCyC6 2MC9 Sarnple
25/8-9 2097.9m - -27.40 -26.90 - -26.30 -25.10 -27.60 - -26.70 084/017625/8-9A 2492m - -28.30 -27.60 - -27.50 -25.90 -28.60 -28.10 -27.10 085/0126
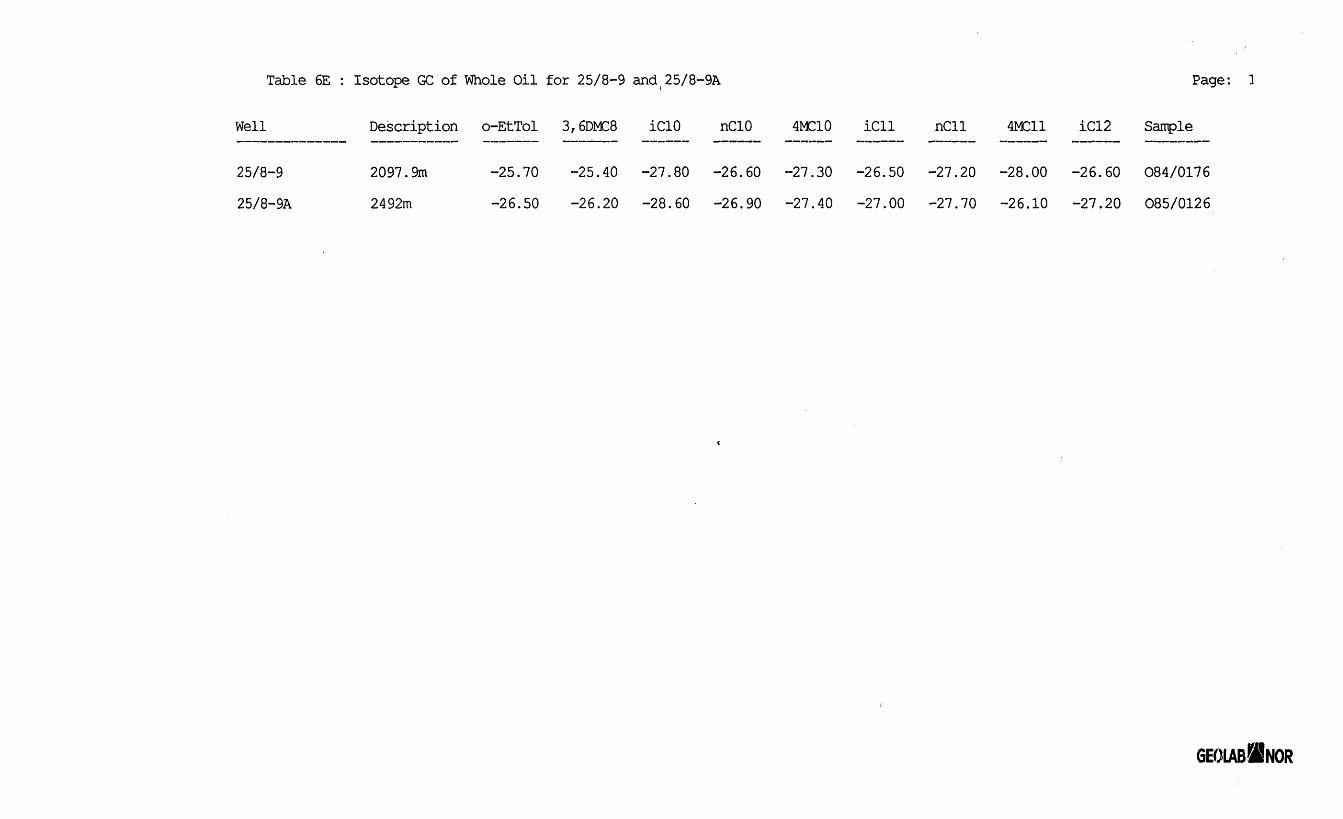
Table 6E : Isotope GC of Whole Oil for 25/8-9 and(25/8-9A Page: 1
Well Description o-EtTol 3,6DMC8 iCIO nCIO 4MC10 iCll nCll 4MC11 iC12 Sample
25/8-9 2097.9m -25.70 -25.40 -27.80 -26.60 -27.30 -26.50 -27.20 -28.00 -26.60 084/017625/8-9A 2492m -26.50 -26.20 -28.60 -26.90 -27.40 -27.00 -27.70 -26.10 -27.20 085/0126
GEOIAB8BNOR
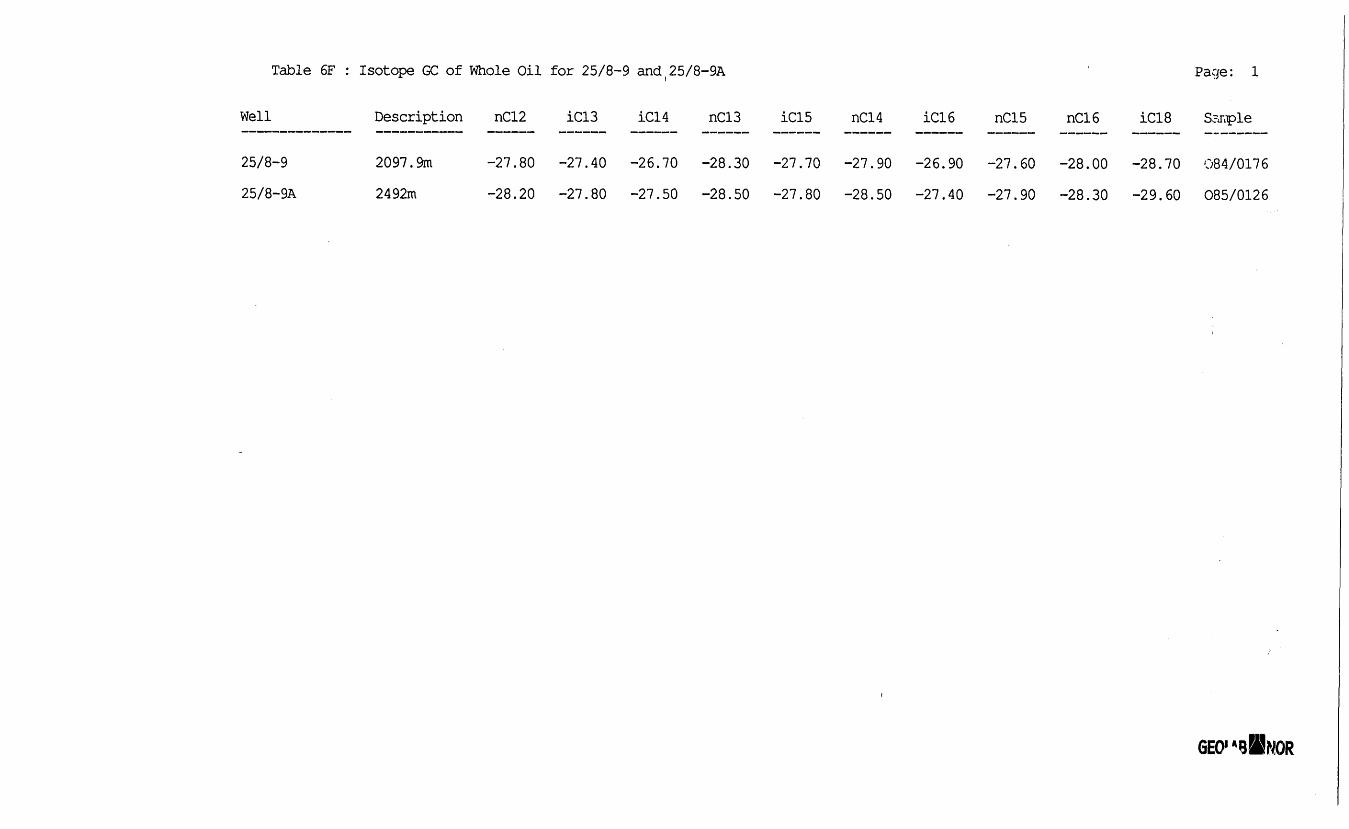
Table 6F : Isotope GC of Whole Oil for 25/8-9 and(25/8-9A ' Page: 1
Well Description nC12 iC13 iC14 nC13 1C15 nC14 iC16 nC15 nC16 iC18 Ssnple
25/8-9 2097.9m -27.80 -27.40 -26.70 -28.30 -27.70 -27.90 -26.90 -27.60 -28.00 -28.70 084/017625/8-9A 2492m -28.20 -27.80 -27.50 -28.50 -27.80 -28.50 -27.40 -27.90 -28.30 -29.60 085/0126
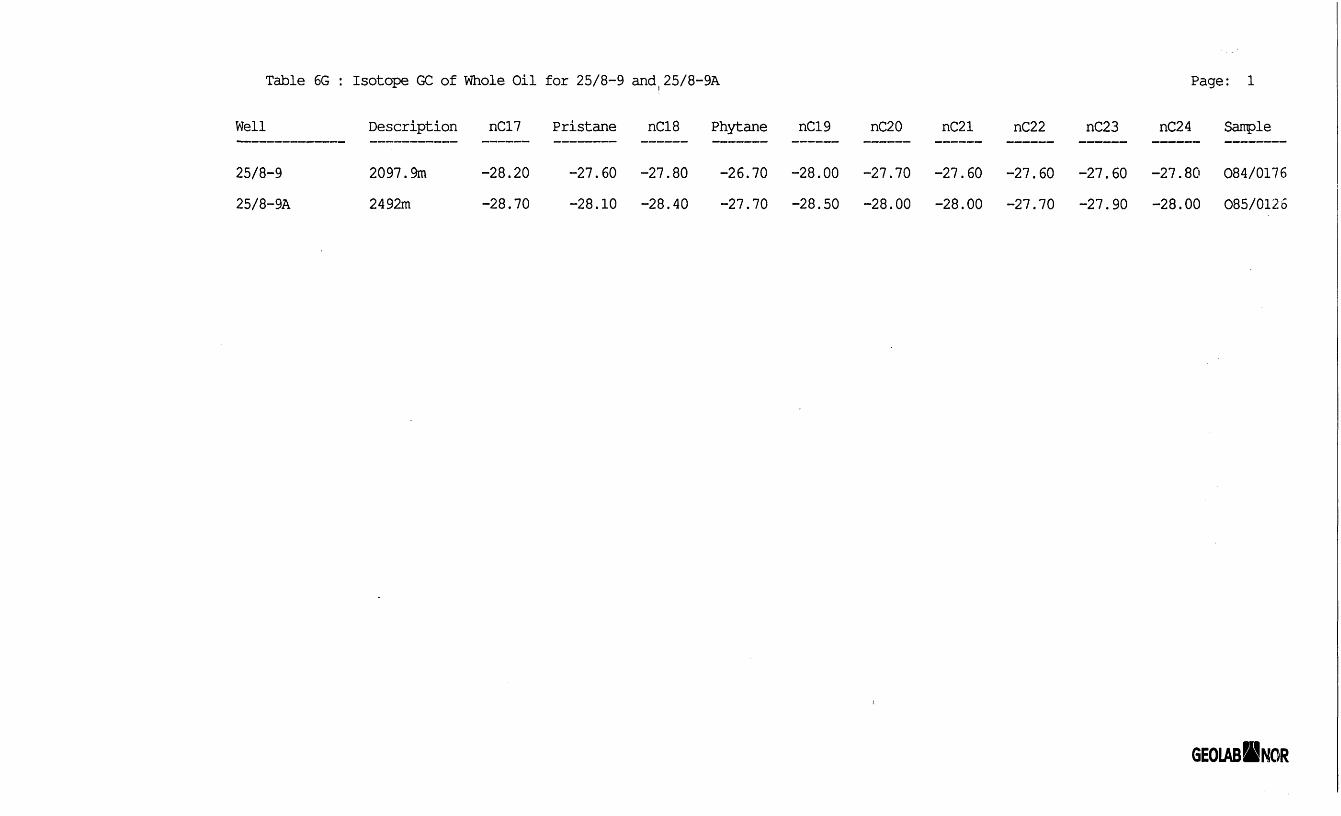
Table 6G : Isotope GC of Whole Oil for 25/8-9 and,25/8-9A Page: 1
Well Description nC17 Pristane nC18 Phytane nC19 nC20 nC21 nC22 nC23 nC24 Sample
25/8-9 2097.9m -28.20 -27.60 -27.80 -26.70 -28.00 -27.70 -27.60 -27.60 -27.60 -27.80 084/017625/8-9A 2492m -28.70 -28.10 -28.40 -27.70 -28.50 -28.00 -28.00 -27.70 -27.90 -28.00 085/0125
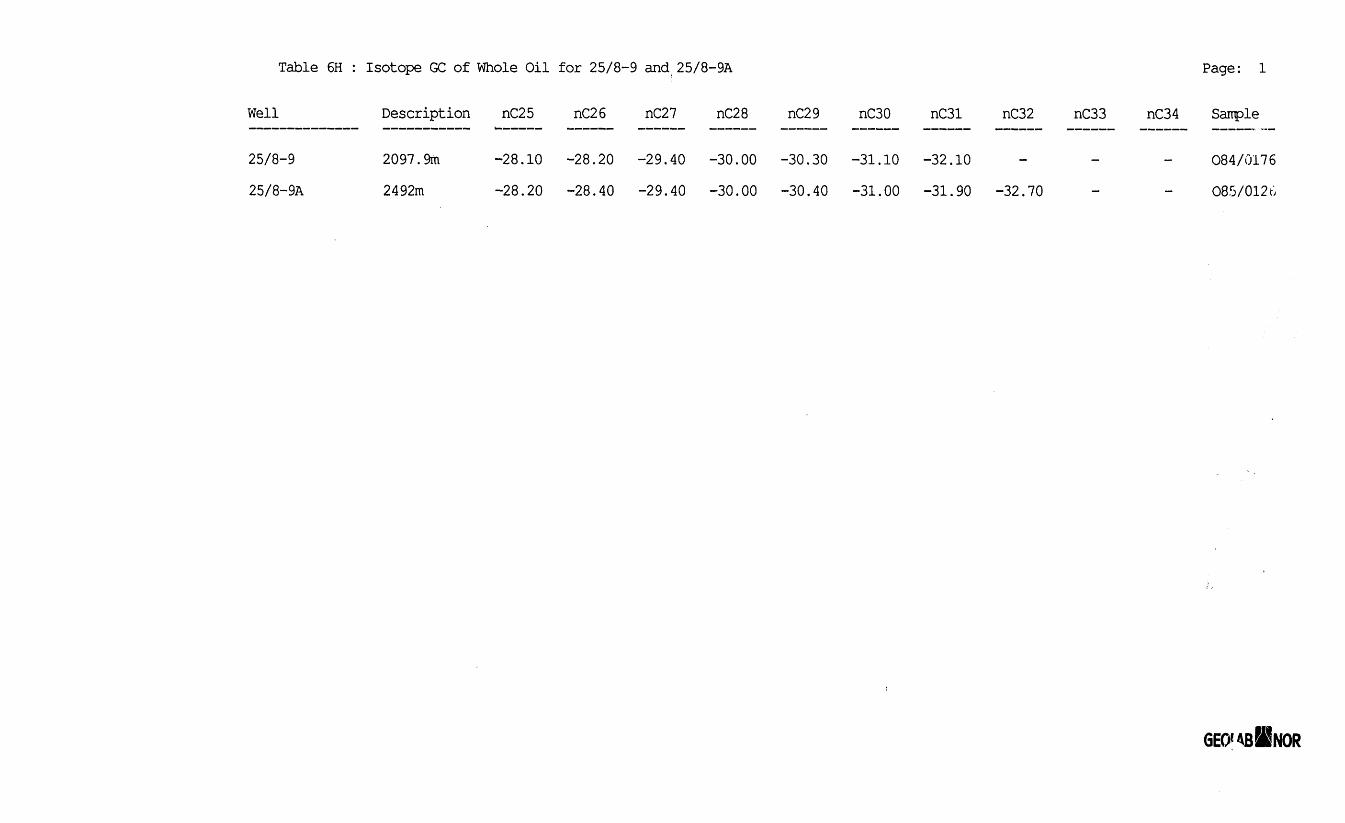
Table 6H : Isotope GC of Whole Oil for 25/8-9 and 25/8-9A Page: 1
Well Description nC25 nC26 nC27 nC28 nC29 nC30 nC31 nC32 nC33 nC34 Sample
25/8-9 2097.9m -28.10 -28.20 -29.40 -30.00 -30.30 -31.10 -32.10 - - - 084/017625/8-9A 2492m -28.20 -28.40 -29.40 -30.00 -30.40 -31.00 -31.90 -32.70 - - 085/0126
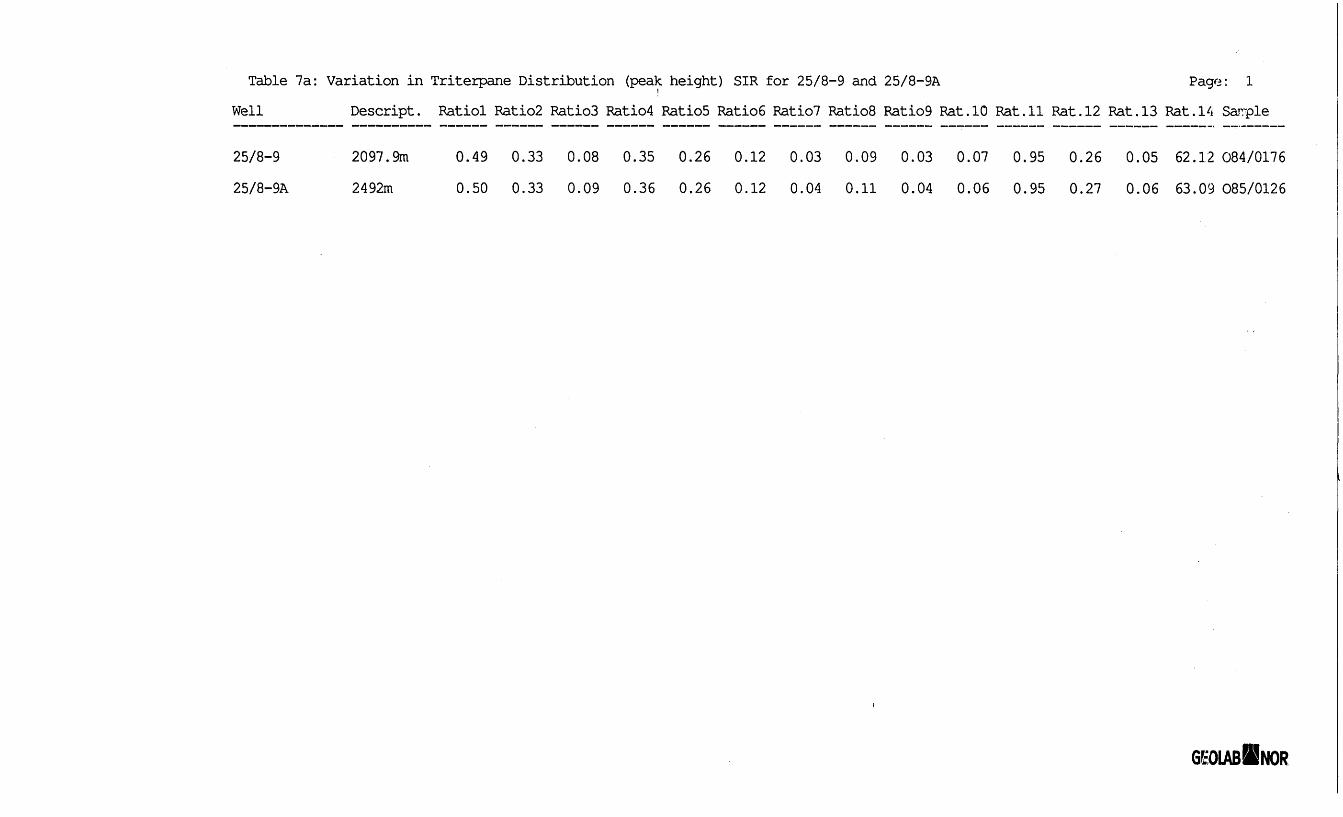
Table 7a: Variation in Triterpane Distribution (peak height) SIR for 25/8-9 and 25/8-9A Page: 1Well Descript. Ratiol Ratio2 RatioS Ratio4 RatioS RatioS Ratio? RatioS Ratio9 Rat.10 Rat.11 Rat.12 Rat.13 Rat.14 Sairple
25/8-9 2097.9m 0.49 0.33 0.08 0.35 0.26 0.12 0.03 0.09 0.03 0.07 0.95 0.26 0.05 62.12 084/017625/8-9A 2492m 0.50 0.33 0.09 0.36 0.26 0.12 0.04 0.11 0.04 0.06 0.95 0.27 0.06 63.09 085/0126

List of Triterpane Distribution Ratios
Ratio 1: 27Tm / 27Ts
Ratio 2: 27Tm / 27TnH-27Ts
Ratio 3: 27Tm / 27Tm+30afl+30fia
Ratio 4: 29afi / 30aii
Ratio 5: 29afi / 29ali+30afl
Ratio 6: 30d / 30aii
Ratio 7: 28al5 / 30al5
Ratio 8: 28ali / 29afi
Ratio 9: 28aft / 28aJ5+30aii
Ratio 10: 24/3 / 30aii
Ratio 11: 30ali / 30aft+301ia
Ratio 12: 29aft+29fta / 29ai5+29iia+30aB+30l5a
Ratio 13: 29fia+301ia / 29ai5+30aii
Ratio 14: 32afiS / 32aIiS+32aliR (%)
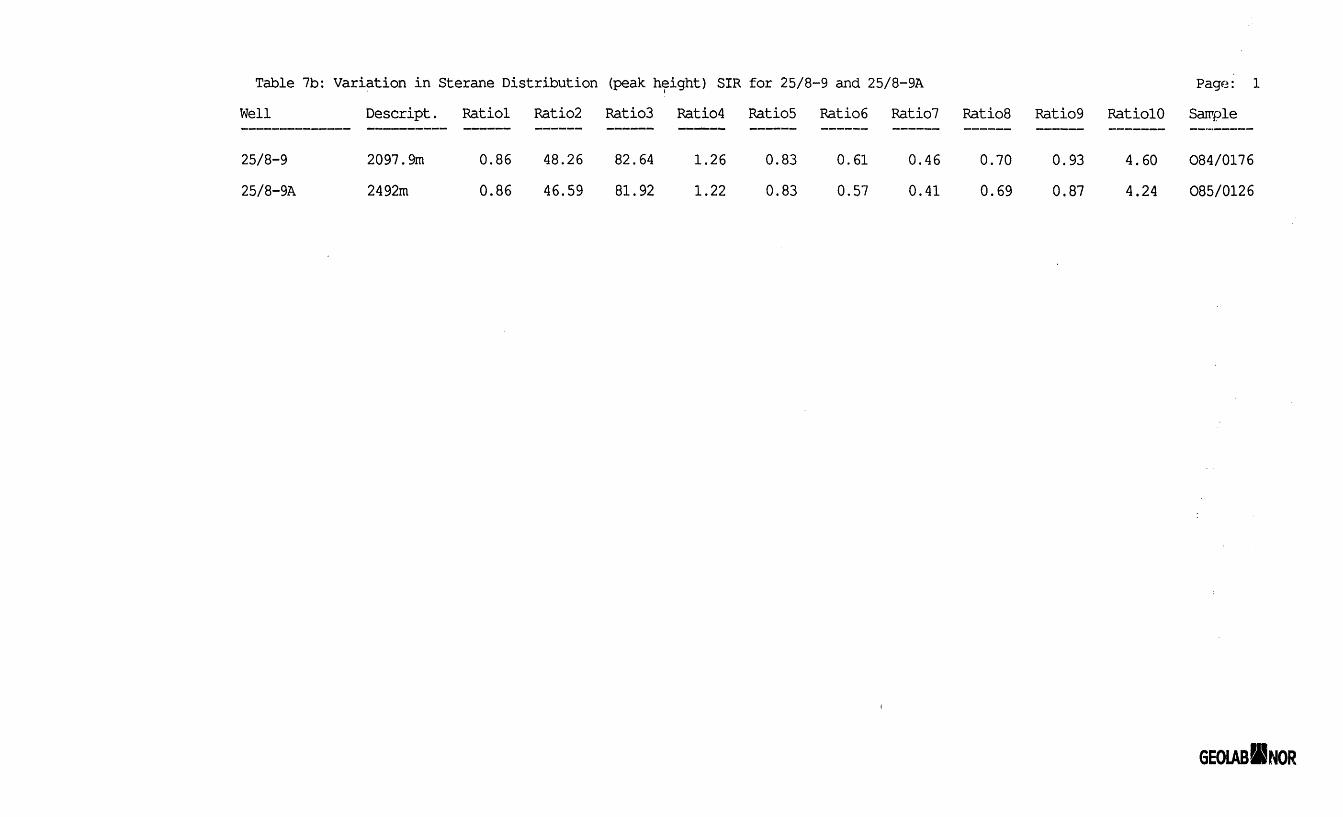
Table 7b: Variation in Sterane Distribution (peak height) SIR for 25/8-9 and 25/8-9A Page: 1Well Descript. Ratiol Ratio2 Ratio3 Ratio4 Ratios RatioS Ratio? RatioS Ratio9 RatiolO Sample
25/8-925/8-9A
2097.9m2492m
0.860.86
48.264 6 . 5 9
82.6481.92
1.261.22
0.830.83
0.610.57
0.460.41
0.700 . 6 9
0.930.87
4.60 084/01764.24 085/0126

List of Sterane Distribution Ratios
Ratio 1: 27dfcS / 27dBS+27aaRRatio 2: 29aaS / 29aaS+29aaR (%)RatioS: 2*(29BBR+29BBS) / (29aaS+29aaR + 2*(29BBR+29BBS)) (%)Ratio 4: 27dBS+27dfiR+27daR+27daS / 29dBS+29dliR+29daR+29daSRatio 5: 29BBR+29BBS / 29BBR+29BBS+29aaSRatio 6: 21a+22a / 21a+22a+29aaS+29BBR+29BBS+29aaRRatio 7: 21a+22a / 21a+22a+28daS+28aaS+29daR+29aaS+291iiiR+291iIiS+29aaRRatio 8: 291M5R+29iMiS / 29aaS+29BBR+29B15S+29aaRRatio 9: 29aaS / 29aaRRatio 10: 29BBR+29BBS / 29aaR

Table 7c: Raw triterpane data (peak height) m/z 191 SIR for 25/8-9 and 25/8-9AWell Descript.
25/8-9
25/8-9A
2097.9m
2492m
23/3
29aB
31aJ5R
566.71863.6771.1
672.52385.31096.1
24/3
29Ts
32aJiS
353964719
4061279
953
.0
.0
.0
.3
.2
.2
25/3
30d
32aftR
81.3639.1438.4
103.4834.7557.6
24/4
29iia
33aliS
303.8101.5311.8
399.6183.2382.2
26/3
300
33aflR
54.00.0
167.9
72.20.0
199.3
27Ts
30aii
34aftS
10005263103
13926688132
.3
.2
.7
.4
.4
.6
27Tm
30iia
34afiR
490.4255.2
63.2
698.6335.2
72.5
28afl 25nor30afi Sample
30G
35aiiS
172.00.0
57.1
259.10.0
62.7
31afiS
35aBR
44.1551.
31.
66.2026.
31.
7 084/017644
2 085/012687
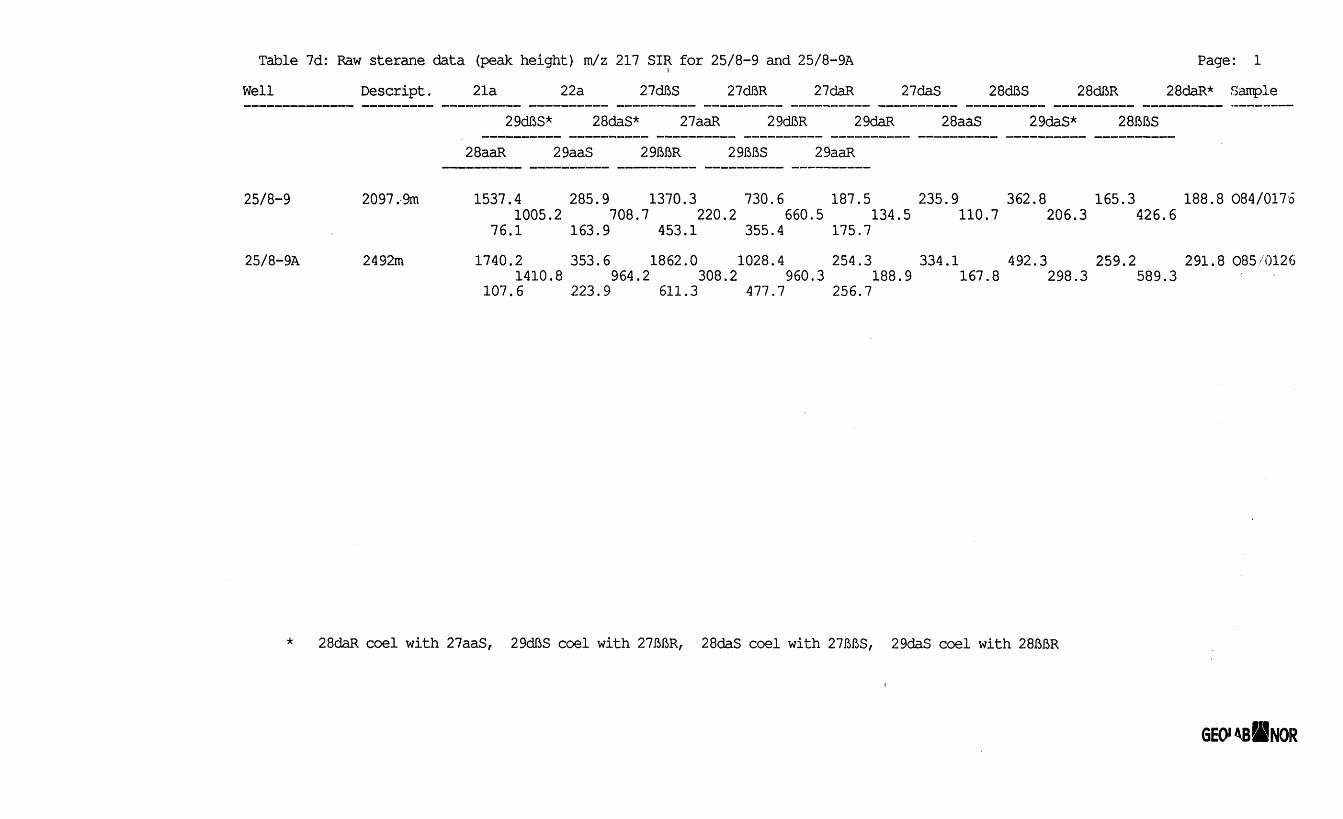
Table 7d: Raw sterane data (peak height) m/z 217 SIR for 25/8-9 and 25/8-9A Page: 1
Well Descript. 21a 22a 27dftS 27dflR 27daR 27daS 28df5S 28dfiR 28daR* Sample
29dftS* 28daS* 27aaR 29df5R 29daR 28aaS 29daS* 28iMbS
28aaR 29aaS 29fMiR 29IM5S 29aaR
25/8-9 2097,9m 1537.4 285.9 1370.3 730.6 187.5 235.9 362.8 165.3 188.8084/01761005.2 708.7 220.2 660.5 134.5 110.7 206.3 426.6
76.1 163.9 453.1 355.4 175.7
25/8-9A 2492m 1740.2 353.6 1862.0 1028.4 254.3 334.1 492.3 259.2 291.8 085/01261410.8 964.2 308.2 960.3 188.9 167.8 298.3 589.3
107.6 223.9 611.3 477.7 256.7
* 28daR coel with 27aaS, 29dftS coel with 27iifiR, 28daS coel with 27MS, 29daS coel with

Table 7e: Raw sterane data (peak height) m/z 218 SIR for 25/8-9 and 25/8-9A
Well
25/8-9
25/8-9A
Descript .
2097.9m
2492m
27fiJBR
786.7
1054.0
27MS
864.6
1199.0
28IMiR
294.3
438.8
281ifiS
559.6
816.3
29JMiR
716.7
932.7
29IM5S
597.
851.
9
1
30I5I5R
50.4
83.2
Page : 1
30fifiS
55.9
80.5
Sample
084/017
085/012

Table 7f: Raw triterpane data (peak height) m/z 177 SIR for 25/8-9 and 25/8-9A Page: 1Well Descript. 25nor28aft 25nor30aJi Sanple
25/8-9 2097.9m 2 9.7 19.4 084/017625/8-9A 2492m 6 2 . 6 36.4 085/0126

Table 8a: Variation in Triaromatic Sterane Distribution (peak height) for 25/8-9 and 25/8-9AWell Descript. Ratiol Ratio2 RatioS Ratio4 RatioS Sample
Page: 1
25/8-9
25/8-9A
2097.9m
2492m
0.46
0.47
0.47
0.45
0.24
0.25
0.23
0.24
0.29
0.32
084/0176
085/0126
Ratiol: al / al + glRatio2: bl / bl + glRatio3: al + bl / al + bl + cl + dl + el + fl + gl
Ratio4: al / al + el + fl + glRatioS: al / al + dl
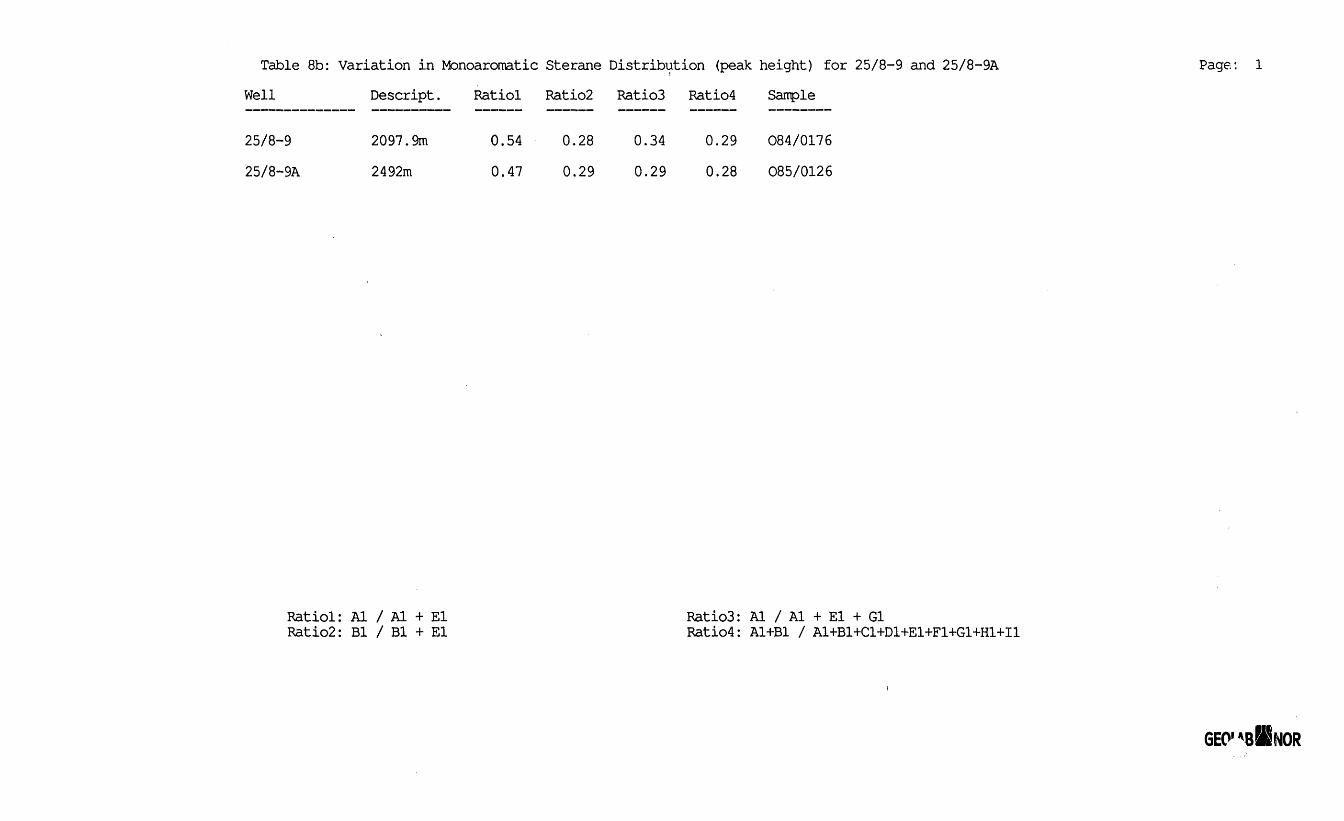
Table 8b: Variation in Monoaromatic Sterane Distribution (peak height) for 25/8-9 and 25/8-9AWell Descript. Ratiol Ratio2 RatioS Ratio4 Sanple
Page
25/8-925/8-9A
2097.9m2492m
0.540.47
0.280.29
0.340.29
0.290.28
084/0176085/0126
Ratiol: Al / Al + ElRatio2: Bl / Bl + El
Ratio3: Al / Al + El + GlRatio4: A1+B1 / A1+B1+C1+D1+E1+F1+GH-H1+I1
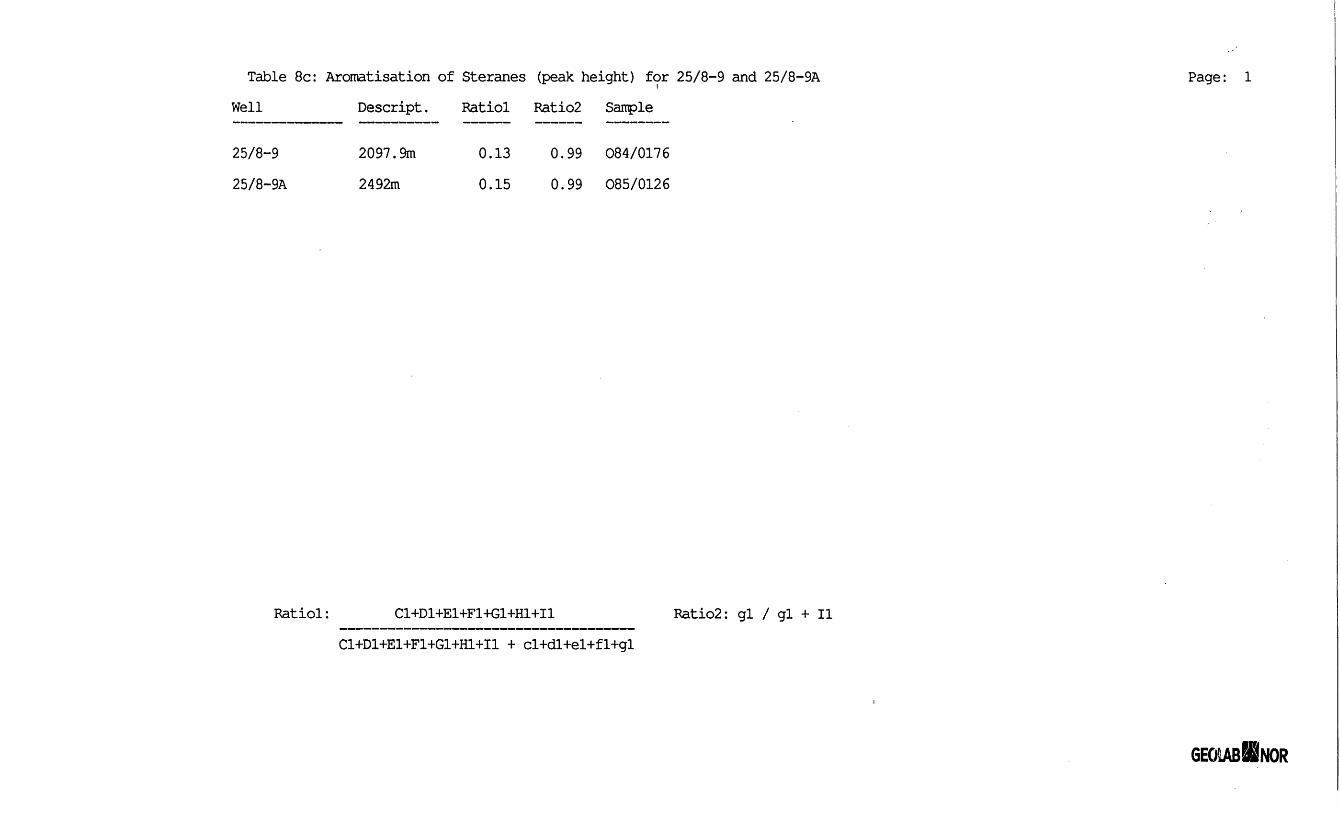
Table 8c: Aromatisation of Steranes (peak height) for 25/8-9 and 25/8-9A Page: 1Well Descript. Ratiol Ratio2 Sanple
25/8-9 2097.9m 0.13 0 . 9 9 084/017625/8-9A 2492m 0.15 0 . 9 9 085/0126
Ratiol: C1+D1+E1+F1+G1+H1+I1 Ratio2: gl / gl + IIC1+D1+E1+F1+G1+H1+I1 + cl+dl+el+fl+gl

Table 8d: Raw triaromatic sterane data (peak height) m/z 231 for 25/8-9 and 25/8-9A Page: 1Well Descript. al bl cl dl el fl gl Sample
25/8-925/8-9A
2097.9m2492m
527.9591.7
541.5555.8
236.0233.1
1308.01280.7
6 6 6 . 7713.2
500.6528.0
612. 66 6 6 . 7
084/0176085/0126

Table 8e: Raw monoaromatic sterane data (peak height) m/z 253 for 25/8-9 and 25/8-9A Page: 1Well Descript. Al Bl Cl Dl El Fl Gl HI II Sample
25/8-925/8-9A
2097.9m2492m '
157.3154.7
51 . 970.5
6 6 . 157.8
34.738.8
133.2173.1
13. 61 2.9
172.1212.8
72.376.7
9.0 088.2 03
GEOLAB NOR ASPO Box 5740 FossegrendaN-7002 TrondheimNorway
Tel: (47) 73 964000Fax: (47) 73 968728Tlx: 65706 geono n
Internet: [email protected] noX.400: S=firmapost, O=geolab-nor, A=telemax, C=no
CLIENT:
AMERADA HESS NORGE
REF(S)Contract No. AHN/CO/94/018
Knut Bakken
TITLE
Geochemical report on NOCS 25/8-9A
AUTHOR(S)
Peter Barry Hall
GEOLAB PROJECT NO.
62324
DATE
3.06.97
PROJECT MANAGER
Peter Barry Hall, Snr. Scientist
QA RESPONSIBLE
Kjell Arne Bakken, Snr. Scientist
REPORT N07FILE PAGE
1 Of 1
2 1 JULI 1997
'ERTOIJ6DIREKTORATE7

Chapter 1
INTRODUCTION
The well NOGS 25/8-9A was drilled (25/8-9 spudded in January 1997) by Amerada Hess Norgein the area south-east of the Heimdal field (block 25/4) and north-east of Balder field (blocks25/10 and 25/11) in the Jotun Field area (Figure 1). The water depth was 125 m and the rotary
table (RT) was 150 m above the sea floor and 25 m above sea level. All depths are given relative
to RT unless otherwise specified.
Samples, including canned cuttings samples, side-wall cores and conventional cores, were
supplied by Amerada Hess together with samples of mud and the mineral oil additive to the drill-mud to Geolab Nor's laboratory in Trondheim.
The analytical program included both screening and follow-up analysis, where samples wereselected for the latter programme after agreement with Knut Bakken, Amerada Hess.
The report is divided into chapters according to the applied analytical methods. The results are
generally discussed in a (descending) stratigraphic context.
1.1 General Well Information
The samples were received as canned cuttings samples, side-wall cores and conventional core
samples. The sample quality was generally good, and with sufficient amounts of sample materialfor analysis (both screening and follow-up analysis). Any superficial contamination wasremoved from the core and side-wall core samples. Use of the mineral oil drilling mud has
caused some analytical problems, due to contamination of the extractable hydrocarbons,particularly in cuttings samples and all samples with low concentrations of in-situ hydrocarbons.
GEOLAB!GNOR
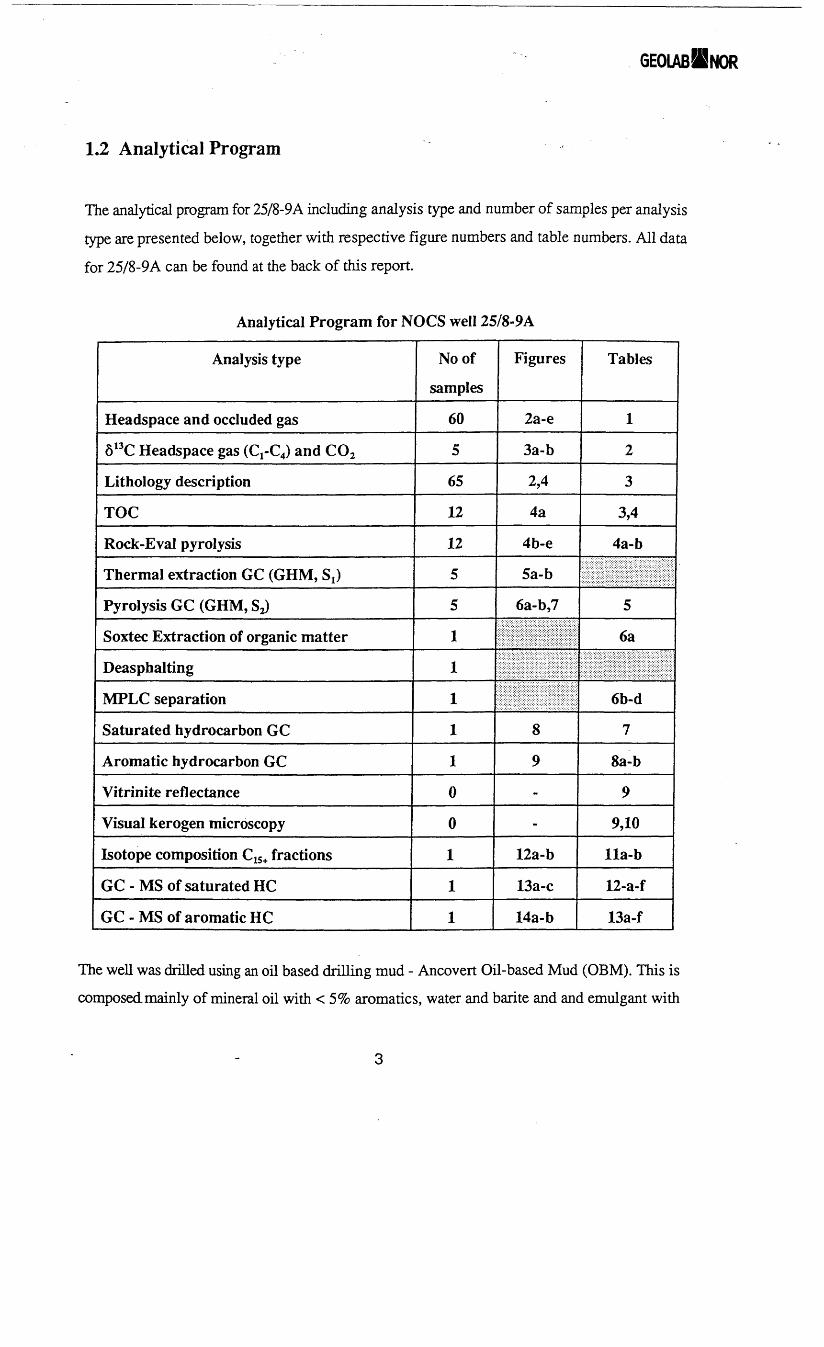
1.2 Analytical Program
The analytical program for 25/8-9A including analysis type and number of samples per analysis
type are presented below, together with respective figure numbers and table numbers. All data
for 25/8-9A can be found at the back of this report.
Analytical Program for NOCS well 25/8-9A
Analysis type
Headspace and occluded gas
613C Headspace gas (CrC4) and CO2
Lithology description
TOC
Rock-Eval pyrolysis
Thermal extraction GC (GHM, St)
Pyrolysis GC (GHM, S J
Soxtec Extraction of organic matter
Deasphalting
MPLC separation
Saturated hydrocarbon GC
Aromatic hydrocarbon GC
Vitrinite reflectance
Visual kerogen microscopy
Isotope composition C15+ fractions
GC - MS of saturated HC
GC- MS of aromatic HC
No of
samples
60
5
65
12
12
5
5
1
1
1
1
1
0
0
1
1
1
Figures
2a-e
3a-b
2,4
4a
4b-e
5a-b
6a-b,7
8
9
-
-
12a-b
13a-c
14a-b
Tables
1
2
3
3,4
4a-b
5
6a
6b-d
7
8a-b
9
9,10
lla-b
12-a-f
13a-f
The well was drilled using an oil based drilling mud - Ancovert Oil-based Mud (OEM). This iscomposed mainly of mineral oil with < 5% aromatics, water and barite and and emulgant with

GEOABlNOR
minor amounts of monmorillonite and other inorganic additives. The mineral oil caused
considerable problems due to heavy contamination of cuttings.

Table l : Cl to C7 hydrocarbons in HEAbCPACE gac(u.l. gas/kg rock)
Project: NOGS 25/8-9Well: NOGS 25/8-9A
Depth unit of measure: m •Indicated values in ml gas/kg re
Depth
1140.001180.001220.001260.001300.001340.001380.001420.001460.001500.001540.001580.001620.001660.001700.001740.001780.001820.001860.001900.001940.001980.002020.002060.002100.002140.002180.00
Cl
48413824545
111389651
35146528718871067296421663456
135036
1-78038462228383673124122546638124844235349817282
C2
431354
14677
272747
42
25735795
20710612116615183141465
C3
33104151438
1018
425
1512153733376 66 93754
244
iC4
---
---1336
3-2655
13111018189
1257
nC4 C5+
2---
3-- • -
31 5
54
5 54
2 61 4
21 42 21 43 63 54 37 7
11 35 51043 30
sumC1-C4
4848388
4569111479657
35166529418981078300122073531
146340
181239412305395375714275563840715093248751988091
sumC2-C4
76
2395
197
11113740761
144
329577117259153172258250134217809
%wetness
0 . 11 . 60 . 50 . 10 . 10 . 10 . 10 . 61 . 11 . 21 . 82 . 17 . 2
21.49 . 81 . 82 . 43 . 32 . 93 . 43 . 63 . 06 . 34 . 95 . 44 . 2
10.0
iC4nC4
0 . 4 9---
0.20---
0 . 9 2--
1.130 . 8 61.27-
5.514 . 0 92 . 9 74.714.483.382.542 . 5 61.571.821.241.32

- 2-Table l : Cl to C7 hydrocarbons in^HEADSPACE gas
(ul gab/kq rock)Project: NOGS 25/8-9
Well: NOCS 25/8-9A.Depth unit of measure: m Indicated values in ml gas/kg rock
De
2220226023002340238023912400240924182427243624452454246324722481249025262553256225712580258925982 6 0 7 ,2 6 1 6 ,2625.
:pth
.00
.00
.00
.00
.00
.00
.00
.00
.00
.00
.00
.00
.00
.00
.00
.00
.00
.00
.00
.00
.00
.00
.00
.00
.00
.00
.00
Cl
496256841753752212600796315088205409672
13364862264702082
491079-14213037637
24731656639209236225
2009
C2
315294147433
1140698
1635271511302432161013023941
1275559362
734346124294853
437
C3
14311676150491300718
1314467
1309921665229108579107353
46518574152935
2 6 9
iC4
3323183111574
16931397
305220137475172237111
50178244
29
nC4
29231634
• 125841883561183732691787113323549222
632210245
34
C5 +
222014289 981
15431098
3552701816344316797424
22104112
14
sumC1-C4
5481614020118170
144719118
17797252381148417782116438753282378
1340333382477713
37862226855256321321
2777
sumC2-C4
519457258648
1871115527104697181244183021228274228
261191252
9147
131257021648859 6
768
%wetness
9 . 57 . 4
12.87 . 9
1 2 . 912.715.21 8 . 615.824.82 5 . 92 6 . 12 6 . 33 6 . 41 9 . 557.46 5 . 91 9 . 81 8 . 65 1.234.72 5 . 625.31 8 . 62 6 . 32 9 . 927.7
iC4nC4
1 . 1 61.001.130 . 9 00 . 9 10.880 . 9 00.880.820.820.820.770 . 6 70 . 3 60.540 . 6 30 . 7 60.530 . 5 60.480.800 . 7 60 . 7 90.810 . 9 30.850 . 8 6

Table ; ' Cl to C 7 hydrocarbons in HEADSPACE gas(pi gas/kg rock)
Project: NOCS 25/8-9Well: NOCS 25/8-9A
Depth unit of measure: m .ndicateci values in ml gas/kg rock
De
Z63426432652266126702679
pth
.00
.00
.00
.00
.00
.00
Cl
2820761628598502461
C2
5 9 91741611138477
C3
355123134855548
iC4
3814171116
nC4
5018211477
C5 +
1898553
sumC1-C4
3862109196182064759 9
sumC2-C4
1042330334223145139
%wne
273034272223
etss
. 0
. 2
. 7
. 2
. 5
. 1
000000
iC4nC4
.77
. 7 9
. 7 9
.81
.11
.80

Table 1-: Cl to C7 hydrocarbons in CUTTINGS gas(ul gas/kg rock) GEOIABSBNOR
Project: NOGS 25/8-9Well: NOCS 25/8-9A
Depth unit of measure": HI/ Indicated values in ml gas/kg rock
De
114011801220126013001340138014201460150015401580162016601700174017801820186019001940198020202060,2100.2140.2180.
pth
.00
.00
.00
.00
.00
.00
.00
.00
.00
.00
.00
.00
.00
.00
.00
.00
.00
.00
.00
.00
.00
.00
.00
.00
.00
. 0 0 ", 0 0
Cl
847
2217211066
1258
1267
-. 14111115151.2159
11138
25
C2 C3
12 11 111 1112 1
1 12 11 112 12 11 12 13 22 12 21 21 12 11 14 4
iC4 nC4 C5+
111111
- -11
-1322143
1 11 81 1 61 21 1 31 1 2
2-1
2 3 10
sumC1-C4 C
958
25192211 .77
156
101499
171414192216221315161139
sum:2-C4
1114212113122223344746433314
%wne
9181415105
1515182018231726181 9 ,2 0,24.22.33.23.2 9 .32.21.1 9 .25.35.
'etss
. 9
. 7
. 5
. 0 .
. 6
. 6
. 2
. 8
. 9
. 1
. 2
. 5
. 3
. 4
. 7
. 2
. 8
. 7, 4, 08598404
000000
0 ,0 .
0 .0.0 .0 .0 .0 .1 .1 .1 .2 .1 .1 .1 .0.1 .0 .0 .
iC4nC4
. 2 6
. 2 9
. 3 9
.32
.38
.23
.32, 5 2
, 8 995526441721755812834770283846263
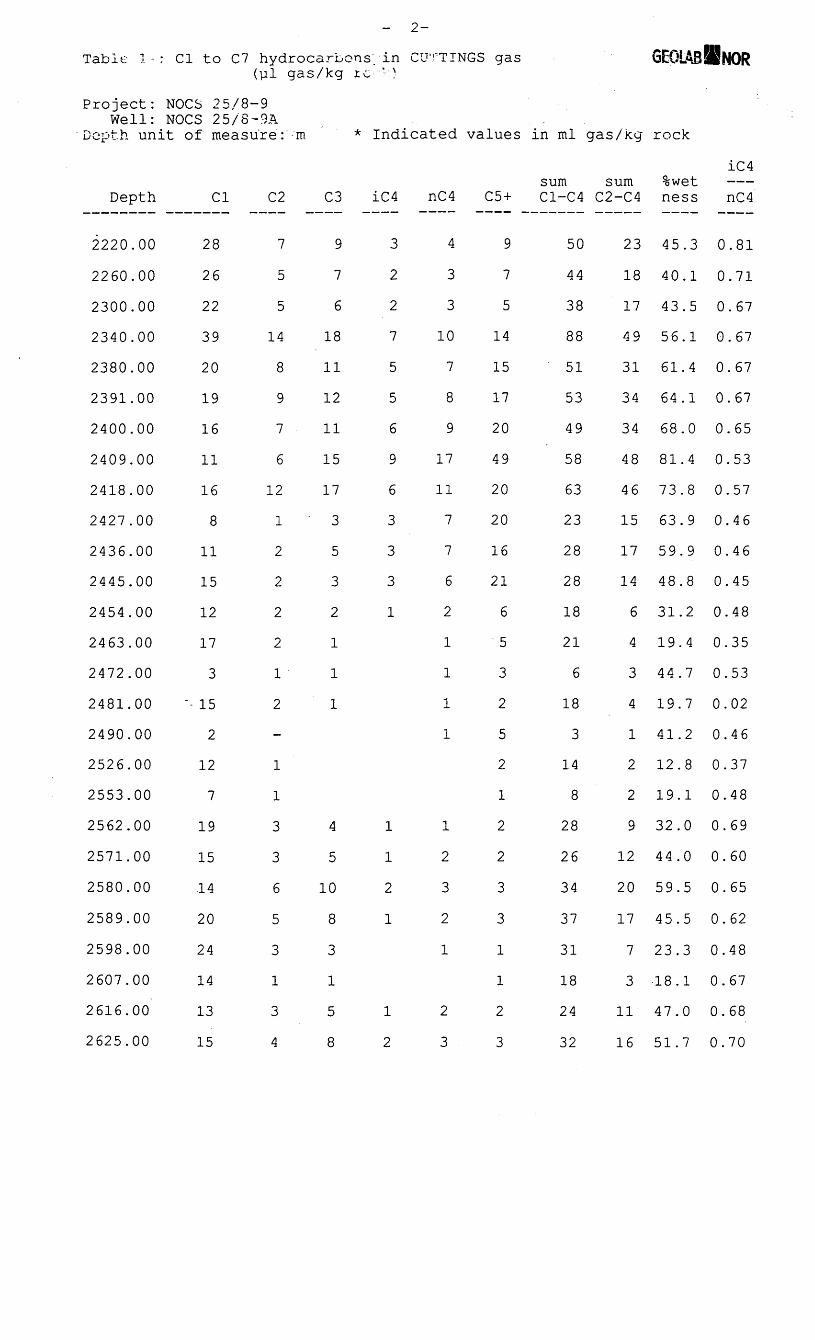
— 2 —Table 1-: Cl to C7 hydrocarbons, in CUTTINGS gas
( p i gas/kg i c • • • > . : >Project: NOGS 25/8-9
Well: NOGS 25/8-9ADepth unit of measure: m * Indicated values in ml gas/kg rock
Depth
222022602300234023802391240024092418242724362445245424632472248124902526255325622571258025892598,2607,2 6 1 6 .2625.
.00
.00
.00
.00
.00
.00
.00
.00
.00
.00
.00
.00
.00
.00
.00
.00
.00
.00
.00
.00
.00
.00
.00
.00
.00
.00
.00
Cl
2826223920191611168
111512173
•- 152127
1915142024141315
C2
755
148976
121222212-1133653134
C3
976
181112111517
' 3532111
451083158
iC4
3227556963331
1121
12
nC4
43310789
171177621111
12321
23
C5+
975
141517204920201621653252122331123
sum sumC1-C4 C2-C4
50443888515349586323282818216
183
148
2826343731182432
23181749313434484615171464341229
12201773
1116
%wetness
45.340.143.55 6 . 16 1 . 46 4 . 16 8 . 081.473.86 3 . 95 9 . 948.831.21 9 . 44 4 . 71 9 . 74 1.212.81 9 . 132.04 4 . 05 9 . 54 5 . 523.318.147.05 1 . 7
iC4nC4
0.810.710 . 6 70 . 6 70 . 6 70 . 6 70 . 6 50.530.570 . 4 60 . 4 60 .450.480.350.530.020 . 4 60.370.480 . 6 90 . 6 00 . 6 50 . 6 20.480 . 6 70 . 6 80.70

- 3-Table I j i C . : , to C7 hydrocarbons in CUTTINGS gas
(ul gas/kg rock) GEOlABfflNOR
Project: NOCS 25/8-9Well: NOCS 25/8-9A
Depth unit of measure: m
Depth Cl C2
- •* Indicated values-in ml gas/kg rockiC4
sum sum %wet ——C3 iC4 nC4 C5 + C1-C4 C2-C4 ness nC4
2"63426432652266126702679
.00
.00
.00
.00
.00
.00
162316131320
642324
1355636
311111
422212
422221
433526262032
271210127
13
613439483438
. 8
. 8
. 1
. 0
. 8
. 9
000000
. 6 8
. 6 9
. 6 8
. 6 2
. 6 2
. 6 4