modulation and coding scheme selection in mbsfn … and coding scheme selection in mbsfn-enabled lte...
TRANSCRIPT
Modulation and Coding Scheme Selection in
MBSFN-enabled LTE Networks
Antonios Alexiou2, Christos Bouras1,2, Vasileios Kokkinos1,2, Andreas Papazois1,2, George Tsichritzis1,2 1 Research Academic Computer Technology Institute
2 Computer Engineering and Informatics Department, University of Patras
Patras, Greece
[email protected], [email protected], [email protected], [email protected], [email protected]
Contact Person:
Professor Christos Bouras
Research Academic Computer Technology Institute and
Computer Engineering and Informatics Department, University of Patras
Tel:+30-2610-960375
Fax:+30-2610-969016
e-mail: [email protected]
Abstract:
Long Term Evolution (LTE) constitutes the next-generation cellular network beyond 3G that is designed to
support the explosion in demand for bandwidth-hungry multimedia services in wireless networks by providing an
extremely high performance radio-access technology. To support Multimedia Broadcast/Multicast Services
(MBMS), LTE offers the functionality to transmit MBMS over Single Frequency Network (MBSFN), where a
time-synchronized common waveform is transmitted from multiple cells for a given duration. This enables over-
the-air combining, thus significantly improving the Spectral Efficiency (SE) compared to conventional MBMS
operation. In MBSFN transmissions, the achieved SE is mainly determined by the Modulation and Coding
Scheme (MCS) selected. This study proposes and evaluates four approaches for the selection of the MCS. Each
approach corresponds to different users’ distribution and multimedia traffic conditions. Based on SE
measurement, we determine the approach that either maximizes or achieves a target SE for the corresponding
users’ distribution and traffic conditions.

Modulation and Coding Scheme Selection in
MBSFN-enabled LTE Networks
Antonios Alexiou2, Christos Bouras1,2, Vasileios Kokkinos1,2, Andreas Papazois1,2, George Tsichritzis1,2 1 Research Academic Computer Technology Institute
2 Computer Engineering and Informatics Department, University of Patras
Patras, Greece
[email protected], [email protected], [email protected], [email protected], [email protected]
Abstract— Long Term Evolution (LTE) constitutes the next-generation cellular network beyond 3G that is
designed to support the explosion in demand for bandwidth-hungry multimedia services in wireless
networks by providing an extremely high performance radio-access technology. To support Multimedia
Broadcast/Multicast Services (MBMS), LTE offers the functionality to transmit MBMS over Single
Frequency Network (MBSFN), where a time-synchronized common waveform is transmitted from multiple
cells for a given duration. This enables over-the-air combining, thus significantly improving the Spectral
Efficiency (SE) compared to conventional MBMS operation. In MBSFN transmissions, the achieved SE is
mainly determined by the Modulation and Coding Scheme (MCS) selected. This study proposes and
evaluates four approaches for the selection of the MCS. Each approach corresponds to different users’
distribution and multimedia traffic conditions. Based on SE measurement, we determine the approach that
either maximizes or achieves a target SE for the corresponding users’ distribution and traffic conditions.
Keywords-long term evolution; multimedia broadcast and multicast; single frequency network; spectral
efficiency; modulation and coding scheme;
I. INTRODUCTION
Long Term Evolution (LTE) constitutes the evolution of the 3rd Generation (3G) mobile telecommunications
technologies. In order to enhance 3rd Generation Partnership Project’s (3GPP) radio interface, LTE utilizes
Orthogonal Frequency Division Multiple Access (OFDMA). This radio technology is optimized to enhance
networks by enabling new high capacity mobile broadband applications and services, while providing cost efficient
ubiquitous mobile coverage [14].
3GPP has introduced the Multimedia Broadcast/Multicast Service (MBMS) as a means to broadcast and
multicast information to mobile users, with mobile TV being the main service offered. LTE infrastructure offers to
1
In the context of LTE systems, the MBMS will evolve into e-MBMS (“e-” stands for evolved). This will be
achieved through the increased performance of the air interface that will include a new transmission scheme called
MBMS over Single Frequency Network (MBSFN). In MBSFN operation, MBMS data are transmitted
simultaneously over the air from multiple tightly time-synchronized cells. A group of those cells, which are
targeted to receive these data, is called MBSFN area [5]. Since the MBSFN transmission greatly enhances the
Signal to Interference plus Noise Ratio (SINR), the MBSFN transmission mode leads to significant improvements
in Spectral Efficiency (SE) in comparison to multicasting over Universal Mobile Telecommunications System
(UMTS). This is extremely beneficial at the cell edge, where transmissions (which in UMTS are considered as
inter-cell interference) are translated into useful signal energy and hence the received signal strength is increased,
while at the same time the interference power is largely reduced [14].
In this study, we evaluate the performance of MBSFN in terms of SE. In general, SE refers to the data rate that
can be transmitted over a given bandwidth in a communication system. Several studies, such as [15], have shown
that SE is directly related to the Modulation and Coding Scheme (MCS) selected for the transmission. Additionally,
the most suitable MCS is selected according to the measured SINR so as a certain Block Error Rate (BLER) target
to be achieved. Taking into account the above analysis, we focus on a dynamic user distribution, with users
distributed randomly in the MBSFN area and therefore experiencing different SINRs. Based on the measured
SINRs, our goal is to select the MCS that better suits each examined user deployment and should be used by the
base stations when transmitting the MBMS data. Therefore, the major contribution of this paper is the proposal and
evaluation of different MCS selection approaches that can be used during MBSFN transmission over LTE cellular
networks.
The remainder of the manuscript is structured as follows: Section II presents the related work in the specific
field, while, in Section III, we describe the methodology for calculating the SE of the MBSFN delivery scheme in
the single-user case. The approaches for selecting the MCS of an MBSFN area are presented in Section IV; while
the evaluation results are presented in Section V. Finally, the conclusions and planned next steps are described in
Sections VI and VII respectively. For the reader’s convenience, appendix A presents an alphabetical list of the
acronyms used in the manuscript.
II. RELATED WORK
The performance of MBSFN has been thoroughly examined in previous research works. However, most of
these works, such as [1], [2] and [3], compare the performance of MBSFN transmissions with classic Point-to-
Point (PTP) and Point-to-Multipoint (PTM) transmissions, in which the transmissions are executed in a per-cell
2

Transmission techniques, which do not adapt to the fading channel, require a fixed link margin or coding to
maintain acceptable performance in deep fades. Thus, these techniques are effectively designed for the worst-case
channel conditions, resulting in insufficient utilization of the channel capacity [8]. For better utilization of the
channel capacity, AMC has been proposed in a variety of publications. For example, an adaptive variable rate
variable-power transmission scheme using un-coded M-ary Quadrature Amplitude Modulation (M-QAM) was
proposed in [9]. This adaptive technique is more power efficient than non-adaptive modulation in fading.
Adaptive algorithms for the Orthogonal Frequency Division Multiplexing (OFDM) system are proposed in [12].
In [12], a multi-cell, multi-user OFDM system with adaptive subcarrier allocation and adaptive modulation is
considered. The specific study describes an adaptive sub-carrier, bit and power allocation algorithm to maximize
the total throughput of the multi-cell system in the presence of Co-Channel Interference (CCI), frequency selective
Rayleigh fading and Additive White Gaussian Noise (AWGN). For the unicast system, link adaptation is possible
because the Channel Status Information (CSI) can be reported to the base-station by the terminal. Our work
expands [12], by focusing on the MBSFN service, which utilizes OFDM technology.
Moreover, studies such as [6], [10], [13], [15] and [18] have shown that SE is directly related to the MCS
selected for the transmission. In [15] the authors propose an approach, which selects the lowest MCS for the
MBSFN transmission that allows an expected SE target to be achieved for 95% of users. However, focusing only
on the users’ side may not be sufficient. Sometimes the operator’s goal may be the maximization of the SE over all
users of the topology or the provision of the service to all the users irrespectively of the conditions the users
experience. On the other hand, in [18] an adaptive MCS based on partial feedback is proposed in order to obtain the
improvement of system throughput. Our work extends and completes the above studies and, furthermore, tackles
the addressed problems by proposing four approaches, each one of them fulfilling different goals in terms of SE.
III. SINGLE-USER MCS SELECTION AND SE ESTIMATION
In order to select the MCS and calculate the SE in the case of a single receiver, we use the following 4-step
procedure [7].
A. Step 1: SINR Calculation
Let the MBSFN area consist of N neighboring cells. Due to multipath, the signals of the cells arrive to the
receiver by M different paths, so the average SINR of a single user at a given point m is expressed as in (1) [15]:
3

( )( )( )
( )( )( )( )
1 1
01 1
( )1
N M i j j
i ji
i j jN M
i ji
w m Pq m
SINR mw m P
Nq m
τ δ
τ δ
= =
= =
+
=− +
+
∑ ∑
∑ ∑
(1)
with:
1 0
( ) 1
0
CP
CPCP CP u
u
TTw T
Totherwise
τττ τ
⎧ ⎫≤ <⎪ −⎪= − ≤ < +⎨ ⎬⎪ ⎪⎪ ⎪⎩ ⎭
T T⎪⎪ (2)
where Pj is the average power associated with the j path, τi(m) the propagation delay from base station i, δj the
additional delay added by path j, qi(m) the path loss from base station i, Tcp the length of the cyclic prefix (CP) and
Tu the length of the useful signal frame.
SINR is usually calculated in OFDMA for each subcarrier and all the SINRs are combined in order to find a
non-linear average SINR (effective SINR or γeff), using the Exponential Effective SIR Mapping (EESM) [11].
( ) 1
1, lniSINR
Neff i i
EESM eN
βγ γ β β−
=
⎛= = − ⋅ ⋅⎜⎜ ⎟
⎝ ⎠∑
⎞⎟ (3)
where N is the number of subcarriers and β is calibrated by means of link level simulations to fit the compression
function to the AWGN [11].
However, in 3GPP LTE systems, adjacent subcarriers allocation is considered, making subcarriers allocated to
one channel experiencing similar fading conditions. All subcarriers allocated to a given channel will thus
experience the same fast fading and their SINR will be equal [15].
B. Step 2: MCS Selection
In order to obtain the MCS that should be used for the transmission of the MBSFN data to a single user, AWGN
simulations have been performed. In general, the MCS determines both the modulation alphabet and the Effective
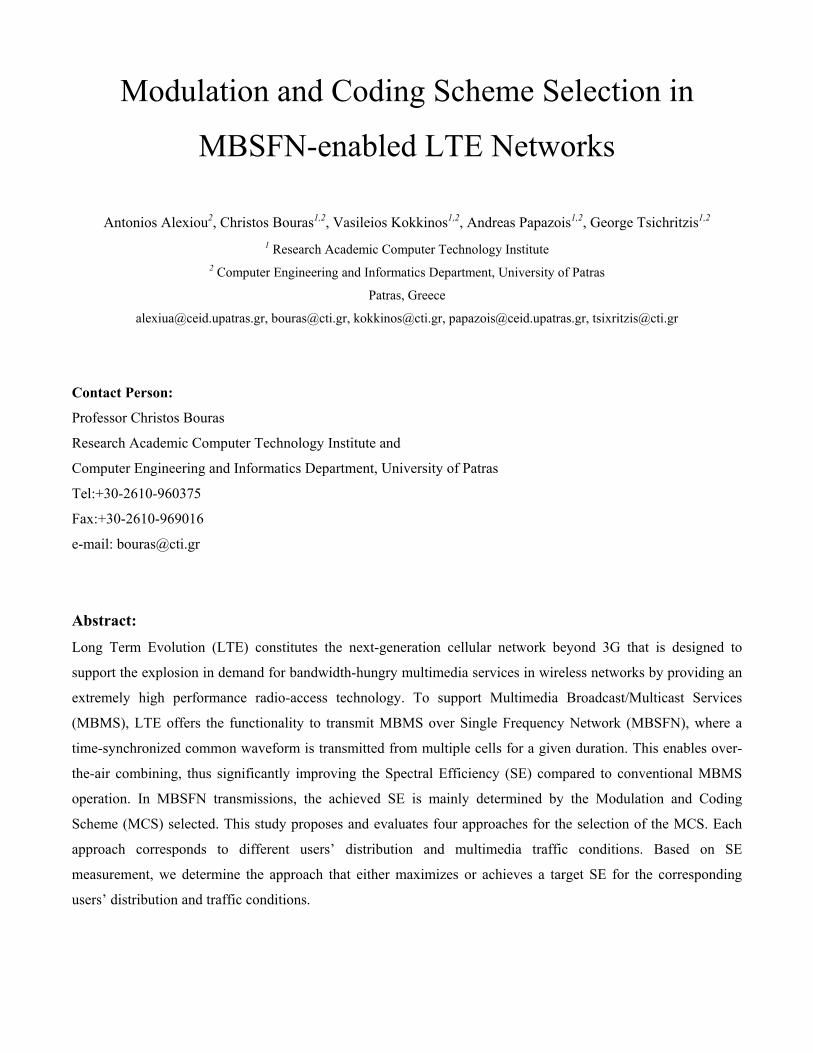
Code Rate (ECR) of the channel encoder. Figure 1 shows the BLER results for Channel Quality Indicators (CQI)
1-15 without using Hybrid Automatic Repeat Request (HARQ) and for 1.4 MHz and 5.0 MHz bandwidth. The
results have been obtained from the link level simulator introduced in [11]. Each MCS is mapped to a predefined
CQI value. The 15 different sets of CQIs and the corresponding MCSs are defined in [4].
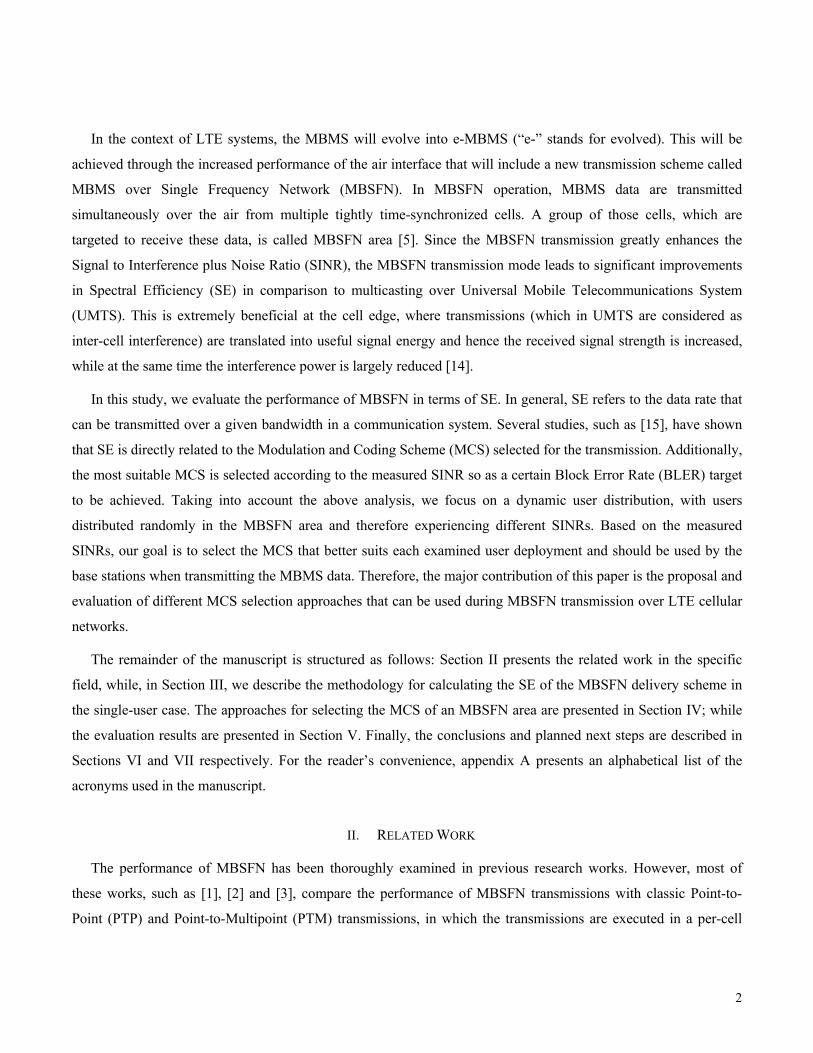
In LTE networks, an acceptable BLER target value should be smaller than 10% [11]. The SINR to CQI
mapping required to achieve this goal can thus be obtained by plotting the 10% BLER values over SNR of the
curves in Figure 1. The 10% BLER values for each CQI are depicted in Figure 2. Using the obtained line, the γeff
can be mapped to a CQI value (i.e. MCS) that should be signaled to the evolved Node B (e-NB or base station) so
as to ensure the 10% BLER target.
4
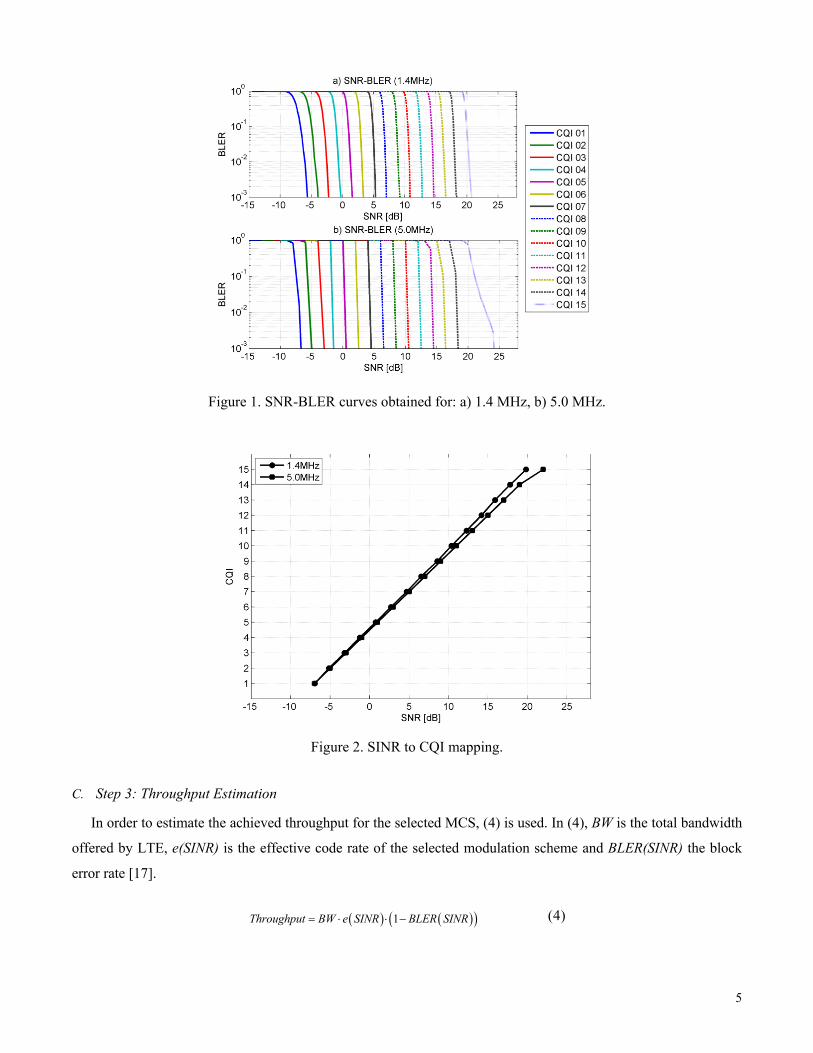
Figure 1. SNR-BLER curves obtained for: a) 1.4 MHz, b) 5.0 MHz.
Figure 2. SINR to CQI mapping.
C. Step 3: Throughput Estimation
In order to estimate the achieved throughput for the selected MCS, (4) is used. In (4), BW is the total bandwidth
offered by LTE, e(SINR) is the effective code rate of the selected modulation scheme and BLER(SINR) the block
error rate [17].
( ) ( )( )1Throughput BW e SINR BLER SINR= ⋅ ⋅ − (4)
5
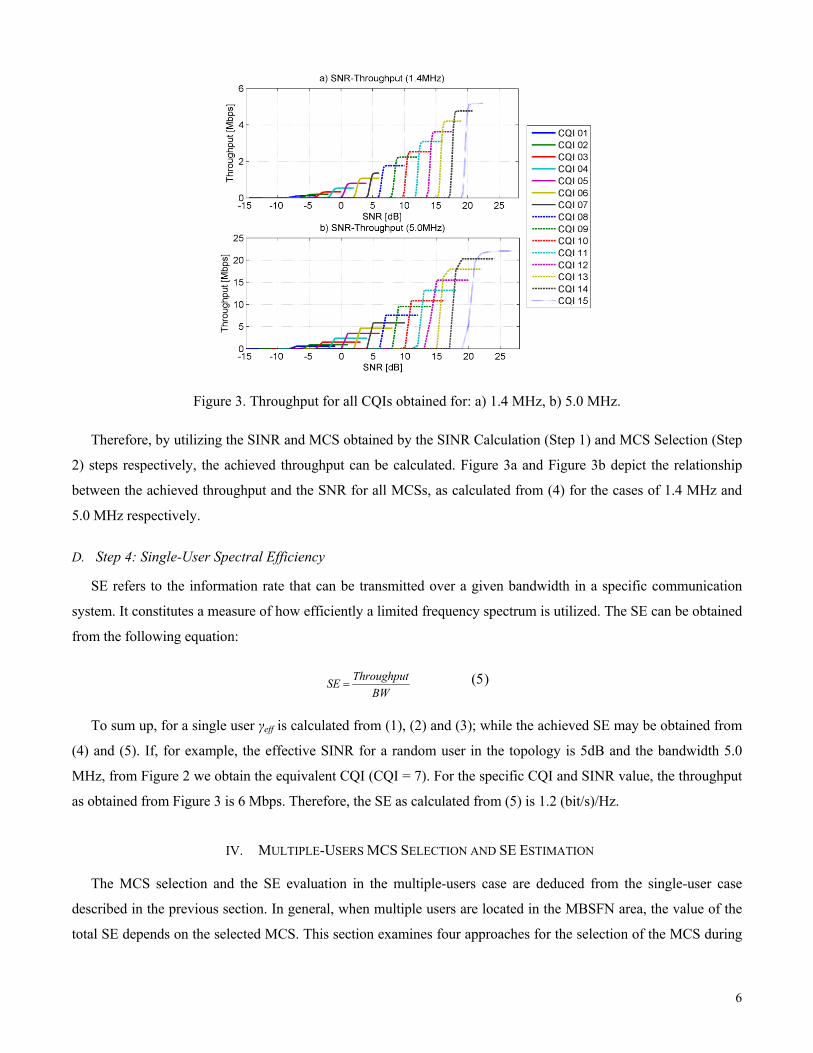
Figure 3. Throughput for all CQIs obtained for: a) 1.4 MHz, b) 5.0 MHz.
Therefore, by utilizing the SINR and MCS obtained by the SINR Calculation (Step 1) and MCS Selection (Step
2) steps respectively, the achieved throughput can be calculated. Figure 3a and Figure 3b depict the relationship
between the achieved throughput and the SNR for all MCSs, as calculated from (4) for the cases of 1.4 MHz and
5.0 MHz respectively.
D. Step 4: Single-User Spectral Efficiency
SE refers to the information rate that can be transmitted over a given bandwidth in a specific communication
system. It constitutes a measure of how efficiently a limited frequency spectrum is utilized. The SE can be obtained
from the following equation:
ThroughputSEBW
= (5)
To sum up, for a single user γeff is calculated from (1), (2) and (3); while the achieved SE may be obtained from
(4) and (5). If, for example, the effective SINR for a random user in the topology is 5dB and the bandwidth 5.0
MHz, from Figure 2 we obtain the equivalent CQI (CQI = 7). For the specific CQI and SINR value, the throughput
as obtained from Figure 3 is 6 Mbps. Therefore, the SE as calculated from (5) is 1.2 (bit/s)/Hz.
IV. MULTIPLE-USERS MCS SELECTION AND SE ESTIMATION
The MCS selection and the SE evaluation in the multiple-users case are deduced from the single-user case
described in the previous section. In general, when multiple users are located in the MBSFN area, the value of the
total SE depends on the selected MCS. This section examines four approaches for the selection of the MCS during
6

MBSFN transmissions. These approaches are carefully selected so as to match different user’ deployments and
media traffic conditions that could be realized in real word scenarios. More specifically, the selected approaches
are listed below:
• The 1st approach selects the MCS that ensures that all users, even those with the lowest SINR, receive the
MBSFN service (Bottom Up approach).
• The 2nd approach selects the MCS that ensures the maximum SE in the MBSFN area (Top Down
approach).
• The 3rd approach sets a predefined SE threshold for the area and selects the MCS that ensures that the
average SE over the MBSFN area exceeds this threshold (Area-Oriented approach).
• The 4th approach selects the MCS that ensures that at least the 95% of the users receive the MBSFN
service with a predefined target SE (User-Oriented approach).
As stated above, the 1st approach ensures that all users, even those with the lowest SINR, will receive the
MBSFN service. Furthermore, this approach is suitable for real time multimedia transmissions in hot zones where
hundreds of people are congregated. The 2nd approach is met in cases where high demanding applications (e.g.,
High quality video streaming) are transmitted through MBSFN. In this case only users with high SLA will receive
the service. The last two approaches are the most commonly used approaches. They appear in cases where a
predefined threshold for the throughput should be ensured either at an area base (3rd approach) or at users’ base
(4th approach). A more detailed analysis of the four MSC selection approaches is presented in the remainder of this
section.
A. 1st Approach - Bottom Up Approach
In this approach, the algorithm first calculates the SINRs for all the users in the topology and finds the
minimum SINR value. Then, the MCS that corresponds to the minimum SINR is obtained from the MCS Selection
step (Figure 2). Finally, from (4) or Figure 3 the corresponding average throughput and SE are obtained. The
operation of this approach indicates that all the users in the MBSFN area will uninterruptedly receive the MBMS
service, irrespectively of the conditions they experience (in terms of SINR). However, the fact that the user with the
minimum SINR determines the MCS indicates that users with greater SINR values will not make use of a MCS
that would ensure a greater throughput. The procedure for obtaining the MCS and the SE is presented using pseudo
code in Algorithm 1 that follows.
7

Algorithm 1. Pseudo code of 1st approach.
Define MBSFN topology % calculate the SINRs for all the users in the topology FOR i = 1:total_users Calculate SINR(i) END %find the lowest SINR min_SINR = min(SINR) % choose the MCS that corresponds to the min SINR selected_MCS = fMCS (min_SINR) % calculate the throughput for the selected MCS throughput = fthroughput(selected_MCS, min_SINR) % calculate the obtained spectral efficiency Calculate SE
B. 2nd Approach - Top Down Approach
The 2nd approach selects the MCS that ensures the maximum average throughput and SE over all users in the
MBSFN area. At first the algorithm calculates the SINR value for each user using (1). Then, the algorithm scans all
the MCSs in Figure 3. For each MCS, the algorithm calculates the per-user throughput depending on the calculated
SINRs and obtains the average throughput and total SE. The MCS that ensures the maximum average throughput -
and therefore the maximum total SE - is selected. Algorithm 2 presents the operation of the 2nd approach using
pseudo code.
Algorithm 2. Pseudo code of 2nd approach.
Define MBSFN topology % calculate the SINRs for all the users in the topology FOR i = 1:total_users Calculate SINR(i) END % for each MCS calculate the average throughput over all users FOR MCS = 1:15 FOR j = 1:total_users throughput(MCS, j) = fthroughput (MCS, SINR(j)) END avg_throughput(MCS) = average(throughput(MCS, :)) Calculate SE(MCS) END %find the max spectral efficiency that can be achieved SE = max(SE(:))
8

C. 3rd Approach - Area-Oriented Approach
The goal of the 3rd approach is to find the lowest MCS that achieves a target SE for an area. This target usually
equals to 1 (bit/s)/Hz [15]. Initially the algorithm calculates the SINR value for each user. Then it proceeds with the
scanning of the MCSs to calculate the per-user throughput. Starting from the lowest MCS, the algorithm calculates
the per-user throughput and obtains the average throughput and the total SE for each MCS. If during the scanning
procedure one MCS ensures that the total SE is equal or higher than the area target SE, the operation stops without
scanning all the MCSs of Figure 3 and the algorithm selects this MCS for the delivery of the MBMS data. In other
words, the goal of this approach is to find the lowest MCS that allows a target SE to be achieved. The scanning
procedure starts from the lowest MCS in order to serve as many users as possible. If the scanning procedure started
from the highest MCS, then the SE target would have been achieved very quickly by utilizing a high MCS, and
therefore only the users that experience high SINRs would receive the MBSFN service as depicted in Figure 3. In
the case the target SE cannot be achieved, this approach has identical operation with the 2nd approach (i.e. selects
the MCS that ensures the maximum total SE). This procedure is presented using pseudo code in Algorithm 3.
Algorithm 3. Pseudo code of 3rd approach.
Define MBSFN topology Define area_target_SE % calculate the SINRs for all the users in the topology FOR i = 1:total_users Calculate SINR(i) END % scan the MCSs so as calculate the SE over the MBSFN area FOR MCS = 1:15 FOR j = 1:total_users throughput(MCS, j) = fthroughput (MCS, SINR(j)) END % Calculate average throughput and spectral efficiency avg_throughput(MCS) = average(throughput(MCS, :)) Calculate SE(MCS) % examine if area target SE is achieved IF SE(MCS) >= area_target_SE THEN % target is achieved BREAK; ELSE % target is not achieved SE = max(SE(:)) END END % obtained spectral efficiency SE = SE(MCS)
9

D. 4th Approach - User-Oriented Approach
The difference between the 4th and the 3rd approach is that in spite of defining an area-specific target SE such
as the 3rd approach, the 4th approach defines a user-oriented target SE (usually equal to 1 (bit/s)/Hz [15]). More
specifically, the algorithm initially calculates the SINR value for each user. Then, starting from the lowest MCS,
the algorithm calculates the per-user throughput and per-user SE of each MCS. If during the scanning procedure
one MCS ensures that at least 95% of the users reach or exceed the target SE, the operation stops and the algorithm
selects this MCS for the delivery of the MBMS data. Similar to the 3rd approach, this approach locates the lowest
MCS that allows a user-specific target SE to be achieved for the 95% of the users’ population. If the target SE
cannot be achieved for the 95% of the users, the algorithm selects the MCS that ensures the maximum total SE.
This procedure is presented using pseudo code in Algorithm 4.
Algorithm 4. Pseudo code of 4th approach.
Define MBSFN topology Define user_target_SE % calculate the SINRs for all the users in the topology FOR i = 1:total_users Calculate SINR(i) END % scan the MCSs so as to calculate the per-user SE FOR MCS = 1:15 FOR j = 1:total_users % Calculate the per user throughput and spectral efficiency throughput(MCS, j) = fthroughput (MCS, SINR(j)) SE(MCS, j) = throughput(MCS, j) / bandwidth END % examine if user target SE is achieved for 95% of users IF SE(MCS, j) >= user_target_SE FOR 95% of users THEN % target achieved BREAK; ELSE % target is not achieved SE = max(SE(:, j)) END END % obtained spectral efficiency SE = SE(MCS, j)
10

V. PERFORMANCE EVALUATION
This section provides simulation results regarding the operation and performance of the aforementioned
approaches. For the purpose of our experiments we have extended the link level simulator [11] in Matlab. In
particular, two different scenarios are investigated. Scenario 1 assumes that a constant number of 100 users are
randomly distributed in the MBSFN area; while Scenario 2 investigates the case of variable number of users. The
parameters used in the simulations are presented in Table 1.
Table 1. Simulation settings.
Parameter Value
Cellular layout Hexagonal grid, 19 cell sites
Inter Site Distance (ISD) 1732 m
Carrier frequency 2.0 GHz
System bandwidth 1.4 MHz / 5.0 MHz
Channel model 3GPP Typical Urban
Propagation model Cost Hata
Cyclic prefix / Useful signal frame length 16.67μsec / 66.67μsec
Modulation and Coding Schemes 15 different sets defined in [4]
A. Scenario 1: Predefined Number of Users
Scenario 1 attempts to make a direct comparison of the proposed approaches when the MBSFN area consists of
a constant number of users. More specifically, the MBSFN area - which consists of four neighboring cells -
contains 100 randomly distributed users. For comparison reasons the evaluation is performed for 1.4 MHz and 5.0
MHz bandwidth.
For the evaluation of the 1st approach, we first consider the case of 1.4 MHz bandwidth. According to the
procedure described in paragraph IV.A, the users’ SINRs are obtained and the lowest SINR value is selected for the
determination of the MCS. In the examined scenario, the lowest SINR is -1.723 dB. Therefore, from Figure 2
CQI 3 is selected. Indeed, Figure 4a confirms that for the user with this value of SINR, CQI 3 can provide the
maximum SE (0.233 (bit/s)/Hz) or equivalently from (5) the maximum throughput (0.326 bit/s). The examination
of Figure 4b leads to similar results. In this case however, the CQI that maximizes the SE of the user with the
lowest SINR is CQI 4 (achieved SE equal to 0.473 (bit/s)/Hz), while the maximum achieved throughput is
11
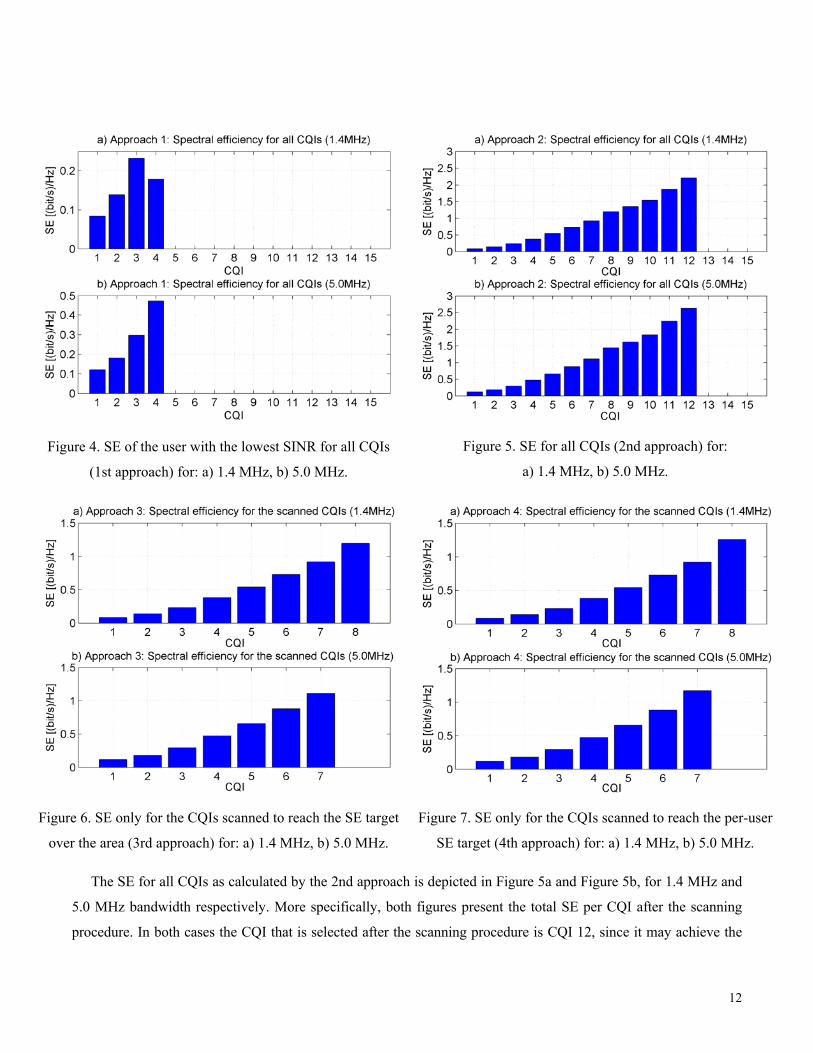
Figure 4. SE of the user with the lowest SINR for all CQIs
(1st approach) for: a) 1.4 MHz, b) 5.0 MHz.
Figure 5. SE for all CQIs (2nd approach) for:
a) 1.4 MHz, b) 5.0 MHz.
Figure 6. SE only for the CQIs scanned to reach the SE target
over the area (3rd approach) for: a) 1.4 MHz, b) 5.0 MHz.
Figure 7. SE only for the CQIs scanned to reach the per-user
SE target (4th approach) for: a) 1.4 MHz, b) 5.0 MHz.
The SE for all CQIs as calculated by the 2nd approach is depicted in Figure 5a and Figure 5b, for 1.4 MHz and
5.0 MHz bandwidth respectively. More specifically, both figures present the total SE per CQI after the scanning
procedure. In both cases the CQI that is selected after the scanning procedure is CQI 12, since it may achieve the
12
highest value of total SE. From Figure 5a we notice that for 1.4 MHz bandwidth and for the specific user
distribution, the achieved SE is 2.200 (bit/s)/Hz. On the other hand for 5.0 MHz bandwidth the achieved SE is
2.630 (bit/s)/Hz (Figure 5b).
As depicted in Figure 6 the algorithm of the 3rd approach scans the MCSs beginning from the MCS that
corresponds to CQI 1. For each MCS the average throughput and total SE are calculated. However, contrary to the
2nd approach, the scanning operation stops when the total SE reaches the target SE over the MBSFN area, which
equals to 1 (bit/s)/Hz. As depicted in Figure 6a for 1.4 MHz bandwidth the first CQI that exceeds the SE target and
therefore is selected for the transmission of the MBMS data, is CQI 8 that achieves 1.193 (bit/s)/Hz. On the other
hand, for the case of 5.0 MHz bandwidth, CQI 7 is selected and achieves a SE level of 1.109 (bit/s)/Hz.
Generally, the 4th approach has similar performance to the 3rd approach with small improvements in the
achieved SE. Indeed, as illustrated in Figure 7, the algorithm scans the MCSs starting from the lowest MCS.
However, contrary to the 3rd approach, in the 4th approach the MCS selection is performed in a user-centered way.
This means that for each of the scanned MCSs, the algorithm calculates the per-user throughput and the equivalent
per-user SE. The output of the scanning procedure indicates that in the case of 1.4 MHz, the first MCS that ensures
that at least the 95% of the users exceed the per-user SE target is CQI 8 (achieved per-user SE: 1.256 (bit/s)/Hz). In
the case of 5.0 MHz, CQI 7 is selected (achieved per-user SE: 1.256 (bit/s)/Hz).
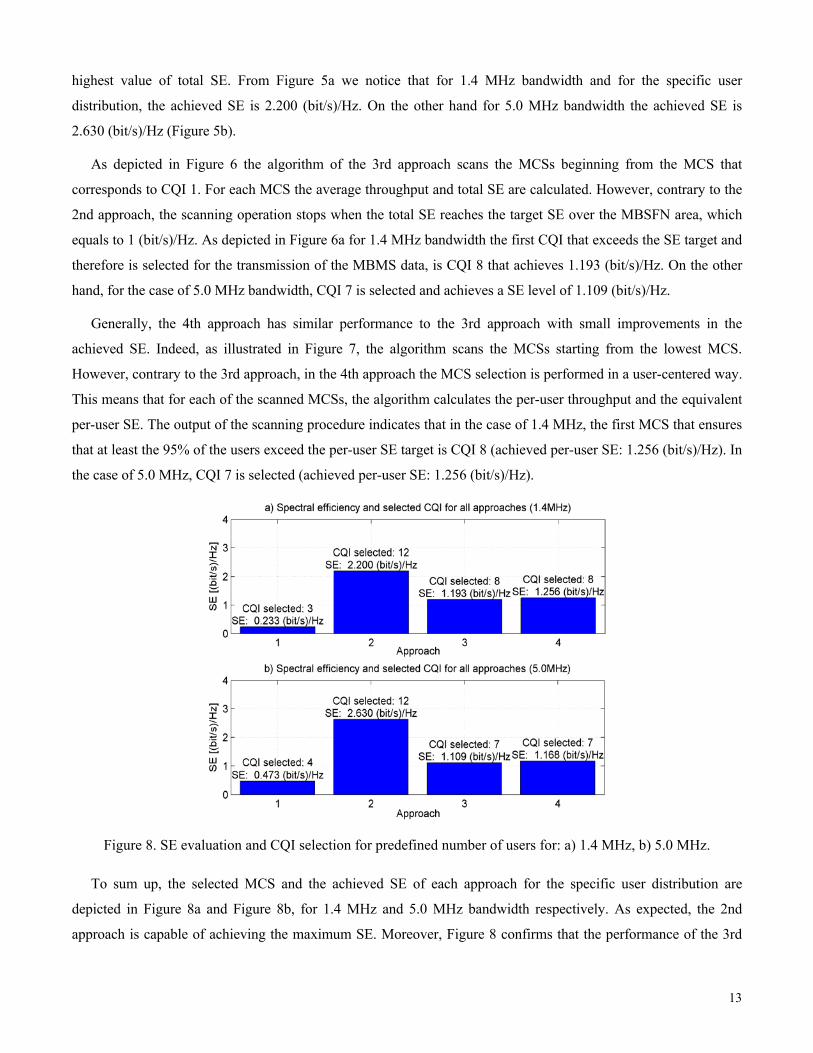
Figure 8. SE evaluation and CQI selection for predefined number of users for: a) 1.4 MHz, b) 5.0 MHz.
To sum up, the selected MCS and the achieved SE of each approach for the specific user distribution are
depicted in Figure 8a and Figure 8b, for 1.4 MHz and 5.0 MHz bandwidth respectively. As expected, the 2nd
approach is capable of achieving the maximum SE. Moreover, Figure 8 confirms that the performance of the 3rd
13
approach is similar to the performance of the 4th one. The difference in the achieved SE is caused due to the fact
that the 4th approach does not take into account the 5% of the users that experience worse network conditions (in
terms of SINR). Nevertheless, it is worth mentioning that both approaches reach the target SE that was set.
B. Scenario 2: Variable Number of Users
This paragraph presents simulation results concerning the operation of the proposed approaches for variable
number of users. More specifically, Figure 9 and Figure 10 examine the performance of each approach in terms of
SE and selected MCS, when the users’ population in the MBSFN area varies from 1 to 1000 users (for 1.4 MHz
and 5.0 MHz bandwidth respectively). All the users that receive the MBMS service appear in random initial
positions throughout the MBSFN area, which consists of four neighboring and tightly time synchronized cells. The
remaining simulation parameters are in accordance with Table 1.
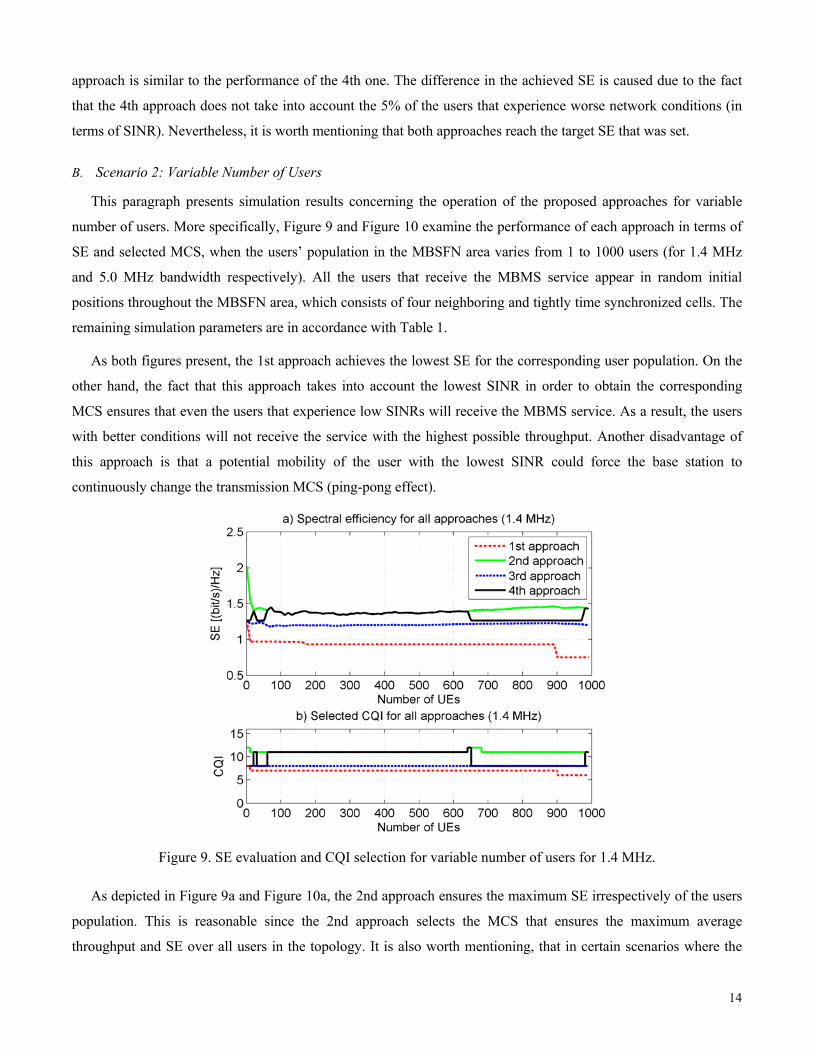
As both figures present, the 1st approach achieves the lowest SE for the corresponding user population. On the
other hand, the fact that this approach takes into account the lowest SINR in order to obtain the corresponding
MCS ensures that even the users that experience low SINRs will receive the MBMS service. As a result, the users
with better conditions will not receive the service with the highest possible throughput. Another disadvantage of
this approach is that a potential mobility of the user with the lowest SINR could force the base station to
continuously change the transmission MCS (ping-pong effect).
Figure 9. SE evaluation and CQI selection for variable number of users for 1.4 MHz.
As depicted in Figure 9a and Figure 10a, the 2nd approach ensures the maximum SE irrespectively of the users
population. This is reasonable since the 2nd approach selects the MCS that ensures the maximum average
throughput and SE over all users in the topology. It is also worth mentioning, that in certain scenarios where the
14
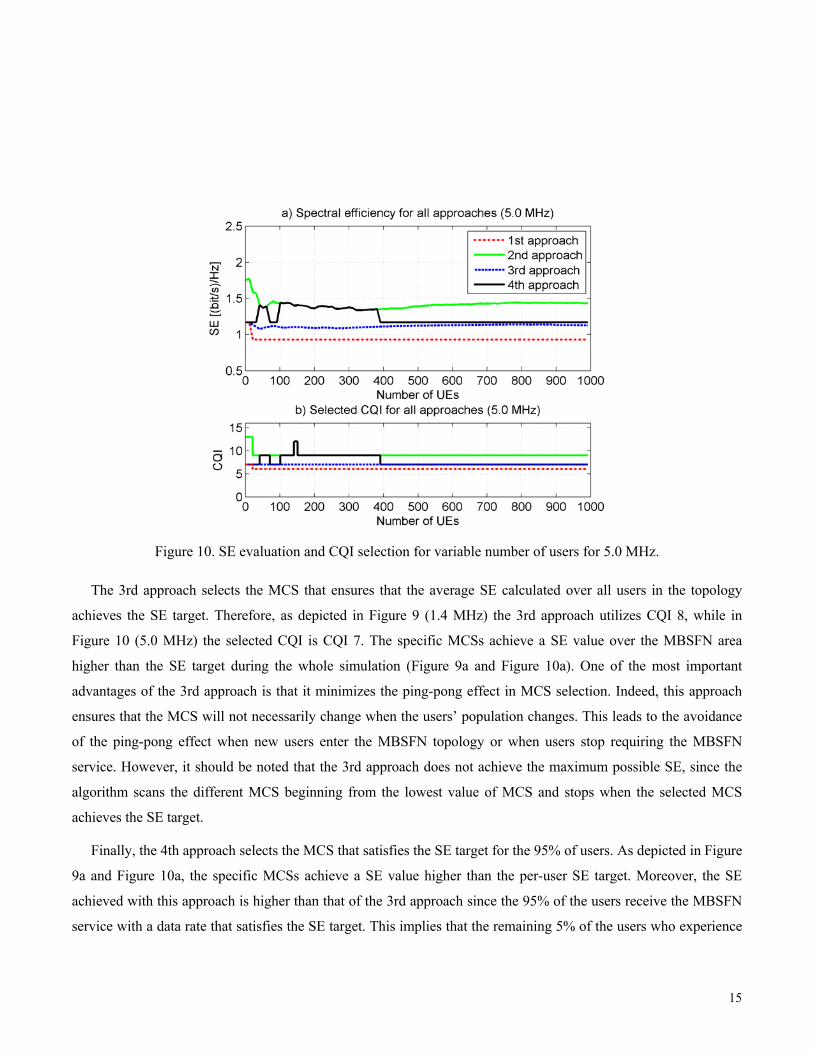
Figure 10. SE evaluation and CQI selection for variable number of users for 5.0 MHz.
The 3rd approach selects the MCS that ensures that the average SE calculated over all users in the topology
achieves the SE target. Therefore, as depicted in Figure 9 (1.4 MHz) the 3rd approach utilizes CQI 8, while in
Figure 10 (5.0 MHz) the selected CQI is CQI 7. The specific MCSs achieve a SE value over the MBSFN area
higher than the SE target during the whole simulation (Figure 9a and Figure 10a). One of the most important
advantages of the 3rd approach is that it minimizes the ping-pong effect in MCS selection. Indeed, this approach
ensures that the MCS will not necessarily change when the users’ population changes. This leads to the avoidance
of the ping-pong effect when new users enter the MBSFN topology or when users stop requiring the MBSFN
service. However, it should be noted that the 3rd approach does not achieve the maximum possible SE, since the
algorithm scans the different MCS beginning from the lowest value of MCS and stops when the selected MCS
achieves the SE target.
Finally, the 4th approach selects the MCS that satisfies the SE target for the 95% of users. As depicted in Figure
9a and Figure 10a, the specific MCSs achieve a SE value higher than the per-user SE target. Moreover, the SE
achieved with this approach is higher than that of the 3rd approach since the 95% of the users receive the MBSFN
service with a data rate that satisfies the SE target. This implies that the remaining 5% of the users who experience
15

bad conditions are not taken into account, in opposition to the 3rd approach in which all the users in the MBSFN
area are considered for the MCS selection.
To sum up, Table 2 presents a cumulative, direct comparison between the approaches analyzed in this
manuscript. The main conclusion is that the selection of the most efficient MCS is an operator dependent
parameter. Therefore, the uninterrupted service provision irrespectively of the users’ conditions would make the 1st
approach the most efficient approach. However, this approach could not provide any guarantee for the throughput
and the achieved SE. On the other hand, for maximum average throughput and maximum SE the most efficient
approach would be the 2nd approach. The 3rd approach constitutes the most efficient approach when the operator
targets at a specific SE value over the MBSFN area and minimizes the ping-pong effect in MCS selection
(minimum MCS switching). Finally, the 4th approach achieves a predefined per-user SE target for at least the 95%
of the users.
Table 2. Qualitative comparison of the approaches.
Performance
Approach Throughput Spectral Efficiency Service Provision MCS Switching
1st Minimum Minimum Guaranteed Medium
2nd Maximum Maximum Not Guaranteed Medium
3rd Medium Target over the area Not Guaranteed Minimum
4th Medium Target per-user Not Guaranteed Maximum
VI. CONCLUSIONS
The main enhancement that the adoption of MBSFN brings in e-MBMS is the improvement of over the air SE.
The achieved SE is mainly determined by the selected MCS in the physical layer. In this manuscript, we have
proposed four different approaches for the efficient selection of the appropriate MCS and we have evaluated the
impact of this selection to the achieved SE. The parameters that have been taken into account in the evaluation are
the number of served users and their position in the topology. Based on the above two parameters, the service
provider can choose the most efficient MCS selection approach for the active MBSFN sessions. The approaches
cover different scenarios that could be realized in real world such as ensuring service continuity for the user with
lowest SINR value and therefore for all users in the MBSFN area, selecting the MCS that maximizes the SE,
selecting the MCS based on the covered area or the percentage of the users that receive the service in an acceptable
quality.
16
In brief, we could say that the selection of the appropriate MCS is an operator dependent issue. Different
operator requirements may lead to different MCS approach selection. To that end, service continuity can be secured
by employing the 1st (Bottom Up) approach, while for high demanding MBMS applications, which are targeted to
users that experience optimal network and link conditions, the 2nd (Top Down) approach is the most efficient one.
Additionally, ping-pong effect can be regulated by employing the 3rd (Area-Oriented) approach and
simultaneously, all MBMS users are treated by the approach as equal irrespectively of the network and link
conditions that they experience. Finally, the 4th (User-Oriented) approach gives the ability to the network operator
to predefine both the per-user target SE and the percentage of users that will be taken into account for the
calculation of the achieved SE.
To conclude, it could be mentioned that the analysis presented in this manuscript underlines that the
introduction of an adaptive MCS selection algorithm for MBFSN enabled LTE networks is a prerequisite for
network operators in order deploy high quality broadcast networks capable of delivering high demanding real time
multimedia applications to mobile users.
VII. FUTURE WORK
The step that follows this work could be the design, the implementation and the evaluation of an algorithm
responsible for choosing the most efficient MCS selection approach according to operator needs each time. Our
analysis indicates that approaches switching is possible to happen in real time. Furthermore, the combined usage of
different approaches is also possible and could solve the particular inefficiencies that each approach has.
Another direction that we intent to investigate is the application of Forward Error Correction (FEC) for MBSFN
transmissions in LTE networks. FEC is an error control method that can be used to augment or replace other
methods for reliable data transmission. The main attribute of FEC schemes is that the sender adds redundant
information in the messages transmitted to the receiver. This information allows the receiver to reconstruct the
source data. Such schemes inevitably add a constant overhead in the transmitted data and are computationally
expensive. This additional communication cost will be calculated and based on this; the efficiency of FEC use in
different scenarios will be evaluated.
REFERENCES
[1] 3GPP R1-070051, “Performance of MBMS Transmission Configurations”, 2007.
[2] 3GPP R1-071049, “Spectral Efficiency comparison of possible MBMS transmission schemes: Additional
Results”, 2007.
[3] 3GPP R1-071433, “Additional Results on EMBMS Transmission Configurations”, 2007.
17

[4] 3GPP TS 36.213, V9.1.0, “Technical specification group radio access network; Evolved Universal Terrestrial
Radio Access; Physical Layer Procedures (Release 9)”, 2010.
[5] 3GPP TS 36.300, V9.3.0, “Technical specification group radio access network; Evolved universal terrestrial
radio access (E-UTRA) and evolved universal terrestrial radio access network (E-UTRAN); Overall
description; Stage 2 (Release 9)”, 2010.
[6] A. Alexiou, C. Bouras, V. Kokkinos, A. Papazois, and G. Tsichritzis,“Efficient MCS Selection for MBSFN
Transmissions over LTE Networks”, 3rd IFIP Wireless Days 2010, Venice, Italy, pp. 1-5, 2010.
[7] A. Alexiou, C. Bouras, V. Kokkinos, A. Papazois, and G. Tsichritzis,“Spectral Efficiency Performance of
MBSFN-enabled LTE Networks”, 6th IEEE International Conference on Wireless and Mobile Computing,
Networking and Communications (WiMob 2010), Niagara Falls, Canada, pp. 361-367, 2010.
[8] A. J. Goldsmith, and S. G. Chua, “Adaptive coded modulation for fading channels”, IEEE Transactions on
Communications, vol. 46, no. 5, pp.595-602, 1998.
[9] A. J. Goldsmith, and S. G. Chua, “Variable-Rate Variable-Power MQAM for Fading Channels”, IEEE
Transactions on Communications, vo1.45, no.10, pp. 1218-1230, 1997.
[10] C. Ball, T. Hindelang, I. Kambourov, and S. Eder, “Spectral efficiency assessment and radio performance
comparison between LTE and WiMAX”, 2008 IEEE International Symposium on Personal, Indoor and
Mobile Radio Communications (PIMRC 2008), Cannes, France, 2008.
[11] C. Mehlfhrer, M. Wrulich, J. C. Ikuno, D. Bosanska, and M. Rupp, “Simulating the Long Term Evolution
Physical Layer”, 17th European Signal Processing Conference (EUSIPCO 2009), Glasgow, Scotland, 2009.
[12] C. Y.Wong, R. S. Cheng, K. B. Lataief, and R. D. March, “Multiuser OFDM with adaptive subcarrier, bit and
power allocation”, IEEE Journal on Selected Areas in Communications, vol. 17, no. 10, pp. 1747-1757, 1999.
[13] D. T. Phan Huy, R. Legouable, D. Ktenas, L. Brunel, and M. Assaad, “Downlink B3G MIMO OFDMA link
and system level performance”, 2008 IEEE Vehicular Technology Conference (VTC 2008-Spring),
Singapore, 2008.
[14] H. Holma, and A. Toskala, “LTE for UMTS - OFDMA and SC-FDMA based radio access”, John Wiley &
Sons, 2009.
[15] L. Rong, O. Haddada, and S. Elayoubi, “Analytical analysis of the coverage of a MBSFN OFDMA network”,
IEEE Global Communication Conference 2008 (Globecom 2008), New Orleans, USA, 2008.
[16] M. Rumney (ed.), “LTE and the Evolution to 4G Wireless: Design and Measurement Challenges”, Agilent
Technologies, 2009.
[17] S. E. Elayoubi, O. Ben Haddada, and B. Fourestie, “Performance evaluation of frequency planning schemes
in OFDMA-based networks”, IEEE Transactions on Wireless Communications, vol. 7, no. 5, pp. 1623-1633,
2008.
18

[18] Y. Sheng, M. Peng, and W. Wang, “A novel adaptive modulation and coding strategy based on partial
feedback for enhanced MBMS network”, The Journal of China Universities of Posts and
Telecommunications, vol. 15, issue 1, pp. 48-54, 2008.
19

20
APPENDIX A: ACRONYMS
Acronym Explanation
3GPP 3rd Generation Partnership Project
AMC Adaptive Modulation and Coding
AWGN Additive White Gaussian Noise
BLER Block Error Rate
CCI Co-Channel Interference
CP Cyclic Prefix
CQI Channel Quality Indicators
CSI Channel Status Information
ECR Effective Code Rate
EESM Exponential Effective SIR Mapping
e-MBMS evolved MBMS
e-NBs evolved Node Bs
e-UTRAN evolved UMTS Terrestrial Radio Access Network
FEC Forward Error Correction
HARQ Hybrid Automatic Repeat Request
ISD Inter Site Distance
LTE Long Term Evolution
MBMS Multimedia Broadcast/Multicast Service
MBSFN MBMS over Single Frequency Network
MCS Modulation and Coding Scheme
M-QAM M-ary Quadrature Amplitude Modulation
OFDMA Orthogonal Frequency Division Multiple Access
PTM Point-to-Multipoint
PTP Point-to-Point
SE Spectral Efficiency
SINR Signal to Interference plus Noise Ratio
UMTS Universal Mobile Telecommunications System