modulation of fluorescent light: flicker rate and light...
TRANSCRIPT

Modulation of fluorescent light: flicker rateand light source effects on visualperformance and visual comfort
Veitch, J.A.; McColl, S.L.
A version of this paper is published in / Une version de ce document se trouve dans :Lighting Research and Technology, v. 27, no. 4, 1995, pp. 243-256
NRCC-38944
www.nrc.ca/irc/ircpubs
Flicker rate and spectral effects 1
Modulation of Fluorescent Light: Flicker Rate and Light Source Effects onVisual Performance and Visual Comfort
Jennifer A. Veitch†, Ph.D. and Shelley L. McColl‡, B.Sc.(Hons.)
† National Research Council of Canada, Institute for Research in ConstructionBuilding M-24, 1500 Montreal Road, Ottawa, Ontario, K1A 0R6 Canada.E-mail: [email protected]
‡ Queen’s University at Kingston
Citation: Veitch, J. A., & McColl, S. L. (1995). Modulation of fluorescent light: Flicker rateand light source effects on visual performance and visual comfort. Lighting Research andTechnology, 27, 243-256.
© National Research Council of Canada, 1995
Summary
The effects of fluorescent light spectral composition and flicker rate on visual performance andvisual comfort were studied on 48 undergraduate students using two different rates of flicker:conventional low-frequency flicker (120 Hz) and high frequency flicker (between 20-60 kHz);and three different light sources; full-spectrum lamps, cool-white lamps, and filtered-cool-whitelamps. The design was a 2 x 3 (Flicker Rate X Light Source) mixed within-between ANOVA.Visual performance and time on visual performance task were assessed using a Landolt ring task.Visual comfort was assessed by self-report after a period of reading difficult text. Visualperformance scores of 18-24-year-old male and female university students were significantlyhigher in the high-frequency flicker condition than the low-frequency flicker condition. Therewere no other statistically significant effects. Health status was unrelated to visual performance.Neurophysiological explanations are discussed. The finding that an energy-efficient means ofdriving fluorescent lamps also can improve visual performance provides added impetus to adoptthis new technology.

Flicker rate and spectral effects 2
1 Introduction
Since its introduction, fluorescent lighting has elicited complaints of visual discomfort andheadache.(1) These reports may be associated with reduced visual performance. Putative causesof these effects include both flicker rate and spectral power distribution.(2,3) This experimentexamined both variables in relation to visual performance and visual comfort.
Luminous modulation of fluorescent lamps powered on alternating current is well-known.Conventional core-coil magnetic ballasts result in flicker at twice the frequency of the electricalsupply (60 Hz in North America, resulting in flicker at 120 Hz). Energy-efficient electronicballasts operate at substantially higher frequencies (20-60 kHz).
Less well-known is the chromatic modulation resulting from differential decay rates of lightemissions from the various phosphors used in fluorescent lamps. Some of the commonly-usedphosphors that emit long-wavelength light continue to do so for some time after the gasdischarge, whereas phosphors with greater emission at shorter wavelengths persist for a shortertime.(4) The longer persisting phosphors introduce a phase lag with the result that the lightalternates in colour as well as intensity. The rate of chromatic flicker depends on the type ofballast used to power the lamps and the persistence of the specific phosphors.
Although the flicker from most fluorescent sources cannot be resolved perceptually, there isevidence that the sensory system detects the oscillations. Schneider (5) found that evokedpotentials in the rabbit’s visual cortex pulse in synchrony with flashes of light presented at afrequency greater than the critical fusion frequency (CFF). In the cat, phase-locked responses tothe oscillations of fluorescent light were found in the retina and the lateral geniculate nucleus. (6-8)
Eysel and Burandt(6) found a two-fold increase in the mean firing rate for fluorescent light incomparison to incandescent light and natural daylight, and found phase-locked neural responsesto a fluorescent light stimulus at frequencies above the perceptual CFF.
In humans, evoked potentials and electroretinogram (ERG) responses above the levels ofperceptual CFF have been detected in response to luminous modulation.(9-13) Berman,Greenhouse, Bailey, Clear, and Raasch(14) found that rhythmic potentials in the human ERG canbe elicited by fluorescent lighting at frequencies as high as 147 Hz, which is a higher frequencythan the usual 120 Hz of a fluorescent lamp with a core-coil magnetic ballast.
The evidence for sensory and neural responses to modulations in light stimuli may provide aneurophysiological explanation for the asthenopic symptoms reported in response to fluorescentlight. Rey and Rey(15) found that working under low-frequency (50 Hz) fluorescent light caused alarger drop in perceptual CFF and a larger increase in reaction time than working under high-frequency fluorescent light (100 kHz). They inferred from these findings that low-frequencyflicker causes more visual fatigue.
In applied research, two studies have found that increasing the operating frequency of thefluorescent lighting system decreases the incidence of eyestrain, headache, and other asthenopicsymptoms. (16,17) Wilkins et al.(17) found that the installation of high-frequency ballasts led to a50% reduction in the reported incidence of eye-strain and headaches in office workers.

Flicker rate and spectral effects 3
Flicker might also disrupt visual performance. Rey and Rey (15) found more errors on aproofreading task performed under low-frequency flicker than under high-frequency flicker.West and Boyce (18) and Wilkins (19) found that saccadic eye movements are disrupted by low-frequency flicker, but not high-frequency flicker.
To date there are no published reports on the effects of chromatic (as opposed to luminous)flicker per se on visual performance and visual comfort. The best evidence to date is indirect:Wilkins and Clark (4) established that chromatic flicker is a function of lamp type. Wilkins andWilkinson (20) developed a tint for eyeglasses to reduce the impact of the chromatic modulationof fluorescent lamps. Wilkins and Neary (21) examined the visual, perceptual, and optometriceffects of individualised tinted eyeglasses on people who had a history of reading difficulties andperceptual distortions. The tinted lenses reduced discomfort and perceptual anomalies whenviewing gratings, and they caused a small improvement in the speed of visual search. It was notclear to the authors whether or not these results were caused by reductions in chromatic flicker.
In addition to the differential modulation that occurs with different lamps, it is possible thatvariations in spectral power distribution (SPD) might affect visual performance and visualcomfort.(2,3) Particular attention has focused on full-spectrum fluorescent lamps:* For example,anecdotal reports(22) have contended that full-spectrum lighting allows students to see theblackboard as clearly from the back of the classroom as from the front.
In the research literature, beneficial effects reported for full-spectrum lamps include improvedvisual acuity (23,24) and reduced fatigue.(24) Berry (25) found that electronic assembly workersreported clearer vision under full-spectrum fluorescent illumination than cool-white lighting,although her study did not include a direct measure of visual performance or acuity. Berman’s (26)
scotopic sensitivity theory predicts that light sources rich in short wavelength illumination willmaximally stimulate the scotopic visual system, reduce pupil size, and increase visual acuityrelative to other light sources. Full-spectrum lamps are scotopically rich in comparison to cool-white or warm-white lamps.
Berman, Fein, Jewett, and Ashford (27,28) found that scotopically rich fluorescent sources doindeed reduce pupil size and improve visual acuity, but the effect was measurable only for lowcontrast, briefly presented stimuli, and the two lamp type conditions represented the extremes ofscotopically rich (blue-green) and scotopically poor (pinkish-red) light. Several other studiesencompassing both strict laboratory conditions and more realistic settings have failed to findeffects of lamp spectral composition on visual performance or visual acuity. (29-33)
Overall, it is not clear whether or not spectral differences affect visual performance. There issome evidence suggesting that full-spectrum lighting may provide a slight advantage in visualacuity for tasks that are extremely difficult, but these effects do not appear to generalise to morecommon tasks, light levels, or settings. Methodological limitations in the research on full-spectrum fluorescent lighting weaken the causal inferences that the investigators seek to make.(35,36)
* For the purposes of this study, a full-spectrum lamp is a fluorescent lamp with a correlated colour temperature(CCT) of 5000 K or greater, a colour rendering index (CRI) value of 90 or greater, relatively equal emissions in allportions of the visual spectrum and some emissions in the near ultraviolet range.

Flicker rate and spectral effects 4
The present experiment was an examination of the effects of SPD and flicker rate on visualperformance and visual comfort. There were three SPD conditions: full-spectrum fluorescentlight [FS], cool-white fluorescent light [CW], and filtered-cool-white fluorescent light [FCW].The filter used in this study is marketed in Canada as a low-cost alternative to full-spectrumlamps; the manufacturer claims that the filter, when applied to a cool-white lamp, produces aSPD similar to that of a full-spectrum lamp and to natural daylight. The filter does not, however,produce the chromatic flicker that is inherent to the full-spectrum lamp. Chromatic flicker wouldbe greatest in the FS condition, lower in the CW condition, and least in the FCW condition (cf.,Ref. 4, 20). Chromatic and luminous flicker differences between the CW and FCW conditionswould be small because the lamps and ballasts in both cases were the same.
These SPD conditions were crossed with two flicker rates: low-frequency (120 Hz) [LF], createdby using a dimmable core-coil magnetic ballast; and high-frequency (20-60kHz) [HF], created byusing a dimmable electronic ballast. The design was a 2 x 3 (Flicker Rate X Light Source) mixedwithin-between analysis of variance (ANOVA). Visual performance, time on the visualperformance task, and visual comfort were assessed using a battery of tests.
Three hypotheses were tested:
1. An interaction was expected between light source and flicker rate. No light source effectwas expected for the HF condition. In this condition there would be no detectable modulation,neither luminous nor chromatic. However, a light source effect was hypothesised for the LFcondition. The chromatic modulation theory would predict the poorest visual performance andleast visual comfort under FS fluorescent light, followed by CW and FCW, which would benearly equal in visual performance and visual comfort.
2. A main effect of flicker rate was expected between lamps operating at low frequenciesand those operating at high frequencies; visual performance and visual comfort were expected tobe significantly higher for HF than for LF.
3. Berman’s theory of scotopic sensitivity predicts a lamp type main effect in which thelighting condition with the greatest proportion of short-wavelength light (FS) would produce thebest visual performance. This prediction contrasts with the prediction based on chromaticmodulation, in which the full-spectrum lamp would cause the poorest performance.
2 Participants
Participants were 48 volunteers (16 male and 32 female) from an introductory psychology courseat medium-sized Canadian university. They ranged in age from 18 to 24 years; however, 32 wereage 19. Participation was for course credit points, and all participants were treated in accordancewith the rules of the university’s ethics policy for research on human participants.
Age was restricted to this narrow range to limit the influence of age-related changes in vision,such as presbyopia. All participants had self-reported normal or corrected-to-normal vision andnormal colour vision. Normal vision was verified using the Titmus vision test (Titmus OpticalVision Tester Model OV7-M, Titmus Optical Co.), which includes six Ishihara Pseudo-

Flicker rate and spectral effects 5
Isochromatic Plates to determine the presence or absence of colour vision deficiencies. Allparticipants wore their corrective lenses, if any, during the entire session.
3 Setting
Tests were administered in a small windowless room, 2.5 m wide, 3 m long and 2.2 m high.Three of the walls of the room were dark grey with a matte finish, and a white light proof curtainmade the fourth wall. The ceiling was constructed of white fibreboard tiles. The floor coveringwas white speckled black tile. The room was equipped with four tables, three of which wereused to support the main apparatus. A fourth small desk was used by the participants whencompleting written material.
The ambient room lighting consisted of three 60 W incandescent lamps, with 200 lx provided onthe work surfaces. This level is consistent with the Illuminating Engineering Society of NorthAmerica (IESNA) recommendations.(37)
4 Dependent Variables
4.1 Visual performance task.
The measure of visual performance was the Vision and Lighting Diagnostic Kit (VALiD).(38)
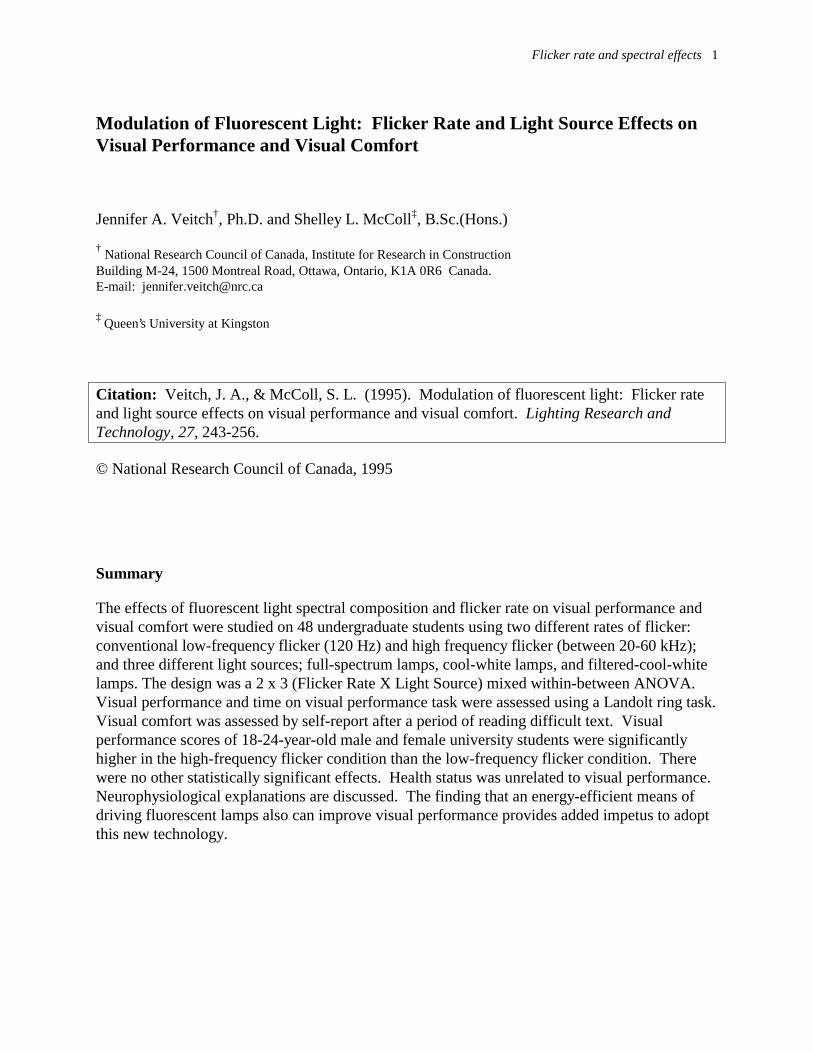
The Landolt ring task used in this kit consists of 12 rows (labelled A to L) and thirteen columns(numbered one to thirteen) of Landolt rings, printed onto a white card of high quality paper (18cm x 19 cm) mounted on a metal plate. The rings vary systematically in size and luminancecontrast. From the top left corner, ring size and gap size decrease across the columns (gap sizeranges from 0.051 cm to 0.009 cm). Moving down columns, from top to bottom, the luminancecontrast decreases systematically by rows of two (from .90 to .08). This provides two equivalentforms of the task (odd- and even- rows). The contrast is greatest for the top two adjacent rowsand the least for the bottom two rows. The task page is reproduced in Figure 1.
The dependent measure was the number of rings per row for which the participant correctlyidentified the orientation of the gap in the ring. This gave a separate score for each of the 6luminance contrasts. A stopwatch was used to time participants as they performed the VALiDtask, to provide a measure of the time spent on the visual task.
Flicker rate and spectral effects 6
Figure 1. The Vision and Lighting Diagnostic Kit (VALiD) Landolt ring task.

Flicker rate and spectral effects 7
4.2 Visual comfort task.
Visual comfort was assessed by self-report after a period of reading difficult text lit by one of the6 lighting conditions. The text was printed in 5-pt Helvetica type on matte white paper. Thispoint size was selected to make the task difficult enough to detect effects during the shortexposure of participants to the lighting condition. The content of the text was two non-fictionselections from standard reading tests appropriate to the participants’ education level. The printsize was too small to permit direct luminance measurements for the calculation of luminancecontrasts. Therefore, the luminance of the print was measured from the thick stroke of a 16-ptletter M printed on the same matte white paper, using the same laser printer. The luminancecontrasts were .92, .84, and .86 for the FS, CW, and FCW conditions respectively.
Participants read the material for 5 min, then completed a questionnaire on visual comfort,printed in high-contrast black on matte white paper. There were sixteen 7-point Likert items inthe questionnaire. For each item, the participant rated the degree to which he or she currentlyexperienced a particular sensation, from 1 = not at all to 7 = very much. The visual comfortscore was the average of the ratings on seven items: blurred or narrowed vision; irritated eyes;dry eyes; spots or shapes in front of the eyes; eyestrain; headache; other vision problems. Theseseven items were adapted from Wilkins and Neary. (21) The remaining nine items were fillers(e.g., restless; hungry; anxious; bored; back strain).
4.3 Health status questionnaire.
A questionnaire administered at the end of the session was used to record information aboutpersonal health and well-being and family health history. Its purpose was to allow for theidentification of possible individual differences affecting the principal dependent measures. Thecontent of the questionnaire was based on factors identified in the literature with a susceptibilityto light modulation effects. These are: migraine (39); reading difficulties (40); anxiety (41); ocularpathologies (42); eye-strain and headaches (17); epilepsy (42). The questionnaire also includedquestions about diseases which have effects on the visual system, sleep habits, colds, and theintake on that day of caffeine and decongestants, which are known to affect pupil size. The lattervariables were included as possible explanations of any outlying cases in the performance data.
5 Independent Variables
5.1 Flicker rate.
Flicker rate was controlled using two ballast conditions: low-frequency (120 Hz) flicker, createdby driving the lamps using a standard 120 V, F40T12 dimmable magnetic ballast (MagnetekUniversal model 502-A-TC-P); and very high-frequency (20-60 kHz [manufacturer’s data])flicker, created by driving the lamps using a controllable electronic integrated-circuit ballast(Advance Mark VII model RDC 2S40-TP). Each ballast type was wired to two luminaires (fourlamps). The source of electricity was provided by the mains 60 Hz, 120 V supply maintainedwithin ± 1% V by an uninterruptible power supply (ME Series, 2.1 kVA).

Flicker rate and spectral effects 8
5.2 Light source.
The VALiD and visual comfort tasks were presented in a specially-constructed apparatus forindirect illumination. The task was centred on a painted white plywood platform between two 25cm x 1 cm apertures. These apertures admitted light from a 1 x 4 - foot luminaire beneath. Lightwas reflected from a hemispheric dome (113 cm in diameter) coated with spectrally neutralreflective paint . Participants viewed the task through a 10.2 cm x 3.8 cm viewing port (alsocoated white inside) directed downward vertically from the top of the dome. The viewingdistance from the top of the viewport to the task surface was 47 cm. A schematic drawing of theapparatus is shown in Figure 2.
Figure 2. Schematic representation of the apparatus. A: Hemispheric dome. B: Viewport. C: Aperturesadmitting light from luminaire beneath. D: VALiD task. E: Illuminance cell under dome. F: Illuminance meter.
B

Flicker rate and spectral effects 9
Four luminaires in total were used for this experiment; they were laid side-by-side on thelaboratory tables for convenience. Two were equipped with core-coil magnetic ballasts, and twowith dimmable electronic ballasts. One luminaire of each ballast type was outfitted with cool-white fluorescent lamps (GE F40T12 CW) , and one with full-spectrum fluorescent lamps (GEF40 T12 Chroma 50). For the filtered-cool-white condition, the acrylic filter (Fluoresoft) wasplaced over the apertures in the platform over the appropriate luminaire.
All the lamps in all the luminaires were new at the start of the experiment. They were burned-infor 100 hours prior to the initial photometric readings, and were burned simultaneously thereafterto maintain equivalent lamp life and temperature conditions. There was a 45-minute warm-upperiod for the lamps prior to each day’s testing. Only one luminaire provided light to the VALiDdome at a given time; the others were covered with a plywood board.
Pilot testing established that 200 lx illuminance on the task would be appropriate for participantsof this age. The light level under the hemisphere was measured continuously by a HagnerUniversal Photometer (Optikon, Inc., Model S2). The illuminance probe was located on thesurface of the platform, adjacent to the task. The meter itself was located outside of the dome,concealed in a box, where it was accessible to the operator at all times. A conventionalluminance meter was used to ascertain that the luminance was even across the task area for alllighting conditions.
5.3 Photometric details.
Table 1 gives the luminous characteristics for the six light source X ballast conditions. SPDswere measured using a Pritchard spectroradiometer (Photo Research 703A). These wereexpected to differ from the manufacturers’ data because the task was illuminated indirectly, andthe precise characteristics of the spectrally reflective paint on the dome were not known . Themeasurements were taken in a dark room and were made by positioning the lens of thespectroradiometer directly over a circular viewing port located on top of the dome. All readingswere taken from the centre of the VALiD task because preliminary photometry indicated thatluminance was even across the task surface. The SPDs, for both LF and HF flicker conditions, ofthe FS, CW, and FCW lighting with 200 lx on the task are shown graphically in Figures 3, 4 and5, respectively. CCTs, chromaticity co-ordinates and luminances are displayed in Table 1.

Flicker rate and spectral effects 10
Table 1 Light Source Specifications
Light Source
Radiance
(W/ster*m2)
LPhot
(cd/ m2)
LScot
(cd/ m2)
S/P x y CCT IESNAFlickerIndex
Magnetic (LF) Ballast
F40T12CW 0.1297 50.36 64.81 1.29 .4169 .4205 3485 .147
F40T12CW + filter 0.1430 49.75 52.54 1.06 .4601 .3908 2538 .137
F40T12 Chroma 50 0.1604 47.47 79.87 1.68 .3919 .4027 3888 .334
Electronic (HF) Ballast
F40T12CW 0.1081 41.32 52.92 1.28 .4220 .4232 3410
F40T12CW + filter 0.1262 43.48. 45.39 1.04 .4650 .3939 2498
F40T12 Chroma 50 0.1467 41.91 69.47 1.66 .3988 .4048 3746
Note. Magnetic ballast: Magnetek Universal model 502-A-TC-P. Electronic ballast: Advance Mark VII modelRDC 2S40-TP. All measurements were taken from the task surface, indirectly lit by the hemispheric dome.Radiance values and relative spectral intensities were obtained using a Pritchard spectroradiometer withmeasurement from 390 to 728 nm, every 2 nm. LPhot (photopic luminance) and LScot (scotopic luminance) werecalculated from spectroradiometer readings. S/P ratio calculated from LScot and Lphot. x and y are the CIEchromaticity co-ordinates. The IESNA Flicker Index is the area above the average light output divided by the totalarea of the light output curve for a single cycle; possible values range from 0 to 1, zero indicating steady output.
Figure 3. Spectral power distribution in reflective dome, 200 lx indirect illumination on task: Full-spectrum lampswith magnetic and electronic ballasts.
0.00E+00
4.00E-04
8.00E-04
1.20E-03
1.60E-03
300 400 500 600 700 800
Wavelength
Rad
ian
ce (
W*m
-2*s
ter-1
)
Magnetic Ballast
Electronic Ballast

Flicker rate and spectral effects 11
Figure 4. Spectral power distribution in reflective dome, 200 lx indirect illumination on task: Cool-white lampswith magnetic and electronic ballasts.
Figure 5. Spectral power distribution in reflective dome, 200 lx indirect illumination on task: Filtered-cool-whitelamps with magnetic and electronic ballasts.
The CCTs were consistently somewhat lower in the HF condition. The SPDs showed theexpected shapes for the FS and CW condition, given that these curves are for reflected light(manufacturers report SPDs for direct light). Contrary to the advertising literature, the SPD ofthe FCW condition resembled that of the CW more than it did the FS. The filter shifted the peakof the distribution up approximately 30 nm from that for the CW lamps alone. Therefore, thefiltered light did not mimic either natural daylight or full spectrum light.
All lighting conditions had been previously equated (using the Hagner illuminance meter) for200 lx horizontal illuminance on the task surface, from which the spectroradiometer readingswere taken, therefore one would expect the luminances to be equal for both ballast conditions.We surmise that the lower spectroradiometric readings for the HF conditions compared to the LF
0.00E+00
4.00E-04
8.00E-04
1.20E-03
1.60E-03
300 400 500 600 700 800
Wavelength
Rad
ian
ce (
W*m
-2*s
ter-1
)
Magnetic Ballast
Electronic Ballast
0.00E+00
4.00E-04
8.00E-04
1.20E-03
1.60E-03
300 400 500 600 700 800
Wavelength
Rad
ian
ce (
W*m
-2*s
ter-2
)
Magnetic BallastElectronic Ballast
Flicker rate and spectral effects 12
conditions might be artifacts of the speed of the detector array. Differences between lamp typesare attributable to the photometric error associated with differences between the (incandescent)standard lamp used to calibrate the meter, and the test lamps(43).
Both photopic and scotopic luminance were calculated from the spectroradiometric data using Vλ
and V’λ. The ratio of scotopic to photopic luminances is presented in Table 1. The FSconditions are clearly more scotopically rich than the other conditions, and by a degree sufficientthat an effect of scotopic sensitivity might be expected (cf. Ref. 26).
Luminous modulation was measured directly from the lamps using a Thorlab high speed silicondetector, for the three light source conditions using the dimmable magnetic ballasts only.Equipment limitations precluded measurement of the luminance modulation for the electronicballast conditions. We judged this to be acceptable in view of the fact that the HF condition istwo orders of magnitude greater than the highest flicker rate detectable by the human sensorysystem, so that for practical purposes its modulation rate is zero.
Table 1 shows the values of the IESNA flicker index for the CW, FCW, and FS lamps. Thesevalues correspond to peak-to-peak modulation of 45.3% (CW), 42.7% (FCW), and 98.5% (FS),which are comparable to values reported previously for European lamps at 50 Hz AC supply. (44)
The FS lamps exhibit more than twice as much luminous modulation as the other light sourceconditions, reflecting chromatic as well as luminous modulation (cf. Ref. 4). The filter reducedthe modulation of the CW lamps only to a small degree.
6 Procedure
Each of the 48 participants was randomly assigned by the experimenter to one of the threelighting source conditions, FS, CW, or FCW. There were sixteen participants per group. Allparticipants completed the dependent measures with two flicker rates, once with HF flicker andonce with LF flicker. The order of flicker rate was counterbalanced across participants.
It was not possible for the experimenter to be blind to the experimental conditions. We reducedthe possibility of experimenter bias as much as possible by the strict application of a script for thesession so that identical instructions were given for both flicker rate conditions, and to keep thedata scoring as objective as possible. (Subject bias is discussed below.)
The time required for participation was approximately 60-70 minutes. All sessions took place inthe evenings between 4 p.m. and 10 p.m. to control the initial adaptation luminance, and to limitdifferences between participants in alertness. During the day, brightness adaptation would havevaried widely between participants who arrived from outdoors and those who had been inside fora period of time; this difference was minimised by testing at night. Furthermore, visualperformance is extremely sensitive to fatigue. Evening testing sessions reduced variabilityassociated with differences in waking time, food and caffeine intake, and activity.
The participants were told that the experiment concerned sensory processing. Approximately 15min were required for the initial instructions; this period also served as the adaptation period.The participants were informed that they would be performing several visual tasks, an auditory
Flicker rate and spectral effects 13
task, and a few questionnaires. The experimenter then explained that participants had the right toleave at any time without penalty, and that all data provided by them would remain anonymousand confidential. These instructions were followed by the signing of a consent form. Theexperimenter then administered the Titmus vision test. One participant who did not pass the testwas thanked for attending the session and was given course credit for attending.
The remainder of the session was carefully structured to prevent fatigue effects from biasing theoutcome of the VALiD task, which is extremely sensitive to fatigue. The visual comfort task isdesigned to induce fatigue. Each participant completed the VALiD task, followed by the visualcomfort task, for one flicker condition, then a five-minute auditory filler task, and then theVALiD task and the visual comfort task for the second flicker condition. This was followed bythe health status questionnaire and, finally, a post-experimental questionnaire.
The experimenter prefaced the first VALiD task with careful instructions about the task.Participants were instructed to read every other row from left to right, starting with either row Aor B. The starting row was counterbalanced across participants. The experimenter stressed thatthey were to read at their own pace and encouraged them to guess if they found a particular circledifficult to see.
Participants were then asked to position themselves ready to look through the viewport, and toclose their eyes. When the experimenter was ready, participants were told to open their eyes. Assoon as the eyes opened, the experimenter started the stopwatch. As the participant called out theorientation of each gap, the experimenter recorded it on a score sheet. When the participantreported not being able to see any further rings, the experimenter stopped the stopwatch andrecorded the time.
The participant moved to the writing desk while the experimenter removed the VALiD task plateand replaced it with the visual comfort task reading material. Participants were asked to try tomake their best effort to understand the material. They were allotted five minutes to read thetext. If any participant finished reading the text before the five minutes were up, they were toldto memorise a portion of the text. Immediately following, participants moved to the writing deskand filled out the visual comfort questionnaire.
For the filler task, participants listened to music while wearing headphones. They wereinstructed that the listening would be followed by subjective questions about the music. Tominimise eye-strain, participants were instructed to gaze at the wall across the room while theylistened. The subjective questions were ratings on three 7-point Likert scales of whether themusic had been loud, pleasant, and relaxing. These data were not analysed.
While the participant listened to the music, the experimenter shifted the dome to the alternateluminaire with the second ballast type and replaced the VALiD task plate ready for the secondhalf of the session. This repeated the testing cycle. The only difference in the second VALiDtest was that participants started reading at a different row than they did during the first test.Ballast order and starting row (A or B) were counterbalanced between participants. The contentof the text for the visual comfort task also was counterbalanced.

Flicker rate and spectral effects 14
Following the second visual comfort questionnaire, participants remained at the writing desk tocomplete the health status questionnaire and the post-experimental questionnaire. The latterserved as a cross-check to test for participant biases.
This completed their participation. A complete debriefing was posted on a public bulletin boardfollowing the completion of the data collection. This procedure was followed to ensure that allparticipants were equally naive as to the purposes of the study at the time of their participation.
7 Subject Bias Results
The results of the post-experimental questionnaire indicated that none of the participants wereaware of the lighting manipulations. Therefore, there is no reason to believe that the results ofthis study were contaminated by participant biases or expectancies concerning the expectedoutcomes.
8 Performance Measure Results
Three conceptually distinct dependent measures were analysed: visual performance, time onvisual performance task, and visual comfort. There were multiple measures of visualperformance (the VALiD scores for 6 contrast levels); therefore, the analysis of those data used amultivariate analysis of variance (MANOVA); univariate ANOVA was used for the remainingdependent measures.
For all these analyses the following analytical model was used: a 2 x 3 (Flicker Rate x LightSource) mixed within-between ANOVA design in which the effects were partitioned into thefollowing single-degree-of-freedom, planned orthogonal contrasts:
1. a main effect for flicker rate [Ballast];
2. main effects for light source:
a. a comparison of the FS condition to both CW and FCW conditions together [Lamp 1];
b. a comparison of the CW to the FCW conditions [Lamp 2];
3. an interaction between light source 2a and flicker rate [Interaction 1];
4. an interaction between light source 2b and flicker rate [Interaction 2].
8.1 Visual performance.
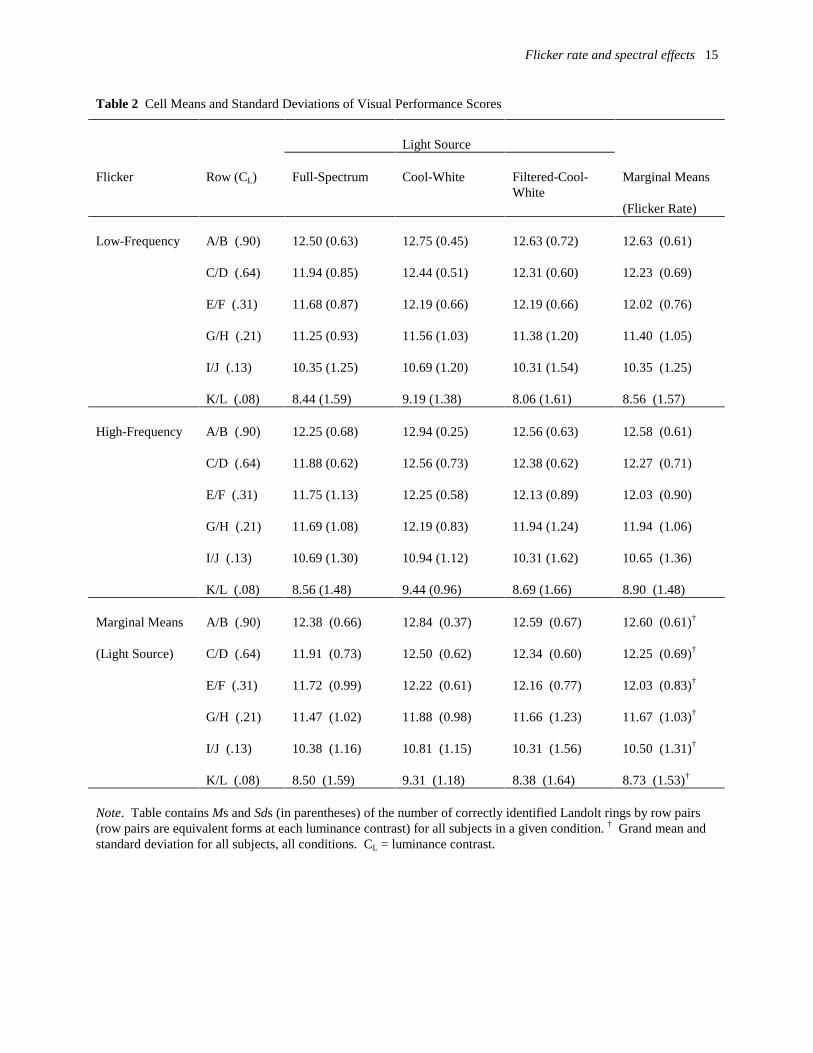
Visual performance scores were calculated as the number of rings reported correctly in each row.Means and standard deviations for all six experimental conditions are presented in Table 2.These data were analysed using the MANOVA described above. The MANOVA results aresummarised in Table 3.
Flicker rate and spectral effects 15
Table 2 Cell Means and Standard Deviations of Visual Performance Scores
Light Source
Flicker Row (CL) Full-Spectrum Cool-White Filtered-Cool-White
Marginal Means
(Flicker Rate)
Low-Frequency A/B (.90) 12.50 (0.63) 12.75 (0.45) 12.63 (0.72) 12.63 (0.61)
C/D (.64) 11.94 (0.85) 12.44 (0.51) 12.31 (0.60) 12.23 (0.69)
E/F (.31) 11.68 (0.87) 12.19 (0.66) 12.19 (0.66) 12.02 (0.76)
G/H (.21) 11.25 (0.93) 11.56 (1.03) 11.38 (1.20) 11.40 (1.05)
I/J (.13) 10.35 (1.25) 10.69 (1.20) 10.31 (1.54) 10.35 (1.25)
K/L (.08) 8.44 (1.59) 9.19 (1.38) 8.06 (1.61) 8.56 (1.57)
High-Frequency A/B (.90) 12.25 (0.68) 12.94 (0.25) 12.56 (0.63) 12.58 (0.61)
C/D (.64) 11.88 (0.62) 12.56 (0.73) 12.38 (0.62) 12.27 (0.71)
E/F (.31) 11.75 (1.13) 12.25 (0.58) 12.13 (0.89) 12.03 (0.90)
G/H (.21) 11.69 (1.08) 12.19 (0.83) 11.94 (1.24) 11.94 (1.06)
I/J (.13) 10.69 (1.30) 10.94 (1.12) 10.31 (1.62) 10.65 (1.36)
K/L (.08) 8.56 (1.48) 9.44 (0.96) 8.69 (1.66) 8.90 (1.48)
Marginal Means A/B (.90) 12.38 (0.66) 12.84 (0.37) 12.59 (0.67) 12.60 (0.61)†
(Light Source) C/D (.64) 11.91 (0.73) 12.50 (0.62) 12.34 (0.60) 12.25 (0.69)†
E/F (.31) 11.72 (0.99) 12.22 (0.61) 12.16 (0.77) 12.03 (0.83)†
G/H (.21) 11.47 (1.02) 11.88 (0.98) 11.66 (1.23) 11.67 (1.03)†
I/J (.13) 10.38 (1.16) 10.81 (1.15) 10.31 (1.56) 10.50 (1.31)†
K/L (.08) 8.50 (1.59) 9.31 (1.18) 8.38 (1.64) 8.73 (1.53)†
Note. Table contains Ms and Sds (in parentheses) of the number of correctly identified Landolt rings by row pairs(row pairs are equivalent forms at each luminance contrast) for all subjects in a given condition. † Grand mean andstandard deviation for all subjects, all conditions. CL = luminance contrast.

Flicker rate and spectral effects 16
Table 3 MANOVA Summary Table for Visual Performance Data
Contrast Wilks’ λ F df R2
Interaction 1 0.861 1.073 6,40 .027
Interaction 2 0.941 0.421 6,40 .008
Lamp 1 .776 1.92 6,40 .071
Lamp 2 .847 1.20 6,40 .031
Ballast .677 3.19* 6,40 .064
Row A/B .184 1,45 .004
Row C/D .136 1,45 .003
Row E/F .033 1,45 .007
Row G/H 15.99** 1,45 .262
Row I/J 2.84 1,45 .059
Row K/L 2.54 1,45 .053
Note. Univariate test results are shown only for the significant multivariate test for the Ballast effect. Lamp 1 is acontrast of FS versus CW/FCW. Lamp 2 is the contrast of CW and FCW. Interaction 1 is the interaction of Ballastx Lamp . Interaction 2 is the interaction of Ballast x Lamp 2. R2 is the correlation ratio (variance accounted for)associated with each effect. For multivariate effects, it is the average of the correlation ratios for the univariateeffects. *p<.02. **p<.01.
In interpreting MANOVA results, one interprets the univariate tests only if the correspondingmultivariate test reaches statistical significance. In this analysis, only the flicker rate contrastproduced a statistically significant overall MANOVA test [Wilks’ lambda = 0.677, F (6,40) =3.19; p < .02]. This was associated with a significant univariate effect for row pair G/H [F (1,45)= 15.99, p < .01]. Performance on this row, for which contrast was .21, was significantly betterin the HF condition (M = 11.94) than the LF condition (M = 11.40). The two rows with lowercontrasts (.13 and .08, respectively) did not show significant effects; however, the scores on thesemore difficult rows were considerably more variable (their standard deviations are 30 - 50 %higher than for row G/H), which would have obscured any significant difference.
Table 3 includes effect size information expressed as a correlation ratio. This is the proportion ofthe variance accounted for by each effect. For multivariate effects, R2 is the average of the effectsizes for the associated univariate effects. Small effects have R2 = .01; medium effects have R2
= .09; large effects have R2 = .25.(44) The significant multivariate ballast effect is small (R2 =.064), but the univariate effect for rows G/H is large. The ballast type accounts for 26% of thevariance in the visual performance scores for those two rows.
Flicker rate and spectral effects 17
No significant interactions or main effects for light source occurred. The Interaction and Lampcontrasts were less powerful than the Ballast contrast because they were between-subjectscomparisons. The correlation ratio for the multivariate Lamp 1 test was nonetheless similar tothat for the overall Ballast contrast (R2 = .071). Participants in the FS group had the lowestvisual performance score, followed by the FCW group and the CW group.
8.2 Time on visual performance task.
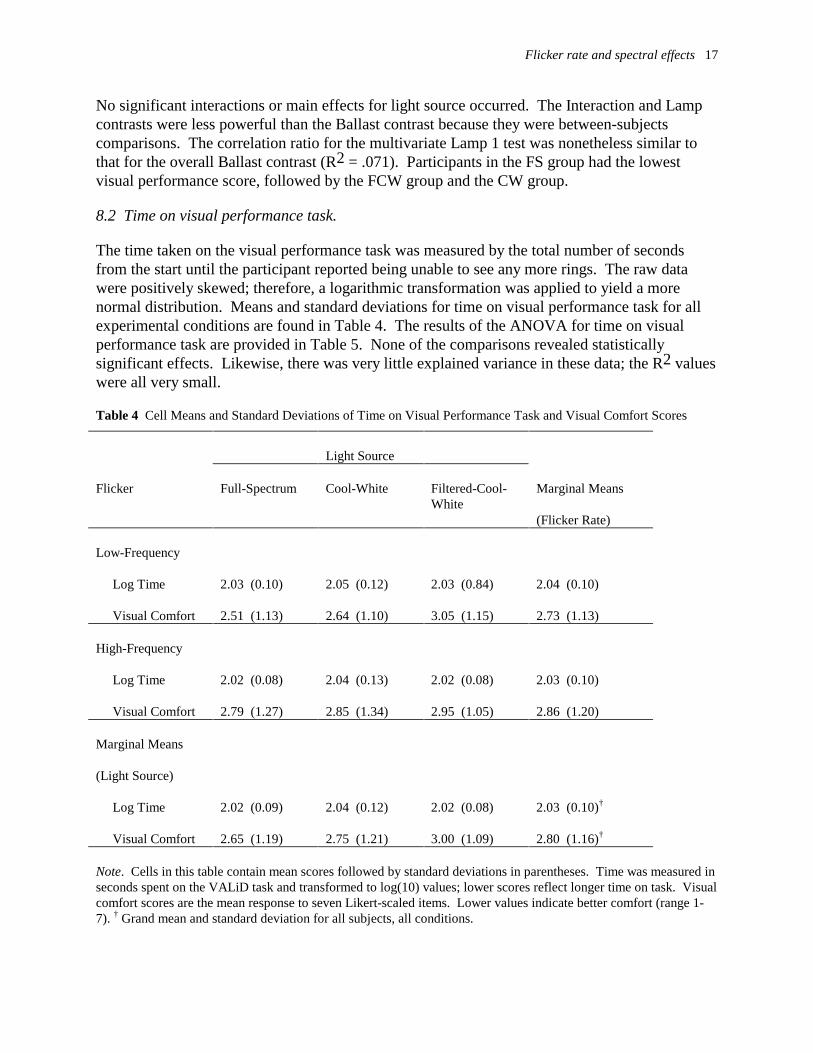
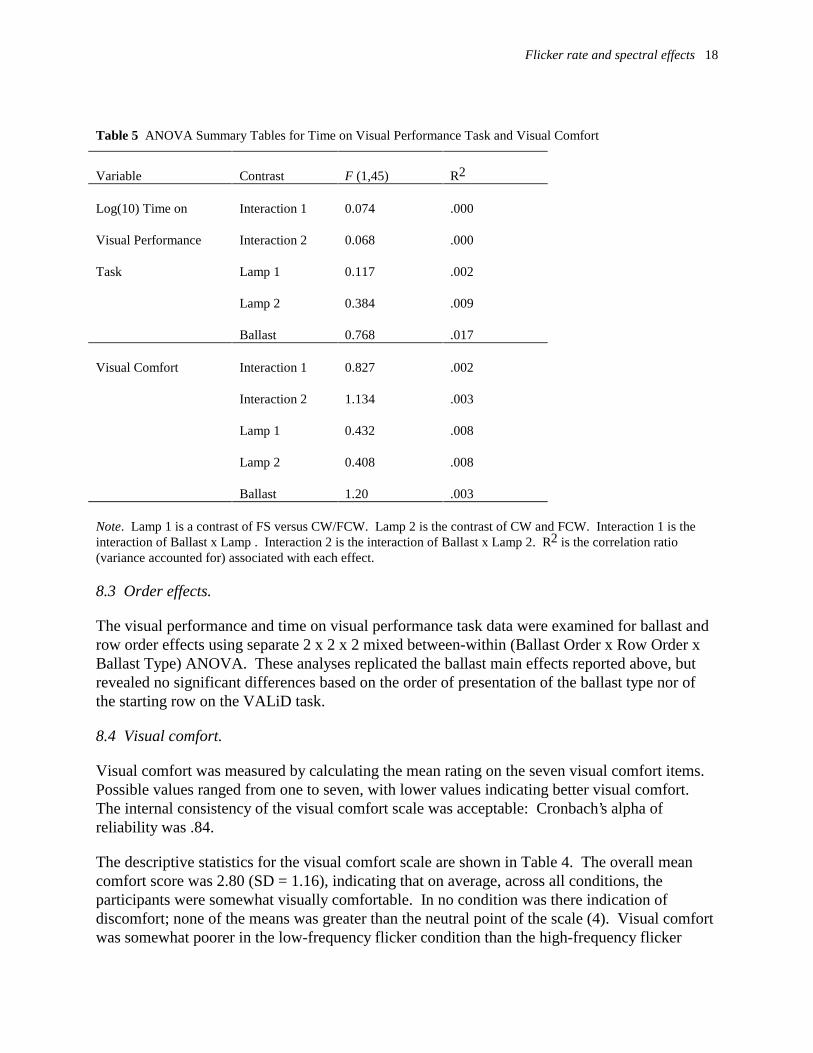
The time taken on the visual performance task was measured by the total number of secondsfrom the start until the participant reported being unable to see any more rings. The raw datawere positively skewed; therefore, a logarithmic transformation was applied to yield a morenormal distribution. Means and standard deviations for time on visual performance task for allexperimental conditions are found in Table 4. The results of the ANOVA for time on visualperformance task are provided in Table 5. None of the comparisons revealed statisticallysignificant effects. Likewise, there was very little explained variance in these data; the R2 valueswere all very small.
Table 4 Cell Means and Standard Deviations of Time on Visual Performance Task and Visual Comfort Scores
Light Source
Flicker Full-Spectrum Cool-White Filtered-Cool-White
Marginal Means
(Flicker Rate)
Low-Frequency
Log Time 2.03 (0.10) 2.05 (0.12) 2.03 (0.84) 2.04 (0.10)
Visual Comfort 2.51 (1.13) 2.64 (1.10) 3.05 (1.15) 2.73 (1.13)
High-Frequency
Log Time 2.02 (0.08) 2.04 (0.13) 2.02 (0.08) 2.03 (0.10)
Visual Comfort 2.79 (1.27) 2.85 (1.34) 2.95 (1.05) 2.86 (1.20)
Marginal Means
(Light Source)
Log Time 2.02 (0.09) 2.04 (0.12) 2.02 (0.08) 2.03 (0.10)†
Visual Comfort 2.65 (1.19) 2.75 (1.21) 3.00 (1.09) 2.80 (1.16)†
Note. Cells in this table contain mean scores followed by standard deviations in parentheses. Time was measured inseconds spent on the VALiD task and transformed to log(10) values; lower scores reflect longer time on task. Visualcomfort scores are the mean response to seven Likert-scaled items. Lower values indicate better comfort (range 1-7). † Grand mean and standard deviation for all subjects, all conditions.
Flicker rate and spectral effects 18
Table 5 ANOVA Summary Tables for Time on Visual Performance Task and Visual Comfort
Variable Contrast F (1,45) R2
Log(10) Time on Interaction 1 0.074 .000
Visual Performance Interaction 2 0.068 .000
Task Lamp 1 0.117 .002
Lamp 2 0.384 .009
Ballast 0.768 .017
Visual Comfort Interaction 1 0.827 .002
Interaction 2 1.134 .003
Lamp 1 0.432 .008
Lamp 2 0.408 .008
Ballast 1.20 .003
Note. Lamp 1 is a contrast of FS versus CW/FCW. Lamp 2 is the contrast of CW and FCW. Interaction 1 is theinteraction of Ballast x Lamp . Interaction 2 is the interaction of Ballast x Lamp 2. R2 is the correlation ratio(variance accounted for) associated with each effect.
8.3 Order effects.
The visual performance and time on visual performance task data were examined for ballast androw order effects using separate 2 x 2 x 2 mixed between-within (Ballast Order x Row Order xBallast Type) ANOVA. These analyses replicated the ballast main effects reported above, butrevealed no significant differences based on the order of presentation of the ballast type nor ofthe starting row on the VALiD task.
8.4 Visual comfort.
Visual comfort was measured by calculating the mean rating on the seven visual comfort items.Possible values ranged from one to seven, with lower values indicating better visual comfort.The internal consistency of the visual comfort scale was acceptable: Cronbach’s alpha ofreliability was .84.
The descriptive statistics for the visual comfort scale are shown in Table 4. The overall meancomfort score was 2.80 (SD = 1.16), indicating that on average, across all conditions, theparticipants were somewhat visually comfortable. In no condition was there indication ofdiscomfort; none of the means was greater than the neutral point of the scale (4). Visual comfortwas somewhat poorer in the low-frequency flicker condition than the high-frequency flicker
Flicker rate and spectral effects 19
condition; however, this difference was not statistically significant (see Table 5). None of themain effects or interactions revealed a statistically significant effect, and the proportion ofexplained variance was very small.
9 Health Status
Responses to the health status questionnaire were used to check for markers that might identifyindividuals who are more sensitive to flicker than others. The frequency of these putativemarkers was low, both in the participants and in their families; this is not surprising in that thesample was both self-selected and small. There appeared to be approximately equal distributionsof health problems across the groups, and there were no clear outlying cases that could beidentified and associated with any health problem.
First, we examined the correlations between the residual error from the visual performanceMANOVA and two continuous variables: the total number of health conditions reported with aself or family history, and the total frequency of health problem complaints. The sum of thesquared residuals across all VALiD rows and both ballast conditions was used as the indicator ofthe unexplained error. There was no correlation between this value and either health indicator.
We hypothesised further that individuals with a sensitivity to flicker would show the greatestdifference in the rank of their visual performance scores in the two flicker conditions. Thisgroup, we expected, should include more of the participants who reported frequent healthcomplaints or a history of health problems previously related to a special sensitivity to flicker.
The correlation between visual performance rank scores in the low and high frequency flickerconditions was high, but not perfect (Spearman rho= .693, p<.0001); not every individualmaintained the same rank performance in both conditions. Therefore, we formed three groupsbased on the difference in total performance (the total number of correctly identified rings in allrows of the VALiD task) for each ballast type. We subtracted the total performance in LF fromthe HF score, ranked the difference, and split the participants into low- (n=15) , medium- (n=18),and high-difference (n=15) groups on this basis. The high-difference group consisted of thoseparticipants who showed the largest improvement in HF relative to LF flicker.
To test the sensitivity hypothesis, we created three new categorical variables from continuousdata, and examined cross-tabulations of these variables with the performance differencecategories. The health variables were: the frequency of complaints (split into quartiles from thecontinuous variable); the number of conditions with a self or family history (quartile split); and,the number of neurological conditions (migraine, epilepsy, reading disorders, frequent headache)with a self or family history (possible scores 0-4; the maximum was 3). None of these tablesrevealed any relationship between health status and the difference in performance across flickerrates.
10 Discussion
The results of this experiment support the hypothesis that luminous modulation affects visualperformance. They do not support the hypothesis that the chromatic modulation that results from
Flicker rate and spectral effects 20
the interaction of fluorescent lamps and ballasts itself influences visual performance or visualcomfort; nor do they support the suggestion that the spectral composition of light affects visualperformance or visual comfort. The main effect for flicker rate, in which high-frequency flickerled to improved visual performance, was small when considered over the whole range ofcontrasts tested; but for the luminance contrast of .21, the effect was large.
This finding is consistent with a current theory about how flicker affects the brain.(45) Cells inthe brain do not fire constantly in response to stimulus features; rather, they exhibit rhythmicpatterns of firing at frequencies between 40-70 Hz. The distribution of interspike intervals is thesame for each population of cells responding to the different parts of the same stimulus. That is,the activity of cells responding to the same stimulus object are correlated and synchronised withone another. If a number of external stimuli occur at the same time, they are interpreted together.Integration of neural responses to the same stimulus is based on common temporal activity.
Low-frequency flicker (on the order of 120-150 Hz; cf. Ref. 14) may add extra noise to the neuralactivity. This noise, which has the same temporal code as the signal to be interpreted, mayinhibit object or form identification by interfering with the integration of neural responses fromthe various neurons that respond to the specific stimulus features. The additional synchronousneural activity (noise) would therefore impede stimulus recognition, especially if the object isdifficult to see, or is near threshold. In the present experiment, a large effect occurred forLandolt rings of luminance contrast .21, but not for darker rings. (The absence of a significanteffect for contrasts below .21 may be an artifact of the higher variability of performance on thoserows.)
Furthermore, the demands of processing this extra neural noise might translate into asthenopicsymptoms, such as increased eye-strain and headache.(2) If so, this would account for the reducedincidence of headache and eye-strain when electronic ballasts were introduced into offices.(17)
The absence of effects on visual comfort in this experiment probably reflects the brief exposuretime (8 minutes at most before the administration of the visual comfort measure). All theparticipants reported being relatively comfortable in both flicker conditions.
A second possibility is that eye movements were disrupted by low-frequency flicker. Wilkins (19)
found that when looking at printed text under 100 Hz or 20 kHz fluorescent light, hisparticipants’ saccadic eye movements under low-frequency light tended to overshoot the target.This might account for the results reported here.
Chromatic modulation did not appear to affect visual performance or visual comfort in thisexperiment. Results released after the data had been collected showed that for equiluminantstimuli, chromatic modulation does not affect saccadic suppression of displacement (themechanism by which the world appears to remain still while the eye makes rapid movements).(46)
It is possible that the mechanism governing saccadic movements is relatively insensitive tochromatic variation in comparison to luminous variation. This hypothesis requires furtherresearch.
The suggestion that certain individuals may be more sensitive to luminous modulation thanothers (9, 16, 20) was not supported in this sample. Our survey of health history and symptom

Flicker rate and spectral effects 21
frequency did not reveal any relationships to visual performance. It may be that the self-selectionof participants to participate caused some bias, or it may be that the sample was not large enoughto detect real population differences. A third possibility is that all people are somewhat sensitiveto luminous modulation effects, regardless of their health status.
Regarding the spectral composition of the light source, the findings do not support Berman’s (26)
hypothesis. There was no statistically significant effect of light source on visual performance,time on the visual performance task, or visual comfort. Light source accounted for 7.1% of thevariance in visual performance, which is on the same order as the overall multivariate effect offlicker rate. However, contrary to the predictions of Berman’s scotopic sensitivity theory, thevisual performance mean scores under the full-spectrum source (the most scotopically rich of thethree) were the lowest of the three visual performance scores for almost all luminance contrastsand flicker conditions (see Table 2). One would expect that with a larger sample size, this trendwould have achieved statistical significance∗ .
The results of this study have important implications for lighting practice. Under restrictiveviewing conditions and tight experimental control, young people with normal vision exhibitedbetter visual performance under high-frequency fluorescent lighting than low-frequencyfluorescent lighting. Effects on visual comfort as registered in asthenopic symptoms are knownto occur in field settings.(17) One might expect that under the usual conditions for visual work,with longer exposure times and for people of varying ages and visual abilities, the effect offlicker rate on visual performance would be magnified accordingly. Thus, the findings of thisstudy add weight to the arguments in favour of high-frequency electronic ballasts for fluorescentlighting systems: Not only are they more energy-efficient than their traditional counterparts, butthey have beneficial effects on human performance and well-being.
Research conducted to examine the effectiveness of different lighting systems on visualperformance and comfort serves a useful purpose in helping both occupants and lighting decisionmakers to make the best lighting choice. These data and others show that lamp type does notappear to be the important factor in relation to visual performance or comfort(36). The evidencehere and elsewhere (16, 19, 21) does show that using high-frequency circuitry could satisfy the needsof occupants, building owners, and the environment: Operating costs will be lower in the longrun, less energy will be required for lighting, and the reduced luminous modulation will improvethe ease of seeing. When many of the changes required to improve energy efficiency demandcurtailed activity or reduced quality of life (e.g., public transportation to replace private vehicles;lower thermostat settings), it is worth noting that what is good for the environment can also begood for people. ∗ The between-subjects comparison for spectral composition was less powerful than the within-subjects design usedby Berman and his colleagues (27) (and for the flicker rate comparison in this study). The between-subjectscomparison was necessary because there are only two equivalent forms of the VALiD test, but we wished to comparethree light source conditions. The power of this experiment to detect even a moderate difference between-groups (R2
= .09) was .31, given a sample size of 16 per group. This is low in comparison to the desired power level of .80(45)..A total sample size of 156 (52 participants per group) would have been required to achieve this level of power if thetrue effect size is moderate (a reasonable assumption, given that Berman et al found a large effect using extremeexamples of scotopically-enriched and -deficient illuminants). Obtaining a sample of that size proved impossible. Inany case, the data obtained in this experiment are inconsistent with the direction of effect predicted by Berman’stheory.

Flicker rate and spectral effects 22
Acknowledgements
Shelley McColl is now at the Department of Psychology, Dalhousie University, Halifax, NovaScotia, Canada.
This project was conducted in partial fulfilment of the requirements for the B.Sc.(Honours)degree in Psychology at Queen’s University, Kingston, Ontario, Canada by the second authorunder the supervision of the first author. The authors would like to thank Barrie Frost for hisassistance with supervision and review of early drafts of the manuscript; Martyn Timmings andDerek Stephenson for equipment samples; Dale Tiller for assistance with the research design;and Ralston Jaekel, Michael Ouellette, and Jana Svec for assistance with the apparatus andphotometry. They are grateful to Peter Boyce and Arnold Wilkins for comments provided on anearlier draft.
References
1. Stone P T Fluorescent lighting and health Lighting Research and Technology 24 55-61 (1990)
2. Wilkins A J Visual display units versus visual computation Behaviour and Information Technology 10515-523 (1991)
3. Wilkins A J Health and efficiency in lighting practice Energy 18 123-129 (1993)
4. Wilkins A J and Clark C Modulation of light from fluorescent lamps Lighting Research and Technology22 103-109 (1990)
5. Schneider C W Electrophysiological analysis of the mechanisms underlying critical flicker frequencyVision Research 8 1235-1244 (1968)
6. Eysel U T and Burandt U Fluorescent light evokes flicker responses in visual neurons Vision Research24 943-948 (1984)
7. Kimura M Neuronal responses of cat’s striate cortex to flicker light stimulation Brain Research 192 560-563 (1980)
8. 8 Lindsey D B Electrophysiology of the visual system and its relation to perceptual phenomenaIn M A B Brazier (Ed) Brain and behavior (pp 359-392) Washington, D. C.: American Institute ofBiological Science (1961)
9. Brundrett G W Human sensitivity to flicker Lighting Research and Technology 6 127-143 (1974)
10. Cavonius C R and Sternheim C E A comparison of electrophysiological and psychophysiologicaltemporal modulation transfer functions of human vision Advances in Experimental Medicine andBiology 24 223-236 (1972)
11. Sternheim C E and Cavonius C R Sensitivity of the human ERG and VECP to sinusoidally modulatedlight Vision Research 12 1685-1695 (1972)
12. Thiry S Contribution à l'étude de l'entrainement photique [Contribution to the study of photic driving]Archives Internationales de Physiologie 59 10-25 (1951)
Flicker rate and spectral effects 23
13. Van der Tweel L H and Verduyn Lunel H F E Human visual responses to sinusoidally modulated lightElectroencephalography and Clinical Neurophysiology 18 587-598 (1965)
14. Berman S M Greenhouse D S Bailey I L Clear R and Raasch T W Human electroretinogram responses tovideo displays fluorescent lighting and other high frequency sources Optometry and Vision Science 68645-662 (1991)
15. Rey P and Rey J-P Les effets comparés de deux éclairages fluorescents sur une täche visuelle et des testsde "fatigue" [Comparison of the effects of two fluorescent lights on a visual task and fatigue tests]Ergonomics 6 393-401 (1963)
16. Lindner H and Kropf S Asthenopic complaints associated with fluorescent lamp illumination (FLI): Therole of individual disposition Lighting Research and Technology 25 59-69 (1993)
17. Wilkins A J Nimmo-Smith I Slater A and Bedocs L Fluorescent lighting headaches and eye-strainLighting Research and Technology 21 11-18 (1989)
18. West D C and Boyce P R The effect of flicker on eye movements Vision Research 8 171-192 (1968)
19. Wilkins A J Intermittent illumination from visual display units and fluorescent lighting affectsmovements of the eyes across text Human Factors 28 75-81 (1986)
20. Wilkins A J and Wilkinson P A tint to reduce eye-strain from fluorescent lighting? Preliminaryobservations Ophthalmic and Physiological Optics 11 172-175 (1991)
21. Wilkins A J and Neary C Some visual optometric and perceptual effects of coloured glasses Ophthalmicand Physiological Optics 11 163-171 (1991)
22. Blumenthal R G New York schools consider installing full-spectrum lights to help students The WallStreet Journal p. B2 (1992 December 31)
23. Blackwell H R Effects of light source spectral distribution upon visual functions Annals of the NewYork Academy of Sciences 453 341-353 (1985)
24. Maas J B Jayson J K and Kleiber D A Effects of spectral differences in illumination on fatigue Journalof Applied Psychology 59 524-526 (1974)
25. Berry J L Work efficiency and mood states of electronic assembly workers exposed to full-spectrum andconventional fluorescent illumination Dissertation Abstracts International 44 635B (UniversityMicrofilms No DA8315116) (1983)
26. Berman S M Energy efficiency consequences of scotopic sensitivity Journal of the IlluminatingEngineering Society 21 3-14 (1992)
27. Berman S M Fein G Jewett D L and Ashford F Luminance-controlled pupil size affects Landolt C taskperformance Journal of the Illuminating Engineering Society 22 150-165 (1993)
28. Berman S M Fein G Jewett D L and Ashford F Landolt-C recognition in elderly subjects is affected byscotopic intensity of surround illuminants Journal of the Illuminating Engineering Society 23 123-130(1994)
29. Boyce P R and Rea M S A field evaluation of full-spectrum polarized lighting Journal of theIlluminating Engineering Society 23 86-107 (1994)

Flicker rate and spectral effects 24
30. Chance R E The effects of two ranges of fluorescent lighting spectra on human physical performanceDissertation Abstracts International 43 2862B (University Microfilms No DA8302215) (1983)
31. Halonen L Effects of lighting and task parameters on visual acuity and performance Espoo Finland:Helsinki University of Technology (NTIS No PB94-179231) (1993)
32. Kuller R and Wetterberg L Melatonin cortisol EEG ECG and subjective comfort in healthy humans:Impact of two fluorescent lamp types at two light intensities Lighting Research and Technology 25 71-81 (1993)
33. Rowlands E Loe D L Waters I M and Hopkinson R G Visual performance in illuminance of differentspectral quality Paper presented at the 17th session of the Commission Internationale de l'Éclairage,Barcelona, Spain (1971)
34. 34 O'Leary K D Rosenbaum A and Hughes P C Fluorescent lighting: a purported source ofhyperactive behavior Journal of Abnormal Child Psychology 6 285-289 (1978)
35. Gifford R Scientific evidence for claims about full-spectrum lamps: Past and future In J A Veitch (Ed)Full-spectrum lighting effects on performance mood and health (IRC Internal Report No 659 pp. 37-46)Ottawa ON: National Research Council of Canada Institute for Research in Construction (1994)
36. Veitch J A and McColl S L Full-spectrum fluorescent lighting effects on people: A critical review InJA Veitch (Ed) Full-spectrum lighting effects on performance mood and health (IRC Internal Report No659 pp. 53-111) Ottawa ON: National Research Council of Canada Institute for Research inConstruction (1994)
37. Rea M S (Ed) Lighting handbook: Reference and application (8th ed) New York: IlluminatingEngineering Society of North America (1993)
38. Rea M S Population data on near field visual acuity for use with the Vision and Lighting Diagnostic(VALiD) Kit (Report no CR5544.3) Ottawa ON: National Research Council of Canada (1988)
39. Debney L M Visual stimuli migraine trigger factors In FC Rose (Ed) Progress in migraine research (Vol2 pp. 30-54) London: Pitman-Medical (1984)
40. 40 Lovegrove W Martin F and Slaghuis W A theoretical and experimental case for a visual deficitin specific reading disability Cognitive Neuropsychology 3 225-267 (1986)
41. Hazell J and Wilkins A J A contribution of fluorescent lighting to agoraphobia Psychological Medicine20 591-596 (1990)
42. Wilkins A Nimmo-Smith I Tait A McManus C della Sala S Tilley A Arnold K Barrie M and Scott S Aneurological basis for visual discomfort Brain 107 989-1017 (1984)
43. Ouellette M J Measurement of light: Errors in broad band photometry. Building Research Journal 2 25-30 (1993)
44. Andersson N Sandström M Berglund A and Hansson K Amplitude modulation of light from varioussources Lighting Research and Technology 26 157-160 (1994)
45. Cohen J Statistical power analysis for the behavioral sciences (2nd ed) Hillsdale NJ: Erlbaum (1988)
Flicker rate and spectral effects 25
46. Singer W Synchronization of cortical activity and its putative role in information processing andlearning Annual Review of Physiology 55 349-374 (1993)
47. Bridgeman B Space constancy on video display terminals (Report AFOSR-90-0095-Final) Santa CruzCA: University of California (NTIS No AD-A280-015) (1994)
Discussion
Dr. A. Wilkins (UK Medical Research Council Applied Psychology Unit)
Did Schneider measure psychophysical thresholds in rabbits, using behavioural techniques inorder to know that the flicker could not be perceived? The study by West and Boyce and that byWilkins measured the effects of flicker over very different frequency ranges. It may be simplisticto refer to the conditions studies as low-frequency flicker and high-frequency flicker as it theranges were similar.
On page 245 [of the journal article] the luminance contrasts are quoted as 0.92, 0.84, and 0.86 forthe full-spectrum, cool-white and filtered cool-white conditions. I would appreciate someclarification as to why the differences should be so large given that the reflectance of the paperand the ink upon it is likely to be fairly flat over the range of visible wavelengths. What was theprecision of the measurements?
I presume that the apertures either side of the stimuli did not provide glare sources. Could this bemade clear? Given that the Pritchard photometer gives different results, it would be good toknow the temporal characteristics of the Hagner photometer.
Dr M S Rea (Lighting Research Center, Rensselaer Polytechnic Institute)
Although the authors have conducted and analysed their study of lamp spectrum, ballast type andtext contrast with professional proficiency, one would not have expected them to find anyimportant effects of lamp spectrum or ballast type from this particular experimental design. Onewould only expect to find an effect of contrast on visibility, which indeed they did.
This study shows, as many have shown before, that there is no impact of conventional lampsource spectrum on performance of a foveal task at photopic levels, once the luminous contrastof the task has been equated for lamp type. I continue to hope, but in vain, that the pages oflighting journals will no longer publish studies of lamp spectrum on the visibility of foveal tasks.As the literature has shown for at least 50 years, the mechanisms leading to the very small visualeffects due to lamp spectrum are well known (e.g., chromatic aberrations or pupil size) but are sosmall as to be safely ignore for the purposes of lighting applications.
The influence of temporal modulation on performance is perhaps less well known, or at leastmore confusing given the recent studies of Wilkins. Nevertheless, the present study adds nothingto our understanding of the effects that Wilkins proposes. The authors show that there is no
Flicker rate and spectral effects 26
relationship between flicker sensitivity and performance on an individual basis, so this studyadds nothing to the case Wilkins has put forward.
The authors are to be heartily and sincerely congratulated for their documentation ofmeasurements, procedures and results. Their documentation helps the reason to affirm his/her apriori expectations on the absence of an effect of ballast type on visual performance and to betterunderstand why the results presented by the authors on ballast type are unlikely to be replicated.First, there is no reason to expect temporal modulation to affect performance at a contrast of 0.21but not at lower contrasts. The authors argue that the reason they did not find effects at lowercontrast is because insufficient data were obtained at those contrasts. This is a weak andmisleading argument since nearly any effect can be shown to be statistically significant with thecollection of a large number of data. If the authors believed paucity of data was a limitation oftheir study then they should have extended their studies before trying to publish the results of asingle study whose results are unexpected. It is important to point out that the statisticallysignificant difference between the results from the 60 Hz and from the high-frequency ballast at acontrast of 0.21 was only 11.40 versus 11.96 letters read, an extremely small effect. A moreparsimonious and more likely explanation of this unexpected and curious finding is that, as inmany formal studies of human behaviour, this result is a chance event. Second, one lamp hastwice as great a peak-to-peak temporal modulation as the other two. Yet there is no interactionbetween lamp type and ballast type as would be expected if this were a real effect. Finally, andas already stated above, if their reported effect was real and the result of some higher-orderneurological effect like that proposed by Wilkins and tacitly supported by the authors, then theauthors should offer some evidence to support that hypothesis; they do not.
One of the tenets of scientific research is that one should accept the simpler explanation over themore complex. There is no reason to expect performance or comfort at this foveal task to bedifferentiated on the basis of 60 Hz versus high-frequency ballast type. Certainly, there is noevidence supplied by the authors in support of this expectation other than the single statisticallysignificant finding at a contrast of 0.21. Indeed, the data offered by the authors themselves arecontradictory to a logical argument supporting a difference in results according to ballast types.Consequently it is simpler to conclude that their statistically significant result occurred bychance.
As a teacher of statistics, I remind my students of a simple but fundamental premise ofexperimentation: That which is important is always statistically significant, but that which isstatistically significant is not always important.
Authors’ reply to discussion
To A. Wilkins:
Dr. Wilkins addresses several details that we are pleased to clarify.
Schneider(48) reported that the rabbits used in his study of electrophysiological response to flickerhad previously been used in a psychophysical study to determine the flicker rate at which critical

Flicker rate and spectral effects 27
flicker fusion was achieved. Unfortunately, there is insufficient information in the journal paperto retrieve the paper in which the psychophysiological data are said to be reported.
Dr. Wilkins is correct that the ranges studied by West and Boyce (1967)(49) and Wilkins(1986)(50) differed. The highest flicker rate in any of the eight experiments in the West andBoyce study was 46 Hz. Wilkins compared CRT screens with 50 Hz and 100 Hz rates, andfluorescent lamps with 100 Hz and 20 kHz rates. Although this is a generalisation, it isnonetheless true that the degree of disruption of saccades was greater for the lower flicker ratesrelative to the higher rates in each experiment.
The position of the viewport over the apparatus was fixed at 90 degrees to the visual task. Withthis geometry it was impossible for viewers to see the apertures; only the task surface wasvisible. The apertures did not provide glare sources. Furthermore, luminance was equal acrossthe visual task.
Dr. Wilkins’ questions concerning the luminance contrasts and the measurements from twodifferent photometers relate in part to the same phenomenon: the sources of inaccuracy in broadband photometry. Ouellette(51) has reported errors of 3% in measurements of one lamp withdifferent photometers of the same make and model, and up to 11% when different lamps arecompared. Differences between different photometer models and manufacturers would beexpected to be greater still. This explains the differences between readings taken with theHagner and Pritchard instruments (to answer Dr. Wilkin’s specific question, at the range used,the rise time for the Hagner instrument is 70 ms). For the contrast measurements, the accuracy ofmeasurement was 2 significant figures; in combination with the photometric errors, then, thesedifferences in luminance contrast are not surprising. Furthermore, the luminance of the blacktarget was probably below the photopic limit of the instrument. In any case, the contrast valuesare all very high and models of visual performance would not predict a measurable effect basedon these differences (cf. Ref 52).
To M. S. Rea:
Dr. Rea questions the logical foundations of our work and charges that the statistical testsproduced spurious outcomes that are trivial in size. He is best known for his work on visualperformance, particularly his Relative Visual Performance model(52) , which provides anunderstanding of some of the factors that can influence the visibility of objects. This researchhas established a mathematical relationship between the visibility of an object and fourcharacteristics: 1) the contrast of the object against its immediate background; 2) the size of theobject, measured from the observer's point of view; 3) the age of the observer, and 4) the state ofvisual adaptation. Dr. Rea’s comments here imply an a priori belief that the state of the art invisual performance research cannot be advanced further than his Relative Visual Performancemodel. Such a belief is premature at best; there are many variables identified in the scientific andapplied literature that also affect visibility, including task colour, motion, and exposure time.
Consequently, we are puzzled by Dr. Rea’s assertion that one would not expect to find an effectof flicker rate on visual performance using this experimental design. Not only was this effectpredictable based on the literature, but a power analysis using Cohen’s(53) guidelines for a large-

Flicker rate and spectral effects 28
sized effect (as we found for the univariate row G/H effect) gives a power value of .97. Thismeans that the experiment had a good probability of detecting a significant effect if one exists.We further protected against the possibility of spuriously detecting a statistically significanteffect because of multiple, nonindependent tests, by the use of multivariate analysis of variance.Space does not permit a full discussion here of this technique; interested readers are directed tothe standard texts, such as Kerlinger(54) or Tabachnick and Fidell(55). We are confident that theeffect of flicker rate is real and await an independent replication.
Dr. Rea is correct in stating that the effects of lamp source spectrum on visual performance arefew and not of practical importance. We reached the same conclusion elsewhere (Ref. 56),although some manufacturers do not concur. We included the light source manipulation in thisexperiment because the manufacturer of the filter has claimed that the product produces dramaticbenefits for those who use it. Although the between-groups comparison is not as powerful as thewithin-groups contrast for the flicker rate, we accepted this limitation. With only two parallelforms of the task, each participant could provide data for only two conditions without riskingpractice or learning effects. Therefore, a fully within-subjects design was not possible. If themanufacturer’s claim was correct, then we would have seen at least a trend favouring the filtercondition. No such trend or effect was observed; we agree with Dr. Rea that there are manyissues for lighting research that are both more interesting and more important than lamp spectralcontent.
Regarding the absence of an effect for the very-low-contrast targets, Dr. Rea is mistakenconcerning the explanation we offered. We did not suggest that an inadequate sample sizedecreased the power for that comparison. We stated that the problem lies in the increasedvariability of performance for these targets. Participants performed more consistently for thehigher-contrast rows, and more variably for the low-contrast rows. The experimenter reportedthat people had to be encouraged to make attempts to see the low-contrast rows, making it likelythat guessing outweighed vision in the performance data for those conditions. Flicker rate maynot be sufficient to overcome the inherent difficulty of the bottom two rows of the VALiD task.Increasing the sample size will not affect the outcome if the data reflect random effects such asguessing.
Dr. Rea also criticises this study for not having included direct measurements relating to theneurophysiological explanations for this phenomenon and more focused attention on the issue ofindividual differences in sensitivity. Such measurements, although desirable, were not feasible.Their absence does not imperil the experimental design, but leaves open questions for futureresearch to address.
Dr. Rea correctly points out that the absolute difference between the mean scores for rows G/Hfor the two ballast types is small. Expressed as a percentage of variance explained, however, theeffect is large. Small absolute effects can be important nonetheless, particularly whendemonstrated under a minimal manipulation of an independent variable.(57) In this case, theparticipants were young people with excellent vision who viewed the stimulus for a very brieftime - a few minutes at best. An effect, even a small one, that is detectable under thoseconditions is impressive indeed, particularly when it fits into other demonstrations of related

Flicker rate and spectral effects 29
effects (e.g., Ref. 58). We hope to address longer-term effects of flicker rate in future work, andwe hope that others will also pursue the questions raised by this pattern of research results.
References
48 Schneider C W Electrophysiological analysis of the mechanisms underlying critical flicker frequency VisionResearch 8 1235-1244 (1968)
49 West D C and Boyce P R The effect of flicker on eye movements Vision Research 8 171-192 (1968)
50 Wilkins A J Intermittent illumination from visual display units and fluorescent lighting affects movements of theeyes across text Human Factors 28 75-81 (1986)
51 Ouellette M J Measurement of light: Errors in broad band photometry. Building Research Journal 2 25-30 (1993)
52 Rea M S and Ouellette M J Relative visual performance: A basis for application. Lighting Research andTechnology 23 135-144 (1991)
53 Cohen J Statistical power analysis for the behavioral sciences (2nd ed) Hillsdale NJ: Erlbaum (1988)
54 Kerlinger F N Foundations of behavioral research (3rd ed) New York: Holt, Rinehart and Winston (1986)
55 Tabachnick B G and Fidell L S Using multivariate statistics. New York: Harper and Row (1983)
56 Veitch J A and McColl S L Full-spectrum fluorescent lighting effects on people: A critical review In JA Veitch(Ed) Full-spectrum lighting effects on performance mood and health (IRC Internal Report No 659 pp. 53-111)Ottawa ON: National Research Council of Canada Institute for Research in Construction (1994)
57 Prentice D A and Miller D T When small effects are impressive. Psychological Bulletin 112 160-164 (1992)
58 Wilkins A J Nimmo-Smith I Slater A and Bedocs L Fluorescent lighting headaches and eye-strain LightingResearch and Technology 21 11-18 (1989)

Flicker rate and spectral effects 30
Correspondence from Lighting Research and Technology, vol. 29, pp. 55-56 (1997)
Modulation of fluorescent light: Flicker rate and light source effects on visual performanceand visual comfort
The study by Veitch and McColl(6) (’the authors’) primarily investigated the conseuqnces offlicker in fluorescent lamps on a visual task, with a secondary evaluation of the effects of lightspectrum. Examination of the protocols and data reveals that the promary study shows an effectthat is probably greater than than reported in the paper, while the secondary study is weaker thandescribed.
In this work both the horizontal illuminance at the task and the task luminance were measured.The luminances indicated in Table 1(6) are generally about 15% higher for the low-frequency (LF)operation than for the high-frequency (HF) operation, even though the task horizontalilluminance is set to the same value for both LF and HF consitions. The authors note thisdiscrepancy and state that it might be due to ’artefacts of the speed of the detector arra’ of theluminance instrument (Photo Research, Pritchard model 703A, Northridge, CA). However, theinstrument maker, in telephone conversations, claims that this model records accurately in bothLF and HF conditions. Likewise, the United States representative for the Hagner Illuminancemeter (Cooke Corp., Hagner model S2, Buffalo, NY) claims their meter is accurate whenmeasuring both LF and HF sources. A possible explanation for the discrepancy between resultsfrom the meter could be electro-magnetic interference (EMI) from the HF ballasts. In Figure 2(6)
the illuminance probe is shown resting just above the lamp housing, and might be quite near theballast. Various degrees of EMI can occur, depending onthe quality of grounding and the amountof shielding of the fixture, as well as the integrity of the shielding of the probe-to-meter cable(since the electrical current carried by the probe cable is very small). Cooke Corp. also indicatedto us that meters have malfunctioned under high-EMI conditions associated with high-voltageswitching. Since the task luminance is the psychophysically appropriate measure of stimulus,and the luminance meter was placed much further awar from the ballasts with less opportunityfor an EMI problem, we consider its values to be the more representative of the test lightingconditions. In which case, according to Table 1(6), the subjects are provided with 13% to 22%less luminance under the HF conditions, and yet they perform better on the visual task.Furthermore, the data in Table 2(6) show that the effect is present for each lamp, despite the factthat each lamp’s effects were studied with a separate set of 16 subjects. This result, which mightbe an unexpected benefit of the HF operation, deserves further careful study.
The primary purpose of the study (to determine the effects of ballast operation frequency onthreshold size and contrast) can be inferred because it is the LF/HF comparison that is studiedwith the statistically strong within-subjects design. Secondarily, the authors have made somestatistically weaker between-group comparisons which they interpret asa test of the ’Bermanhypothesis’ regarding the effecs of the scotopic spectrum on visual performance. The secondaryexperiment provides no such test, for several reasons.
Firstly, in all ourpapers(7-10) on the benfits of scotopic sensitivity, the experiments wereconducted under full-field viewing conditions with uniform illumination. However, the testingapparatus in the authors’ experiment restricted the primary visual field of view (due to the

Flicker rate and spectral effects 31
viewport dimensions) to 0.28 sr (about 5% of the solid angle covered in full field of view). Thevisual field at larger angles receives much less illumination due to the inter-reflected light fromthe sides of the viewport.
Secondly, lamps that do not differ much in S/P ratios do not differ much with respect to scotopicoutput (assuming equal photopic levels). Given the S/P ratios used in this experiment and ourdata for the spectral response of pupil size (11), we would predict only about a 7% change inpubject pupil area when comparing results fro the full-spectrum lamps with those from the CWlamp. This assumes a near full field of view, not the restricted field use in the authors’ study.Thus, there may not have been significant pupil size differences in the authors’ experiment.Without a pupil size difference, we would not predict a spectral effect on performance.
Thirdly, there is a probability that the contrast for the visual performance task were not eual forthe three spectrally-different lamps. The authors found difference in contrast for the visualcomfort reading material under the three test lamps, but did not state whther the contrast of thevisual performance task had been measured. Any differences in task contrast due to lampspectrum would introduce a bias of unknown magnitude and direction with respect to between-lamp comparisons.
Fourthly, the statistics used require that each of the three different groups studied berepresentative of the general population, i.e., have the same mean acuity. Since the smallest ringgap size was 0.66 minutes of arc, subjects who identified all rings correctly at the high contrastlevel had at least 6/4 (20/13) vision, which is considerably better than normal. For the CW lamp,15 of the 16 subjecst had at least better than 20/13 vision, suggesting that this groups had better-than-average vision. In contrast, for the full-spectrum lamp, only 6 opf the 16 subjects had atleast 20/13 vision. Thus the difference in mean scores can just as well be atributed to a chancedifference in the mean group acuities, rather than to lamp spectrum. However, because of theexperimental design, in which both lamp type and group vary together, it is not possible todisentangle these variables.
Fifth and last, even though the authors state that they have not found any statistically significantevidence of a spectral effect on visual performance, they claim that the data shows ’trendscontrary to Berman’s hypothesis’. There are several errors here. A trend should not be takenseriously unless the statistical probability approaches, but does not reach, significance (forexample, P<0.10). This is not the case here. In addition, the authors have chosen to highlightonly one ’trend’ in their data. Examination of their data will show both the full spectrum (FS) andfiltered CW (FCW) lamps to have poorer performance than the CW alone. Since the FS lamphas more scotopic content, which the FCW has less scotopic content, theese trends are inopposite directions, as might be the case for chance occurrences. Why have the authors choisento mention only one of the two ’trends’?
The secondary study is too weak (due, at least, to between-group comparisons, small S/Pchanges, and a narrow field of view) to argue against the hypothesis that spectrally modulatedchanges in pupil size can affect visual acuity.

Flicker rate and spectral effects 32
References
6 Veitch J A and McColl S L On the modulation of fluorescent light: Flicker rate and spectral distributioneffects on visual performance and visual comfort Lighting Research and Technology 27 243-256 (1995)
7 Berman S M Fein G Jewett D L and Ashford F Luminance-controlled pupil size affects Landolt-C taskperformance Journal of the Illuminating Engineering Society 22(2) 150-165 (1993)
8 Berman S M Fein, G Jewett D L and Ashford F Landolt-C recognition in elderly subjects is affected byscotopic intensity of surround illuminants Journal of the Illuminating Engineering Society 23(2) 123-130(1994)
9 Berman S M Jewett D L Fein G Benson B Law T Myers A and Bullimore M A Lighting spectral effecton Landolt C performance is enhanced by blur and abolished by mydriasis Journal of the IlluminatingEngineering Society 25(1) 42-50 (1996).
10 Berman S M Fein G Jewett D Benson B and Myers A Luminance-controlled pupil size affects word-reading accuracy Journal of the Illuminating Engineering Society 25(1) 51-59 (1996)
11 Berman S M Fein G Jewett D L Saika G and Ashford F Spectral determinants of steady-state pupil sizewith full field of view Journal of the Illuminating Engineering Society, 21(2) 3-13 (1992)
S M Berman† and Blaine R Benson‡
†Energy and Environment DivisionE O Lawrence Berkeley National Laboratory
Berkeley, CA 94720USA
‡Abratech Corporation475 Gate 5 Road, Suite 255
Sausalito, CAn 94965USA
Authors’ reply
We are pleased that our paper(6) provoked the interest of Dr. Berman and Mr. Benson.Understandably, we disagree with certain of their remarks.
At the time of the experiment, we were unaware of the potential effect of electromagneticinterference from the electronic ballasts on our illuminance meter. We concur with theconclusion that it is possible that the net effect of this discrepancy may be to underestimate thesize of the flicker effect on visual performance. Therefore, we can only agree with Dr. Bermanand Mr. Benson that further careful study of flicker rates on visual processing is warranted.
We disagree with their conclusions regarding the lamp type comparison, which are based oncriticisms of both the methods and the results. First, we point out that the lamp type comparisonwas not selected solely as a test of Dr. Berman’s scotopic sensitivity hypothesis, but as a means toinduce chromatic as well as luminous flicker (Ref. 6, p. 244).

Flicker rate and spectral effects 33
We are unconvinced that the differences in the field of view between our experiment and Dr.Berman’s work have any implications for the outcome. In any case, we believe that thediscussion of differences in methodology begs the question. If the effect of a scotopicallyenriched lamp on vision is robust, and if it is substantial enough to warrant changes in lightingpractice, as Dr. Berman has argued(12), then it should occur reliably, across varyingmethodologies, and with lamps that are typical of current practice. To date, Dr. Berman’s workhas found the effect consistently, but using an unusual arrangement that separates task andsurround lighting, and using lamps that are extreme in their S/P ratio (0.24 and 4.31(10)). Theratios of the sources employed in our study, which were typical of current practice, ranged from1.04 to 1.68(6).
It is true that the statistical power of a between-groups comparison with 16 participants per group(total sample size of 48 in three groups) is lower than that of a within-groups comparison, and itis possible that with either a larger sample size (as we noted, Ref. 6, p 252) or a within-subjectsdesign, a lamp type effect on visual performance might have been observed. However, as wenoted in our earlier reply to Dr. M. S. Rea, (Ref 6, p. 255), the VALiD task provided only twoparallel forms of the test. To have used the same task for more than one experimental condition,as a within-subjects design with six combinations of lamp and ballast type would have required,would have risked a confounding practice effect. We judged this to be more serious than thealternative, which was a less-than-optimal level of statistical power.
Differences in task contrast between the lamps were small enough that they were unlikely to haveaffected between-groups visual performance (cf. Ref 13). In any case, if lamp spectral qualitieshave this differential effect on contrast of commonly-read materials (such as the laser printercopy used for the contrast measurements), then any associated differences in visual performancewould apply to real-world conditions. We note, moreover, that the order of task contrast, fromhighest to lowest (FS, FCW, CW), is opposite to the order of visual performance scores (CW,FCW, FS).
Dr. Berman and Mr. Benson make a logical error when they state that a priori differences inacuity between the lamp type groups confound the contrast, in that they base their statementabout acuity on the dependent measure of visual performance, which could have been influencedby the lamp type. To compare the baseline acuities of participants would require a pretest(initial) measure of acuity based on identical test conditions. We are confident that the groupswere comparable in this sense because all participants passed the Titmus vision test with at least20/20 vision and were subsequently assigned randomly to one of the three groups. This is thestandard procedure for a true between-groups experimental design(14,15). We quote Cook andCampbell, authors of one of the most widely-cited books on research design in the behaviouralsciences: "...a properly implemented random assignment procedure will usually result in initiallycomparable experimental groups..." (Ref. 14, p. 342). It allows us to infer that differences in theoutcome measures between the groups were caused by the treatment (lamp type) rather than bypre-existing differences between the groups.
In their fifth point, Dr. Berman and Mr. Benson ask why we highlighted only one trend. Wetested two specific hypotheses using planned comparisons. Neither was statistically significant,but we highlighted the contrast between the FS group and the combined FCW/CW group because

Flicker rate and spectral effects 34
its multivariate F(6,40)=1.92 had p=.10, leading us to suggest that the trend might have beenstatistically significant with a larger sample size. Our interest in that contrast was related in partto the fact that the percentage of variance associate with it (7%) was as large as that explained bythe statistically significant ballast effect (6%). We did not discuss the mean difference betweenthe FCW and CW groups, which we also tested, because its F(6,40)=1.20 had p=.32. Werejected the hypothesis that these means differed.
In conclusion, we thank these researchers for their comments and we hope that their interest isreflected in independent replications of this work.
References
12 Berman S M Energy efficiency consequences of scotopic sensitivity Journal of the IlluminatingEngineering Society 21(1) 3-14 (1992)
13 Rea M S and Ouellette M J Relative visual performance: A basis for application Lighting Research andTechnology 23 135-144 (1991)
14 Cook T D and Campbell D T Quasi-experimentation: Design and analysis for field settings (Boston:Houghton Mifflin) (1979)
15 Kerlinger F N Foundations of behavioral research (3rd ed.) (New York: Holt, Rinehart, & Winston)(1986)
Jennifer A. Veitch† and Shelley L. McColl‡
† National Research Council of CanadaInstitute for Research in Construction
Ottawa, ON K1A 0R6 CanadaE-mail: [email protected]
‡ Dept. of Psychology, McGill University1205 Dr. Penfield Ave
Montreal, QC H3A 1B1 CanadaE-mail: [email protected]