modulation of pulmonary defense mechanisms …...modulation of pulmonary defense mechanisms against...
TRANSCRIPT

Modulation of Pulmonary Defense Mechanisms Against Viral and Bacterial Infections by Acute Exposures to Nitrogen Dioxide
George J. Jakab The Johns Hopkins School of Hygiene and Public Health, Baltimore, Maryland
Includes the Report of the Institute's Health Review Committee
Research Report Number 20

HEALTH EFFECTS INSTITUTE 1-£[ ----------4
The Health Effects Institute (HEI) is a nonprofit corporation founded in 1980 to assure that objective, credible, high-quality scientific studies are conducted on the potential human health effects of motor vehicle emissions. Funded equally by the U.S. Environmental Protection Agency (EPA) and 27 automotive manufacturers or marketers in the United States, HEI is independently governed. Its research projects are selected, conducted, and evaluated according to a careful public process, including a rigorous peer review process, to assure both credibility and high scientific standards. HEI makes no recommendations on regulatory and social policy. Its goal, as stated by former EPA Administrator William D. Ruckelshaus, is "simply to gain acceptance by all parties of the data that may be necessary for future regulations."
The Board of Directors Archibald Cox Chairman Carl M. Loeb University Professor (Emeritus). Harvard Law School
William 0. Baker Chairman (Emeritus). Bell Laboratories
Health Research Committee Walter A. Rosenblith Chairman Institute Professor (Emeritus). Massachusetts Institute of Technology
Joseph D. Brain Cecil K. and Philip Drinker Professor of Environmental Physiology, Harvard University School of Public Health
Curtis C. Harris Chief, Laboratory of Human Carcinogenesis, National Cancer Institute
Barbara Hulka Chairperson, Department of Epidemiology. University of North Carolina
Roger 0. McClellan President, Chemical Industry Institute of Toxicology
Health Review Committee Robert I. Levy Chairman President, Sandoz Research Institute; Former Director, National Heart, Lung and Blood Institute
Bernard Goldstein Professor and Chairman, Department of Environmental and Community Medicine, University of Medicine and Dentistry of New Jersey, Robert Wood Johnson Medical Center
Gareth M. Green Professor and Chairman, Department of Environmental Science, johns Hopkins University
Millicent W. P. Higgins Associate Director for Epidemiology and Biometry, National Heart. Lung and Blood Institute
Paul Meier Professor of Statistics, University of Chicago
Officers and Staff Rashid Shaikh Acting Coexecutive Director and Director for Scientific Review and Evaluation Jane Warren Acting Coexecutive Director and Dimctor of Research Richard M. Cooper Corporate Secretary Judith Zalon Director of Administration and Finance Debra N. Johnson Controller Kathleen Nauss Senior Staff Scientist Patrick Kinney Staff Scientist Maria Costantini Staff Scientist
Donald Kennedy President, Stanford University
Charles W. Powers Partner, Resources for Responsible Management; Founding Executive Director, HE!
Robert F. Sawyer Professor of Mechanical Engineering, University of California, Berkeley
John W. Tukey Senior Research Statistician; and Donner Professor of Science Emeritus. Princeton University
Mark J. Utell Professor of Medicine and Toxicology, University of Rochester School of Medicine
Gerald N. Wogan Professor of Toxicology, Massachusetts Institute of Technology
Werner Stoeber Special Consultant to the Committee Director, Fraunhofer Institute of Toxicology and Aerosol Research
Sheldon D. Murphy Chairman, Department of Environmental Health, University of Washington
Herbert Rosenkranz Professor and Chairman, Department of Environmental Health Sciences and Professor of Biochemistry. Pediatrics and Radiology, Case Western Reserve University
Arthur Upton Professor and Chairman, Institute of Environmental Medicine, New York University
James Grizzle Special Consultant to the Committee Professor of Biostatistics, University of North Carolina
Alison M. Dorries Staff Scientist Ann Y. Watson Consulting Staff Scientist L. Virgi Hepner Publications Manager Mary-Ellen Patten Administrative Assistant Gail Allosso Assistant to the Director of Administration and Finance Hannah Protzman Secretary Janet Fader Secretary Wendy Charest Secretary Patricia White Receptionist Robin M. Cuozzo Accounting Assistant
-----------~--~--------
Research Agreement No. 84-2 Copyright (ci 1988 hy Health Effects Institute Designed and printed hy Prime Communications, Inc.

TABLE OF CONTENTS
Research Report No. 20
Modulation of Pulmonary Defense Mechanisms Against Viral and Bacterial Infections by Acute Exposures to Nitrogen Dioxide
INVESTIGATORS' REPORT George J. Jakab
Abstract.
Introduction.
Nitrogen Dioxide and Resistance to Respiratory Infections .....
Respiratory Defense Mechanisms Against
1
1
2
Bacterial Infections . . . . . . . . . . . . . . . . . . . . . . . . . 3
Respiratory Defense Mechanisms Against
Viral Infections
Summary ................ .
... 4
5
Aims .................. . ························· 5
Methods
Animals
Bacterial Agents .
Viral Agents
Preparation of Bacteria for Inhalation Challenge ..
Bacterial Challenge ..
Viral Infection
Bactericidal Assay .
Radioassay Procedure
Virus Titration ..
Collection of Pulmonary Cells.
Albumin Determinations in Pulmonary Lavage Fluid... . ......... .
Lung Wet: Dry Weight Ratios.
Nitrogen Dioxide Inhalation Exposure Chambers
Nitrogen Dioxide Exposure.
Experimental Design ............ .
5
5
5
5
6
6
6
6
7
7
7
7
7
8
8
8
Statistical Analysis ........... 9
Results .10
Nitrogen Dioxide Generation and Quantification .. 10
Pulmonary Antibacterial Defenses (Nitrogen Dioxide Exposure After Bacterial Challenge) .................... 10
Pulmonary Antibacterial Defenses (Nitrogen Dioxide Exposure Before Bacterial Challenge) ............ .
Pulmonary Antibacterial Defenses (Nitrogen Dioxide Exposure Before and After Bacterial Challenge) .
Pulmonary Antibacterial Defenses in the
. ...... 13
13
Predisposed Host . . ..................... 13
Particle Clearance .......................... . . ... 15
Bacterial Infection .......... 15
Viral Infection ........ . . ............ 16
Discussion .. 18
Pulmonary Antibacterial Defenses ............ 18
Pulmonary Particle Clearance ...................... 21
Pulmonary Antibacterial Defenses in the
Predisposed Host. . ............... 21
Bacterial Infection ........................ . . ... 22
Viral Infection .
Implications of Findings .
Acknowledgments .
References
. ............. 22
............................ 23
. .. 24
.............. 24
Appendices . . . . . . . . . . . . . . . . . . . . . ............... 31
About the Author ..................................... 38
Publications Resulting from This Research ........... 38
HEALTH REVIEW COMMITTEE'S REPORT Health Effects Institute
Introduction .. 39 Technical Evaluation. . .................................. 41
The Clean Air Act ........................................ 39 Assessment of Methods and Study Design . . . . ....... 41
Background . ........................... 39 Interpretation of Results . ......................... 42
Goals and Objectives .. .41 Remaining Uncertainties and Implications for
Summary of Investigator's Conclusions .................. 41 Future Research . . . . . . . . . . . . . . . . . . ........... 43
References ........................... 44

ABBREVIATIONS
ii
AN OVA
BHI
CP-HBSS
EDTA
EIDso
HBSS
HEPA filter
HE PES
Nz
N02
32p
PBS
PMNs
ppm
TSA
TSB
analysis of variance
brain-heart-infusion broth
citrate-phosphate-buffered Hank's balanced salt solution
ethy lenediaminetetraacetic acid
50 percent median egg infectious dose
Hank's balanced salt solution
high-efficiency particulate air filter
N-2-hydroxyethyl-piperazine-N-ethane sulfonic acid
nitrogen
nitrogen dioxide
radiolabeled phosphorus
phosphate-buffered saline
polymorphonuclear leukocytes
parts per million
trypticase soy agar
trypticase soy broth

INVESTIGATORS' REPORT
Modulation of Pulmonary Defense Mechanisms Against Viral and Bacterial Infections by Acute Exposures to Nitrogen Dioxide
George J. Jakab
ABSTRACT
The scientific literature suggests that ambient levels of nitrogen dioxide increase susceptibility to respiratory infec
tions. However, this association has not been conclusively demonstrated. The epidemiologic data regarding this relationship are inconclusive because these studies have used parameters of "acute respiratory illness" that are not necessarily related to infectious episodes. Previous animal studies have used either mortality after bacterial infection with virulent bacteria or decreased rate of intrapulmonary killing
of bacteria with low virulence. Studies using appropriate bacterial and viral challenge organisms, with morbidity as an endpoint, provide a better basis for extrapolation to humans. The investigations in animals suggest a relationship between nitrogen dioxide and increased susceptibility to respiratory infection, but studies in which functional parameters of host resistance to such infections have been used are few.
The aim of this work was to determine the threshold level of acute nitrogen dioxide exposure that would induce increased susceptibility to, and increased severity of, viral and bacterial infections. Physiologic parameters of host resistance to respiratory infections were used as endpoints. A composite picture was developed of dose-response relationships between
nitrogen dioxide and the impairment of a spectrum of defense parameters in the murine respiratory tract against viral and bacterial challenges.
The salient findings of this study are as follows: (1) the intrapulmonary killing of Staphylococcus aureus was impaired at 5 ppm of nitrogen dioxide; (2) this effect was found at 2.5 ppm or less when nitrogen dioxide exposure was superimposed on lungs predisposed to lowered resistance through immunosuppression with corticosteroids; (3) the adverse effect of nitrogen dioxide occurred at lower concentrations when exposure followed bacterial challenge; and (4) during the course of murine Sendai virus infection, exposure to nitrogen dioxide for four hours per day did not alter the infection in the lungs, but rather it enhanced lung pathology.
Aerobiology Laboratories, Department of Environmental Health Sciences, The Johns Hopkins School of Hygiene and Public Health, Baltimore, MD.
The implications of these findings are that the antibacterial defenses of the lungs are susceptible to the inhibiting effects of short acute exposures of lower concentrations of nitrogen dioxide when the lungs are predisposed by bacteria present or, even more so, by immunosuppression. The alveolar macrophage phagocytic system is the defense component of the lungs that is most susceptible to the adverse effects of
nitrogen dioxide. The finding that nitrogen dioxide increases virus-associated lung damage suggests that the increased severity ofthe disease process results from the proliferation of the virus to high titers, rather than from alterations of the infective process.
INTRODUCTION
Nitrogen dioxide (N02 ) causes lung injury at high concentrations (Lowry and Schuman 1956; National Research Council 1977), but its effects at levels encountered in outdoor and indoor air have been difficult to characterize. Most studies of the relationship between exposure to N02 and health have focused on respiratory symptoms and illnesses and on changes in pulmonary function. Experimental investigations support the choice of these outcome measures because N02 may damage the I ung direct! y, through its oxidant properties, or indirectly, by altering the defense mechanisms of the lung, and thereby increasing its susceptibility to respiratory infections.
The current U.S. National Ambient Air Quality Standard for N02 is 0.05 parts per million (ppm) for the annual arithmetic mean of 24-hour values (U.S. Environmental Protection Agency 1981). Average 24-hour N02 concentrations in urban atmospheres vary widely, but in some cities they commonly reach the range of 0.05 to 0.2 ppm. Some urban communities report short-term (spike) elevated N02 concentrations as high as 0.5 ppm (California Air Resources Board 1983). Recognition, in the late 1970s, that indoor N02 sources also contribute to personal exposure, and that indoor concentrations often exceed outdoor concentrations in many homes (Shy eta!. 1978), gave impetus to the study of the sources and effects of indoor N02 . Combustion of gas during cooking releases N02 • On the average, normal use of an unvented gas cooking range adds 0.025 ppm of N02 to the background concentration in the home (Spengler eta!. 1983). The increase is greater during cold weather when the air exchange is usually
1

reduced. Peak levels in the kitchen may reach 0.2 to 0.4 ppm during cooking with a gas range (Spengler and Sexton 1983). Therefore, personal exposures to N02 are higher for people living in homes with gas stoves and ovens than for people living in homes with electric stoves. In addition, exposure from gas cooking stoves is widespread; 50 percent of homes in the United States have gas cooking appliances (U.S. Department of Commerce 1983).
Data on the health effects of N02 concentrations likely to be encountered by the general population are derived from experimental and epidemiologic studies. Some controlled human exposure studies suggest that levels comparable to those measured in homes may increase airway reactivity in some persons with asthma, but the results of other studies are inconclusive (Orehek eta!. 1976; Hazucha eta!. 1983; Kleinman et a!. 1983; Morrow 1984; Bauer et a!. 1986).
The majority of epidemiologic studies have been crosssectional surveys of school children. The investigators generally assessed symptom status, pulmonary function, and retrospective illness histories obtained by parentcompleted questionnaires. However, consistent evidence of excess respiratory symptoms in children exposed to gas stoves has not been demonstrated.
NITROGEN DIOXIDE AND RESISTANCE TO RESPIRATORY INFECTIONS
Epidemiology
Studies designed specifically to detect an association between N02 exposure and increased susceptibility to respiratory infections are few. The many epidemiologic studies that have been reported (Shy et a!. 1970a,b; Pearlman et a!. 1971a,b; Cohen et a!. 1972; Speizer and Ferris 1973a,b; Melia eta!. 1977, 1978, 1979; Ferris 1978; Florey eta!. 1979, 1982; Goldstein eta!. 1979, 1981; Keller eta!. 1979a,b; Speizer eta!. 1980a,b; Love eta!. 1982a,b; Schenker et a!. 1983; Hoek eta!. 1984a, b; Ware eta!. 1984; Fischer et a!. 1985; Remijin et a!. 1985) focused on the association between exposure to N02 and a group of symptoms generally termed "acute respiratory illness." The respiratory parameters examined (for example, runny nose, sore throat, cough, phlegm, wheezing, nasal congestion, colds going into the chest) are not necessarily related to infectious episodes, but rather may be due to such other factors as the irritant effect of N02 or increased bronchial hyperreactivity.
It is unclear how these symptoms of acute respiratory illness became equated with acute respiratory infections; there is no direct epidemiologic evidence of the relationship between exposure to N02 and increased acute
2
N02 Exposure and Modulation of Pulmonary Defense Mechanisms
respiratory infection. There have been no epidemiologic studies in which infectious parameters were rigorously examined (for example, isolation of the infectious agent during symptomatic episodes and seroconversion). The Health Effects Institute is currently attempting to remedy this by supporting a feasibility study by Dr. Jonathan M. Samet of the University of New Mexico, Albuquerque, NM.
Experimental Studies
Recognition of the association between exposure to N02 and the development of acute respiratory illness has led to the use of animal models that have used microbiologic parameters to evaluate toxicity. Specifically, the effect of exposure to N02 on the outcome of host-parasite interactions in the lung has been explored (Goldstein eta!. 1976; Ehrlich 1980; Gardner 1984; Goldstein 1984; Green 1984). The aerosol model of rodent infections provides an excellent means of measuring pollutant-induced physiologic abnormalities of antibacterial activity, because sufficient similarity exists between the defense mechanisms of rodents and humans to permit the use ofthe rodent as a surrogate (Goldstein 1984; Green 1984). Detection of N0 2-induced abnormalities in individual components of the pulmonary antibacterial system is a sensitive means of assessing potential toxicity and of providing evidence to test the hypothesis that N02 may increase susceptibility to respiratory infections in humans.
The bulk of the studies have been performed with a rodent model that is often referred to as the "infectivity model," developed by Ehrlich (1963, 1966, 1980), Coffin and Bloomer (1967), Coffin and Gardner (1972), Gardner and Graham (1972), and coworkers (Purvis and Ehrlich 1963; Ehrlich and Henry 1968; Henry eta!. 1969, 1970; Ehrlich eta!. 1979; Illing eta!. 1980; McGrath and Oyervides 1982, 1985; Gardner 1984). This model links interference with pulmonary antibacterial activity to disease and mortality. Rather than infecting rodents with minimally virulent organisms (such as staphylococci) that do not provoke injurious responses in the rodent lung (Goldstein eta!. 1974; Pierce et a!. 1977), in the infectivity model rodents are challenged by aerosol inhalation with highly virulent Streptococcus pyogenes (group C) or Klebsiella pneumoniae before or after N02 exposure. When these pathogens are used the physiologic alterations in lung antibacterial defenses induced by N02 exposure result in bacterial proliferation and excessive mortality (base-line mortality in the infectivity model is approximately 40 percent with the Klebsiella species and 20 percent with S. pyogenes). Studies with this model have shown that when a species of Klebsiella is used as the infecting organism, a two-hour exposure to 3. 5 ppm of N02 results in increased mortality

G.J. Jakab
(Ehrlich 1966). When S. pyogenes was used, increased mortality was observed after a single three-hour exposure to 2 ppm of N02 (Ehrlich et al. 1977).
An important conclusion that can be supported from the use of the infectivity model is that N02 exposure has reduced the host defenses. Furthermore, these studies point to the importance of the infecting organism in the assessment of the health effects ofN02 exposure, because the toxic effect occurred at a lower concentration when S. pyogenes was used as the infecting organism.
Considerable caution must be used in applying the conclusion from the infectivity model to humans (Weil1972; Colucci et al. 1973; Krasovskii 1976; Bouhuys et al. 1978; Jakab 1980; Book 1982; Gardner 1984; Goldstein 1984; Green 1984; Garattini 1986). As Green (1984) states:
In man, the association is with increased symptoms of cough, phlegm, and colds going into the chest. These are nonspecific symptomatic changes that could be attributable to irritant as well as infectious etiologies. If infective episodes were involved in humans, as could be the case in chronic bronchitis, they would have the character of exacerbating purulent bronchitis instead of pneumonias and would be related to endogenous flora rather than to newly acquired pathogens. Such infections are nonlethal by replication of bacteria and invasion of tissues and bloodstream. The underlying health effect, except where severe chronic disease is present, is characterized as a minor morbidity rather than a mortality incident.
The aerosol model for rodent infections that (1) measures minor changes in symptomatology and physiology rather than major lethal events, (2) does not depend on the virulence of pathogenic microbial species, (3) involves infection as an outcome and not a cause of the physiologic derangement, and (4) concentrates on physiologic rather than pathologic measures of host defense (Colucci et al. 1973) was developed by Laurenzi and coworkers (1964), Green and Goldstein (1966), and their colleagues. This system of analysis utilizes quantitative bacteriologic monitoring of lung tissues in animals exposed to N02 . This methodology provides an in vivo evaluation of microbicidal function of the lung; thus, the model uses physiologic parameters of host resistance against bacterial challenge as an endpoint (Green and Goldstein 1966). In one of the few studies in which this model was applied to evaluate the toxicity of N02 , mice were challenged with aerosolized S. aureus and then exposed to various concentrations of N02
(0 to 14.8 ppm) for four hours (Goldstein et al. 1973). The lungs were then removed and the quantities of viable bacteria that remained in the lungs were determined. Animals exposed to N0 2 levels of 1.9 ppm cleared bacteria
as well as animals in the control groups did. However, pulmonary bactericidal capacity was progressively impaired with increasing concentr!J.tions in groups exposed to 3.8 ppm N02 or greater.
The above finding points to the lack of a clear association between exposure to N02 and increased susceptibility to respiratory infections. The epidemiologic data are ambiguous: Infection cannot be affirmed as causative, whereas the experimental model used most often at ambient levels of N02 exposure measures death as an endpoint, rather than minor changes in morbidity that are applicable to the human situation.
The remainder of this introduction deals with respiratory defense mechanisms against viral and bacterial infections as a basis for understanding the experimental results and the possible interaction between N02 and respiratory infections in human populations.
RESPIRATORY DEFENSE MECHANISMS AGAINST BACTERIAL INFECTIONS
Although bacteria enter the lungs daily by inhalation of small droplets or by aspiration from the upper respiratory tract, the distal airways and the alveoli are normally sterile. This is because the normal lung has the inordinate capacity to inactivate bacteria (Green et al. 1977). Bronchopulmonary defense mechanisms against bacterial infections depend primarily on the integrated activity of the phagocytic and immune systems (Green et al. 1977). In the normal lung, the alveolar macrophage serves as the surveillance phagocyte (Goldstein et al. 1977a). This resident phagocytic system can be augmented by the intraalveolar influx of polymorphonuclear leukocytes (PMNs) to provide the lungs with additional defense capabilities (Rehm et al. 1979, 1980). Specific immune mechanisms augment the biocidal defenses of the lung by enhancing phagocytic activity (Jakab 1976).
Experimental studies have shown that exposure to N02
impairs pulmonary antibacterial defenses (Ehrlich 1966; Ehrlich and Henry 1968; Buckley and Loosli 1969; Goldstein et al. 1973; Ehrlich et al. 1977), and studies have examined the effects of N02 on various lung-defense and cell-function parameters (Sherwin et al. 1968; Gardner et al. 1969; Valand et al. 1970; Acton and Myrvik 1972; Giordano and Morrow 1972; Freeman et al. 1974; Hattori and Takemura 1974; Aranyi et al. 1975; Hadley et al. 1977; Schiff 1977; Amoruso et al. 1981), but the effect of N02 on the integrated defenses has not been systematically approached. It is possible to study the individual components of the coordinated biocidal mechanisms of the lungs by using different challenge organisms to probe specific defense parameters. In this research, S. aureus was used
3

as a probe to study the functional integrity of the alveolar macrophage phagocytic system, and the gram-negative bacteria Proteus mirabiJis and K. pneumoniae were used to examine the dual phagocytic systems of the lungs consisting of both the resident alveolar macrophages and newly recruited inflammatory PMNs into the alveolar spaces (Pierce et al. 1977; Rehm et al. 1979, 1980). Finally, Pasteurella pneumotropica, a gram-negative rodent respiratory bacterium (Brennan et al. 1965, 1969), was used to examine the effect of N02 on pulmonary antibacterial defenses against an organism endogenous to the host.
The rationale for the selection of gram-positive and gramnegative organisms to probe the individual defense mechanisms of the lungs is as follows. Inhalation challenges with the number of S. aureus used in these studies do not result in an inflammatory response of the lungs (Pierce et al. 1977; Lipscomb et al. 1983); therefore, intrapulmonary killing of this organism is dependent on the alveolar macrophage phagocytic system (Goldstein et al. 1977a; Lipscomb et a!. 1983; Onofrio et a!. 1983). On the other hand, inhalation challenges with gram-negative organisms result in a brisk inflammatory response of the lungs by an influx of PMNs (Jay et a!. 1976; Pierce et a!. 1977; Rehm et a!. 1980). That the PMNs play a role in resistance to gram-negative infections is indicated by the observation that intrapulmonary killing of gram-negative bacteria, but not of S. aureus, is suppressed in neutropenic animals (Rehm et al. 1979), and recruitment of PMNs into the lungs prior to bacterial challenges enhances pulmonary bactericidal activity (Rylander et a!. 1975).
At the cellular level, the bactericidal armamentarium of the pulmonary phagocyte rapidly inactivates and degrades inhaled organisms within hours of their entrance into the alveolar region (Kim et al. 1976). The ability of the resident macrophage to seek out, ingest, and inactivate bacteria results from the integration of a number of complex events. Phagocytes are attracted to bacteria by chemotactic factors either elaborated from the bacteria or formed as a result of the interaction of the bacteria with lung tissue. Bacterial ingestion is triggered by the attachment of the bacteria to both specific immunologic receptors and nonspecific membrane receptors. Once ingested, the bacteria are internally isolated in phagosomes. Lysosomes, containing microbicidal and degradative enzymes (Goldstein 1983), fuse with the phagosomes to form the phagolysosome, in which intracellular processing of the bacteria occurs. In addition to lysosomal killing mechanisms, alveolar macrophages are capable of inactivating organisms by oxygen-dependent mechanisms, such as those involving the superoxide radical anion, myeloperoxidase, and hydrogen peroxide; these microbicidal compounds are of primary importance in bacterial killing by phagocytes.
4
N02 Exposure and Modulation of Pulmonary Defense Mechanisms
The bacterial challenges used herein with S. aureus, P. mirabi]is, K. pneumoniae, and P. pneumotropica do not establish an infective process. Regardless of the challenge dose delivered by aerosol inhalation, the bacteria are rapidly eliminated; the lungs are virtually sterile approximately 24 to 48 hours after the bacterial challenge (Green and Kass 1964a,b; Laurenzi et a!. 1964).
Infection is defined as "the multiplication of organisms" (Stedman 1972), and self-limiting infections in the healthy host represent the success of the host defense mechanisms in controlling the process. Because of the extraordinary capacity of lung defenses to maintain the sterility of the respiratory membrane, the best available model of a selflimiting bacterial infection is with the intracellular microorganism Listeria monocytogenes. After aerosol inhalation, this organism sets up a smoldering long-term infection in the lung that lasts approximately seven days (Lefford et al. 1978, 1979; Jakab eta!. 1981). Thereafter, with the appearance of the cell-mediated immune response (Truitt and Mackaness 1971), the bacteria are rapidly inactivated. The cell-mediated immune responses against L. monocytogenes infection involve specifically sensitized T-lymphocytes that secrete biologically active proteins, termed lymphokines. These lymphokines interact with alveolar macrophages to endow the latter with enhanced intracellular microbicidal activity (Harrington-Fowler eta!. 1981; Miyata et a!. 1982).
RESPIRATORY DEFENSE MECHANISMS AGAINST VIRAL INFECTIONS
In experimental models of Sendai virus and influenza virus infection, the severity and duration of the resulting illness depend on the infectious dose of the virus delivered to the respiratory tract (Jakab 1975). With infectious doses that cause moderate-to-severe pneumonitis, the virus proliferates rapidly in the lungs, reaching peak titers approximately three to five days after viral infection. Thereafter, pulmonary virus titers rapidly decline, with infectious virus no longer recoverable after the ninth day of infection (Appell et a!. 1971; Jakab and Dick 1973).
During the acute stages of the infection, the ciliated epithelial cells of the conducting airways are the principal sites of viral replication. The ciliated epithelium degenerates and desquamates in the affected areas. Maximum histopathologic changes occur approximately a week after viral infection. At this time, the affected areas of the lung parenchyma are characterized by hyperemia and thickening of the alveolar walls, with interstitial infiltration with leukocytes and capillary thrombosis. The alveoli are congested and edematous, and contain leukocytic exudates. The virus-induced lesion begins to resolve by the ninth day of

G.J. Jakab
the infection, as evidenced by the beginning of repair of the damaged areas of mucosa and the resolution of the consolidation in the lung parenchyma (van Nunen and van der Veen 1967; Robinson et al. 1968).
Host defenses against the virus infection include interferon, which nonspecifically prevents viral replication (Charlton and Blandford 1977; Zee et al. 1979; Wyde et al. 1982), and the specific antiviral immune response (Virelizier et al. 1979; Ada et al. 1981; Ennis 1982). Interferon concentrations in the lung are usually at their highest levels on approximately the fifth day of infection, and then decline as the virus disappears (Heath 1979; Hoshino et al. 1983). Specific antiviral immunoglobulins are detected in the lungs by the third day of infection, and are recovered from bronchial washings by day eight (Scott and Walker 1976; Charlton and Blandford 1977); serum antibodies usually appear by day eight (Heath 1979). In addition to the humoral immune response, cytotoxic T-lymphocytes sensitized to the viral antigen also appear in the lungs during the third day of infection. This response peaks at approximately day seven and then declines. Cytotoxic T-lymphocytes destroy virus-infected cells through a process involving the lysis of the target cell containing the viral antigen (Yap and Ada 1978; Wells et al. 1983).
SUMMARY
Our knowledge of whether or not exposure to ambient levels of N02 increases susceptibility to respiratory infections is inconclusive. The epidemiologic data regarding this relationship leave room for doubt, as these studies have used parameters of acute respiratory illness that are not necessarily related to infectious episodes. Experimental studies in which functional parameters of host resistance to respiratory infections have been used are few. However, these few experimental studies indicate that acute N0 2 exposure at concentrations of 3.8 ppm or greater (Goldstein et al. 1973) impairs the intrapulmonary killing of bacteria in the lungs.
AIMS
The overall goal of this study was to determine the threshold concentration of N02 that, during an acute exposure, increases the susceptibility to, and the severity of, viral and bacterial respiratory infections. This aim was accomplished through studies of functional resistance mechanisms of the murine lung against bacterial and viral challenges; this provides a composite picture of the dose-response relationship between exposure to N02 and impairment of a spectrum of respiratory defense parameters. The specific objectives were to determine the concentration of N02 that corresponds with each of the following effects:
1. Decreases physical transport from the lungs; 2. Decreases intrapulmonary bacterial killing; 3. Decreases in vivo alveolar macrophage phagocytic
activity; 4. Decreases auxiliary (PMN) phagocytic activity in
the lungs; 5. Increases the severity of bacterial infection; 6. Increases the severity of viral infection; 7. Decreases intrapulmonary bacterial killing in the
predisposed lung.
METHODS
ANIMALS
White female Swiss mice weighing 20 to 23 g (Hilltop Laboratory Animals, Scotsdale, PA), and having no serologic evidence of Sendai virus infection, were used. Bacterial agglutination tests demonstrated serum antibodies against P. pneumotropica, but not against S. aureus, P. mirabilis, and K. pneumoniae. The animals were housed in filter-topped cages and provided with food and-water ad libitum. Virus-infected animals and noninfected animals were kept in separate rooms. National Institutes of Health (NIH) Guidelines for care and use of laboratory animals were followed.
BACTERIAL AGENTS
S. aureus (FDA strain 209P, phage type 42D), P. mirabilis (a laboratory strain), K. pneumoniae (a clinical isolate), P. pneumotropica (a fresh isolate from the nasopharynx of a mouse not from the supplier of the animals used herein), and L. monocytogenes (ATCC strain 7644) were used in our experiments.
Stock bacterial cultures were prepared by inoculating each of the organisms into 1,000 ml of brain-heart-infusion broth (BHI) and incubating the suspension for 24 hours at 3 7 oc in a rotary-shaker water bath (Model G76; New Brunswick Scientific, New Brunswick, NJ). Thereafter, each bacterial preparation was concentrated 10-fold by centrifugation and suspended in 80 ml of BHI. After adding 20 ml of sterile glycerin to each suspension, the bacterial preparations were divided into 1-ml portions and frozen at -20°C. The purity of each culture was verified before use.
VIRAL AGENTS
Stock viral cultures of parainfluenza 1 (Sendai) virus and mouse-adapted influenza A/PR8/34 virus were prepared by inoculating 0.1 ml of the virus into the allantoic cavity of 10-day-old embryonated chicken eggs (Truslow Farms, Chestertown, MD). The eggs were then incubated at 35 oc for two days, chilled overnight at 4 oc, and the allantoic
5

fluid from each egg was harvested and pooled. After centrifugation (500 X g; 10 minutes at 4 °C), each Virus preparation was divided into small portions and frozen at -70°C. Ten dozen eggs were used to prepare each virus stock. The infectious titer of the Sendai and influenza virus stock preparations was 109 50 percent median egg infectious dose (EID50). The identities of the viruses were verified by serologic (hemagglutination-inhibition) tests against NIH reference reagents: V321-511-558 for Sendai virus and V301-511-552 for influenza A/PR8/34 virus.
PREPARATION OF BACTERIA FOR INHALATION CHALLENGE
Of the stock bacterial preparations of S. aureus, P. mirabilis, K. pneumoniae, P. pneumotropica, and L. monocytogenes, 1 ml was inoculated into 200 ml of trypticase soy broth (TSB) and incubated at 37°C in a rotary-shaker water bath. After 18 hours the cultures were centrifuged (3,000 x g; 10 minutes), washed twice with 0.1 M phosphate-buffered saline (PBS; pH 7.6), and resuspended in 10 ml of TSB.
For the studies dealing with physical translocation of bacterial particles, the staphylococci were incubated in 150 ml of phosphorus-free culture medium containing 1 mCi of 32P (Jakab and Green 1972). After 18 hours at 37°C in a shaking water bath, the labeled staphylococci were centrifuged, washed twice with PBS to remove all the unattached radiolabel, and resuspended in 8 ml of TSB.
BACTERIAL CHALLENGE
A previously described (Ruppert et al. 1976) modification of the Henderson (1952) aerosol apparatus was used to challenge the animals with the bacteria by inhalation. The apparatus consists, in sequence, of a Collison atomizer activated by compressed air, a 6- by 60-cm length of Plexiglas tubing to mix the nebulized agent with diluting air, a large Plexiglas cylindrical chamber (28 by 80 em) containing six cylindrical wire cages, a fiberglass prefilter, two absolute-type bacterial high-efficiency particulate air (HEPA) filters, and a vacuum pump. The atomizer was activated with 15 psi of compressed air and, at a rate of 6liters per minute, produced a continuous cloud of small infectious droplets, 97 percent of which had an aerodynamic particle diameter of 3.5 ~-tm or less (Jakab and Green 1972), as determined with an Andersen (1958) sampler.
The outlet of the nebulizer emptied into the open end of the small Plexiglas tubing, which acted as a mixing chamber in which the bacterial cloud from the nebulizer was mixed with a larger volume of air. The secondary air entered the mixing chamber around the nozzle of the atomizer. The vacuum pump, located at the downstream end of the apparatus, maintained the secondary air flow of approximately
6
N02 Exposure and Modulation of Pulmonary Defense Mechanisms
20 liters per minute, as measured with a hot wire anemometer. Each end of the large cylindrical exposure chamber was removable, and was equipped at the center with a rectangular baffle plate suspended perpendicularly to the air stream. This baffle plate removed large droplets, and provided more uniform mixing and distribution of the bacteria in the exposure chamber.
The six cylindrical cages located in the exposure chamber were made of stainless-steel woven wire. Each holds 12 mice that are individually separated, in order to prevent the huddling of the animals, which would alter the number of bacterial particles the animals inhaled. To ensure more uniform distribution of the aerosol in the chamber, the cages rested on 2-cm-high offsets, which allowed a 2-cm airspace between the cages and the chamber wall. This space was then blocked by placing Plexiglas rings between the cages; the bacterial particles were channeled through the space holding the animals (Ruppert et al. 1976). The aerosol-generation apparatus, exposure chamber, and filter system were located in a HEPA-filtered reverse laminar flow hood (Baker Co., Sanford, ME). Animals were challenged for 30 minutes with each bacterial cloud, during which time 1 to 5 x 10⁵
of each of the bacteria were deposited in the lungs.
VIRAL INFECTION
Animals were infected with either parainfluenza 1 (Sendai) or influenza A/PR8/34 virus for 30 minutes in the same chamber, under identical conditions as were used for the bacterial challenges. For Sendai virus a 1:5 dilution of the stock virus was used, whereas a 1:50 dilution was used for infection with influenza A/PR8/34 virus. Each virus infection resulted in a moderate-to-severe pneumonitis, from which the animals readily recovered.
BACTERICIDAL ASSAY
Pulmonary bactericidal activity was assessed by previously described methods (Ruppert et al. 1976). Briefly, animals were killed by luxation of the neck immediately (zero time) or four hours after cessation of bacterial challenge. The lungs were aseptically removed, trimmed of the trachea and major bronchi, and homogenized in 3 ml of iced TSB with an all-glass tissue homogenizer (Model K41; Tri-R Instruments, Rockville Center, NY). A 1.0-ml aliquot of the lung homogenate was diluted 10-fold in sterile PBS, and a 0.1-ml aliquot of the appropriate dilution was cultured quantitatively in quadruplicate on Petri-X dishes by standard microbiologic pour-plate methods. Trypticase soy agar (TSA) supplemented with 5 percent sodium chloride (NaCl) was used for S. aureus, TSA was used for L. monocytogenes and K. pneumoniae, and bismuth sulfite agar was used for P. mirabilis. P. pneumotropica was cultured on prepared TSA-5 percent sheep blood agar (Jakab and Dick 1973). The

G.J. Jakab
Petri dishes were incubated for 48 hours at 37°C, and were then visually counted with a Quebec Colony Counter (Model 3325; American Optical, Buffalo, NY). Pulmonary bactericidal activity in each animal was calculated as the percentage of initial viable bacteria remaining after four hours by the following formula (Ruppert et al. 1976) (see Appendix A):
Percent viable bacteria remaining = bacterial count (4
hr)lmean bacterial count (0 hr) x 100.
RADIOASSA Y PROCEDURE
Quantitative measurement of 32P activity was performed on another 1.0-ml aliquot of the lung homogenate from animals challenged with radiolabeled S. aureus (Green and Goldstein 1966). The samples were prepared for liquid scintillation counting by digestion in 2.0 ml of 10x hyamine hydroxide (New England Nuclear, Boston, MA), overnight, at room temperature, in 20-ml screw-cap glass counting vials. After digestion, 5 ml of absolute ethyl alcohol and 10 ml of toluene-based liquid scintillation solution (Omnifluor; New England Nuclear, Boston, MA) were added. The samples were assayed in a liquid scintillation spectrometer (Beckman Instruments Inc., Fullerton, CA). After correction for dilution, quench, and background, radioactivity was expressed as counts per minute per milliliter of lung homogenate assayed.
Physical transport of 32P-labeled S. aureus from the lungs was determined by following the decline in radiotracer activity. The 32P counts in the lungs of individual animals killed after four hours were expressed as a percentage of the mean radiotracer counts obtained from the animals killed immediately (Jakab and Green 1972).
VIRUS TITRATION
At various times after Sendai virus infection, groups of animals were killed and their lungs removed aseptically. Each lung was homogenized in 2 ml of iced citrate phosphate-buffered Hank's balanced salt solution (CP-HBSS; pH 7.0). The lung homogenates were then incubated for five minutes at 3 7 oc in a rotary-shaker water bath in order to elute the virus from the tissue. Thereafter, the pooled homogenates were centrifuged (500 x g, 5 minutes at 4°C), the supernatant aliquotted in 1.0-ml portions, and frozen at -70 oc until assay.
Infectious pulmonary virus titers were determined by allantoic cavity inoculation of 10-day-old embryonated chicken eggs (Lennette and Schmidt 1974). A 0.1-ml inoculum of a 10-fold dilution of the pooled lung homogenate supernatant fluid (in CP-HBSS supplemented with 100 units of penicillin and 100 p.g of streptomycin) was inoculated into each of four eggs. The eggs were then incubated at 35 oc for two days, chilled at 4°C overnight, and then harvested
for allantoic fluid. Thereafter, 0.5 ml of each allantoic fluid was mixed with 0.5 ml of a 0.5 percent suspension of sheep erythrocytes, and the tubes were examined for hemagglutinin activity after incubation for one hour at room temperature. The EID50 endpoint was calculated by the Karber method (Lennette and Schmidt 1974).
COLLECTION OF PULMONARY CELLS
Total and differential cell counts of free pulmonary cells were made four hours after the inhalation challenge with bacteria (Astry et al. 1983). The animals were killed by brainstem compression and were bled by cardiac puncture. The lungs were surgically removed in toto. Pulmonary cells were collected by inserting a Pasteur pipette into the trachea and introducing and withdrawing 1.5 ml oflavage solution (0.85 percent NaCl, 0.1 percent glucose, 3 mM ethylenediaminetetraacetic acid [EDTA], and 20 mM N-2-hydroxyethyl-piperazine-N-ethane sulfonic acid [HEPES] buffer) three times; a total of 4.5 ml of lavage solution was used for each lung. After collection, the total number of cells from each animal was counted with the use of a hemacytometer. The cell suspensions were then centrifuged (400 x g; 10 minutes), the supernatants discarded, and the cells resuspended in Hank's balanced salt solution (HBSS) at 5 x 10⁵ cells/ml. Duplicate sets of pulmonary cells were prepared by cytocentrifuging 0.2 ml of the cells so prepared (1,000 rpm for 10 minutes in a Cytospin II; Shandon Instruments, Sewickley, PA). Morphologic differentiation was performed on the cytocentrifuged preparations, which were stained with Diff-Quick (Dade Diagnostics, Agua, PRJ, by microscopically counting not less than 300 cells and scoring them as being either alveolar macrophages, PMNs, or lymphocytes.
ALBUMIN DETERMINATIONS IN PULMONARY LAVAGE FLUID
The concentration of albumin was quantified in the first lavage fluid. After centrifugation to remove the lavaged cells, 20 p.l of the supernatant was incubated with 100 p.l of a commercially available 0.01 percent bromcresol green solution (Albumin Color Reagent; Sigma Chemical Co., St. Louis, MO). After 15 minutes at room temperature, the optical density was measured at 630 nm and the quantity of albumin (mg/ml) was estimated from a standard curve.
LUNG WET:DRY WEIGHT RATIOS
Separate groups of mice were killed, and the lungs were excised, weighed, lyophilized overnight (Speedvac Concentrator; Savant Instruments Inc., Farmingdale, NY), and weighed again.
7
NITROGEN DIOXIDE INHALATION EXPOSURE CHAMBERS
Two identical stainless-steel horizontal-flow environmental exposure chambers (Baker Company, Sanford, ME) were used in these studies (Appendix B). These chambers have been described and tested for reliable flow dynamics (Hemenway et al. 1982; Hemenway and MacAskill, 1982}.
NITROGEN DIOXIDE EXPOSURE
The N02 generation and quantification system used herein was newly developed in collaboration with our consultant, Dr. David R. Hemenway (Department of Civil and Mechanical Engineering, University of Vermont). Concurrent with this project, Dr. Hemenway was a coinvestigator of another project funded by the Health Effects Institute that dealt with N02 exposures (HEI Agreement No. 83-5}. This newly developed N02 exposure system is detailed elsewhere (Hemenway and Jakab 1987}.
Nitrogen dioxide was generated (Appendix C) by mixing the gas phase of liquid N02 (99.5 percent chemically pure grade; Matheson, East Rutherford, NJ) with nitrogen (N2)
in a 50-liter Teflon gas-sampling bag (Pollution Measurement Corp., Chicago, IL). The mixing ratio of N2 :N0
2 de
pended on the desired exposure concentrations. A stainless-steel and Teflon diaphragm pump (Model NOS; KNF Neuberger, Inc., Princeton, NJ), attached to a stainless-steel calibrated metering valve, delivered N02 to a small premixing chamber for final dilution with HEPA-filtered room air before it entered one of the stainless-steel horizontal exposure chambers. Air flow to the exposure chambers was maintained at 8 cubic feet per minute, which provided a theoretical air turnover of 20 volume changes per hour.
Chamber concentrations of N02 were continuously monitored with a chemiluminescent N02 analyzer attached to a chart recorder (Columbia Scientific Instruments, Austin, TX), as described by Fontinin and associates (1970}. The N02 monitor was calibrated by a primary calibration system with a permeation tube, as previously described (Hughes et al. 1977}. A multipoint calibration was performed before each experiment.
Nitrogen dioxide concentrations were preset prior to the placement of the animals in the chamber. To place the animals in the chambers, the N02 flow into the diluent air was halted, the chamber flushed with the diluent air, the animals placed in the chamber, and the N0 2 flow started again. Once the N02 exposure levels were preset, evacuation of N02 from the chamber, transfer of the animals, and reestablishment of the preset concentration took approximately five minutes. Since the N02 concentrations were recorded with the chart recorder, the levels of N02 were calculated by measuring the area under the curve with an electronic graphics calculator (Numonics Corp., Lansdale,
8
N02 Exposure and Modulation of Pulmonary Defense Mechanisms
PA). The exposure levels were reported as time-weighted averages for the exposure periods. Since real-time monitoring allows rapid adjustment for excursions from the target concentrations, the infrequent and slight drifts were immediately readjusted. The time-weighted exposure averages were within ± 5 percent of the target concentrations.
Two horizontal-flow exposure chambers were used in these studies. In one the mice were exposed to various levels of N02 ; the other served as a control chamber to expose animals to an identical flow of HEPA-filtered room air without the N02 . The animals were housed in individual stainless-steel wire cages during the exposure periods.
EXPERIMENTAL DESIGN
The experimental design depended primarily on the hostdefense parameter being tested, or the specific question being asked about the effect of N02 exposure on resistance to respiratory infections.
Intrapulmonary Antibacterial Defenses
Two basic protocols were used for the studies dealing with the effects of N02 exposure on the intrapulmonary killing of bacteria (S. aureus, P. mirabilis, K. pneumoniae, and P. pneumotropica). The first was to elucidate the effect of exposure to N02 after bacterial challenge. For these experiments, the animals were challenged with the bacteria and divided into three equal groups. One group was killed immediately after bacterial challenge (0 hr), whereas the second and third groups were exposed to N02 or ambient air, respectively, for four hours and then killed.
The second protocol was to assess the effect of preexposure to N02 on pulmonary bactericidal activity against S. aureus and P. mirabilis. For these studies, half the mice were exposed to ambient air for four hours. All the animals were then challenged with the bacterium. Half the N02-preexposed group and half the ambient-air control group were killed immediately after bacterial challenge. The remaining half of each group were allowed to breathe ambient room air (in cages placed in the animal holding room) and then were killed at four hours.
Each group consisted of six to 10 animals. Depending on the protocol and the concentration of N02 used, each experiment was run at least two times and the results of the runs were pooled. The replicates of the experiments were needed for statistical evaluation.
Resistance to Bacterial Respiratory Infection
To determine the effect of N02 exposure on resistance to long-term bacterial infection, mice were infected by aerosol inhalation with L. monocytogenes and then divided into two groups. In separate experiments, one group was exposed for four hours per day to either 10 or 20 ppm of N02 , while

G.J. Jakab
the respective control groups were allowed to breathe am
bient air for four hours per day in the second exposure chamber. Groups of mice were assayed at three, five, 10, and 14 days after bacterial infection.
Resistance to Sendai Virus Infection
To examine the effect of N02 exposure on resistance to viral infections, mice were infected by aerosol inhalation with a sublethal dose of Sendai virus and then divided into two groups. In separate experiments, one group was exposed for four hours per day to either 5, 10, or 20 ppm of
N02 , while the respective control groups were allowed to breathe ambient air for four hours per day in the second exposure chamber. Groups of virus-infected mice and noninfected mice were assayed at three, five, seven, and ten days after infection in order to determine pulmonary virus titers.
Predisposed Host
Influenza-Virus-Associated Bacterial Superinfections. Mice were infected by aerosol inhalation with a dose of influenza A/PRS/34, which caused a moderate pneumonitis. Eight days after infection, virus-infected mice and noninfected mice were challenged by aerosol inhalation with S. aureus. In separate experiments, half the virus"
infected mice and noninfected mice were exposed for four hours to either 5 or 10 ppm of N02 , while the other half of the two groups were allowed to breathe ambient air for four hours in the second exposure chamber. Intrapulmonary bactericidal activity was assessed at four hours after bacterial challenge, as described above.
Corticosteroid Treatment. Mice were injected intramuscularly in the rear leg with 4 mg of sterile methylpredniso
lone acetate suspension (Depo-Medrol; Upjohn Co., Kalamazoo, MI) contained in a 0.1-ml volume. Control animals were injected intramuscularly with 0.1 ml of PBS. Four days later, all mice were challenged by aerosol inhalation with S. aureus, and the corticosteroid-treated animals and non treated animals were separated into two groups. In separate experiments, half the treated mice and nontreated mice were exposed for four hours to either 1.0, 2.5, 5.0, or
10.0 ppm of N02 , while the other half of the two groups were allowed to breathe ambient air for four hours in the second exposure chamber. Intrapulmonary bactericidal activity was assessed at four hours after bacterial challenge, as described above.
Summary of Experimental Design
1. Exposure after challenge: bacterial challenge - N02 for four hours - assay.
2. Exposure before challenge: N02 for four hours - bacterial challenge - four hours - assay.
3. Exposure before and after challenge: N02 for four hours - bacterial challenge - N02 for four hours.
4. Resistance to bacterial infection: infect with L. monocytogenes - expose to N02 for four hours per day -assay on days 0, 3, 5, 10, and 14.
5. Resistance to virus infection: infect with Sendai virus -
expose to N02 for four hours per day - assay on days 0, 3, 5, 7, and 10.
6. Predisposed host 1: infect with influenza virus - eight days - bacterial challenge - N02 for four hours -assay.
7. Predisposed host 2: corticosteroid injection - four days - bacterial challenge - N02 for four hours - assay.
STATISTICAL ANALYSIS
Statistical analysis was carried out using the differences
between control groups and treated groups (excess survival
of bacteria in the lungs) as the measurement analyzed. The
experimental design was a randomized block design, with
treatment combinations defined by concentration and
presence or absence of exposure to N02 before or after
bacterial challenge. The blocks were replications of the
experiments, representing the different days on which the
experiments were performed, and each concentration had
between one and four replicates.
In order to determine if the between-replication variability
was greater than the within-replication variability, a one
way analysis of variance was computed for the means of
the differences of the replications, and the replication er
ror term was compared with a comparable pooled variance
term (calculated by dividing by the harmonic means of the
group numbers [n]). If the replication error term was
significantly greater than the pooled error term, a one-way
analysis of variance, using the means of the differences, was
the analysis adopted to determine significance. If the error
terms were not significantly different, implying equal
within- and between-replication variability, the analysis of
variance was calculated by pooling all replications within
a concentration. The post-hoc analysis used to determine
which groups were significantly different was the Duncan's
multiple range test.
Statistical design for the experiments with four exposure
groups (the immunosuppressant and influenza virus exper
iments) was a randomized block design with four treatment
combinations, defined by concentration of N02 . The blocks
are replications of the experiments representing the different
days on which the experiments were performed. A three
way analysis of variance was used to determine whether or
not the between-replication variability was significantly dif
ferent from the within-replication variability. If it was
9

significantly different, the F-ratios for testing treatment effects utilized appropriate error variances based on variations among replications and not the within-subgroup variation. Again, the Duncan's multiple range test was the post-hoc analysis used to determine significance.
RESULTS
The data from the pooled runs at each N02 concentration are presented in the figures, followed by the appropriate reference to one of the appendices in which the individual value for each replicate is presented in tabular form.
NITROGEN DIOXIDE GENERATION AND QUANTIFICATION
The N02 generation and quantification system is detailed in the Methods section, and in one of the papers that resulted from these studies (Hemenway and Jakab 1987).
Figure 1 shows a typical curve, indicating the excellent stability of the system over a four-hour exposure period. In general, the stability was better than ± 2 percent.
PULMONARY ANTIBACTERIAL DEFENSES (NITROGEN DIOXIDE EXPOSURE AFTER BACTERIAL CHALLENGE)
Staphylococcus aureus Pulmonary antibacterial defenses against S. aureus are primarily dependent on the alveolar macrophage phagocytic system (Goldstein et al. 1977a). Therefore, S. aureus was used as the indicator organism to probe the effect of N02 on the functional integrity of the alveolar macrophages. In these studies, groups of mice were challenged with S. aureus and then exposed for four hours to N02 target concentrations of 2.5, 4, 5, 10, and 15 ppm. The bactericidal activity data are presented in Figure 2 (Appendix D).
E a. 25 a. ;i 0 20 ;:: <
-- --'"""- - - - -'-TARGET CONCENTRATION
c: ~ 15 z w 0 z 10 0 0
C\1 5 0 z
0 0 1 2 3 4
EXPOSURE TIME, HOURS
Figure 1. Inhalation chamber response using the Teflon bag generation system.
10
N02 Exposure and Modulation of Pulmonary Defense Mechanisms
Pulmonary bactericidal activity against S. aureus decreased progressively with exposure to increasing concentrations of N0 2. These differences were significant for the comparison of controls and mice exposed to 5 ppm of N02 or greater.
Proteus mirabilis
As stated above, pulmonary antibacterial defenses against S. aureus are primarily dependent on alveolar macrophages (Goldstein et al. 1977a), whereas lung defenses against gram-negative bacteria, such as our indicator organism, P. mirabilis, consist of both alveolar macrophages and PMNs (Jay et al. 1976; Rehm et al. 1980). The peripheral phagocyte is not a constituent of the cell populations of normal murine lungs, but it can migrate to the lung in response to inhaled gram-negative bacteria and thus provide auxiliary phagocytic defense capabilities to the lung (Pierce et al. 1977; Rehm et al. 1979). Failure of the PMNs to migrate to the lung is associated with a decrease of pulmonary defenses against gram-negative bacteria, but not against S. aureus (Rehm et al. 1979; Astry et al. 1983).
In these studies, groups of mice were challenged with P. mirabilis and exposed for four hours to target concentrations of 5, 10, 15, 17.5, 20, and 25 ppm of N02 • The bactericidal activity data are presented in Figure 3 (Appendix E). Nitrogen dioxide concentrations of 5 ppm had no effect on the intrapulmonary killing of P. mirabilis. In contrast, 10 ppm of N0 2 significantly enhanced the bactericidal activity of N02-exposed lungs, and the trend toward this enhancement was still evident at 15 ppm. In-
II) 50 :;)
~Control ~ a: :;)
• N02 Exposed 'II: C/) 40 c,; a:
:1
LLI 0 P<0.05 ...I J: ID 'It < 1-> < ...I CJ <z Ez 20 z-_ca: LI.::E oLLI a: 1-
10 z LLI 0 a: LLI Q,
2.5 4.0 5.0 10.0 15.0
N02 CONCENTRATIONS (ppm)
Figure 2. Comparison of intrapulmonary killing of S. aureus between mice exposed to either ambient air (control) or N0 2 for four hours after bacterial challenge. Each value represents the mean ± SE of 14 to 22 determinations.

G.J. Jakab
creasing the N0 2 exposure concentrations to 17.5 ppm resulted in equivalent rates of intrapulmonary bacterial killing. Finally, at exposure concentrations of 20 ppm, a significant suppression of bactericidal activity of the lung against this organism was observed. This impairment continued in a dose-dependent manner at 25 ppm; at 30 ppm mice began to die if exposed to N02 after P. mirabilis challenge.
The initial enhancement, followed by the suppression, of pulmonary bactericidal activity against P. mirabilis at increasing N02 exposure concentrations was unexpected. To gain insights into the possible mechanism of this effect (that is, the recruitment of additional phagocytes into the alveolar area), the lungs of control, N02-exposed, P. mirabilischallenged, and P. mirabilis-challenged-plus-N02-exposed mice were lavaged in order to quantify total and differential cell counts on the retrieved cell populations.
Figure 4 (Appendix F) shows that 6.3 ± 0.4 x 10⁵ cells were lavaged from the lungs of control animals, of which more than 98 percent were alveolar macrophages. Four-hour exposure to 10 ppm of N02 increased the total cell yield to 8.1 ± 1.2 x 10⁵ , but did not significantly alter the differential cell population. When mice were exposed to our standard challenge of P. mirabilis, the lavageable cell yield increased to 37.5 ± 2.0 x 10⁵ cells, compared-with the control group receiving no treatment. Most ofthe cells (90. 7 ± 1.2 percent) from the group receiving the bacterial challenge were PMNs. Exposure of P. mirabilis-challenged animals to 10 ppm of N02 resulted in almost a twofold increase of the retrieved cell numbers, and an increase of the PMNs to 95.2 ± 0.3 percent.
Cl) 50 =:i iii ~ Control <t !:!:(/) • N02 Exposed :ta: 40
. ::I Q.O p<0.05 w:t: ...J'I' !DI- 30 =:!:<( > ...JC!l <(~ -z 1-_
20 -<(
~:IE u..W oa: 1-
10 z w (.) a: w Q.
5.0 10.0 15.0 17.5 20.0 25.0
N02 CONCENTRATIONS (ppm)
Figure 3. Comparison of intrapulmonary killing of P. mirabilis between mice exposed to either ambient air [control) or N02 for four hours after bacterial challenge. Each value represents the mean ± SE of 20 to 24 determinations.
60 90.1%
o a PMNa 8 50
c:i IIJ'IJ Macrophage& 0
)( 40 (/) ...I ...I UJ
~ 30 z :::> ...I
:;:: 20 C) < > < ...I 10 99.5% 97.3%
1.8%
Amb Air N02 (10 ppm)
88.7%
P. mirabilis P. mirabilis
& 10 ppm N02
Figure 4. Comparison of total and differential counts of cells lavaged from murine lungs at four hours after treatment with either ambient air, 10 ppm N02 , P. mirabilis, or P. mirabilis plus 10 ppm N02 . The numbers on top of the bars represent the percentages of the alveolar macrophages and PMNs retrieved [lymphocytes were less than 2 percent throughout). Each value represents the mean ± SE of eight determinations.
Figure 5 (Appendix F) presents the experiment with P. mirabilis-challenged mice that were exposed to 25 ppm of N02 for four hours before bronchoalveolar lavage. Exposure to N02 at this concentration reflected the results obtained with 10 ppm of N02 (Figure 4).
Klebsiella pneumoniae
To determine whether N02 acted as a coinflammatory agent with another gram-negative organism, which in this case was a respiratory pathogen, experiments were performed with K. pneumoniae. In these studies, groups of mice were challenged with K. pneumoniae and then exposed for four hours to 10 ppm of N02 , at which time pulmonary bactericidal activity and bronchoalveolar lavage cell counts were performed .
Exposure to 10 ppm of N02 significantly reduced the intrapulmonary killing of K. pneumoniae; 45.6 ± 3.0 percent of the initial viable bacteria remained in the lungs of N02-exposed mice, compared with 28.1 ± 1.7 percent in the lungs of control animals that breathed ambient air (Appendix G).
The data for the lavage studies performed at four hours after bacterial challenge are presented in Figure 6 (Appendix H). From the lungs of control mice, 3.8 ± 0.3 x 10⁵
cells were retrieved, of which more than 99 percent were alveolar macrophages. Four hours of exposure to 10 ppm N0 2 increased the total cell yield to 4.8 ± 0.3 x 10⁵ and increased the PMN response to 3.0 ± 0.4 percent. When mice were challenged with K. pneumoniae, the lavageable cell yield increased to 13.5 ± 1. 3 x 10⁵ and the PMN
11

response to 67.5 ± 3.0 percent. Exposure of K. pneumoniaechallenged mice to 10 ppm of N0 2 resulted in 20.1 ± 2.2 x 10⁵ total cells retrieved, of which 67.1 ± 2.5 percent were PMNs.
Pasteurella pneumotropica
As stated above, S. aureus, P. mirabiJis, and K. pneumoniae were used as indicator organisms to probe the effect of N02 exposure on the functional integrity of the alveolar macrophage and auxiliary (PMN) phagocytic systems of the lungs. Bacterial challenge with P. pneumotropica was also used to probe the effect of N02 exposure on the defense mechanism of the lung against an organism endogenous to the respiratory tract of the experimental animal model. It should be remembered that these mice had serum antibody against P. pneumotropica, but no demonstrable antibody against the other organisms.
In these studies, groups of mice were challenged with P. pneumotropica and then exposed for four hours to 5, 10, 15, 20, 25, or 30 ppm of N02 . The bactericidal activity data are presented in Figure 7 (Appendix I). Nitrogen dioxide concentrations of 5, 10, 15, and 20 ppm had no statistically significant effect on bactericidal activity. Increasing the exposure levels of N0 2 to 25 and 30 ppm induced significant bactericidal dysfunction.
The lavage cell counts for P. pneumotropica-challenged animals exposed for four hours to 10 ppm of N02 are presented in Figure 8 (Appendix J). From the lungs of control mice, 6.3 ± 0.6 x 10⁵ cells were retrieved, of which more than 99 percent were alveolar macrophages. After four
Amb Air N02 (25 ppm) P. mirabilis P. mirabilis
& 25 ppm N02
Figure 5. Comparison of total and differential counts of cells lavaged from murine lungs at four hours after treatment with either ambient air, 25 ppm NO,. P. mirabilis, or P. mirabilis plus 25 ppm N02 . The numbers on top of the bars represent the percentages of the alveolar macro phages and PMNs retrieved (lymphocytes were less than 2 percent throughout). Each value represents the mean ± SE of eight determinations.
12
N02 Exposure and Modulation of Pulmonary Defense Mechanisms
hours of exposure to 10 ppm of N02 , the total cell yield was 7.0 ± 4.7 x 10⁵ , of which 1.7 ± 0.4 percent were PMNs. When mice were challenged with P. pneumotropica, the lavageable cells increased to 43.6 ± 4.7 x 10⁵ of which 89.5 ± 1.4 percent were PMNs. Exposure of P. pneumotropica-challenged mice to 10 ppm of N02 for four hours resulted in a decrease of the total cells retrieved, to 35.0 ± 3.0 x 10⁵ , of which 92.5 ± 1.1 percent were PMNs.
Summary
The data on pulmonary bactericidal activity and bronchoalveolar lavage in which mice were exposed to more than one concentration of N0 2 are summarized in Figures 9 and 10.
Previously, the bactericidal data for S. aureus, P. mirabi]is, and P. pneumotropica (Figures 2, 3, and 7) were presented as the actual values of the percentage of viable bacteria remaining at four hours in control animals and in those exposed to various concentrations of N02 • Since the rate of intrapulmonary killing varies among the different bacteria (Jakab 1976), comparisons of the effect of N02 on the absolute bactericidal activity are difficult. Therefore, the differences in bactericidal values (excess bacterial survival or killing) between control and N02-exposed groups were calculated. For example, if the actual value was 10 percent of the bacteria remaining at four hours in the control group and 15 percent in the N02-exposed group, the difference (excess bacterial survival) would be 5 percent. Figure 9 presents the data as the differences, expressed as difference in percentage change, between control and N02-exposed groups among the various bacteria.
The data reveal three different trends in the modulation of pulmonary antibacterial defenses by exposure to N02 .
With S. aureus, a clear dose-response relationship is evident in that pulmonary bactericidal activity decreased progressively with increasing concentrations of N02 . With P. mirabiJis, N02 exposure to 10 ppm significantly enhanced bactericidal activity (signified by a negative value), and at 15 ppm this enhancing trend was still evident. Increasing N02 exposures to 20 ppm and 25 ppm caused a significant suppression of pulmonary antibacterial defenses. Finally, with P. pneumotropica, yet another pattern emerged, in that significant suppression was observed only at N02 exposure levels of 25 and 30 ppm.
Figure 10 presents a summary comparison of the lavage cell determinations obtained from mice challenged with S. aureus (Appendix K), P. mirabi]is, P. pneumotropica, and K. pneumoniae and exposed to N0 2 . Bacterial challenge with P. mirabilis recruited the most PMNs into the lungs, followed by P. pneumotropica and K. pneumoniae. Exposure to N02 significantly increased PMN recruitment into the lungs after P. mirabilis challenge, but had no signifi-

G.J. Jakab
cant effect on pulmonary PMN recruitment with the other
bacterial challenges.
PULMONARY ANTIBACTERIAL DEFENSES (NITROGEN DIOXIDE EXPOSURE BEFORE BACTERIAL CHALLENGE)
The data for the experiments in which mice were exposed to various concentrations of N02 for four hours and then challenged with either S. aureus or P. mirabilis are presented in Figure 11 (Appendices Land M). Two exposure levels were used in these studies. The first was the lowest concentration for which a bactericidal dysfunction against the organism was observed in the experiments described above using post-bacterial challenge and N02
exposure. The second concentration was approximately oneand-a-half to two times higher.
Preexposure levels of 5 ppm of N02 for four hours before bacterial challenge had no effect on the subsequent intrapulmonary killing of S. aureus, whereas 10 ppm significantly impaired bactericidal activity. Comparison of lung antibacterial defenses against P. mirabilis between exposure levels of 20 ppm and 30 ppm showed no effect at the lower concentration but a significant enhancement at the higher concentration.
PULMONARY ANTIBACTERIAL DEFENSES (NITROGEN DIOXIDE EXPOSURE BEFORE AND AFTER BACTERIAL CHALLENGE)
Previously it was demonstrated that 5 ppm was the lowest concentration of N02 exposure that resulted in pulmonary
0 14
8 8 12
)(
"' 1 ..J ..J w 0 (.? z "" ..J
0 w (.?
~ :5
~ PMNs
- Macrophages
Amb Air N02 (10 ppm) K. pneumo. K. pneuma. & 10 ppm N02
Figure 6. Comparison of total and differential counts of cells lavaged from murine lungs at four hours after treatment with either ambient air, 10 ppm N02 , K. pneumoniae, or K. pneumoniae plus 10 ppm N02 • The numbers on top of the bars represent the percentages of the alveolar macro phages and PMNs retrieved (lymphocytes were less than 2 percent throughout). Each value represents the mean ± SE of eight determinations.
bactericidal dysfunction, and that this occurred when the challenge organism was S. aureus and N02 exposure followed bacterial challenge (Figure 2). In order to determine whether or not this threshold dose could be reduced, mice were exposed to 2. 5 ppm of N02 for four hours before and after staphylococcal challenge. The four groups of mice were treated as follows: (1) ambient air, bacterial challenge, ambient air; (2) ambient air, bacterial challenge, N02 exposure; (3) N02 exposure, bacterial challenge, ambient air; and (4) N02 exposure, bacterial challenge, N02 exposure. The respective bactericidal values for the groups were 11.8
± 1.1 percent, 10.8 ± 0.9 percent, 9.7 ± 0.9 percent, and 10.0 ± 0.8 percent (Appendix N), showing that exposure to 2.5 ppm of N02 for four hours both before and after bacterial challenge did not have a detrimental effect on pulmonary defenses against S. aureus.
PULMONARY ANTIBACTERIAL DEFENSES IN THE PREDISPOSED HOST
The above series of studies clearly demonstrated that, in the normal host, perturbations of pulmonary antibacterial defenses were induced only at exposures to high levels of N02 . In fact, the lowest concentration of N02 that induced a detrimental effect against pulmonary challenges with S. aureus was 4 ppm (Figure 2). Hosts predisposed by a vari-
~ & 40
~ 0 :!; ;:,Ill II,IC::
~ g 30 .X
O....r WI-~<( <((!) -z >...JZ <(-_<( 1-:::E
~~ ~ 10 1-z w (,) a: w c.
5.0
~Control
• N02 Exposed
p<0.05
10.0 15.0 20.0 25.0
N02 CONCENTRATIONS (ppm)
30.0
Figure 7. Comparison of intrapulmonary killing of P. pneumotropica between mice exposed to either ambient air (control) or N02 for four hours after bacterial challenge. Each value represents the mean ± SE of 20 to 30 determinations.
13

ety offactors such as virus infection and corticosteroid treatment are known to be more susceptible to infections of the lungs (reviewed by Huber et al. 1977).
Influenza Virus
Influenza virus infections are known to predispose the host to bacterial superinfections (Martinet al. 1959; Loosli 1967; Nichol and Cherry 1967; Jarstrand and Tunevall 1974). Experimental studies have shown that maximal suppression of pulmonary antibacterial defenses occurs approximately a week after viral infection (Green 1966; Jakab 1981a,b). In the studies reported here, groups of mice were infected by aerosol inhalation with influenza virus and then challenged eight days later with aerosolized S. aureus. Thereafter, mice were exposed for four hours to N0 2 at concentrations of 5 or 10 ppm. The groups consisted of control mice (noninfected and not exposed to N02), virusinfected mice, and virus-infected plus N0 2-exposed mice.
Figure 12 (Appendix 0) presents the bactericidal data. Influenza virus infection on day eight significantly suppressed pulmonary antibacterial defenses: more than 40 percent of the initial viable staphylococci remained in the virusinfected lungs, compared with less than 11 percent in noninfected control animals. As demonstated previously, N02 exposure at 5 and 10 ppm impaired the intrapulmonary killing of staphylococci in a dose-dependent manner. Nitrogen dioxide exposure superimposed on the virus infection had no effect on the intrapulmonary killing of S aureus at 5 ppm, but at 10 ppm, N02 exposure significantly contributed to the virus-induced bactericidal defect.
0 0 0 0 0
><
"' ...J ...J UJ u
"
40
z 2 ::> ...J
" UJ
" < ~ 10 ...J
~ PMNs
- Macrophages
Amb Air N02 (10 ppm) P. pneumo P. pneumo.
& 10 ppm N0 2
Figure 8. Comparison of total and differential counts of cells lavaged from murine lungs at four hours after treatment with either ambient air, 10 ppm N02 , P. pneumotropica, or P. pneumotropica plus 10 ppm N02 . The numbers on top of the bars represent the percentages of the alveolar macrophages and PMNs retrieved [lymphocytes were less than 2 percent throughout). Each value represents the mean± SE of eight determinations.
14
N02 Exposure and Modulation of Pulmonary Defense Mechanisms
Corticosteroid Treatment
Corticosteroids are known to suppress pulmonary antibacterial defenses (Green and Kass 1964a; Pennington 1977; Blackwood and Pennington 1982; Nugent and Pesanti 1982). In these experiments, mice were treated by intramuscular injection with 0.1 ml of a depot corticosteroid, while control mice received an intramuscular injection of 0.1 ml of PBS. Four days later, corticosteroid -treated animals and control animals were challenged with S. aureus and exposed for four hours to N02 concentrations of either 1, 2.5, 5, or 10 ppm.
Figure 13 (Appendix P) presents the bactericidal data. Treatent with the corticosteroid significantly suppressed pulmonary antibacterial defenses, as more than 17 percent
50
"'"' ~ S. AUREUS wa:
"" 1&'1 P. MIRABILIS ...JO
'""""' • P. PNEUMO. ">" ZCI- p <0.05 ::2wct: u"'" 20 f-:r~ Z><Z
~~~ 15
O::zw ~~a: 10 z....1!3 -oa: wtx:W
5 ul-1-zZ u ~8~
0 ~~~ !:!:wet; c~ > -5
wZ
"' -10
4.0 30.0
N02 CONCENTRATIONS (ppm)
Figure 9. Summary comparison of intrapulmonary killing of S. aureus, P. mirabilis, and P. pneumotropica between mice exposed either to ambient air or to various concentrations of N02 for four hours after bacterial challeuge. The data are presented as the difference in percent change between control and N02-exposed bactericidal values.
60
0 50 0 0 0
-PMNs
R Macrophages
~
j LU ()
"' z :: iil "' ;: :l
BACTERIA None No 2 (ppm) (-)
S. aureus (-) (5)
P. mirabilis (-) (10) (25)
P. pneumo. (-) (10)
K. pneumo.
H (10)
Figure 10. Summary comparison of total and differential counts of cells lavaged from murine lungs at four hours after challenge with either S. aureus, P. mirabi]is, P. pneumotropica, or K. pneumoniae with or without treatment with N02 .

G.J. Jakab
40 S.AUREUS
~Control
• N02 Exposed
• p<0.05
P. 111/RAB/L/S
, 0.0 20.0 30.0
N02 CONCENTRATIONS (ppm)
Figure 11. Comparison of intrapulmonary killing of S. aureus or P. mirabilis between mice exposed to either ambient air (control) or N02 for four hours before bacterial challenge. All animals were exposed to ambient air after bacterial challenge. Each value represents the mean ± SE of 16 to 24 determinations.
of the initial viable staphylococci remained in the lungs of treated animals, while less than 10 percent remained in the lungs of the nontreated control mice. As demonstrated
previously, N02 exposure at 5 and 10 ppm impaired the intrapulmonary killing of staphylococci in a dose-dependent manner, whereas exposures of 1 and 2.5 ppm had no significant effects. In contrast, the combination of corticosteroid treatment and N02 exposure significantly impaired the intrapulmonary killing of S. aureus at 2.5 ppm, and pulmonary bactericidal activity decreased progressively with exposure to increasing concentrations of N02 •
PARTICLE CLEARANCE
In order to determine whether or not short-term N02
exposure altered the physical translocation of particles from the lungs, animals were challenged by aerosol inhalation
with 32P-labeled S. aureus and then exposed for four hours to N02 concentrations of either 10, 15, or 20 ppm. Physical clearance of the bacteria, as determined by decline in radiotracer activity in the lungs, is presented in Figure 14.
Physical removal of radiolabeled staphylococci was not affected by exposure to N02 . Similar amounts of the isotope were recovered from the lungs of control and N02-exposed mice for each of the exposure levels studied. However, as documented previously with unlabeled staphylococcal challenges (Figure 2), pulmonary bactericidal activity decreased progressively with exposures to increasing concentrations of N02 .
Ocontrol
60 ~ N02 Exposed
!g ~ Virus-Infected
lU • Virus & N02 a: 50 :;) q:ln
cri~ wO ..Jl: 40 r::c-.r ~ .... >ct ..J<!l ~z .... --Z z--< u..:::E ow 1-a:: 20 z w u a: w Q. 10
5.0 10.0
N02 CONCENTRATION (ppm)
Figure 12. Comparison of intrapulmonary killing of S. aureus in mice infected with influenza A/PRS/34 virus eight days previously that were exposed to either ambient air or N02 for four hours per day throughout the virus infection. Each value represents the mean ± SE of 20 determinations.
BACTERIAL INFECTION
After bacterial challenge, the organisms used above (S. aureus, P. mirabilis, P. pneumotropica, and K. pneumoniae) are rapidly eliminated from the lungs. Because of this, an
infective process is not established since the intrapulmonary defense mechanisms eliminate the viable bacteria successfully in a relatively short time. In contrast, aerosol exposure of mice to L. monocytogenes establishes a smoldering long-term infection; the viable bacterial population in the lungs does not change appreciably during the first week after exposure, but the organism is slowly eliminated after
that point (Lefford eta!. 1978, 1979; Jakab eta!. 1981). To determine the effect of N02 exposure on pulmonary resistance to L. monocytogenes, mice were exposed to an infectious aerosol of the organism for 30 minutes and then exposed for four hours per day to N02 concentrations of either 10 or 20 ppm. During the remainder of the day the animals were housed in filter-topped stainless-steel cages. At three, five, 10, and 14 days after infection, control and
15

N02 -exposed mice were killed and the viable L. monocytogenes were counted. Figure 15 shows that exposure to N02 concentrations of 10 ppm and 20 ppm for four hours per day had no significant effect on the course of the L. monocytogenes infection.
VIRAL INFECTION
The murine respiratory virus parainfluenza 1 (Sendai) was used to determine whether N02 exposure increases the severity of a respiratory infection that is endogenous to the host (Parker et al. 1964; Parker and Reynolds 1968).
Infectious Pulmonary Virus Titers
Mice were infected by aerosol inhalation with a dose of the virus that induces a moderate pneumonitis from which all of the animals readily recovered. Within one hour of infection, the mice were exposed to N02 for four hours per day for 10 days. In three separate experiments, N02 concentrations of either 5, 10, or 20 ppm were used. At three, five, seven, and ten days after virus infection, groups of five mice were killed, their lung homogenates were pooled, and infectious pulmonary virus titers were determined by standard egg-inoculation techniques.
Figure 16 shows that exposure to N02 concentrations of 5 ppm for four hours per day had no effect on the proliferation and elimination of the infectious virus from the lungs. At the exposure level of 10 ppm, the proliferation of the virus was identical in control and N02-exposed groups. Finally, at levels of 20 ppm, less infectious virus was recovered from the lungs of N02-exposed animals than
I """ cri§ wo -Jl:
~~ ><
5~ !:::z 1!: < 20 U..::li Ow ._a: z w ()
ffi 10 Q.
Ocontrol
l'i:;;] N02 Exposed
fill Cortisone Treated
• Cortisone & N02
Figure 13. Comparison of intrapulmonary killing of S. aureus in mice treated with corticosteroids for four days. Exposure to N02 was for four hours after bacterial challenge. Each value represents the mean ± SE of 10 to 20 determinations.
16
N02 Exposure and Modulation of Pulmonary Defense Mechanisms
from those allowed to breathe ambient air; however, this was overcome by day five. Starting on day four, N02-exposed mice died in ever-increasing numbers. This was expected from preliminary range-finding experiments; therefore, additional mice were included to obtain mortality data in the 20-ppm N02-exposure experiment. Gross examination of the lungs of moribund animals showed massive surface consolidation involving up to 80 percent of the lung surface area.
Lung Wet:Dry Weight Ratios and Albumin in Lung Lavages
Death from viral pneumonitis is associated with overwhelming lung damage that results in pulmonary insufficiency for adequate alveolar gas exchange. The above results of the virus titrations showed that N02 exposure at 5 and 10 ppm did not alter the infective process of the viral pneumonitis, whereas the results of the experiment with exposure to 20 ppm suggested that N02 exposure potentiates lung pathology, a contention supported by the observation that N02 exposure acts as a concomitant inflammatory agent with P. mirabilis (Figures 4 and 5).
In order to determine whether or not N02 exposure altered lung damage during Sendai virus pneumonitis, infected mice were exposed to either 10 or 20 ppm of N02 for four hours per day for eight days. At this time, at the height of the virus-induced pulmonary pathology (Heath 1979) wet:dry weight ratios and the albumin content of the lungs were determined as indices of acute lung damage. Figure 17 (Appendix Q) shows that 10 and 20 ppm of N02 did not increase the lung wet:dry weight ratios upon expo-
rn a: :::>
~ !2 ~ 80
"'"" 5! ~ 70 ;:)(!I "( z Ill~ 60
o(
~~ ~ a: 50 >~ ;;J. ~ 40 Eb ~ ~ 30 z w wo ~ ~ 20 w 1-0.. 0
15 o( a:
N02 (ppm)
AGENT BACT. 32p BACT. 32p BACT. 32p
Figure 14. Comparison of intrapulmonary bacterial killing and radiotracer removal in murine lungs following inhalation challenge with 32P-labeled S. aureus. Each value represents the mean ± SE of 20 to 26 determinations.
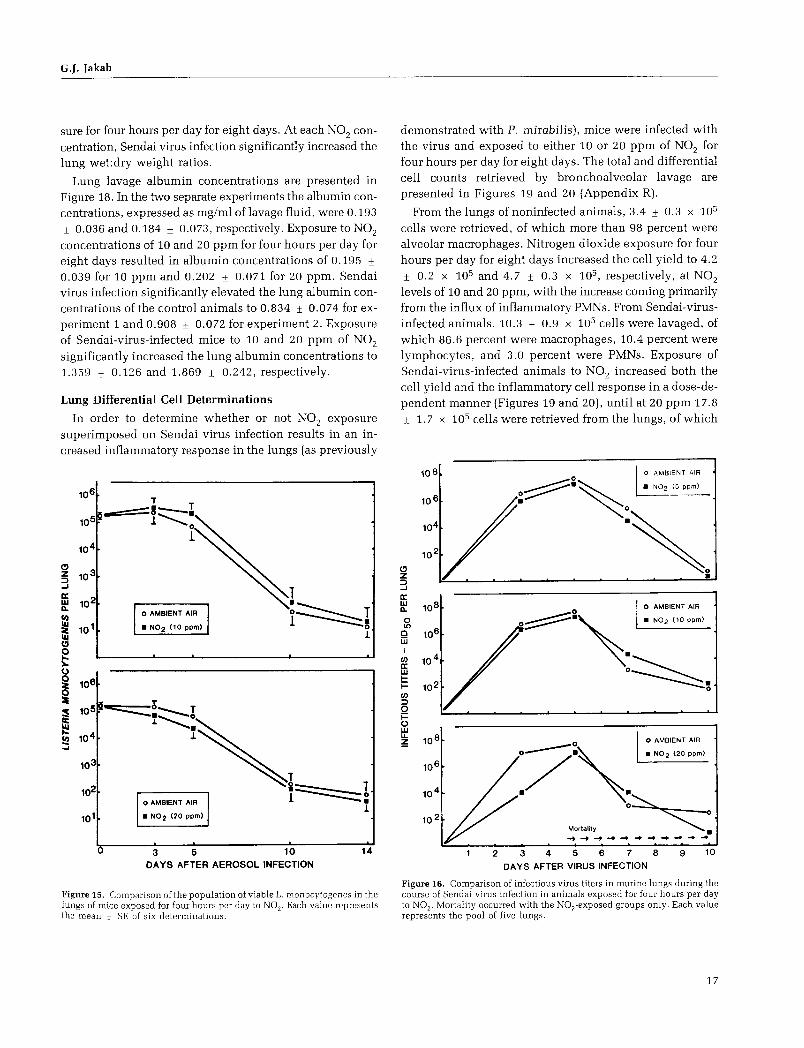
G.J. Jakab
sure for four hours per day for eight days. At each N02 con
centration, Sendai virus infection significantly increased the lung wet:dry weight ratios.
Lung lavage albumin concentrations are presented in Figure 18. In the two separate experiments the albumin concentrations, expressed as mg/ml oflavage fluid, were 0.193
± 0.036 and 0.184 ± 0.073, respectively. Exposure to N02
concentrations of 10 and 20 ppm for four hours per day for eight days resulted in albumin concentrations of 0.195 ± 0.039 for 10 ppm and 0.202 ± 0.071 for 20 ppm. Sendai virus infection significantly elevated the lung albumin concentrations of the control animals to 0.834 ± 0.074 for experiment 1 and 0.908 ± 0.072 for experiment 2. Exposure of Sendai-virus-infected mice to 10 and 20 ppm of N02
significantly increased the lung albumin concentrations to 1.359 ± 0.126 and 1.869 ± 0.242, respectively.
Lung Differential Cell Determinations
In order to determine whether or not N02 exposure superimposed on Sendai virus infection results in an increased inflammatory response in the lungs (as previously
u
T -==s :::::::--~ l .......... 0
1
0 AMBIENT AIR
• N02 (10 ppm)
3 5 10 DAYS AFTER AEROSOL INFECTION
14
Figure 15. Comparison of the population of viable L. monocytogenes in the lungs of mice exposed for four hours per day to N02. Each value represents the mean ± SE of six determinations.
demonstrated with P. mirabilis), mice were infected with the virus and exposed to either 10 or 20 ppm of N02 for four hours per day for eight days. The total and differential cell counts retrieved by bronchoalveolar lavage are presented in Figures 19 and 20 (Appendix R).
From the lungs of noninfected animals, 3.4 ± 0.3 x 10⁵
cells were retrieved, of which more than 98 percent were alveolar macrophages. Nitrogen dioxide exposure for four hours per day for eight days increased the cell yield to 4.2
± 0.2 x 10⁵ and 4.7 ± 0.3 x 10⁵ , respectively, at N02
levels of 10 and 20 ppm, with the increase coming primarily from the influx of inflammatory PMNs. From Sendai-virusinfected animals, 10.3 ± 0.9 x 10⁵ cells were lavaged, of which 86.6 percent were macrophages, 10.4 percent were lymphocytes, and 3.0 percent were PMNs. Exposure of Sendai-virus-infected animals to N02 increased both the cell yield and the inflammatory cell response in a dose-dependent manner (Figures 19 and 20), until at 20 ppm 17.8
± 1. 7 x 10⁵ cells were retrieved from the lungs, of which
(!) z ::> ...J
a: w a.. 0 Ll)
0 w I
en a: w 1-i= en ::> 0 i= () w u. ~
2
0 AMBIENT AIR
·=~. . ""' "" .,., 0~.
0
3 4 8 9 DAYS AFTER VIRUS INFECTION
Figure 16. Comparison of infectious virus titers in murine lungs during the course of Sendai virus infection in animals exposed for four hours per day to N02 . Mortality occurred with the N02 -exposed groups only. Each value represents the pool of five lungs.
17

6.0 Exp. #1 Exp. #2
N02 = 10ppm N02 • 20 ppm
0 ;::: < 5.5 a: 1-J:
"' w ;:: >- 5.0 a: 0 ;::: w ;::
"' z 4.5 ::0 -'
4.0 Amb Air N02 Virus Virus & Amb A~ N0 2 Virus Virus &
(10 ppm) 10 ppm (20 ppm) 20 ppm
N02 N02
Figure 17. Comparison of lung wet: dry weight ratios in mice infected eight days previously with Sendai virus and exposed for four hours per day to N0 2 . Each value represents the mean ± SE of six to eight determinations.
73.1 percent were alveolar macrophages, 12.3 percent were lymphocytes, and 14.6 percent were PMNs.
DISCUSSION
The studies performed herein clearly demonstrate that a four-hour acute exposure to N02 adversely affects the bactericidal activity of the murine lung. However, the concentration of N02 at which this impairment occurs is dependent on the challenge organism, the exposure protocol, and the immunologic status of the host. The threshold level at which N02 exposure caused bactericidal dysfunction was lower when mice were predisposed by treatment with corticosteroids.
Nitrogen dioxide exposures for four hours per day during the course of infection with L. monocytogenes had no effect on the number of viable bacteria recovered from the lungs. Nor did N02 exposures for four hours per day have any effect on the course of murine Sendai virus infection; rather, exposure enhanced the pathogenesis of the viral pneumonitis.
PULMONARY ANTIBACTERIAL DEFENSES
In this study, S. aureus was used as the indicator organism to probe quantitatively the functional integrity of the alveolar macrophage phagocytic system, and P. mirabiJis and K. pneumoniae were used to probe the dual phagocytic system of the lung, consisting of the resident alveolar macrophages and the PMNs newly recruited into the alveoli (Rehm et al. 1979). In addition, bacterial challenge with P. pneumotropica was used to probe the effect of N02 exposure on the phagocytic defense mechanisms of the lungs
18
N02 Exposure and Modulation of Pulmonary Defense Mechanisms
2.0
l 1.5
0
~ 1.0 5 z :1 ::0
~ 0.5 <
Amb Air NO 2 Virus Virus & (10 ppm) 10 ppm
N02
Amb Air NO 2 Virus Virus &
(20 ppm) 20 ppm
N02
Figure 18. Comparison of lung lavage albumin concentrations in mice infected eight days previously with Sendai virus and exposed for four hours per day to N02 . Each value represents the mean ± SE of six determinations.
against a pathogen endogenous to the respiratory tract of the experimental host (Brennan et al. 1969; Jakab and Dick 1973).
Pulmonary antibacterial defenses against S. aureus are primarily dependent on the alveolar macrophages (Goldstein et al. 1974), whereas lung defenses against gram-negative bacteria are dependent on a dual phagocytic system that consists of both alveolar macrophages and PMN s (Pierce et al. 1977; Rehm et al. 1979, 1980). The peripheral phagocyte is not a constituent of the normal lung's murine cell population, but it can immigrate rapidly to the lung in response to gram-negative bacteria, and thus provide additional phagocytic defense capabilities to the lung (Pierce et al. 1977). Failure of PMNs to immigrate to the lungs is associated with a decrease of pulmonary defenses against gram-negative bacteria but not against S. aureus (Rehm et al. 1979; Astry et al. 1983).
Nitrogen dioxide exposure after staphylococcal challenge caused a progressive dose-dependent suppression of bactericidal activity (Figure 2). This impairment was observed in mice exposed to levels of N02 of 5 ppm or greater. It is noteworthy that these results are quantitatively similar to data obtained by Goldstein and associates (1973) in an almost identical system. These workers observed a significant defect in the intrapulmonary killing of S. aureus at an N02 concentration of 7.0 ± 0.3 ppm but not at 3.8 ± 0.5 ppm. In addition, the threshold level observed herein held constant during the three-year study for experiments involving the pulmonary clearance of radiolabeled staphylococci and the pulmonary antibacterial defenses in the predisposed host.
The initial enhancement (followed by the suppression) of pulmonary bactericidal activity against P. mirabilis, by exposure to increasing concentrations of N02 , was unex-

G.J. Jakab
pected (Figure 3). To gain insight into the possible mechanisms of this modulating effect, the lungs of mice were lavaged in order to quantify the phagocytic cell populations. Exposure of P. mirabilis-challenged mice to 10
ppm and 25 ppm of N02 increased the auxiliary (PMN) phagocytic cell population of the lungs nearly twofold over that observed with the bacterial challenge alone (Figures 4 and 5). Nitrogen dioxide exposure alone is known to increase the intraalveolar PMNs obtainable by pulmonary lavage (Gardner eta!. 1969). The results herein demonstrate that N02 acts as a concomitant inflammatory agent in P. mirabilis-challenged lungs. Therefore, a possible explanation for the enhanced bactericidal activity against P. mirabilis at an N02 exposure concentration of 10 ppm may be that the augmented recruitment of phagocytic PMNs into the lungs increased the intrapulmonary killing capabilities. This contention is supported by the observation that recruitment of PMNs into the lungs follows the inhalation of endotoxin (Hudson et a!. 1977) and gramnegative bacteria (Rehm et a!. 1980; Baseler et a!. 1983).
Prior induction of intraalveolar PMNs enhances the intrapulmonary killing of organisms (Rylander et a!. 1975).
Following this line of reasoning, the enhancing effect in bactericidal activity brought about by augmented recruitment of phagocytic cells to the lungs at exposure to 10 ppm of N02 was finally overcome at exposure to 20 ppm, most likely through impairments in the intrinsic phagocytic process itself (Acton and Myrvik 1972; Vassallo et a!. 1973;
Amoruso eta!. 1981; Rietjens eta!. 1986; Suzuki eta!. 1986)
or as a consequence of edema.
In order to determine whether or not the phenomenon of N02 acting as a coinflammatory agent would hold true after challenge with other gram-negative bacteria, a small study was performed with K. pneumoniae. After K. pneumoniae challenge, 13.5 x 10⁵ phagocytic cells were lavaged from the lungs (Figure 6), compared with an approximately threefold increase (37.5 x 10⁵ ) lavaged from lungs challenged with P. mirabilis (Figure 4). Exposure to 10 ppm of N0 2 increased the phagocytic cell yield in K. pneumoniae-challenged lungs to 20.1 x 10⁵ (Figure 6),
compared with 59.4 x 10⁵ in P. mirabilis-challenged lungs (Figure 4). These data show that N02 exposure also acts as a concomitant inflammatory agent after an inhalation challenge with K. pneumoniae. However, the magnitude of the recruited phagocytic inflammatory response after a bacterial challenge, and the subsequent exposure to 10 ppm of N02 , is significantly less than that observed with P. mirabilis. Therefore, the fewer phagocytic cells in the lungs of K. pneumoniae-challenged mice may explain why pulmonary antibacterial defenses were suppressed at exposure to 10 ppm of N02 in the case of K. pneumoniae and enhanced in the case of P. mirabilis.
0 0 0 0 ~ X en ...J ...J w ()
c w C!l < > < ...J
20
18
16
14
12
10
8
6
4
2
• Total Cells
tm Macro phages
Amb Air NO 2 NO 2 Virus ( 1 0 ppm)(20 ppm) Infected
Virus & Virus &
10 ppm 20 ppm
Figure 19. Comparison of total cells and alveolar macrophages lavaged from mice infected eight days previously with Sendai virus and exposed for four hours per day to N02 • Each value represents the mean ± SE of eight determinations.
260
240
220
0 0 q
X 120 en ...J ...J w 100 ()
c w
80 C!l < > < ...J 60
40
20
,~ Lymphocytes
~ PMNs
Amb Air NO 2 NO 2 Virus ( 1 0 ppm) (20 ppm) Infected
Virus & Virus & 10 ppm 20 ppm
1
Figure 20. Comparison of total lymphocytes and PMNs lavaged from mice infected eight days previously with Sendai virus and exposed for four hours per day to N0 2 . Each value represents the mean ± SE of eight determinations.
The modulating effect of exposure to increasing concentrations of N02 was again different when the challenge organism was P. pneumotropica. This organism is endogenous to the respiratory tract flora of many rodent colonies (Brennan eta!. 1969), including the mice used in this study. Exposure to 5, 10, 15, or 20 ppm ofN02 had no statistically significant effect on the intrapulmonary killing
19

of this organism, although at 10 ppm it almost approached significance (27.4 ± 3.0 percent in N02-exposed versus 18.6 ± 3.1 percent in controls; p > 0.05 < 0.1). The bactericidal defect was finally noted at N02 exposure levels of 20 and 30 ppm. Pulmonary lavages showed that N02 exposure concentrations of 10 ppm impaired the recruitment of the auxiliary PMN phagocytic defenses to the lung upon challenge with this bacterium (Figure 8). Following the line of reasoning established previously with P. mirabilis, fewer intraalveolar phagocytic cells may explain the near bactericidal defect against P. pneumotropica at N02 exposure levels of 10 ppm. In addition, contrasted with S. aureus, P. mirabilis, and K. pneumoniae organisms, another host-defense parameter, the antibody, undoubtedly plays a role in pulmonary resistance against P. pneumotropica. Active or passive systemic immunization is known to enhance the intrapulmonary killing of gram-negative bacteria in normal animals (Jakab 1976) and to mitigate the bactericidal defects when pulmonary antibacterial defenses are suppressed (Jakab and Green 1973). Serum antibody transudated into the lungs during the inflammatory process may account for the observation that the final bactericidal defect against P. pneumotropica occurred at exposure levels of 25 ppm of N02 , whereas the defect against P. mirabilis (in those mice that possessed no demonstrable antibody against this organism) occurred at 20 ppm of N02 .
The studies detailed above clearly demonstrate that an acute exposure to N02 for four hours after a bacterial challenge causes dysfunction in pulmonary antibacterial defenses, but that the level at which this defect occurs depends both on the organism used to probe a specific defense parameter and on the N02 concentration (Figure 9). When S. aureus was used to probe the functional activity of the alveolar macrophage phagocytic system, the bactericidal defect was initially observed at exposure concentrations of 5 ppm and a clear dose-response relationship was observed with increasing concentrations. When gramnegative bacteria were used to probe the functional activity of both the resident and auxiliary phagocytic defenses of the lung, the results depended on whether or not the challenge organism recruited additional phagocytic defenses to the lungs and whether the bacterium was exogenous or endogenous to the respiratory tract of the host.
The studies in which the mice were exposed to N0 2 and then challenged with the bacteria were performed to determine whether or not exposure sequence played a role. The effect of exposure to N02 (for four hours prior to the bacterial challenge) on the pulmonary antibacterial defenses depended on the challenge organism. With S. aureus, no bactericidal defect was observed at 5 ppm. However, Goldstein and associates (1973) observed bactericidal dysfunc-
20
N02 Exposure and Modulation of Pulmonary Defense Mechanisms
tion against S. aureus after a 17-hour exposure to 2.3 ± 0.2 ppm of N02 or greater (6.6 ± 0.6 ppm), but not at 1.0 ± 0.1 ppm. Taken together, these results indicate a time-dose relationship in which time may be the more important factor. Exposure concentrations of 10 ppm clearly impaired pulmonary antistaphylococcal activity. However, this defect was not permanent; intrapulmonary killing of S. aureus was again normal in N02-exposed mice that breathed ambient air for 18 hours before the staphylococcal challenge.
Exposure to 20 ppm of N02 after bacterial challenge suppressed the intrapulmonary killing of P. mirabilis, and at 30 ppm the animals succumbed to the toxic effects oftreatment with both N02 and the bacterium (Figure 3). In contrast, preexposure to 20 ppm of N02 had no significant effect on bactericidal activity, whereas preexposure to 30 ppm enhanced the intrapulmonary killing of P. mirabilis. The reason for this enhancement is not known; however, a fourhour preexposure to this high concentration of N02 might injure the lung sufficiently (Gregory et a!. 1983) to predispose it to a greater and more rapid influx of PMNs upon P. mirabilis challenge. The resultant effect would be to provide the lungs with additional phagocytic defenses by increasing the phagocyte:bacteria ratio.
In combination, the studies involving N02 exposure both before and after bacterial challenge with S. aureus and P. mirabilis show that the antibacterial defenses of the lungs are susceptible to the inhibiting effects of short, acute exposures of N02 at lower concentrations when N02 is administered after the lungs have been seeded with the bacteria. This observation was noted previously in our laboratory; studies with similar exposure protocols that used the cigarette-smoke component, acrolein, showed that the bactericidal defect was induced at a lower concentration when acrolein exposure followed bacterial challenge (C. A. Astry and G.J. Jakab, unpublished observations). In addition, preexposure to N02 plus bacterial challenge with our most sensitive bacterial probe, S. aureus, show no residual effect at 18 hours after cessation of exposure to 10 ppm of N02 .
Finally, since the S. aureus challenges did not induce confounding variables brought about by large inflammatory responses into the lungs (Appendix K), an experiment was performed that combined N02 exposure (at a level of 2.5 ppm) both four hours before and after staphylococcal challenge in an attempt to determine whether or not a continuous N02 exposure protocol (with the exception of the 45 minutes required for the bacterial challenge) would lower the threshold dose for the N02-induced bactericidal defect. This experiment was essentially negative (Appendix N): Exposure to 2.5 ppm of N02 both before and after bacterial challenge caused no alterations in the intrapulmonary kill-

G.J. Jakab
ing of S. aureus, compared with the control mice that were exposed simultaneously to N02 either before or after the staphylococcal challenge. In the context of the studies of Goldstein and coworkers (1973), who observed a suppression of intrapulmonary killing of S. aureus after a 17-hour prechallenge exposure to 2.3 ± 0.2 ppm of N02 followed by ambient air, the combined data again indicate a timedose relationship in which the period of exposure appears to be the more important factor.
PULMONARY PARTICLE CLEARANCE
Previous studies by Goldstein and colleagues (1973), in which aerosol challenges with 32P-labeled S. aureus were used to evaluate the effect of N02 on the rate of physical transport from the murine lungs (as quantified by decline in radiotracer activity), found no effect on 32P removal at N02 exposure levels ranging from 1.9 ± 0.3 ppm to 14.8 ± 0.3 ppm. In our study, we overlapped and expanded these studies and found that the physical removal rates were not altered by exposures to N02 concentrations up to 20 ppm. In contrast, as observed previously with unlabeled staphylococcal challenges, N02 exposure caused a clear dose-related defect in pulmonary antibacterial defenses. These data emphasize that in terms of protection against infectious agents, in situ bactericidal destruction by the intrapulmonary phagocytic defense system is the dominant mechanism, rather than mechanical removal by the physical translocation systems (Green et al. 1977).
PULMONARY ANTIBACTERIAL DEFENSES IN THE PREDISPOSED HOST
Under normal conditions, inhaled bacteria are rapidly killed in murine lungs. However, exposure to environmental contaminants, therapeutic agents, viral infections, and various other stresses suppresses the antibacterial activity of the lungs (reviewed in Huber et al. 1977). To determine if an underlying condition increased the susceptibility of murine lungs to the detrimental effects of N02 at levels lower than those observed in normal mice, influenza virus infection and corticosteroid treatment were used as the predisposing factors.
Virus-associated secondary bacterial infections are of important clinical significance, especially during influenza epidemics (Martinet al. 1959; Loosli 1967, 1973; Jarstrand and Tunevall 1974). Experimental studies have shown that during the acute phase of the viral infection, the bactericidal mechanisms of the lung become progressively depressed, with maximal suppression occurring approximately a week after viral infection (Green 1966; Jakab 1974). Thereafter, the antibacterial defenses of the lung become reestablished,
and they are essentially normal by the end of the second week of infection. This impairment of pulmonary antibacterial defenses is associated with dysfunctions of the alveolar macrophage phagocytic system (Couch 1981; Jakab 1981b, 1986). Corticosteroid treatment is also known to suppress the antibacterial defenses of the lungs (Green and Kass 1964a; Pennington 1978; Blackwood and Pennington 1982; Nugent and Pesanti 1982).
In our study, both influenza virus infection and corticosteroid treatment suppressed the intrapulmonary killing of S. aureus (Figures 12 and 13). In addition, as observed previously, pulmonary bactericidal activity in noninfected and untreated control animals were suppressed at N02
exposure levels of 5 ppm and greater. Nitrogen dioxide exposure superimposed on the virus infection had no effect on the intrapulmonary killing of staphylococci at 5 ppm of N02 , but at 10 ppm it significantly contributed to the virus-induced bactericidal defect. In contrast, the combination of corticosteroid treatment and N02 exposure significantly impaired the intrapulmonary killing of S. aureus at concentrations lower (between 1 and 2.5 ppm) than that observed in normal animals (5 ppm).
The reason that one predisposing factor (corticosteroid treatment) makes the lungs hypersusceptible to the toxic effects of N02 , whereas the other predisposing factor (virus infection) does not, is not known. Previously, in similar experiments, we had to use large concentrations of the cigarette-smoke component, acrolein, to demonstrate a combined effect of virus infection and acrolein exposure on pulmonary antibacterial defenses (Jakab 1977; Astry and Jakab 1983). It is possible that differences in the cellular composition of the alveolar regions of the lungs during the time of exposure to N02 might have contributed to these results.
Virus infections of the murine lungs result in a dynamic inflammatory response. For example, on the eighth day of the infection, up to six times as many phagocytic cells can be lavaged from virus-infected lungs as from the lungs of noninfected control animals (Wyde et al. 1978, 1982; Warr and Jakab 1983). These additional phagocytes could be available to ingest and kill bacteria.
In contrast to the recruitment of inflammatory cells to virus-infected lungs, corticosteroid treatment reduces the pulmonary cell population (Pennington 1978) and the inflammatory response to the lungs after a bacterial challenge with the gram-negative organism Pseudomonas aeruginosa (Pennington 1977), but not after a challenge with staphylococci (Nugent and Pesanti 1982). Therefore, virus infection may provide the necessary phagocyte:bacteria ratio that would not be altered by a superimposed exposure to
21

5 ppm of N02 . In contrast, corticosteroids could reduce alveolar macrophage phagocytic function, thereby predisposing the antibacterial defenses of the lung to a lower concentration of N02 than would be true for the lungs of the untreated host.
Although the mechanisms of reduced phagocytic function need to be elucidated, the implications of the corticosteroid studies are clear. An underlying host defect involving lung defenses rendered the lung hypersusceptible to the effects of N02 • The influence of an altered host status on lung susceptibility to infection after N02 exposure is poorly understood; however, these findings point the way toward the analysis of other populations that may be at high risk (Pennington 1984) when exposed to pollutant gases through the numerous animal models of immunosuppression (Pennington 1985), chronic lung damage (Snider et al. 1986), and old age (Esposito and Pennington 1983).
BACTERIAL INFECTION
L. monocytogenes has been used previously as a test organism to determine the systemic toxicity of benzene (Rosenthal and Snyder 1985) and formaldehyde (Dean et al. 1984) inhalation. In this study, the organism was used to evaluate the pulmonary resistance of the host to the effects of N02 • The results show that high levels of exposure to N02 (10 and 20 ppm) for four hours per day during the two-week infection period did not alter the infective process in the lungs.
Resistance against L. monocytogenes is more complex than that against the other bacterial agents studied herein. Host defenses against S. aureus depend solely on the alveolar macrophage phagocytic system (Goldstein et al. 1977a), and resistance toP. mirabilis and K. pneumoniae depends on the dual phagocytic system of the lungs (both alveolar macrophages and inflammatory PMNs) (Rehm et al. 1979), which, in the case of P. pneumotropica, is augmented by a specific antibody. Resistance against L. monocytogenes is dependent on alveolar macrophages, PMNs, and cell-mediated immunity. Immediately after infection, this facultative gram-negative intracellular bacterium can be found in alveolar macrophages, and within hours it can be found in inflammatory PMNs (G.A. Warr and G.J. Jakab, unpublished observations). For approximately five days thereafter, the viable bacterial population in the lungs does not appreciably alter. This could be because the organism is not killed or, more likely, because a balance is achieved between intracellular multiplication and killing. Yet, although the proliferation of the organism is controlled, these nonspecific defenses cannot eliminate the organism from the lungs, as specific (immunologic) defenses
22
N02 Exposure and Modulation of Pulmonary Defense Mechanisms
are required for the intrapulmonary elimination of L. monocytogenes (Truitt and Mackaness 1971; Lefford et al. 1979; Harrington-Fowler et al. 1981; Miyata et al. 1982). One possible mechanism for the elimination of Listeria organisms from the lung might be that during the early phases of the infection, the nonspecific phagocytic defenses keep the organism from multiplying extensively in the lungs. Therefore, there is sufficient time for the host to mount the cell-mediated immune response. This specific response consists ofT-lymphocytes that interact with the alveolar macrophages through soluble mediators, thus increasing the phagocytic microbicidal activity that subsequently eliminates the organism from the lungs.
An interesting trend appears to be emerging from the data on the various bacteria used in these studies: The more complex the functional resistance mechanism to a bacterium, the higher the dose of N02 required to impair defenses against that bacterium. Thus, 5 ppm of N02 affects the alveolar macrophage phagocytic system (S. aureus studies), whereas the combined phagocytic system involving the alveolar macrophages and PMNs shows an adverse effect at N02 concentrations of 10 ppm or greater (P. mirabilis, K. pneumoniae, and P. pneumotropica studies). When cellmediated immunity is added to the dual phagocytic system (L. monocytogenes), an adverse effect on functional resistance against this organism will require in excess of 20 ppm of N02 . This also appears to be the case during Sendai virus infection, since the data indicate that exposure to 20 ppm of N02 does not alter the infective process, but it does increase the severity of the disease through increased lung pathology (discussed below).
VIRAL INFECTION
Few studies have been performed of the effects of N02 on resistance to viral infection (Henry et al. 1970; Fenters et al. 1973, 1979; Motomiya et al. 1973), as the bulk of the studies have been performed with bacteria. For example, Henry and associates (1970) found that the infection of squirrel monkeys with influenza virus 24 hours before exposure to 10 ppm of N02 was fatal to all monkeys within three days. Infected control animals showed symptoms of viral infection, but they did not succumb to the infection. Exposure to 5 ppm of N0 2 after viral infection resulted in death in one of three monkeys.
In this study, we used parainfluenza 1 (Sendai) virus infection to examine the effect of N02 exposure on resistance to infection with a pathogen endogenous to the host (Parker et al. 1964; Ward 1974). The rationale for using Sendai virus was that studies of the effects of air pollutants on resistance

G.J. Jakab
to viral infection have used infection with human isolates of influenza virus, or mouse-adapted strains of influenza virus, such as influenza A/PR8/34. These viruses are not natural pathogens to the experimental host; consequently, the relevance of these studies to the effects of air pollution on infection with a human pathogen has been questioned.
The data (Figure 16) show that exposure to N02 concentrations of 5, 10, and 20 ppm for four hours per day did not increase infectious pulmonary virus titers. At exposure concentrations of 20 ppm, the mice began to die in increasing numbers from the fourth day of infection. To gain insight into the cause ofthe deaths, lung wet: dry weight ratios, lung lavage albumin content, and the inflammatory cell response in the lungs were used as indices of pathologic manifestation. In combination, the data show that N02 exposure does not alter the growth and elimination of infectious virus in the lungs. This suggests that N02 does not affect the infectious process, which involves the control and elimination of the virus infection by nonspecific (interferon) and specific (immunologic) defense mechanisms. However, there is another aspect to consider in pulmonary virus infections, namely, the resultant lung damage. Sendai virus infections result in progressive pathologic changes of murine lungs (Robinson et al. 1968). The studies reported here show that N02 increases the severity of the disease process through increased lung damage, rather than through alteration of the infective process.
Whether or not N02 exposure can also increase the infective process cannot be established from these data. Virus proliferation in the lungs, and the ensuing lung damage, is virus-dose dependent (Nayak and Kelley 1965; Jakab 1975). We used a dose of virus that resulted in the proliferation of the virus to high titers and caused moderate-tosevere pneumonitis. Whether N02 exposure would increase the infective process with a lesser virus inoculum, which would result in lower pulmonary virus titers and a milder pneumonia, remains to be determined.
Finally, it should be remembered that virus infection with either Sendai or influenza A/PR8/34 virus involves pneumonitic processes in the lung parenchyma, whereas the majority of viral infections in humans involve the upper respiratory tract. No adequate models are available in rodents to readily test the hypothesis that N02 exposure increases susceptibility to viral infections of the upper respiratory tract. Human volunteer studies must be undertaken to explore this hypothesis, such as those performed by Dr. Thomas Kulle of the University of Maryland, Baltimore, MD, under the auspices of the Health Effects Institute.
IMPLICATIONS OF THE FINDINGS
The goal of this work was to determine the threshold level of acute N02 exposure that would induce increased susceptibility to, and increased severity of, bacterial and viral respiratory infections. Physiologic parameters of resistance to respiratory infections were used as endpoints. This aim was accomplished through bacterial and viral challenges of the lungs that provided a composite picture of the doseresponse relationship between acute exposures to N02 and impairment of a spectrum of respiratory defense parameters.
This work can be viewed as a transitional study between those investigations that used inhalation challenges with lethal infectious agents and those that are more germane to air pollution issues related to public health, namely, infectious agents that may lead to acute and chronic illness. Our approach used inhalation challenges with bacteria that are nonlethal by replication, which allowed us to characterize the effect of exposures to N02 through physiologic abnormalities such as suppression of intrapulmonary killing of organisms. The results form the necessary data base upon which specific questions can be formulated for future studies regarding the effect of exposure to N02
on resistance to infections of the respiratory tract.
First, the experiments with the gram-positiveS. aureus and the gram-negative bacteria unraveled some of the confounding variables in the study of resistance mechanisms of the lungs and how they are modulated by exposures to N0 2 .
Second, the experiments with staphylococci showed that the alveolar macrophage phagocytic system, as quantified by the intrapulmonary killing of S. aureus, is the defense component of the lungs most susceptible to the adverse effects of N02 . A four-hour exposure to 5 ppm of N02 impaired the intrapulmonary killing of this organism.
Third, the experiments involving N02 exposure for four hours both before and after bacterial challenge with S. aureus show that pulmonary defenses are more susceptible to the adverse effect of N02 when the lung is already seeded with the organism. When N02 exposure both before and after bacterial challenge was examined at 2.5 ppm, the threshold dose for the adverse effect of N02 was not reduced.
Fourth, the corticosteroid experiments show an adverse effect of between 1 and 2.5 ppm of N02 on the intrapulmonary killing of S. aureus when N02 exposure is superimposed on immunosuppressed animals, compared with the 5 ppm of N02 needed for an adverse effect in
23

untreated animals. These results demonstrate that the predisposed host is hypersusceptible to the adverse effects of N02 • The implication of this finding is the probable existence of a high-risk population (because of immunosuppression, chronic lung damage, or old age) whose altered host status makes them more susceptible to infection after exposure to N02 (Green 1972).
Fifth, the studies with Sendai virus clearly show that exposure to N02 increases lung damage during virus pneumonia. Although this finding is a short-term sequela of virus infection and N02 exposure, long-term lung damage can also result from virus pneumonitis and exposure to air pollutants. For example, mice infected with influenza A/PR8/34 and continuously exposed to 0.5 ppm of ozone showed enhanced development of pulmonary fibrosis (Jakab 1988). Since childhood infections may be associated with increased risk of adult lung disease (Kattan 1979), these experimental studies indicate that concern should be given not only for the effect of N02 exposure on the short-term morbidity of the infectious episode, but also for the longterm noninfectious sequelae that may manifest themselves in the epidemic of chronic adult lung disease.
The current U.S. National Ambient Air Quality Standard for N02 is 0.05 ppm for the annual arithmetic mean of 24-hour values. Average 24-hour N02 concentrations vary widely, and can commonly reach from 0.05 ppm to 0.2 ppm, with some cities reaching short-term spikes as high as 0.5 ppm. The concentration of N0 2 that gave acute effects in this study (5 ppm) is substantially higher than the acceptable standards. However, pure N02 , in the absence of copollutants, probably exists only in laboratory situations. Moreover, the effective concentration could be reduced to less than one-half this concentration in immunosuppressed animals, suggesting that defects in host resistance may render subgroups of one population more susceptible to the adverse effects of N02 . There is virtually no information on the subgroups that might be implicated. Humans are undoubtedly exposed to N0 2 in complex mixtures of atmospheric contaminants. For this reason, the health effects of air pollution cannot be attributed to a single agent alone, as interactions need to be taken into consideration (Green 1972; Goldstein eta!. 1974; Ehrlich eta!. 1977; Illing eta!. 1980).
In the studies reported here, we have established a model to evaluate the effects of N02 on pulmonary resistance mechanisms against infections, and we have provided the necessary data base for the further exploration of this model. The new information presented here indicates a divergence of effects of N0 2 on gram-positive and gram-negative bacteria, as well as on viruses. Our results provide initial clues as to which types of infections might be expected in
24
N02 Exposure and Modulation of Pulmonary Defense Mechanisms
an N02-exposed population, as well as which elements of the population might be at increased risk. The results, therefore, provide leads for more in-depth research concerning the defenses of the lung likely to be affected by N02 ,
as well as those that appear more resistant.
ACKNOWLEDGMENTS
I would like to thank Dr. Robert Frank for his time in helping me put this work into perspective.
REFERENCES
Acton JD, Myrvik QN. 1972. Nitrogen dioxide effects on alveolar macrophage. Arch Environ Health 24:48-52.
Ada GL, Leung KN, Ertl H. 1981. An analysis of effector T cell generation and function in mice exposed to influenza or Sendai viruses. Immunol Rev 58:5-24.
Amoruso MA, Witz G, Goldstein BD. 1981. Decreased superoxide anion radical production by rat alveolar macrophages following inhalation of ozone or nitrogen dioxide. Life Sci 28:2215-2221.
Andersen AA. 1958. New sampler for the collection, sizing, and enumeration of viable airborne particles. J Bacterial 76:471-484.
Appell LH, Kovatch RM, Reddcliff JM. 1971. Pathogenesis of Sendai virus infection in mice. Am J Vet Res 32:1835-1841.
Aranyi C, Fenters J, Ehrlich R. 1975. Scanning electron microscopy of alveolar macrophages after exposure to 0 2 ,
N02 , and 0 3 . Environ Health Perspect 16:180-187.
Astry CL, Jakab GJ. 1983. The effects of acrolein exposure on pulmonary antibacterial defenses. Toxicol Appl Pharmacal 67:49-54.
Astry CL, Warr GA, Jakab GJ. 1983. Impairment of polymorphonuclear leukocyte immigration as a mechanism of alcohol-induced suppression of pulmonary antibacterial defenses. Am Rev Respir Dis 128:113-117.
Baseler MW, Fogelman B, Burrell R. 1983. Differential toxicity of inhaled gram-negative bacteria. Infect Immun 40:133-138.
Bauer MA, Utell MJ, Morrow PE, Speers DM, Gibb FR. 1986. Inhalation of 0. 30 ppm nitrogen dioxide potentiates exercise-induced bronchospasm in asthmatics. Am Rev Respir Dis 134:1204-1208.
G.J. Jakab
Blackwood LL, Pennington JE. 1982. Dose-dependent effect of glucocorticocosteroids on pulmonary defenses in a steroid-resistant host. Am Rev Respir Dis 126:1045-1049.
Book SA. 1982. Scaling toxicity from laboratory animals to people: An example with nitrogen dioxide. J Toxicol Environ Health 9:719-725.
Bouhuys AS, Beck GL, Schoenberg JB. 1978. Do present levels of air pollution outdoors affect respiratory health? Nature 276:466-471.
Brennan PC, Fritz TE, Flynn RJ. 1965. Pasteurella pneumotropica: Cultural and biochemical characteristics, and its association with disease in laboratory animals. Lab Anim Care 15:307-312.
Brennan PC, Fritz TE, Flynn RJ. 1969. Role of Pasteurella pneumotropica and Mycoplasma pulmonis in murine pneumonia. J Bacterial 97:337-349.
Buckley RD, Loosli CG. 1969. Effects of nitrogen dioxide inhalation on germ-free mouse lungs. Arch Environ Health 18:588-595.
California Air Resources Board. 1983. California Air Quality Data, Vol. 15, 1983 Annual Summary. Sacramento, CA.
Charlton D, Blandford G. 1977. Immunoglobulin classspecific antibody response in serum, spleen, lungs, and bronchoalveolar washings after primary and secondary Sendai virus infection of germ-free mice. Infect Immun 17:521-527.
Coffin D, Bloomer E. 1967. Acute toxicity of irradiated auto exhaust: Its indication by enhancement of mortality from streptococcal pneumonia. Arch Environ Health 15:36-38.
Coffin D, Gardner DE. 1972. Interaction of biologic agents and chemical air pollutants. Ann Occup Hyg 15:219-234.
Cohen CA, Hudson AR, Clausen JL, Knelson JH. 1972. Respiratory symptoms, spirometry, and oxidant air pollution in nonsmoking adults. Am Rev Respir Dis 105:251-261.
Colucci AV, Hammer DI, Williams ME, Hinners TA, Pinkerton C, Kent JL, Love GJ. 1973. Pollutant burdens and biologic response. Arch Environ Health 27:151-154.
Couch RB. 1981. The effects of influenza on host defenses. J Infect Dis 144:284-291.
Dean JH, Lauer LD, House RV, Murray MJ, Stillman WS, Irons RD, Steinhagen WH, Phelps MC, Adams DO. 1984. Studies of immune function and host resistance in B6C3F1 mice exposed to formaldehyde. Toxicol Appl Pharmacal 72:519-529.
Ehrlich R. 1963. Effect of air pollutants on respiratory infection. Arch Environ Health 6:638-642.
Ehrlich R. 1966. Effect of nitrogen dioxide on resistance to respiratory infection. Bacterial Rev 3 0:604-614. Ehrlich R. 1980. Interaction between environmental pollutants and respiratory infections. Environ Health Perspect 35:89-99.
Ehrlich R, Findlay JC, Fenters FD, Gardner DE. 1977. Health effects of short-term inhalation of nitrogen dioxide and ozone mixtures. Environ Res 14:223-231.
Ehrlich R, Findlay JC, Gardner DE. 1979. Effects of repeated exposures to peak concentrations of nitrogen dioxide and ozone on resistance to streptococcal pneumonia. J Toxicol Environ Health 5:631-642.
Ehrlich R, Henry MC. 1968. Chronic toxicity of nitrogen dioxide: I. Effect on resistance to bacterial pneumonia. Arch Environ Health 17:860-865.
Ennis A. 1982. Some newly recognized aspects of resistance against and recovery from influenza. Arch Viral 73:207-217.
Esposito AL, Pennington JE. 1983. Effects of aging on antibacterial mechanisms in pneumonia. Am Rev Respir Dis 128:662-667.
Fenters JD, Ehrlich R, Findlay J, Spangler J, Tolkacz V. 1979. Serologic response in squirrel monkeys exposed to nitrogen dioxide and influenza virus. Am Rev Respir Dis 104:448-451.
Fenters JD, Findlay JC, Port CD, Ehrlich R, Coffin DL. 1973. Chronic exposure to nitrogen dioxide: Immunologic, physiologic, and pathologic effects in virus-challenged squirrel monkeys. Arch Environ Health 27:85-89.
Ferris BG. 1978. Health effects of exposure to low levels of regulated air pollutants: A critical review. J Air Pollut Control Assoc 28:482-497.
Fischer P, Remijin B, Brunekreef B, Van Der Lende R, Schouten J, Quanjer P. 1985. Indoor air pollution and its effect on pulmonary function of adult nonsmoking women: II. Associations between nitrogen dioxide and pulmonary function. Int J Epidemiol 14:221-226.
Florey C du V, Melia RJW, Chinn S, Goldstein BD, Brooks AGF, John HH, Craighead IB, Webster X. 1979. The relationship between respiratory illness in primary schoolchildren and the use of gas for cooking: III. Nitrogen dioxide, respiratory illness, and lung function. Int J Epidemiol 8:347-353.
Florey C du V, Melia RJW, Morris R, John HH, Clark JD. 1982. The epidemiology of indoor nitrogen dioxide in the U.K. In: Luftqualitat in Inneraumen (Aurand K, Seifert B, Wegner J, eds.). Gustav Fisher Verlag, New York, NY.
25

Fontinin A, Sabadell AJ, Ronco RJ. 1970. Homogeneous chemiluminescent measurement of nitric oxide with ozone. Anal Chern 42:575-579.
Freeman G, Juhas LT, Furiosi NJ, Mussenden R, Stephens RJ, Evans MJ. 1974. Pathology of pulmonary disease from exposure to interdependent ambient gases (nitrogen dioxide and ozone). Arch Environ Health 29:203-210.
Garattini S. 1986. Toxic effects of chemicals: Difficulties in extrapolating data from animals to man. CRC Crit Rev Toxicol 16:1-29.
Gardner DE. 1984. Oxidant-induced enhanced sensitivity to infection in animal models and their extrapolations to man. J Toxicol Environ Health 13:423-439.
Gardner DE, Graham JA. 1972. Increased pulmonary disease mediated through altered bacterial defenses. In: Pulmonary Macrophage and Epithelial Cells (Sanders CL, Schneider RD, Dagle GE, Ragan HA, eds.) pp.1-21. Proceedings of the 16th Annual Hartford Biology Symposium, Richland, WA.
Gardner DE, Holzman RS, Coffin DL. 1969. Effects of nitrogen dioxide on pulmonary cell population. J Bacterial 98:1041-1043.
Giordano AM, Morrow PE. 1972. Chronic low-level nitrogen dioxide exposure and mucocilliary clearance. Arch Environ Health 25:443-449.
Goldstein BD, Melia RJW, Chinn S, Florey C du V, Clark D, John HH. 1979. The relationship between respiratory illness in primary schoolchildren and the use of gas for cooking: II. Factors affecting nitrogen dioxide levels in the home. Int J Epidemiol 8:339-345.
Goldstein BD, Melia RJW, Florey C du V. 1981. Indoor nitrogen oxides. Bull NY Acad Med 57:873-882.
Goldstein E. 1983. Hydrolytic enzymes of alveolar macrophages. Rev Infect Dis 5:1078-1092.
Goldstein E. 1984. An assessment of animal models for testing the effect of photochemical oxidants on pulmonary susceptibility to bacterial infection. J Toxicol Environ Health 13:415-421.
Goldstein E, Eagle CM, Hoeprich PD. 1973. Effect of nitrogen dioxide on pulmonary bacterial defense mechanisms. Arch Environ Health 26:202-204.
Goldstein E, Jordan GW, MacKe=ie MR. 1976. Methods for evaluating the toxicological effects of gaseous and particulate contaminants on pulmonary microbial defense systems. Ann Rev Pharmacal Toxicol 16:447-463.
Goldstein E, Lippert W, Warshauer D. 1977a. Pulmonary alveolar macrophage: Defender against bacterial infection of the lung. J Clin Invest 54:519-528.
26
N02 Exposure and Modulation of Pulmonary Defense Mechanisms
Goldstein E, Warshauer D, Lippert W, Tarkington B. 1974. Ozone and nitrogen dioxide exposure on murine pulmonary defense mechanisms. Arch Environ Health 28:85-90.
Green GM. 1966. Patterns of bacterial clearance in murine influenza. Antimicrob Agents Chemother 1966:26-29.
Green GM. 1972. Host variables in pulmonary responses to the environment. In: Environmental Factors in Respiratory Disease (Lee DHK, ed.). Academic Press, Orlando, FL.
Green GM. 1984. Similarities of host defense mechanisms against pulmonary infectious diseases in animals and man. J Toxicol Environ Health 13:471-478.
Green GM, Goldstein E. 1966. A method for quantitating intrapulmonary bacterial inactivation in individual animals. J Lab Clin Med 68:669-775.
Green GM, Jakab GJ, Low RB, Davis GS. 1977. Defense mechanisms of the respiratory membrane. Am Rev Respir Dis 115:479-514.
Green GM, Kass EH. 1964a. Factors influencing the clearance of bacteria by the lung. J Clin Invest 43:679-776.
Green GM, Kass EH. 1964b. The role of the alveolar macrophage in the clearance of bacteria from the lungs. J Exp Med 119:167-176.
Gregory RE, Pickrell JA, Hahn FF, Hobbs CH. 1983. Pulmonary effects of intermittent subacute exposure to lowlevel nitrogen dioxide. J Toxicol Environ Health 11:405-414.
Hadley JG, Gardner DE, Coffin DL, Menzel DB. 1977. Enhanced binding of autologous red cells to the macrophage plasma membrane as a sensitive indicator of pollutant damage. In: Pulmonary Macrophage and Epithelial Cells (Sanders CL, Schneider RD, Dagle GE, Ragan HA, eds.) pp. 66-77. Proceedings of the 16th Annual Hartford Biology Symposium, Richland, WA.
Harrington-Fowler L, Henson PM, Wilder MS. 1981. Fate of Listeria monocytogenes in resident and activated macrophages. Infect Immun 33:11-16.
Hattori S, Takemura K. 1974. Ultrastructural changes in the bronchiolar alveolar system caused by air pollution and smoking. J Clin Electron Microsc 6:350-361.
Hazucha MH, Ginsberg JF, Me Donnell WF, Haak ED, Pimmel RL, Salaam SA, House DE, Bromberg PA. 1983. Effects of 0.1 ppm nitrogen dioxide on airways of normal and asthmatic subjects. J Appl Physiol 54:730-739.
Heath RB. 1979. The pathogenesis of respiratory viral infection. Postgrad Med 55:122-127.
Hemenway DR, Carpenter RL, Moss OR. 1982. Inhalation toxicology chamber performance: A quantitative model. Am Ind Hyg Assoc J 43:120-127.

G.J. Jakab
Hemenway DR. Jakab GJ. 198 7. The monitoring and generation of standard atmospheres of nitrogen dioxide for inhalation studies: Problems and solutions. Appl Ind Hyg 2:18-23.
Hemenway DR, MacAskill SM. 1982. Design, development and test results of a horizontal flow inhalation toxicology chamber. Am Ind Hyg Assoc J 43:874-879.
Henderson DR. 1952. An apparatus for the study of airborne infection. J Hyg (Camb) 50:53-68.
Henry MC, Ehrlich R, Blair WH. 1969. Effect of nitrogen dioxide on resistance of squirrel monkeys to Klebsiella pneumoniae infection. Arch Environ Health 18:580-587.
Henry MC, Findlay J, Spangler J, Ehrlich R. 1970. Chronic toxicity of N02 in squirrel monkeys: III. Effects on resistance to bacterial and viral infection. Arch Environ Health 20:566-570.
Hoek G, Brunekreef B, Meijer R, Scholten A, Boleij J. 1984a. Indoor nitrogen dioxide pollution and respiratory symptoms of schoolchildren. Int Arch Occup Environ Health 55:79-86.
Hoek G, Meijer R, Scholten A, Noij D, Lebret E. 1984b. The relationship between indoor nitrogen dioxide concentration levels and personal exposure: A pilot study. Int Arch Occup Environ Health 55:73-78.
Hoshino A, Takenaka H, Mizukoshi 0, Imanishi J, Kishida T, Tovey MG. 1983. Effect of anti-interferon serum of influenza virus infection in mice. Antiviral Res 3:59-65.
HuberGL, LaForce MF, Johanson WG Jr. 1977. Experimental models and pulmonary antimicrobial defenses. In: Respiratory Defense Mechanisms, Part 2 (Brain JD, Proctor DF, Reid LM, eds.). Marcel Dekker, New York, NY.
Hudson AR, Kilburne KH, Halprin GM, McKenzie WN. 1977. Granulocyte recruitment to airways exposed to endotoxin aerosols. Am Rev Respir Dis 115:89-95.
Hughes EE, Rook HL, Deardorff ER, Margeson JH, Fuerst RH. 1977. Performance of a nitrogen dioxide permeation device. Anal Chern 10:1823-1829.
Illing JW, Miller FJ, Gardner DE. 1980. Decreased resistance to infection in exercised mice exposed to N02 and 0 3 . J Toxicol Environ Health 6:843-851.
Jakab GJ. 1974. Effect of sequential inoculation of Sendai virus and Pasteurella pneumotropica in mice. JAm Vet Med Assoc 164:723-728.
Jakab GJ. 1975. Suppression of pulmonary antibacterial activity following Sendai virus infection in mice: Dependence on virus dose. Arch Viral 48:385-390.
Jakab GJ. 1976. Factors influencing the immune enhancement of intrapulmonary bactericidal mechanisms. Infect Immun 14:389-398.
Jakab GJ. 1977. Adverse effect of a cigarette smoke component (acrolein) on pulmonary antibacterial defenses and on viral-bacterial interaction in the lung. Am Rev Respir Dis 115:33-38.
Jakab GJ. 1980. Nitrogen dioxide-induced susceptibility to acute respiratory illness: A perspective. Bull NY Acad Med 56:847-855.
Jakab GJ. 1981a. Interaction between Sendai virus and bacterial pathogens in the murine lung: A review. Lab Anim Sci 31:170-177.
Jakab GJ. 1981b. Mechanisms of virus-induced bacterial superinfections of the lung. Clin Chest Med 2:59-66.
Jakab GJ. 1986. Mechanisms of bacterial superinfections in viral pneumonias. Schweiz Med Wochenschr 115:75-86.
Jakab GJ. 1988. Influenza virus, ozone and fibrogenesis (abstract). Am Rev Respir Dis 137:166a.
Jakab GJ, Dick EC. 1973. Synergistic effect in viral-bacterial infection: Combined infection of the murine respiratory tract with Sendai virus and Pasteurella pneumotropica. Infect Immun 8:762-768.
Jakab GJ, Green GM. 1972. The effect of Sendai virus infection on bactericidal and transport mechanisms of the murine lung. J Clin Invest 51:1989-1998.
Jakab GJ, Green GM. 1973. Immune enhancement of pulmonary bactericidal activity in murine virus pneumonia. J Clin Invest 52:2878-2884.
Jakab GJ, Warr GA, Astry CL. 1981. Alterations of pulmonary defense mechanisms by protein depletion diet. Infect Immun 34:610-622.
Jarstrand C, Tunevall G. 1974. The significance of bacterial superinfection in influenza. Scand J Infect Dis 6:137-144.
Jay SJ, Johanson WG Jr, Pierce AK, Reisch JS. 1976. Determinants of lung bacterial clearance in normal mice. J Clin Invest 57:811-817.
Kattan M. 1979. Long-term sequelae of respiratory illness in infancy and childhood. Pediatr Clin North Am 26:525-535.
Keller MD, Lanese RR, Mitchell RI, Cote RW. 1979a. Respiratory illness in households using gas and electricity for cooking: I. Survey of incidence. Environ Res 19:495-503.
Keller MD, Lanese RR, Mitchell RI, Cote RW. 1979b. Respiratory illness in households using gas and electricity for cooking: II. Symptoms and objective findings. Environ Res 19:504-515.
Kim M, Goldstein E, Lewis JP, Lippert W, Warshauer D. 1976. Murine pulmonary alveolar macrophage: Rates of bacterial ingestion, inactivation, and destruction. J Infect Dis 133:310-320.
27

Kleinman MT, Bailey RM, Linn WS, Anderson KR, Whynot JD, Shamoo DA, Hackney JD. 1983. Effect of 0.2 ppm nitrogen dioxide on pulmonary function and response to bronchoprovocation in asthmatics. J Toxicol Environ Health 12:815-826.
Krasovskii GN. 1976. Extrapolation of experimental data from animals to man. Environ Health Perspect 13:51-58.
Laurenzi GA, Berman L, First M, Kass EH. 1964. A quantitative study of the deposition and clearance of bacteria in the murine lung. J Clin Invest 43:759-768.
Lefford MJ, Amell L, WarnerS. 1978. Listeria pneumonitis: Induction of immunity after airborne infection with Listeria monocytogenes. Infect Immun 22:746-751.
Lefford MJ, WarnerS, Amell L. 1979. Listeria pneumonitis: Influence of route of immunization on resistance to airborne infection. Infect Immun 25:672-679.
Lennette EH, Schmidt NJ, eds. 1974. Diagnostic Procedures for Viral and Rickettsial Infections. American Public Health Association, New York, NY.
Lipscomb MF, Onofrio JM, Nash EJ, Pierce AK. 1983. A morphologic study of the role of phagocytes in the clearance of Staphylococcus aureus from the lung. J Reticuloendothel Soc 33:429-442.
Loosli CG. 1967. Synergism between respiratory viruses and bacteria. Yale J Bioi Med 40:522-540.
Loosli CG. 1973. Influenza and the interaction of viruses and bacteria in respiratory infections. Medicine 52:369-384.
Love GJ, Lan SP, Shy CM. 1982a. A study of acute respiratory disease in families exposed to different levels of air pollution in the Great Salt Lake Basin, Utah, 1971-1972 and 1972-1973. Environ Health Perspect 44:165-174.
Love GJ, Lan SP, Shy CM, Riggan WB. 1982b. Acute respiratory illness in families exposed to nitrogen dioxide ambient air pollution in Chattanooga, Tennessee. Arch Environ Health 3 7:75-80.
Lowry T, Schuman LM. 1956. "Silo-filler's disease": A syndrome caused by nitrogen dioxide. JAMA 162:153-160.
Martin CM, Kunin CM, Gottlieb LS, Finland M. 1959. Asian influenza A in Boston, 1957-1958: II. Severe staphylococcal pneumonia complicating influenza. Arch Intern Med 103:532-542.
McGrath JJ, Oyervides J. 1982. Response of N02-exposed mice to Klebsiella challenge. Adv Mod Environ Toxicol 5:475-485.
McGrath JJ, Oyervides J. 1985. Effects of nitrogen dioxide on resistance to Klebsiella pneumoniae in mice. JAm Coli Toxicol 4:227-231.
28
N02 Exposure and Modulation of Pulmonary Defense Mechanisms
Melia RJW, Florey C du V, Altman DS, Swan AV. 1977. Association between gas cooking and respiratory disease in children. Br Med J 2:149-152.
Melia RJW, Florey C du V, Chinn S. 1979. The relation between respiratory illness in primary school children and the use of gas for cooking: I. Results from a national survey. Int J Epidemiol 8:333-338.
Melia RJW, Florey C du V, Darby SC, Palmers ED, Goldstein BD. 1978. Differences in N02 levels in kitchens with gas cookers. Atmos Environ 12:1379-1381.
Miyata M, Mitsuyama M, Ogata N, Nomoto K, Takey K. 1982. Two steps in the generation of acquired cellular resistance against Listeria monocytogenes: Accumulation and activation of macrophages. Immunology 47:247-253.
Morrow PE. 1984. Toxicologic data on N02 : An overview. J Toxicol Environ Health 13:205-227.
Motomiya T, Ito K, Yoshida R, Ide G, Otsu H, Nakishima Y. 1973. The effects of exposure to N02 gas in the infection of influenza virus of mouse: Long-term experiment in low concentrations. Rep Environ Res Organ Chiba Univ 1:27-32.
National Research Council. 1977. Nitrogen Oxides. National Academy of Sciences, Washington, DC.
Nayak DP, Kelley GW. 1965. The effect of varied inoculums on the distribution and progression of influenza virus (5-15) in lungs of mice. Am J Vet Res 26:984-990.
Nichol KP, Cherry JD. 1967. Bacterial-viral interrelations in respiratory infections of children. N Eng! J Med 277:667-672.
Nugent KM, Pesanti EL. 1982. Chronic glucocorticosteroid therapy impairs staphylococcal clearance from murine lungs. Infect Immun 38:1033-1036.
Onofrio JM, Toews GB, Lipscomb MF, Pierce AK. 1983. A morphologic study of the role of phagocytes in the clearance of Staphylococcus aureus. Am Rev Respir Dis 127:335-341.
Orehek J, Massari JP, Gayrard P, Grimaud C, Charpin J. 1976. Effect of short-term, low-level nitrogen dioxide exposure on bronchial sensitivity of asthmatic patients. J Clin Invest 57:301-307.
Parker JC, Reynolds RK. 1968. Natural history of Sendai virus infection in mice. Am J Epidemiol 88:112-125.
Parker JC, Tennant RW, Ward TG. 1964. Enzootic Sendai virus infection in mouse breeder colonies within the United States. Science 146:936-938.
Pearlman ME, Finklea JF, Creason CM, Shy M, Young M, Horton RJM. 1971a. Nitrogen dioxide and lower respiratory illness. Pediatrics 47:391-398.

G.J. Jakab
Pearlman ME, Finklea JF, Shy CM, Van Bruggen J, Newill VA. 1971b. Chronic oxidant exposure and epidemic influenza. Environ Res 4:129-140.
Pennington JE. 1977. Bronchoalveolar cell response to bacterial challenge in the immunosuppressed lung. Am Rev Respir Dis 116:885-893.
Pennington JE. 1978. Differential effects of cyclophosphamide and cortisone acetate on bronchoalveolar phagocytic cell populations. Am Rev Respir Dis 118:319-324.
Pennington JE. 1984. Respiratory tract infections: Intrinsic risk factors. Am J Med 76:34-41.
Pennington JE. 1985. Immunosuppression of pulmonary host defenses. In: Advances in Host Defense Mechanisms (Gallin Jl, Fauci AS, eds.) pp. 141-164. Raven Press, New York, NY.
Pierce AK, Reynolds RC, Harris GD. 1977. Leukocytic response to inhaled bacteria. Am Rev Respir Dis 116:679-684.
Purvis MR, Ehrlich R. 1963. Effect of atmospheric pollutants on susceptibility to respiratory infection: II. Effect of nitrogen dioxide. J Infect Dis 113:72-76.
Rehm SR, Gross GN, Hart DA, Pierce AK. 197-9. Animal model of neutropenia suitable for the study of dualphagocyte system. Infect Immun 25:299-303.
Rehm SR, Gross GN, Pierce AK. 1980. Early bacterial clearance from murine lungs; species-dependent phagocytic response. J Clin Invest 66:194-199.
Remijin B, Fischer P, Brunekreef B, Lebret E, Boleij JSM, Noij D. 1985. Indoor air pollution and its effect on pulmonary function of adult nonsmoking women: 1. Exposure estimates for nitrogen dioxide and passive smoking. lnt J Epidemiol 14:215-220.
Rietjens IMCM, Poelen MCM, Hempenius RA, Gijbels MJJ, Alink GM. 1986. Toxicity of ozone and nitrogen dioxide to alveolar macrophages: Comparative study revealing differences in their mechanism of toxic action. J Toxicol Environ Health 19:555-568.
Robinson TWE, Cureton RJR, Heath RB. 1968. The pathogenesis of Sendai virus infection in the mouse lung. J Med Microbial 1:89-95.
Rosenthal GJ, Snyder CA. 1985. Modulation ofthe immune response to Listeria monocytogenes by benzene inhalation. Toxicol Appl Pharmacal 80:502-510.
Ruppert D, Jakab GJ, Sylvester DL, Green GM. 1976. Sources of variance in the measurement of intrapulmonary killing of bacteria. J Lab Clin Med 87:544-558.
Rylander R, Sneall M-C, Garcia I. 1975. Pulmonary cell response patterns after exposure to airborne bacteria. Scand J Respir Dis 56:195-200.
Schenker MB, Samet JM, Speizer FE. 1983. Risk factors for childhood respiratory disease: The effect of host factors and home environmental exposures. Am Rev Respir Dis 128:1038-1043.
Schiff LJ. 1977. Effect of nitrogen dioxide on influenza virus infection in hamster trachea organ culture. Proc Soc Exp Bioi Med 156:546-549.
Scott GH, Walker JS. 1976. Immunoglobulin-bearing cells in lungs of mice infected with influenza virus. Infect Immun 13:1525-1527.
Sherwin RP, Richters V, Brooks M, Buckley RD. 1968. The phenomenon of macrophage congregation in vitro and its relationship to in vivo N02 exposure of guinea pigs. Lab Invest 18:269-277.
Shy CM, Creason JP, Pearlman MF, McClain KE, Benson FB, Young MM. 1970a. The Chattanooga School Children Study: Effects of community exposure, to nitrogen dioxide:
I. Methods, description of pollutant exposure, and results of ventilatory testing. J Air Pollut Control Assoc 20:539-545.
Shy CM, Creason JP, Pearlman MF, McClain KE, Benson FB, Young MM. 1970b. The Chattanooga School Children Study: Effects of community exposure to nitrogen dioxide: II. Incidence of acute respiratory illness. J Air Pollut Control Assoc 20:582-586.
Shy CM, Goldsmith JR, Hackney JD, Lebovitz MD, Menzel DB. 1978. Health effect of air pollution. Am Thorac Soc News 6:1-63.
Snider GL, Lucey EC, Stone PJ. 1986. Animal models of emphysema. Am Rev Respir Dis 113:149-169.
Speizer FE, Ferris B Jr. 1973a. Exposure to automobile exhaust: I. Prevalence of respiratory symptoms and disease. Arch Environ Health 26:313-318.
Speizer FE, Ferris B Jr. 1973b. Exposure to automobile exhaust: II. Pulmonary function measurement. Arch Environ Health 26:319-324.
Speizer FE, Ferris B Jr, Bishop YMM, Spengler J. 1980a. Respiratory disease rates and pulmonary function in children associated with N02 exposure. Am Rev Respir Dis 121:3-10.
Speizer FE, Ferris B Jr, Bishop YMM, Spengler J. 1980b. Health effects of indoor N02 exposure: Preliminary results. In: Nitrogen Oxides and Their Effects on Health (Lee SD, ed.) pp.343-359. Ann Arbor Science Publishers, Ann Arbor, MI.
29

Spengler JD, Duffy CP, Letz R, Tibbitts TW, Ferris BG Jr. 1983. Nitrogen dioxide inside and outside 137 homes and implications for ambient air quality standards and health effects research. Environ Sci Technol 17:164-168.
Spengler JD, Sexton K. 1983. Indoor air pollution: A public health perspective. Science 221:9-17.
Stedman TL. 1972. Stedman's Medical Dictionary, 22nd ed. Williams & Wilkins Co., Baltimore, MD.
Suzuki T, Ikeda S, Kanoh T, Mizoguchi I. 1986. Decreased phagocytosis and superoxide anion production in alveolar macrophages ofrats exposed to nitrogen dioxide. Arch Environ Contam Toxicol 15:733-739.
Truitt GL, Mackaness GB. 1971. Cell-mediated resistance to aerogenic infection of the lung. Am Rev Respir Dis 104:829-843.
U.S. Department of Commerce, Bureau of the Census. 1983. 1980 Census of Housing, Vol. 1, Characteristics of Housing Units, Detailed Housing Characteristics, Part I, United States Summary. U.S. Government Printing Office, Washington, DC.
U.S. Environmental Protection Agency. 1981 Review of the National Ambient Air Quality Standards for Nitrogen Oxides: Assessment of Scientific and Technical Information. Office of Air Quality Planning and Standards, Research Triangle Park, NC.
Valand SB, Action JD, Myrvik QN. 1970. Nitrogen dioxide inhibition of viral induced resistance in alveolar monocytes. Arch Environ Health 20:303-309.
van Nunen MCJ, van der Veen J. 1967. Experimental infection with Sendai virus in mice. Arch Viral 22:388-37.
Vasallo LL, Domm BM, Poe RH, Duncombe ML, Gee JBL. 1973. N02 gas and N02 effects on alveolar macrophage phagocytosis and metabolism. Arch Environ Health 26:2 70-2 74.
30
N02 Exposure and Modulation of Pulmonary Defense Mechanisms
Virelizier JL, Allison AC, Schild GC. 1979. Immune responses to influenza in the mouse, and their control of the infection. Br Med Bull 35:65-68.
Ward JM. 1974. Naturally occurring Sendai virus disease of mice. Lab Anim Sci 24:938-942.
Ware JH, Dockery DW, Spiro A, Speizer FE, Ferris BG. 1984. Passive smoking, gas cooking, and respiratory health of children living of six cities. Am Rev. Respir Dis 129:366-374.
Warr GA, Jakab GJ. 1983. Pulmonary inflammatory responses during viral pneumonia and secondary bacterial infection. Inflammation 7:93-104.
Weil SC. 1972. Guidelines for experiments to predict the degree of safety of a mateiral for man. Toxicol Appl Pharmacal 21:194-199.
Wells MA, DanielS, Djeu JY, Kiley SC, Ennin FA. 1983. Recovery from a viral respiratory tract infection: IV. Specificity of protection by cytotoxic T lymphocytes. JImmunol 130:2908-2911.
Wyde PR, Peavy DL, Cate TR. 1978. Morphological and cytochemical characterization of cells infiltrating mouse lungs after influenza infections. Infect Immun 21:140-146.
Wyde PR, Wilson MR, Cate TR. 1982. Inteferon production by leukocytes infiltrating the lungs of mice during primary influenza virus infection. Infect Immun 38:1249-1255
Yap KL, Ada GL. 1978. The recovery of mice from influenca A virus infection: Adoptive transfer of immunity with influenza virus-specific cytotoxic T lymphocytes recognizing a common virion antigen. Scand J Immunol8:413-420.
Zee YC, Osebold JW, Dotson WM. 1979. Antibody responses and interferon titers in the respiratory tracts of mice after aerosolized exposure to influenza virus. Infect Immun 25:202-207.

G.J. Jakab
APPENDIX A. Schematic Representation of the Pulmonary Bactericidal Assay
Aerosol
Challenge
;:;;\ - ~ - ~---1~~~~~~0 U \J ~ Bacteria Quantitative
~ ({)tj. "'"' ~~O~M~O 8";:,::~:' - ,,000
~ ~ ~ Viable Bacteria
VIABILITY 4 HOUR 1 0,000 0 HOUR = 100.000 X 100 = 10%
PERCENT = o01 BACTERIA KILLED 1 OO% - 1 O% - 9 70
APPENDIX B. Inhalation Chamber System
Sampling ports Fecal catch pa
Automatic flow control Manual overide
Flow sensor
N02 generation system
APPENDIX C. Nitrogen Dioxide Bag Fill and Generation System
N02 BAG FILL
>a: Q
FUME HOOD ---l I I I I
______ _j
N02 GENERATION
DILUTION AIR -::::::===;:::;:::::::::=::= TO
t CHAMBER PLEXIGLASS BOX
[UNDER NEGATIVEPRESSUR'El v R
I SOL TEFL·~· I c ____J L _____ j
®>-------~
STAINLESS STEEL-TEFLON
DIAPHRAGM PUMP
31

N02 Exposure and Modulation of Pulmonary Defense Mechanisms
APPENDIX D. Comparison of Intrapulmonary Killing of Staphylococcus aureus in Mice Exposed to Various Concentrations of Nitrogen Dioxide for Four Hours After Bacterial Challenge
N02 Cone. (ppm)
2.5
4
5
10
15
Run No.
1 2
Pool
1 2
Pool
1 2 3
Pool
1 2 3
Pool
1 2
Pool
·' Each value represents the mean ± SE. b p < 0.05. ' p < 0.01.
n
10 10 20
10 10 20
6 6 6
18
6 6
10 22
6 8
14
0 Hours
100.0 ± 10.7 100.0 ± 8.4 100.0 ± 6.6
100.0 ± 9.5 100.0 ± 7.2 100.0 ± 5.8
100.0 ± 9.9 100.0 ± 8.0 100.0 ± 8.1 100.0 ± 4. 7
100.0 ± 10.9 100.0 ± 11.4 100.0 ± 8.1 100.0 ± 5.4
100.0 ± 10.1 100.0 ± 8.2 100.0 ± 6.2
Percent of Initial Viable Bacteria Remaining"
Control
6.5 ± 0.7 12.8 ± 3.8 9.7 ± 2.0
7.3 ± 1.2 7.3 ± 0.9 7.3 ± 0.7
8.7 ± 0.9 11.4 ± 4.3
6.2 ± 0.7 8.8 ± 1.5
7.2 ± 1.3 11.6 ± 2.3
7.4 ± 1.3 8.5 ± 1.0
11.3 ± 1.3 10.5 ± 4.4 10.9 ± 2.5
4 Hours
N02-Exposed
8.3 ± 2.4 6.2 ± 0.5 7.3 ± 1.2
9.0 ± 0.7 12.8 ± 1.9 10.9 ± 1.1
10.0 ± 0.6 29.0 ± 5.0 14.7 ± 2.1 17.9 ± 2.6b
23.1 ± 41.1 ± 14.1 ± 23.9 ±
6.9 13.9
2.3 4.8c
56.7 ± 5.9 41.9 ± 6.9 48.2 ± 4.9c
APPENDIX E. Comparison of Intrapulmonary Killing of Proteus mirabiJis in Mice Exposed to Various Concentrations of Nitrogen Dioxide for Four Hours After Bacterial Challenge"
N02 Cone. (ppm)
5
10
15
17.5
20
25
Run No.
1 2
Pool
1 2 3 4
Pool
1 2 3
Pool
1 2
Pool
2 3 4
Pool
n
10 10 20
6 6 6 6
24
6 6 8
20
10 10 20
6 6 6 6
24
10
0 Hours
100.0 ± 8.8 100.0 ± 8. 7 100.0 ± 6.0
100.0 ± 3.2 100.0 ± 6.5 100.0 ± 5.6 100.0 ± 9.8 100.0 ± 3.1
100.0 ± 8.9 100.0 ± 5.2 100.0 ± 5.4 100.0 ± 3.6
100.0 ± 11.2 100.0 ± 10.8 100.0 ± 7.6
100.0 ± 12.8 100.0 ± 14.1 100.0 ± 10.1 100.0 ± 5.1 100.0 ± 5.2
100.0 ± 12.2
'' Analysis of variance (AN OVA} total p for concentration ,; 0.0001. h Each value represents the mean ± SE. ' p < 0.05. d p < 0.01.
32
Percent of Initial Viable Bacteria Remainingb
Control
27.3 ± 1.9 15.0 ± 1.3 21.1 ± 1.8
19.5 ± 2.1 29.1 ± 5.2 26.4 ± 2.1 23.6 ± 3.2 24.6 ± 1.7
26.6 ± 2.8 26.8 ± 1.5 17.8 ± 1.6 23.2 ± 1.5
20.0 ± 2.0 22.1 ± 1.8 21.0 ± 1.3
21.3 ± 1.8 20.9 ± 2.9 26.2 ± 4.1 19.9 ± 3.2 22.1 ± 1.5
23.4 ± 2.2
4 Hours
N02-Exposed
26.4 ± 2.9 17.5 ± 1.6 21.9 ± 1.9
16.6 ± 2.0 17.3 ± 1.6 20.1 ± 2.0 14.5 ± 2.5 17.1 ± 1.1c
20.3 ± 2.2 25.7 ± 2.4 18.2 ± 1.4 21.1 ± 1.3
21.3 ± 2.3 23.6 ± 1.7 22.4 ± 1.4
32.7 ± 4.9 38.5 ± 5.5 36.5 ± 5.5 35.6 ± 2.1d 35.8 ± 2.2
39.3 ± 3.8d

G.J. Jakab
APPENDIX F. Comparison of Cells Retrieved from Murine Lungs by Bronchoalveolar Lavage at Four Hours After Treatment with Either Ambient Air, Nitrogen Dioxide, Proteus mirabilis, or Proteus mirabilis and Nitrogen Dioxide
Total Differential Cell Count Per Lunga Cell Count Per Lung" Percenta.b Percenta,b Macrophages PMNs
Treatment (X 105) Macro phages PMNs (X 105) (X 103)
Ambient Air 6.3 ± 0.4 99.5 ± 0.2 0 6.2 ± 0.4 0 N02 (10 ppm) 8.1 ± 1.2 97.3 ± 1.1 1.6 ± 0.9 7.9 ± 1.2 7.5 ± 3.1 P. mirabilis 37.5 ± 2.0 9.2 ± 1.5 88.7 ± 1.8 3.5 ± 0.7 3324.7 ± 186.1 P. mirabilis
+ 10 ppm N02 59.4 ± 4.3 7.9 ± 1.4 90.1 ± 1.4 4.7 ± 0.9 5359.3 ± 418.7
Ambient Air 5.9 ± 0.4 99.1 ± 0.4 0.4 ± 0.2 5.8 ± 0.4 1.7 ± 1.2 N02 (25 ppm) 6.3 ± 0.4 94.9 ± 0.8 3.8 ± 0.7 6.0 ± 0.4 23.8 ± 4.5 P. mirabilis 38.4 ± 3.3 9.4 ± 1.2 88.4 ± 1.4 3.7 ± 0.6 3385.3 ± 276.2 P. mirabilis
+ 25 ppm N02 54.4 ± 4.0 3.1 ± 0.2 93.4 ± 1.6 1.7 ± 0.2 5076.8 ± 391.8
" Each value represents the mean ± SE of eight determinations. b Lymphocytes were < 2 percent.
APPENDIX G. Comparison of Intrapulmonary Killing of Klebsiella pneumoniae in Mice Exposed to 10 ppm of Nitrogen Dioxide for Four Hours After Bacterial Challenge
Percent of Initial Viable Bacteria Remaining 8
N02 Cone. Run (ppm) No.
10 1 2 3
Pool
" Each value represents the mean ± SE. b p < 0.001.
n
6 6 6
18
0 Hours
100.0 ± 10.8 100.0 ± 10.0 100.0 ± 10.8 100.0 ± 5.7
4 Hours
Control N02-Exposed
30.4 ± 3.5 39.4 ± 2.8 23.7 ± 2.5 54.9 ± 4.3 30.1 ± 2.1 42.5 ± 6.0 28.1 ± 1.7 45.6 ± 3.ob
APPENDIX H. Comparison of Cells Retrieved from Murine Lungs by Bronchoalveolar Lavage Four Hours After Treatment with Either Ambient Air, Nitrogen Dioxide, Klebsiella pneumoniae, or Klebsiella pneumoniae and Nitrogen Dioxide
Total Differential Cell Count Per Lunga Cell Count Per Lunga Percent8 Percenta Macrophages PMNs
Treatment (x 105 ) Macrophages PMNs (x 105 ) (X 103)
Ambient Air 3.8 ± 0.3 99.5 ± 0.3 0.4 ± 0.2 3.8 ± 0.3 1.6 ± 0.8 N02 (10 ppm) 4.8 ± 0.3 95.5 ± 0.7 3.0 ± 0.4 4.6 ± 0.3 14.3 ± 2.3 K. pneumoniae 13.5 ± 1.3 29.5 ± 2.6 67.5 ± 3.0 3.9 ± 0.5 918.2 ± 104.5 K. pneumoniae
+ 10 ppm N02 20.1 ± 2.2 29.1 ± 2.4 67.1 ± 2.5 5.9 ± 1.0 1337.9 ± 143.3
'' Each value represents the mean ± SE of eight determinations.
33

N02 Exposure and Modulation of Pulmonary Defense Mechanisms
APPENDIX I. Comparison of Intrapulmonary Killing of Pasteurella pneumotropica in Mice Exposed to Various Concentrations of Nitrogen Dioxide for Four Hours After Bacterial Challengea
N02
Cone. (ppm)
5
10
15
20
25
30
Run No.
1
2
3
Pool
1
2
3
4
Pool
1
2
Pool
1
2
3
4
Pool
1
2
Pool
1
2
Pool
n
10
6 10
26
6
6
8
10
30
10
10
20
6
6
6
10
28
10
10
20
10
10
20
0 AN OVA total p for concentration :5 0.001. b Each value represents the mean ± SE. ' p < 0.01.
Percent of Initial Viable Bacteria Remainingb
0 Hours
100.0 ± 11.3
100.0 ± 21.3
100.0 ± 18.5
100.0 ± 9.3
100.0 ± 100.0 ± 100.0 ± 100.0 ±
100.0 ±
100.0 ±
100.0 ± 100.0 ±
17.7
6.8
6.3
6.6 5.7
9.0
6.0
5.2
100.0 ± 11.3
100.0 ± 17.7
100.0 ± 21.3
100.0 ± 13.0
100.0 ± 7.4
100.0 ± 12.4
100.0 ± 15.4
100.0 ± 9.6
100.0 ± 9.6
100.0 ± 10.4
100.0 ± 6.9
Control
11.8 ± 1.7
22.0 ± 2.4
30.2 ± 5.4
21.2 ± 2.7
30.2 ± 5.8
19.5 ± 6.5
11.3 ± 2.7
17.1 ± 3.2
18.6 ± 3.1
20.3 ± 2.3
25.2 ± 6.2
22.7 ± 3.2
13.7 ± 2.5
19.6 ± 8.3
10.3 ± 3.2
31.0 ± 4.1
20.4 ± 2.8
11.8 ± 2.4
22.2 ± 3.4
17.0 ± 2.3
14.6 ± 2.6
25.1 ± 3.6
19.4 ± 2.5
4 Hours
N02-Exposed
14.7 ± 2.5
20.7 ± 2.9
23.8 ± 5.1
19.6 ± 2.6
39.7 ± 4.2
34.4 ± 6.5
21.9 ± 3.8
20.2 ± 3.7
27.4 ± 3.0
28.7 ± 5.2
22.0 ± 3.3
25.3 ± 3.1
23.9 ± 1.4
23.3 ± 6.5
13.1 ± 3.0
35.1 ± 8.3
25.5 ± 3.6
25.3 ± 3.6
38.7 ± 5.1
32.0 ± 3.4c
29.7 ± 5.9
44.7 ± 6.2
37.2 ± 4.5c
APPENDIX J. Comparison of Cells Retrieved from Murine Lungs by Bronchoalveolar Lavage Four Hours After Treatment with Either Ambient Air, Nitrogen Dioxide, Pasteurella pneumotropica, or Pasteurella pneumotropica and Nitrogen Dioxide
Treatment
Ambient Air N02 P. pneumotropica P. pneumotropica
+ 10 ppm N0 2
Total Cell Count Per Lung"
(X 105 )
6.3 ± 0.6 7.0 ± 0.5
43.6 ± 4.7
35.0 ± 3.0
Percenta Macro phages
99.5 ± 0.3 97.4 ± 0.6
9.9 ± 1.3
7.1 ± 1.1
' Each value represents the mean ± SE of eight determinations.
34
Percenta PMNs
0.3 ± 0.2 1.7 ± 0.4
89.5 ± 1.4
92.5 ± 1.1
Differential Cell Count Per Lunga
Macro phages (X 105 )
6.3 ± 0.6 6.8 ± 0.4 4.3 ± 0.8
2.4 ± 0.4
1.7 ± 1.1 11.9 ± 0.3
3893.4 ± 417.5
3246.7 ± 296.1

G.J. Jakab
APPENDIX K. Comparison of Cells Retrieved from Murine Lungs by Bronchoalveolar Lavage at Four Hours After Treatment with Either Ambient Air, Nitrogen Dioxide, Staphylococcus aureus, or Staphylococcus aureus and Nitrogen Dioxide
Total Cell Count Per Lunga
(X 105)
Differential Cell Count Per Lunga
Treatment
Ambient Air N02 (5 ppm) S. aureus S. aureus
+ 5 ppm N02
6.3 ± 0.6
7.2 ± 0.6
8.2 ± 0.8
7.2 ± 0.7
Percenta Macrophages
98.8 ± 0.2
99.6 ± 0.2
96.8 ± 0.6
96.6 ± 0.6
" Each value represents the mean ± SE of eight determinations.
Percenta PMNs
0.9 ± 0.2
0.1 ± 0.1
2.2 ± 0.4
1.9 ± 0.5
Macro phages (X 105)
6.2 ± 0.6
7.2 ± 0.6
7.9 ± 0.8
7.0 ± 0.7
5.8 ± 1.5
0.6 ± 0.6
18.2 ± 3.4
11.4 ± 2.4
APPENDIX L. Comparison of Intrapulmonary Killing of Staphylococcus aureus in Mice Exposed to Various Concentrations of Nitrogen Dioxide for Four Hours Before Bacterial Challengea
N02 Cone. (ppm)
5
10
Run No.
1
2
Pool
1
2
3
Pool
n
8
8
16
8
8
8
24
" ANOVA total p concentration :5 0.0001. b Each value represents the mean ± SE. c p < 0.01.
Percent of Initial Viable Bacteria Remainingb
Control
0 Hours 4 Hours
100.0 ± 7.9
100.0 ± 12.6
100.0 ± 7.2
100.0 ± 7.4
100.0 ± 13.6
100.0 ± 8.6
100.0 ± 5.7
9.2 ± 1.4
17.6 ± 1.8
13.4 ± 1.5
15.7 ± 1.7
13.4 ± 1.3
11.1 ± 1.9
13.4 ± 1.0
0 Hours 4 Hours
100.0 ± 10.8
100.0 ± 7.2
100.0 ± 6.2
100.0 ± 12.4
100.0 ± 14.2
100.0 ± 12.6
100.0 ± 7.2
11.1 ± 1.2
13.5 ± 1.5
12.3 ± 1.0
18.7 ± 1.7
24.8 ± 1.7
21.1 ± 3.2
21.5 ± 1.4c
APPENDIX M. Comparison of Intrapulmonary Killing of Proteus mirabilis in Mice Exposed to Various Concentrations of Nitrogen Dioxide for Four Hours Before Bacterial Challenge
N0 2 Cone. (ppm)
20
30
Run No.
1
2
Pool
1
2
Pool
n
8
8
16
8
8
16
·' Each value represents the mean ± SE.
Percent of Initial Viable Bacteria Remaininga
Control
0 Hours 4 Hours
100.0 ± 13.4
100.0 ± 11.7
100.0 ± 8.6
100.0 ± 10.7
100.0 ± 21.2
100.0 ± 11.5
31.1 ± 3.2
30.7 ± 4.5
30.9 ± 2.7
28.8 ± 4.7
26.4 ± 4.7
27.6 ± 3.2
N02-Exposed
0 Hours 4 Hours
100.0 ± 6.8
100.0 ± 10.3
100.0 ± 6.0
100.0 ± 11.6
100.0 ± 11.5
100.0 ± 7.9
37.3 ± 5.1
30.3 ± 5.4
33.8 ± 3.7
15.7 ± 2.1
16.4 ± 2.6
16.1 ± 1.6b
b p < 0.01 between four-hour control and four-hour NO,-exposed.
35
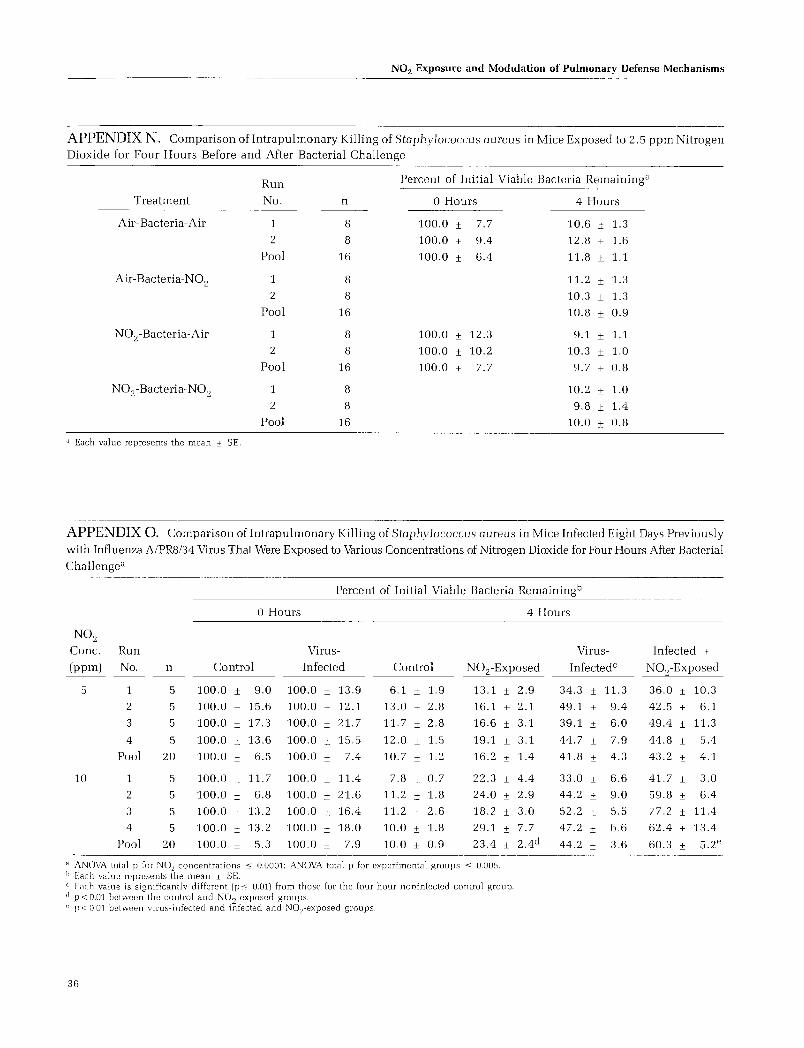
N02 Exposure and Modulation of Pulmonary Defense Mechanisms
APPENDIX N. Comparison of Intrapulmonary Killing of Staphylococcus aureus in Mice Exposed to 2.5 ppm Nitrogen Dioxide for Four Hours Before and After Bacterial Challenge
Run
No.
Percent of Initial Viable Bacteria Remaining8
Treatment
Air-Bacteria-Air
Air-Bacteria-N02
N0 2- Bacteria-Air
N02-Bacteria-N02
" Each value represents the mean ± SE.
1
2
Pool
1
2
Pool
1
2
Pool
1
2
Pool
n
8
8
16
8
8
16
8
8
16
8
8
16
0 Hours
100.0 ± 7.7
100.0 ± 9.4
100.0 ± 6.4
100.0 ± 12.3
100.0 ± 10.2
100.0 ± 7.7
4 Hours
10.6 ± 1.3
12.8 ± 1.6
11.8 ± 1.1
11.2 ± 1.3
10.3 ± 1.3
10.8 ± 0.9
9.1 ± 1.1
10.3 ± 1.0
9.7 ± 0.8
10.2 ± 1.0
9.8 ± 1.4
10.0 ± 0.8
APPENDIX 0. Comparison of Intrapulmonary Killing of Staphylococcus aureus in Mice Infected Eight Days Previously
with Influenza A/PR8/34 Virus That Were Exposed to Various Concentrations of Nitrogen Dioxide for Four Hours After Bacterial Challengea
Percent of Initial Viable Bacteria Remainingb
0 Hours 4 Hours
N02
Cone. Run
(ppm) No.
5
10
1
2
3
4
Pool
1
2
3
4
Pool
n
5
5
5
5
20
5
5
5
5
20
Control
Virus
Infected
100.0 ± 9.0 100.0 ± 13.9
100.0 ± 15.6 100.0 ± 12.1
100.0 ± 17.3 100.0 ± 21.7
100.0 ± 13.6 100.0 ± 15.5
100.0 ± 6.5 100.0 ± 7.4
100.0 ± 11.7
100.0 ± 6.8
100.0 ± 13.2
100.0 ± 13.2
100.0 ± 5.3
100.0 ± 11.4
100.0 ± 21.6
100.0 ± 16.4
100.0 ± 18.0
100.0 ± 7.9
Control
6.1 ± 1.9
13.0 ± 2.8
11.7 ± 2.8
12.0 ± 1.5
10.7 ± 1.2
7.8 ± 0.7
11.2 ± 1.8
11.2 ± 2.6
10.0 ± 1.8
10.0 ± 0.9
N02-Exposed
13.1 ± 2.9
16.1 ± 2.1
16.6 ± 3.1
19.1 ± 3.1
16.2 ± 1.4
22.3 ± 4.4
24.0 ± 2.9
18.2 ± 3.0
29.1 ± 7.7
23.4 ± 2.4d
" ANOVA total p for NO, concentrations :o; 0.0001; ANOVA total p for experimental groups :o; 0.005. b Each value represents the mean ± SE. c Each value is significantly different (p:o; 0.01) from those for the four-hour noninfected control group. a p < 0.01 between the control and N02-exposed groups. " p<0.01 between virus-infected and infected and NO,-exposed groups.
36
Virus
Infectedc
34.3 ± 11.3
49.1 ± 9.4
39.1 ± 6.0
44.7 ± 7.9
41.8 ± 4.3
33.0 ± 6.6
44.2 ± 9.0
52.2 ± 5.5
47.2 ± 6.6
44.2 ± 3.6
Infected +
N02-Exposed
36.0 ± 10.3
42.5 ± 6.1
49.4 ± 11.3
44.8 ± 5.4
43.2 ± 4.1
41.7 ± 3.0
59.8 ± 6.4
77.2 ± 11.4
62.4 ± 13.4
60.3 ± 5.2e

G.J. Jakab
APPENDIX P. Comparison of Intrapulmonary Killing of Staphylococcus aureus in Mice Treated with Corticosteroids for Four Days That Were Exposed to Various Concentrations of Nitrogen Dioxide for Four Hours After Bacterial Challengea
Percent of Initial Viable Bacteria Remainingb
N02
Cone.
(ppm)
1
2.5
5
10
Run
No.
1
2
3
4
Pool
1
2
n
5
5
5
5
20
0 Hours
Control
100.0 ± 6.7
100.0 ± 11.8
100.0 ± 2.9
100.0 ± 10.1
100.0 ± 3.9
Steroid
Treated
100.0 ± 7.1
100.0 ± 11.2
100.0 ± 3.8
100.0 ± 9.4
100.0 ± 3.8
5 100.0 ± 8.8 100.0 ± 6.3
5 100.0 ± 21.0 100.0 ± 9.3
3 5 100.0 ± 10.9 100.0 ± 11.7
4 5 100.0 ± 10.4 100.0 ± 8.4
Pool 20 100.0 ± 6.3 100.0 ± 4.2
1 5 100.0 ± 15.8 100.0 ± 6.9
2 5 100.0 ± 12.6 100.0 ± 1.2
3 5 100.0 ± 12.0 100.0 ± 18.1
4 5 100.0 ± 4.7 100.0 ± 12.3
Pool 20 100.0 ± 5.5 100.0 ± 5.8
1 5 100.0 ± 9.9 100.0 ± 8.4
2 5 100.0 ± 20.9 100.0 ± 9.0
Pool 10 100.0 ± 10.9 100.0 ± 5.8
Control
13.2 ± 1.6
8.8 ± 1.1
9.0 ± 0.8
6.5 ± 0.5
9.4 ± 0.7
11.1 ± 2.0
11.3 ± 2.3
7.3 ± 1.3
7.6 ± 1.1
9.3 ± 0.9
7.6 ± 1.3
10.6 ± 1.2
10.4 ± 0.9
9.9 ± 2.7
9.6 ± 0.8
9.5 ± 0.7
10.1 ± 1.8
9.8 ± 0.9
4 Hours
N02-Exposed
14.9 ± 2.7
9.4 ± 0.7
9.0 ± 0.8
6.3 ± 0.7
9.9 ± 1.0
12.3 ± 1.8
9.9 ± 2.0
6.7 ± 1.0
9.6 ± 1.2
9.6 ± 0.8
9.7 ± 1.0
15.6 ± 2.3
14.9 ± 1.4
13.8 ± 2.7
13.5 ± 1.0
20.4 ± 2.2
21.1 ± 5.9
20.8 ± 3.oe
Steroid
Treated
18.2 ± 1.9
16.3 ± 0.3
18.2 ± 0.7
14.6 ± 1.7
16.8 ± 0.7c
17.7 ± 1.0
20.0 ± 2.5
22.6 ± 4.5
15.1 ± 2.0
18.9 ± 1.4C
21.0 ± 2.2
23.8 ± 3.3
17.2 ± 2.9
20.5 ± 2.0
20.6 ± 1.3c
20.1 ± 1.7
18.7 ± 1.8
19.4 ± 1.2c
Steroid +
N02-Exposed
21.2 ± 0.8
19.2 ± 2.1
23.2 ± 2.5
20.3 ± 2.2
21.0 ± 1.0
23.3 ± 2.8
27.8 ± 3.6
29.9 ± 5.3
21.0 ± 1.0
25.5 ± 1.8d
44.7 ± 7.9
35.1 ± 1.2
27.2 ± 2.4
39.2 ± 4.9
36.5 ± 3.od
48.7 ± 6.6
45.2 ± 2.2
46.9 ± 3.3d
·' ANOVA total p for NOz concentrations <; 0.0001; ANOVA total p for treatment groups <; 0.001. b Each value represents the mean ± SE. ' Each value is significantly different (p< 0.01 or less) from those for the four-hour nontreated control group. d p < 0.05 or less between steroid-treated and steroid-treated + N0 2-exposed groups. '' p < 0.05 or less between control and N0.2-exposed groups.
APPENDIX Q. Comparison of Lung Wet: Dry Weight Ratios in Mice Infected with Sendai Virus Eight Days Previously That Were Exposed for Four Hours Per Day to Either 10 ppm or 20 ppm of Nitrogen Dioxide
N02
Cone.
(ppm)
10
20
Run
No.
1
2
Pool
1
n
4
4
8
6
Noninfected
Control
4.525 ± 0.023
4.420 ± 0.110
4.472 ± 0.056
4.465 ± 0.045
N02-Exposed
4.349 ± 0.089
4.487 ± 0.202
4.418 ± 0.106
4.740 ± 0.093
'' p < 0.01 between noninfected and virus-infected control groups. b p< 0.01 between virus-infected controls and virus-infected N0 2-cxposed groups.
Virus-Infected
Control
5.105 ± 0.340
5.168 ± 0.215
5.136 ± 0.1878
5.009 ± 0.113 8
5.563 ± 0.294
5.729 ± 0.189
5.646 ± 0.165b
5.747 ± 0.156b
37

N02 Exposure and Modulation of Pulmonary Defense Mechanisms
APPENDIX R. Comparison of Cells Lavaged from Lungs of Mice That Were Infected with Sendai Virus Eight Days Previously and Exposed to Either Ambient Air or Nitrogen Dioxide at 10.0 ppm or 20 ppm for Four Hours Per Day
Total Cell
Count Per Percenta Lung a
Treatment (X 105) Macrophages Lymphocytes
Ambient Air 3.4 ± 0.3 98.8 ± 0.4 0.5 ± 0.2
N02 (10 ppm) 4.2 ± 0.2 96.4 ± 0.5 0.9 ± 0.3
N02 (20 ppm) 4.7 ± 0.3 87.3 ± 1.1 2.1 ± 0.4
Sendai 10.3 ± 0.9 86.6 ± 1.7 10.4 ± 1.6
Sendai +
10 ppm N02 12.1 ± 0.9 82.2 ± 1.6 11.8 ± 1.1
Sendai +
20 ppm N02 17.8 ± 1.7 73.1 ± 1.8 12.3 ± 0.7
" Each value represents the mean ± SE of eight determinations.
ABOUT THE AUTHOR
George J. Jakab is a professor in the Department of Environmental Health Sciences at the Johns Hopkins School of Hygiene and Public Health. He received his Ph.D. in medical
microbiology in 1970 from the University of Wisconsin (Madison. WI) and his postdoctoral training in the Department of Medicine at the University of Vermont. Dr. Jakab has conducted research and published articles on pulmonary defense mechanisms against infectious agents and the interaction of pulmonary infections and atmospheric contaminants on acute and chronic lung diseases.
38
Differential Cell Count Per Lunga
Macrophages Lymphocytes
PMNs (X 105) (X 103)
0.7 ± 0.3 3.4 ± 0.3 1. 7 ± 0.7
2.7 ± 0.5 4.1 ± 0.2 3.8 ± 1.3
10.6 ± 0.9 4.1 ± 0.3 9.9 ± 2.2
3.0 ± 0.3 8.9 ± 0.8 107.1 ± 19.0
6.0 ± 0.6 9.9 ± 0.8 142.8 ± 10.6
14.6 ± 1.1 13.0 ± 1.3 218.9 ± 25.3
PUBLICATIONS RESULTING FROM THIS RESEARCH
PMNs
(X 103)
2.5 ± 0.8
11.5 ± 1.7
49.8 ± 6.2
30.9 ± 4.2
72.6 ± 6.3
259.9 ± 25.4
Jakab GJ. 1987. Modulation of pulmonary defense mechanisms by acute exposures to nitrogen dioxide. Environ Res 42:215-228.
Hemenway DR, Jakab GJ. 1987. The monitoring and generation of standard atmospheres of nitrogen dioxide for inhalation studies: Problems and solutions. Appl Ind Hyg 2:18-23.

HEALTH REVIEW COMMITTEE'S REPORT J-E[ ---------- ~ Health Effects Institute
INTRODUCTION
The Health Effects Institute issued a Request for Applications (RFA 83-2) soliciting proposals on "Nitrogen Oxides and Susceptibility to Respiratory Infections" in the summer of 1983. In September 1983, Dr. George J. Jakab of the Johns Hopkins School of Hygiene and Public Health, Baltimore, MD, proposed a project entitled "Nitrogen Dioxide-Induced Increased Susceptibility to and Severity of Respiratory Infections." In March 1984, the HEI approved the three-year project, with modifications, and authorized total expenditures of $339,945. The project began in October 1984, and the final report was accepted by the Health Review Committee in October 1987. The Health Review Committee Report is intended to place the Investigator's Report in perspective as an aid to the sponsors of the HEI and to the public.
THE CLEAN AIR ACT
The U.S. Environmental Protection Agency (EPA) sets standards for motor vehicle emissions of oxides of nitrogen (and other pollutants) under Section 202 of the Clean Air Act, as amended in 1977. Section 202(a)(1) directs the administrator of the EPA to "prescribe (and from time to time revise) ... standards applicable to the emissions of any air pollutant from any class or classes of new motor vehicles or new motor vehicle engines, which in his judgment cause, or contribute to, air pollution which may reasonably be anticipated to endanger public health or welfare." Sections 202(a)(3) and 202(b)(1) impose specific requirements for reductions in motor vehicle emissions of oxides of nitrogen (and other pollutants), and provide the EPA with limited discretion to modify those requirements.
The determination of the appropriate standards for emissions of oxides of nitrogen depends in part on an assessment of the risks to health that they present. Of the oxides of nitrogen, nitrogen dioxide has been of most concern, and its effect on health has been the focus of research. A study of the effects of nitrogen dioxide on defense mechanisms against respiratory infection in an animal model can contribute knowledge useful in making the evaluations of probable health effects in humans that are an important part of informed regulatory decision-making under Section 202.
In addition, Section 109 of the Clean Air Act provides for the establishment of National Ambient Air Quality Standards. The current standards include primary and secondary standards for nitrogen dioxide. Those standards were last reviewed in 1985. Also, under Section 166 of the Act, in February 1988,
the EPA published regulations to prevent significant deterioration of air quality due to emissions of nitrogen dioxide. Research of the type described here can increase understanding of the effects of nitrogen dioxide on lung tissue, and thus contribute indirectly to the appropriateness of the existing standards and to ongoing and future regulatory initiatives.
BACKGROUND
The nitrogen dioxide that is present in urban environments is derived largely from vehicular sources. Morning rush-hour traffic generates high concentrations of nitric oxide (NO), which in the presence of sunlight and oxygen (02), is converted to nitrogen dioxide (N02) (Ehrlich 1980). The current one-hour National Ambient Air Quality Standard for nitrogen dioxide is 0.053 parts per million (ppm) averaged over one year. Although the nitrogen dioxide standard is being met generally, typical long-term ambient concentrations of nitrogen dioxide range from 0.001 ppm in isolated rural areas to hourly peaks in urban areas that can exceed 0.3 ppm (U.S. Environmental Protection Agency 1985). Nitrogen dioxide generated indoors by appliances such as gas stoves reaches average levels of 0.025 ppm, although peaks as high as 0.2 to 0.4 ppm may be reached (Samet eta!. 1987). Nitrogen dioxide is known to cause serious biologic effects at high levels of exposure. There is also evidence to suggest that exposure to nitrogen dioxide leads to increased susceptibility to respiratory infections (see reviews by U.S. Environmental Protection Agency 1982; Morrow 1984; Samet eta!. 1987).
Under normal conditions, the lung has the capability to maintain sterile conditions, and it disposes of particulates and microoganisms by constantly removing or detoxifying any such agents that are deposited on the lung surfaces (Gardner 1982). This is accomplished through the cooperative action of both specific and nonspecific components of host defense mechanisms, which include transport mechanisms for clearance of foreign particles, bacteria, and viruses; phagocytic cells (alveolar macrophages and polymorphonuclear leukocytes); and immune secretions, such as interferons and immunoglobulins. Toxicological evidence indicates that oxidants such as nitrogen dioxide penetrate beyond the nasopharyngeal region, and can alter the normal functioning of the major pulmonary defenses (Gardner 1984). Data from animal studies suggest that such alterations of pulmonary defenses may make them vulnerable to secondary insults, such as infection (Gardner 1982; Pennington 1988).
Clinical studies on the effect of nitrogen dioxide exposure on respiratory infections are limited because of ethical and
39

-1----------I-E[ Health Review Committee's Report
practical considerations. A number of epidemiological studies have investigated this relation between nitrogen dioxide exposure and respiratory infections; however, taken as a whole, the results of epidemiological studies have been inconsistent and inconclusive (Samet et al. 1987; Pennington 1988). The relation between nitrogen dioxide exposure and respiratory infections has also been explored in a number of animal systems. Green (1984) has argued that an appropriate animal model for testing the environmental pollutant and microorganism disease relationship should fulfill several criteria. First, most human infectious episodes generally result in morbidity, rather than mortality. Therefore, in an animal model, the measurement of minor changes in symptomatology and physiology may be more pertinent than the measurement of mortality. Second, endogenous microorganisms are the source of most respiratory infections in humans. Therefore, autochthonous rather than exogenous microbial flora should be used in experimental studies. Finally, the animal model ought to measure the physiologic derangement of the host defenses that precedes infection, such as rates of physical removal and intrinsic killing of bacteria, rather than
pathologic measures of defense.
Most animal studies have fulfilled these criteria only to a limited extent. In one in vivo model, animals are exposed to inhaled nitrogen dioxide, then infected with highly virulent microorganisms, generally by aero sal inhalation. The effects of nitrogen dioxide exposure on the lung defenses against infection are assessed by decreased survival of the infected animals. In a typical study, McGrath and Oyervides (1985) noted a four-fold increase in mortality in mice acutely exposed (three days, 24 hours per day) to 5 ppm nitrogen dioxide, followed by bacterial challenge with Klebsiella pneumoniae. Monkeys exposed to influenza virus and 5 to 10 ppm nitrogen dioxide had an increased mortality rate, compared to virusexposed animals that did not receive nitrogen dioxide (Henry et al. 197D; Fenters et al. 1971; Ehrlich and Fenters 1973). Because of the reliance on mortality outcomes, however, caution is necessary in extrapolating the results to risks in humans.
Perhaps a more appropriate in vivo approach involves an assessment of decreased capacity to kill bacteria in the lungs of animals exposed to nitrogen dioxide. A review by Jakab (1980) concluded that, generally, these studies show impaired killing of bacteria by lung phagocytes and increased infectivity of bacterial pathogens in nitrogen-dioxide-exposed animals. Goldstein and colleagues (1973) challenged mice with aerosolized Staphylococcus aureus, followed by acute exposure to various concentrations of nitrogen dioxide. The number of viable bacteria in the I ungs of the treated animals was compared to that of the air-exposed animals. Bactericidal capacity was reduced in groups exposed to 3.8 ppm or more nitrogen dioxide. In general, all the in vivo studies have used
40
high levels of nitrogen dioxide (more than 3.8 ppm) in order to produce an effect on the measured outcome (Pennington 1988); people are rarely exposed to such high levels of nitrogen dioxide.
Other studies have focused on the role of specific components of host defense mechanisms in vitro. Macro phages, recovered by bronchoalveolar lavage or tracheal epithelium explants, were functionally evaluated after either previous nitrogen dioxide exposure in the whole animal or direct nitrogen dioxide exposure of the cells in vitro. Following in vitro exposure for 30 minutes, macrophages showed reduced bactericidal capacity and suppressed biochemical secretions at nitrogen dioxide levels as low as 0.1 ppm (Voison et al. 1977). Amoruso and coworkers (1981) found dose-dependent decreases in superoxide anion radical production in alveolar macrophages isolated from rats exposed to 6.1 to 17.0 ppm nitrogen dioxide for two to three hours. This effect is implicated as playing a role in antibacterial activities. Mochitate and colleagues (1986} noted mildly enhanced activities of certain enzymes (such as glucose-6-phosphate dehydrogenase and glutathione peroxidase of the peroxidative metabolic pathway, and succinate-cytochrome c reductase of the mitochondrial respiratory system), as well as increased numbers of macrophages, when rats were exposed to 4 ppm nitrogen dioxide for 10 days. However, Lefkowitz and coworkers (1984) found no significant changes in interferon levels, a measure of immune system responsiveness, in mice exposed to 5.0 ppm nitrogen dioxide for seven days.
An alternative to the models described above is the use of virulent bacteria and virus strains in intact animals, focusing on infectious outcome as the endpoint. Animals with normal pulmonary defenses are capable of defending the lung against minor infectious incidents. If any of the animal's several pulmonary defenses is significantly altered, prolonged microbial viability and enhanced establishment of infection would be expected. With this approach, subtle alterations in the immune system of the host can be detected at exposure concentrations that produce no (or minimal) other overt toxicological effects (Gardner 1982). Moreover, by using microorganisms that produce disease through different pathways, animal models can be used to evaluate the role of specific components of the defense system.
Dr. Jakab reports here on the effects of nitrogen dioxide on mechanisms of defense against respiratory infection, using gram-negative and gram-positive bacteria and an endogenous virus to examine how susceptibility to infection and host reponsiveness to infection may be modified. Gram-negative and gram-positive bacteria produce different types of toxins eliciting specific host defense mechanisms. Also, antibacterial defense mechanisms differ from viral defenses. In general, gram-positive bacteria produce toxins that are released by

---------- ~ ~~~ J-E[
by lysis of the bacterial cells by macrophages, whereas gramnegative pathogenic bacteria produce fever and an inflammatory reaction (cellular injury and increased capillary permeability) by inducing the release of endogenous agents (pyrogens) from neutrophils (Robbins and Coltran 1979).
Dr. Jakab used the gram-positive bacteria S. aureus to probe the effect of nitrogen dioxide on the functional integrity of alveolar macrophages, and the gram-negative bacteria Proteus mirabilis to elucidate the contribution of recruited polymorphonuclear leukocytes to the defense system. K. pneumoniae, a gram-negative organism that is a respiratory pathogen, was selected to determine whether nitrogen dioxide acted as a coinflammatory agent with the pathogenic bacteria, and Pasteurella pneumotropica was used to probe the effect of nitrogen dioxide exposure on the defense mechanisms of the lung against an organism that is endogenous to the respiratory tract of the experimental animal model. The murine respiratory virus parainfluenza 1 (Sendai) was used to determine whether or not nitrogen dioxide exposure increased the severity of a viral respiratory infection that is endogenous to the host.
GOALS AND OBJECTIVES
The broad objective of this investigation was to examine the influence of exposure to nitrogen dioxide on functional parameters that might influence both susceptibility to infection and host responsiveness to infection. The lung's defense mechanisms against bacterial and viral infections were assessed with respect to their modification by exposure to a range of concentrations of nitrogen dioxide. Dose-response studies were performed to determine the concentration of nitrogen dioxide exposure that would result in increased susceptibility to, or increased severity of, viral and bacterial infections in mice, using physiological parameters of host resistance to respiratory infections as endpoints.
The specific objective was to seek answers to the following questions: (1) what is the threshold concentration for a single four-hour exposure to nitrogen dioxide that would alter the defense mechanisms against bacterial infections; (2) what is the influence of the order of exposure to nitrogen dioxide and bacterial challenge, that is, exposure to nitrogen dioxide for four hours before or after the bacterial challenge; (3) what is the effect of nitrogen dioxide exposure on resistance to longterm bacterial infection; (4) does nitrogen dioxide exposure alter resistance to viral infections; and (5) is there an interaction of nitrogen dioxide exposure with the altered resistance to bacterial infections in animals predisposed by infection with Sendai virus, or by immunosuppression with corticosteroid treatment?
SUMMARY OF INVESTIGATOR'S CONCLUSIONS
The principal findings of this study are:
1. The intrapulmonary killing of S. aureus was impaired in mice exposed to a concentration of 5 ppm nitrogen dioxide. Challenge by other bacterial species required higher levels of nitrogen dioxide to perturb pulmonary defenses.
2. The adverse effect of nitrogen dioxide on lung antibacterial activity occurred at lower concentrations when the exposure to the irritant gas followed bacterial challenge, as compared to when it preceded the challenge.
3. No effect was observed in mice exposed to 10 or 20 ppm nitrogen dioxide and challenged with Listeria monocytogenes, an organism that produces a more chronic infectious process.
4. Exposure to nitrogen dioxide for four hours per day, in conjunction with S. aureus challenge, during the course of Sendai virus infection did not alter the bacterial number in the lungs of mice but did enhance the lung pathology associated with the infection.
5. Impairment of intrapulmonary killing of S. aureus occurred at a lower concentration, 2.5 ppm, when mice that had been immunosuppressed with corticosteroid were exposed to nitrogen dioxide. Bacterial infection in mice predisposed with Sendai virus was not altered with nitrogen dioxide exposure.
Overall, the data suggest that the mechanisms of resistance to pulmonary infection by gram-positive and gram-negative bacteria are affected differently by nitrogen dioxide exposure.
TECHNICAL EVALUATION
ASSESSMENf OF METHODS AND STUDY DESIGN
The methods selected for use in this study are standard techniques that are well established. The investigator is very familiar with them and used the techniques appropriately. The concentrations of nitrogen dioxide studied in this investigation ranged from 1 to 30 ppm; however, not all experiments included this full range (see Table 1). The endpoint in experiments involving bacterial challenge was the number of viable bacteria remaining four hours after the bacterial challenge, which either immediately preceded or immediately followed a four-hour exposure to nitrogen dioxide. Two exceptions to this regimen were the L. monocytogenes experiment, which used an exposure to nitrogen dioxide of four hours per day for 14 days, and the Sendai experiment, which used an exposure of four hours per day for 10 days. In the viral infection
41

-1-----------I-E[ Health Review Committee's Report
Table 1. Nitrogen Dioxide Exposures for Each Experimental Condition
N02 Exposure Challenge Organism (ppm)
1 2.5 4 5 10 15 17.5 20 25 30
S. aureus X X X X X
S. aureus + corticosteroid X X X X
S. aureus + Sendai virus X X
32P-S. aureus X X X
P. mirabilis X X X X X
K. pneumoniae X
P. pneumotropica X X X X X
L. monocytogenes X X
Parainfluenza 1 virus (Sendai) X X X
studies, the virus titer in lung homogenates was used as an endpoint. Further attributes of infection were noted by differential cell counts, lung wet: dry weight ratios, and albumin in lung lavages. Particle clearance mechanisms were studied by following the disposal of 32P-labeled bacteria.
The experimental design is well described in the Methods section, and is summarized in tabular form at the end of that section to serve as a guide to the reader. However, it is not clear how animals were allocated to exposure treatment, nor is a formal calculation of the statistical power to detect expected outcomes presented. Appropriate statistical tests were used for data analysis, although a statement of rationale for the choice of Duncan's statistical test would have been useful. The report contains frequent reference to dose-response relationships, yet lacks any formal analyses for trends. Such analyses, using linear or nonlinear regression models, would have provided more precise information on dose-response relationships, and would have strengthened considerably the inferences made from the extensive data that were obtained.
INTERPRETATION OF RESULTS
The lowest level of nitrogen dioxide at which statistically significant levels of intrapulmonary killing of S. aureus were noted is 5 ppm nitrogen dioxide exposure for four hours, and 2.5 ppm nitrogen dioxide with concurrent corticosteroid treatment; Dr. Jakab contends that these represent the ''threshold'' levels of nitrogen dioxide. However, the determination of a threshold is heavily dependent on study design and analysis. The focus ofthe current study was to gain an understanding of the mechanisms of host defense; it was not designed specifically to maximize information pertinent to
42
the threshold and dose-response questions. In addition, the reported' 'threshold'' values were determined qualitatively from the graphs presented in the Investigator's Report. The method of choice for a reliable determination of threshold values is to subject the data to statistical analysis using one of the several models. Therefore, the ''threshold'' values reported by Dr. Jakab should be interpreted with caution. Futhermore, one must clearly appreciate that threshold values determined in animal studies do not predict the threshold for humans. Again, this study was not designed specifically to elucidate interspecies differences, and the study should be evaluated with this in mind.
The sequence-of-exposure studies in the S. aureus system provide mechanistic data on the exposure-outcome relationship; The nitrogen-dioxide-induced impairment in antibacterial activity occurred at lower concentrations when exposure followed bacterial challenge than when it preceded the challenge. These results, along with those of Goldstein and coworkers (1973), who found effects at 2.3 ± 0.2 ppm nitrogen dioxide after 17 hours, suggest that in the sequencedose relationship, the order of exposure may override the effect of concentration. These are valuable mechanistic implications that have bearing on the design offuture infectivity studies.
When the lung was challenged with Sendai virus, the investigator found increased virus-associated lung damage after exposure to nitrogen dioxide (as indicated by increased I ung wet:dry weight ratios, albumin content, and influx of inflammatory polymorphonuclear leukocytes); he interprets this observation as suggesting long-term consequences for the lung when exposure and infection coexist. Thus, the author hypothesizes that childhood infections, some of which may be related to nitrogen dioxide exposures, might enhance the risk oflung disease in adults. Such conjectures, although apparently based on other recent observations in the investigator's laboratory, are not really addressed in the investigator's report. There is some evidence that supports the view that episodes of infection and inflammation in early life might indeed influence pulmonary function in later life (Lebowitz eta!. 1987; Voter eta!. 1988); however, these studies are preliminary, and require confirmation based on larger study samples and longer periods of observations.
In addition to the experimental features discussed above, the outcome of infection depends upon physiological factors, such as clearance mechanisms, cellular defenses triggered in the host (for example, recruitment of macrophages), and host immunity. Dr. Jakab has evaluated the contribution of some ofthese factors in respiratory infections in mice. InS. aureus infections, physical removal rates were found not to be impaired at any nitrogen dioxide concentration tested, which is in agreement with previous work by Goldstein and

---------- ~ ~~~ J-E[
colleagues (1973), who tested nitrogen dioxide levels of 2 to 15 ppm. Dr. Jakab concludes that the effects observed at 5 ppm support a bactericidal defect in the phagocytic system, rather than an effect on the transport system.
The author found a biphasic dose-response relationship for bactericidal activity against P. mirabilis: At 10, 15, and 17.5
ppm nitrogen dioxide bactericidal activity was enhanced, whereas at 20 and 25 ppm nitrogen dioxide it was suppressed (no effect was noted at 5 ppm). The investigator has explained these results by suggesting that at the intermediate concentrations of nitrogen dioxide, the lungs recruit increased numbers of polymorphonuclear leukocytes which then enhance bactericidal activity. Exposure to 20 ppm or higher concentrations of nitrogen dioxide overcomes this defense mechanism and results in an impairment of bactericidal activity of the recruited cells, allegedly by impairment of intrinsic phagocytic processes; however, upon repeating the experiment with K. pneumoniae, another gram-negative bacteria, 10 ppm of nitrogen dioxide failed to enhance bactericidal activity. The author explained this result by stating that this organism does not recruit sufficient numbers of polymorphonuclear leukocytes to make enhancement of recruitment at 10 ppm important. These interpretations are supported by limited experiments only, and the conclusions regarding mechanisms must be recognized as somewhat speculative. Nevertheless, the experiments suggest that, in mice, an acute exposure to nitrogen dioxide for four hours after bacterial challenge causes dysfunctions in pulmonary antibacterial defenses that may differ qualitatively at different nitrogen dioxide exposure concentrations, and that may be dependent upon the particular organism used to probe specific defense parameters.
The investigator emphasizes the particular importance of the experiment in animals in which immunosuppression was induced by corticosteroid treatment, and suggests that there may be high-risk individuals in the population who are particularly susceptible to nitrogen dioxide enhancement of susceptibility to pulmonary infections. However, the data from these experiments are very limited, and are still far from confirming that nitrogen dioxide exposure is a risk factor for human populations.
The levels tested in this study (see Table 1) are relatively high as compared to typical human exposures (see Background section of this report). However, we do not know if the actual lung dose in mice and humans is the same even with identical exposures to nitrogen dioxide. The known differences between the structure of the nasal cavity in humans and rodents (Patra 1986) suggest that a higher proportion of nitrogen dioxide may be absorbed in the upper airways of mice resulting in a lower proportionate dose to the lung tissue. Therefore, it is possible that the actual dose to the lower respiratory tract of mice, particularly at the lower levels administered by Dr. Jakab, may not be so far away from those in humans.
In the discussion section of the report, Dr. Jakab makes the following interesting speculation, which may prove to be an important guideline for future research in this area: "From the data with all the bacteria employed in these studies, an interesting trend appears to be emerging, that the more complex the functional resistance mechanism, the higher the dose of nitrogen dioxide required to impair defenses against that bacteria." Thus, while 5 ppm nitrogen dioxide affects the alveolar macrophage phagocytic system (S. aureus studies), the combined phagocytic system involving the alveolar macrophages and polymorphonuclear leukocytes is only affected adversely at nitrogen dioxide concentrations of 10 ppm or more (P. mirabilis, K. pneumoniae, and P. pneumotropica studies). The results with L. monocytogenes involves cellmediated immunity as well as the dual phagocytic system, and adverse effects of nitrogen dioxide on functional resistance against this organism requires exposures in excess of 20 ppm nitrogen dioxide.
REMAINING UNCERTAINTIES AND IMPLICATIONS FOR FUTURE RESEARCH
The investigator used animal and infection models to better understand pulmonary defense mechanisms, in order to allow more knowledgeable judgments concerning human doseresponse and organism-specific response relationships.
The results from this study point to additional questions that need to be pursued and, in particular, to studies that would further clarify the temporal relations of exposure and response. Since most of Dr. Jakab's research was conducted with a single four-hour exposure to nitrogen dioxide, it leaves open the question of whether or not more prolonged exposures would result in respiratory effects at lower nitrogen dioxide exposures than the 5 ppm reported here. Further research to determine the comparability of alveolar concentrations of nitrogen dioxide achieved at varying exposure concentrations in mice and humans would facilitate analysis of the human health significance of these murine studies.
The role of corticosteroid in increasing susceptibility to bacterial infection, by producing effects at lower nitrogen dioxide concentrations, is presumed to be related to suppression of immune system function. Further studies of the role of the immune system in modulating interactions between nitrogen dioxide and bacteria would appear to be a valuable direction forfuture research. The present investigation clearly suggests that there are broad differences in the mechanisms through which nitrogen dioxide can alter lung defenses against infection or the pathological consequences of infection, or both, at high levels of nitrogen dioxide. It remains for future work to explore whether or not there are conditions under which this holds at lower concentrations of nitrogen dioxide. Acquisition of further insight into chemotactic or intracellular bactericidal mechanisms that explain these broader influ-
43

~---------fE[ Health Review Committee's Report
ences would be a valuable goal for research. This kind of information is needed to explain why different exposures to different concentrations of nitrogen dioxide can result in varied, qualitative responses to infectious agents (as was observed with P. mirabilis). It is important that these molecular or cellular studies also be conducted with a dose-response protocol, and that they be corroborated with the kind of physiologic mechanism experiments conducted in the present investigation.
The studies presented here, within the limits of the design used, determined nitrogen dioxide levels that produce enhanced infectious outcome in a laboratory animal model. Extrapolation of these data to human exposures can best be aided by developing mechanistic criteria in the laboratory animal models that can be applied in human clinical or epidemiologic studies. This investigation has made progress toward this end.
REFERENCES
Amoruso MA, Witz G, Goldstein BD. 1981. Decreased superoxide anion radical production by rat alveolar macrophages following inhalation of ozone or nitrogen oxide. Life Sci 28:2215-2221.
Ehrlich R. 1980. Interaction between environmental pollutants and respiratory infections. Environ Health Perspect 35:89-100.
Ehrlich R, Fenters JD. 1973. Influence of nitrogen dioxide on experimental influenza in squirrel monkeys. In: Proceedings of the Third International Clean Air Congress, pp. A11-A13. Sponsored by the International Union of Air Pollution Prevention Association. VDI-Verlag, Dusseldorf, Federal Republic of Germany.
Fenters JD, Ehrlich R, Findlay J, Spangler J, and Tolkacz V. 1971. Serologic response in squirrel monkeys exposed to nitrogen dioxide and influenza virus. Am Rev Respir Dis 104:448-451.
Gardner DE. 1982. Use of experimental airborne infections for monitering altered host defenses. Environ Health Perspect 43:99-107.
Gardner DE. 1984. Oxidant-induced enhanced sensitivity to infection in animal models and their extrapolations to man. J Toxicol Environ Health 13:423-439.
Goldstein E, Eagle C, Hoeprich PD. 1973. Effect of nitrogen dioxide on pulmonary bacterial defense mechanisms. Arch Environ Health 26:202-204.
Green GM. 1984. Similarities of host defense mechanisms against pulmonary infectious diseases in animals and man. J Toxicol Environ Health 13:471-478.
Henry MC, Findlay J, Spangler J, Ehrlich R. 1970. Chronic toxicity of nitrogen dioxide in squirrel monkeys: III. Effect on
44
resistance to bacterial and viral infection. Arch Environ Health 20:566-570.
Jakab GJ. 1980. N0 2-induced susceptibility to acute respiratory illness: A perspective. Bull NY Acad Med 56:847-855.
Lebowitz MD, Holberg CJ, Knudson RJ, Burrows B. 1987. Longitudinal study of pulmonary function development in childhood, adolescence, and early adulthood. Am Rev Respir Dis 136:69-75.
Lefkowitz SS, McGrath JJ, Lefkowitz DL, Spicer JB. 1984. Interferon production following nitrogen dioxide exposure. Int J Immunopharmacol 6(4):275-278.
McGrath JJ, Oyervides J. 1985. Effects of nitrogen dioxide on resistance to Klebsiella pneumoniae in mice. JAm Call Toxicol 4:227-231.
Mochitate K, Takahashi Y, Ohsumi T, Miura T. 1986. Activation and increment of alveolar macrophages induced by nitrogen dioxide. J Toxicol Environ Health 17:229-239.
Morrow PE. 1984. Toxicological data on NOx: An overview. J Toxicol Environ Health 13:205.
Patra AL. 1986. Comparative anatomy of mammalian respiratory tract: The nasopharyngeal region and the tracheobronchial tree. J Toxicol Environ Health 17:163-174.
Pennington JE. 1988. Effects of automotive emissions on susceptibility to respiratory infections. In: Air Pollution, the Automobile, and Public Health: Research Opportunities for Quantifying Risk (Watson AY, Bates RR, Kennedy D, eds.). National Academy Press, Washington, DC.
Robbins SL, Coltran RS. 1979. Pathological basis of disease, pp. 374-482. WB Saunders Company, Philadelphia, PA.
Samet JM, Marbury MC, Spengler JD. 1987. Health effects and sources of indoor air pollution. Am Rev Respir Dis 136:1486-1508.
U.S. Environmental Protection Agency. 1982. Air quality criteria for nitrogen oxides. EPA-600/8-82-026. U.S. Environmental Protection Agency, Environmental Criteria and Assessment Office, Research Triangle Park, NC.
U.S. Environmental Protection Agency. 1985. Health research plan for the study of nitrogen dioxide. Staff paper. Office of Assistant Administrator of Research and Development, Washington, DC.
Voisin C, Aerts C, Jakubczak E, Houdret JL, Tonnel AB. 1977. Effects of nitrogen dioxide on alveolar macrophages surviving in the gas phase. Bull Euro Physiopathol Respir 13:137-144.
Voter KZ, Henry MM, Stewart PW, Henderson FW. 1988. Lower respiratory illness in early childhood and lung function and bronchial reactivity in adolescent males. Am Rev Respir Dis 137:302-307.

LIST OF HEI PUBLICATIONS 1-£[ ---------- ~
Special Reports Title
Gasoline Vapor Exposure and Human Cancer: Evaluation of Existing Scientific Information and Recommendations for Future Research
Automotive Methanol Vapors and Human Health: An Evaluation of Existing Scientific Information and Issues for Future Research
Gasoline Vapor Exposure and Human Cancer: Evaluation of Existing Scientific Information and Recommendations for Future Research
Research Reports Report No.
1
2
3
4
5
Title
Estimation of Risk of Glucose 6-Phosphate Dehydrogenase-Deficient Red Cells to Ozone and Nitrogen Dioxide
Disposition and Metabolism of Free and Particle-Associated Nitropyrenes after Inhalation
Transport of Macromolecules and Particles at Target Sites for Deposition of Air Pollutants
The Metabolic Activation and DNA Ad ducts of Dinitropyrenes
An Investigation into the Effect of a Ceramic Particle Trap on the Chemical Mutagens in Diesel Exhaust
Principal Investigator
M. Amoruso
J. Bond
T. Crocker
F.A. Beland
S.T. Bagley
6 Effect of Nitrogen Dioxide, Ozone, and Peroxyacetyl Nitrate on Metabolic and Pulmonary Function
D.M. Drechsler-Parks
7
8
9
10
11
12
13
14
15
16
17
DNA Adducts of Nitropyrene Detected by Specific Antibodies
Effects of Inhaled Nitrogen Dioxide and Diesel Exhaust on Developing Lung
Biochemical and Metabolic Response to Nitrogen DioxideInduced Endothelial Injury
Predictive Models for Deposition of Inhaled Diesel Exhaust Particles in Humans and Laboratory Species
Effects of Ozone and Nitrogen Dioxide on Human Lung Proteinase Inhibitors
Neurotoxicity of Prenatal Carbon Monoxide Exposure
Effects of Nitrogen Dioxide on Alveolar Epithelial Barrier Properties
The Effects of Ozone and Nitrogen Dioxide on Lung Function in Healthy and Asthmatic Adolescents
Susceptibility to Virus Infection with Exposure to Nitrogen Dioxide
Metabolism and Biological Effects of Nitropyrene and Related Compounds
Studies on the Metabolism and Biological Effects of Nitropyrene and Related Nitro-polycyclic Aromatic Compounds in Diploid Human Fibroblasts
J.D. Groopman
J.L. Mauderly
J.M. Patel
C.P. Yu
D.A. Johnson
L.D. Fechter
E.D. Crandall
J.Q. Koenig
T.J. Kulle
C.M. King
V.M. Maher
Publication Date
September 1985
May 1987
Supplement January 1988
Publication Date
August 1985
February 1986
February 1986
August 1986
January 1987
April1987
April1987
May 1987
June 1987
July 1987
August 1987
September 1987
October 1987
January 1988
January 1988
February 1988
March 1988
Copies of these reports can be obtained by writing to the Health Effects Institute, 215 First Street, Cambridge, MA 02142

LIST OF HEI PUBLICATIONS 1-£( ---------- -1 Research Reports
Report No.
18
19
Title
Respiratory Infections in Coal Miners Exposed to Nitrogen Oxides
Factors Affecting Possible Carcinogenicity of Inhaled Nitropyrene Aerosols
Principal Investigator
M. Jacobsen
R.K. Wolff
Publication Date
July 1988
July 1988
Copies of these reports can be obtained by writing to the Health Effects Institute, 215 First Street, Cambridge, MA 02142

---------- ~ THE HEALTH EFFECTS INSTITUTE: AN OVERVIEW I-£(
The Health Effects Institute (HEI) is an independent nonprofit corporation that is "organized and operated ... to conduct, or support the conduct of, and to evaluate research and testing relating to the health effects of emissions from motor vehicles." It is organized in the following ways to pursue this purpose.
INDEPENDENCE IN GOVERNANCE
HEI is governed by a four-member Board of Directors whose members are Archibald Cox (Chairman of the Board), Carl M. Loeb University Professor (Emeritus) at Harvard University; William 0. Baker, Chairman Emeritus of Bell Laboratories and Chairman of the Board of Rockefeller University; Donald Kennedy, President of Stanford University; and Charles Powers, Partner, Resources for Responsible Management.
TWO-SECTOR FINANCIAL SUPPORT
The Institute receives half of its funds from the United States government through the Environmental Protection Agency, and halffrom the automotive industry. Twenty-seven domestic and foreign manufacturers of vehicles or engines contribute to the Institute's budget in shares proportionate to the number of vehicles or engines that they sell.
THE HEI RESEARCH PROCESS
HEI is structured to define, select, support, and review research that is aimed at investigating the possible health effects of mobile source emissions. Its research program is developed by the Health Research Committee, a multidisciplinary group of scientists knowledgeable about the complex problems involved in determining the health effects of mobile source emissions. The Committee seeks advice from HEI's sponsors and from other sources prior to independently determining the research priorities of the Institute.
After the Health Research Committee has defined an area of inquiry, the Institute announces to the scientific community that research proposals are being solicited on a specific topic. Applications are reviewed first for scientific quality by an appropriate expert panel. Then they are reviewed by the Health
Research Committee both for quality and for relevance to HEI's mission-oriented research program. Studies recommended by the Committee undergo final evaluation by the Board of Directors, who review the merits of the study as well as the procedures, independence, and quality of the selection process.
THE HEI REVIEW PROCESS
When a study is completed, a draft final report authored by the investigator(s) is reviewed by the Health Review Committee. The Health Review Committee has no role either in the review of applications or in the selection of projects and investigators for funding. Members are also expert scientists representing a broad range of experience in environmental health sciences. The Committee assesses the scientific quality of each study and evaluates its contribution to unresolved scientific questions.
Each Investigator's Report is peer-reviewed, generally by a biostatistician and three outside, independent reviewers chosen by the Review Committee. At one of its regularly scheduled meetings, the Review Committee discusses the Investigator's Report. The comments of the committee and the peer reviewers are sent to the investigator, and he or she is asked to respond to the comments and, if necessary, revise the report. The Review Committee then prepares its own report, which inc! udes a general background on the study, a technical evaluation of the work, a discussion of the remaining uncertainties and areas forfuture research, and implications ofthe findings for public health. The HEI Research Report, which includes the Investigator's Report and the Review Committee Report, is then published in monograph form after evaluation by the HEI Board of Directors. The Research Reports are made available to the sponsors, the public, and many scientific and medical libraries, and are registered with NTIS.
All HEI investigators are urged to publish the results of their work in the peer-reviewed literature. The timing and nature of HEI report releases are tailored to ensure that the Health Review Committee's report does not interfere with the journal publication process.

lE£ HEALTH EFFECTS INSTITUTE 215 First Street, Cambridge, Massachusetts 02142 (617) 491-2926
Research Report Number 20 November, 1988