module 1: chromatography grade about the instructions · last revised: 8/20/2014 1 module 1:...
TRANSCRIPT

Last Revised: 8/20/2014
1
Module 1: Chromatography 5th Grade
About the Instructions: This document is intended for use by classroom teachers, SciTrek Leads, and SciTrek Volunteers. The document has been composed with input from teachers, Leads, Volunteers, and SciTrek staff to provide suggestions to future teachers/Leads/Volunteers. The instructions are not intended to be used as a direct script but were written to provide teachers/Leads/Volunteers with a guide line to present the information that has worked in the past. Teachers/Leads/Volunteers should feel free to deviate from the instructions to help students reach the learning goals of the module. Some places in which you can be creative and melded the program to meet your individual teaching style are: during class discussion, group management, generating alternative examples, and asking students leading questions. However, while running the module make sure to cover all the material each day with in the given 60 minutes. In addition, no changes should be made to the academic language surrounding conclusions or the conclusion activity.
Activity Schedule: There are no scheduling restrictions for this activity.
Day 1: Conclusion Assessment/Observations/Variables (60 minutes) Day 2: Question/Experimental Set-Up/Procedure (60 minutes) Day 3: Experiment/Conclusion Activity (60 minutes) Day 4: Conclusion Activity/Conclusion/Question/Experimental Set-Up/Procedure (60 minutes) Day 5: Experiment/Conclusion (60 minutes) Day 6: Poster Making (60 minutes) Day 7: Poster Presentations (60 minutes) Day 8: Conclusion Assessment/Tie to Standards (60 minutes)
NGSS Standard Addressed:
5-PS1-3 Make observations and measurements to identify materials based on their properties. Learning Objectives:
1. Students will be able to list at least two physical properties of a substance. 2. Students will know that mixtures can be separated based on the physical properties of individual
substances in the mixture. 3. Students will know that a conclusion is a claim supported by data. 4. Students will be able to distinguish between statements that are claim/data/neither. 5. Students will be able to match a claim with supporting data and realize when the data does not support
the claim. 6. Students will be able to identify appropriate claims and data for a given data set. 7. Students will be able to list at least two ways that they behaved like scientists.

Last Revised: 8/20/2014
2
Classroom Teacher Responsibilities:
In order for SciTrek to be sustainable the program needs to work with teachers on developing their abilities to run student-centered inquiry-based science lessons in their own classroom. As teachers take over the role of SciTrek Lead, SciTrek will expand to additional classrooms. Even when teachers lead the modules in their own classroom, SciTrek will continue to provide volunteers and all of the materials needed to run the module. Below is a sample timeline for teachers to take over the role as the SciTrek lead.
1. Module 1 (year 1) a. Classroom Teacher Co-Runs Group
i. Classroom teacher will co-run a group with a SciTrek volunteer. Groups contain ~ten students and will be subdivided into three small groups, ~four students, to perform experiments.
2. Module 2 (year 1) a. Classroom Teacher Runs Group
i. Classroom teacher will run a group. Groups contain ~ten students and will be subdivided into three small groups, ~four students, to perform experiments.
3. Module 3 (year 2) a. Classroom Teacher Runs Group and Starts Leading Class Discussions
i. Classroom teacher will run a group. Groups contain ~ten students and will be subdivided into three small groups, ~four students, to perform experiments.
ii. Classroom teacher will start leading parts of group discussions (e.g., conclusion activity, tie to standards, etc.)
4. Module 4 (year 2) a. Classroom Teacher Leads the Class with Co-Lead Volunteer
i. Classroom teacher will be responsible for leading entire class discussions (e.g., conclusion activity, tie to standards, etc.).
ii. Classroom teacher will be responsible for time management. iii. Classroom teacher will be responsible for overseeing volunteers and helping
any groups that are struggling. 5. Any Additional Modules (year 3 and beyond)
a. Classroom Teacher Leads the Class i. Classroom teacher will be responsible for leading whole class discussions
(e.g., conclusion activity, tie to standards, etc.). ii. Classroom teacher will be responsible for time management.
iii. Classroom teacher will be responsible for overseeing volunteers and helping any groups that are struggling.
SciTrek staff will be counting on teacher involvement after year one. Teachers should notify the SciTrek staff if they will not be present on any days of the module. Additional steps can be taken to become a SciTrek lead faster than the proposed schedule above. Contact [email protected] to learn more.
In addition, teachers are required to come to UCSB for the volunteer orientation, typically one week prior to the start of the module. Contact [email protected] for exact times and dates, or see our website at http://web.chem.ucsb.edu/~scitrek/Module_Times.html under your class modules times. At the orientation teachers will meet the volunteers that will be helping in their classroom, go over module content, and learn their responsibilities during the module.

Last Revised: 8/20/2014
3
Prior to the Module (at least 1 week):
1. Come to the SciTrek orientation at UCSB. 2. Divide the class into three groups, ~ten students each. We find these groups work best when
they are mixed levels and mixed language abilities. These larger groups of students will be further subdivided into three small groups, ~three students each, when performing experiments. You can also designate their small groups if desired. Send your class list showing the three large/small groups to [email protected] one week before the start of the module so that we can have nametags/notebooks made for students.
During the Module:
If possible have a document camera available for the SciTrek lead every day of the module. Day 1:
Have the students’ desks/tables moved into three groups and cleared off. This ensures that each student has a desk during SciTrek activities.
Day 2-6: Have the students’ desks/tables moved into nine groups and cleared off. This ensures that each student has a desk during SciTrek activities and that students can begin with the module as soon as SciTrek arrives.
Day 7 and 8: Have the students’ desks/tables cleared off. The desks/tables do not need to be moved into groups.
Materials Used for this Module:
1. Crayons Crayola 8 count 2. Test tubes 25 x 150 mm (Fisher Part Number: 17-988-499) 3. Corks (Size 10) (Fisher Part Number: 07-781N) 4. Test tube stands (hand made by cutting a 2x4 into 15.5 cm long pieces and drilling four holes with a 1
in drill bit 2.5 cm deep along the center line of the block) 5. Nalgene gradated cylinders 10 ml (Fisher Part Number: 08-572-5A) 6. Chromatography paper (role 2 cm x 100 m (thickness 0.18mm) cut into 10.5 cm strips) (Fisher Part
Number: S47087) 7. Other papers (all papers are cut into 2 cm x 10.5 cm strips)
Papers (coffee filter, construction paper, graph paper, newspaper, paper towel, and copy paper (white, pink, yellow, green, purple and blue))
8. Rulers (Office Max Part Number: 21215472) 9. MyChron Timers (Fisher Part Number: S65330) 10. Disposable pipets (droppers) (Fisher Part Number: 13-711-7M) 11. Markers
Mr. Sketch (red, orange, yellow light green, dark green, light blue, dark blue, purple, light pink, dark pink, black, and brown)
Crayola (red, yellow, green, blue, purple, black, and brown) Expo-Overhead pens (red, yellow, green, blue, purple, black, and brown) Sharpie (red, yellow, green, blue, purple, black, and brown) Rose Art (red, yellow, green, blue, purple, black, and brown) Other Black Pens (Bic, Dry Erase, and Paper Mate)

Last Revised: 8/20/2014
4
12. Water 13. Rubbing alcohol (RA) 14. White vinegar 15. Dish soap (without dilution the dish soap is too thick to be absorbed by the paper, therefore, a soap
solution is made my mixing equal parts of water and dish soap) 16. 1 oz. Plastic cups (Smart and Final) labeled: water, RA, soap, and vinegar
17. Bags with 2 oz. of the following: baking soda, baby powder, salt, and sugar (both labeled with their
names and A, B, C, and D) 18. Mixture bags (Mixture 1: pieces of rough (2.5 cm x 2.5 cm) and coarse (1 cm x 2 cm) sand paper;
Mixture 2: metal nuts (10-24) and nylon nuts (10-24) purchase from OSH; Mixture 3: magnets (refrigerator magnets cut into 1 cm x 3 cm) and card stock (cut into 1 cm x 3 cm); Mixture 4: bottle containing sand and water)
All printed materials used by SciTrek (nametags, material pages, poster parts, student notebooks, or instructions) can be made available for use and/or editing by emailing [email protected].
Day 1: Conclusion Assessment/Observations/Variables Schedule:
Introduction (SciTrek Lead) – 2 minutes Conclusion Assessment (SciTrek Lead) – 10 minutes Observation Discussion (SciTrek Lead) – 2 minutes Observations (SciTrek Volunteers) – 24 minutes Variable Discussion (SciTrek Lead) – 5 minutes Variables (SciTrek Volunteers) – 12 minutes Wrap-Up (SciTrek Lead) – 5 minutes
Materials: (3) Volunteer Boxes:
☐ Student nametags
☐ Volunteer lab coat ☐ Test tube with cork
☐ Pencil
☐ Dropper
☐ Timer
☐ (12) Student notebooks
☐ (2) Markers
☐ Test tube stand
☐ 10 ml Graduated cylinder
☐ (2) Rulers
☐ (2) Pieces of chromatography paper with pencil line drawn 2 cm above bottom
☐ Volunteer instructions
☐ Paper towels
☐ Black marker (Mr. Sketch) ☐ Water (8 oz.)
☐ (3) Crayons (8 colors only)

Last Revised: 8/20/2014
5
Other Supplies:
☐ (3) Large group notepads ☐ (3) Trays ☐ Bucket Lead Box:
☐ (5) Blank nametags
☐ Lead lab coat
☐ (2) Test tubes with stoppers
☐ (2) Pencils
☐ (2) Droppers
☐ (2) Timers
☐ Time Card
☐ (3) Extra student notebooks
☐ (3) Markers (orange, green, blue)
☐ (2) Test tube stands
☐ (2) 10 ml Graduated cylinders
☐ (2) Rulers
☐ (4) Pieces of chromatography paper with pencil line drawn 2 cm above bottom
☐ Lead instructions
☐ Paper towels
☐ (2) Black markers (Mr. Sketch)
☐ Water (8 oz.)
☐ (3) Boxes of crayons (8 colors only)
☐ (35) Conclusion assessments
SciTrek Notebook Pages Used With Students:
Last Revised: 8/20/2014
6
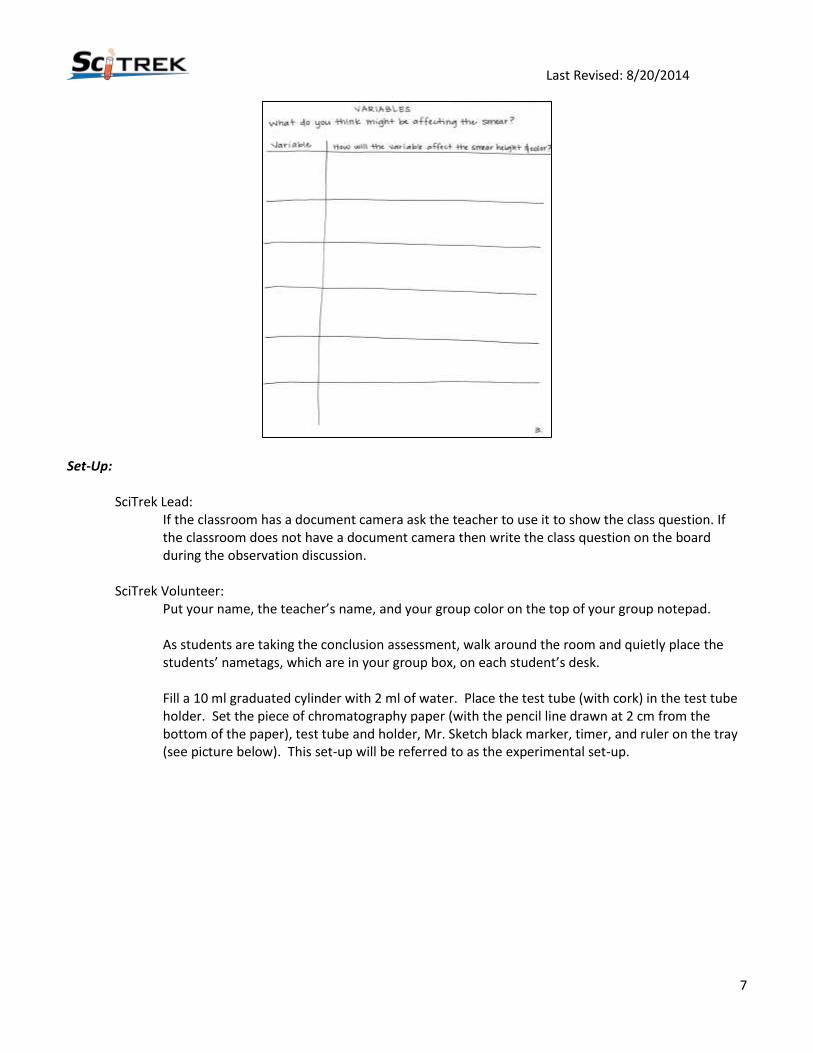
Group Notebook Pages Used With Students:
Last Revised: 8/20/2014
7
Set-Up:
SciTrek Lead: If the classroom has a document camera ask the teacher to use it to show the class question. If the classroom does not have a document camera then write the class question on the board during the observation discussion.
SciTrek Volunteer:
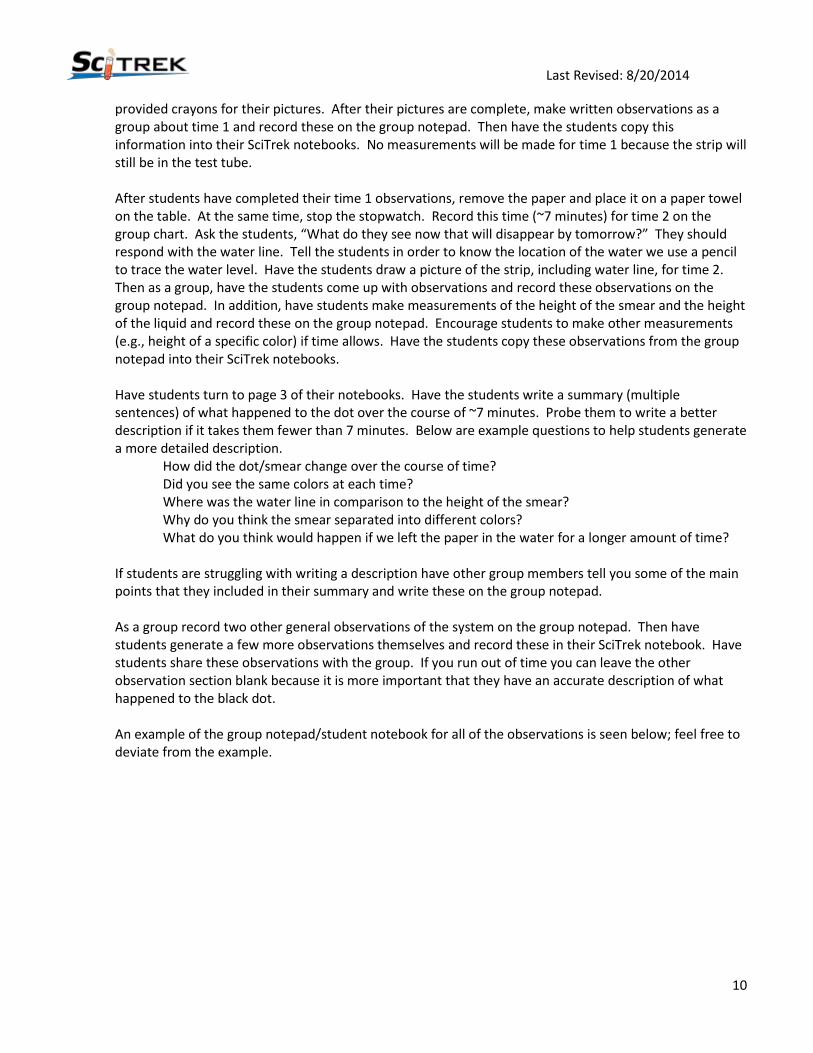
Put your name, the teacher’s name, and your group color on the top of your group notepad. As students are taking the conclusion assessment, walk around the room and quietly place the students’ nametags, which are in your group box, on each student’s desk. Fill a 10 ml graduated cylinder with 2 ml of water. Place the test tube (with cork) in the test tube holder. Set the piece of chromatography paper (with the pencil line drawn at 2 cm from the bottom of the paper), test tube and holder, Mr. Sketch black marker, timer, and ruler on the tray (see picture below). This set-up will be referred to as the experimental set-up.

Last Revised: 8/20/2014
8
Introduction (2 minutes – Full Class – SciTrek Lead):
“Hi, we are scientists from UCSB and we want to show you what we do as scientists. We will show you an experiment and then you can make observations, come up with a class question, and then design your own experiments to help answer the class questions. We want to show you that you can do science and have fun.” If you are a teacher that is leading the class tell your students that we are going to start a long-term science investigation and you have asked some scientists from UCSB to come and help. Allow the UCSB volunteers to introduce themselves and share their majors.
Conclusion Assessment (10 minutes – Full Class – SciTrek Lead):
As the students are taking the assessment, the volunteers should get the student nametags out of their group boxes and walk around the room looking for their students. Have the volunteers quietly lay each student’s nametag on their desk. If students do not have their name on their paper remind them to do so. After nametags have been handed out volunteers should assemble the experimental set-up. “Before we start with the module we will determine how your ideas on conclusions are developing.” Pass-out the conclusion assessment and tell students to fill out their name, teacher’s name, and date at the top of the assessment. Remind the students that it is important that they fill out this assessment on their own. For section one, read the instructions to the students. Then read each of the statements and tell the students to circle if the statement is an example of claim, data, or neither. As you are reading the statements walk around the room and verify that students have written their name on the top of the paper. For section two, read the instructions to the students and give them a few minutes to make matches between claims and data. You do not need to read the individual claim and data statements to the students. For section three, read the instructions to the students. Then read each of the statements. Tell the students based on the results table to circle if the statement is an example of claim, data, opinion, or if it is incorrect. You do not need to read or review the results tables with the students. Read the last question to the students and have them fill in the blank. When they are finished, collect the assessments and verify that the student’s name is on the top of the paper.

Last Revised: 8/20/2014
9
Observation Discussion (2 minutes – Full Class – SciTrek Lead):
Tell the students that scientists make lots of observations. Ask the class, “What is an observation? What are the types of things that you can record for an observation?” If they have trouble with this, show them an object and let them make some observations. Turn these observations into general features of an observation. Examples of possible general observations are: color, texture, size, weight, temperature, material, etc.
“In this experiment we are going to make observations of one strip of paper at three different times. The first time will be before we put the paper in the test tube with water and the other two will be after the paper is put in the test tube with water.” Remind them to make both written and illustrated observations in their SciTrek notebooks. Tell the class they will now get in their groups and make observations. To determine their group they will need to look at the color of their nametag. Tell each colored group where to go. If a student does not have a nametag write the student’s name on one of the extra nametags that are in the lead box using the color of marker of the group they will join.
Observations (24 minutes – Large Groups – SciTrek Volunteers):
Once the students come over to your group have them sit in boy-girl fashion. Make sure the table is set- up as described in the set-up section. Pass out the SciTrek notebooks to each student. Make sure students fill out the entire front cover (except for group number) before beginning with observations. Then have students turn to page 2 of their notebooks.
As a group, have the students come up with some observations about the experimental set-up before you put the chromatography paper and water into the test tube. These observations should be recorded under experimental set-up. Observations should be recorded on the large group notepad first and then copied into student notebooks. Encourage students to make other observations that are not on the group notepad and write them in their personal notebooks.
With the black marker make a dot on the line of the chromatography paper (the smaller the dot the better the results). Have students look at the paper and tell them to remember what it looks like because this will be their time 0 observation. Pour the 2 ml of water into the test tube and place the chromatography paper into the test tube, cork the system, and start the timer. It is important that this is done prior to having students record their time 0 observations so that enough time passes (~ 3 minutes) between time 0 and time 1. Record 0 seconds under the time because this is when the strip of paper was put into the test tube. Then have students draw a picture of their observations of the paper at time 0. In addition, have students generate observations and record these under the time 0 section of the chart on the group notepad. Then have the students copy this information into their SciTrek notebooks. Note that the time measurement will be 0 cm because the dot did not move at time 0. After students have completed their time 0 observations, record the time on the stopwatch, this will be time 1 (~3 minutes). DO NOT STOP THE TIMER OR TAKE THE STRIP OUT OF THE TEST TUBE AT TIME 1. Have the students draw a picture of what the paper looks like at time 1. Make sure students draw the picture exactly like the strip of paper in front of them. A common mistake that students make is drawing the dye colors going down from the line instead of up from the line. Allow the students to use the
Last Revised: 8/20/2014
10
provided crayons for their pictures. After their pictures are complete, make written observations as a group about time 1 and record these on the group notepad. Then have the students copy this information into their SciTrek notebooks. No measurements will be made for time 1 because the strip will still be in the test tube.
After students have completed their time 1 observations, remove the paper and place it on a paper towel on the table. At the same time, stop the stopwatch. Record this time (~7 minutes) for time 2 on the group chart. Ask the students, “What do they see now that will disappear by tomorrow?” They should respond with the water line. Tell the students in order to know the location of the water we use a pencil to trace the water level. Have the students draw a picture of the strip, including water line, for time 2. Then as a group, have the students come up with observations and record these observations on the group notepad. In addition, have students make measurements of the height of the smear and the height of the liquid and record these on the group notepad. Encourage students to make other measurements (e.g., height of a specific color) if time allows. Have the students copy these observations from the group notepad into their SciTrek notebooks.
Have students turn to page 3 of their notebooks. Have the students write a summary (multiple sentences) of what happened to the dot over the course of ~7 minutes. Probe them to write a better description if it takes them fewer than 7 minutes. Below are example questions to help students generate a more detailed description. How did the dot/smear change over the course of time? Did you see the same colors at each time? Where was the water line in comparison to the height of the smear? Why do you think the smear separated into different colors? What do you think would happen if we left the paper in the water for a longer amount of time? If students are struggling with writing a description have other group members tell you some of the main points that they included in their summary and write these on the group notepad. As a group record two other general observations of the system on the group notepad. Then have students generate a few more observations themselves and record these in their SciTrek notebook. Have students share these observations with the group. If you run out of time you can leave the other observation section blank because it is more important that they have an accurate description of what happened to the black dot. An example of the group notepad/student notebook for all of the observations is seen below; feel free to deviate from the example.

Last Revised: 8/20/2014
11

Last Revised: 8/20/2014
12
At the end of the observation section, each group will be asked to share one observation. Pick one student that will share an observation with the rest of the class.
Variable Discussion (5 minutes – Full Class – SciTrek Lead):
Have each group share one of their observations with the rest of the class. Review with the class how the dot changed over time. Make sure that by the end of the discussion the students have identified that there was originally a black dot on the line. When the dot was placed in water the dot separated into several colors and the more time that passed the larger the separation became. Ask the class what the most interesting observation was. They should reply that the black dot spread out into multiple colors. Tell the class we will then work together to answer the question, “What factors affect the black dot from spreading out into multiple colors?” More simply, “What factors affect the smear?” Write this question on the front page of the example notebook under the document camera and have students copy this question onto their notebook. Tell students they are now going to discuss variables within their groups.
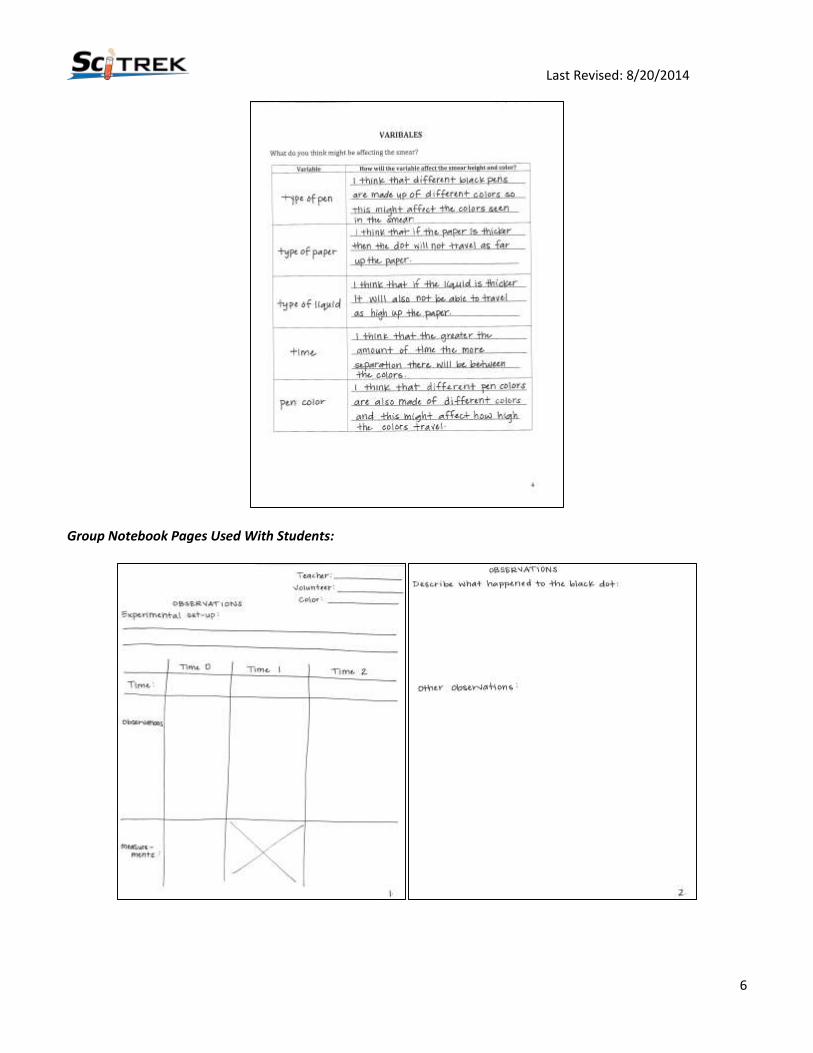
Ask the class what does the word “variable” mean to a scientist? What is the definition of a variable in science? Possible answer: variables are parts of the experiment that you can change. Tell the class that they are going to think about variables in the experiment that they could change to help us answer the class question of: What factors affect the smear? In addition to generating variables we should think about why these variables might affect the outcome of the experiment. Ask the class to give you a variable that they think might affect the smear and have them tell you why or how they think that variable would affect the experiment. Then probe them on how they would design an experiment to test if this variable affected the smear. Finally, have the students make a prediction of the results of the experiment that they proposed. Example: Variable: paper type
Why this variable might affect the smear? Different papers might absorb different amount of liquid. How would you test this variable? Get different types of paper and put black dots on them and put them in water. Prediction: The more absorbent the paper the larger the smear would be.
Tell the students they will generate more variables and analyze them in their groups.
Variables (12 minutes – Large Groups – SciTrek Volunteers):
As a group, come up with a variable and make a prediction about how it will affect the smear. Encourage and challenge students to explain why they think their prediction is correct and how this variable will affect the smear. Repeat this process two more times and record these ideas on the group notepad and then have students copy these into their notebooks. Then have students generate more variables and make predictions about how different values of this variable will affect the smear and record their ideas in their notebook. Have students share these ideas with the group.

Last Revised: 8/20/2014
13
Prepare one student to share one of their variables and why they think it will affect the smear during the group discussion.
Wrap-Up (3 minutes – Full Class – SciTrek Lead):
Have one student from each group share a variable that they generated and why/how they think it will affect the smear. Make sure that students tell you their predictions about how different values of that variable will affect the smear. Challenge students to justify their thinking and explore with them how this might help them design an experiment. For example, if a students’ variable was paper type and they predicted that the more absorbent the paper the bigger the smear because the smear height never went higher than the liquid height ask them when they select their papers for their experiment if they would want all papers that absorbed the same amount of water. Then ask them to give you an example of a paper that absorbs a lot of water (paper towels) and a paper that does not absorb a lot of water (copy paper). Tell the students that the next time we meet they will design an experiment to answer a question that they have about this experiment, which will help them learn about factors that might affect the smear.
Clean-Up:
Before you leave, have students attach their nametags to their notebooks and place them in the group box. Put the test tube with the liquid in it in the waste bucket. Do not leave the cork in the test tube or put it in the waste bucket; put the cork back in the group box. Bring all materials back to UCSB. In addition, put your lab coat back in your group box.

Last Revised: 8/20/2014
14
Day 2: Question/Experimental Set-Up/Procedure
Schedule:
Introduction (SciTrek Lead) – 13 minutes Question (SciTrek Volunteers) – 10 minutes Experimental Set-Up (SciTrek Volunteers) – 15 minutes Procedure (SciTrek Volunteers) – 14 minutes Results Table (SciTrek Volunteers) – 5 minutes Wrap-Up (SciTrek Lead) – 3 minutes
Materials:
(3) Volunteer Boxes:
☐ Student nametags
☐ Volunteer lab coat
☐ Pencil
☐ Student notebooks
☐ (2) Red pens
☐ (3) Materials pages (group color/number indicated)
☐ Volunteer instructions
☐ Notepad
Lead Box:
☐ (5) Blank nametags
☐ Lead lab coat
☐ Notepad
☐ Time card
☐ (3) Extra student notebooks
☐ (3) Marker (orange, green, blue)
☐ (2) Pencils
☐ Lead instructions
☐ (2) Red pens
☐ (3) Materials pages

Last Revised: 8/20/2014
15
SciTrek Notebook Pages Used with Students:

Last Revised: 8/20/2014
16
Set -Up: SciTrek Lead:
Make sure that each of the larger groups (~ten students) are divided into three smaller groups (three/four students). When dividing the students into smaller groups, try to form mixed gendered/ability groups. Before arriving to class indicate each student’s group by writing their group number on the front cover of their SciTrek notebook.
If the classroom has a document camera, ask the teacher to use it for the question, experimental set-up, and results examples (pages 5, 6, and 8). If the classroom does not have a document camera, then tape the example poster-size notebook pages to the front board.
SciTrek Volunteer:
Set out the SciTrek notebooks/nametags around the table, setting students in the same small group next to each other. Have materials pages with group numbers and colors filled out to give students after they complete their questions. Have a red pen available to approve students’ question, experimental set-up, and procedure (pages 5, 6 and 7).
Introduction (13 minutes – Full Class – SciTrek Lead):
Ask the students what they did during the last meeting with SciTrek. They should reply that they put a black dot on a piece of paper and observed that the dot separated into different colors when the paper got wet. Ask the class if they remember the class question they decided to investigate. They should reply, “What factors affect the smear?” Tell students that one way scientists answer questions is by performing experiments; today they will design an experiment to help answer the class question. Ask the class if they think there are multiple factors that could affect the smear. They should respond that there probably are multiple factors. Therefore, each group will generate a smaller question to investigate. Once we put all the group research together we should be able to answer the class question. After each group has generated a question they will determine the values of their changing variable(s) and then determine their controls; this is sometimes known as an experimental set-up. After they have generated their experimental set-up they will write a list of steps to follow during their experiment, also known as a procedure. Tell the students that they need to keep a few things in mind during this process of designing their experiment.
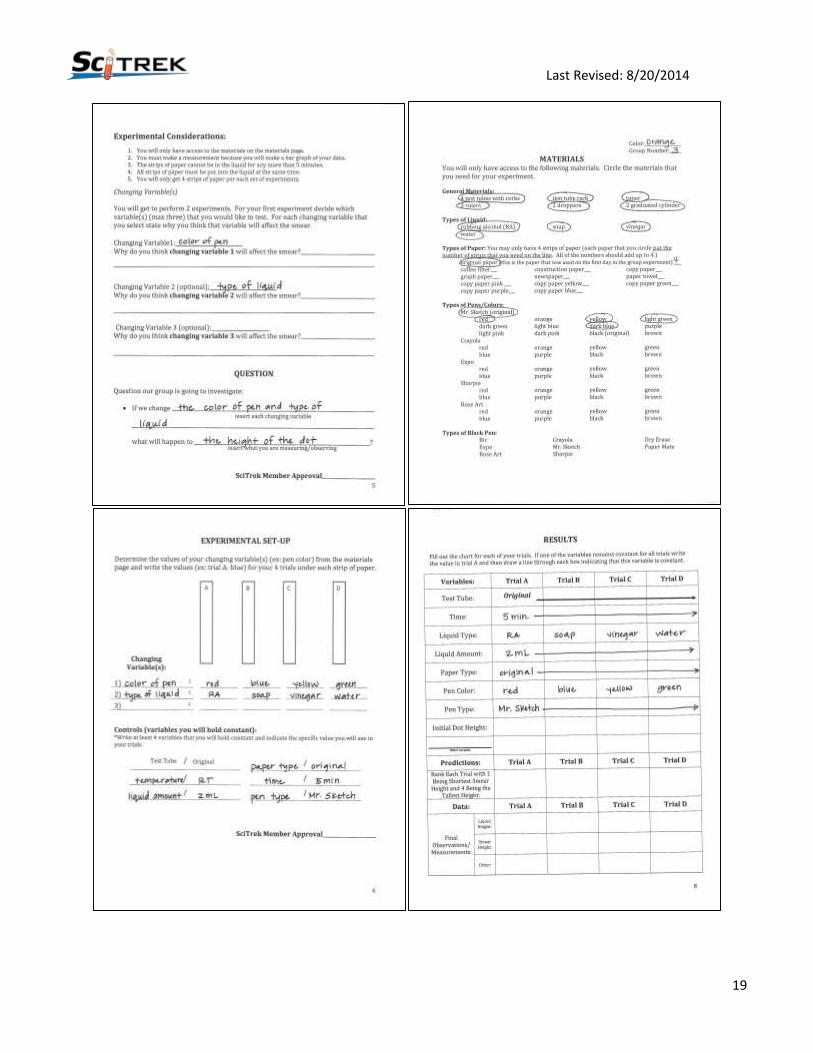
Experimental Considerations:
1. You will only have access to the materials on the materials page. 2. You must make a measurement because you will make a bar graph of your data. 3. The strips of paper cannot be in the liquid for more than 5 minutes. 4. All strips of paper must be put into the liquid at the same time. 5. You will only get 4 strips of paper for each experiment so you will only have 4 trials.
Tell the students we are now going to generate an example question/experimental set-up together and that you will write it in an example notebook so that they will be able to refer back to it when they are completing the process themselves. Make sure that students DO NOT fill out the example question/experimental set-up in their notebooks.
Ask the students for one variable that they think will affect the smear (example answer: pen color). For whatever variable is chosen have the students tell you how they think this variable will affect the smear (example answer: the black pen separated into different colors therefore, maybe different pens color

Last Revised: 8/20/2014
17
separate into different colors. In addition, I think that the height of the smear will be approximately the same height as the original smear because I cannot see how pen color would change the height.) Push student to make predictions on both color and height of the smear. Then ask them if we want a narrow or a wide range of values for this variable and why (example answer: we would want as many different pen colors as possible so that we could see if they all were different colors). Then write down the suggested variable on the example notebook (page 5) under the document camera. Ask the students if they think any other variables will affect the smear (example answer: liquid type). Then ask them to tell you why they think this variable will affect the smear (example answer: the thicker the liquid the less it would absorb up the paper and the smaller the smear would be. However, I do not think that the liquid type would affect the colors that come out of the dot because the colors are a result of the ink and not the liquid). Finally, ask them if we want a narrow or a wide range of values for this variable and why (example answer: we would like a wide range of liquids to see the effects easier). Then write down the second changing variable on the example notebook. Do not fill in the third changing variable or the blanks explaining why they think each changing variable would affect the smear. Tell the students when they are going through this process in their small groups they can generate one, two, or three changing variable(s) that they will investigate. Show students how to insert their changing variable(s) into the question frame to find the question they will investigate. For the example discussed about the question would be: If we change the pen color and liquid type what will happen to the color and size of the smear? Explain to students that many times when there is a large question, like our class questions, scientist break it down into smaller questions that individual scientist can investigate and then they compile their work to answer the large question.
Tell them once they have determined their question and have approval, their SciTrek lead will give them a materials page for determining the values of their changing variable(s) and controls. Ask students if they know how scientists define controls. Make sure that by the end of the conversation students understand that controls are variables that are held constant during an experiment. For example, if they used Mr. Sketch pens for all the strips then one of their controls would be pen type. These controls can be different than the original experiment. Show the students the materials page and have them help you decide the values for the changing variables. If they choose a value contrary to their experimental design, question them on their reasoning. For example, if they said they wanted to use a wide range of pen colors and they picked red, light pink, dark pink, and orange ask them if this values would allow them to best answer their question. Then allow them to change their values if needed. See the example notebook below for possible class choices. Write these values on the example notebook. In addition, show them how to select the materials that they will need on the materials page. Once they have determined the values of their changing variables have them generate a list of controls. First generate five things that could be controls and then show them the materials page again and have them fill in the values. For example the controls could be: pen type, time, dot height, liquid amount, paper type. Write these variables on the left side of each of the slashes in the example notebook. Then have them use the materials page to determine the exact values that they will use for each control. After each value is selected ask the class if having that value would make it easier or harder for them to find the answer to their question. For instance, if one of their constants was time 1 minute, ask them will it be harder or easier to determine if pen color and liquid height is affecting the color and the height of the smear if they used a 1 minute time. Hopefully, they will realize that having a time of 1 minute would
Last Revised: 8/20/2014
18
make it harder to analyze their results because their smear would not have time to travel up the paper. If they realize this might make their experiment more difficult, allow them to change their selection to 5 minutes. Record all of the values of the controls on the right side of the slash. Also, fill out the materials page appropriately. See example notebook/materials page below for possible class choices. Tell students that once they have their experimental set-up complete they will have it approved by their SciTrek volunteer. Next, they will write a procedure that they will be able to follow next time. When writing their procedure they should write all the values of their changing variable(s). Show students the example procedure step on page 7 of their notebook (put dot on each strip of paper A) red, B) blue, C) green, and D) yellow). Once their procedure is completed they will get it approved by a SciTrek volunteer and then they will fill out their results table so they will be ready to start their experiment during SciTrek’s next visit. Put the results table (page 8) under the document camera. Tell students when they have a constant variable, or a control, they will just write it in trial A and then draw a line through the remaining trials. Put one or two of the class controls in the table. However, if a variable is changing then the values need to be written in all of the boxes. Record the class changing variable values in the appropriate boxes. Tell students the last thing they will need to do is make predictions about the smear height at the end of the experiment. Tell them they can label the trials 1 to 4, with 1 being the shortest smear and 4 being the tallest smear. If they think that two strips will be the same height they can put the same number for two strips. Show them where to fill this in on the results table but do not fill the predictions in for the class. Tell students that they will now divide into groups and design their experiments. Leave the question/experimental set-up on the document camera so that students can refer back to it as they design their experiments. Below is an example of what should be filled in the example notebook during the introduction. Note that several sections are left blank.
Last Revised: 8/20/2014
19

Last Revised: 8/20/2014
20
Question (10 minutes – Small Groups – SciTrek Volunteers):
Have students get into their small groups. Have them determine the variable(s) that will be their changing variable(s). If they have only one changing variable do not encourage them to have more and if they have two/three changing variables do not encourage them to have fewer. Students will analyze their data and then perform an additional experiment to correct any mistakes that they made on their first experiment. Then have each group write why/how they think each changing variable will affect the color of the solution. After this is complete they can fill out their question. When you sign off on their question you can give them a materials page with their group color and number designated in the upper right hand corner. An example notebook is seen below. Pick one student to share the question that their group is going to investigate during the class discussion.
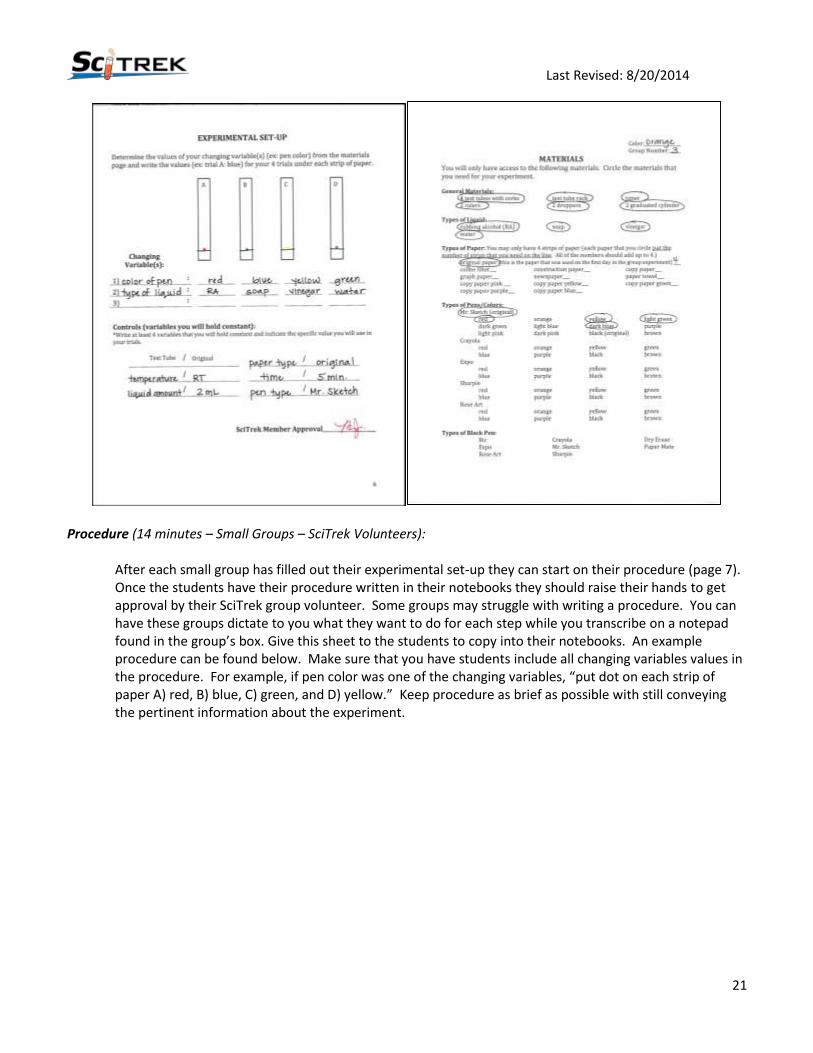
Experimental Set-Up (15 minutes – Small Groups – SciTrek Volunteers):
Have groups determine the values for their changing variable(s) and record them in their experimental set-up on page 6. Encourage students to determine their controls before determining the values of their controls. Ask students to justify the values that they have chosen for their controls and if these values will make it easier or harder to answer their question. In addition, collect the materials page and make sure that it is filled out correctly and completely. This is essential for staring their experiments during the next SciTrek visit. An example of the experimental set-up page in the notebook and materials page are seen below.
Last Revised: 8/20/2014
21
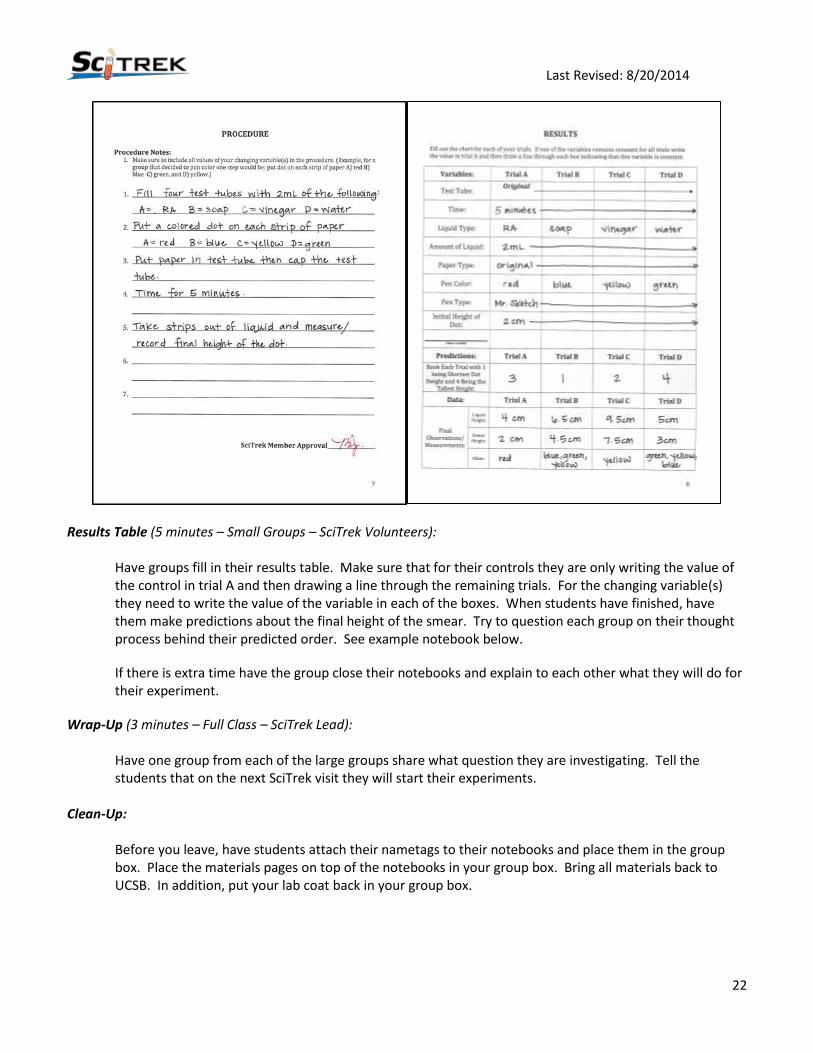
Procedure (14 minutes – Small Groups – SciTrek Volunteers):
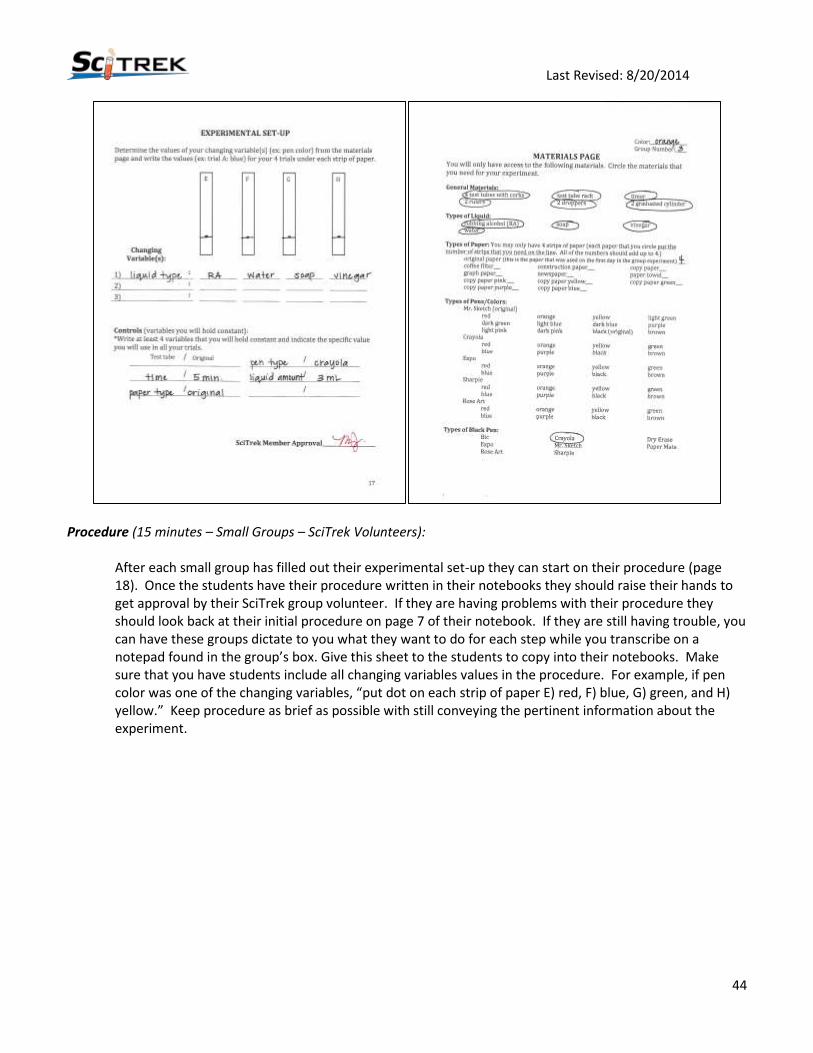
After each small group has filled out their experimental set-up they can start on their procedure (page 7). Once the students have their procedure written in their notebooks they should raise their hands to get approval by their SciTrek group volunteer. Some groups may struggle with writing a procedure. You can have these groups dictate to you what they want to do for each step while you transcribe on a notepad found in the group’s box. Give this sheet to the students to copy into their notebooks. An example procedure can be found below. Make sure that you have students include all changing variables values in the procedure. For example, if pen color was one of the changing variables, “put dot on each strip of paper A) red, B) blue, C) green, and D) yellow.” Keep procedure as brief as possible with still conveying the pertinent information about the experiment.
Last Revised: 8/20/2014
22
Results Table (5 minutes – Small Groups – SciTrek Volunteers):
Have groups fill in their results table. Make sure that for their controls they are only writing the value of the control in trial A and then drawing a line through the remaining trials. For the changing variable(s) they need to write the value of the variable in each of the boxes. When students have finished, have them make predictions about the final height of the smear. Try to question each group on their thought process behind their predicted order. See example notebook below.
If there is extra time have the group close their notebooks and explain to each other what they will do for their experiment.
Wrap-Up (3 minutes – Full Class – SciTrek Lead):
Have one group from each of the large groups share what question they are investigating. Tell the students that on the next SciTrek visit they will start their experiments.
Clean-Up:
Before you leave, have students attach their nametags to their notebooks and place them in the group box. Place the materials pages on top of the notebooks in your group box. Bring all materials back to UCSB. In addition, put your lab coat back in your group box.
Last Revised: 8/20/2014
23
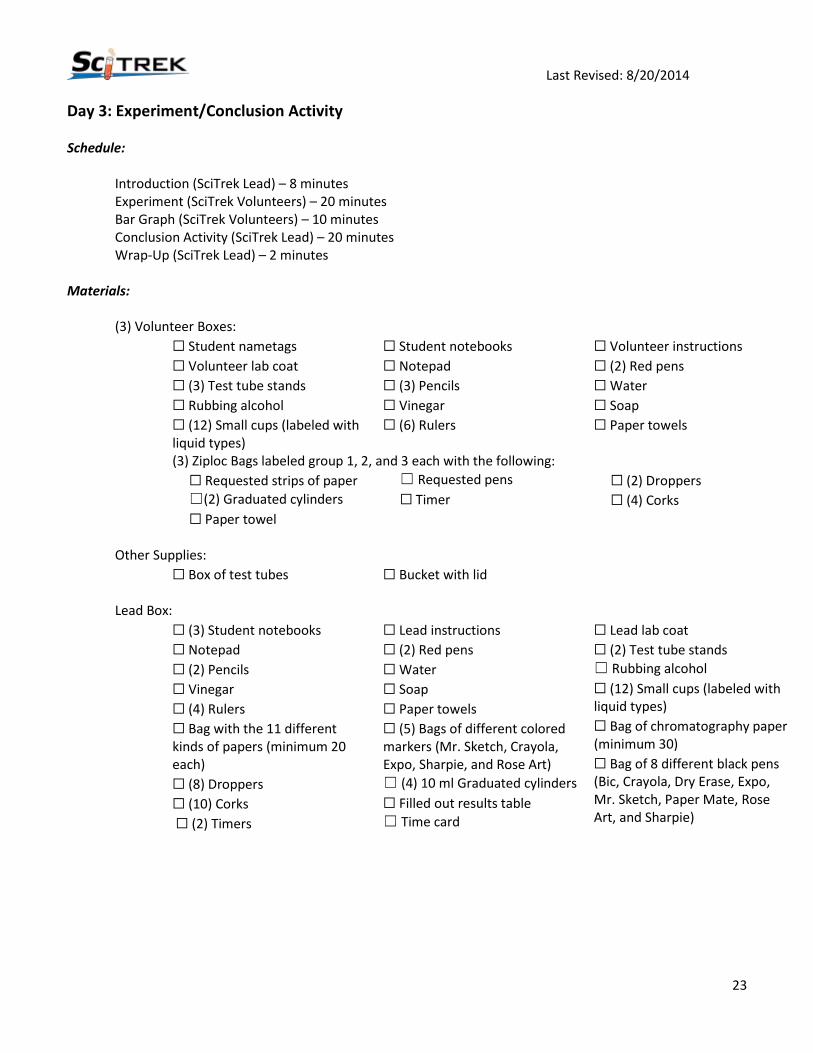
Day 3: Experiment/Conclusion Activity Schedule: Introduction (SciTrek Lead) – 8 minutes
Experiment (SciTrek Volunteers) – 20 minutes Bar Graph (SciTrek Volunteers) – 10 minutes Conclusion Activity (SciTrek Lead) – 20 minutes Wrap-Up (SciTrek Lead) – 2 minutes
Materials:
(3) Volunteer Boxes:
☐ Student nametags
☐ Volunteer lab coat
☐ (3) Test tube stands
☐ Rubbing alcohol
☐ (12) Small cups (labeled with liquid types)
☐ Student notebooks
☐ Notepad
☐ (3) Pencils
☐ Vinegar
☐ (6) Rulers
☐ Volunteer instructions
☐ (2) Red pens
☐ Water
☐ Soap
☐ Paper towels
(3) Ziploc Bags labeled group 1, 2, and 3 each with the following:
☐ Requested strips of paper
☐(2) Graduated cylinders
☐ Paper towel
☐ Requested pens
☐ Timer
☐ (2) Droppers
☐ (4) Corks
Other Supplies:
☐ Box of test tubes ☐ Bucket with lid
Lead Box:
☐ (3) Student notebooks
☐ Notepad
☐ (2) Pencils
☐ Vinegar
☐ (4) Rulers
☐ Bag with the 11 different kinds of papers (minimum 20 each)
☐ (8) Droppers
☐ (10) Corks
☐ (2) Timers
☐ Lead instructions
☐ (2) Red pens
☐ Water
☐ Soap
☐ Paper towels
☐ (5) Bags of different colored markers (Mr. Sketch, Crayola, Expo, Sharpie, and Rose Art)
☐ (4) 10 ml Graduated cylinders
☐ Filled out results table
☐ Time card
☐ Lead lab coat
☐ (2) Test tube stands
☐ Rubbing alcohol
☐ (12) Small cups (labeled with liquid types)
☐ Bag of chromatography paper (minimum 30)
☐ Bag of 8 different black pens (Bic, Crayola, Dry Erase, Expo, Mr. Sketch, Paper Mate, Rose Art, and Sharpie)

Last Revised: 8/20/2014
24
SciTrek Notebook Pages Used With Students:
Last Revised: 8/20/2014
25
Set-Up: SciTrek Lead:
If the classroom has a document camera, ask the teacher to use it for the graph example (page 9) and the conclusion activity (pages 10 and 11). If the classroom does not have a document camera, then tape the example poster-size notebook pages to the front board. Make sure that the results table (the example that will be used to show students how to make their graphs) is completed prior to entering the classroom.
SciTrek Volunteer:
Set out the SciTrek notebook/nametags around the table, setting students in the same small group next to each other. While the lead is going over the data table/graph, place the test tubes in the test tube rack and pour all of the liquids that your groups need into the small cups. Have all supplies ready so that you can set them out as soon as your groups are ready to start.
Introduction (8 minutes – Full Class – SciTrek Lead):
Ask the class, “What is the class question that we are investigating?” The students should reply, “What factors affect the smear?” Tell them that today they will start their experiment to answer this question. However, before they can start their experiment they need to have their procedure and results table completed (most students will have completed this the day before). Once these are finished they can raise their hands and they will receive their experimental supplies form their SciTrek volunteer.
Tell students that when they record their data they will make two measurements: the height of the liquid and the height of the smear. In addition, they will record any other observations such as the colors that are observed in each smear.
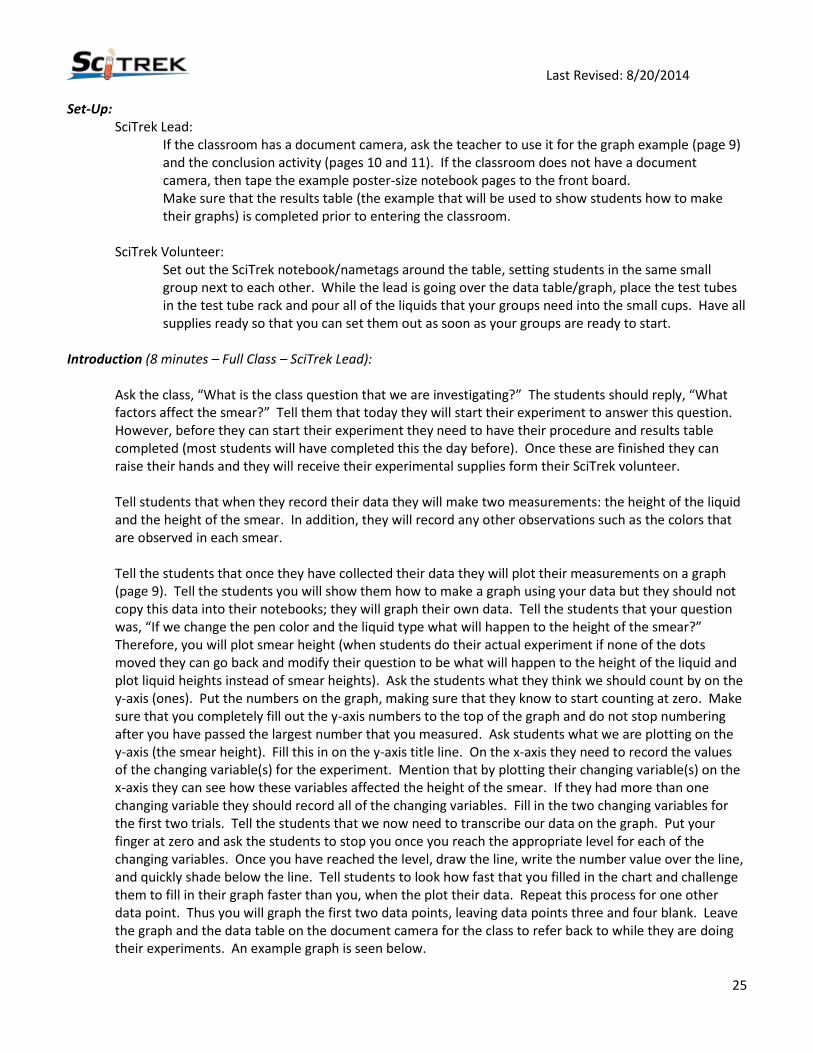
Tell the students that once they have collected their data they will plot their measurements on a graph (page 9). Tell the students you will show them how to make a graph using your data but they should not copy this data into their notebooks; they will graph their own data. Tell the students that your question was, “If we change the pen color and the liquid type what will happen to the height of the smear?” Therefore, you will plot smear height (when students do their actual experiment if none of the dots moved they can go back and modify their question to be what will happen to the height of the liquid and plot liquid heights instead of smear heights). Ask the students what they think we should count by on the y-axis (ones). Put the numbers on the graph, making sure that they know to start counting at zero. Make sure that you completely fill out the y-axis numbers to the top of the graph and do not stop numbering after you have passed the largest number that you measured. Ask students what we are plotting on the y-axis (the smear height). Fill this in on the y-axis title line. On the x-axis they need to record the values of the changing variable(s) for the experiment. Mention that by plotting their changing variable(s) on the x-axis they can see how these variables affected the height of the smear. If they had more than one changing variable they should record all of the changing variables. Fill in the two changing variables for the first two trials. Tell the students that we now need to transcribe our data on the graph. Put your finger at zero and ask the students to stop you once you reach the appropriate level for each of the changing variables. Once you have reached the level, draw the line, write the number value over the line, and quickly shade below the line. Tell students to look how fast that you filled in the chart and challenge them to fill in their graph faster than you, when the plot their data. Repeat this process for one other data point. Thus you will graph the first two data points, leaving data points three and four blank. Leave the graph and the data table on the document camera for the class to refer back to while they are doing their experiments. An example graph is seen below.
Last Revised: 8/20/2014
26
Tell the students that they will now start their experiments and as soon as they are done they can graph their results.
Experiment (20 minutes – Small Groups – SciTrek Volunteers):
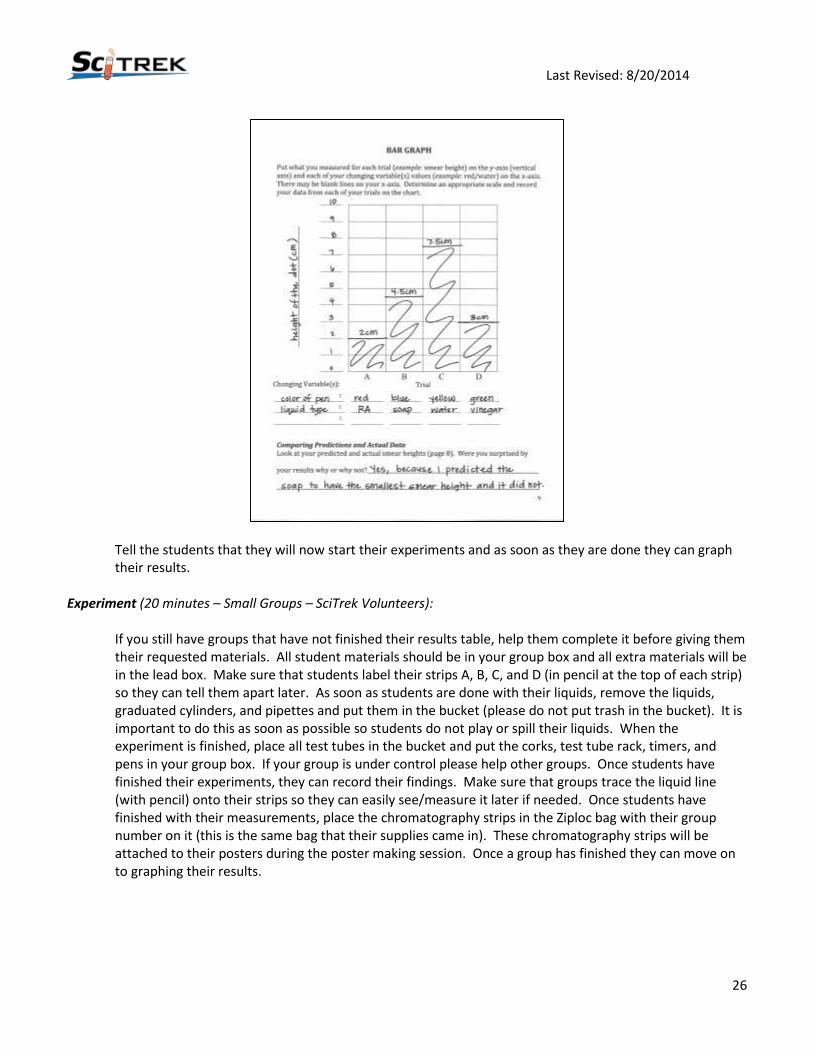
If you still have groups that have not finished their results table, help them complete it before giving them their requested materials. All student materials should be in your group box and all extra materials will be in the lead box. Make sure that students label their strips A, B, C, and D (in pencil at the top of each strip) so they can tell them apart later. As soon as students are done with their liquids, remove the liquids, graduated cylinders, and pipettes and put them in the bucket (please do not put trash in the bucket). It is important to do this as soon as possible so students do not play or spill their liquids. When the experiment is finished, place all test tubes in the bucket and put the corks, test tube rack, timers, and pens in your group box. If your group is under control please help other groups. Once students have finished their experiments, they can record their findings. Make sure that groups trace the liquid line (with pencil) onto their strips so they can easily see/measure it later if needed. Once students have finished with their measurements, place the chromatography strips in the Ziploc bag with their group number on it (this is the same bag that their supplies came in). These chromatography strips will be attached to their posters during the poster making session. Once a group has finished they can move on to graphing their results.

Last Revised: 8/20/2014
27
Bar Graph (10 minutes – Small Groups – SciTrek Volunteers):
Help students fill out their bar graphs (page 9). If students pick systems in which the dot did not smear they can go back to page 5 and revise their question to, “What will happen to the height of the liquid?” from, “What will happen to the height of the smear?” Then they will be able to plot liquid height instead of smear heights. Once they have graphed their values, make sure that they write the number on top of their line so that it is easy to discern the value. Once students have completed their bar graph, have them use their data table to compare their predicted and actual results. They will then write a sentence summarizing these comparisons. If there is time, ask students why they think their results differed from their predictions.
If students finish early they can look at the conclusion activity on page 10 of their notebooks and start labeling each statement as claim, data, or neither.
Conclusion Activity (20 minutes – Full Class – SciTrek Lead):
Tell the students to turn to page 10 in their notebooks. Put a blank notebook under the document camera and turn to page 10. Mention that before they analyze their graphs and draw conclusions, it is important that they recognize and understand other’s conclusions.
Ask the class, “What is a conclusion?” After listening to the student’s answers make sure that the students understand that a conclusion is a claim supported by data. Write this definition on page 10 of the example notebook for the students to copy. Tell the students that in order to make a conclusion we need to make sure that we understand the difference between claim and data. First, read the claim definition and the example. Tell the students that a claim is something that we can verify by testing. Have the class generate approximately four examples of statements that are claims. After a student suggests a possible claim ask the class if the possible claim can be verified by testing. Have the class hold their thumb up if it is a claim and down if it is not. Then ask someone else in the class to propose how you would test this claim. Several examples are seen below. Examples: Claim: rabbits are faster than mice
Test: time rabbits and mice running a certain distance Claim: giraffes are taller than horses Test: measure the height of a horse and a giraffe Claim: the average watermelon weighs more than the average pumpkin Test: weigh pumpkins and watermelons to determine the average weight
Next, read the definition of data and the example aloud. Tell students that data often contains a numerical measurement such as a height (5 m) or a weight (20 kg). Ask the students if data has to contain a numerical measurement. Explain that data can also be in the form of observations. For example, plants are observed to have greener leaves when in direct light than indirect light. When you want to identify if a statement is data look for measurements or words such as recorded or observed that allow you to know that an experiment was performed.

Last Revised: 8/20/2014
28
Ask the students if all statements have to be either a claim or data. Lead students into realizing that some statements are neither a claim nor data; a common example of a statement that is not a claim or data is an opinion statement. Have students generate approximately four examples of opinion statements that are neither claims nor data. Example: Watermelons taste better than pumpkins. Rabbits are cuter than cats.
Read the directions to part 2 aloud to the class. Then work on the activity as a class. Tell the students to look for clues in the sentences to identify the statement as claim, data, or neither. Have the students share what they think is the correct answer and why. Have the class vote using thumbs up/thumbs down if they agree/disagree with the student’s reasoning. After the class has come to agreement, mark the correct answer on the example notebook for students to copy. If the statement is a claim, have the students speculate what data they would need to collect in order to make a conclusion. If the statement is data, have the students generate a claim that could be supported by that data.
Below are the explanations and answers to part 2 letters a-f on page 10.
Letter a: McDonalds served 100 customers and Taco Bell served 75 customers Data (Data Collected: Counted number of people)
This is data because a scientist needed to count the number of people coming out of McDonalds and Taco Bell. This could be paired with a claim to make the conclusion: McDonalds serves more

Last Revised: 8/20/2014
29
customers than Taco Bell because McDonalds served 100 customers and Taco Bell served 75 customers.
Letter b: blue is the best color
Neither-Opinion This statement is neither data nor a claim because it is an opinion and scientists cannot measure/observe opinions. An opinion can never be supported by data, therefore it cannot be a claim.
Letter c: butterflies that are larger than 15 cm are attracted to bright colors Claim
This is not an example of data, because this statement was not measured or observed. Instead it is a claim. Tell students that the numbers that are present in this claim are called descriptive numbers because they describe the experiment that would need to be run to test this claim. These are numbers that identify a group; therefore, they are not a collected measurement. Tell students that we need be able to distinguish between descriptive numbers and collected measurements. Scientists can go out and collect data to support this claim. One piece of data that scientists could collect to support this claim is to count the number of butterflies that land on bright colored paper compared to the number of butterflies that land on black or brown paper. This could be paired with data to make the conclusion: butterflies that are larger than 15 cm are attracted to bright colors because 20 large butterflies landed on the bright papers (neon green, bright yellow, and turquoise) and only 2 landed on the black or brown paper.
Letter d: ice has been observed to float on water Data (Data Collected: observed ice and water)
This is an example of data because a scientist went out and observed ice and water and saw that the ice floated on water. This could be paired with a claim to make the conclusion: ice is less dense than water because ice has been observed to float on water.
Letter e: people buy more pizza than hamburgers
Claim This is not an example of data, because this statement was not measured or observed. Instead it is a claim. Scientists can go out and collect data to support this claim. One piece of data that scientists could collect to support the claim is to count the number of people that buy pizza and hamburgers in one day. This could be paired with data to make the conclusion: people buy more pizza than hamburgers because out of 10 people at the restaurant 7 people bought pizza and only 3 people bought hamburgers.
Letter f: the average male blue whale weighs 100 tons, while the average female blue whale weighs 135 tons
Data (Data Collected: measured the weight of blue whales (female and male)) This is an example of data because a scientist went out and measured the weight of female and male blue whales. This could be paired with a claim to make the conclusion: female blue whales weigh more than male blue whales because the average male blue whale weighs 100 tons, while the average female weighs 135 tons.
Once part 2 is completed have the students turn to page 11 in their notebooks.

Last Revised: 8/20/2014
30
Tell the students that now they are going to practice matching claims with supporting data. Tell the class to read the statements carefully because not all of the claims will make a match. Instruct them to only draw lines between the claims that match up with data. Tell the students to work by themselves for the first couple of minutes (~2 minutes) and that afterwards we will go over the examples as a class.
Ask the class if anyone has identified a match. Read each suggestion claim/data match that is made by a student and then ask the rest of the class if they agree/disagree using thumbs up/thumbs down. If they disagree, ask a student to explain. Continue asking students if they are able to make any other connections until all possible matches are made.
Below are correct matches that can be made from this activity
1. Sony TVs are brighter than Samsung TVs because Sony TVs give off 20 lumens of light and Samsung TVs give off 10 lumens of light.
This is a correct match because the data clearly supports the claim using numerical values to make a conclusion.
2. The color purple is made from blue and red because when blue and red paint were mixed
together the paint was observed to turn purple. This is a correct match because the data clearly supports the claim using an observation to make a conclusion.

Last Revised: 8/20/2014
31
Below are incorrect matches that can be made from this activity
3. Wind turbines produced more electricity than solar panels in California because wind turbines
produce 100 MW of energy and solar panels produce 200 MW of energy in California. This is an incorrect match because the data does not support the claim. The claim says that more electricity is produced in wind turbines, however, the data supports the opposite claim that solar panels produce more electricity. Ask students, in order to make a conclusion do you think scientist can change the claim or the data. Students should realize that scientist can change their claims but they cannot change data. In addition, scientists must include all data when generating a claim.
4. More people read from electronic devices than books because the speed of light is measured to
be 3×10⁸ 𝑚𝑠.
This is an incorrect match because the data has nothing to do with and does not support the claim. Therefore, this is an incorrect conclusion.
Wrap-Up (2 minutes – Full Class – SciTrek Lead):
Tell students that on the next SciTrek visit they will analyze others data from the pen dye experiments to identify appropriate claims and data statements. They will then analyze their data to draw a conclusion. After they will design a second experiment.
Clean-Up:
Before you leave, have students attach their nametags to their notebooks and place them in the group box. Make sure that all of the liquids and dishes are in the bucket and the buckets lid is securely fastened. Bring all materials back to UCSB. In addition, put your lab coat back in your group box.
Day 4: Conclusion Activity/Conclusion/Question/Experimental Set-Up/Procedure Schedule: Introduction (SciTrek Lead) – 2 minutes
Conclusion Activity (SciTrek Lead) – 15 minutes Conclusion (SciTrek Volunteers) – 5 minutes Question (SciTrek Volunteers) – 5 minutes Experimental Set-Up (SciTrek Volunteers) – 10 minutes Procedure (SciTrek Volunteers) – 15 minutes Results Table (SciTrek Volunteers) – 5 minutes Wrap-Up (SciTrek Lead) – 3 minutes
Materials:
(3) Volunteer Boxes:
☐ Student nametags
☐ Volunteer lab coat
☐ Pencil
☐ Student notebooks
☐ (3) Materials pages (group color/number indicated)
☐ Volunteer instructions
☐ (2) Red pens
☐ Notepad
Last Revised: 8/20/2014
32
Lead Box:
☐ (3) Extra student notebooks
☐ (2) Red pens
☐ (3) Materials pages
☐ Lead instructions
☐ Notepad
☐ Time card
☐ Lead lab coat
☐ (2) Pencils
SciTrek Notebook Pages Used with Students:
Last Revised: 8/20/2014
33

Last Revised: 8/20/2014
34
Set-Up:
SciTrek Lead: If the classroom has a document camera, ask the teacher to use it for the conclusion activity (pages 12- 14). If the classroom does not have a document camera, then tape example poster-size notebook pages to the front board. Have students sit in their regular classroom seats when completing the conclusion activity.
SciTrek Volunteer:
Pass out the SciTrek notebooks/nametags to the students in their regular seats. The first part of the activity will be done in their regular classroom seats, then students will break up into their small groups.
Introduction (2 minutes – Full Class – SciTrek Lead):
Have the students sit down in their regular classroom seats. While you are doing the introduction have the SciTrek volunteers hand out the SciTrek notebooks/nametags to the students. Inform students that today they are going to analyze other’s data to determine which claims are appropriate for a given set of results. Then, they will analyze their own data to see if they can make a claim/conclusion. They will then have the opportunity to design a second experiment or redesign their first experiment, which will be carried out during the next SciTrek visit.

Last Revised: 8/20/2014
35
Conclusion Activity (15 minutes – Full Class – SciTrek Lead):
Tell the students to turn to page 12 in their notebooks. Place a blank notebook under the document camera and open to page 12. Tell the students to look over the data table. Ask a student to explain the experiment that was conducted. Make sure that they identify changing variables and controls. For example one explanation might be, “In this experiment, a black dot was drawn on two strips of the original paper with two different pen types. The strips were then put in water for 5 minutes. The changing variable was the pen type and the controls were the time, liquid type, liquid amount, paper type, pen color, and initial dot height.” Ask students what types of statements are needed to make a conclusion. Students should tell you that a conclusion is made from a claim and a supporting data statement. Ask students for the definition of a claim. Students should remind you that a claim is the explanation of your data, a statement that can be verified by testing. Ask students for the definition of data. Students should remind you that data is either a measurement or an observation (known as data) that can be used to support a claim. Ask them if all statements have to be either claim or data. Students should say no; there are many other type of statements, one being opinions that are neither claim nor data statements. Tell the students that we are now going to look over a list of statements about a given data set and then decide if each statement is an example of a claim, data, or an opinion. In addition since we have the results table, we can also check to see if the statement is incorrect; the claim is incorrect if it does not agree with the data or if the statement was not tested.
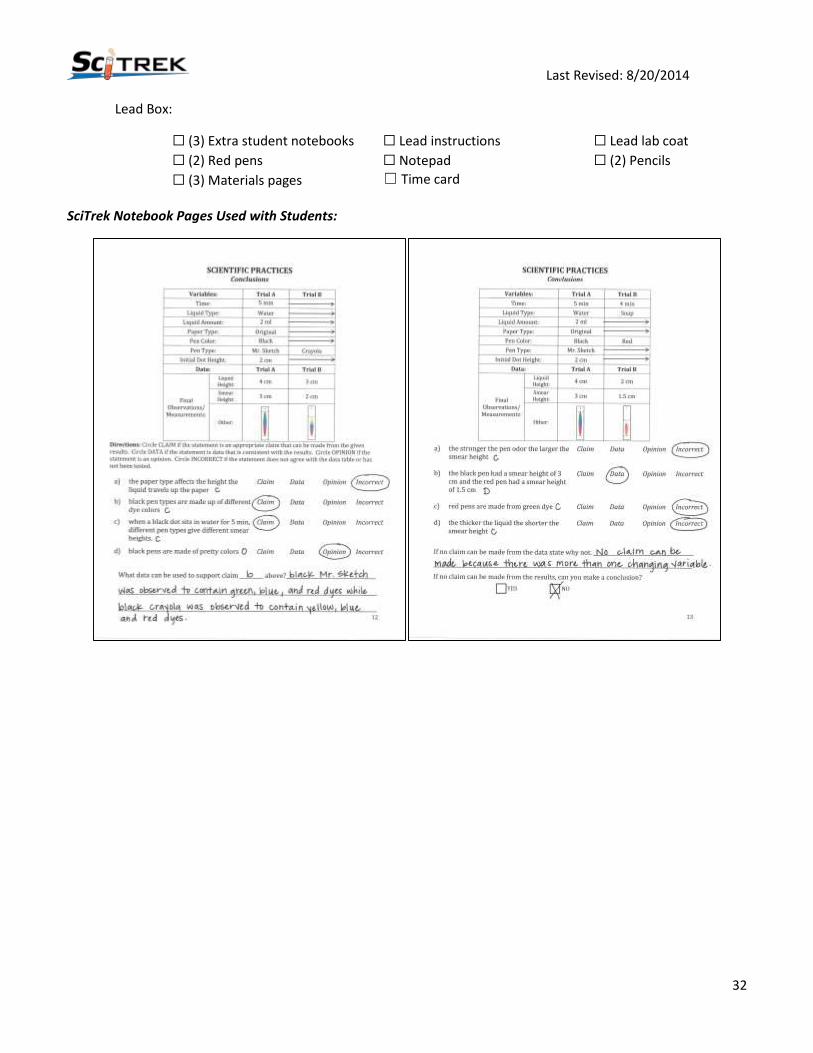
Tell students when determining the classification (claim, data, opinion, or incorrect) of each statement the first thing they should do is read the statement and decide if the statements is claim, data, or opinion. If the statement is a possible claim they should write a “c” by the statement, if the statement is possibly data they should write a “d” by the statement, if the statements is an opinion they should write an “o” by the statement. If they have identified if the statement as claim or data they will need to check to see if it is correct. For claims, the statement will be incorrect if it does not agree with the data or has not been tested. For data, the statement will be incorrect if it does not agree with the results. Letter a: the paper type affects the height the liquid travels up the paper
Incorrect (Claim/Variable Held Constant) Students should identify this statement as a possible claim and write “c” next to the statement. This is a possible claim because the statement was not measured or observed and it is not an opinion. Ask the students if the scientists tested this claim and if the claim is consistent with the data. Students should see that the claim is made about the paper type; however, in the experiment this was a variable that was held constant. Since no data was collected on the effects of changing the paper type there is no data that could support this claim. Therefore, this claim is inappropriate for the results table and students should circle incorrect.
Letter b: black pen types are made up of different dye colors
Correct Students should identify this statement as a possible claim and write “c” next to the statement. This is a possible claim because the statement was not measured or observed and it is not an opinion. Ask the students if the scientists tested this claim and if the claim is consistent with the data. Students should see that the claim is made about the pen type. Pen type was the changing
Last Revised: 8/20/2014
36
variable in the experiment. In addition, the different pen types had different dye colors. Therefore, this claim is consistent with the results table and students should circle claim.
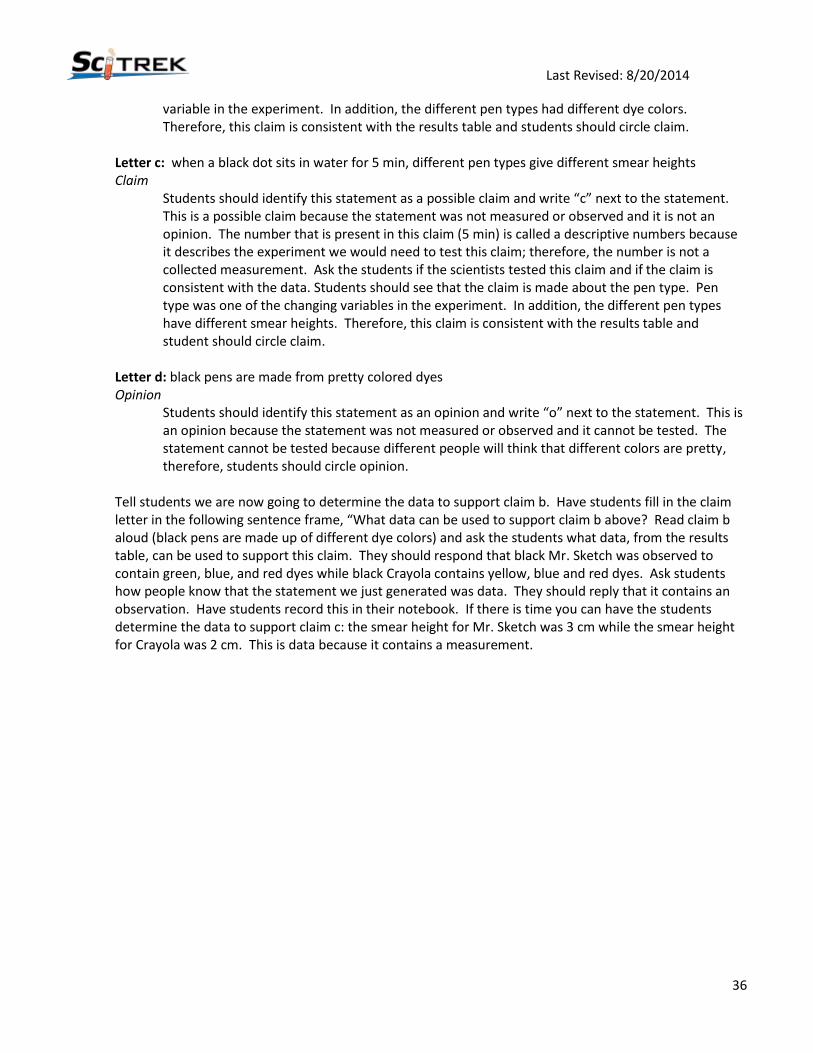
Letter c: when a black dot sits in water for 5 min, different pen types give different smear heights Claim
Students should identify this statement as a possible claim and write “c” next to the statement. This is a possible claim because the statement was not measured or observed and it is not an opinion. The number that is present in this claim (5 min) is called a descriptive numbers because it describes the experiment we would need to test this claim; therefore, the number is not a collected measurement. Ask the students if the scientists tested this claim and if the claim is consistent with the data. Students should see that the claim is made about the pen type. Pen type was one of the changing variables in the experiment. In addition, the different pen types have different smear heights. Therefore, this claim is consistent with the results table and student should circle claim.
Letter d: black pens are made from pretty colored dyes
Opinion Students should identify this statement as an opinion and write “o” next to the statement. This is an opinion because the statement was not measured or observed and it cannot be tested. The statement cannot be tested because different people will think that different colors are pretty, therefore, students should circle opinion.
Tell students we are now going to determine the data to support claim b. Have students fill in the claim letter in the following sentence frame, “What data can be used to support claim b above? Read claim b aloud (black pens are made up of different dye colors) and ask the students what data, from the results table, can be used to support this claim. They should respond that black Mr. Sketch was observed to contain green, blue, and red dyes while black Crayola contains yellow, blue and red dyes. Ask students how people know that the statement we just generated was data. They should reply that it contains an observation. Have students record this in their notebook. If there is time you can have the students determine the data to support claim c: the smear height for Mr. Sketch was 3 cm while the smear height for Crayola was 2 cm. This is data because it contains a measurement.

Last Revised: 8/20/2014
37
Have students turn to page 13 in their notebooks. Turn the example notebook to page 13. Tell the students to look over the data table. Ask a student to explain the experiment that was conducted. Make sure that they identify changing variables and controls. For example one explanation might be, “In this experiment, a different color dot was draw on two strips of the original paper. The papers were in two different liquids for two different times. The changing variables were time, liquid type, and pen color and the controls were liquid amount, paper type, pen type, and initial dot height.” Tell the students that we are now going to go through the same process that we went through with the last data set, identifying each of the given statements as claim, data, opinion, or incorrect.
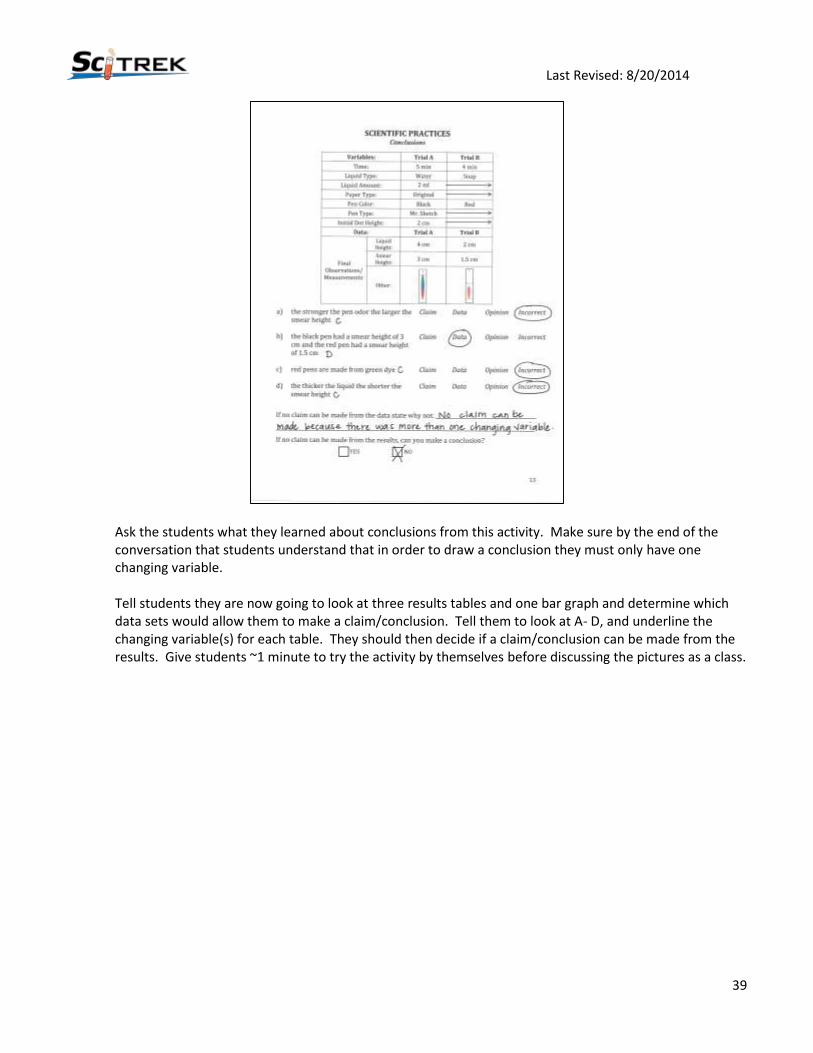
Letter a: the stronger the pen odor the larger the smear height
Incorrect (Claim/No Data Gathered) Students should identify this statement as a possible claim and write “c” next to the statement. This is a possible claim because the statement was not measured or observed and it is not an opinion. Ask the students if the scientists tested this claim and if the claim is consistent with the data. Students should see that the claim is made about the odor of the pens, however, this variable that was not measured in this experiment. Since no data was collected on the effects of odor on smear height there is no data that could support this claim. Therefore, this claim is inappropriate for the results table and students should circle incorrect.
Last Revised: 8/20/2014
38
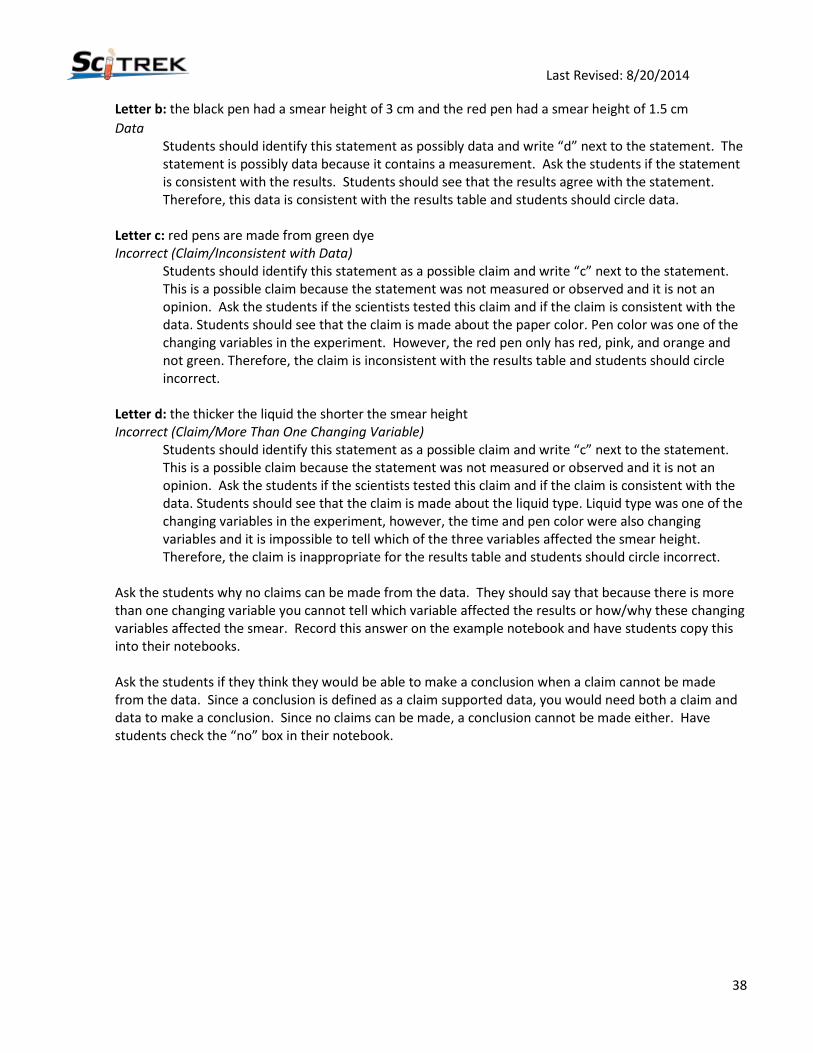
Letter b: the black pen had a smear height of 3 cm and the red pen had a smear height of 1.5 cm
Data Students should identify this statement as possibly data and write “d” next to the statement. The statement is possibly data because it contains a measurement. Ask the students if the statement is consistent with the results. Students should see that the results agree with the statement. Therefore, this data is consistent with the results table and students should circle data.
Letter c: red pens are made from green dye
Incorrect (Claim/Inconsistent with Data) Students should identify this statement as a possible claim and write “c” next to the statement. This is a possible claim because the statement was not measured or observed and it is not an opinion. Ask the students if the scientists tested this claim and if the claim is consistent with the data. Students should see that the claim is made about the paper color. Pen color was one of the changing variables in the experiment. However, the red pen only has red, pink, and orange and not green. Therefore, the claim is inconsistent with the results table and students should circle incorrect.
Letter d: the thicker the liquid the shorter the smear height
Incorrect (Claim/More Than One Changing Variable) Students should identify this statement as a possible claim and write “c” next to the statement. This is a possible claim because the statement was not measured or observed and it is not an opinion. Ask the students if the scientists tested this claim and if the claim is consistent with the data. Students should see that the claim is made about the liquid type. Liquid type was one of the changing variables in the experiment, however, the time and pen color were also changing variables and it is impossible to tell which of the three variables affected the smear height. Therefore, the claim is inappropriate for the results table and students should circle incorrect.
Ask the students why no claims can be made from the data. They should say that because there is more than one changing variable you cannot tell which variable affected the results or how/why these changing variables affected the smear. Record this answer on the example notebook and have students copy this into their notebooks. Ask the students if they think they would be able to make a conclusion when a claim cannot be made from the data. Since a conclusion is defined as a claim supported data, you would need both a claim and data to make a conclusion. Since no claims can be made, a conclusion cannot be made either. Have students check the “no” box in their notebook.
Last Revised: 8/20/2014
39
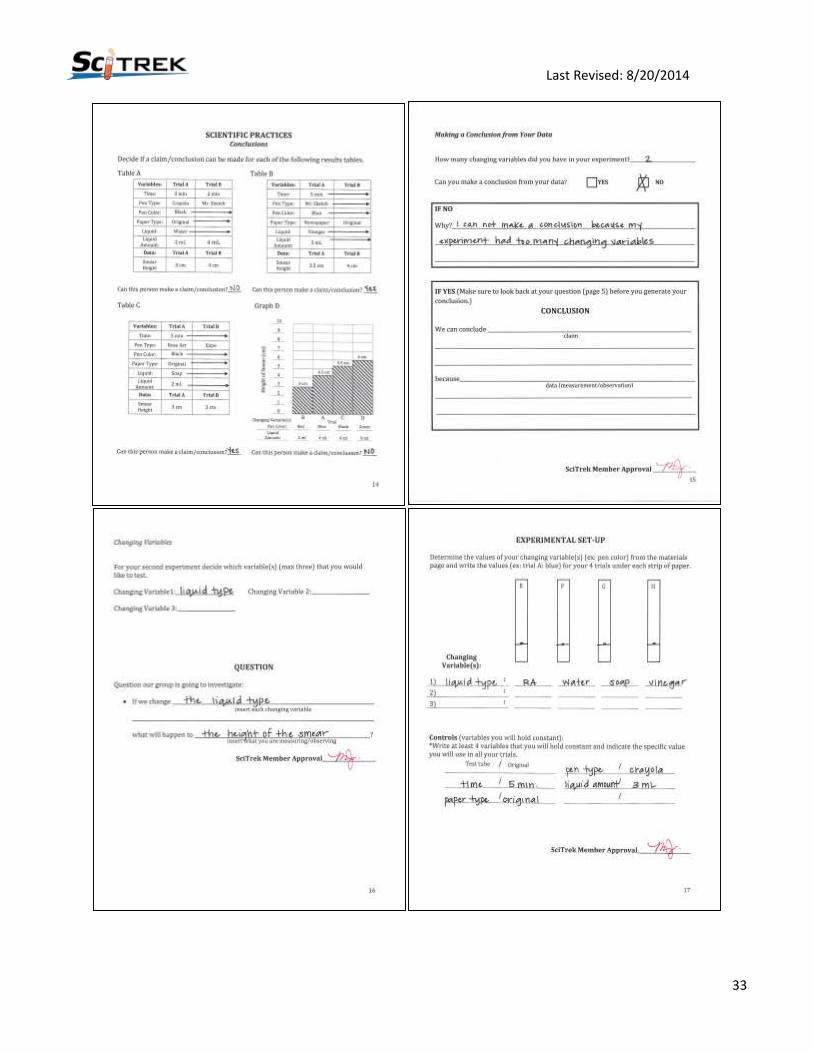
Ask the students what they learned about conclusions from this activity. Make sure by the end of the conversation that students understand that in order to draw a conclusion they must only have one changing variable. Tell students they are now going to look at three results tables and one bar graph and determine which data sets would allow them to make a claim/conclusion. Tell them to look at A- D, and underline the changing variable(s) for each table. They should then decide if a claim/conclusion can be made from the results. Give students ~1 minute to try the activity by themselves before discussing the pictures as a class.

Last Revised: 8/20/2014
40
Ask students the following questions: Table A
What is/are the changing variable(s)? time, pen type, and liquid amount
How many changing variables are there? three Can a conclusion/claim be made from this data?
no Why not?
This experiment had 3 changing variables and conclusions/claims can only be made when there is one changing variable.
Table B What is/are the changing variable(s)?
paper type How many changing variables are there? one Can a conclusion/claim be made from this data?
yes Did the paper type affect the smear height?
yes

Last Revised: 8/20/2014
41
Table C What is/are the changing variable(s)?
pen type How many changing variables are there? one Can a conclusion/claim be made from this data?
yes Did the pen type effect the smear height?
no Graph D
What is/are the changing variable(s)? pen color , and liquid amount
How many changing variables are there? two Can a conclusion/claim be made from this data?
no Why not?
They had two changing variables and conclusions/claims can only be made when there is one changing variable.
Tell students that tables (such as tables A-C) and graphs (such as graph D) represent two different ways of displaying results from an experiment. Ask the students what the advantages and disadvantages are for tables versus graphs. Students should realize that viewing at the data in table form yields a complete idea about what experiment was conducted and which controls were used; however, it is harder to see patterns in the data. Alternatively, viewing the data in graph form allows patterns or trends to be viewed but does not display the controls the experimenter used.
Inform students that scientists often graph their own data so that they are better able to understand their results and to look for patterns and trends that can best explain their data. Point out that in Graph D Trial B is graphed before Trial A. Ask students why they think the data was graphed in this way. Students should respond that it was graphed this way to show a pattern. Tell students that when they make their own graphs they can graph the trials in any order so that they might be able to better see trends or patterns in their results.
Tell students that they will now analyze their data to see if they can make a conclusion. Notify them that the group that comes up with the best conclusion, or claim supported by data, will get a prize on the last day of the module. Remind them that it is okay if they cannot draw a conclusion from their first experiment because they will have the opportunity to run another experiment in which they should only have one changing variable so that they will be able to draw a conclusion.
Inform students that once they have decided if they can/cannot make a conclusion they will either state why they cannot make a conclusion or use their results to make a conclusion. Once this is complete they can move on to designing their new experiment. Tell them that they are going to give poster presentations at the end of the module and the presentations will be more interesting if there are multiple changing variables that have been tested. In addition if a wide range of variables are chosen, the class question (What factors affect the smear?) will be more likely to be answered. Therefore, they should try to explore a changing variable that they think no one else in the class is investigating.
Last Revised: 8/20/2014
42
Tell students they will now start working with their group to analyze their old experiment and start their new experiment.
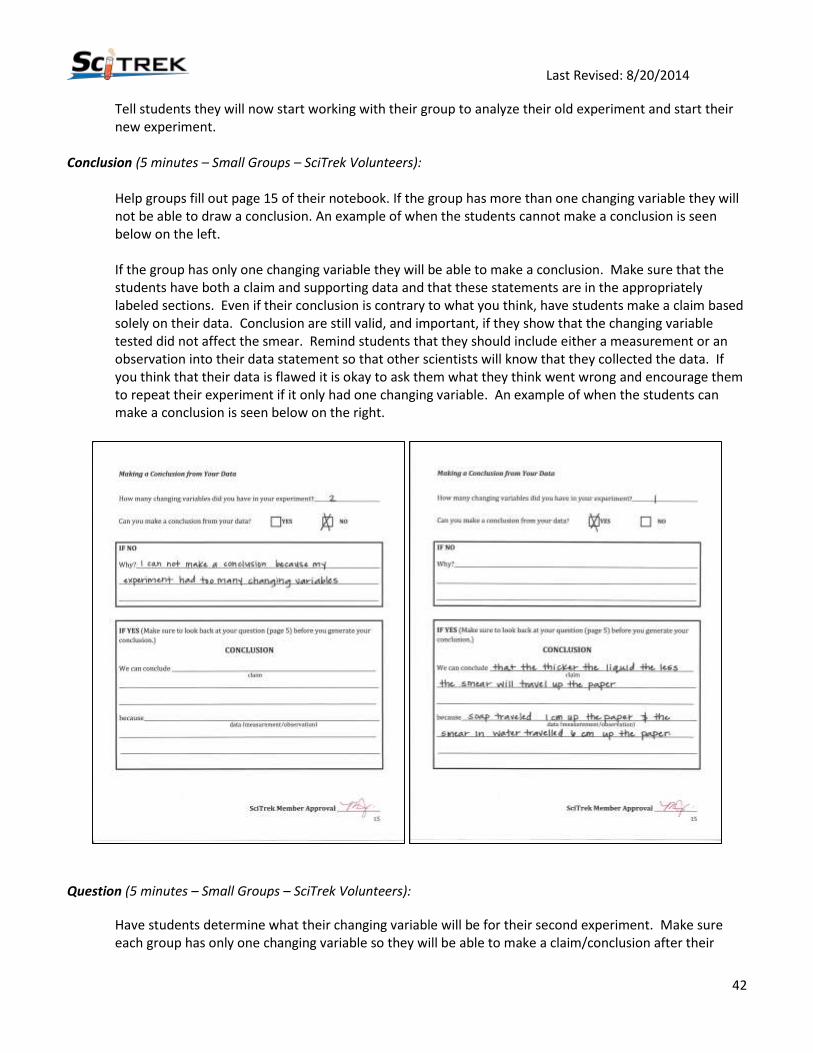
Conclusion (5 minutes – Small Groups – SciTrek Volunteers):
Help groups fill out page 15 of their notebook. If the group has more than one changing variable they will not be able to draw a conclusion. An example of when the students cannot make a conclusion is seen below on the left.
If the group has only one changing variable they will be able to make a conclusion. Make sure that the students have both a claim and supporting data and that these statements are in the appropriately labeled sections. Even if their conclusion is contrary to what you think, have students make a claim based solely on their data. Conclusion are still valid, and important, if they show that the changing variable tested did not affect the smear. Remind students that they should include either a measurement or an observation into their data statement so that other scientists will know that they collected the data. If you think that their data is flawed it is okay to ask them what they think went wrong and encourage them to repeat their experiment if it only had one changing variable. An example of when the students can make a conclusion is seen below on the right.
Question (5 minutes – Small Groups – SciTrek Volunteers):
Have students determine what their changing variable will be for their second experiment. Make sure each group has only one changing variable so they will be able to make a claim/conclusion after their

Last Revised: 8/20/2014
43
experiment. If possible, encourage your small groups to each have a different changing variable. After groups have decided on their changing variable have them fill out their question. When you sign off on their question you can give them a materials page with their group color and number designated in the upper right hand corner. Select one group member to read their question they are going to investigate to the class during the wrap-up discussion.
Experimental Set-Up (10 minutes – Small Groups – SciTrek Volunteers):
Have groups determine the values for their changing variable and record them in their experimental set-up on page 17. Then encourage students to determine what their controls will be and have them record these constants on the left side of the line in their experimental set-up on page 17. After have students determine the values of their controls with the help of the materials page. Ask students to justify the values that they have chosen for their controls and have them tell you if these values will make it easier or harder to answer their question. In addition, collect the material page and make sure that it is filled out correctly. It is essential for students to do this so that they can start their experiments during the next class. An example of a notebook and materials page is seen below.
Last Revised: 8/20/2014
44
Procedure (15 minutes – Small Groups – SciTrek Volunteers):
After each small group has filled out their experimental set-up they can start on their procedure (page 18). Once the students have their procedure written in their notebooks they should raise their hands to get approval by their SciTrek group volunteer. If they are having problems with their procedure they should look back at their initial procedure on page 7 of their notebook. If they are still having trouble, you can have these groups dictate to you what they want to do for each step while you transcribe on a notepad found in the group’s box. Give this sheet to the students to copy into their notebooks. Make sure that you have students include all changing variables values in the procedure. For example, if pen color was one of the changing variables, “put dot on each strip of paper E) red, F) blue, G) green, and H) yellow.” Keep procedure as brief as possible with still conveying the pertinent information about the experiment.

Last Revised: 8/20/2014
45
Results Table (5 minutes – Small Groups – SciTrek Volunteers):
Have groups fill in their results table. Make sure that for their controls they are only writing the value of the control in trial E and then drawing a line through the remaining trials. For the changing variable(s) they need to write the value of the variable in each of the boxes. When students have finished, have them make predictions about the final height of the smear. Try to question each group on their thought process behind their predicted order. See example notebook below.
If there is extra time have the group close their notebooks and explain to each other what they will do for their experiment.
Wrap-Up (3 minutes – Full Class – SciTrek Lead):
Have one group from each of the large groups read the question that they are going to investigate. Tell the students that you are really excited to see their experiments and they will get a chance to perform these experiments the next SciTrek visit.
Clean-Up:
Before you leave, have students attach their nametags to their notebooks and place them in the group box. Place the materials pages on top of the notebooks in your group box. Bring all materials back to UCSB. In addition, put your lab coat back in your group box.

Last Revised: 8/20/2014
46
Day 5: Experiment/Conclusion Schedule:
Introduction (SciTrek Lead) – 10 minutes Experiment (SciTrek Volunteers) – 20 minutes
Bar Graph (SciTrek Volunteers) – 10 minutes Conclusion (SciTrek Volunteers) – 17 minutes Wrap-Up (SciTrek Lead) – 3 minutes
Materials:
(3) Volunteer Boxes:
☐ Student nametags
☐ Volunteer lab coat
☐ (3) Test tube stands
☐ Rubbing alcohol
☐ (12) Small cups (labeled with liquid types)
☐ Student notebooks
☐ Notepad
☐ (3) Pencils
☐ Vinegar
☐ (6) Rulers
☐ Volunteer instructions
☐ (2) Red pens
☐ Water
☐ Soap
☐ Paper towels
(3) Ziploc Bags labeled group 1, 2, and 3 each with the following:
☐ Requested strips of paper
☐ (2) Graduated cylinders
☐ Paper towel
☐ Requested pens
☐ Timer
☐ (2) Droppers
☐ (4) Corks
Other Supplies:
☐ Box of test tubes ☐ Bucket
Lead Box:
☐ (3) Student notebooks
☐ Notepad
☐ (2) Pencils
☐ Vinegar
☐ (4) Rulers
☐ Bag with the 11 different kinds of papers (minimum 20 each)
☐ (8) Droppers
☐ (10) Corks
☐ Time card
☐ Lead instructions
☐ (2) Red pens
☐ Water
☐ Soap
☐ Paper towels
☐ (5) Bags of different colored markers (Mr. Sketch, Crayola, Expo, Sharpie, and Rose Art)
☐ (4) 10 ml Graduated cylinders
☐ Graphs, two, for conclusion activity
☐ Lead lab coat
☐ (2)Test tube stands
☐ Rubbing alcohol
☐ (12) Small cups (labeled with liquid types)
☐ Bag of chromatography paper (minimum 30)
☐ Bag of 8 different black pens (Bic, Crayola, Dry Erase, Expo, Mr. Sketch, Paper Mate, Rose Art, and Sharpie)
☐ (2) Timers
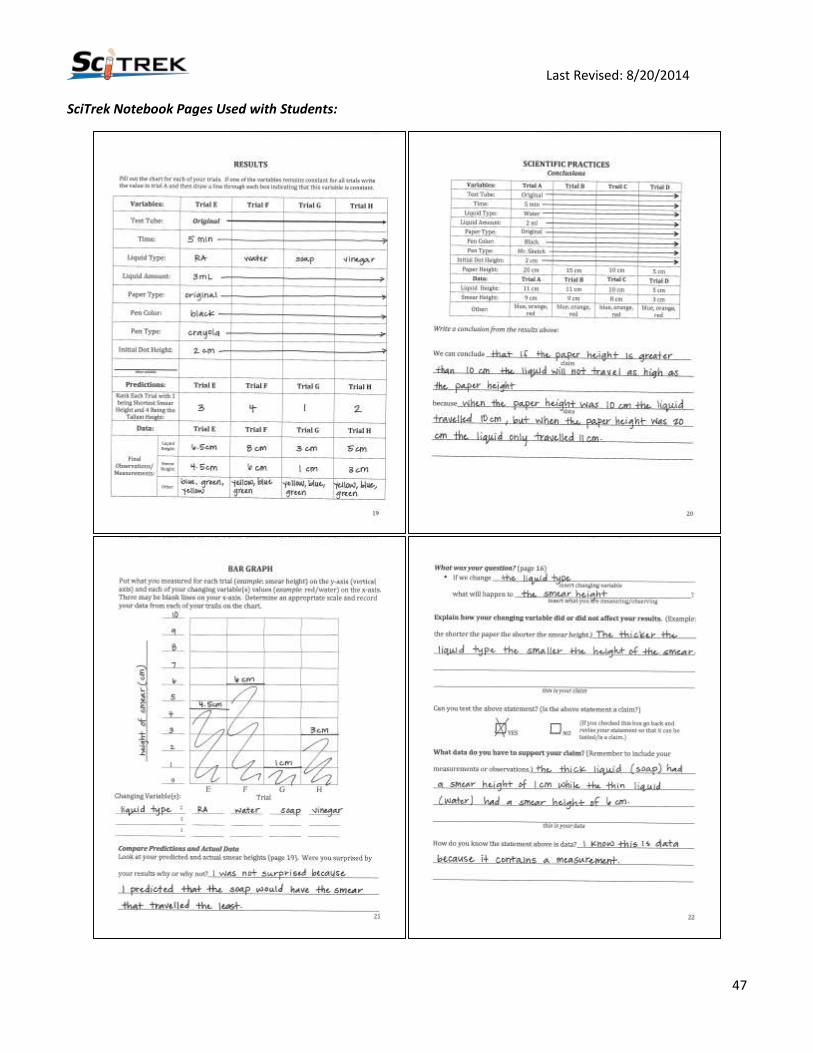
Last Revised: 8/20/2014
47
SciTrek Notebook Pages Used with Students:
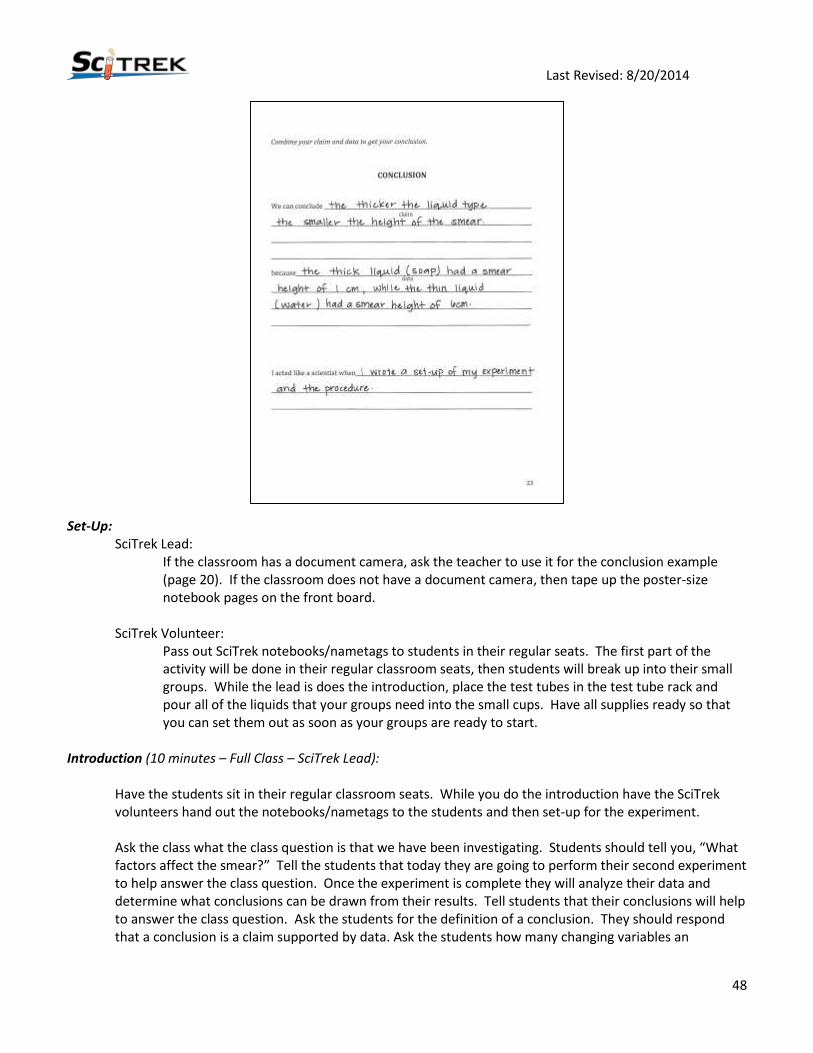
Last Revised: 8/20/2014
48
Set-Up: SciTrek Lead:
If the classroom has a document camera, ask the teacher to use it for the conclusion example (page 20). If the classroom does not have a document camera, then tape up the poster-size notebook pages on the front board.
SciTrek Volunteer:
Pass out SciTrek notebooks/nametags to students in their regular seats. The first part of the activity will be done in their regular classroom seats, then students will break up into their small groups. While the lead is does the introduction, place the test tubes in the test tube rack and pour all of the liquids that your groups need into the small cups. Have all supplies ready so that you can set them out as soon as your groups are ready to start.
Introduction (10 minutes – Full Class – SciTrek Lead):
Have the students sit in their regular classroom seats. While you do the introduction have the SciTrek volunteers hand out the notebooks/nametags to the students and then set-up for the experiment. Ask the class what the class question is that we have been investigating. Students should tell you, “What factors affect the smear?” Tell the students that today they are going to perform their second experiment to help answer the class question. Once the experiment is complete they will analyze their data and determine what conclusions can be drawn from their results. Tell students that their conclusions will help to answer the class question. Ask the students for the definition of a conclusion. They should respond that a conclusion is a claim supported by data. Ask the students how many changing variables an
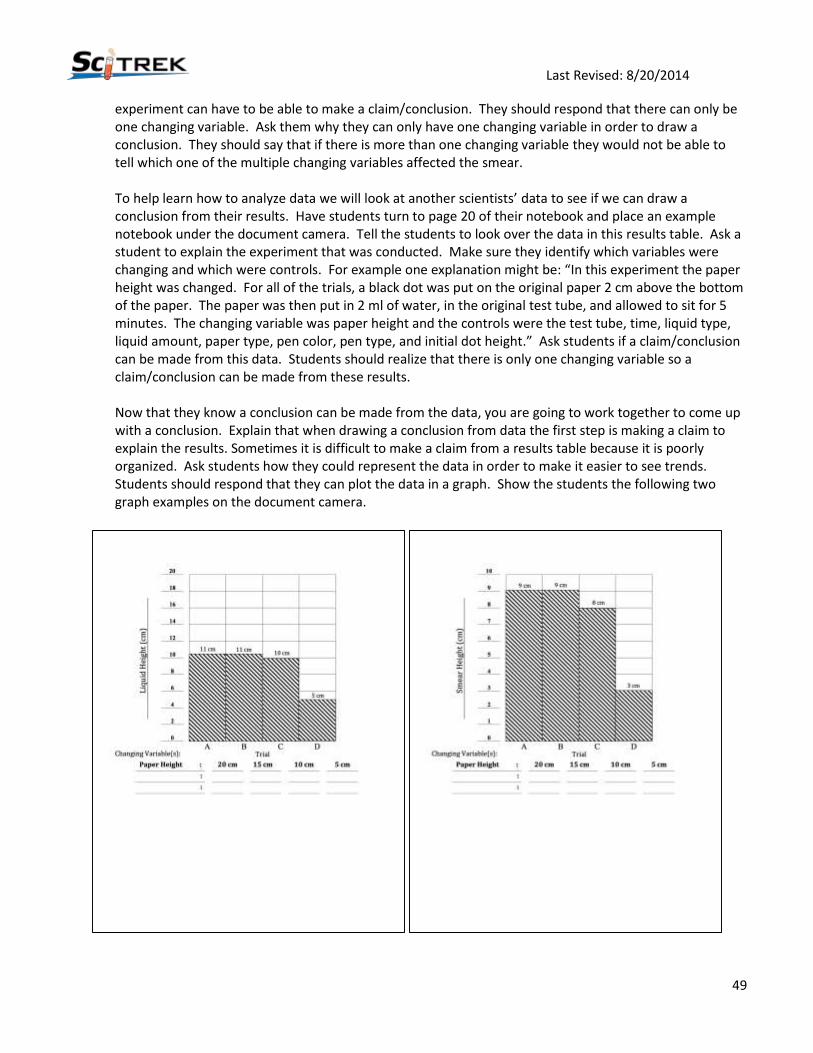
Last Revised: 8/20/2014
49
experiment can have to be able to make a claim/conclusion. They should respond that there can only be one changing variable. Ask them why they can only have one changing variable in order to draw a conclusion. They should say that if there is more than one changing variable they would not be able to tell which one of the multiple changing variables affected the smear. To help learn how to analyze data we will look at another scientists’ data to see if we can draw a conclusion from their results. Have students turn to page 20 of their notebook and place an example notebook under the document camera. Tell the students to look over the data in this results table. Ask a student to explain the experiment that was conducted. Make sure they identify which variables were changing and which were controls. For example one explanation might be: “In this experiment the paper height was changed. For all of the trials, a black dot was put on the original paper 2 cm above the bottom of the paper. The paper was then put in 2 ml of water, in the original test tube, and allowed to sit for 5 minutes. The changing variable was paper height and the controls were the test tube, time, liquid type, liquid amount, paper type, pen color, pen type, and initial dot height.” Ask students if a claim/conclusion can be made from this data. Students should realize that there is only one changing variable so a claim/conclusion can be made from these results.
Now that they know a conclusion can be made from the data, you are going to work together to come up with a conclusion. Explain that when drawing a conclusion from data the first step is making a claim to explain the results. Sometimes it is difficult to make a claim from a results table because it is poorly organized. Ask students how they could represent the data in order to make it easier to see trends. Students should respond that they can plot the data in a graph. Show the students the following two graph examples on the document camera.
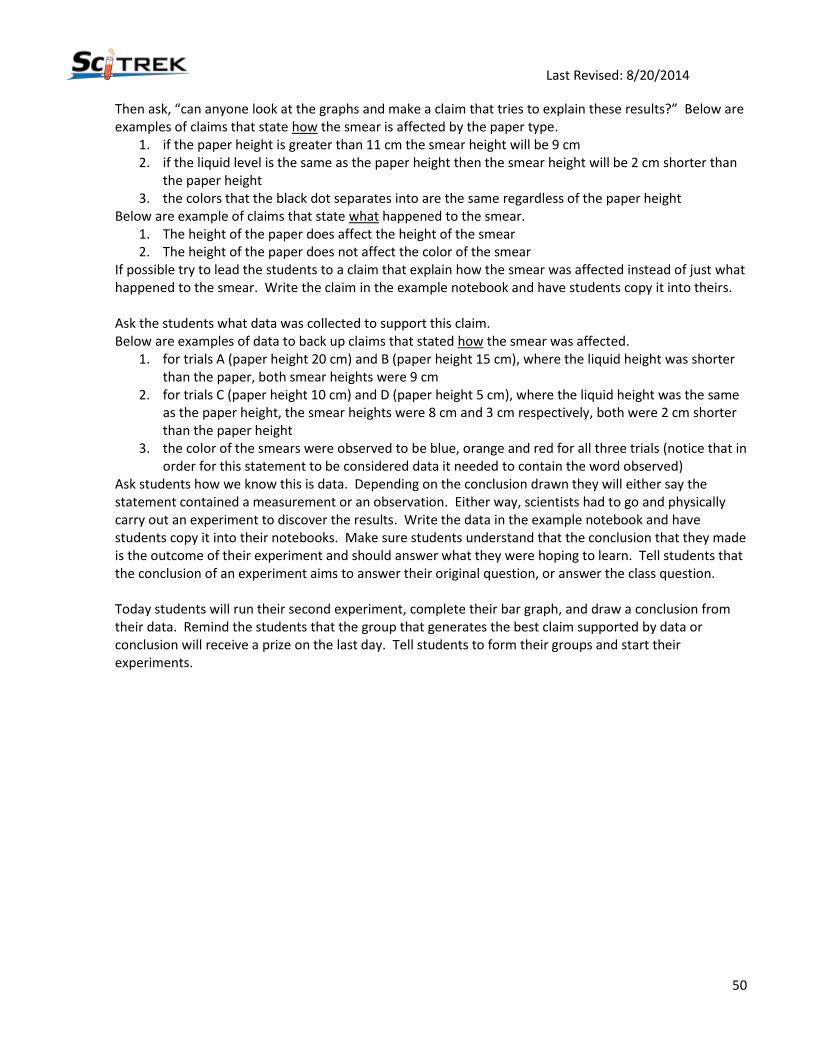
Last Revised: 8/20/2014
50
Then ask, “can anyone look at the graphs and make a claim that tries to explain these results?” Below are examples of claims that state how the smear is affected by the paper type.
1. if the paper height is greater than 11 cm the smear height will be 9 cm 2. if the liquid level is the same as the paper height then the smear height will be 2 cm shorter than
the paper height 3. the colors that the black dot separates into are the same regardless of the paper height
Below are example of claims that state what happened to the smear. 1. The height of the paper does affect the height of the smear 2. The height of the paper does not affect the color of the smear
If possible try to lead the students to a claim that explain how the smear was affected instead of just what happened to the smear. Write the claim in the example notebook and have students copy it into theirs. Ask the students what data was collected to support this claim.
Below are examples of data to back up claims that stated how the smear was affected. 1. for trials A (paper height 20 cm) and B (paper height 15 cm), where the liquid height was shorter
than the paper, both smear heights were 9 cm 2. for trials C (paper height 10 cm) and D (paper height 5 cm), where the liquid height was the same
as the paper height, the smear heights were 8 cm and 3 cm respectively, both were 2 cm shorter than the paper height
3. the color of the smears were observed to be blue, orange and red for all three trials (notice that in order for this statement to be considered data it needed to contain the word observed)
Ask students how we know this is data. Depending on the conclusion drawn they will either say the statement contained a measurement or an observation. Either way, scientists had to go and physically carry out an experiment to discover the results. Write the data in the example notebook and have students copy it into their notebooks. Make sure students understand that the conclusion that they made is the outcome of their experiment and should answer what they were hoping to learn. Tell students that the conclusion of an experiment aims to answer their original question, or answer the class question.
Today students will run their second experiment, complete their bar graph, and draw a conclusion from their data. Remind the students that the group that generates the best claim supported by data or conclusion will receive a prize on the last day. Tell students to form their groups and start their experiments.

Last Revised: 8/20/2014
51
Experiment (20 minutes – Small Groups – SciTrek Volunteers):
If you still have groups that have not finished their results table, help them complete it before giving them their requested materials. All student materials should be in your group box and all extra materials will be in the lead box. Make sure that students label their strips E, F, G, and H (in pencil at the top of each strip)
so they can tell them apart later. As soon as students are done with their liquids, remove the liquids, graduated cylinders, and pipettes and put in the bucket (please do not put trash in the bucket). It is important to do this as soon as possible so students do not play or spill their liquids. When the experiment is finished, place all test tubes in the bucket and put the corks, test tube rack, timers, and pens in your group box. If your group has things under control please help other groups. Once students have finished their experiments, they can record their findings. Make sure that groups draw the liquid line (with pencil) onto their strips so they can easily see/measure it later if needed. Once students have finished their measurements, place their chromatography strips in the Ziploc bag with their group number on it (this is the same bag that their supplies came in). These chromatography strips will be attached to their posters during the poster making session. Once a group has finished they can move onto graphing their results.
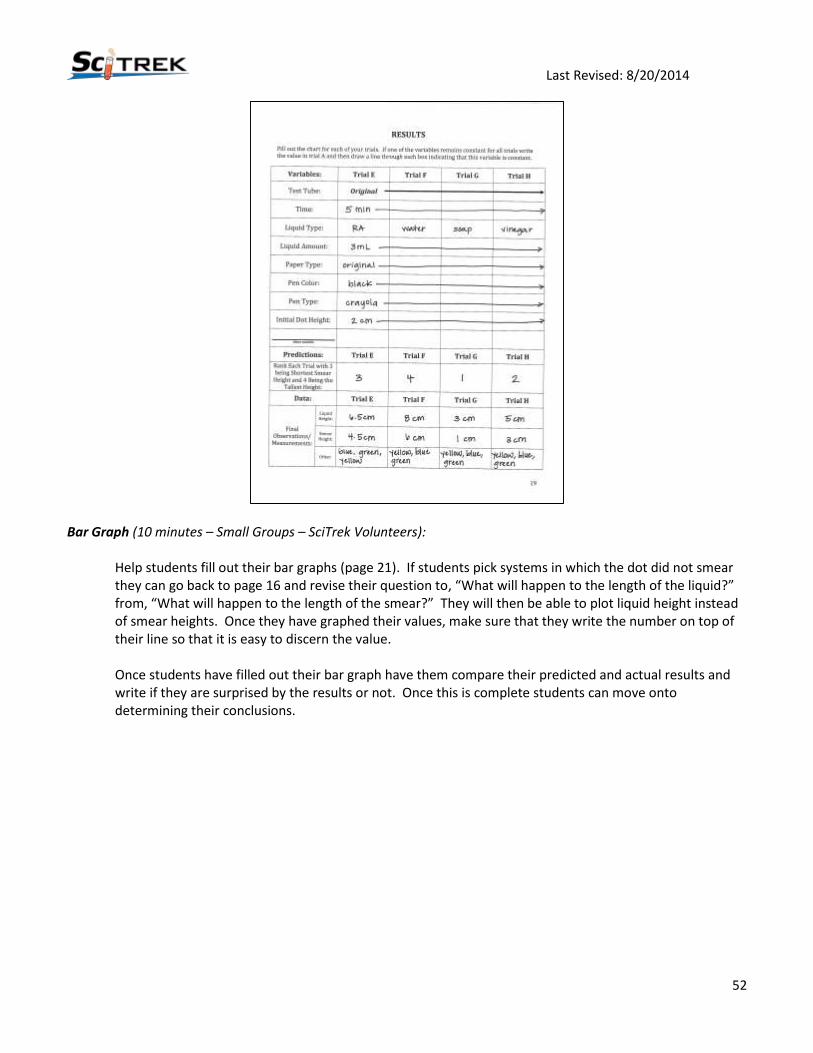
Last Revised: 8/20/2014
52
Bar Graph (10 minutes – Small Groups – SciTrek Volunteers):
Help students fill out their bar graphs (page 21). If students pick systems in which the dot did not smear they can go back to page 16 and revise their question to, “What will happen to the length of the liquid?” from, “What will happen to the length of the smear?” They will then be able to plot liquid height instead of smear heights. Once they have graphed their values, make sure that they write the number on top of their line so that it is easy to discern the value. Once students have filled out their bar graph have them compare their predicted and actual results and write if they are surprised by the results or not. Once this is complete students can move onto determining their conclusions.

Last Revised: 8/20/2014
53
Conclusion (15 minutes – Small Groups – SciTrek Volunteers):
Help the students write their conclusion. First, have them copy their question from page 16 of their notebook onto the conclusions page (page 22). (If they had to change the measurement in their question from smear height to liquid height or vice versa, they can revise their question and record this onto page 16). Second, have the students discuss if their changing variable affected smear/water level and how. Challenge students to think about how their changing variable did or did not affect their measurements. For this experiment we will not focus on why the dot is spreading up the paper. Once they have discussed their ideas have the students fill out the first part on the conclusions page (page 22), “explain how your changing variable did or did not affect your results.” Example claims that state how the changing variable did or did not affect measurements.
Claim 1: the more absorbent the paper the larger the smear Claim 2: the more time the taller the smear
Example claims that state what happened to the smear. Claim 3: the paper type affected the height of the smear Claim 4: the color of the pen did not affect the height of the smear If possible have students determine how their changing variable did or did not affect results (claims 1 and 2). If they cannot determine how, have them state what happened to the smear (claims 3 and 4). The best claims will allow students to make predictions about systems that they have not experimented with. Have students verify that their proposed statement is testable. If it is testable then the statement is a claim but if it is not testable then they need to revise their statement.

Last Revised: 8/20/2014
54
After students have determined their claim have them determine the supporting data. This is when students should look at their results table and record in words what measurements or observations were used to support their claim. Example data to support the four claims that are previously listed.
Data 1: the smear on the paper towel (most absorbent) was 3 cm and the smear on the copy paper (least absorbent) was 0.5 cm Data 2: the strip that sat in the liquid for 1 minute had a 1 cm smear and the strip that sat in the liquid for 5 minutes had a 4 cm smear Data 3: the smear on the paper towel was 3 cm and the smear on the copy paper was 0.5 cm Data 4: all of the smears by the Mr. Sketch pens, regardless of color, were about 3 cm long
Once students have determined the data needed to support their claim, have them justify how they know the statement should be classified as data. (Statements that are data contain a measurement or an observation. If the statement has an observation make sure the word “recorded” or “observed” is in the statement to indicate that the experiment was carried out.) If the data statement does not have a measurement or the words “observed” or “recorded,” have students modify their statement. Then have students combine their claim and data to generate their conclusion.
Example conclusions:
Conclusion 1: The more absorbent the paper the larger the smear because the smear on the paper towel (most absorbent) was 3 cm and the smear on the copy paper (least absorbent) was 0.5 cm. Conclusion 2: The more time the taller the smear because the strip that sat in the liquid for 1 minute had a 1 cm smear and the strip that sat in the liquid for 5 minutes had a 4 cm smear. Conclusion 3: The type of paper affected the height of the smear because the smear on the paper towel was 3 cm and the smear on the copy paper was 0.5 cm. Conclusion 4: The color of the pen did not affect the height of the smear because all of the smears by the Mr. Sketch pens, regardless of color, were about 3 cm long.
Example student work for the conclusion section can be seen below.
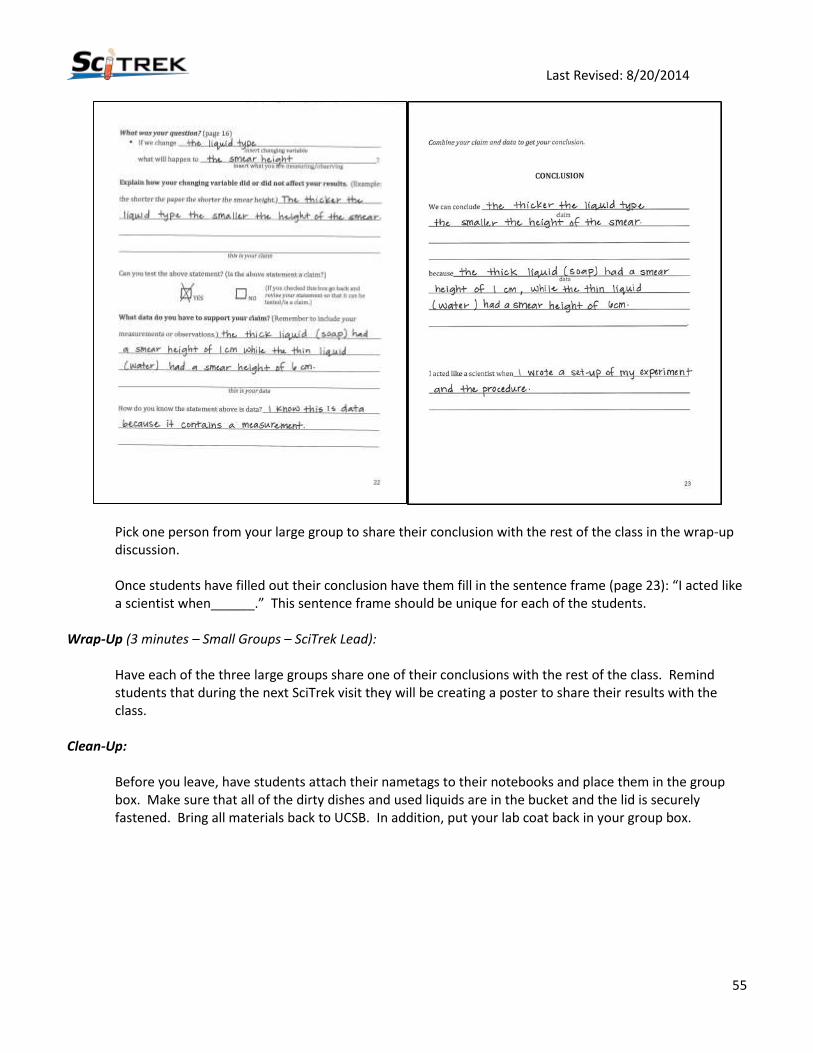
Last Revised: 8/20/2014
55
Pick one person from your large group to share their conclusion with the rest of the class in the wrap-up discussion. Once students have filled out their conclusion have them fill in the sentence frame (page 23): “I acted like a scientist when______.” This sentence frame should be unique for each of the students.
Wrap-Up (3 minutes – Small Groups – SciTrek Lead):
Have each of the three large groups share one of their conclusions with the rest of the class. Remind students that during the next SciTrek visit they will be creating a poster to share their results with the class.
Clean-Up:
Before you leave, have students attach their nametags to their notebooks and place them in the group box. Make sure that all of the dirty dishes and used liquids are in the bucket and the lid is securely fastened. Bring all materials back to UCSB. In addition, put your lab coat back in your group box.

Last Revised: 8/20/2014
56
Day 6: Poster Making Schedule: Introduction (SciTrek Lead) – 2 minutes
Verify Classmates’ Conclusion (SciTrek Volunteers) – 10 minutes Poster Making (SciTrek Volunteers) – 46 minutes Wrap-Up (SciTrek Lead) – 2 minutes Materials:
(3) Volunteer Boxes:
☐ Student nametags
☐ Volunteer lab coat
☐ (2) Glues
☐ (3) Stickers on how to present graph
☐ Student notebooks
☐ (2) Pencils
☐ Scissors
☐ (6) Paperclips
☐ Volunteer instructions
☐ Highlighter
☐ Poster diagram (full page)
☐ (3) Sets of Student strips from experiment
Poster Parts
☐ (3) Scientists’ names
☐ (3) Procedures
☐ (3) Conclusions
☐ (3) Questions
☐ (3) Results
☐ (12) “I acted like a scientist when ______”
☐ (3) Experimental set-ups
☐ (3) Results graphs
☐ (12) Picture spaces
Other Supplies:
☐ Large poster paper
Lead Box:
☐ (3) Extra notebooks
☐ (2) Pencils
☐ (2) Scissors
☐ (6) Paperclips
☐ Lead instructions
☐ (2) Highlighters
☐ Poster diagram (full page)
☐ Scotch tape
☐ Lead lab coat
☐ (2) Glues
☐ (3) Stickers on how to present graph
☐ Time Card Set-Up:
SciTrek Lead:
Ask the classroom teacher for a place to leave the student posters in the classroom.
SciTrek Volunteer: Set out SciTrek notebooks/nametags around the table making sure to set students that are in the same small group next to each other. Have poster parts ready for students.

Last Revised: 8/20/2014
57
SciTrek Notebook Pages Used with Students:
Introduction (2 minutes – Full Class – SciTrek Lead):
Ask the class, “What is the class question that we have been investigating?” Students should tell you, “What factors affects the smear?” Inform the class that they will be making posters to present their findings to the class. Before they make posters they will have a collaborator, a scientist/student studying a similar subject, checking their conclusion. At the same time they will check their collaborators conclusion. Ask the class how scientists’ define conclusion, a claim supported by data. Ask the class what a claim is, the explanation of your results, something that can be tested, as well as what data is, measurements or observations. Inform students that when they read their collaborators conclusion they should make sure that the first statement is a claim and can be tested and the second statement, after the “because,” should be data and contain either a measurement or an observation. Once they have checked and committed on their collaborators conclusion they will switch notebooks back. They should then read over the comments and improve their conclusion if needed. After they have revised their conclusion they will create a poster to present to the class during the next SciTrek visit. This presentation will tell the class what their group has discovered about the class questions. Tell students that they should write as neatly as possible on the poster parts so that the other class members can read their poster. In addition, they will pick one of their two experiments to present. Remind them that they should pick an experiment from which they were able to draw a conclusion.

Last Revised: 8/20/2014
58
Verify Classmates’ Conclusion (10 minutes – Small Groups – SciTrek Volunteers):
Have students collaborate with a student from another group. Have the two students switch notebooks and check each other’s conclusions (page 23). When they are done have them return the notebook to the original owner. An example of a checked conclusion is seen below.
Poster Making (46 minutes – Small Groups – SciTrek Volunteers):
Each small group (three/four students) will make one poster on one of their experiments from which they can draw a conclusion. Assign each student a part of the poster to complete. If a student struggles with writing try to give them a shorter writing section to complete (example: experimental set-up). Have the students write their name on the sections that they complete. In the students’ notebook highlight the section that they will complete/read. If students are completing multiple sections, use the paperclips in your group box to clip together the sections that they are completing/reading this way when presenting they will not need to flip back and forth between pages. Place the following sentence frame sticker on the top of the book of the student that is completing the bar graph (page 21).
The _______________________ for____________ was _____________________.
Then practice reading the four sentences with that student. For the poster below, the sentence frame would be: The length of the smear for rubbing alcohol was 4.5 cm. Make sure that you fill in the “length
what was measured variable measurement
(you should fill this blank out for the student)
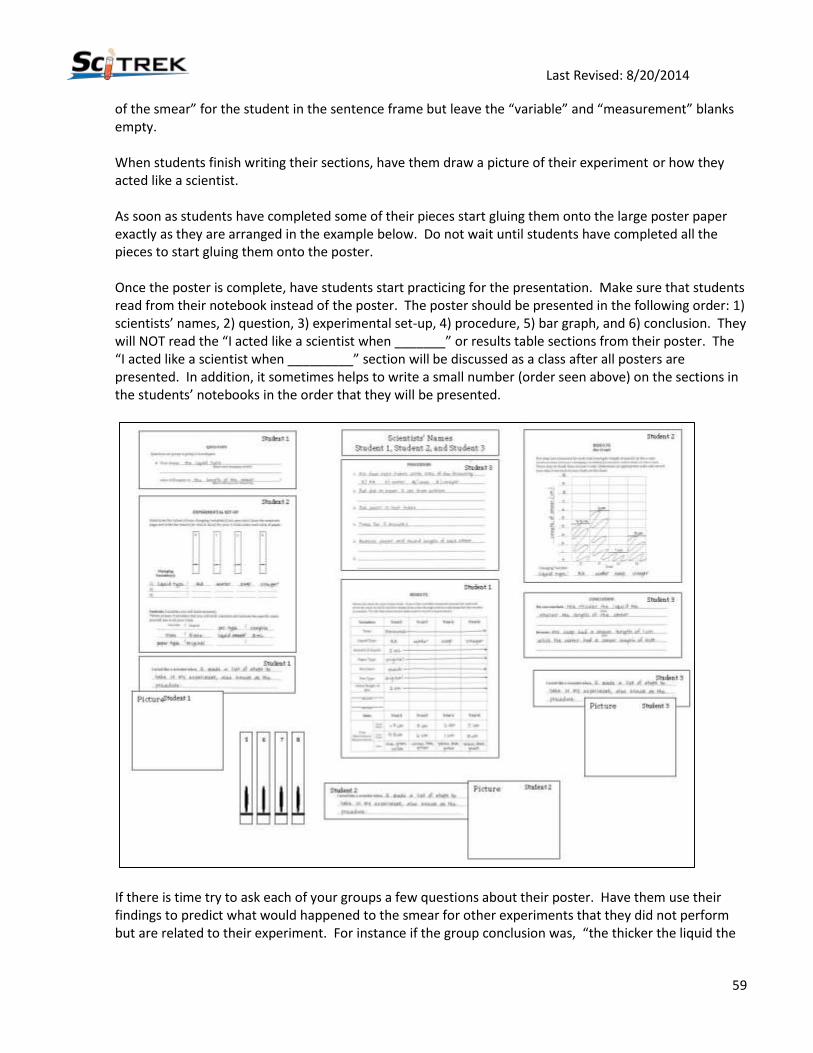
Last Revised: 8/20/2014
59
of the smear” for the student in the sentence frame but leave the “variable” and “measurement” blanks empty. When students finish writing their sections, have them draw a picture of their experiment or how they acted like a scientist. As soon as students have completed some of their pieces start gluing them onto the large poster paper exactly as they are arranged in the example below. Do not wait until students have completed all the pieces to start gluing them onto the poster. Once the poster is complete, have students start practicing for the presentation. Make sure that students read from their notebook instead of the poster. The poster should be presented in the following order: 1) scientists’ names, 2) question, 3) experimental set-up, 4) procedure, 5) bar graph, and 6) conclusion. They will NOT read the “I acted like a scientist when _______” or results table sections from their poster. The “I acted like a scientist when _________” section will be discussed as a class after all posters are presented. In addition, it sometimes helps to write a small number (order seen above) on the sections in the students’ notebooks in the order that they will be presented.
If there is time try to ask each of your groups a few questions about their poster. Have them use their findings to predict what would happened to the smear for other experiments that they did not perform but are related to their experiment. For instance if the group conclusion was, “the thicker the liquid the
Last Revised: 8/20/2014
60
smaller the smear because soap gave a 1 cm smear height and water gave a 6 cm smear height,” ask the group to predict what length would the smear be if your liquid was honey. They should able to predict that it would be less than 1 cm because honey is thicker than soap.
Wrap-Up (2 minutes – Full Class – SciTrek Lead):
Tell students that they will present their findings during the next SciTrek visit and that you are looking forward to hearing about their experiments.
Clean-Up:
Before you leave, have students attach their nametags to their notebooks and place them in the group box. Leave student posters in the classroom. Bring all materials back to UCSB. Look through all of the conclusions and place a notebook from the group with the best conclusion on the top of your box. In addition. In addition, put your lab coat back in your group box.
Day 7: Poster Presentations
Schedule: Introduction (SciTrek Lead) – 2 minutes Practice Posters (SciTrek Volunteers) – 5 minutes
Poster Presentations (SciTrek Volunteers/SciTrek Lead) – 48 minutes Wrap-Up (SciTrek Lead) – 5 minutes Materials:
(3) Volunteer Boxes:
☐ Student nametags
☐ Volunteer lab coat
☐ (6) Paperclips
☐ Student notebooks
☐ Highlighter
☐ Large binder clip
☐ Volunteer instructions
☐ Pencil
☐ (12) Sharpened SciTrek pencils (all same color)
Lead Box:
☐ (3) Extra student notebooks
☐ (2) Pencils
☐ (6) Paperclips
☐ Lead instructions
☐ (2) Highlighters
☐ (4) SciTrek erasers
☐Lead lab coat
☐ Scotch tape
☐ Time card
Student posters should already be in the classroom. Set-Up:
SciTrek Lead: Write the class question on the board, “What factors affect the smear?” Leave enough room to record student findings under the question.

Last Revised: 8/20/2014
61
SciTrek Volunteer:
Set out the SciTrek notebooks/nametags. Get your groups’ posters. Today students will be sitting in their regular classroom seats during poster presentation. Have pencils ready to distribute to your group after the poster presentations.
Introduction (2 minutes – Full Class – SciTrek Lead):
Tell students that today they will present their posters to the class. Inform students that this is a common practice in science. Scientists go to conferences where they present posters. At these presentations other scientist give them feedback on their experiments which allow them to return to the lab with new ideas for future experiments.
Tell the students that they will have 5 minutes to practice presenting their poster. Students should first explain to each other, without looking at their notebooks or posters their experiment and results. They should then use the remaining time to practice presenting. Remind students to read from their notebooks when presenting. Tell students that after practicing they will return to their normal classroom seats.
Practice Posters (5 minutes – Small Groups – SciTrek Volunteers):
Make sure that each small group is telling each other what they did and what they found out from their experiment. Then have them practice their poster presentation, making sure they are reading the poster parts in the correct order (scientists’ names, question, experimental set-up, procedure, graph, and conclusion). Make sure each student section is highlighted in their notebook. If students are reading from multiple pages use a paperclip to clip these pages together. Remind students to read from their notebook rather than from their poster.
Poster Presentations (48 minutes – Full Class – SciTrek Volunteers/SciTrek Lead):
Have students return to their original class seats. Ask the class, what question we are working on solve? Students should tell you: What factors affect the smear? Tell the students that after each presentation you will ask the class what changing variable the group was testing. They will then be given the opportunity to ask scientific questions, to the presenting group, to help determine if the variable investigated affected the color of the solution. Students that ask a scientific question during the presentation will get a SciTrek pencil at the end of the presentations. Give the class one or two examples of scientific examples. Some possible examples are, Why did your group pick the controls that you did? Can you make a prediction about another paper type that you think would give a large smear height? Did your results agree with a previous group’s and why? Ask the class, “If a group’s changing variable was liquid type, would they be able to answer questions about changing the paper type?” They should say no. “Therefore, we should try to ask the group questions that focus on their changing variable.” Tell the class once they have finished asking the group questions you will ask them if the groups changing variable affected the height of the smear and how. You will then summarize their ideas on the board under the class question. Volunteers should make sure that students are quiet and respectful when other groups are presenting. When one of your groups is presenting go to the front of the room with them and prompt students if they get stuck and remind them to read from their notebooks.
Last Revised: 8/20/2014
62
During the student question time, the SciTrek lead and/or volunteers should ask at least one question. Example of possible question are, “How do you know…?” or “Is there anything else you can do to get more information about your question?” Each group should answer approximately four questions. After all poster presentations have been given, ask the class, “What did we learn about the smear?” Have them summarize the class findings. The highlights from many experiments are seen below. Do not expect students to know highlight from experiments that were not run.
The thinner the liquid the taller the liquid/smear height.
Different liquids will change the order the colors appear in the smear, but not what colors appear.
The more absorbent the paper the taller the liquid/smear height.
If the liquid level is above the dot, the smear will travel downwards. If the liquid level is below the dot, the smear will travel upwards.
Different black pens are made up of different dye colors.
Colored markers separate into fewer colors than black markers.
The longer the time the taller the liquid/smear height. While summarizing experiments, use students’ collected data and not what they should have found from the list above. Tell students that you want to get the longest most colorful smear and that you need them to tell you what values of variables you should use.
Time: As long as possible
Liquid type: Water or another thin liquid
Liquid Amount: Enough to get the liquid close to the dot without going over the dot
Paper Type: The original paper or another absorbent paper
Pen Color: Black
Pen Type: Any washable marker
Initial Dot Height: A value that would put the dot close to the liquid level Each SciTrek volunteer should keep track of who asks a question and give these students a pencil at the end of the session. If a student does not ask a question during the poster presentations have them ask/answer a question about the experiment before you give them a pencil.
Wrap-Up (5 minutes – Full Class – SciTrek Lead):
Ask students the following question: How did you act like a scientist during this project?
Tell the students that the volunteers that have been working with them are undergraduate and graduate students that volunteer their time so that they can do experiments. Have the students say thank you to the volunteers. This is the last day with their SciTrek volunteers, therefore, they should say goodbye to them. Tell students that you will be back one more time. Announce the group that came up with the best conclusion or claim supported data from their experiments. Talk a little about why that group’s conclusion was selected. Distribute prizes (erasers) to that group. Tell students to remove the paper part of their nametag from the plastic holder. They can keep the paper nametag, but need to give the plastic sleeve back to their SciTrek volunteer.

Last Revised: 8/20/2014
63
Clean- Up:
Before you leave, collect the plastic parts of nametags and put them in the group box. Students can keep the paper part of their nametag. Also collect notebooks and clip them together with a large binder clip. Leave student posters in the classroom. Bring all materials back to UCSB. Remove tape from the lid of your box and place into your box. In addition, remove all materials from lab coat pockets, remove your nametag, unroll lab coat sleeves, and put your lab coat back in your group box.
Day 8: Conclusion Assessment/Tie to Standards Schedule: Conclusion Assessment (SciTrek Lead) – 10 minutes
Tie to Standards (SciTrek Lead) – 50 minutes Materials:
Lead Box:
☐ (3) Extra student notebooks
☐ Lead lab coat
☐ (20) Pure substance bags labeled with letters (A=baking soda, B= sugar, C= salt, and D= powder)
☐ Time card
☐ Student notebooks
☐ (2) Pencil
☐ (21) Mixture bags (7 bags of each of the 3 different mixtures)
☐ Jar of sand and water
☐ (2) Mystery data sheets
☐ Lead instructions
☐ Rock showing a visible mixture
☐ (20) Pure substance bags labeled (sugar, salt, baking soda, and powder)
☐ (35) Conclusion assessments

Last Revised: 8/20/2014
64
SciTrek Notebook Pages Used With Students:
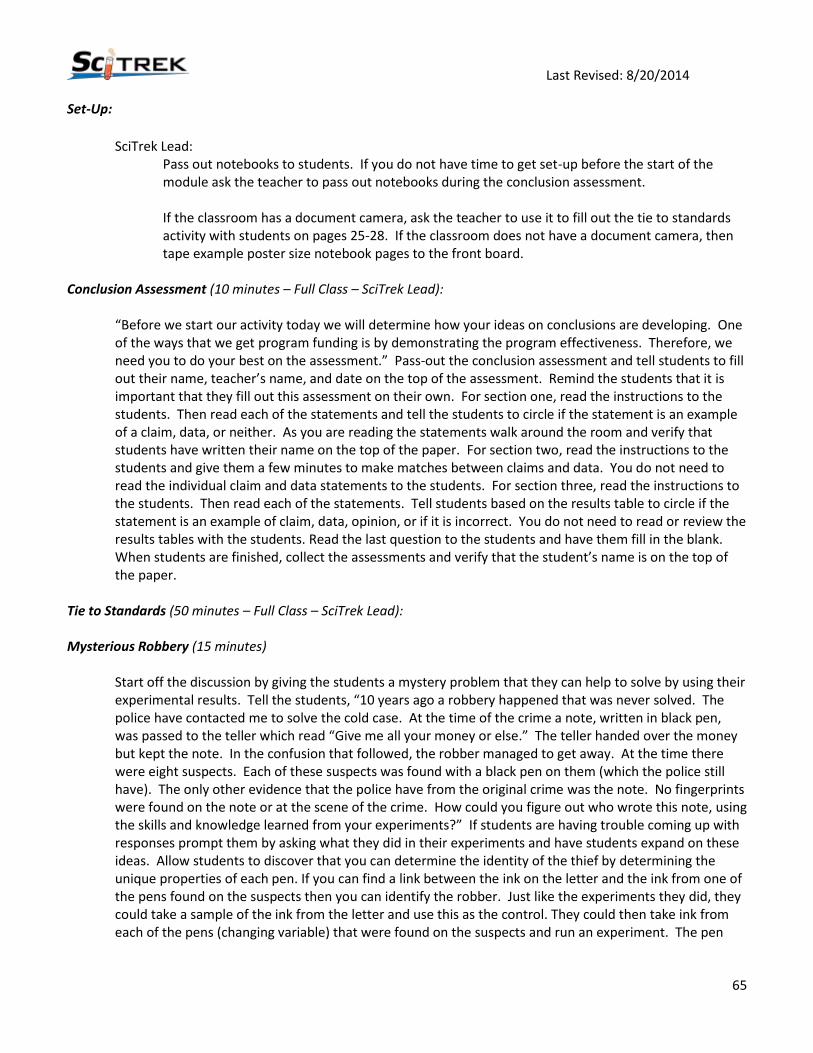
Last Revised: 8/20/2014
65
Set-Up:
SciTrek Lead:
Pass out notebooks to students. If you do not have time to get set-up before the start of the module ask the teacher to pass out notebooks during the conclusion assessment. If the classroom has a document camera, ask the teacher to use it to fill out the tie to standards activity with students on pages 25-28. If the classroom does not have a document camera, then tape example poster size notebook pages to the front board.
Conclusion Assessment (10 minutes – Full Class – SciTrek Lead):
“Before we start our activity today we will determine how your ideas on conclusions are developing. One of the ways that we get program funding is by demonstrating the program effectiveness. Therefore, we need you to do your best on the assessment.” Pass-out the conclusion assessment and tell students to fill out their name, teacher’s name, and date on the top of the assessment. Remind the students that it is important that they fill out this assessment on their own. For section one, read the instructions to the students. Then read each of the statements and tell the students to circle if the statement is an example of a claim, data, or neither. As you are reading the statements walk around the room and verify that students have written their name on the top of the paper. For section two, read the instructions to the students and give them a few minutes to make matches between claims and data. You do not need to read the individual claim and data statements to the students. For section three, read the instructions to the students. Then read each of the statements. Tell students based on the results table to circle if the statement is an example of claim, data, opinion, or if it is incorrect. You do not need to read or review the results tables with the students. Read the last question to the students and have them fill in the blank. When students are finished, collect the assessments and verify that the student’s name is on the top of the paper.
Tie to Standards (50 minutes – Full Class – SciTrek Lead): Mysterious Robbery (15 minutes)
Start off the discussion by giving the students a mystery problem that they can help to solve by using their experimental results. Tell the students, “10 years ago a robbery happened that was never solved. The police have contacted me to solve the cold case. At the time of the crime a note, written in black pen, was passed to the teller which read “Give me all your money or else.” The teller handed over the money but kept the note. In the confusion that followed, the robber managed to get away. At the time there were eight suspects. Each of these suspects was found with a black pen on them (which the police still have). The only other evidence that the police have from the original crime was the note. No fingerprints were found on the note or at the scene of the crime. How could you figure out who wrote this note, using the skills and knowledge learned from your experiments?” If students are having trouble coming up with responses prompt them by asking what they did in their experiments and have students expand on these ideas. Allow students to discover that you can determine the identity of the thief by determining the unique properties of each pen. If you can find a link between the ink on the letter and the ink from one of the pens found on the suspects then you can identify the robber. Just like the experiments they did, they could take a sample of the ink from the letter and use this as the control. They could then take ink from each of the pens (changing variable) that were found on the suspects and run an experiment. The pen
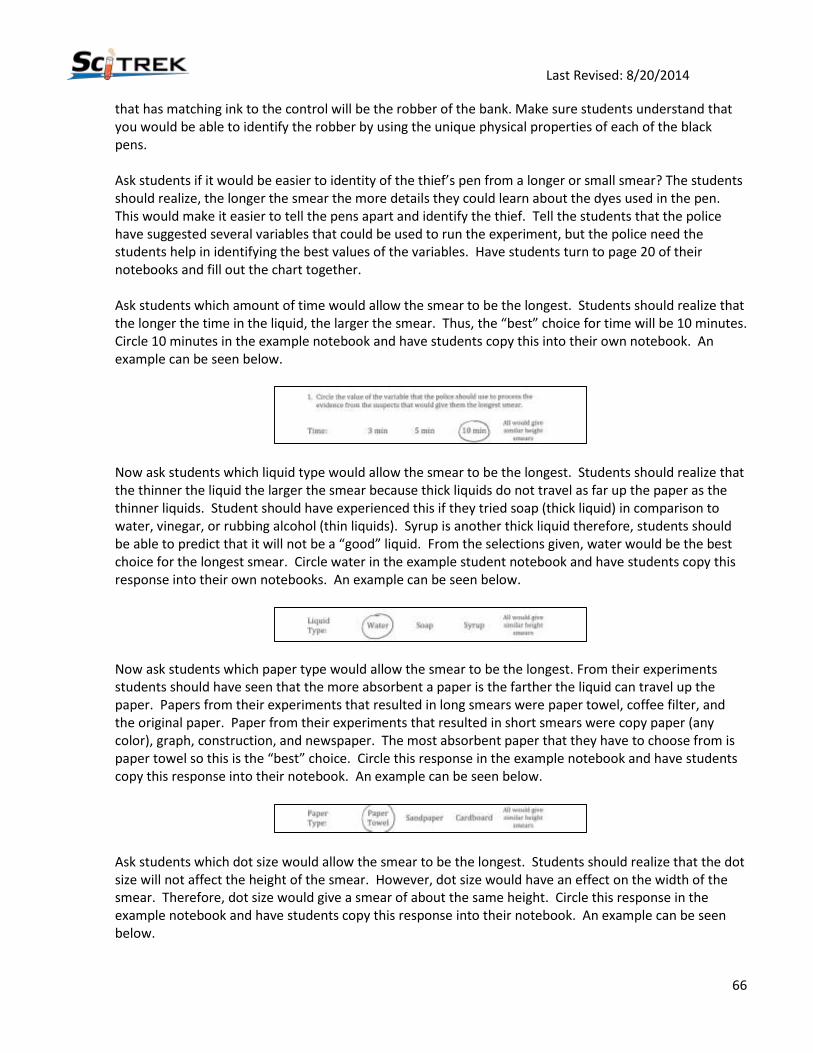
Last Revised: 8/20/2014
66
that has matching ink to the control will be the robber of the bank. Make sure students understand that you would be able to identify the robber by using the unique physical properties of each of the black pens. Ask students if it would be easier to identity of the thief’s pen from a longer or small smear? The students should realize, the longer the smear the more details they could learn about the dyes used in the pen. This would make it easier to tell the pens apart and identify the thief. Tell the students that the police have suggested several variables that could be used to run the experiment, but the police need the students help in identifying the best values of the variables. Have students turn to page 20 of their notebooks and fill out the chart together.
Ask students which amount of time would allow the smear to be the longest. Students should realize that the longer the time in the liquid, the larger the smear. Thus, the “best” choice for time will be 10 minutes. Circle 10 minutes in the example notebook and have students copy this into their own notebook. An example can be seen below.
Now ask students which liquid type would allow the smear to be the longest. Students should realize that the thinner the liquid the larger the smear because thick liquids do not travel as far up the paper as the thinner liquids. Student should have experienced this if they tried soap (thick liquid) in comparison to water, vinegar, or rubbing alcohol (thin liquids). Syrup is another thick liquid therefore, students should be able to predict that it will not be a “good” liquid. From the selections given, water would be the best choice for the longest smear. Circle water in the example student notebook and have students copy this response into their own notebooks. An example can be seen below.
Now ask students which paper type would allow the smear to be the longest. From their experiments students should have seen that the more absorbent a paper is the farther the liquid can travel up the paper. Papers from their experiments that resulted in long smears were paper towel, coffee filter, and the original paper. Paper from their experiments that resulted in short smears were copy paper (any color), graph, construction, and newspaper. The most absorbent paper that they have to choose from is paper towel so this is the “best” choice. Circle this response in the example notebook and have students copy this response into their notebook. An example can be seen below.
Ask students which dot size would allow the smear to be the longest. Students should realize that the dot size will not affect the height of the smear. However, dot size would have an effect on the width of the smear. Therefore, dot size would give a smear of about the same height. Circle this response in the example notebook and have students copy this response into their notebook. An example can be seen below.
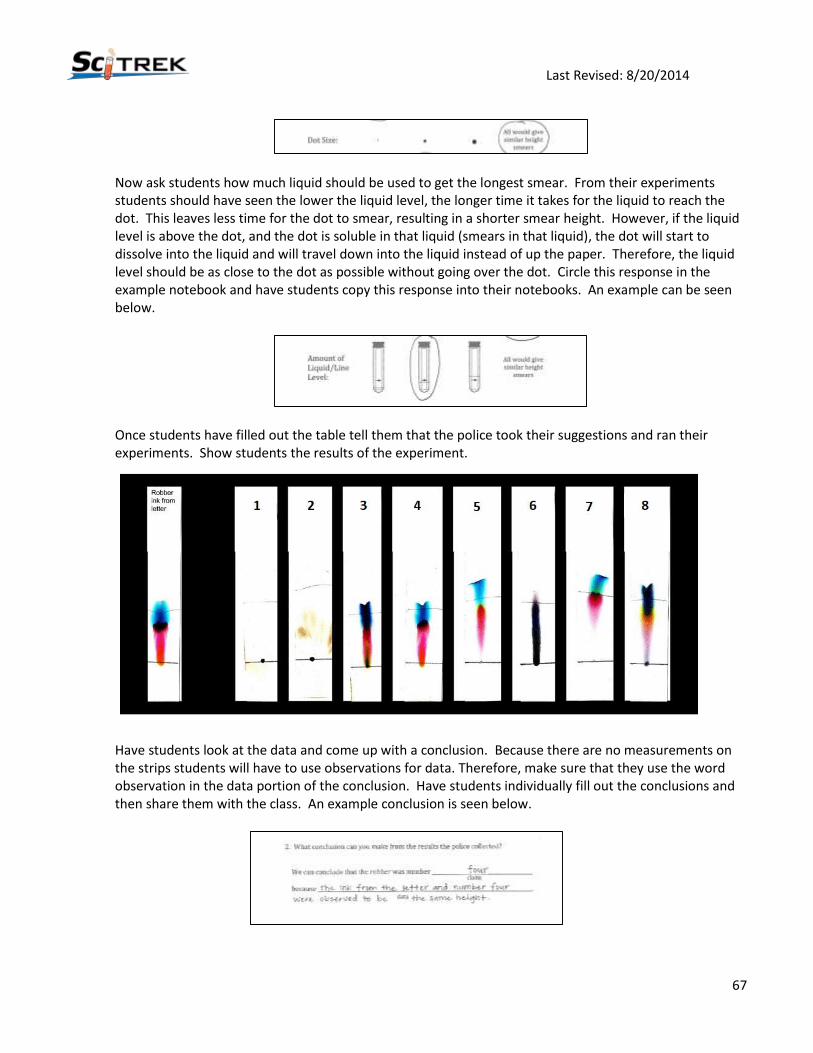
Last Revised: 8/20/2014
67
Now ask students how much liquid should be used to get the longest smear. From their experiments students should have seen the lower the liquid level, the longer time it takes for the liquid to reach the dot. This leaves less time for the dot to smear, resulting in a shorter smear height. However, if the liquid level is above the dot, and the dot is soluble in that liquid (smears in that liquid), the dot will start to dissolve into the liquid and will travel down into the liquid instead of up the paper. Therefore, the liquid level should be as close to the dot as possible without going over the dot. Circle this response in the example notebook and have students copy this response into their notebooks. An example can be seen below.
Once students have filled out the table tell them that the police took their suggestions and ran their experiments. Show students the results of the experiment.
Have students look at the data and come up with a conclusion. Because there are no measurements on the strips students will have to use observations for data. Therefore, make sure that they use the word observation in the data portion of the conclusion. Have students individually fill out the conclusions and then share them with the class. An example conclusion is seen below.

Last Revised: 8/20/2014
68
Mixture Discussion (5 minutes)
What do you think the results imply about composition of the black ink? Students should respond, the blank inks are made up of many different colored dyes making them all different mixtures. All materials can either be divided into mixtures or pure substances. Pure substances are made up of one type of atom or molecule and mixtures are made up of two or more distinct pure substances. Some mixtures are easily identified because you can see the different substances. Show students the rock in which the individual components of the mixture can be seen. Have students come up with four examples of mixtures they can see with their eyes and record one in the example notebook. Tell students that they can either record the mixture that you wrote or write another example in their notebook. An example can be seen below.
Tell students that sometimes you cannot see the individual parts of a mixture until it is separated, like the ink from the black pens. Now have students come up with four examples of a mixtures they cannot see with their eyes and record one in the example notebook. Tell students that they can either record the mixture that you wrote or write another example in their notebook. An example can be seen below.
Separating Mixtures/Physical Properties (10 minutes)
Pass out the mixture bags, one bag to every two students. There are three different mixtures bags that students could get, try to keep students that are at the same table with the same mixture bag. Ask the students if their bag contains a mixture or a pure substances and why. They should be able to see that all the bags contain two different substances, therefore, all of the bags contain mixtures. Tell the students that they need to find the picture of the mixture that is in the bag that they received. They then need to think about all of the properties of those substances in the bag, that they could use to separate the substance by, and then write these properties down next to the picture. For example, if I had a pieces of metal and a pieces of plastic I could separate the metal from plastic by conductivity. The metal would conduct electricity while the plastic would not. So I would write conductivity in the blank next to mixture number 2. Tell students they might be able to use several properties to separate the mixture. Give students three minutes to complete the task. At the end of the three minutes have students put the materials back into the bag and collect all of the bags from the students.
Ask students with mixture 1 which properties they used for separating the mixture. Students should have been able to feel that the different sheets of sandpaper have different textures. They also might notice that there is a slight variation in the color of the two types of sandpaper. Record their responses into the example notebook and have students copy this response. An example can be seen below.

Last Revised: 8/20/2014
69
Ask students with mixture 2 which properties they used for separating the mixture. Students should notice that the two types of nuts different materials and different colors. In addition, the two nuts have different masses. Record their responses into the example notebook and have students copy this response. An example can be seen below.
Ask students with mixture 3 which properties they used for separating the mixture. Students should notice that the different substances vary in color, and thickness. They should also see that the magnets stick to each other while the papers do not. Record their responses into the example notebook and have students copy this response. An example can be seen below.
Show the class the jar of the sand and water and ask them how they would separate that mixture. Students should notice that the water is a liquid and the sand is a solid. If they do not know what this is called tell them that scientist would say that the water and the gravel are different states of matter. They also might notice that the two substances vary by other properties including color, texture, opacity, etc. Record their responses into the example notebook and have students copy this response. An example can be seen below.
Tell students that they just separated the mixtures using the physical properties of the individual substances in the mixture. Have them write “physical property” at the top of chart. Tell students that physical properties are attributes of the material that you can measure or observe without changing the substance. Other physical properties include melting point, boiling point, solubility, conductivity, hardness, etc. Tell students that physical properties are important because they can be used to separate mixtures. Then give three examples:
Magnetism can be used to separate mixtures. If you had a sand and iron mixture you could put a magnet into the mixture. This would cause all of the iron to stick to the magnet and then you could pour off the sand. Different states of matter can be used to separate mixtures. If you had a sand and water mixture the mixture could be poured through a filter. The liquid would pass through and the solid would be left behind. Boiling point can be used to separate mixtures. If you had a water and a salt mixture you could heat the mixture up. This would case the water to evaporate leaving behind the salt which has a much higher boiling point.
Last Revised: 8/20/2014
70
In our experiment, we separated out the different dye colors in a pen. Let’s try to determine the physical properties that were used to separate the dyes. What did we do to get the dye colors to travel up the paper?
We had to put the paper in liquid/water. If there was red on the top of the smear and green on the bottom of the smear which color was more attracted to the water and why? (If needed draw a picture on the board)
The red traveled farther up the paper so it must be more attracted to the liquid/water. What happened when Sharpie pens were tried with water?
Nothing /the dot did not move. Were the Sharpie pens attracted to the water and how do you know?
No because it did not go up the paper. Do you think that the Sharpie pens are attracted to anything?
The Sharpie marker must have been attracted to the paper because it did not move. What happened when you put the Sharpie in the rubbing alcohol?
It had a small smear. Explain to the students that this means that the Sharpie ink was attracted to the rubbing alcohol. Explain them that different dyes are attracted to different liquids, therefore, if you change liquids you change the attraction, which can change the order colors appear in the smear. For example water could yield a smear that is blue, green, yellow and rubbing alcohol could yield a smear that is green, blue, yellow. Be sure that by the end of the conversation students understand that the physical properties used to separate dye colors were the attraction of the ink to the paper and/or the attraction of the ink to the liquid. Then inform the class that this method of separation is called chromatography.
Pure Substances (15 minutes)
Tell students that physical properties can be used to separate mixtures, but they also can be used to identify pure substances. Pass-out the labeled pure-substance bags; these four bags contain a single pure substance (sugar, salt, baking soda, and powder). Students will be given a few minutes to identify physical properties of each of the pure substance which they should record in their notebooks. Tell them that they can open the bag but the material must stay in the bag. The only sense that they are not allowed to use is taste. Once they have written down the physical properties, you will take away the bags and give them four bags that are labeled with only a letter. They will then need to determine the identity of the pure substance based off their notes. Give students ~5 minutes to examine and write down the physical properties of the labeled substance, then remove the bags. Hand out the letter bags and have them determine what the unknown substances are: Bag A = Baking Soda Bag B = Sugar Bag C = Salt Bag D = Powder
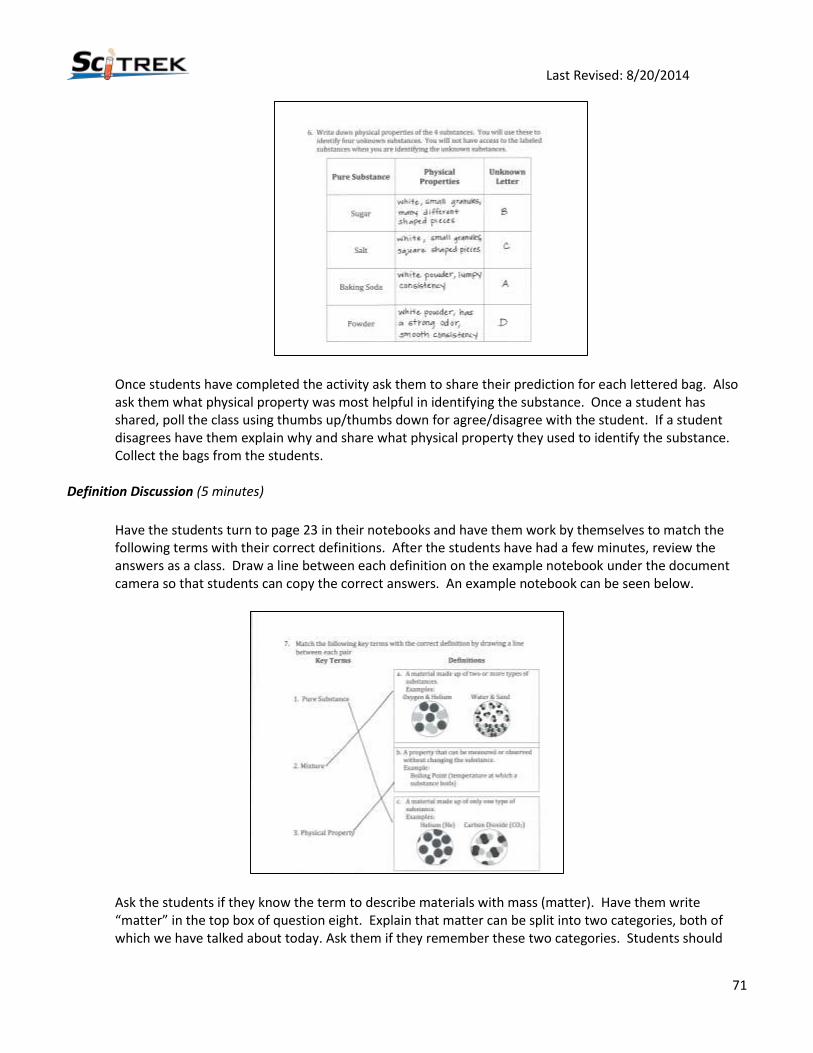
Last Revised: 8/20/2014
71
Once students have completed the activity ask them to share their prediction for each lettered bag. Also ask them what physical property was most helpful in identifying the substance. Once a student has shared, poll the class using thumbs up/thumbs down for agree/disagree with the student. If a student disagrees have them explain why and share what physical property they used to identify the substance. Collect the bags from the students.
Definition Discussion (5 minutes)
Have the students turn to page 23 in their notebooks and have them work by themselves to match the following terms with their correct definitions. After the students have had a few minutes, review the answers as a class. Draw a line between each definition on the example notebook under the document camera so that students can copy the correct answers. An example notebook can be seen below.
Ask the students if they know the term to describe materials with mass (matter). Have them write “matter” in the top box of question eight. Explain that matter can be split into two categories, both of which we have talked about today. Ask them if they remember these two categories. Students should

Last Revised: 8/20/2014
72
reply mixtures and pure substances. Tell the class that mixtures can be separated into pure substances. Ask the class what properties we take advantage of to perform these separations. Students should state physical properties. Make sure students fill in all the terms in question eight. An example can be seen below.
If molecules/compounds have come up in your discussion you can also briefly discuss how chemical properties can be used to separate molecules/compounds into pure elements. Tell the class that you have enjoyed learning science with them and they will get another opportunity for SciTrek to come to their room and run long term investigations with them later in the year. Tell them to remember what they have learned for their next module.
Clean- Up:
Bring all materials back to UCSB.