module 1 educator’s guide investigation 3 - nasa · the ways in which different scientists use...
TRANSCRIPT
1
What cansatellites tell usabout Earth?Investigation OverviewStudents learn to identify basic characteris-
tics of satellite images. They demonstrate how
satellite signals are connected to images and explore
the ways in which different scientists use such images.
Time required: Two 45-minute sessions
Materials/ResourcesCrayons
Log 1: Morro Bay, California: Which is the satellite image? (transparency)
Log 2: What is this satellite doing? (transparency)
Log 3: How do satellites work? (transparency and one copy for each
student)
Log 4: How are satellite images like puzzles? (one copy for each pair of
students)
Log 5: Who uses satellite images and for what purpose? (one copy for
each group of four students)
Log 6: How do satellite images help predict hurricanes? (transparency)
Log 7: How do images of flooding help us learn about Earth? (transpar-
ency)
Log 8: How do images of volcanoes help us study Earth? (transparency)
Content PreviewRemote sensing is the science of observing, identifying, and measuring
objects and regions without direct contact. An aerial photo and a remotely
sensed satellite image are two perspectives “from above.” Sensors are
mounted on satellites that orbit Earth. Sensor signals are processed to
produce a satellite image. Views of large areas are produced by overlap-
ping remotely sensed images, a technique known as mosaicing (making a
mosaic). A pixel is the smallest unit in an aerial photo or remotely sensed
image, and refers to the area on the ground from which the satellite ac-
quires a single measurement. A remotely sensed digital image is made up
of millions of pixels. Many types of scientists use remote sensing and
satellite images in their research.
Classroom ProceduresBeginning the Investigation1. Show the students a transparency of Log 1. Explain that both show
Morro Bay, California. Discuss the differences between the two and
have them answer the Log questions. Guide the students to discover
the difference in scale.
Geography Standards
Standard 1: The World inSpatial Terms
How to use maps and othergeographic representations,tools, and technologies to ac-quire, process, and report infor-mation from a spatial perspective
• Identify and describe the character-
istics and purposes of geographic
representations, tools, and
technologies.
Geography SkillsSkill Set 4: Analyzing GeographicInformation
• Use texts, photographs, and
documents to observe and interpret
geographic trends and relation-
ships.
Module 1 Educator’s Guide Investigation 3
2
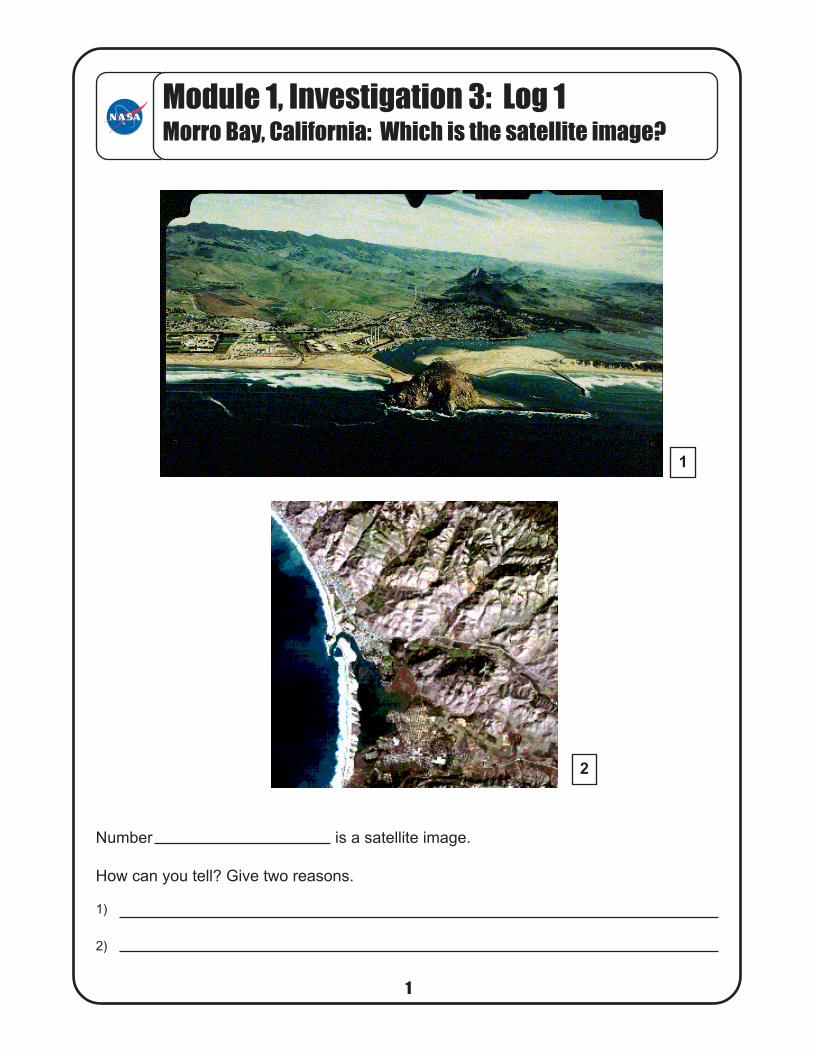
• The satellite image (Figure 2) shows a much
larger area since the satellite was at a higher
altitude than the airplane from which the photo
was taken. The satellite was directly overhead
(oblique view), while the airplane view was at an
angle (though cameras mounted on airplanes can
also take photographs from directly overhead).
• The satellite image appears to be made of small
squares. These are called pixels. Tell the
students that they will soon learn why this is so.
• Explain that during this investigation students will
learn how a satellite creates images, and how
these satellite images are used to study Earth.
2. On the board write “remote sensing” and ask
students if anyone has heard of this term. Ask one
student to read a few sentences from a book. Tell
the class that this student is using remote sensing.
Ask how can this be? Explain that this student is
gathering information about something from a
distance and that this is a form of remote sensing.
Explain that the brain gathers information from a
book by analyzing and interpreting reflected light.
Explain that remote sensing is a way of gathering
information without touching the source of the
information, from as close as a book or from as far
away as a satellite in orbit.
Developing the Investigation3. Ask students what they know about satellites.
Explain that a satellite is a small body, natural or
artificial, that revolves around a larger astronomical
object. The Moon is Earth’s natural satellite. There
are many kinds of artificial satellites that serve
different purposes. Some help communication by
transmitting signals from telephones and comput-
ers. NASA’s satellites carry sensors that observe
Earth to better understand the environment. These
satellite sensors gather information about weather,
landforms, oceans, vegetation, land use, and other
things. The information is transmitted to computers
on Earth. Information gathered by satellites is
displayed as pictures or “images.”
4. If an Internet connection is available, show the
class the animation of how one satellite scans
Earth. <http://earthobservatory.nasa.gov/Library/
AM1/anim/am_godview.mov> or <http://
earthobservatory.nasa.gov/Library/AM1/anim/
swath_modis.mov> Have students note that as
Earth rotates, the satellite observes a new swath of
Earth surface.
5. How do satellites send images from space?
Tell students that they are going to draw a picture
to simulate how satellites send images from space
to computers. Give each student a copy of Log 3and display a transparency of Log 3.
Tell students that you are the “sender” in the
satellite and each of them is a “receiver” in a
computer at a ground station that communicates
with the satellite. They will draw a picture by
interpreting the signals you send them. This is
remote sensing!
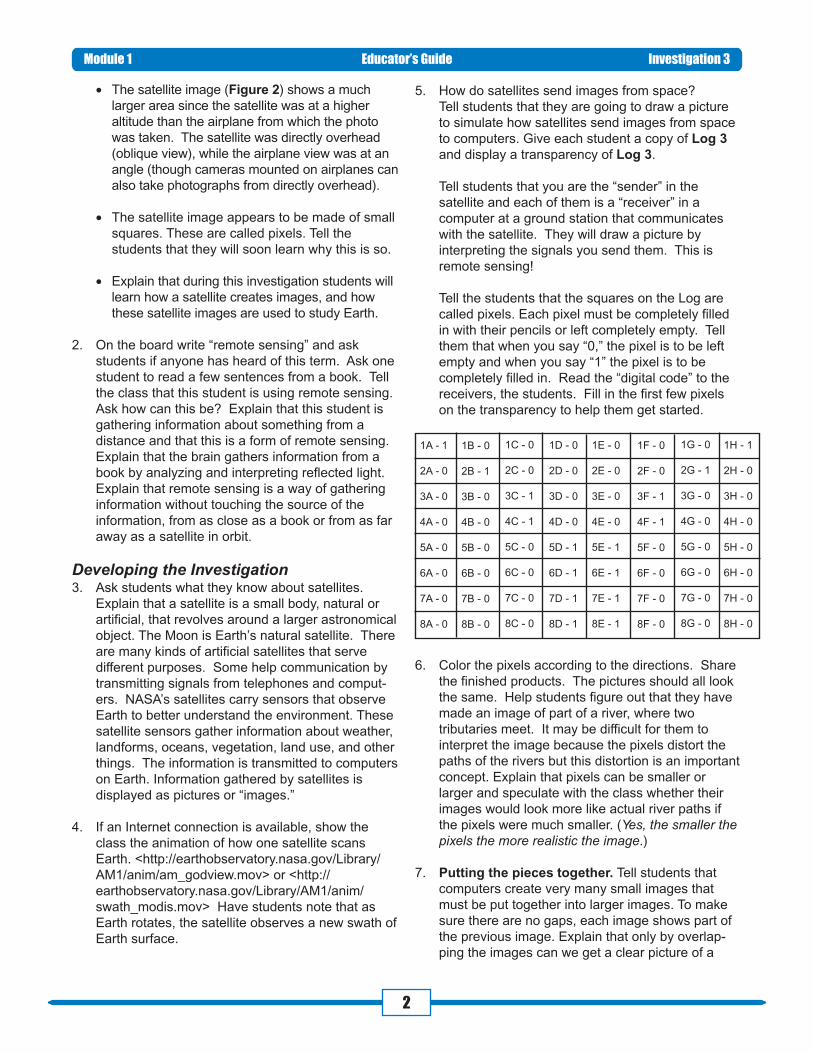
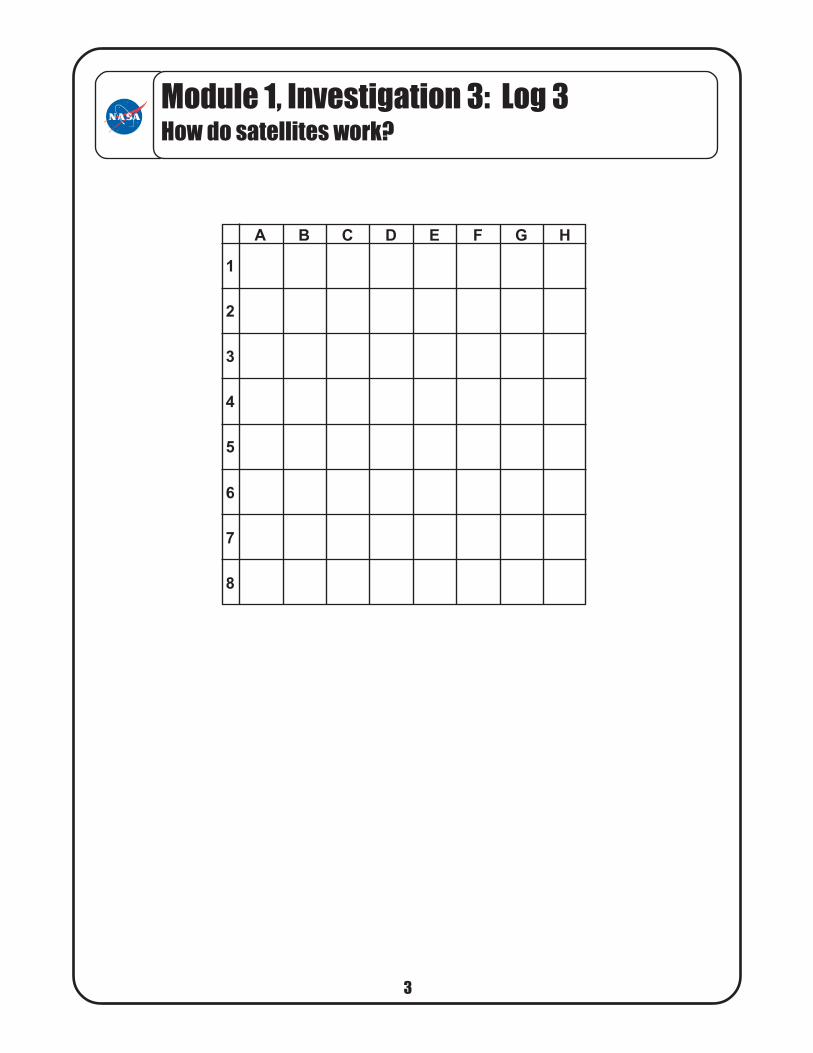
Tell the students that the squares on the Log are
called pixels. Each pixel must be completely filled
in with their pencils or left completely empty. Tell
them that when you say “0,” the pixel is to be left
empty and when you say “1” the pixel is to be
completely filled in. Read the “digital code” to the
receivers, the students. Fill in the first few pixels
on the transparency to help them get started.
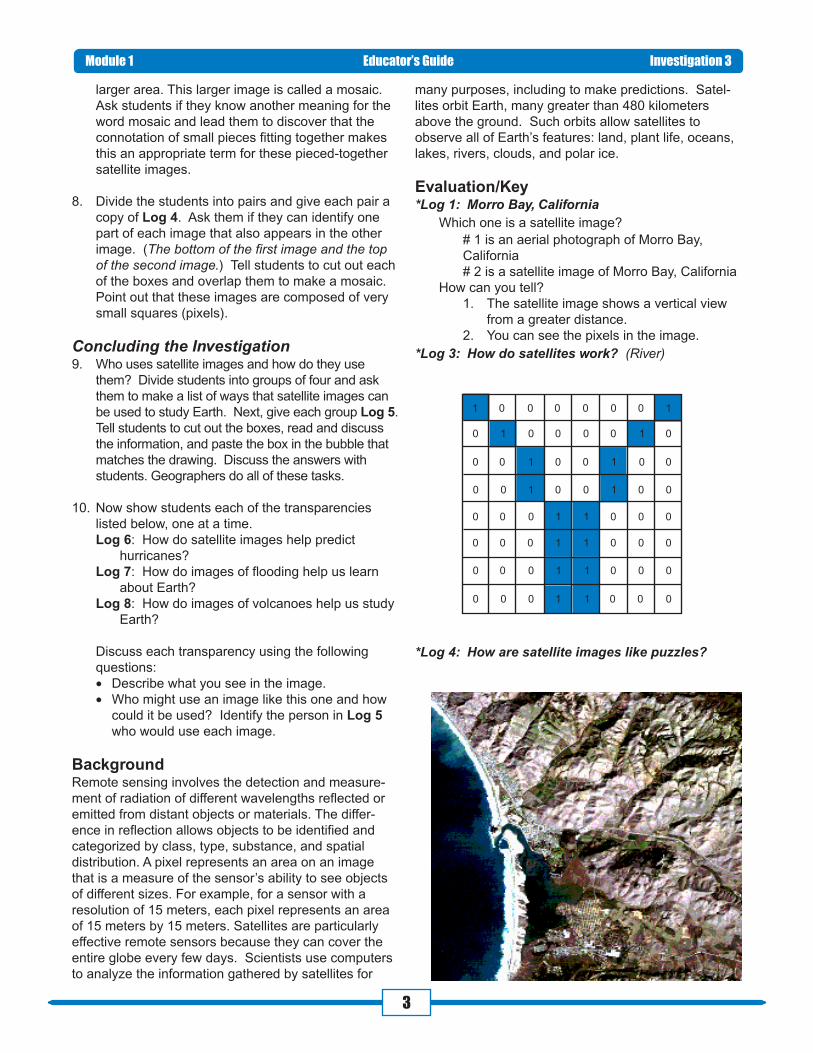
6. Color the pixels according to the directions. Share
the finished products. The pictures should all look
the same. Help students figure out that they have
made an image of part of a river, where two
tributaries meet. It may be difficult for them to
interpret the image because the pixels distort the
paths of the rivers but this distortion is an important
concept. Explain that pixels can be smaller or
larger and speculate with the class whether their
images would look more like actual river paths if
the pixels were much smaller. (Yes, the smaller thepixels the more realistic the image.)
7. Putting the pieces together. Tell students that
computers create very many small images that
must be put together into larger images. To make
sure there are no gaps, each image shows part of
the previous image. Explain that only by overlap-
ping the images can we get a clear picture of a
Module 1 Educator’s Guide Investigation 3
1A - 1
2A - 0
3A - 0
4A - 0
5A - 0
6A - 0
7A - 0
8A - 0
1B - 0
2B - 1
3B - 0
4B - 0
5B - 0
6B - 0
7B - 0
8B - 0
1C - 0
2C - 0
3C - 1
4C - 1
5C - 0
6C - 0
7C - 0
8C - 0
1D - 0
2D - 0
3D - 0
4D - 0
5D - 1
6D - 1
7D - 1
8D - 1
1E - 0
2E - 0
3E - 0
4E - 0
5E - 1
6E - 1
7E - 1
8E - 1
1F - 0
2F - 0
3F - 1
4F - 1
5F - 0
6F - 0
7F - 0
8F - 0
1G - 0
2G - 1
3G - 0
4G - 0
5G - 0
6G - 0
7G - 0
8G - 0
1H - 1
2H - 0
3H - 0
4H - 0
5H - 0
6H - 0
7H - 0
8H - 0
3
larger area. This larger image is called a mosaic.
Ask students if they know another meaning for the
word mosaic and lead them to discover that the
connotation of small pieces fitting together makes
this an appropriate term for these pieced-together
satellite images.
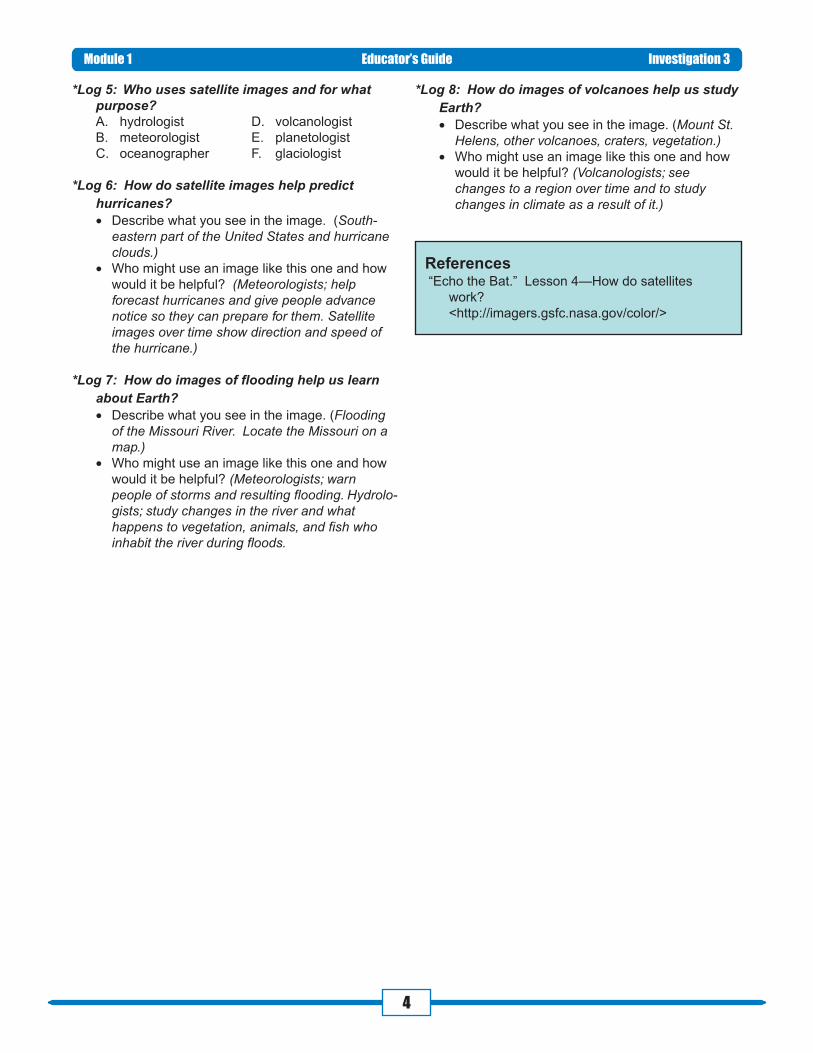
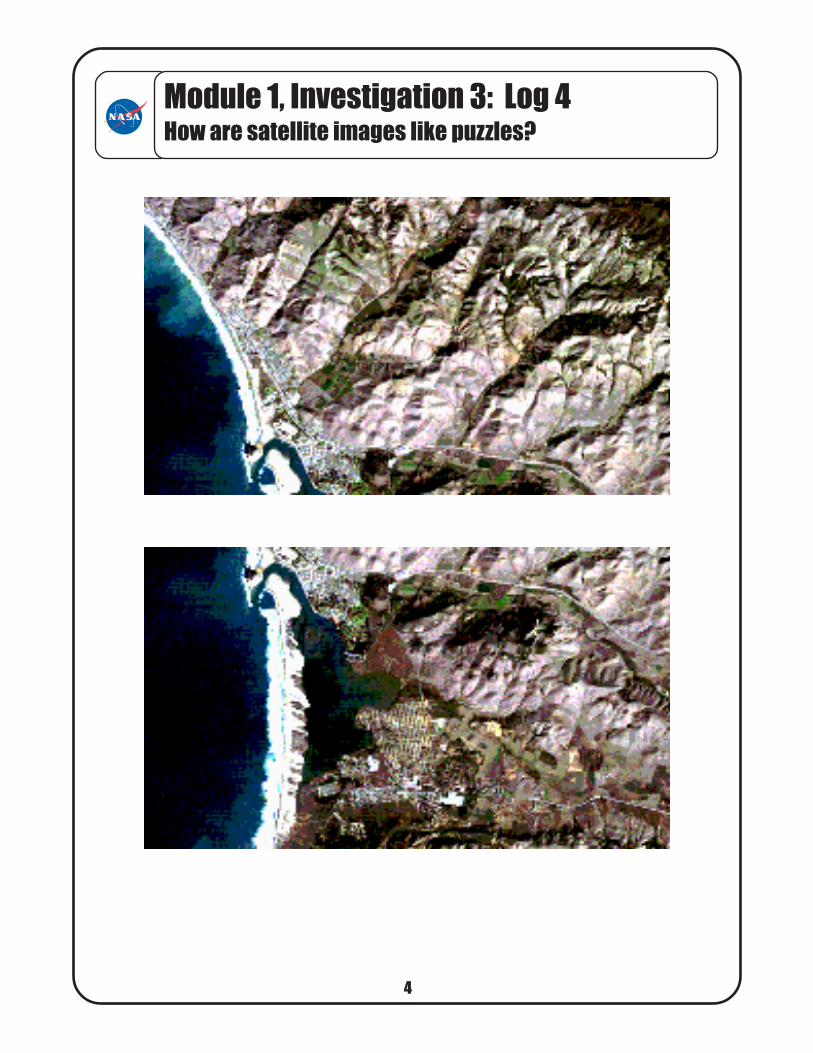
8. Divide the students into pairs and give each pair a
copy of Log 4. Ask them if they can identify one
part of each image that also appears in the other
image. (The bottom of the first image and the topof the second image.) Tell students to cut out each
of the boxes and overlap them to make a mosaic.
Point out that these images are composed of very
small squares (pixels).
Concluding the Investigation9. Who uses satellite images and how do they use
them? Divide students into groups of four and ask
them to make a list of ways that satellite images can
be used to study Earth. Next, give each group Log 5.
Tell students to cut out the boxes, read and discuss
the information, and paste the box in the bubble that
matches the drawing. Discuss the answers with
students. Geographers do all of these tasks.
10. Now show students each of the transparencies
listed below, one at a time.
Log 6: How do satellite images help predict
hurricanes?
Log 7: How do images of flooding help us learn
about Earth?
Log 8: How do images of volcanoes help us study
Earth?
Discuss each transparency using the following
questions:
• Describe what you see in the image.
• Who might use an image like this one and how
could it be used? Identify the person in Log 5who would use each image.
BackgroundRemote sensing involves the detection and measure-
ment of radiation of different wavelengths reflected or
emitted from distant objects or materials. The differ-
ence in reflection allows objects to be identified and
categorized by class, type, substance, and spatial
distribution. A pixel represents an area on an image
that is a measure of the sensor’s ability to see objects
of different sizes. For example, for a sensor with a
resolution of 15 meters, each pixel represents an area
of 15 meters by 15 meters. Satellites are particularly
effective remote sensors because they can cover the
entire globe every few days. Scientists use computers
to analyze the information gathered by satellites for
many purposes, including to make predictions. Satel-
lites orbit Earth, many greater than 480 kilometers
above the ground. Such orbits allow satellites to
observe all of Earth’s features: land, plant life, oceans,
lakes, rivers, clouds, and polar ice.
Evaluation/Key*Log 1: Morro Bay, California
Which one is a satellite image?
# 1 is an aerial photograph of Morro Bay,
California
# 2 is a satellite image of Morro Bay, California
How can you tell?
1. The satellite image shows a vertical view
from a greater distance.
2. You can see the pixels in the image.
*Log 3: How do satellites work? (River)
Module 1 Educator’s Guide Investigation 3
1 0 0 0 0 0 0 1
1 1
1 1
1 1
1 1
1 1
1 1
1 1
0
0
0
0
0
0
0
0
0
0
0
0
0 0
0
0
0
0
0
0
0 0
0
0
0
0
0
0
0
0 0
0
0
0
0
0
0
0
0
0
0
0
*Log 4: How are satellite images like puzzles?
4
*Log 5: Who uses satellite images and for whatpurpose?A. hydrologist D. volcanologist
B. meteorologist E. planetologist
C. oceanographer F. glaciologist
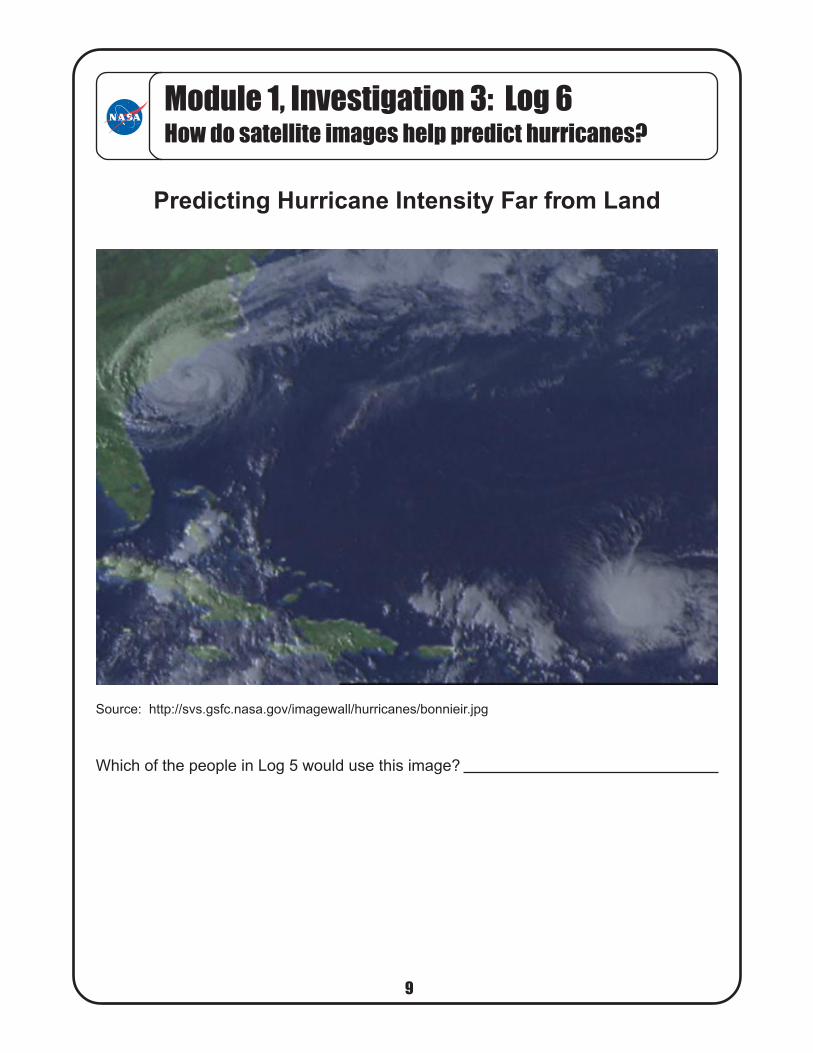
*Log 6: How do satellite images help predicthurricanes?• Describe what you see in the image. (South-
eastern part of the United States and hurricaneclouds.)
• Who might use an image like this one and how
would it be helpful? (Meteorologists; helpforecast hurricanes and give people advancenotice so they can prepare for them. Satelliteimages over time show direction and speed ofthe hurricane.)
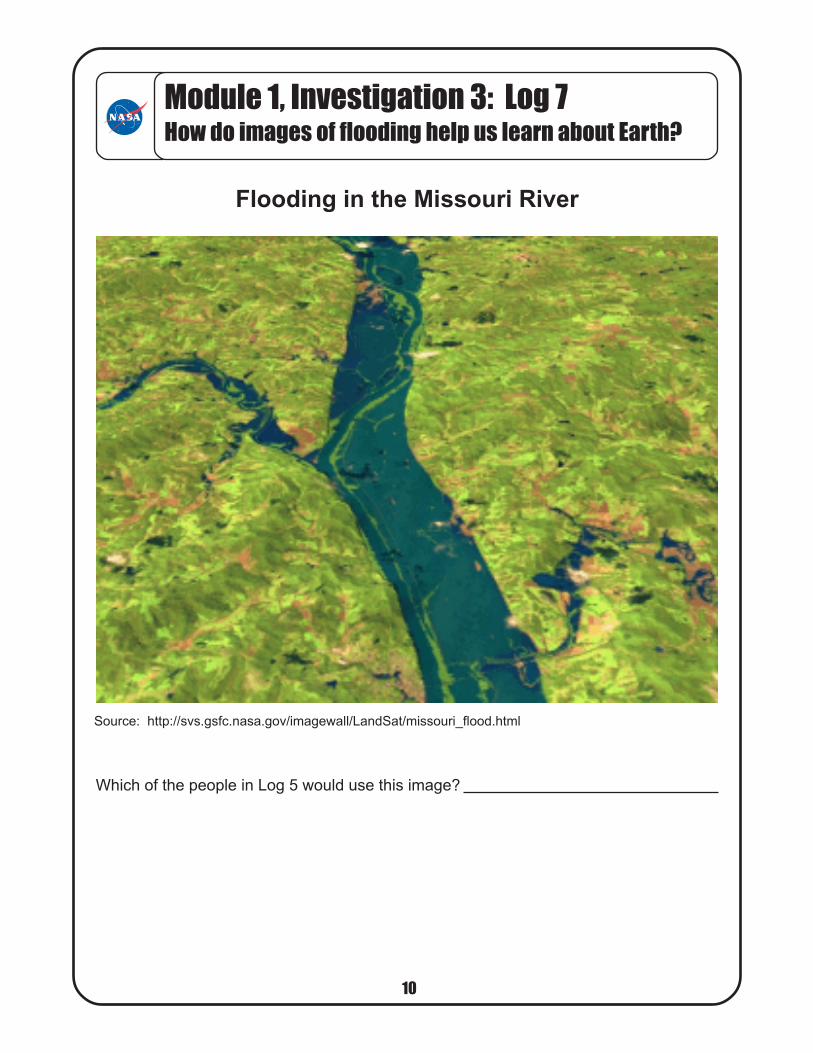
*Log 7: How do images of flooding help us learnabout Earth?• Describe what you see in the image. (Flooding
of the Missouri River. Locate the Missouri on amap.)
• Who might use an image like this one and how
would it be helpful? (Meteorologists; warnpeople of storms and resulting flooding. Hydrolo-gists; study changes in the river and whathappens to vegetation, animals, and fish whoinhabit the river during floods.
Module 1 Educator’s Guide Investigation 3
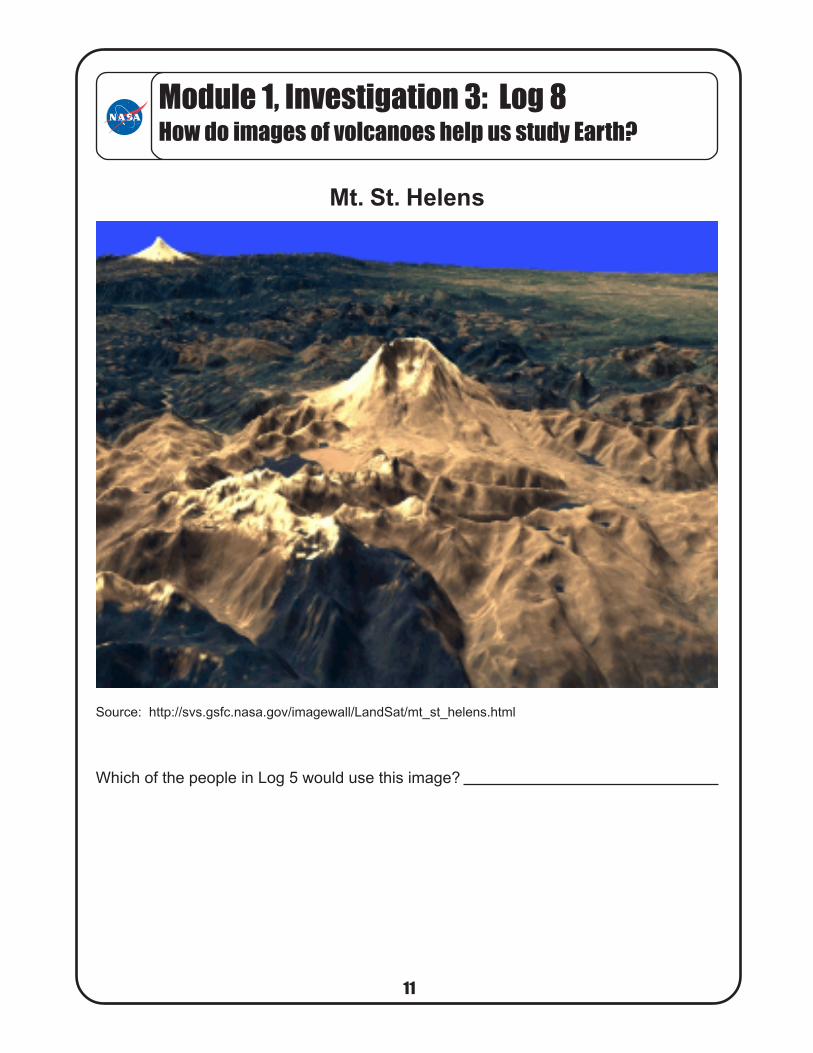
*Log 8: How do images of volcanoes help us studyEarth?• Describe what you see in the image. (Mount St.
Helens, other volcanoes, craters, vegetation.)• Who might use an image like this one and how
would it be helpful? (Volcanologists; seechanges to a region over time and to studychanges in climate as a result of it.)
References “Echo the Bat.” Lesson 4—How do satellites
work?
<http://imagers.gsfc.nasa.gov/color/>
5
Module 1, Investigation 3: Log 1Morro Bay, California: Which is the satellite image?
1
1
2
Number is a satellite image.
How can you tell? Give two reasons.
1)
2)
62
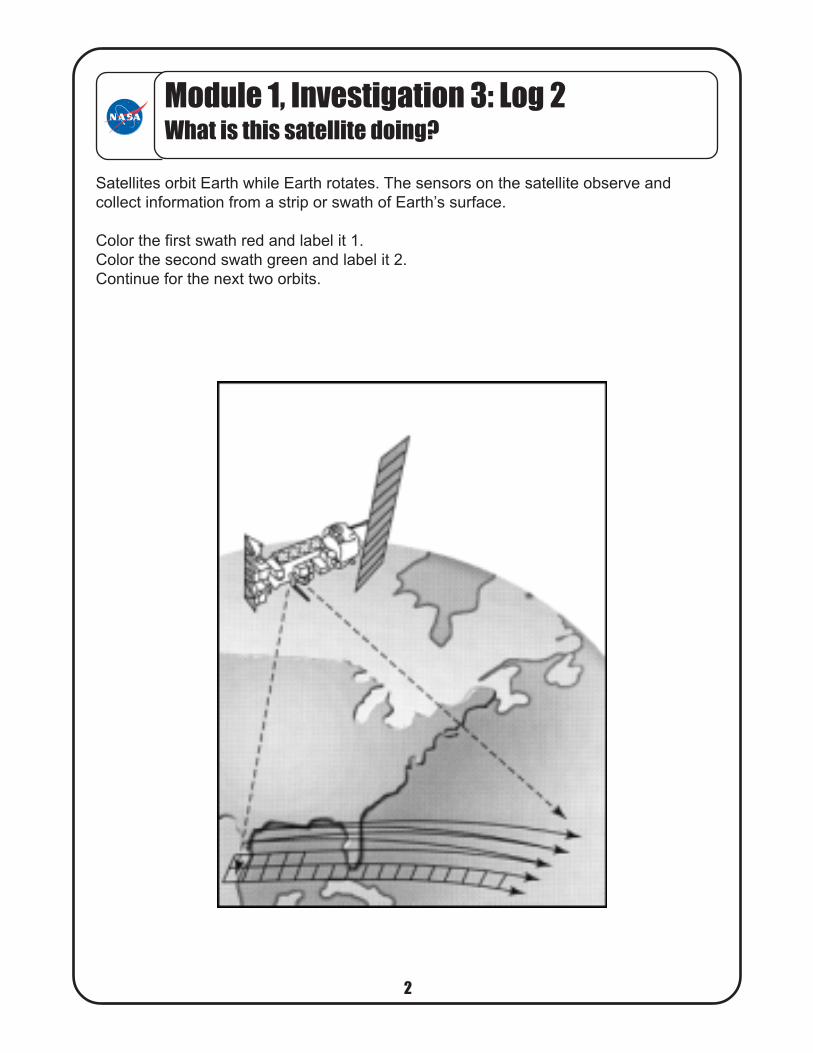
Module 1, Investigation 3: Log 2What is this satellite doing?
Satellites orbit Earth while Earth rotates. The sensors on the satellite observe and
collect information from a strip or swath of Earth’s surface.
Color the first swath red and label it 1.
Color the second swath green and label it 2.
Continue for the next two orbits.
73
Module 1, Investigation 3: Log 3How do satellites work?
1
A B C D E F G H
2
3
4
5
6
7
8
84
Module 1, Investigation 3: Log 4How are satellite images like puzzles?
95
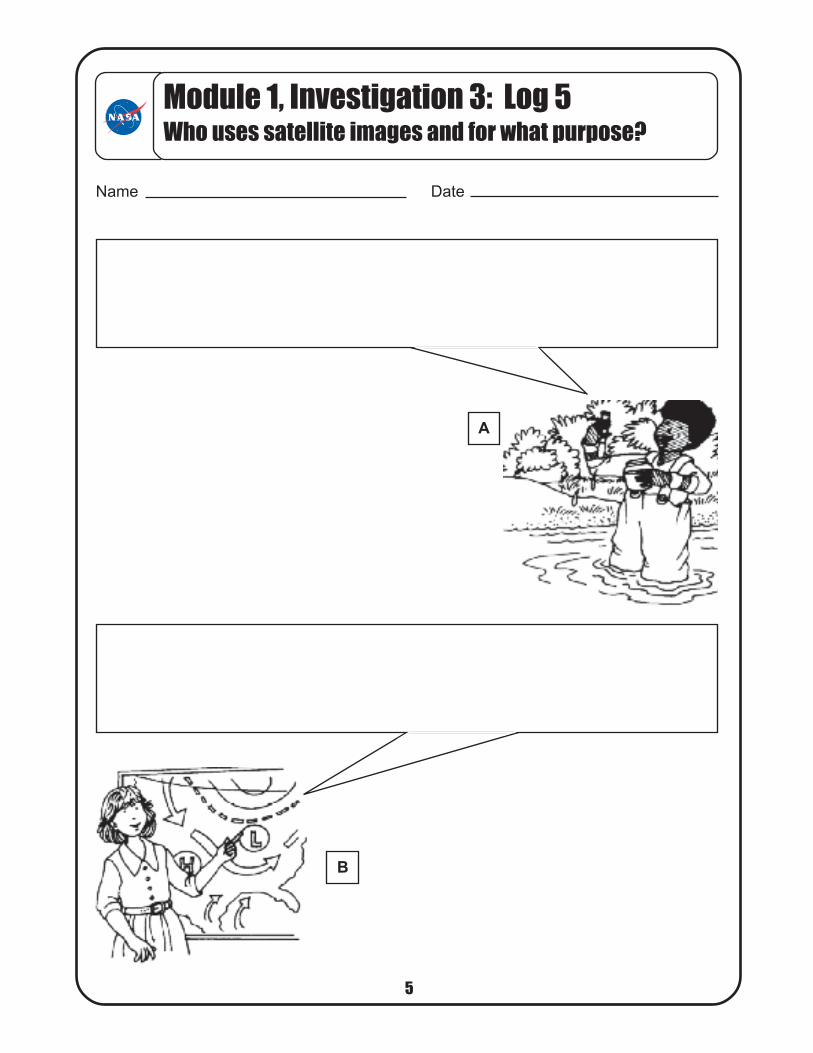
Module 1, Investigation 3: Log 5Who uses satellite images and for what purpose?
Name Date
A
B
106
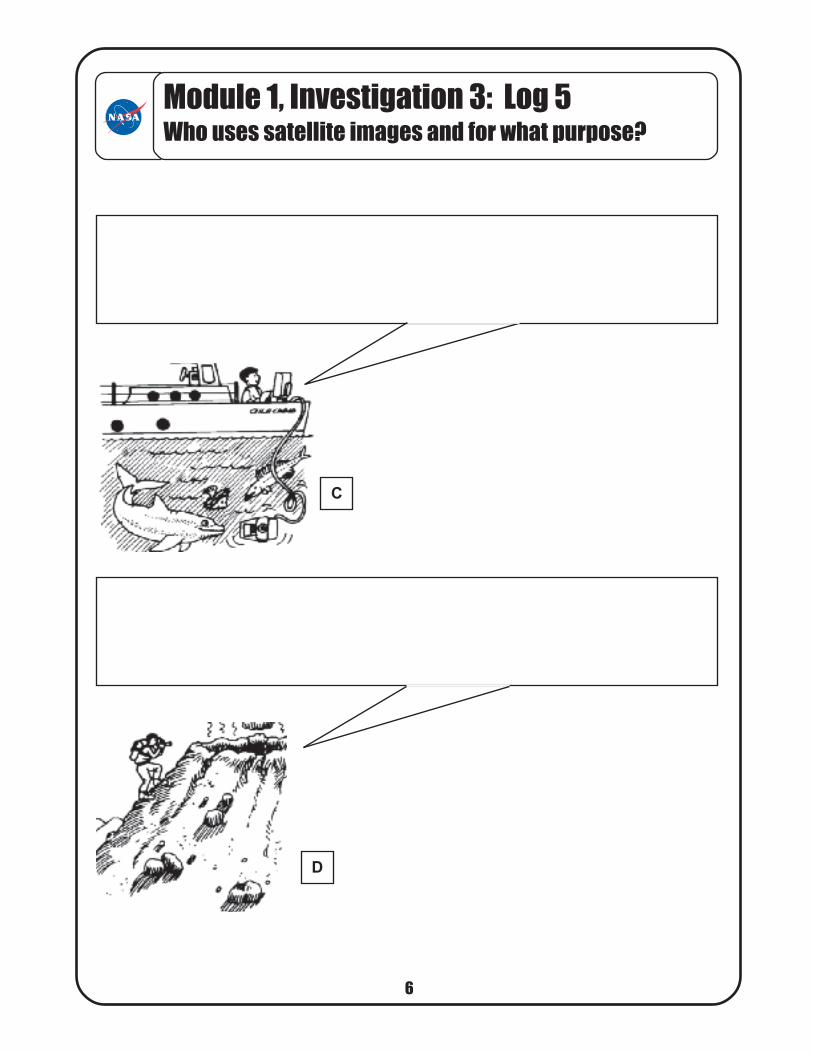
Module 1, Investigation 3: Log 5Who uses satellite images and for what purpose?
C
D
117
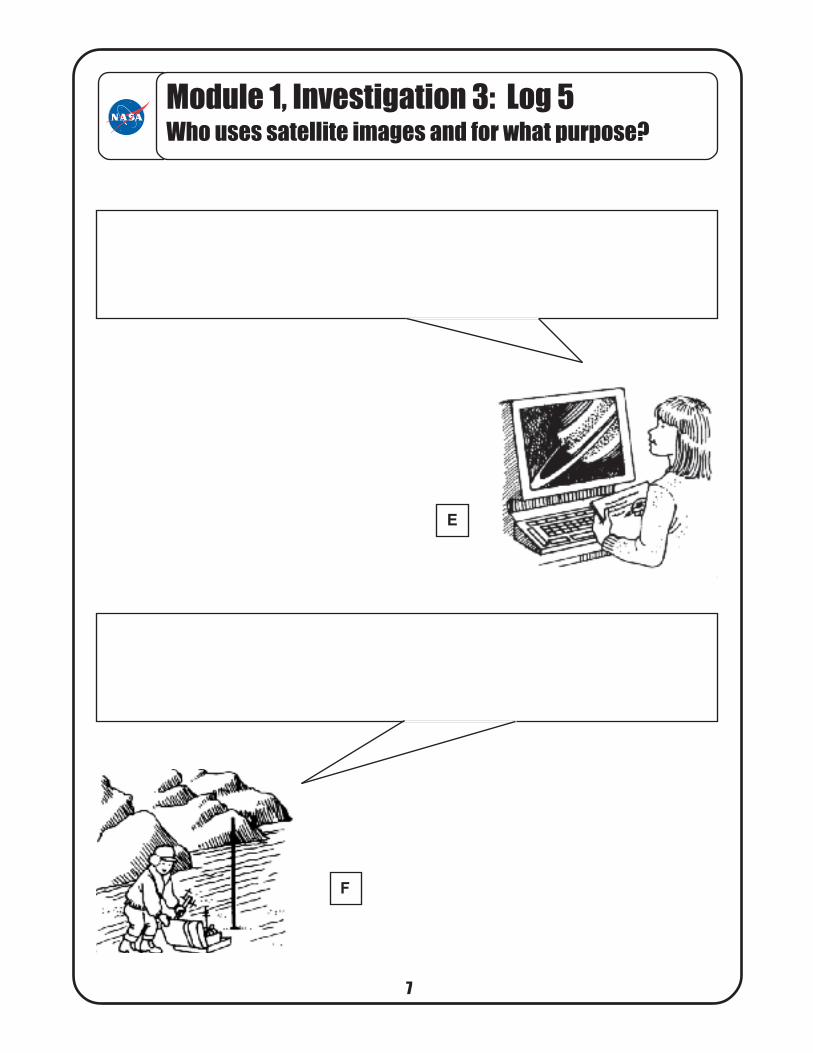
Module 1, Investigation 3: Log 5Who uses satellite images and for what purpose?
E
F
128
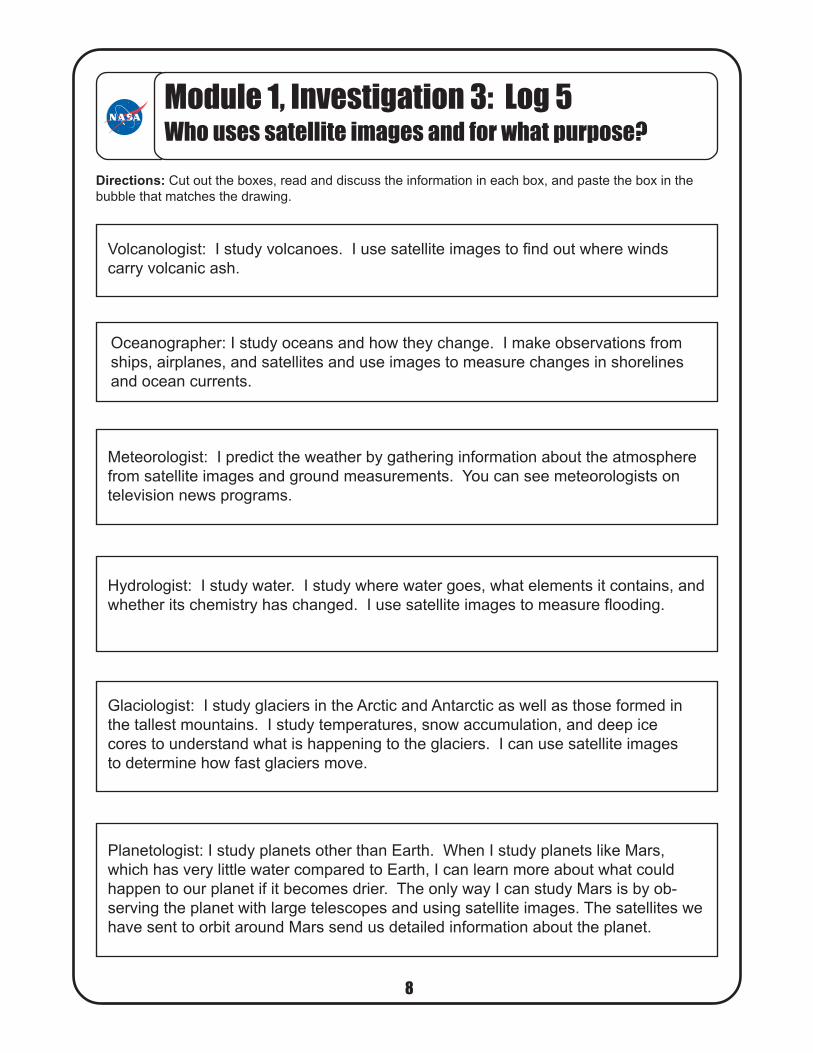
Module 1, Investigation 3: Log 5Who uses satellite images and for what purpose?
Directions: Cut out the boxes, read and discuss the information in each box, and paste the box in the
bubble that matches the drawing.
Volcanologist: I study volcanoes. I use satellite images to find out where winds
carry volcanic ash.
Oceanographer: I study oceans and how they change. I make observations from
ships, airplanes, and satellites and use images to measure changes in shorelines
and ocean currents.
Meteorologist: I predict the weather by gathering information about the atmosphere
from satellite images and ground measurements. You can see meteorologists on
television news programs.
Hydrologist: I study water. I study where water goes, what elements it contains, and
whether its chemistry has changed. I use satellite images to measure flooding.
Glaciologist: I study glaciers in the Arctic and Antarctic as well as those formed in
the tallest mountains. I study temperatures, snow accumulation, and deep ice
cores to understand what is happening to the glaciers. I can use satellite images
to determine how fast glaciers move.
Planetologist: I study planets other than Earth. When I study planets like Mars,
which has very little water compared to Earth, I can learn more about what could
happen to our planet if it becomes drier. The only way I can study Mars is by ob-
serving the planet with large telescopes and using satellite images. The satellites we
have sent to orbit around Mars send us detailed information about the planet.
139
Module 1, Investigation 3: Log 6How do satellite images help predict hurricanes?
Predicting Hurricane Intensity Far from Land
Source: http://svs.gsfc.nasa.gov/imagewall/hurricanes/bonnieir.jpg
Which of the people in Log 5 would use this image?
1410
Module 1, Investigation 3: Log 7How do images of flooding help us learn about Earth?
Flooding in the Missouri River
Source: http://svs.gsfc.nasa.gov/imagewall/LandSat/missouri_flood.html
Which of the people in Log 5 would use this image?
1511
Module 1, Investigation 3: Log 8How do images of volcanoes help us study Earth?
Mt. St. Helens
Source: http://svs.gsfc.nasa.gov/imagewall/LandSat/mt_st_helens.html
Which of the people in Log 5 would use this image?