module 1 introduction - muarchive.mu.ac.in/myweb_test/syba study material/s.y.b.a.-economics paper -...
TRANSCRIPT
1
1 MODULE 1
INTRODUCTION
INDIAN ECONOMY IN THE PRE-BRITISH PERIOD
UNIT STRUCTURE
1.0 Objectives
1.1 Introduction
1.2 Village communities
1.3 Towns during pre-British period
1.4 Handicraft Industries
1.5 Summary
1.6 Questions
1.0 OBJECTIVES
1. To understand the structure and organization of villages and
towns -during pre-British period.
2. To study the various industries and Handicrafts during Pre-British Period.
1.1 INTRODUCTION
In the preceding discussion, we are going to understand the
history of Indian economy, i.e. Study of economic activities of men over the period of time in India before the British rule. This study is little complex because India had the rule by Mughals, Marathas, Local kings and Nawabs on different parts of India. We should study the past to obtain the lessons for the present. Similarly, this study will help us in testing the hypothesis of economic theories. In this unit we shall be able to present a general picture of the villages, towns and the economic activities undertaken in India during Pre-British rule.
2
1.2 VILLAGE COMMUNITIES
Old Indian villages were isolated and self-sufficient socio-
economic units, covering about ninety percent of the population of India. In 1872, 68.5 percent of male population derived their livelihood from land. Further, people who were engaged in industrial occupation had agriculture as a subsidiary occupation. Villages were self sufficient entities. There was a barter system of exchange. The means of transport and communication were underdeveloped. The old economic order was governed and regulated largely by prevailing customs and status. The joint family and the caste system decided the occupation of the individuals. Under the economic order, rent, wages and prices were determinate and regulated by the prevailing usages and customs. Rents paid by the cultivators to the landlord were customary. Wages were largely regulated by custom which regulated the remuneration of the hired labour for agricultural purposes. Custom also regulated prices. There was limited scope for the division of labor, because of the demand for their product was fixed and limited within village. There was absence of competition, so the products were stereotyped and determined by customs. A barter economy prevailed in villages. The use of money was very rare. Village administration:
Due to lack of means of communication and no desire of the rulers to interfere in the affairs of the villages, the villages had their own administrative units. The village administration was looked after by the organization of council of elders, i.e. village panchayat. These panchayats consisted of five or more members. Village panchayat had to perform various functions such as, maintenance of peace and order, collection of revenue, keeping of accounts, police duties etc. Occupational structure of village:
It consisted of agriculturists, village artisans, village officers and menials. Agricultural cultivation was mainly for consumption and very little was kept for market. Each village had its own artisans and menials. Its ‗chamers‘ skinned the dead cattle, cured their hides and made the villagers sandals and thongs. Local carpenters made their ploughs. Blacksmith made shears, potters made utensils, and weavers made cotton clothing, so also the washer men, barbers had their jobs.
3
Agricultural production and productivity:
Peasants in Mogul India cultivated their own separate fields with agricultural practices as those employed by the European countries. They used wooden ploughs, manures, seeds and artificial irrigation to supplement rain. Wells and tanks were the main sources of the irrigation. An important feature of Indian agriculture was large number of food and non-food crops raised by the Indian peasant. The seventeenth century saw the introduction of two major crops, tobacco and maize and variety of edible fruits brought by the Moguls and Portuguese. There was substantial increase in the production of indigo, mulberry, poppy and sugarcane during seventeenth and early eighteenth centuries. The average productivity of land was higher in pre-British period as compared to the productivity in 1900, which was due to the greater availability of land.
It is important to note that land during this period was highly
stratified. On one hand, there were big peasants, who carried out cultivation on its own management (khudkasht). They employed laborers for various cultivation activities for which they paid them wages, while on the other hand small peasants who engaged in cultivation but depended upon borrowing for subsistence and food, seed and cattle. Though size of agricultural product and per capita product in the Mughal India was better, the growth rate of agriculture was slow. This was due to heavy dependence on monsoon and defective land revenue system. CHECK YOUR PROGRESS 1. Describe old village communities in India.
1.3 TOWNS DURING PRE-BRITISH PERIOD
Due to absence of data and other statistical information about the towns during pre-British period, it is difficult to comment on growth of towns and their linkages with rest of the world. Following are some of the observations.
- Most of the towns were non-industrial in character
- Every town had an industry but it was not the cause of its survival.
- The old towns owed their existence to
4
(a) Places of pilgrimage,
(b) Seats of courts or capital of province and
(c) Commercial depots.
The Mogul period had been very much important for the urbanization, especially for northern and central India. The political unification of so vast area under a single ruler stimulated commercial and urban life, as obstacles to the movement of the people and the goods were removed, greater transport facilities were provided, etc. The monetization of land revenue helped in the growth of urban areas. So also the availability of raw materials provided additional incentive to the development of urban centres.
The main towns during Mogul period were Delhi, Agra, and
Lahore. The other growing towns were Banaras, Luckhnow, Samnath, Jaunpur etc. The size and endurance of individual towns depended largely on their activities. Certain towns had been purely industrial, or commercial, or administrative unit. While Mathura and Banaras were the centres of pilgrimage. Some towns prospered more than others since they had an access to river communication which met large demand of European countries for Indian goods, for instance, the textile industries in Patna and Banaras benefited from the rivers like Ganga and Hugli.
During the Mogul period, there was steady shift in the
intensity of urbanization from west to east. As a result of prosperity, central and western parts of Uttar Pradesh started coming into their own towns and town ships were developed by direct government patronage. By the middle decades of 18th especially Awadh, were prospering, and thus leading to more favourable conditions for urbanization.
Thus it is clear that most of the urban centres depended heavily on political conditions for their development and prosperity. Similarly, new Maratha capitals, Poona, Nagpur, Baroda etc. led to the growth of towns. New port cities were quite immune to the political disorders such as Calcutta, Pondicherry and Bombay. It is because of the development of administrative headquarters also, that the cities (capitals) in their respective regions were developed. These included Agra, Delhi, and Lahore in the north and muslim capitals in the south—Bijapur, Golconda, Ahmednagar and Hyderabad. Some cities grew up because of their religious importance, such as Banaras, Ujjain, Mathura, Chidambaram and Tanjore. Cities like Calcutta, Bombay, Madras, Pondicherry, Surat, Cochin and Calicut were important centers of trade with other countries. Thus it is difficult to state the exact cause for the development of cities during pre-British period. Towns were developed with the combined causes like trade, pilgrimage centres and administrative headquarters etc.
5
1.4 HANDICRAFTS INDUSTRY
The handicrafts industry in the pre-British period was pretty
strong. Indian exports consisted mainly of handicrafts, and enjoyed a huge amount of export surplus. A comparative analysis showed that India was more advanced than European countries in terms of industrial production. Handicraft goods like, textiles, luxury products of artistic trade were flourishing under the patronage of nobles and kings. Different cities of India became the centres of industrial and commercial activity. Even towns began to become commercial centres . Organization of handicrafts industry: Division of labour:
There was a good deal of division of labor, especially in the artistic industries. However it was not so well-developed and modern as it is now. Localisation of industries:
Owing to the availability of raw materials, in case of Kashmir shawls or marbles, there was considerable localization of industries. Similarly, proximity of markets, skilled labor led to the concentration of the industries. The restriction of the area of demand was most serious limitation of the Indian handicraft industry which affected its growth and organization. The guilds on the basis of caste:
The urban industry was better organized than the rural which was primitive. Urban crafts were organized into guilds on the basis of caste pursuing hereditary occupations. They upheld high standard of workmanship, high quality of work and welfare of workers. It had following aspects.
Highest patronage was made to the titular head of the guild
(nagarseth or city lord).
The affairs of the guild were managed by the court of oldmen or ‗mahajans‘, and the only office bearer was salaried clerk or ‗Gumasta‘.
The guild system was not a capitalist. The craftsmen were
the guild men working to order on the materials supplied by the customers.
6
The artisans sometimes worked as independent masters with or without apprentices and sometimes lost their independence as and worked for dealer. The East India company did not change this system fundamentally. Its agents bought the goods through native dealers or its agents gave orders to collect the goods from actual handicraftsmen. Thus the urban handicrafts were well organized and well developed during pre-British period. Let us discuss now some of the major industries existed during the pre-British period. The textile industry:
The textile industry was one of the important industries of the pre-British period. The textile handicrafts included the manufacture of cotton, silk and woolen cloths and other varieties. The chief centres of the textiles were towns like Agra, Delhi, Lahore, Multan, Ahmadabad, Bharoch, Surat, Patna, Dacca etc. Many other towns were also involved in the production of textiles such as, Sarhind, Samanah, Nasarpur, Sehwan, Sironj, Nosarai, Shahjadpur and Agrezabad. The silk products:
The manufacture of silk cloth was the next order of importance. ‗chopas‘, ‗ bandanas‘, and ‗corahs‘ of Murshidabad, Maldah and Bengal towns; the fine floral brocadework of Banaras and Ahmedabad ; and double weaving of colors produced at Poona, Yeola and other places were the most important silk products. The woolen industry:
In woolen, the important product was Kashmiri shawls, produced in Kashmir and other towns of Punjab like Amritsar and Ludhiana. Kashmiri shawls had a great demand all over India. By 1850 the shawls became very much popular in Europe and France. However, it faced many hurdles like France-German war, introduction of new techniques, availability of cheap substitute products, leading to decline of the industry. The metal industry:
In India, the manufacture of steel and wrought iron had high perfection almost two thousand years ago. It is known that the iron industry not only fulfilled local wants, but also exported the products to foreign countries. The quality of the metal was world-wide popular. The famous iron pillar near Delhi, which fifteen hundred years old, indicates the amount of skill in the manufacture of wrought iron its durability. The iron industry flourished mainly in towns like, Mysore, Chota Nagpur and the Central provinces. The other metals like brass, copper and bell metal were also famous all
7
over India. The town centres for the metals were, Banaras, Nasik, Pune, Hyderabad, Vishakhapattanam and Tanjore. Many other industries like gold, silver, marble, sandalwood; glass-bangles, etc. were existed.
The ship-building industry:
It was a flourishing industry in Surat and Baroch. The large supplies of good timber had made ship-building a prosperous in India. In the words of William Digby, ―a hundred years ago, the ship-building was so excellent in India that ships could travel to Thames, as compared to the ships built in Britain. Other small industries:
Other industries like, jute, paper, leather wood ware, bows and arrows, cord work, cutting of precious stones, pottery, sculpturing, scents, perfumes, oils etc., were well developed during pre-British period. Pattern of Industrial Production:
The pattern of industrial production during the pre-British period would be clear from the following points. To meet the requirements of the court:
The craftsmen and artisans worked for royal workshops or ‗karkhanas‘ under the control of the government. The state authorities provided the raw material to the craftsmen and paid wages to them. Most of the karkhanas were located at cities like Agra, Delhi, Lahore and Ahmedabad. The nobles also followed the same industrial pattern. State monopolies:
The employment of skilled workers was to produce arms and ammunition for the state. The production was strictly under the control of the government supervision. The coins minting was undertaken mostly in urban areas. A large quantity of arms and ammunition was done in Dacca. Highly skilled laborers:
A large number of skilled laborers or artisans were working all over the urban areas and responsible for the production of artistic goods and luxury goods. There was a very high amount of skilled workers who were working independently.
8
Local markets:
The artisans from rural areas were working to meet the demands of local markets. They were mainly engaged in producing the traditional crafts, pottery, carpentry and other skills. The production was done on subsistence-basis, and the artisans were paid in cash or kind. Supplementary to agriculture:
The production of crafts and other products was linked to the agriculture. For instance, farmers produced the goods based on agriculture like silk, indigo, oil and sugar. The production of salt and iron was also done on the part-time basis by the peasants or farmers. Thus the production of these goods was linked to agriculture as well as to the industry. Similarly, the goods to be produced were highly determined by the caste to which the craftsman belonged. Introduction of the factory system:
As the trade activities increased, the nature of production the methods, demand conditions changed, a class of merchants was developed and they started having control on the production. The merchants supplied the finished products to the foreign traders. The artisans were employed in a large number and were paid for their services by the merchants. Stagnant technology:
In spite of the developments in the methods of production of the manufactured goods, the countries like Europe and China were far ahead of India in terms of technological progress, especially, in the use of wind and water power, printing, metallurgy, and basic goods. It is very difficult to find the reasons for the backwardness but we can say that the system of production was highly caste system oriented. That is, the belief was more in transferring the hereditary skills from one generation to another and resistance to the labor-saving technology. Check your progress:
1. Describe towns during pre-British period.
2. Describe the organization of handicrafts industry.
9
1.8 SUMMARY
1. Old village communities were self sufficient economic units.
2. Isolation: the membership of the village was limited to the villagers only the outsiders found it difficult to infiltrate the rural areas.
3. Village Panchayats looked after the village administration the king used to contact villagers through the village representatives.
4. Existence of joint family system and caste system.
5. Villagers were broadly classified into agriculturists, artisans, menials and officers.
6. Following are some of the observations of the towns during pre-British period:
- Most of the towns were non-industrial in character
- Every town had an industry but it was not the cause of its survival.
- The old towns owed their existence to
(a) Places of pilgrimage,
(b) Seats of courts or capital of province and
(c) Commercial depots.
7. The handicrafts industry in the pre-British period was pretty strong. Indian exports consisted mainly of handicrafts, and enjoyed a huge amount of export surplus. A comparative analysis showed that India was more advanced than European countries in terms of industrial production.
1.9 QUESTIONS
1. Explain the village administration.
2. Discuss agricultural production and productivity.
3. What was the occupational structure of India during pre-British period?
4. How was the village economy during the pre-British period?
5. Discuss the nature and growth of towns during Mughal period.
6. What were the types of handicrafts produced in India during pre-British period?
10
2
COSEQUENCES OF BRITISH RULE ON INDIAN ECONOMY
UNIT STRUCTURE
2.0 Objectives
2.1 Introduction
2.2 The Theory of Drain
2.3 Protection of Indian industries
2.4 Summary
2.5 Questions
2.0 OBJECTIVES
1. To understand the colonial exploitation and study the economic
consequences of British rule in India.
2. To study the Theory of Economic Drain.
3. To study the protection given to Indian industries.
2.1 INTRODUCTION
It is well known fact that the British rule of nearly one
hundred and fifty years has adversely affected the agriculture, industry, communication, trade and many other aspects of our life in India. There were positive effects also of the British rule on these sectors, however, positive effects of the rule were very much less than the negative effects. It not only affected us economically but our social, culture and institutions also were greatly changed. To understand the economic consequences of the British rule, it important for us to know how the initially trade-oriented Britishers have changed themselves into the Rulers of India later. Initially, the East India Company acquired many concessions for trade in India from then rulers, which allowed them to get control on the production and other activities and entry in the ruling of the country. It is in this context, important for us to note that in search of Indian empire and its rich culture and prosperity, Vasco-d-Gama discovered the minimum distance sea route to India. Due to this, a rapid transition took place in India‘s trade with most of the foreign countries, especially England, France, Portugal and Holland. All these countries started establishing their trade companies in India

11
to get maximum advantage from the trade with India. East India Company was one of the trade companies. The Indian rulers then, at the central and regional levels started offering them a good amount of concessions and facilities for the establishments. Thus , a favourable atmosphere for trade was created which helped them to empowering into political field as well. After the death of Bad shah Aurangzeb, the central power was almost collapsed, and the rulers at regional and local levels declared themselves as independent. This led the Company to become further strong not only economically but also politically. By the year 1818, the East India Company had established its rule all over India. Portugal ruled over Goa, Div and Daman; while France got Pondicherry. 2.1.1 Exploitation of colonial India:
After the establishment of the rule of East India Company of India, the colonial exploitation of the country began. There was massive drain of wealth from India to England resulting in economic poverty of India 2.1.2 Economic consequences of the British rule:
British Rule has brought revolutionary changes in India with respect to agriculture, commerce, transport and communication. Besides, the British rule also had an impact on social, cultural and political aspects. Initially, India had experienced a little impact of British rule especially in urban areas. However, afterwards the effects were rapidly spreaded all over India including rural and urban areas. Let us discuss the consequences of the British rule as following:
A) Agriculture:
As we know Indian economy is dominated by agriculture sector. The source of livelihood of maximum section of population was agricultural sector. Basically agriculture was looked upon as the main source of income for many families. But, the British rule has affected agriculture sector in following manner.
i) Sub-division and fragmentation: Handicraft industry was
adversely affected because of the British rule. This led to stopping of production of the handicraft products. So the people had no objective other than to move on to agriculture. Consequently the agriculture land was sub-divided among the family members. Further laws of inheritance made the land fragmented or scattered at different places. Sub-division and fragmentation created low agricultural productivity which further deteriorated the living standards of the people of rural areas.
12
ii) Changes in cropping pattern: Commercialization of agriculture had been a one of the serious consequences of the British rule. Before British rule the agricultural production was undertaken for self consumption. But after the British rule there was changed rapidly. The infrastructural development in agricultural sector with respect to transport, communication led to effective marketing. This had resulted into commercialization of agriculture. So the farmers started the production of cash crops like cotton, tea, coffee and jute. Thus the improvements in agriculture led to the production of selected crops. There was diversion in the product from the traditional crops to modern crops. This has resulted in further deterioration of their lives.
iii) Entry of middlemen: Commercialization of agriculture allowed the entry of a class of middlemen. The wide scope of market allowed the entry of brokers and middlemen. Thus the British rule created class of middlemen who acted as a link between farmers and ultimate consumers.
iv) Contribution to world market: Entry of middlemen established a strong relation between Indian agriculture and world market. The prices of agricultural products were determined as per the international standards. However this mainly affected the prices of commercial crops.
v) Processing units: Lastly, due to changes in the agrarian economy such as commercialization of agriculture, availability of foreign market, the processing industries were developed.
B) Trade and Commerce:
It has been observed that British rule has affected the composition, volume and direction of India‘s foreign trade. The effects of British rule on Trade and Commerce can be summerised as follows:
i) Export of machine-made goods to India: It was not possible
for the British textile industry to compete with indigenous producers. Therefore, the British government followed a policy, wherein it destroyed the Indian textile industry in a systematic manner. In order to protect the British textiles, the British government imposed heavy duties on Indian textiles (to be exported). However, there was no duty on imported British products.
ii) Development of Jute and plantation: The British government helped to establish Jute industry to enjoy monopoly over the supplies of jute products. A very few jute industries were established by the British. These industries were established in such a way that they could not be built
13
elsewhere because of geographical reasons. Further, plantation industry gave a lot of scope to them to exploit Indian Plantation workers.
C) Revenue and expenditure of British government:
To retain their rule over India, the British required to maintain a big army. The total expenditure on the army was one-third of the total government‘s budget. This included pension of army officers, expenditure on Secretary of State for India, Salaries of the members of the Indian Council, payment to Bank of England for debt management.
D) Railways, roads and decline of handicraft industries:
The British rule led to the construction of roads and railways. In order to improve the movement of the goods from one place to another, it was essential for the British government to create better transportation facility. So, the British government started the building up of railways and roads in the country. This has resulted into quick movement of goods and people from one place to another. However, before the British rule, the handicrafts industry was prosperous and the handicraft products were very much popular in world market. But this was changed due to the British rule. The handicraft industry was destroyed by them systematically.
E) End of village communities:
Self sufficient village community was an unique feature of Indian economy during pre-British period. A system called ‗Balutedari‘ was radically changed which affected villages‘ autonomy adversely. The destruction of village communities was due to following:
i) Village came in contact with other villages, cities due to Transport and Communication development
ii) New administrative system substituted the old administrative pattern and thus villages had lost their autonomy
iii) The destruction of handicraft industry led to the problem of unemployment among people, so people started migrating to the cities.
F) Along with the above consequences, India had experienced adverse effects on social, cultural and organizational aspects as well. These non-economic consequences were also as important as the economic consequences.
14
2.2 THE THEORY OF DRAIN
Background:
Drain of resources from India to England was one of the economic consequences of British rule in India. Indian national leaders have criticised the British rulers of India for the massive drain of wealth from their country to England during their rule. Dadabhai Naoroji, Romesh Dutt, M.G.Ranade, Lala Lajpat Rai, G.K.Gokhale were among the prime advocates who were against the drain of wealth and other resources from India to England. They have written extensively on this issue of economic drain. In their opinion, drain of wealth was the major cause of increasing poverty in India.
The transfer of resources from India to England began in the
middle of 18th century. Dadabhai Naoroji was the main exponent of theory of drain. He has clearly mentioned the concept of Economic chain in his book ―Poverty and Un-British Rule in India‖. In this book, he has given the estimates of the extent of economic chain in India. He strongly argued that it is the economic drain that has caused poverty in India.
Meaning (Concept):
Drain means one-way flow or one-directional flow. In case of economic drain it would imply the one-way flow of economic resources without any returns. According to some of nationalist leaders, the drain of wealth from India to England was equal to the excess of exports over imports. But, Dadabhai Naoroji‘s interpretation of economic drain is broad based. In addition, he included home charges and the interest paid on the British investment in India. Naoroji estimated home charges of £10 crore for the period of 1829 to 1865.
Home charges:
In the 19th century, Indian Government in England incurred certain expenditures in sterling were termed as ‗Home charges‘. These included dividends to shareholders of East India Company, interest on loans by Indian Government in England, Expenditure on British Army, pension of the British officers in India, payment of interest to railway companies and salaries of the Secretary of State for India and the staff. All these expenditures were not essential from India‘s development point of view.
R.C. Dutt estimated the total revenues of India up to £64.70crore during the period of 1891-92 to 1900-01. The expenditure during this period was £15.90crore. Therefore, one fourth of the total revenues were remitted to England as home
15
charges, over 2 crore sterling were annually drained from India to England without any quid pro quo to India and its economic development.
Pay of home charges was totally unjust and objectionable due to fact that this money was used to pay for the wars in Afganistan, China and other countries. Main causes for Home Charges and Economic drain:
1. Export surplus: Dadabhai Naoroji estimated that over the period from 1835 to 1872 there was an export surplus of £345 million.
2. Public debt : Adding to export surplus the public debt of £50 million also caused economic drain.
3. Payment for railways: Further amount of money spent on railways were 100 million pounds.
Thus, the magnitude of drain comes to £495 million or roughly 50 crore pounds.
Besides, this (£50crore) the industries in England received large additional monetary support for supplying all European Stores which the European and British wanted to fulfil their consumption requirements.
In this context, it may also be pointed out that while India
had continuous export surpluses with England, while Colonies like Australia and Canada had large import surpluses with England, which led to increase of income and employment in these countries. However, the capital stock was drained away from India to England, depriving Indian agriculture and industry which needed imported machinery.
Moral drain:
As industries were killed by foreign competition, there was drain of human skill as well, since people were forced to use primitive techniques for agriculture. According to Dadabhai Naoroji, ― All the talent and nobility of intellect and soul, which nature gives to every country, is to India lost treasure. There is, thus a triple evil – loss of wealth, wisdom and work to India under the present system of administration‖.
2.3 PROTECTION OF INDIAN INDUSTRIES
During post World War I (1919 onwards) the Indian
government provided some protection to the industries to promote
16
their growth. However the protection was limited to few industries only. Indian industrial sector had its first factory established in the middle of 19th century. The first cotton mill was established in and at Baroda in 1853 and first Jute mill was started in 1855 at Bengal. The construction of railways led to the development of ‗coal mining‘. Thus, there were only these three industries which were partially owned by Indians and foreigners. Consequently the rate of investment needed for growth of industrial sector was low. However, the flow of money into industrial sector could have been channelized if the money in banking business, landed property, money lending would have been used properly by the British government. The government did not want to develop Indian industries mainly because of a ‗fear of competition‘ to the British industries in Britain and no interest I Indian industrial growth.
Fiscal Policy:
British Government, under laissez- faire philosophy did not take any initiative to promote industrial growth. Their approach to Indian industries was not favourable for the industrial growth. Especially in case of cotton textile industry, the British government removed the import duty on the objection by Lancastire. Because of imposition of import duty may provide protection to the Indian industries. Thus, the fiscal policy of the government was not favourable for the industrial growth. Industrial Protection (1919 onwards):
There was a considerable relaxation of the imperialistic hold on the Indian economy due to World War I. During this period, many steps were taken to provide protection to the industries. The Industrial Commission was appointed in 1916, which suggested strongly to provide protection to Indian industries. The Montegue – Chelmsford report, 1919 clearly stated that, ‗India‘s commercial and fiscal policies were being dictated by Lancastire and suggested
After the ‗Swadeshi Movement‘, the real growth of industrial sector began. The number of cotton mills increased from 36 in 1900 to 64 in 1914. The output of coal increased to 16 million tonnes in 1914. So also two more mining industries came up – i.e. mica and manganese. The iron and steel industry same into existence in 1907, when Tata and Steel Company (TISCO) was established. However, the growth of Indian industrial sector had been slow due to following reasons:
a) Domestic factors: The demand from the Indian people had been low, as per capita income of the people was low. Similarly, a majority of people, being poor were not interested in buying luxury or high priced manufactured goods. They depended on
17
traditional type of goods. Due to this, there was less incentive to the use of modern technology. From supply side, all inputs had to be imported except labour which was cheap in India during British rule.
b) Unfavourable policy of the British: Due to low incomes of the people, the rate of capital accumulation was low.
Discriminating Protection:
The Fiscal Commission established in October 1921, recommended the adoption of the scheme of ‗discriminating protection‘ under which protection was to be granted to those industries which applied for it and satisfied minimum conditions laid down by the Commission.
“Triple formula of the Commission’:
The Fiscal Commission suggested following conditions for granting protection to the industries.
1. The industry must have natural advantages such as abundant supply of raw material, labour, cheap power supply and large demand for its products in the country.
2. The industry must be one which could not develop on its own (i.e. without protection)
3. The industry must be one which will be able to face international competition eventually without protection.
The above mentioned three principles were referred as triple formula of the Fiscal Commission. However, the policy of discriminating protection was criticised on following grounds:
1. Industries like defense and basic industries are significant from national point of view and these industries need protection. But, there is no mention of this in the triple formula.
2. The validity of discriminating protection policy is lost under the situation of unemployment and underemployment. If industries get protection in a country, then it would be better for the country‘s economic development.
3. Rigid and unsympathetic interpretation of the principles laid down by the Fiscal Commission caused denial of protection to certain deserving industries. The government rejected application for protection on flimsy grounds.
4. For granting protection, the government appointed a system of appointing temporary tariff boards in 1923. However, this policy of the government had many disadvantages that - i)It concerned only one industry at a time so the plans for different industries could not be synchronized or co-
18
ordinated, ii) many industries remain untouched. All this resulted in lop-sided development of the industrial sector.
Policy of Discriminating Protection:
Despite the above mentioned limitations the policy of discriminating protection helped the industrial development. Government of India granted protection to the following industries as per the recommendations of Fiscal Commission: A) Iron and steel Industry:
This was the first industry to receive protection in 1924. Tata Iron and Steel Company (TISCO) had a difficult time in 1921, preferred a claim to the Tariff Board to raise the import duty on iron and steel products. The Tariff Board agreed and recommended an increase in the import duty. In 1924 the industry was given protection due to increase in sterling value of Rupee. In 1927, the protection period of three years ended and second inquiry was conducted which continued the protection for seven years and the Steel Protection Act was passed in 1927. At the expiry of seven years in 1933-34, the Board found that protection was responsible for the growth of industry and extended the protection for another seven years i.e. up to 1941. After the World War II in 1941, the protection was continued till April 1947.
B) Cotton Textile Industry:
Tariff Board for Cotton textile industry was established in 1926. The government did not accept its recommendations earlier. But in 1930, the government imposed 11% import duty. These duties were further increased to 25% for British goods and 31.25% on non-British goods. But because of depreciation in the value of Japanese currency yen, import of Japanese cloth increased significantly. So the duty was raised to 50% on non-British goods in 1932, and further it was raised to 75% in 1933. This shows that Indian cotton textile required protection from import of Japanese cloth.
C) Paper Industry:
The production of paper was started in 1870 in India. During 1924-25, the Tariff Board recommended that protection can be given to certain categories of paper. As a result of protection, the production capacity of paper industry increased to a greater extent.
D) Match Industry:
The government had levied a high duty on matches for revenue purpose which gave an impetus for domestic production of matches. The growth of domestic industry led to the decline of
19
imports of matches. The Tariff Board recommended the conversion of the revenue duty into the protective duty of the same amount.
E) Heavy chemicals:
During World War II, it was felt that the chemical industry would grow up. But Indian demand for chemicals was low. After the war the demand for chemicals was increased. The cost of sulphuric acid was high. So, Tariff Board recommended protection to the chemical industry. But the government rejected financial assistance to the industry. E) Sugar Industry:
The Imperial Council of Agricultural Research requested the government of India to give protection to the sugar industry. The Tariff Board had to decide about the protection to be given to variety of producers involved in the production of gur, khandsari and the refineries of gur and modern factories producing white sugar directly from sugarcane. The Tariff Board recommended import duty on sugar to grant protection to sugar industry, both modern as well as manufacturing of sugar by indigenous methods.
F) Cement Industry:
Tariff Board recommended protection to this industry in the form of bounties on Indian cement sold in port cities of Bombay and Calcutta. However, the government did not directly protected by the government, though indirect protection did help the industry to grow.
Effects of protection:
i) Positive effect on production with respect to iron and steel, paper, sugar, metal, cement.
ii) No sufficient increase in production, employment and National Income.
iii) All discrimination but no protection was given to the industries who needed the protection the most.
iv) Discrimination in the triple condition of protection.
v) More benefits to the British goods industries than Indian industries.
vi) Neglect of industries like ship-building, automobiles, aero plane and electrical goods.
Thus, in spite of the protective policy, the country remained
the same as before, predominantly agricultural, underdeveloped, low saving and income, and backward in the use of modern technologies.
20
2.4 SUMMARY
1. The economic consequences can be summarized as following:
Decline of joint family system
Decline of handicraft industry
Westernization
Broad outlook of people towards caste system and education
Discipline and punctuality became important to the people
Changes in education system
Growth and development of transportation and communication means.
2. Economic drain it would imply the one-way flow of economic
resources without any returns. Dadabhai Naoroji‘s interpretation of economic drain is broad based. He included home charges and the interest paid on the British investment in India.
3. During post World War I (1919 onwards) the Indian government provided some protection to the industries to promote their growth. However the protection was limited to few industries only.
2.5 QUESTIONS
1. Discuss the economic consequences of British rule in India.
2. Explain the Theory of Drain in respect of India.
3. Describe the Policy of Protection given to Indian industries during British period.
21
3
b) SALIENT FEATURES OF INDIAN ECONOMY
UNIT STRUCTURE
3.0 Objectives
3.1 Salient Features of Indian Economy
3.2 Structural changes in National Income since Independence
3.3 Government Measures to Alleviate Poverty in India
3.4 Income Inequality in India
3.5 Summary
3.6 Questions
3.0 OBJECTIVES
1. To study the salient features of Indian economy.
2. To study the structural changes in National income of India since Independence.
3. To study the measures undertaken by Government to alleviate poverty in India.
4. To study the problem of income inequality and Government measures to reduce it.
3.1 SALIENT FEATURES OF INDIAN ECONOMY AS A DEVELOPING ECONOMY
1. Mass poverty and low per capita income: i) Per capita income in India, estimated at about $900 and
$1000 in 2007 and 2008 respectively. It is one of the lowest in the world. The extent of poverty can be derived from the poor quality of food, clothing, housing, education and medical facilities in the country, all indicates a low standard of living.
ii) Various factors are responsible for the negligible growth in per capita private final expenditure:
- Unsatisfactory growth of national income,
- Increasing pressure of growing population,
22
- unequal distribution of incremental income between different sections of the society,
- Increasing share of government expenditure, and
- Increasing share of private and public investments.
iii) If we look at the pattern of final consumption expenditure, bulk of the expenditure is still being spent on food items. The quality of food-intake is also poor leading to serious malnutrition among a large section of population.
2. Inequalities in income distribution:
The World Bank, in its World Development Report, 2008, has revealed that the richest 20 percent took 43.3 percent of the total income and the poorest 20 percent received only 8.9 percent of the total income distribution. This shows that one-fourth of the population subsists below the line of poverty.
3. Predominance of Agriculture:
Agriculture provides employment to about two-thirds of the total working population in India. The 1981 population census, however, for the first time registered a significant decline in the proportion of labour force engaged in agriculture and presently 58 percent of the labour force is estimated to be engaged in this sector. This is an indication of economic progress and structural change that is gradually taking place.
4. Underdeveloped natural resources and Inadequate Capital formation:
India is gifted with a large number of renewable and non-renewable natural resources. But these resources remain unutilised either because of lack of capital or because of lack of technical know-how. The lack of capital in the Indian economy is reflected in the low rate of production and consumption of steel, cement and electricity, etc. Inadequacies relating to technical know-how are well known.
7. Demographic Peculiarities:
India‘s population has been increasing at a very fast rate. During the four decades 1961-2001, India‘s population increased at an annual rate of about 2.2 percent and even currently is increasing at about 1.7 percent. As a consequence, the absolute annual increase in India‘s population is being estimated at about 17 million.
8. Unemployment and underemployment:
The Indian economy is a labour surplus economy which is characterized by the large mass of unemployment and
23
underemployment. The general pattern of manpower development in the country is that only 10 to 11 percent of the increase in the labour force finds employment in the organised sector while the drifts into part-time employment in the rural areas or the informal sector of the urban industry or trade, or becomes chronically unemployed. This lack of employment, obviously, reflects the waste of potentially productive resources.
9. Quality of Human Capital:
i) The poor quality of human capital can be judged by the high rate of illiteracy prevalent in the country. The constitutional provision of free compulsory education until the age of 14 years was directly aimed at eradicating illiteracy. The object has not been achieved yet.
ii) In skilled areas like computer literacy, the situation is disastrous specially at a time when the floodgates of reforms have pushed up the requirements of trained manpower.
iii) The per capita expenditure on education in India is around $5. The per capita consumption of paper estimated at only 2 kg. in India.
iv) The quality of human capital is also indicated by the availability of medical facilities. The number of hospital beds available is only 9.10lakhs for a population of over 1,000 million, a ratio of one bed per 1,075 population. The number of doctors available in the country is about 4.5 lakhs, giving doctor-population ratio of 1:2200.
v) Only 16 out of every 100 Indian households- a mere four in the villages- have what are called first generation infrastructure facilities, i.e., safe drinking water, electricity and toilets. About 20 percent of the population have no access to safe drinking water. Only 2 percent of the rural population has access to adequate sanitation.
vi) India has the distinction of the highest percentage of neonates who weigh less than the internationally accepted norm of 2.5 kg. More than 28 percent of children are born underweight.
10. Technological backwardness:
Technological backwardness had been and continues to be a characteristic feature of the Indian economy although some changes in techniques have taken place in certain selected segments of the economy.
i) The rate of technological growth in India had been between 0.7 percent and 1.1 percent.
24
ii) According to a 2007 World Bank report, India had only 119 R & D researchers per million population.
11. Infrastructural inadequacies:
Infrastructure facilities are continued to be inadequate in relation to the demands being made on it by the process of economic growth.
12. Dualistic economy:
The totally traditional and completely modern economy co-exists in India.
i) In agriculture we find the latest technology at work along with the primitive techniques also well-embedded and firmly rooted.
ii) India possesses a substantially large, modern organised sector of industry which produces highly sophisticated goods that compare well with the international standards. At the same time the old artisans do their jobs at subsistence level.
iii) A large part of the economy is subsistence-based and responds hardly to the market incentives.
iv) The outcome of five and a half decades of economic planning has been the emergence of two India‘s-an India characterised by high-tech and sophisticated industries, advances in the field of nuclear energy development, development of satellites in geostationary orbits, prosperity and five star culture, and traditional India often referred to as Bharat steeped in poverty, unemployment, hunger, disease and illiteracy.
13. Unfavourable social and value structure:
i) The structure of social relations is hierarchical. The emphasis is not on the individual but rather upon the family or class as the special unit.
ii) The value system minimises the importance of economic incentives, material rewards, independence and rational calculation. Such a value system may be criticised from an economic view point.
iii) There is little belief in man‘s power over nature.
iv) Corruption is rampant. It is both a major cause of poverty as well as a barrier to overcoming it.
The cultural value system in India appears not to be adequately favourable to economic achievement, and the people remain economically backward.
25
3.2 STRUCTURAL CHANGES IN NATIONAL INCOME SINCE INDEPENDENCE
In this topic, with the help of National Income data, we will
study important structural changes taking place in the Indian Economy during the last five and a half decades.
3.2.1 Composition of Gross Domestic Product:
The composition of GDP of an economy explains the relative significance of the different producing sectors. When a country is in a state of underdevelopment, primary sector makes the largest contribution to the national income. As the country grows and gets developed, the contribution of the industrial and services sectors gradually increases.
It would be seen that over the period the primary sector‘s
share has fallen by 40%, while those of the secondary and tertiary sectors have increases. This trend continued even in the liberalisation period.
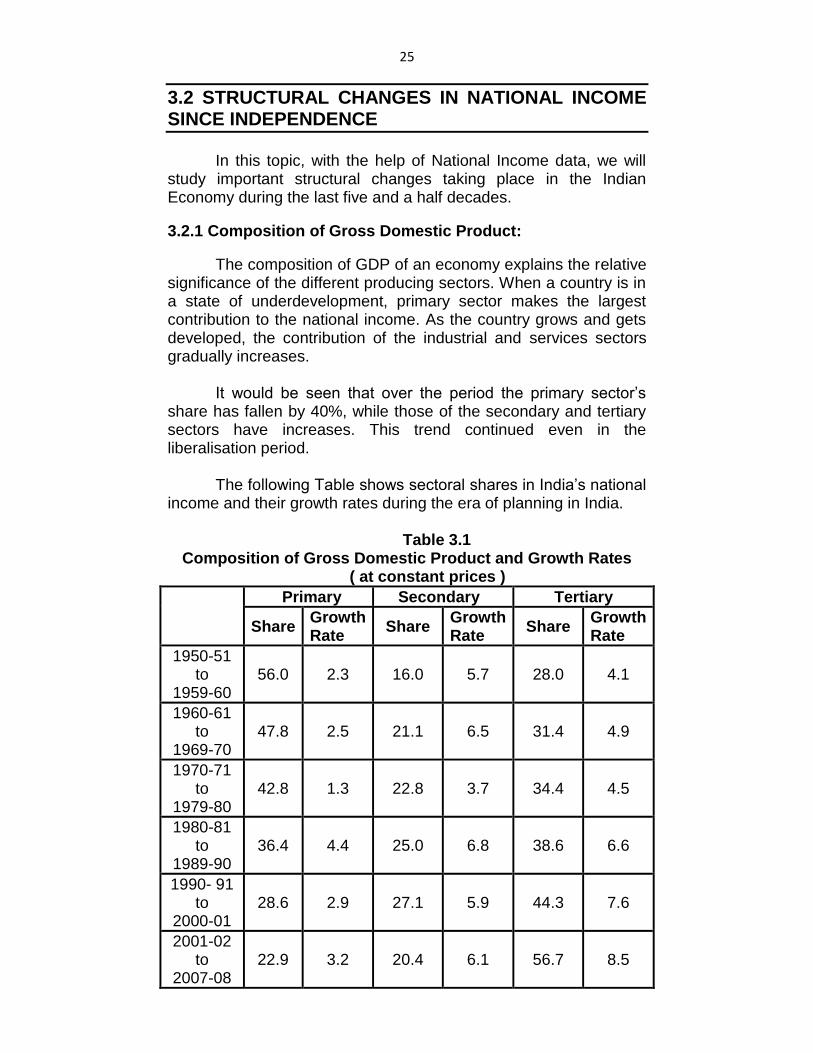
The following Table shows sectoral shares in India‘s national
income and their growth rates during the era of planning in India.
Table 3.1 Composition of Gross Domestic Product and Growth Rates
( at constant prices )
Primary Secondary Tertiary
Share Growth Rate
Share Growth Rate
Share Growth Rate
1950-51 to
1959-60 56.0 2.3 16.0 5.7 28.0 4.1
1960-61 to
1969-70 47.8 2.5 21.1 6.5 31.4 4.9
1970-71 to
1979-80 42.8 1.3 22.8 3.7 34.4 4.5
1980-81 to
1989-90 36.4 4.4 25.0 6.8 38.6 6.6
1990- 91 to
2000-01 28.6 2.9 27.1 5.9 44.3 7.6
2001-02 to
2007-08 22.9 3.2 20.4 6.1 56.7 8.5
26
In the above table it can be seen that the rate of growth of the secondary and tertiary sectors has been more than double that of the primary sector in the first two decades. In the subsequent decade, the tertiary sector grew faster than the primary and secondary sector. During 1980s, when all the three sectors were growing at a faster rate, the secondary sector was fastest. Subsequently, the tertiary sector has been growing the fastest.
Presently, about two-thirds of the incremental growth in the
Indian economy can be attributed to the tertiary, i.e. the non-commodity sector. Following are the causes of rapid increase in tertiary sector.
i) The advent of information technology and the knowledge economy has enhanced the growth of the high productivity segment of the services sector as well as a variety of service activities involving low productivity activities catering to a large mass of people.
ii) Public services grow more rapidly where national Governments have significant role in planning and production in the economy as a whole. In fact, the ‗visible hands‘ of the modern governments as reflected in the government policies and in the expansion patterns of the national and international authorities during the last few decades are directed towards the creation of fast economic and social infrastructures.
iii) Operation of the demonstration effect as a consequence of the growing mobility due to expanding foreign trade, tourism and cultural and educational tours is another important factor.
iv) Increasing urbanisation is closely associated with a rise in demands for infrastructure services such as communication, public utilities and distribution services.
v) With the increasing complexities of modern industrial organisation, manufacturing industries have become service oriented. This has been reflected in the increasing functions of accounting, finance, legal services, advertisement, marketing, public relations etc. Because of the prevalent labour laws, these services are being increasingly outsourced, so that growth in industry is actually being counted as growth in services.
3.2.2 Distribution of GDP between Agricultural and Non-Agricultural Income:
The per capita GDP in agriculture has increased barely by 37.5 percent in 55 years while that in the non-agricultural sector increased by over 580 percent. As a result, the difference between the per capita GDP in agriculture and non-agriculture has been growing steadily; the ratio of the per capita GDP in non-agriculture
27
to the per capita GDP in agriculture was 0.68 in 1950-51; it increased to 3.60 in 2006-07.
There are two reasons for the growing disparity between the agricultural and non-agricultural sectors. i) The growth rate of the agricultural sector is much smaller than
that of the non-agricultural sector; the annual growth rate being 2.38 percent in agriculture and 4.83 percent in non-agriculture over the whole period from 1950-51 to 2005-06.
ii) In spite of the high disparity between the two sectors, population does not move from one to the other. The differential stays and grows because the population in agriculture does not or rather cannot freely enter into the non-agricultural sector.
3.2.3 Share of the Rural and Urban sectors:
During the last two decades the rural economy has grown much faster (7.5% per annum) compared to urban (5.6%) on the back of strong growth in the rural non-farm sector. As a result, whereas in 1980-81, the rural sector accounted fro 41 percent of the GDP, in 2005-06 this proportion has been estimated at 51percent, i.e., the rural sector is estimated to have overtaken the urban sector.
Growth in per capita income in rural India has been almost
double compared to urban India, though on a much lower base.
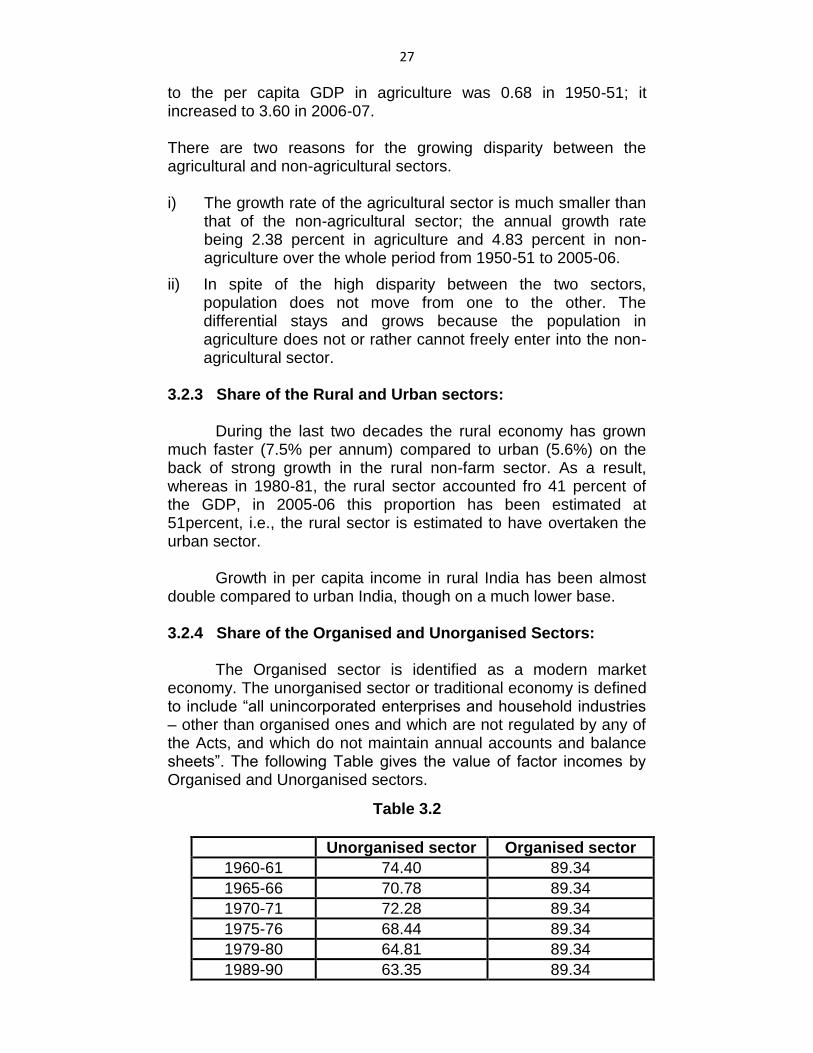
3.2.4 Share of the Organised and Unorganised Sectors:
The Organised sector is identified as a modern market economy. The unorganised sector or traditional economy is defined to include ―all unincorporated enterprises and household industries – other than organised ones and which are not regulated by any of the Acts, and which do not maintain annual accounts and balance sheets‖. The following Table gives the value of factor incomes by Organised and Unorganised sectors.
Table 3.2
Unorganised sector Organised sector
1960-61 74.40 89.34
1965-66 70.78 89.34
1970-71 72.28 89.34
1975-76 68.44 89.34
1979-80 64.81 89.34
1989-90 63.35 89.34
28
During the last couple of decades, organised sector has
been growing faster than the unorganised sector. This trend has been facilitated by policies like reduction in excise duties and tariffs. It indicates growing modernisation in the organisation pattern of the economy.
However the unorganised sector continues to dominate the
economy with two-thirds of the NDP.
3.2.5 Share of the Public and Private sectors in the GDP:
During the period, the public sector has practically doubled its share in the GDP and now accounts for one-fourth of the economy. This is undoubtedly a significant change in the structure of the economy in terms of the increased importance of the public sector in domestic activity; over the period the growth rate of the public sector was 6.0 percent per year, whereas that of the private sector was only 2.8 percent. If, in spite of this, the private sector still continues to dominate the structure of the economy with 75 percent of the GDP, it is partly because of the importance of agriculture which still retains a dominant position in the economy.
3.2.6 Factor Shares:
The traditionally accepted factors of production are land, labour, capital and enterprise, and their shares are described as rent, wages and salaries, interest and profits. In Indian economy, there is still another category known as ‗self employed‘ whose income is known as ‗mixed income‘.
i) Mixed income of the self employed constitutes a large single
component, about 40 percent of the NDP. This would indicate that a large segment of the Indian economy is run by self-employed persons. Sector-wise, the primary sector holds the predominant position among the sectoral mixed incomes, although its share has registered a significant decline over the years. The share of the sector comprising transport, communications and trade, which emerges as the second important sector, has increased over the years, whereas the share of the secondary sector has remained almost unchanged over the years.
In the current decade, beginning with 2000-01, the share of mixed income has shown a declining trend. This is significant and alarming view of the fact that while the share of population dependent upon mixed income has increased.
ii) Another 40 percent of the GDP in the economy generates in the form of ‗employee compensation‘, and over the years this
29
proportion has been rising. During the period 2000-01 to 2004-05, the share of the employee‘s compensation came down marginally. This included both worker‘s wages, which came down quite sharply, and remuneration of salaried employees, which went up. A sector-wise analysis of the share of employee compensation leads to the following conclusions:
a) The share of the primary sector has gone down which indicates growing mechanisation;
b) The share of the secondary sector has been stationary which indicates the lack of employment orientation on the part of the industrial growth;
c) The share of the tertiary sector has been rising. It is this sector which seems to be most employment-oriented.
iii) The share of the operating surplus companies, which includes both private and public enterprises has been increasing, it increased from about 12 percent of the GDP in 2000-01 to about 16 percent in 2004-05. This jump has been driven primarily by an increase in corporate profitability.
iv) Remittances are calculated as the sum of worker‘s remittances, compensation of employees, and migrant transfers. Remittances currently account for 3 percent of India‘s GDP. To sum up, an important structural change in the Indian
economy has been rising proportion of wages and salaries in the NDP. The magnitude of employee compensation in the Indian economy makes it particularly vulnerable to the adverse impact of inflation and also tends to strengthen the cost-push factors in acceleration of inflation.
3.3 GOVERNMENT MEASURES TO ALLEVIATE POVERTY IN INDIA
Magnitude of Poverty in India:
In India, poverty has been defined as that situation in which
an individual fails to earn income sufficient to buy him bare means of subsistence. To quantify the extent of poverty and measure the number of ‗poor‘ in the country, professional economists have made use of the concept of ‗poverty line‘.
The Planning Commission has defined the poverty line on
the basis of recommended nutritional requirements of 2,400 calories per person per day for rural areas and 2,100 calories for urban areas. For a household of five members, the poverty line has been fixed at an annual income of Rs. 21,593 in rural areas and Rs. 31,390 in urban areas. According to the Planning Commission
30
about one-fourth (27.50 percent) of India‘s total population, i.e., about 315 million, live below the poverty line.
Poverty however is not equitably distributed throughout the
country. Bihar, Jharkhand, Chhattisgarh, Uttarakhand, M. P., Rajasthan and U. P. account for 51 percent of the country‘s poor. If Assam, Orissa, West Bengal and some Union Territories are added, these states would account for over 70 percent of the poor in the country.
Poverty Alleviation Programmes: Beginning with the launch
of Integrated Rural Development Programme (IRDP) in the year 1980, a number of PAP‘s have been formulated and implemented. Among these PAP‘s the more important have been : Training of Rural Youth for Self-Employment (TRYSEM 1975), National Food for Work Programme (NFWP), Rural Landless Employment Guarantee Programme (RLEGP 1983), Development of Women and Children in Rural Areas (DWCRA), Million Wells Scheme (MWS), Nehru Rozgar Yojana (NRY), Employment Assurance Scheme (EAS), Prime Minister‘s Rozgar Yojana (PMRY), Prime Minister‘s Integrated Urban Poverty Eradication Programme (PMIUPEP), etc.
Most of the programmes have been recently redesigned and
restructured to improve their impact on the poor. The important PAP‘s presently in operation are:
Swarna Jayanti Gram Swarozgar Yojana
National Food for Work Programme
Sampoorna Grameen Rozgar Yojana
Prime Minister‘s Rozgar Yojana
Swarna Jayanti Shahari Rozgar Yojana. 1. National Food for Work Programme (NFWP):
This programme was launched on November 14, 2004 in
150 most backward districts of the country with the objective to intensify the generation of supplementary wage employment. The programme is open to all rural poor who are in need of wage employment and desire to do manual unskilled work. It is implemented as a 100 percent centrally sponsored scheme and the food grains are provided to states, free of cost.
2. Rural employment Generation Programme (REGP):
This was launched in 1995 with the objective of creating self employment opportunities in the rural areas and small towns, is being implemented by the Khadi and Village Industries Commission (KVIC). Under REGP, entrepreneurs can establish village industries
31
by availing of margin money assistance from the KVIC and bank loans for projects with a maximum cost of Rs. 25 lakh.
3. Jawahar Gram Samridhi Yojana:
The Government announced on June 23,1999 the launch of this programme. It was dedicated to the development of rural infrastructure at the village level and was implemented by the village panchayats.
The programme was implemented as a Centrally-sponsored
scheme on cost-sharing basis with the States in the ratio of 75 : 25. In the case of Union Territories, the total funding would be done by the Centre. The village panchayats were empowered to prepare and implement the annual plans.
The works to be undertaken would, however, be decided at the village level by the gram sabha or the village assembly of the panchayayts concerned. The JGSY was merged with SGRY from September 9, 2001. 4. Prime Minister’s Rozgar Yojana (PMRY):
The Prime Minister‘s Rozgar Yojana was launched on October 2, 1993.
- It provides sustained employment to about 10 lakh educated unemployed youth in micro enterprises, manufacturing services and business ventures.
- All those who have undergone government-sponsored technical courses for a minimum duration of six months, besides matriculates and ITI diploma holders, are eligible for the scheme.
- Youth between the age 18 and 35 belonging to families with annual incomes of less than Rs. 24,000 are eligible for assistance under the scheme.
- All promotional, financial and development agencies of the state and central governments at the field level are involved in the implementation.
- Reputed NGO‘s are associated with the scheme, especially in the selection, training of entrepreneurs and preparation of projects.
5. Swarna Jayanti Shahari Rozgar Yojana:
The scheme came into effect on December 1, 1997 by integrating three PAP‘s for urban areas., via. NRY, Urban basic services for the Poor and the PMIUPEP. The scheme primarily provides for setting up of self employment ventures by the urban
32
poor as also wage employment through creation of durable community assets.
- The component of wage employment would be confined to towns, with less than five lakh population as per the 1991 census.
- The scheme also envisages encouragement for empowerment of urban poor women and provides for a special sub-scheme, called the ―Development of Women and Children in Urban Areas‖. Under this, groups of women setting up ventures jointly would be entitled to a special subsidy of 50 percent of the project cost or Rs. 1.25 lakhs, whichever is less.
- A special incentive is to be provided for thrift and credit societies of urban poor women.
6. Swarnajayanti Gram Swarozgar Yojana (SGSY):
This scheme replaced the earlier self employment and allied programmes (IRDP, TRYSEM, DWCRA, SITRA, GKY and MWS) has been launched since 1st April, 1999. This scheme is meant for the rural families/individuals falling below poverty line. Within the rural poor, the vulnerable persons/groups like SCs/STs, women and disabled constitute its target groups.
SGSY is conceived as a holistic programme of micro-
enterprises covering all aspects of self-employment, viz., organisation of the rural poor into Self Help Groups (SHGs) and their capacity building, planning of activity clusters, infrastructure build-up, technology, credit and marketing. SGSY is a credit-cum- subsidy programme. 7. Sampoorna Grameen Rozgar Yojana (SGRY):
It was formally inaugurated by the Prime Minister on September 24, 2001. The Jawahar Gram Samridhi Yojana and the Employment Assurance Scheme have been merged into the SGRY. It is basically a food-for-work programme. A part of the wages will be paid in cash and another part in kind in the form of food grains. It is a centrally-sponsored scheme. Employment opportunities would be generated by emphasising the growth of drought-proofing, watershed development, afforestation and construction of school buildings- i.e., varied infrastructure activities.
8. District Rural Industries Project (DRIP):
The Government launched in October, 1994, the District Rural Industries Project to strengthen the untapped potential for employment generation and for augmenting the income of the rural
33
poor. It envisages to set up rural industrial estates in 500 selected villages within a period of five years generating sustainable employment opportunities for 25,000 rural population with an investment in the form of bank loan of about Rs. 25 crores with all necessary linkages.
9. Janashree Bima Yojana:
It is a new insurance scheme for people below the poverty line. The scheme was announced on June 20, 2000. It will cover all those who are below the poverty line and in the age group of 18 to 60 years. The Central Government would pay Rs. 100 per person per annum out of the provision of Rs. 200 per person. The beneficiaries would get up to Rs. 20,000 for natural death, Rs. 25,000 for partial disability due to accidents, and Rs. 50,000 for death or total disability in accidents.
10. Pradhan Mantri Gramodaya Yojana (PMGY):
It was introduced in 2000-01 with the objective of focussing on village level development in five critical areas, i.e., health, primary education, drinking water, housing and rural roads, with the overall objective of improving the quality of life of people in rural areas. It incorporates the following schemes:
i) Pradhan Mantri Gram Sadak Yojana
ii) Pradhan Mantri Gramodaya Yojana (Gramin Awas)
iii) Pradhan Mantri Gramodaya Yojana (Rural Drinking Water Project)
11. Jai Prakash Rozgar Guarantee Yojana (JPRGY):
The Union Budget 2002-03 proposed to set up this scheme to provide employment guarantee to the unemployed in the most distressed districts of the country. KVIC, DC (SSI) and other agencies will be fully involved in the implementation of this scheme.
3.4 INCOME INEQUALITY IN INDIA
An equitable distribution of national income is a necessary
component of economic development. Otherwise, an increased national income may fail to percolate to the different sections of society, so that the fruits of growth are enjoyed by few people- a situation described as Inequalities of income.
Inequalities of income and wealth exist both in rural and
urban areas.
34
Rural Sector: The inequalities of income are to be seen in the form of unequal distribution of land. Agricultural census reveals that 17.4 percent of land area is covered by only 1.6 percent of holdings which occupy the topmost position in the economic ladder, whereas59 percent of the holdings at the bottom of the ladder occupy only 14.9 percent of land.
Urban sector: The distribution of urban households indicated that 45 percent of the households had assets less than Rs. 10,000 each, accounting for only 4 percent of the value of total assets. At the other end of the distribution, nearly 10 percent of the households were located in higher assets groups with assets exceeding Rs. 1 lakh each, and sharing 56 percent of the value of total assets.
Rural – Urban disparities: The 60th round of the NSS finds that the monthly per capita consumer expenditure in urban areas was 88 percent higher than in the rural areas. This gap is primarily due to the difference in price levels in rural and urban areas.
Government policies and measures to improve distribution of income:
In India, economic growth had been slow and there is enough evidence to show that the vulnerable sections of population had not benefited from it. In the light of this experience the government revised its policy towards the problem of poverty. 1. Land reforms and redistribution of agricultural land:
The main cause of income inequality in rural area is the concentration of agricultural land in the hands of few. Before the abolition of the zamindari system most of the land belonged to the absentee landlords who appropriated a large portion of the agricultural production while the tiller of the soil got hardly enough for subsistence. Thus, legislative measures were undertaken to abolish landlords and other intermediaries and ceilings on land holdings were fixed.
Serious attempts to carry out these reforms would have
broken the concentration of agricultural land. But unfortunately not only the legislative measures to carry out land reforms were inadequate and defective; their implementation was also difficult at various levels. As a consequence, even now about 40 percent of the agricultural land belongs to top 5 percent of the rural households.
2. Control over monopolies and restrictive trade practices:
Control of monopoly tendencies is considered necessary for reducing income inequalities. The Monopolies and Restrictive
35
Trade Practices Act was passed in 1969. It provided for control over monopolies and also for prohibiting restrictive trade practices. In case of business houses indulging in objectionable restrictive trade practices, their cases were to be handed over to the Monopoly and Restrictive Trade Practices Commission whose judgement would be binding on the erring enterprises. In practice, these measures were found rather inadequate and ineffective. Not only this, the government further liberalised these measures on one pretext or the other.
3. Employment and wage policies:
Since the beginning of the Fourth Plan some special programmes have been undertaken such as the Crash Scheme for Rural Employment, the drought Prone Areas Programme, self employment schemes for engineers, employment schemes for educated unemployed, Food for Work Programme etc. These programmes were undertaken in an ad-hoc manner. The Integrated Rural Development Programme (IRDP) was started in 1978-79 and extended to the entire country during the Sixth Plan period. The IRDP, the National Rural Employment Programme (NREP) and the Rural Landless Employment Guarantee Programme (RLEGP) aimed at providing employment to the rural poor. On April 1, 1989 the NREP and the RLEGP were merged into the Jawahar Rozgar Yojana. The IRDP and allied programmes such as Training for Rural Youth for Self Employment and Development of Women and Children in Rural Areas have been restructured into a single self employment programme called Swarnajayanti Gram Swarozgar Yojana (SGSY) from April 1999. The JRY has been restricted and renamed as Jawahar Gram Samridhi Yojana (JGSY) with effect from April 1999. The UPA government at the Centre has introduced National Rural Employment Guarantee Scheme. However, inadequate budgetary allocation has undermined the scheme.
4. Social Security Measures:
The most comprehensive social security measure is the Employee Provident Fund Act which entitles the insured workers to medical benefits, disability benefit, benefits for the period of sickness, maternity benefit and benefits to dependents. The Workmen‘s Compensation Act entitles industrial workers to compensation in case of injury resulting in death, disability or disease while on duty. Similarly the Maternity Benefit Act regulates the employment of women workers for certain periods before and after child birth and the Employees Provident Fund Act entitles workers employed in organised industries to the benefit of provident Fund.

36
1. Minimum Needs Programme:
While ensuring the fulfilment of the basic needs, it should not hinder economic growth. The Minimum Needs Programme which was introduced in the Fifth Plan was not only directed towards the alleviation of poverty but also aimed at assisting economic growth. The provision of free or subsidised services through public agencies is expected to improve the productive efficiency of both rural and urban workers. This integration of social consumption programmes with economic development programmes is necessary to accelerate growth and to ensure the achievement of plan objectives.
2. Programmes for the uplift of the poor:
The poorest sections in the rural areas belong to the families of landless agricultural labourers, small and marginal farmers, rural artisans, Scheduled castes and Scheduled tribes. In order to raise income of these categories of rural poor the following three types of programmes have been undertaken
i) Resource and income development programme for the rural poor,
ii) Special area development programme,
iii) Works programme for creation of supplementary employment opportunities.
A number of programmes for the uplift of the rural poor falling in one category or the other have been in operation in the country for as much as the last two and a half decades.
3. Taxation:
Looking at the taxation structure and the degree of progression in the rates of direct taxes one gets the impression that the Indian tax system is progressive and has been designed to prevent concentration of wealth in a few hands. But reality is different. The base on which income tax is levied i India corresponds to what is called in the tax jargon a ‗realised income‘ and is arrived at after allowing for all expensed of earning. In addition, the law allows numerous exemptions and deductions in order to promote various ―non tax‖ objectives. No systematic attempt has been made to examine how the Indian income tax base compares with a true index of the economic position of the tax payers such as the net accretion concept of income which is more relevant for judging the impact of taxes on the distribution of the command over goods and services in the community. Data required for such an enquiry are simply not available. Thus on the basis of superficial examination of the tax rates it would be wrong to claim
37
that Indian tax system redistributes income in favour of the poorest sections of the society. Taxation of income on the basis of realisation, as is the practice in this country, does not touch the major source of inequality.
3.5 SUMMARY
1. Indian economy is characterised by mass poverty, low
standard of living, unequal distribution of income, poor quality of human capital, predominance of agriculture, backwardness of technology, infrastructural inadequacy etc.
2. The composition of GDP of an economy explains the relative significance of the different producing sectors. As the country grows and gets developed, the contribution of the industrial and services sectors gradually increases. It would be seen that over the period the primary sector‘s share has fallen by 40%, while those of the secondary and tertiary sectors have increases.
3. The per capita GDP in agriculture has increased barely by 37.5 percent in 55 years while that in the non-agricultural sector increased by over 580 percent.
4. Growth in per capita income in rural India has been almost double compared to urban India, though on a much lower base.
5. During the last couple of decades, organised sector has been growing faster than the unorganised sector. However the unorganised sector continues to dominate the economy with two-thirds of the NDP.
6. Poverty however is not equitably distributed throughout the country. Bihar, Jharkhand, Chhattisgarh, Uttarakhand, M. P., Rajasthan and U. P. account for 51 percent of the country‘s poor. If Assam, Orissa, West Bengal and some Union Territories are added, these states would account for over 70 percent of the poor in the country.
7. The important Poverty Alleviation Programmes presently in operation are:
Swarna Jayanti Gram Swarozgar Yojana
National Food for Work Programme
Sampoorna Grameen Rozgar Yojana
Prime Minister‘s Rozgar Yojana
Swarna Jayanti Shahari Rozgar Yojana
38
8 Government introduced various measures to reduce inequalities of income such as land reforms, redistribution of land, social security measures, taxation policies etc.
3.6 QUESTIONS
1. Explain the characteristic features of Indian Economy.
2. Examine the structural changes in National Income in India since Independence.
3. Define poverty and discuss the various measures adopted by Government to alleviate poverty in India.
4. Income is unequally distributed in India – Discuss.
39
4
MODULE 2 AGRICULTURE
UNIT STRUCTURE
4.0 Objectives
4.1 Nature of India‘s Agriculture
4.2 Importance of agriculture in Indian economy
4.3 Causes of low productivity
4.4 Land Reforms
4.5 New Agricultural Strategy and Green Revolution
4.6 Summary
4.7 Questions
4.0 OBJECTIVES
1. To study the nature of India‘s Agriculture
2. To study the importance of agriculture in Indian economy
3. To study the causes of low productivity in Indian agriculture
4. To study the changes brought about in Indian agriculture through Land Reforms
5. To study the meaning, role and achievement of New Agricultural Strategy in Indian agriculture and the future of Green Revolution
NATURE AND IMPORTANCE:
4.1 NATURE OF INDIA’S AGRICULTURE
At the time of independence, India‘s agriculture was in a
state of backwardness. Productivity per hectare and per worker was extremely low. The techniques employed were age-old and traditional. Because of low productivity, agriculture merely provided subsistence to the farmers. Following causes explains the backward and traditional nature of Indian agriculture.
40
1. Feudal relations of production:
At the time of Independence, three types of land tenure system were prevalent in the country – zamindari, mahalwari and ryotwari. The zamindari system was based on exploitation since zamindars pressurized peasants in a variety of ways. Ryots in the Ryotwari system also leased out their land to tenants for cultivation and these tenants were also subjected to the exploitation. After Independence, the State governments enacted laws to abolish the intermediaries. However, these were entirely inadequate to have any drastic impact on the agrarian structure. 2. Usurious capital and rural indebtedness:
During the pre Independence period, moneylenders charge exorbitant rates of interest, manipulate accounts to their advantage and often seize the land of small and marginal farmers on one or the other pretext. Since long the Indian peasant has been living the life of bonded land slave. After Independence, the government has initiated a number of steps to curb their activities. One of the important policy measure being the development of cooperative credit institutions and the increasing participation of banks in providing rural credit. However, because of a number of factors, the small and marginal farmers continue to depend on moneylenders for fulfilling their credit. 3. Labour market dualism:
Because of the excessive pressure of population on land, wages in the agricultural sector tend to be considerably lower as compared to the modern (industrial) sector. This leads to a labour market dualism. This dualism is explained by the fact that large number of workers remain sticking to traditional agriculture despite low wage due to either to ignorance of better opportunities outside agriculture, or to their inability to obtain a modern sector job despite wishing to do so, or to the cost of moving being unacceptably high in relation to the expected wage premium. These cheap labour leads to the adoption of labour intensive methods of production. 4. Outmoded farming techniques:
Most of the Indian farmers continue to use outmoded farming techniques. The traditional agriculture depends on the biological sources of energy, rains and drug manure. Returns to farmers under this technique of production are very meagre and the nature of farming is appropriately described as subsistence
41
farming. However, with the advent of the new agricultural strategy in 1966, modern techniques of production and new high-yielding varieties of seeds, agricultural productivity registered substantial increases in these areas. However, since large areas of the country continue to use outmoded agricultural techniques. 1. Fluctuations and instability in crop output: The Indian
agriculture has rightly been called a ‗gamble in monsoons.‘ Even now as much as 60 per cent of gross cropped area continues to depend on rainfall. Therefore, nature continues to play a major role in determining the level of agricultural production.
2. Diversities in the agricultural sector and the problem of
generalization: India is a large country having substantial agricultural diversities. Different regions exhibit entirely different characteristics so that no one plan can be conceived for all agricultural regions of the country. For e.g., take a case of rainfall. Western Rajasthan and a part of the Thar Desert have a very uncertain rainfall of 4 to 5 inches a year, whereas Cherrapunji in Assam has an annual rainfall of more than 450 inches. While considerable areas face drought conditions in a particular year, some areas encounter the fury of floods. Some areas face the problems of waterlogging and salinity. There are substantial regional inequalities in regard to sub-division and fragmentation of holdings.
The presence of large diversities in the agricultural sector
makes it necessary to devise separate agricultural policies for different regions. It is not possible to generalize and formulate a single agricultural policy for the nation as a whole.
4.2 IMPORTANCE OF AGRICULTURE IN INDIAN ECONOMY
Indian agriculture in the pre-Independence period can be
correctly described as a subsistence occupation. Britishers pursued a typical colonial policy in India and did nothing to develop agriculture. They created a class of intermediaries known as zamindars who sucked the blood out of the rural poor. A substantial part of the produce was taken away by this parasitic class and the actual cultivator was left only with subsistence income. Some farmers started adopting agriculture on a commercial basis only after Independence and more specifically when planning era and Green Revolution started. 1. Share in National Income: After the initiation of planning in
India, the share of agriculture has persistently declined on
42
account of the development of the secondary and tertiary sectors of the economy. From 59.2 per cent in 1950-51, the share of agriculture in GDP at factor cost declined steadily to 27.4 per cent in 1999-2000 (at 1993-94 prices). At 1999-2000 prices, the share of agriculture in GDP at factor cost was 27.6 per cent in 1999-2000 and 23.0 per cent in 2004-05.
The share of agriculture in national income is often taken as an indicator of economic development. As the country progresses, the dependence on agriculture declines.
2. Largest employment providing sector: In 1951, 69.5 per cent
of the working population was engaged in agriculture. This percentage fell to 60 per cent in 1999. However, with rapid increase in population the absolute number of people engaged in agriculture has become exceedingly large. Development of the other sectors of the economy has not been sufficient to provide employment to the increasing additions to working population forced to fall back upon agriculture even if their marginal productivity on land is zero or nearly so. This gives rise to the familiar problem of underemployment and disguised unemployment.
3. Contribution to capital formation: Since agriculture is the
largest sector in India, it must play an important role in pushing up the rate of capital formation. Unless the rate of capital formation increases to a sufficiently high degree, economic development cannot be achieved. To extract surplus from agriculture, the policies advocated are: (i) transfer of labour and capital from farm to non-farm activities; (ii) taxation of agriculture in such a way that the burden on agriculture is greater than the government services provided to agriculture.; (iii) turning the terms of trade against agriculture by imposing price controls on agricultural products, taxation or the use of multiple exchange rates that discriminate against agriculture.
4. Providing raw materials to industries: Agriculture provides
raw materials to various industries of national importance. Sugar industry, jute industry, cotton textile industry, vanaspati industry are examples of some such industries which depend on agriculture for their development. The entire range of food processing industries is similarly dependent on agriculture.
5. Market for industrial products: Since more than two thirds of
the population of developing countries like India lives in rural areas, increased rural purchasing power is a valuable stimulus to industrial development. If steps are taken to expand agricultural output and productivity, the income of the rural
43
sector will increase which will increase demand for industrial products.
6. Importance in International trade: For a number of years the
three agriculture-based exports of India – cotton, textiles, jute and tea accounted for more than 50 per cent of export earnings of the country. Total exports increased to around 70 to 75 per cent if we add the export of other agricultural commodities like cashew kernels, tobacco, coffee, vanaspati oil, sugar etc. This heavy dependence reflected the underdeveloped nature of the economy. The share of agricultural exports in total exports was 44.2 per cent in 1960-61. This fell to 30.7 per cent in 1980-81 and 10.2 per cent in 2004-05. As far as composition of imports is concerned, capital goods, industrial machinery, petroleum and petroleum products and maintenance imports have accounted for the bulk of imports.
Development of agriculture is a virtual precondition of
sectoral diversification and development itself. A growing surplus of agricultural produce is needed in the country to (i) increase supplies of food and agricultural raw materials at non inflationary prices; (ii) widen the domestic market for industrial goods through increased purchasing power within the rural sector; (iii) facilitate inter sectoral transfers of capital needed for industrial development and (iv) increase foreign exchange earnings through agricultural exports.
4.3 CAUSES OF LOW PRODUCTIVITY
A comparison of productivity levels in Indian agriculture with
the levels in other countries shows the low level of productivity in Indian agriculture. Productivity of wheat in India is about 34 percent of the productivity in U.K. and 67 percent of the productivity in China. As far as rice is concerned, productivity in India is 49 percent of the productivity in China and 40 percent of the productivity in USA. The productivity of seed cotton in India is about one-fifth as compared with China and less than one-half as compared with USA and Pakistan. As far as groundnut is concerned, productivity in India is 26 percent of the productivity in USA and 36 percent of the productivity in China. India happens to be one of the largest growers and producers of most of the agricultural crops but ranks very low in terms of yield. The causes of low productivity in Indian agriculture can be divided into the following categories: A. General causes: 1. Social environment: The Indian farmer is illiterate,
superstitious, conservative and non responsive to the new agricultural techniques of production which helps to increase
44
productivity. This type of social environment of villages is often stated as an obstacle in agricultural development.
2. Pressure of population on land: There is heavy pressure of population on land. Since the non-agricultural sectors of the economy have not been able to expand, the pressure on agricultural sector continued to increase. In 2001, nearly three quarters of the rural working population was employed in the agricultural sector. Increasing pressure on land is partly responsible for the subdivision and fragmentation of holdings. Productivity on small economic holdings is low.
3. Land degradation: Government of India has recently estimated
that nearly half of the country‘s 329 million hectares of soil could be categorised as degraded. Almost 43 percent of the land suffers from high degradation resulting in 33-67 percent yield loss while 5 percent is so damaged that it has become unusable.
B. Institutional causes: 1. Land tenure system: In the pre independence period, the
agrarian structure depended solely on the presence of a few big landlords and zamindars. The status of the actual cultivator was not more than a slave or serf, had no incentive to increase productivity. In the post independence period, legislations were passed to abolish intermediaries. But it only changes their garb and became big landowners. Regulation of rent, security of tenure, ownership rights for tenants, etc. did not make the position of tenants better. In this land tenure system, it is difficult to increase productivity only through technological means.
2. Lack of credit and marketing facilities: The weak
agricultural structure is not supported by any sound infrastructure like marketing system, in spite of large trading being carried out by the government agencies like Food Corporation of India and the NAFED, continues to be faulty. In case of the credit finance system, services of regional rural banks and NABARD are inadequate.
3. Uneconomic holdings: According to National Sample
Survey, 52 percent holdings in 1961-62 had a size of less than 2 hectares. In 1995-96, 80 percent of the total holdings fell under this category. Most of these holdings are not only extremely small they are also fragmented into a number of tiny plots so that cultivation on them can be carried out only by labour intensive techniques. This results in low productivity. Until the excessive labour employed on agriculture is transferred to alternative jobs and the holdings are
45
consolidated, modern techniques of production cannot be adopted and the possibilities of increasing agricultural productivity will remain limited.
C. Technical causes: 1. Outmoded agricultural techniques: most of the Indian
farmers continue to use outmoded agricultural techniques. Wooden ploughs and bullocks are still used by a majority of farmers. Use of fertilizers and new high yielding varieties of seeds is also extremely limited.
2. Inadequate irrigation facilities: Despite substantial expansion of irrigation, even now 60 percent of the gross cropped area continues to depend on rains. Rainfall is often insufficient, uncertain and irregular. Accordingly, productivity is bound to be low in all those areas which lack irrigation facilities, and are totally dependent on rains. Even in areas having irrigation facilities, potential is not wholly utilised because of defective management. The costs of irrigation are also increasing continuously and the small farmer is, therefore, unable to make use of available irrigation facilities.
Check Your Progress:
1. Explain the nature of Indian agriculture. 2. Discuss the institutional causes of low productivity in Indian
agriculture. _________________________________________________________________________________________________________________________________________________________________________________________________________________________________________________________________________
4.4 LAND REFORMS
Changes brought about in the agrarian structure through
direct intervention are characterized as land reforms. The need for direct intervention in the form of land reforms was required in India because of the exploitative nature of the land tenure system prevailing during the pre Independence period.
There were three types of land tenure systems prevailing in the country: a) Zamindari system or the Landlord-Tenant system: In this system the ownership of the land is separated from the managerial and labouring function. Here the landlord acts as an intermediary between the State and the actual tiller, and is responsible for the payment of land revenue to the State.
46
b) Mahalwari system or Communal system of farming : Under this system the ownership of land is maintained by a collective body usually the village serves as a unit of management, land is distributed among individual peasants, revenue is collected from them and paid to the government by the body. c) Ryotwari or the Owner- cultivator system: Under this system, the bulk of the rights of use and control of land are held by the family which provides the primary labour force on the farm. The Owner –Cultivator is responsible directly to the State and pays land revenue.
Objectives of Land Reforms in India: In India the land reforms programme has remained one of the major policies for rural development ever since the inception of the planning process. The major objectives are as follows-
Restructuring of agrarian relations to achieve egalitarian social structure;
Elimination of exploitation in land relations;
Improvement of socio-economic conditions of rural poor by widening their land base;
Actualisation of the goal of ―land to the tiller‖
Increasing agricultural production and productivity;
Facilitating land base development of rural poor;
Infusion of a greater measure of equality in local institutions. Progress of Land reforms in India: 1. Abolition of the Zamindari system: The Zamindari system manifested absentee landlordism and was largely responsible for the deteriorating conditions of tenant-farmers. Immediately after Independence, every State enacted its own legislation for the abolition of intermediary interests. The legislation brought about 20 million cultivators into direct contact with the State. A considerable area of cultivable wasteland and private forests belonging to the intermediaries have been vested in the State. This has facilitated the distribution of 57.7lakh hectares to landless agriculturists. 2. Tenancy Reform Legislation : Tenants can be classified into (i) Occupancy tenants, (ii) sub-tenants, (iii) tenants-at-will. Occupancy tenants enjoy permanent rights like the owner and do not face the fear of eviction as long as they pay rent on time. Whereas tenants-at-will and sub-tenants existence depends on the mercy of landlords. Therefore, to protect these people special laws have been enacted and implemented.
47
A. Regulation of rent:
In the pre-Independence period, the rent charged by Zamindars from the tenants was exorbitant. Legislations were enacted after 1947 to regulate the limits of rents and reduce the burden on tenants. The Fifth Five Year Plan stated that maximum rent should be fixed at one-fourth or one-fifth of the total produce. Except Punjab, Haryana, Jammu and Kashmir, Tamil Nadu and Andhra Pradesh, this limit generally observed by all the States.
However, legislations fixing maximum limit of rent have been violated. Because of the strong socio-economic and political hold of the landowners in the countryside, they have been able to extract considerably more rent from the peasants than the rent fixed by the legislations.
B. Security of tenure:
legislation for security of tenure had three essential aims:(i) ejectments do not take place except in accordance with the provisions of the law; (ii) land may be resumed by an owner, if at all, for personal cultivation only; (iii) in the event of resumption, the tenant is assured of a prescribed minimum area.
However the degree of protection to tenants afforded by the
law in a particular area depends upon the following factors:
a) Definition of the term tenant
b) The circumstances in which landowners are allowed to resume tenanted land for cultivation
c) Definition of the term personal cultivation
d) Status of land records. In all tenancy laws of the country persons cultivating the
lands of others on payment of rent are treated as tenants. However, in some States like U.P. and west Bengal, sharecroppers are not regarded as tenants. Thus all laws aiming at protecting tenants do not help them.
The right of resumption combined with flaws in the definition
of personal cultivation rendered all tenancies insecure. The landlord could eject any tenant on the plea of personal cultivation.
Many landlords compelled their tenants to give up the
tenancies on their own accord. In this manner they succeeded in circumventing the tenancy laws because no laws can help the tenants if they give up their right voluntarily.
48
Laws relating to security of tenure can be implemented
effectively only if correct and up-to-date land records are available. A person can claim that he is a tenant only if his name appears as such in the land records. However, it has been observed that in many States either no records of tenancy exists or are incomplete and out-of-date.
C. Ownership Rights of tenants:
Some tenants have passed legislations to confer right of ownership on tenants. In some states the laws fall short of expectation. West Bengal, Karnataka and Kerala have achieved more success than the other States.
It has been observed that for a long period of time, many
tenants did not exercise their rights to purchase ownership of land they cultivated, because either they could not afford to pay the purchase price or many tenants were unwilling to purchase land.
D. Land Rights of Women:
Historically, land reform has excluded women. But in some second generation land reform movement in India, women raised the demand for land to be allotted in their names. Women‘s ownership of land becomes necessary condition for adequate use of credit and necessary flexibility in management of farm resources.
E. Ceilings on Land Holdings:
By a ceiling on land holdings mean the fixing of the maximum size of holding that an individual cultivator or a household may possess. Beyond this maximum size all land belonging to the landlords is taken over by the government to be redistributed among the landless labourers. The basic objective of such a measure is to reduce wide disparities of income and wealth found in the agrarian structure.
Progress of Ceiling Legislation:
The unit of application: A family is the unit of application of ceilings. The family is defined as consisting of husband, wife and children.
The level of ceilings: For lands which have an assured supply of water and where at least two crops are raised, the ceiling depending upon the productivity of land and other factors, has been fixed at 10 to 18 acres. In places where irrigation is done by private sources, for purposes of fixation of ceiling 1.25 acres is to be the equivalent of on acre of land irrigated by
49
public sources, but this is subject to the condition that in both the cases the upper limit does not exceed 18 acres. In areas where there is a provision for irrigation for the raising of only one crop, the upper limit of the ceiling has been fixed at 27 acres. For the remaining types of land, the upper limit is 54 acres.
Performance: The success of the ceiling laws is judged by the area of surplus land that becomes available for redistribution among landless, marginal and small farmers. The area actually declared surplus is only a small part of the are that should have been available as surplus. The wide disparity between official estimates and State Government‘s declarations of surplus land has come to light after a comparison between data from the different Agricultural Censuses with the State‘s estimates.
F. Consolidation of Holdings:
A major cause of low agricultural productivity is the fragmentation and sub-division of holdings, resulting in uneconomic holdings. The average size of a holding can be raised through consolidation of holdings. Legislation to prompt consolidation of holdings has been enacted in different States after Independence where agrarian reforms had already been undertaken. While separate organisations were set up for this work in Punjab, Haryana and U.P. and the entire area of these States was covered by plans of consolidation, the work was done by normal agencies of revenue administration in other States with varying degrees of intensity. It has been recommended in the recent plans that consolidation should be made compulsory in the command of the large irrigation projects.
G. Land Records:
Correct and up-to-date land records are an essential condition for effective implementation of land reforms programme. It is also necessary to ensure smooth flow of credit and agricultural inputs to landholders. States are increasingly paying attention to this vital aspect of the programme. Land records are now being computerised, throughout the country, although the progress is slow.
4.5 NEW AGRICULTURAL STRATEGY AND GREEN REVOLUTION
4.5.1 New Agricultural Strategy:
50
The new strategy of agricultural production came to be introduced around the period between the Third Plan and Fourth Plan (i.e. 1961-1969). The first stage of new strategy pertained to the Intensive Agricultural District Programme. It was started in 1960-61 in three districts and was subsequently extended by stages to another thirteen. Later, the High-Yielding Varieties Programme (HYVP) was also added and the strategy was extended to cover the entire country. This strategy has been called by various names: modern agricultural technology, seed-fertiliser-water technology, or simply green revolution.
As a result of the new agricultural strategy, area under improved seeds has gone up since 1966. The new varieties are of a short-term duration and therefore it is possible to grow more than one crop during a year. Wheat production has increased tremendously in Punjab, Haryana, Delhi, Rajasthan and Western U.P. for the New Mexican varieties like Lerma Rojo, Sonara-64, Kalyan and P.V.18.
Traditional agriculture relies heavily on indigenous inputs
such as the use of organic manures, seeds, simple ploughs and other primitive agricultural tools, bullocks, etc. Modern technology, on the other hand, consists of chemical fertilisers, pesticides, improved varieties of seeds including hybrid seeds, agricultural machinery, extensive irrigation, use of diesel and electric power, etc. Since 1966, the use of modern agricultural inputs has increased at a compound rate of 10 percent per annum in contrast to the traditional inputs rising at the rate of only one percent per annum during the same period. 4.5.2 Achievements of the New Agricultural Strategy: i) Boost to the production of cereals: The major achievement of
the new strategy is to boost the production of major cereals, viz., wheat and rice. The production of rice increased from 35 million tonnes in 1960-61 to 93 million tonnes in 2006-07. The yield per hectare has also recorded an improvement from a little more than 11 quintals in 1960-61 to nearly 21 quintals now. The production of wheat increased from 11 million tonnes in 1960-61 to 75 million tonnes in 2006-07. The green revolution was confined only to High Yielding Varieties (HYV) cereals, mainly rice, wheat, maize and jowar.
ii) Increase in the production of commercial crops: The green revolution was mainly directed to increase the production of food grains. It did not affect initially the production of commercial crops or cash crops such as sugarcane, cotton, jute, oilseeds and potatoes; these crops did not record any significant improvement initially. However, significant
51
improvement in the output of sugarcane took place after 1973-74. Likewise, there was considerable improvement in the production of other cash crops such as oilseeds, potatoes etc.
iii) Significant changes in crop pattern: As a result of the green revolution, the crop pattern in India has undergone two significant changes. Firstly, the output of cereals has risen at the rate of 3 to 4 percent per annum but the output of pulses has remained stagnant or even declined. This has resulted in a decline in the importance of pulses in food grain output from 16 percent in 1960-61 to 6 percent in 2006-07. Cereals, on the other hand, have risen in importance from 84 percent to 94 percent during the same period.
Secondly, among cereals, the proportion of rice in total cereal output has come down from 48 percent to 46 percent between 1950-51 and 2006-07. During the same period, however, the importance of wheat has more than doubled, i.e., from 15 percent to 37 percent. The share of coarse grains has gone down from 37 percent to 17 percent of the total cereals. The rising output of wheat indicates a substitution of coarse grains with wheat, on the side of production as well as consumption.
iv) Boost to agricultural production and employment: The successful adoption of the new agricultural technology has led to continuous expansion in area under crops, increase in total production and rise in agricultural productivity. Impressive results have been achieved in wheat, rice, maize, potatoes, etc. the adoption of new technology has also given a boost to agricultural employment because of diverse job opportunities created by multiple cropping and shift towards hired workers. At the same time, there has been displacement of agricultural labour by the extensive use of agricultural machinery.
v) Forward and backward linkages strengthened: The new technology and modernisation of agriculture have strengthened the linkages between agriculture and industry. Even under traditional agriculture, the forward linkage of agriculture with industry was always strong, since agriculture supplied many of the inputs of industry; but backward linkage of agriculture to industry – the former using the finished products of the latter was weak. However, agricultural modernisation has created a larger demand for inputs produced and supplied by industries to agriculture and thus the backward linkage has also become quite strong. In this way, the linkage between agriculture and industry has got strengthened.
4.5.3 Weaknesses of New Strategy:
52
The new agricultural technology has made the farmer market-oriented. The farmers are largely dependent on the market for the supply of inputs and for the demand for their output. Modern technology proved superior over traditional technology only in those areas where appropriate conditions prevail. These conditions prevail only in certain selected areas.
i) Indian agriculture is still a gamble in the monsoon: After
introduction of the green revolution in the early 1960s, food grains production has increased to 108 million tonnes in 1970-71. But immediately for the next year i.e. in 1972-73, it has reduced to 95 million tonnes. Sharp fluctuations in the latter years were observed in the food grains production. After many fluctuations, the output increased to 176 million tonnes in 1990-91 and 213 million tonnes in 2001-02. Due to extensive drought conditions it declined steeply to 174 million tonnes during 2002-03 it then touched to 231 million tonnes in 2007-08. Two conclusions can be drawn from fluctuations of output of cereals in India since the introduction of new agricultural strategy:
a) Output of cereals as well as other agricultural products is still subject to weather conditions as in the past;
b) The maximum and minimum total outputs, however, are now much higher than in the past.
ii) Growth of Capitalistic Farming in Indian Agriculture: The new agricultural strategy consisting of IADP and HYVP necessitated heavy investment in seeds, fertilisers, pesticides and water. These heavy investments are beyond the capacity of small and medium farmers. The vast majority of rural households with little or no land, with poor finances and poor creditworthiness have not gone in for the new technology in a big way and have benefited the least from the green revolution. Regions which have been well endowed with resources like Punjab, Haryana and Western U.P. have benefited the most from the use of modern technology and have prospered. Other regions have remained backward and underdeveloped. Regional disparities have thus increased.
iii) Widening disparities in income: Technological changes have contributed to widening the disparities in income between landowners on one hand and landless labourers and tenants on the other.
iv) New Strategy and Socio-economic relations in rural areas: Often small and marginal farmers are forced to take some land on lease; in some cases, they are pure tenants. Rising rents in recent years and/or the tendency of landowner to resume land for personal cultivation. It has actually led to an
53
absolute deterioration in the economic condition of the small owner-cum-tenant cultivator class.
v) Problem of labour displacement: Two types of technological innovations were introduced under the Green revolution – biological and mechanical. The term biological innovations refer to the changes in inputs that increase productivity of land. The introduction of high yielding varieties and use of fertilisers, fall in this category. The mechanical innovations refer to the introduction of new appliances which displaces human or bullock labour. Thus, biological innovations are labour-absorbing, mechanical innovations are labour-saving. The effect of mechanisation can be seen in the wheat growing areas of Punjab. Nearly 55 percent of the total labour displaced was expected to be caused by tractors and pump-sets and 37 percent by threshers and reapers. This shows that the technical changes causes labour displacement.
4.5.4 The Green Revolution – the future prospects:
India has reached a stage of development where we need an ‗evergreen revolution‘ i.e., producing more on less land and less water. Agro Business and Agro Processing should be the main driver of this revolution with crop diversification as one of the main strategies.
Regionally differentiated strategy: With wide variations in
agro-climatic and economic condition across the country, there cannot be a single strategy of agricultural growth to be followed everywhere.
At the macro level, the agricultural level, the development
strategy need be differentiated by broad regional characteristics of agro economic situation as follows:
North-Western High Productivity Region: the strategy will be to promote diversification of agriculture and raising of high value crops and to strengthen strong linkages with the agro-processing industry and exports besides creation of relevant infrastructure.
Eastern Region: Productivity in this region is very low despite abundant water availability and good soil. The strategy for this region and bring the yield to the levels of high productivity states like Haryana and Punjab. The major thrust will be on flood control, drainage management, improvement of irrigation facilities, especially minor irrigation, input delivery systems supported by adequate agricultural credit and extension services.
54
Arid Zones of Peninsular India including Rajasthan: The productivity in this region is low because of water scarcity. The emphasis will be on development of efficient water harvesting and conservation methods and technologies, suitable irrigation packages based on watershed approach and promotion of an appropriate farming system which economises on water use and generates higher values from land.
Ecological Fragile Regions including Himalaya and Desert Areas: The thrust will be on the development of agricultural systems which do not damage the fragile ecological balance in the region, but, on the other hand, help in conserving and strengthening the sustainability of natural resources.
To sum up, a focussed plan of action in the form of a new policy is required. Check Your Progress:
1. State the three types of systems of land tenure prevailing in India.
2. Discuss the achievements of New Agricultural Strategy in India.
_________________________________________________________________________________________________________________________________________________________________________________________________________________________________________________________________________
4.6 SUMMARY
1. At the time of independence, India‘s agriculture was in a state of
backwardness. Productivity per hectare and per worker was extremely low. The techniques employed were age-old and traditional. Due to large diversities in the agricultural sector it is not possible to generalize and formulate a single agricultural policy for the nation as a whole.
2. Indian agriculture in the pre-Independence period can be correctly described as a subsistence occupation. Some farmers started adopting agriculture on a commercial basis only after Independence and more specifically when planning era and Green Revolution started.
3. Development of agriculture is a virtual precondition of sectoral diversification and development itself.
4. A comparison of productivity levels in Indian agriculture with the levels in other countries shows the low level of productivity in Indian agriculture.
55
5. The need for direct intervention in the form of land reforms was required in India because of the exploitative nature of the land tenure system prevailing during the pre Independence period.
6. In India the land reforms programme has remained one of the major policies for rural development ever since the inception of the planning process.
7. The New Agricultural Strategy was introduced around the Third Plan and Fourth Plan (1961 to 1969). It has been called by various names: modern agricultural technology, seed-fertiliser-water technology, or simply green revolution.
8. The new agricultural technology is not free from weaknesses. It has made the farmer market-oriented. The farmers are largely dependent on the market for the supply of inputs and for the demand for their output.
9. India has reached a stage of development where we need an ‗evergreen revolution‘. Agro Business and Agro Processing should be the main driver of this revolution with crop diversification as one of the main strategies.
4.7 QUESTIONS
1. Indian agriculture is backward and traditional in nature –
Explain.
2. Explain the importance of agriculture in Indian economy.
3. What are the causes of low productivity in Indian agriculture?
4. Discuss the importance of Land Reforms in Indian agriculture.
5. Explain the achievements and weaknesses of the New Agricultural Strategy.
6. Examine the future prospects of Green Revolution in India.
56
5 RURAL CREDIT
UNIT STRUCTURE
5.0 Objectives
5.1 Introduction of Rural credit in India
5.2 Sources of rural credit in India
5.3 NABARD and Rural Development
5.4 Recent developments in the field of Rural Finance
5.5 Agricultural marketing in India
5.6 Agricultural Price Policy in India
5.7 Food Security in India
5.8 Summary
5.9 Questions
5.0 OBJECTIVES
1. To understand the need and purpose of rural credit
2. To study the Institutional and non-Institutional sources of Rural credit
3. To study the role of NABARD in rural development
4. To study the present system, defects of agricultural marketing and Government measures to improve the system of agricultural marketing in India
5. To study the working provisions and defects of Agricultural Price Policy and to understand the reorientation measures for effectiveness of the APP
6. To study the meaning and definition, objectives of Food Security Policy in India, and critical evaluation of Public Distribution System.
57
5.1 INTRODUCTION OF RURAL CREDIT IN INDIA
Credit needs of the Indian farmers can be classified into
three types depending upon the period and the purpose for which they are required:
(a) Farmers need funds for short periods of less than 15 months
for the purpose of cultivation or for meeting domestic expenses. For e.g., they want to buy seeds, fertilisers, fodder for cattle, etc. They may require funds to support their families in those years when the crops have not been good or adequate for the purpose.
(b) The farmers require finances for medium period ranging between 15 months and 5 years for the purpose of making some improvement on land, buying cattle, agricultural implements, etc. These loans are larger than short-term loans.
(c) The farmers need finances for the purpose of buying additional land, to make payment improvements on land, to pay off old debt and to purchase costly agricultural machinery. These loans are for long periods of more than 5 years.
5.2 SOURCES OF RURAL CREDIT
There are two sources of credit available to farmers –
institutional and private. Institutional credit refers to loans provided to farmers by co-operative societies and co-operative banks, and commercial banks including regional rural banks (RRBs). Private or Non institutional sources include money-lenders, traders and commission agents, relatives and landlords. Non institutional sources accounted for 93 percent of the total credit requirements in 1951-52 and institutional sources including the government accounted for only 7 percent of the total credit needs in that year. 5.2.1 Non-institutional sources: A) Money Lenders: are of two types:
Landlords or rich farmers who combine farming with money lending and professional money lenders.
The cultivators depend upon the money-lenders for their
requirements of cash. The moneylenders freely supplies credit for productive and non-productive purposes. They provide credit for short term as well as long term requirements of the farmers. The moneylenders are easily accessible and maintains a close and personal contact with the borrower, often having relation with family extending over generations. His methods of business are simple
58
and elastic. He has local knowledge and experience and therefore can lend against promissory notes. He knows how to protect himself against default, through legal and illegal methods.
B) Landlords and others:
Traders and commission agents supply funds to farmers for productive purposes much before the crop mature. They force the farmers to sell their produce at low prices and they charge a heavy commission for their dealings. Farmers often borrow from their own relatives in cash or in kind for their temporary requirements. They carry low or no interest and they are returned soon after the harvest. Farmers, particularly small farmers and tenants, depend upon landlords and others to meet their financial requirements for they charged exorbitant interest rates. 5.2.2 Institutional sources:
The need for institutional credit arises because of the weakness or inadequacy of private agencies and their exploitative nature of credit. The basic motive of Institutional credit is to help the farmer to raise his productivity and maximise his income. The rate of interest is not only relatively low but can be different for different groups of farmers and for different purposes. 1. Rural Co-operative Credit Societies:
The rural co-operative movement was started in over 100 years back largely with a view to providing agriculturists funds for agricultural operations at low rates of interest and protect them from the clutches of moneylenders.

59
Chart
The organisation of the co-operative credit for short period is as following: a) Primary Agricultural Credit Society (PACS):
It may be started with ten or more persons, normally belonging to a village. The value of each share is generally nominal. PACS deal directly with farmer-borrowers, grant short term and medium term loans and also undertake distribution and marketing functions. The management of the society is under an elected body consisting of President, Secretary and Treasurer. Profits are not distributed as dividends to shareholders but are used for the welfare of the village.
60
The usefulness of PACS has been rising steadily. In 1950-51, they advanced loans worth Rs. 23crores, which increased to Rs. 200crores in 1960-61 and further to Rs. 34,520crores in 2000-01. This progress has been spectacular but not adequate considering the demand for finance from farmers.
The number of PACS had come down from 2,12,000 in 1960-61 to 1,61,000 in 1970-71 and 1,06,380 at the end March 2006 with estimated membership of over 10crore farmers. Most of the PACS are dependent on the finance provided by Central Cooperative Banks(CCBs). In case the CCBs are weak, the PACS are starved of finance which affects the credit functions of PACS. At the end of March 2006, the loans and advances outstanding for PACS were about Rs. 51,780crores. b) District Central Co-operative Banks (DDCBs):
These are federations of primary credit societies in specified areas normally extending to a whole district. These banks have a few private individuals as shareholders who provide both finance and management. They may accept deposits from the general public but their main task is to lend to village primary societies. By the end of March 2006, there were 369 District Central Cooperative Banks. The loans outstanding came to Rs. 79,200crores. They acts as an intermediaries between the State Co-operative Bank on the one hand and the village primary credit societies on the other. The Reserve Bank – now NABARD has formulated a scheme for the rehabilitation of weak central co-operative banks. NABARD is providing liberal assistance to the State Governments for contributing to the share capital of the weak Central Co-operative Banks selected for the purpose. c) State Co-operative Banks (StCBs):
The StCB finances and controls the working of the District Central Cooperative banks in the State. It serves as a link between NABARD from which it borrows and the cooperative central banks and village primary societies. There are 31 State Cooperative Banks (StCB) in the country. The State Cooperative Bank not only interested in helping the rural cooperative credit movement but also in promoting other co-operative ventures and in extending the principles of co-operation. During 2005-06 the 31 state cooperative banks had lent about Rs. 48,260crores to District Central Co-operative Banks. Long term Rural credit: Cooperative Agriculture and Rural Development Banks (CARDBs):
The long term requirements of the farmers were traditionally met by the money-lenders. Initially, land mortgage banks were
61
organised for the purpose of providing long term credit to farmers. These banks were later called land development banks. In recent years, they have been renamed as Cooperative Agricultural and Rural Development Banks (CARDBs). These were classified into Primary Co-operative Agricultural and Rural Development Banks (PCARDBs) and State Co-operative Agricultural and Rural Development Banks (SCARDBs). The number of PCARDBs and their branches increased from 286 in 1950-51 to 696 in 2005-06, while that of SCARDBs increased from 5 to 20 during the same period. Total loans advanced by PCARDBs during 2005-06 were Rs. 2,250 crores and the loans outstanding at the end March was Rs. 12,740 crores. On the other hand, SCARDBs had sanctioned loans worth Rs. 2,900crores in 2005-06 and the amount outstanding at the end March 2006 was Rs. 17,710crores. Finance and Loan operations of CARDBs:
CARDBs obtain their funds from share capital reserves, deposits and issue of bonds or debentures. Debentures are long term loans which are issued by SCARDBs, carrying fixed interest and for fixed periods, generally up to 20 years. They are subscribed by the LIC, the commercial banks, the State bank of India and its subsidiaries and by the Reserve Bank of India. SCARDBs also float rural debentures for periods up to 7 years which are subscribed by farmers and panchayats and by the Reserve Bank of India.
CARDBs provide credit for a variety of purposes such as redemption of old debts, improvement of land, purchase of costly agricultural equipment, construction of wells and erection of pumps, etc.
Though land development banking has made considerable progress in recent years, it has not really contributed much to the improvement of the financial position of the farmers. Following factors are responsible for its ineffectiveness:
- Overdues have caused innumerable financial problems to the capacity of banks to lend.
- Enough attention was not paid to build up the manpower capable of shouldering the increasing volume of business.
- Landless labourers, village artisans and marginal farmers who could take up certain productive activities are not able to secure credit from the CARDBs mainly because they do not possess land or adequate security to offer against loans.
Commercial Banks and rural Credit:
After nationalisation was introduced in 1969, a rapid expansion in bank branches in rural areas was started. By July
62
1969, all commercial banks had over 1,860 branches in rural and semi-urban areas which have increased to over 30,585 by June 2006.
Direct and Indirect finances by Commercial Banks:
In the initial period of nationalisation, the banks concentrated their attention on large cultivators and other special category farmers such as those engaged in raising high-yielding varieties of food grains. At present short term crop loans account for nearly 42 to 45 percent of the total loans disbursed by the commercial banks to farmers. Term loans for varying periods for purchasing pump sets, tractors and other agricultural machinery, for construction of wells and tube-wells, for development of land for the purchase of fruit and garden crops, or levelling and development of land for the purchase of plough animal, etc. are provided. These term loans accounted for 35 to 37 percent of the total loans disbursed by the commercial banks. Commercial banks extended loans for activities like dairying, poultry farming, piggery, bee keeping, fisheries and others which accounted for 15 to 16 percent.
Commercial banks are financing co-operative societies to enable them to expand their production credit to the farmers. Commercial banks are providing indirect finance for the distribution of fertilisers and other inputs. They also extend their credit to manufacturing or distribution firms and agencies and co-operatives engaged in the supply of pump sets and other agricultural machinery on a hire purchase basis. They finance operations of the Food Corporation of India, the State Government and others in the procurement, storage and distribution of food grains. Finally commercial banks subscribe to the debentures of the central land development banks and also extend advances to the latter. Problems of Commercial banks in agricultural credit:
There are 5, 50,000 villages spread throughout the country. To reach all of them with only about 47,000 banking offices is a difficult task. In recent years, the rural branches of the commercial banks have been under severe financial difficulty on account of high transaction cost on small loan accounts, low interest rates etc. Lead Bank Scheme (LBS):
Towards the close of 1969, the Reserve Bank of India adopted the ―area approach‖ to nationalised banks and finalised a ―lead Bank scheme‖ for all the 380 districts in the country. Under the scheme, all the nationalised banks and a few private sector banks were allotted specific districts and were asked to play the ―lead role‖. The basic aim of the Lead Bank Scheme is that in a district for coordinating credit deployment in a district. Under the
63
scheme, the Lead Banks act as lenders to bring about a coordination of co-operative banks and other financial institutions in their respective districts to bring about rapid economic development. They make a quick survey of their lead districts, identify unbanked centres and prepare a phased programme for branch expansion in the district. On the basis of the surveys, the Lead Banks estimate the deposit potential and the credit gap and take steps to tap the deposit potential and fill the credit gap. It will result into deposit mobilisation and also in the expansion of finance to agriculture and small industries. Regional Rural Banks (RRBs):
In pursuance of the aspect of the New Economic Programme that the Government of India set up Regional Rural Banks. The main objective of the RRBs is to provide credit and other facilities particularly to the small and marginal farmers, agricultural labourers, artisans and small entrepreneurs so as to develop agriculture, trade, commerce, industry and other productive activities in rural areas. Initially, five RRBs were set up on October 2, 1975 in Uttar Pradesh, Haryana, Rajasthan and west Bengal. Each RRB had an authorised capital of Rs. 1crore, and issued and paid up capital of 25lakhs. The share capital was subscribed by the Central Government (50%), the State Government concerned (15%) and the sponsoring commercial bank (35%). RRBs and NABARD:
National Bank has the responsibility to lay down policies for RRBs, to oversee their operations, provide refinance facilities and attend to problems faced by them.
The Narasimham Committee on the Financial System (1991) evaluated the working of RRBs. In the opinion of the Committee, the problem was one of improving the viability of RRBs without sacrificing the basic objectives for which they were originally set up. The Agricultural Credit Review Committee under the chairmanship of Dr. A. M. Khusro observed that the weaknesses of RRBs were endemic and non-viability was built into their structure. The RRBs had accumulated huge losses and in a few cases, the losses had eroded even a part of their deposits. Therefore, the Reserve Bank of India appointed the M. C. Bhandari Committee to suggest measures for restructuring RRBs. Accordingly, the issued share capital of RRBs has been enhanced from Rs. 75lakh to Rs. 1crore. To implement its 2004 policy , the Government entrusted the task of restructuring the RRBs to RBI and NABARD. After consultation with all concerned parties, state Governments and commercial banks, the Government of India amalgamated 147 RRBs into 46 new RRBs in September 2005. These new banks are sponsored by
64
19 banks in 17 states. The total number of RRBs has now declined from 196 to 95.
5.3 NATIONAL BANK FOR AGRICULTURAL AND RURAL DEVELOPMENT (NABARD)
A National Bank for Agricultural and Rural Development
(NABARD) or the National Bank was set up in July 1982 by an Act of Parliament to take over the functions of the Agricultural Refinance Development Corporation (ARDC) and the refinancing functions of RBI in relation to co-operative banks and RRBs. NABARD is linked originally with the RBI by the latter contributing half of its share capital and the other half being contributed by the Government of India and nominating three of its Central Board Directors on the board of NABARD, besides a Deputy Governor of RBI being appointed as Chairman of NABARD. 5.3.1 Resources of NABARD:
The authorised share capital of NABARD was Rs. 500crores and its paid-up capital was Rs. 100crores, contributed equally by the Central Government and the Reserve Bank. The resources of the National Agricultural funds were transferred to NABARD. World Bank and IDA have also been providing funds to NABARD for implementation of the projects financed by them. The most important source of NABARD‘s funds is RIDF deposits, closely followed by market borrowings. 5.3.2 Functions of NABARD:
NABARD has a dual role to play (a) as an apex institution and (b) as a refinance institution. NABARD has inherited its apex role from RBI i.e. it is performing all the functions formerly performed by RBI with regard to agricultural credit. At the same time, NABARD has taken over the functions of ARDC and thus provides refinance facilities to all banks and financial institutions lending to agriculture and rural development.
i) NABARD services as a refinancing institution for all kinds of
production and investment credit to agriculture, small scale industries, cottage and village industries, handicrafts and rural crafts and real artisans and other allied economic activities with a view to promoting integrated rural development
ii) It provides short term, medium term and long term credit to State Co-operative Banks (SCBs), RRBs, LDBs and other financial institutions approved by RBI
65
iii) NABARD gives long term loans (up to 20 years) to State Governments to enable them to subscribe to the share capital of co-operative credit societies
iv) NABARD gives long term loans to any institution approved by the Central Government or contribute to the share capital or invests in securities of any institution concerned with agriculture and rural development
v) NABARD has the responsibility of co-ordinating the activities of Central and State Governments, the Planning Commission and other all India and state level institutions entrusted with the development of small scale industries, village and cottage industries, rural crafts, industries in the tiny and decentralised sectors, etc.
vi) It has the responsibility to inspect RRBs and co-operative banks, other than primary co-operative societies
vii) It maintains a Research and Development Fund to promote research in agriculture and rural development, to formulate and design projects and programmes to suit the requirements of different areas and to cover special activities.
5.3.3 Working of NABARD:
NABARD is performing the various functions assumed by it smoothly and efficiently. It sanctioned short term credit limits worth Rs. 8,820crores during 2003-04 and Rs. 16,100crores during 2006-07 for financing seasonal agricultural operations at the concessional rate of 3 percent below the Bank rate. NABARD has attempted to ensure the flow of credit to weaker sections of society under the new 20-point programme by making it obligatory for banks to disburse a specified percentage of short term loans to small and marginal farmers and other economically weaker sections.
NABARD provides two types of refinance. The first is extended to RRBs, Apex Rural Credit Institutions, viz., State Co-operative Banks and state Governments. The second type of refinance is extended to provide resources for ground level deployment of rural credit.
Purpose-wise, minor irrigation has continued to occupy an important place in scheme lending of NABARD i.e. about 13 percent of the schemes sanctioned in recent years consisted of minor irrigation works.
NABARD has vigorously continued its efforts in promoting investments in the agricultural sector in the less developed / under
66
–banked states – U.P., Bihar, M.P., Rajasthan and Orissa have been the biggest beneficiaries.
5.3.4 NABARD and Rural Infrastructure Development Fund (RIDF):
The RIDF was created to extend loans to State Governments to enable them to complete the implementation of the existing rural infrastructural projects which were held up for want of funds. Infrastructure projects refer to irrigation, rural roads, rural bridges, watershed development, flood protection, market yard/godown, cold storage, fisheries, forest development, inland water ways, etc.
The Union Budget for 1995-96 proposed the creation of rural Infrastructure Development Fund (RIDF) in NABARD with a corpus of Rs. 2,000crores. This corpus was contributed by all the Indian scheduled commercial banks to make up for their short fall in agricultural lending target of 18 percent of net bank credit. With every successive budget, the Indian Government continued RIDF, designating as RIDF-I, RIDF-II and so on.
NABARD was able to mobilise deposits from all banks under RIDF to the tune of Rs. 35,720crores between 1996 and 2007. This was in addition to Rs. 60,000crores contributed by the Government.
The scope of the projects eligible for RIDF loans has also
been enlarged to include innovative projects such as mini-hydel under power sector, rain water harvesting, construction of primary schools, primary health centres, etc. The total number of projects financed through RIDF was over 2, 44,000 in 2006-07.
CHECK YOUR PROGRESS:
1. State the non-institutional sources of agricultural credit.
2. Sate the institutional sources of agricultural credit.
3. Explain the functions of NABARD.
5.4 RECENT DEVELOPMENTS IN THE FIELD OF RURAL FINANCE
a) Micro Finance:
Micro credit or micro finance is a novel approach to ―banking with poor‖ where bank credit is extended to the poor through Self
67
Help Groups (SHGs), Non-Governmental Organizations (NGOs), credit unions, etc. It attempts to combine lower transaction costs and high degree of repayments. The SHG-bank linkage programme, introduced and encouraged by NABARD, is now being implemented vigorously by more than 30,000 branches of commercial banks, RRBs and cooperative banks in over 520 districts in 30 states and Union Territories. At the end of March 2007, as many as 2.9 million SHGs are linked with banks and 7,000 NGOs are associated with the scheme. b) Kisan Credit Cards:
KCCs were introduced in 1998-99. The purpose of the KCC scheme is to facilitate short term credit to farmers. Its implementation has been taken up by 27 commercial banks, 187 RRBs and 334 Central Cooperative Banks. Since its inception till the end of March 2007, nearly 67 million KCCs have been issued and total loans sanctioned amounted to Rs. 97,710crores. KCC is also providing personal accident insurance cover of Rs. 5,000 for death and Rs. 25,000 for disability.
5.5 AGRICULTURAL MARKETING
5.5.1 System of Agricultural marketing in India: The important types of agricultural markets in India are as follows: Primary or local markets: These markets are organised by
Village Panchayats, who charge some rent from shopkeepers for the space occupied. These markets are known as ‗shandies‘, in southern states, or ‗chuna‘ in Kerala, hat, painth or bazar in northern and north eastern states, held once or twice in a week in the neighbourhood of a group of villages. More than 50 percent of the total marketed surplus is sold at these markets. The village bania acts as a middleman in these markets.
Secondary markets: Business in these markets is transacted regularly throughout the year. The markets provide facilities of storage, handling and banking services, and are well served by roads and railways. These are also known as ‗wholesale‘ or ‗assembling‘ markets and are called mandis or gungs. A number of middlemen operate in these markets.
Terminal markets: These markets perform the function of carrying goods to consumers, final buyers or to places of processing. Such markets are located in big cities or at ports.
Fairs: held at religious occasions at pilgrim centres are important sources of marketing of agricultural produce in India. Such fairs are held annually and are organised by district
68
officers, local bodies or private agencies. They are very popular in states like Bihar, Orissa, U.P., Maharashtra, W. Bengal and Rajasthan.
Regulated markets: These have been set up by the Government for the purpose of checking fraudulent practices which are generally practised by traders in the primary and secondary markets. Government rules and regulations govern the market practices.
Cooperative marketing: These markets function on the basis on the basis of principles of cooperation. A cooperative marketing society can carry the agricultural produce direct to the consumers, thus dispensing with a large army of middlemen and intermediaries.
State Trading: in agricultural produce has become an important element of agricultural marketing in India. State agencies, like the Food Corporation of India, set up their exclusive centres in and around villages and mandis at harvest time to procure produce from peasants at Government-fixed prices.
5.5.2 Defects of agricultural marketing: a. In the agricultural marketing in India there are a large number of
middlemen indulging in widespread malpractices.
b. Lack of proper warehousing facilities in the villages, therefore the farmer was compelled to store his products in pits, mud-vessels, kutcha storehouses etc. These unscientific methods of storing led to considerable wastage.
c. There was not any provision for grading, thus there was no incentive to use better seeds and produce better varieties.
d. Transportation facilities were also highly inadequate and only a small number of villages were joined by railways and pucca roads to mandis. The produce was carried on slow moving transport vehicles like bullock-carts which could not be used to carry produce to far-flung places and the farmer force to sell his produce in nearby market at low prices.
e. Farmers are illiterate and they are not aware about the prices of their produce in different markets, so there is no option for them but to accept the price offered to them by the middlemen.
f. Indian farmer is poor and lack staying power, so he tried to sell his produce immediately after harvest at less prices.
g. There was a total lack of institutional sources of credit and the farmers were almost totally dependent on the moneylenders whose sole objective is to exploit the farmers by forcing them to

69
sell produce to them at low prices than the market prices in turn for the loans granted to them.
5.5.3 Government measures to improve agricultural marketing system in India:
An efficient agricultural market may lead to increase in efficiency of farmers and provide an incentive to produce more. Following measures have been adopted by Government to overcome the defects of agricultural marketing. 1. Establishment of Regulated markets:
Regulated markets are places where transactions are governed by various rules and regulations. The market committees consist of representatives of growers, traders and the government, who look after functioning of these markets. These committees are responsible for the enforcement of fair grading practices, licensing of market functionaries, stopping the deduction of unauthorised market charges, introduction of the open auction system of sales and enforcement of standard weights and to secure impartial arbitration in case of disputes. The markets provide yards, godowns, sheds, etc. Reliable and up-to-date market news are made available to the farmers. There are 7,161 regulated markets in the country.
2. Private terminal markets:
Private parties are being permitted to set up terminal markets for agricultural produce. These markets are being set up by corporate, other private enterprises and cooperatives. The facilities provided at the markets include electronic auction, cold chain and logistics support from the primary collection centres located at convenient places. 3. Provision for Storage and Warehousing facilities:
Improved storage performs the function of regulating supply in relation to demand, stabilisation of prices and maintenance of buffer stocks. A warehouse is a godown where goods are stored on the journey from places of manufacture or consumption. Storage and warehousing facilities for agricultural crops on commercial basis are available both in the public and private sectors. The main institutional agencies providing these facilities are the Central and State Warehousing Corporations, the Food Corporation of India and the Cooperatives. 4. Corporate marketing:
Corporates are more capable of undertaking risks and can face financial losses than small and medium farmers. The
70
corporate buy the produce on contract basis from farmers, and pay them the prevailing market prices. The farmers can sell their produce elsewhere if they get a better price. The corporate are paying detailed attention to several aspects of retail chain right from seed distribution, fertiliser application, improving irrigation technologies, facilitating credit, processing and setting up cold storage, transporting and finally selling the produce. 5. Standard weights and Grading:
The Standard weights and Measures Act was brought into force in 1958. Under the Act, only Government weights and measures can be used for transactions. Grading of agricultural produce is done under the provisions of the Agricultural Produce (Grading and Marketing) Act, 1937, for which purpose the insignia AGMARK is used. This insignia is the hallmark of quality. Grading standards have been laid down for 150 agricultural and allied commodities. Compulsory grading before export is carried out in respect of 41 commodities.
6. Market information:
Relating to agricultural products collected by public agencies and co-operatives is made available to farmers. For dissemination of information all sorts of media, like display boards, radio, television, weekly, monthly and yearly publications, conferences, etc. are used. This information service is a part of the infrastructure that is needed for a healthy functioning of the market. Further, during 2005-06, a scheme for Marketing Research and Information Network, AGMARKNET, was implemented to provide electronic connectivity to important wholesale markets in the country for collection and dissemination of price and market related information. 7. Transport arrangements:
In an integrated road development programme, rural roads have been assigned a higher priority so as to bring lakhs of our villages into the national mainstream. As at the beginning of the Tenth Plan, 61,947 villages out of a total of 67,915 villages with a population of 1,500 and above had been connected by all-weather roads. Similarly, 40,551 villages out of a total of 57,859 villages with a population between 1,000 and 1,500 had been so connected. 8. State Trading in Food-grains:
It has been introduced mainly with the object of providing food-grains to the deficit States. However, it has also been adopted as a measure to support the farmers in securing reasonable prices. It is carried out partly by the Food Departments and partly by the FCI.
71
9. Market Intervention Scheme (MIS):
In order to protect the growers of the horticultural / Agricultural commodities which are perishable in nature, from making distress sales in the event of bumper crop during peak arrival period when prices fall to very low level, Government implements MIS for a particular commodity on the request of a State Government concerned. Losses suffered are shared on 50:50 basis between Central and the State. The NAFED has been appointed as a Central Nodal Agency which operates the scheme through the State designated agencies i.e., State Marketing Federations. 10. Marketing Inspection, Research and Training:
The government has paid attention to the requirements of adequate arrangements for market inspection, research and training. Occasional surveys of markets can help in identifying problems and finding solutions for them. The directorate of Marketing and inspection undertakes inspection and research of major agricultural products. 11. Cooperative marketing:
It requires that individual farmers organise themselves into a cooperative society; they pool their produce together, and market it collectively. The sales proceeds are distributed among the individual members in proportion to their share in the produce marketed.
Cooperative marketing as a separate institution came to be developed during the second plan. The National Cooperative Department and Warehousing Board was set up in 1956. It was expected to plan and promote programmes for the production, processing, marketing, storage, warehousing and import of agricultural produce through cooperative societies with financial assistance from the Government of India. This board was subsequently replaced by National Cooperative Development Corporation (NCDC) which was set up in March, 1963. a. Boost to Export of Agricultural Products:
Under Government support, export of agricultural products has shown an increasing trend in recent years. It has increased from Rs. 7,880crores in 1992-93 to Rs. 34,000crores in 2003-04. India‘s agricultural exports include pulses, rice, wheat, tobacco, sugar, cashew nuts, seasame seeds poultry and dairy products, spices, groundnut, oilmeals, castor oil, fruits and vegetables, meat and meat preparations, marine products, etc. The share of agricultural exports in India‘s exports ranges around 12 to 15 percent.
72
Foreign Trade Policy (2004-09) of the Government of India has emphasized the importance of agricultural exports and has initiated a new scheme – Special Agricultural Produce Scheme – for promoting the export of fruits, vegetables, flowers, minor forest produce. The Government is earmarking funds to assist states for development of Agro Export Zones (AEZ). b. Future Trading:
As Part of economic reforms, the Government permitted the resumption of futures trading in potato, castor seed, pepper, turmeric etc. During 1997-98 the Government extended futures trading in coffee, cotton, castor oils and jute goods. In the 1998-99 budget, the Government announced futures trading in oilseeds, oilcakes and edible oils. The Government allowed international futures trading in pepper and castor oil.
In 2003-04, the Government of India initiated major steps
towards introduction of future trading in all commodities by setting up the National Level Commodity Exchanges. The major agricultural commodities traded at these exchanges are wheat, cotton, soya oil, jute, rubber, pepper, turmeric, etc. There is also a judicious mix of protection against both price and quality risks. The National Commodity and Derivative Exchange, Mumbai has launched pilot projects in the states of Gujarat, M.P., and A.P. to help farmers understand the concepts and benefits of hedging the price risk on trading platform of an Exchange prior to harvesting. CHECK YOUR PROGRESS:
1. What are the different types of agricultural markets in India?
2. Write a note on Co-operative marketing in India.
5.6 AGRICULTURAL PRICE POLICY IN INDIA
Agricultural Price Policy in India has moved through two
distinct phases during the last five decades. In 1965, the Agricultural Price Commission (since then designated as the Commission on Agricultural Costs and Prices CACP) was set up.
1. Organisation of food zones: To introduce an element of
stability in agricultural prices, food zones were organised in March 1964. The country was divided into eight wheat zones. Rice zones were formed in South India. On the failure of this experiment, each State was made a separate zone. Movement
73
of food-grains within a zone was free but restrictions were imposed on movements from one zone to the other. The Government took upon itself the task of procuring food-grains from the surplus States and distributing them to the deficit-States through the public distribution system.
2. Fixation of minimum support prices and procurement
prices by the government: The agricultural Prices Commission was, accordingly, set up in January 1965. It was renamed Commission for Agricultural Costs and Prices (CACP) in 1985. Ever since its inception, the Commission has been announcing minimum support prices, procurement prices and issue prices for a number of agricultural commodities. Minimum support prices are in nature of a long term guarantee to the producers. Procurement prices are fixed at a higher level as compared to the minimum support prices and are meant essentially for the purchase of quantities needed by the government for maintaining the public distribution system and for building up buffer stocks. Issue prices indicate the prices at which the government supplies food-grains through fair price shops and ration depots.
3. Rationing and sale through fair price shops: The public
distribution system in our country operates through a network of ration shops and fair price shops. Fair price shops are intended to meet the minimum needs of the vulnerable sections of society. However, these shops are at present meeting the requirements of all. For their extra need of food-grains, the consumers can turn to the free market. The total number of fair price shops has increased from 2.39lakh in March 1979 to about 4.75lakh.
4. Other steps: The government initiated a number of other steps
to ensure favourable returns to the farmers and reasonable prices to the consumers. These included building up of buffer stocks, State trading, nationalisation of wholesale trade in wheat and rice, procurement from wholesalers, import of food-grains, etc.
5.6.1 Shortcomings: 1. Inadequate coverage: The facility of official procurement
reaches only a handful of farmers. It covers hardly 15% of the total food-grains production. It has only benefited those farmers who have surpluses and had a negative impact on small farmers in underdeveloped regions.
2. Rising burden of subsidies: The remunerative price and/or
subsidised inputs have failed to keep pace with the rate of
74
increase in costs. It has had two consequences. Firstly, the farmer is discouraged from producing the maximum level of output and secondly, the government is taking upon itself a huge burden of subsidies.
3. Transmitted wrong signals: The current prices of inputs and
outputs in India send a wrong signal to the farmers that conserving social and water resources are inefficient and depleting them is efficient.
4. Ineffective Public Distribution: A large section of the poor
people is outside the purview of the Public distribution System. Therefore the system has failed to serve the objective. It has just increased the burden on the national exchequer.
5. Large price spend: There is an important issue of wide
difference between prices received by the producers and prices paid by the consumers. In this context, issues relating to the network of regulations and costs associated with it, incidence of octroi, increase in transportation costs, over fragmentation of the distribution network, etc. are some of the issues that need a careful and detailed study.
6. Neglect of linkages: Agricultural Price Policy measures take
into account only the relationship between agricultural inputs and the product prices. The relationship between agricultural raw materials and the finished products is not adequately examined. Agricultural Price Policy ignored the backward and forward linkages of agricultural crops. It caused a serious limitation in achieving the objectives of equity and productivity and may jeopardise other economic objectives like promotion of exports. Lack of integrated approach is a serious weakness of the APP as practised in India.
5.6.2 Suggestions for Reorientation of Agricultural Price Policy:
Following suggestions can be made in regard to reorientation of the APP.
1. Minimum Support Prices: Two economic criteria should
govern the operations based on MSP. a) MSP should only cover the cost of production of an efficient producer; b) Farmers should make profits by responding to market signals and c) MSP should help the farmers in making the necessary adjustments and not in obviating their need.
2. Procurement Price: Procurement prices are fixed at a higher level as compared to the MSP and are meant for the purchase
75
of quantities needed by the government for maintaining the public distribution system and for building up buffer stocks. A lower procurement price would serve the purpose of procurement well enough.
3. Maximum price: The primary responsibility of the government in relation to the fixing of maximum level for the price of a commodity is (a) to keep in check the inflationary forces bringing about increases in the overall price level, (b) elimination of collusive and manipulative practices leading to artificial scarcity and high prices for particular commodities.
4. Reforms of the Institutions: Two important institutions are directly connected with the management of the food economy viz., the CACP and the FCI. The CACP should retain its expert character rather than trying to be representative of various interests. The FCI should be decentralised and debureaucratised and the states should be made major stakeholders.
Above all, it should be recognised that price policy measures can, at best, be supplementary to other policy measures and institutional interventions.
5.7 FOOD SECURITY IN INDIA
Meaning and definition of food security: World Development Report (1986) defined food security as ―access by all people at all times to enough food for an active, healthy life.‖
Food and Agriculture Organisation (FAQ) defined food security as ―ensuring that all people at all times have both physical and economic access to basic food they need.‖ Food Policy in India:
5.7.1 Objectives:
a) To avoid localised and widespread famine and open under-nutrition;
b) To maintain remunerative prices to farmers, encourage them to use modern inputs and technology;
c) To stabilise prices due to market distortions;
d) To provide price support when there is a rapid fall in food-grain prices;
e) To attempt through administrative means to keep down prices when there is a strong upward pressure;
76
f) To supply vulnerable classes with food-grains at below market prices;
g) To procure food-grains for public distribution at below market prices;
h) To build and maintain a buffer stock of food-grains to facilitate government operations;
i) To use the agricultural price policy to resist general inflationary forces in the economy.
Instruments of Food Policy:
The various instruments of food policy in India can be explained under three sections, A) Production and Supply of food-grains, B) Consumption of food-grains, C) Distribution of food-grains.
A) Production and Supply of food-grains: The basic objective of agricultural planning in India has been to achieve self reliance in production of food-grains. 1. Production:
Production of food-grains in particular, and agricultural production in general, has been sought to be raised through the adoption of a package of measures which can be grouped under three heads, viz., technological improvements, institutional and infrastructural reforms, and support services. Technological improvements and institutional reforms have aimed at providing infrastructure that proves conducive to the goal of a rapid increase in agricultural production. Minimum support prices guarantees the producers that the prices will not be allowed to fall below the minimum economic levels. Since 1977-78, the support prices have been raised from year to year.
2. Supply:
Domestic production of food-grains has always been sought to be supplemented by imports, whenever warranted by the domestic situation. The primary objective of imports as of the food policy in general has been to help sustain the public distribution system and to protect the interests of the weaker sections of society.
B) Consumption of food-grains: There are two aspects of consumption of food-grains in India:
- There is increasing number of mouths to be fed.
77
- the consumption pattern of people have been loaded in favour of cereals, specially wheat and rice.
1. Population Policy:
The aim of the Government policy in this regard has been to give the facilities and incentives to people to check the size of their families. The family welfare planning programme which forms a part of the nation‘s population policy has striven hard to bring down the fertility rate.
2. Nutrition policy:
The National nutrition Policy, formulated in 1993, recognises the significance of short term measures such as nutrition interventions for special vulnerable groups, fortification of food items, control of micro-nutrient and protein-energy deficiencies through inter-sectoral programmes such as universalisation of supplementary feeding for pre-school children and expectant and nursing mothers through Integrated Child Development Scheme, basic minimum services including mid-day meals for school going children, child survival and safe motherhood programme to extend nutrition and universal immunisation. To achieve these, the National Plan of Action was initiate in 1995.
C) Distribution of food-grains: 1. Public Distribution System (PDS):
The basic objective of the public distribution system in India is to provide essential consumer goods at cheap and subsidised prices to the consumers. To run this system, the government resorts to levy purchases of a part of the marketable surplus with traders / millers and producers at procurement prices. The grain thus procured, is used for distribution to the consumers through a network of ration / fair price shops and / or building up buffer stocks. PDS has been also used in India for the distribution of edible oils, sugar, coal, kerosene and cloth. The most important items covered under PDS in India have been rice, wheat, sugar and kerosene. Together these four items have accounted for 86 percent of the total PDS sales. PDS distributes commodities worth more than Rs.30,000 crore annually to about 160 million families and is perhaps the largest distribution network of its kind in the world.
The main agency providing food-grains to the PDS is the Food Corporation of India (FCI) set up in 1965. The primary duty of the Corporation is to undertake the purchase, storage, movement, transport, distribution and sale of food-grains and other foodstuffs. It ensures on the one hand that the farmers get remunerative prices
78
for their produce, and on the other hand, the consumers get food-grains from the central pool at uniform prices fixed by the government of India. 2. Buffer stocks:
This is the stock which would enable the Government to maintain the supply line even in a year of crop failure. The primary objectives of buffer stocks are price stabilisation and achievement of stability of farm incomes. These objectives determine the optimum size of buffer stocks that the Government should hold. The holdings of food-grains involve costs in the form of interest lost, go-down rentals and wastage in storage. These costs have been estimated to have gone up from Rs.77.55 per quintal in 1991-92 to Rs.390.0 per quintal in 2005-06 and are estimated to be rising at the rate of 15 percent per annum.
3. Procurement:
Buffer stock operations can be successfully maintained only if these are supported by a proper procurement of food-grains by the government. The following systems of procurement have been adopted in India in recent years:
- A monopoly purchase in which the whole of the marketable surplus is to be sold to the State only;
- A graded levy on producers on his total land holdings and with a certain weightage for irrigated land;
- A levy on millers / dealers;
- Purchase through licensed wholesale dealers including millers;
- Support purchase in open market. 5.7.2 Critical Evaluation of PDS:
1. Limited Benefit to poor from PDS:
The rural as well as urban poor have not benefited much from the PDS as their dependence on the open market has been much higher than on the PDS for most of the commodities. A large number of poor who are homeless and without proper residential proof are left out of the food security system as they did not possesses ration cards.
2. Regional disparities in PDS benefits:
There are considerable regional disparities in the distribution of PDS system. In 1995, the four Southern States of Andhra
79
Pradesh, Karnataka, Kerala and Tamil Nadu accounted for almost one-half of total PDS off-take of food-grains in the country while their share in all India population below the poverty line in 1993-94 was just 18.4 percent. As against this, the four Northern states of Bihar, M.P., Rajasthan and U.P. having as much as 47.6 percent of the all India population below poverty line in 1993-94 accounted for just 10.4 percent of all India off-take of food-grains from PDS in 1995. 3. The question of urban bias:
It has been observed that the off-take in the urban areas was about 85 percent of the total off-take from the PDS. There was indeed an urban bias in PDS in the 1960s and 1970s as its coverage was confined to major cities and a few states. However, with the expansion of PDS in rural areas in later period, this bias has been corrected. 4. The burden of food subsidy:
PDS is highly subsidised in India and this put a severe fiscal burden on the government. Subsidy on PDS arises from the difference between the issue price and the economic cost of FCI. From Rs. 662crore in 1980-81, food subsidy increased to Rs.2,850 crore in 1991-92 and further to Rs.25,800crore in 2004-05. 5. Inefficiencies in the operations of FCI:
The economic cost of FCI food-grains operations has been rising on account of increase in procurement prices and other costs which include procurement incidentals, distribution cost and carrying cost. The inefficiencies in the operations of FCI are due to its highly centralised and bureaucratic mode of operation. 6. PDS results in price increases:
It has been criticised that PDS have resulted in all round price increase. This is due to the reason that large procurement of food-grains every year by the government actually reduces the net quantities available in the open market. Taking advantage of this the traders indulged in speculation raising the food-grains prices in the open market. 5.7.3 Reorganisation of Food Security System and Safety Net for poor:
To overcome the shortcomings and weaknesses in the PDS, following suggestions have been made:
80
1. Targeted Public Distribution System (TPDS):
The key features of TPDS as adopted by the Government of India are as follows: A) Targeting:
This policy introduced the targeting by dividing the entire population into below poverty line (BPL) and above poverty line (APL) categories, based on poverty line defined by the Planning Commission. From January 2006, the monthly entitlement of food-grains for BPL families was reduced to 35 to 30 kg per household per month. For APL families their entitlement was reduced from 35 to 20 kg per household per month. B) Dual prices:
The PDS now has dual central issue prices: prices for BPL consumers and prices for APL consumers. A third price, introduced in 2001, is for the beneficiaries of the Antyodaya Scheme. It was announced in the Budget 2000 that central issue prices i.e. prices at which the Food Corporation of India sells grains for the PDS to State governments will be set at 50% of ‗economic cost‘ of FCI for BPL families and 100% of the ‗economic cost‘ for APL families.
C) Centre-State control:
PDS is designed and managed by State governments, and State governments differ with respect to entitlements, the commodities offered, retail price and so on. With the TPDS now, the size of the BPL population and the entitlement for the BPL population are decided by the central government.
2. Linking of PDS with Public works Programmes:
The main objective of PDS is to work as a ‗Safety net‘ for the poor by providing adequate quantities of food-grains at affordable prices. Rural works Programmes (RWPs) like employment Guarantee Scheme (EGS) in operation in Maharashtra, Jawahar Rojgar Yojana (JRY), Employment Assurance Scheme (EAS) and Sampoorna Grameen Rozgar Yojana (SGRY) which provide employment to the poor sections are also powerful safety nets for the poor.
3. Adoption of a Food Stamps / Food Credit Cards Programme:
Tenth Five Year Plan, 2002-07, strongly advocates the adoption of a food stamps / food credit cards programme. In this context it calls for removing all restrictions on inter-State movement
81
of food-grains once for all; strengthening the system of private trade and marketing of food-grains; and discontinuing the practice of having fair price shops throughout the length and breadth of the country and providing food subsidy through normal food supply shops. The plan calls for introduction of food stamps or the food credit card system. It advocates the adoption of the food stamps programme in phases.
Under the system of food stamps, the State governments
could issue a subsidy entitlement card (SEC) instead of issuing ration cards. The SEC will indicate the total number of food stamps a family is entitled to every month.
4. Decentralisation of the Food security System:
Critics of PDS advocate decentralisation of this system. The basic level organisation in the proposed system would be panchayats and other local level participatory organisations. They would serve as an apparatus for reaching food to the poor. They would identify the poor, monitor their conditions and implement programmes to meet their employment and food needs. The Second tier in the food security system would be located at the State‘s development planning and policies. It would implement the price policy formulated at the national level and hold operational stocks of food-grains in dispersed locations to ensure intra-year stability of prices and to reach food-grains to areas where normal trade channels are weak or inoperative. 5. National Food Security Mission, 2007:
On May 29, 2007, the government announced the launch of a scheme to double the growth rate in agriculture to 4 percent over the 11th Plan period. The Centre would provide Rs.25,000crore for new farm initiatives launched by States. It also announced a time bound Food Security Mission to counter rising prices of food products by enhancing production of wheat, rice, pulses and edible oil to ensure visible changes in their availability over three years. 6. Blueprint for Development of Agriculture Sector:
For Centre: (i) Food Security Mission to be launched for wheat, rice and pulses over four years. (ii) Additional 8 million tonnes of wheat, 10 million tonnes of rice and 2 million tonnes pulses to be produced over base year (i.e.2006-07). (iii) New Additional Central assistance scheme with Rs. 25,000crore funding over 4 years. (iv) hike in AIBP funding. (v)restructuring of RIDF funding pattern to strengthen rural infrastructure / boost research. (vi) Direct Fertiliser Subsidy to farmers.
82
For States: (i) District-based plans for optimum resource use. (ii) AIBP Projects to be completed on priority in consonance with farm production targets. (iii) Highest Priority to seed production. (iv) Major KVK expansion planned.
5.8 SUMMARY
1. The credit needs of the Indian farmers can be classified as
short term credit for the period up to 15 months, medium term credit for the period between 15 months to 5 years and long term credit for the period exceeding 5 years.
2. There are two sources of credit available to farmers – institutional and private. Institutional credit refers to loans provided to farmers by co-operative societies and co-operative banks, and commercial banks including regional rural banks (RRBs).
3. Private or Non institutional sources include money-lenders, traders and commission agents, relatives and landlords.
4. A National Bank for Agricultural and Rural Development (NABARD) or the National Bank was set up in July 1982 by an Act of Parliament to take over the functions of the Agricultural Refinance Development Corporation (ARDC) and the refinancing functions of RBI in relation to co-operative banks and RRBs.
5. There are various types of agricultural marketing in India such as primary markets, secondary markets, terminals, fairs, regulated markets, co-operative markets, state trading corporations etc.
6. Government adopted several measures to correct the defects of agricultural marketing in India.
7. The agricultural Prices Commission was, accordingly, set up in January 1965. It was renamed Commission for Agricultural Costs and Prices (CACP) in 1985.
8. The CACP performs functions such as organisation of food zones, fixation of minimum support prices and procurement prices, rationing and sale through fair price shops etc.
9. Food and Agriculture Organisation (FAQ) defined food security as ―ensuring that all people at all times have both physical and economic access to basic food they need.‖
10. The various instruments of food policy in India can be explained under three sections, A) Production and Supply of food-grains, B) Consumption of food-grains, C) Distribution of food-grains.
83
11. The basic objective of the Public Distribution System (PDS) in India is to provide essential consumer goods at cheap and subsidised prices to the consumers.
12. To overcome the shortcomings and weaknesses in the PDS, Targeted Public Distribution System (TPDS) have been suggested.
5.9 QUESTIONS
1. Explain the need and purpose of rural credit.
2. What are the sources of rural credit in Indian agriculture?
3. Write a note on NABARD.
4. Discuss the different types of Agricultural markets in India.
5. What are the defects of agricultural markets in India?
6. Explain the measures adopted by the Government to correct the defects of agricultural markets.
7. Explain the Agricultural Price Policy in detail.
8. Examine the Food Policy in India.
9. Write a note on Public Distribution System in India.
84
6 MODULE 3
INDUSTRY
UNIT STRUCTURE
6.0 Objectives
6.1 Introduction
6.2 Trends in Industrial Growth
6.3 Major Issues in Industrial Sector
6.4 Industrial Policy Resolution 1948 & 1956
6.5 New Industrial Policy 1991
6.6 Evaluation of New Industrial Policy 1991
6.7 Summary
6.8 Questions
6.0 OBJECTIVES
After reading this unit, you will come to know:
• Trends in Industrial growth in pre and past reform period.
• Major issues in India‘s Industrial Sector,
• Industrial Policy Resolution of 1948 & 1956
• New Industrial Policy 1991.
6.1 INTRODUTION
At the time of independence, India was industrially an
underdeveloped economy. The poor industrial sector was
dominated by consumer goods industries. The important industries
were, by and large agro-based, like cotton textile, jute, sugar,
paper, salt, and soap & leather goods.
85
The capital goods industries hardly made their presence felt.
One of the important reasons for weak industrial sector was the
negligence during the British period. The British considered India
as a source of supply of raw material and market for British
manufacturers.
6.2 TRENDS IN INDUSTRIAL GROWTH
6.2.1 Growth in Pre-Reform Period (1947-1990):
In the post independence period, India embarked upon
economic development under the Five Year Plans. It was
accepted, that rapid development of the nation would only be
possible through the establishment of a strong and diversified
industrial base. The major changes in the industrial growth &
structure during the planning period (pre-period) can be analyzed
by dividing the planning period into three phases.
(i) Phase I (1951-65): Building up of Strong Industrial Structure:
The First Plan did not envisage any large-scale programmes
of industrialization. Only Rs.55 crore out of the total expenditure of
Rs. 1,9602 Crore (2.8 per cent) was spent on ‗Industry & Minerals‘
in the First Plan.
The Second Plan (1956-1961) accorded top priority to
programmes of industrialization as would be clear from the fact that
the expenditure on industry and minerals was liked to Rs 938 crore
under this plan which was 20.1 per cent of the total expenditure of
Rs.4,627 crore. Based on Mahalnobis Model, the Second Plan set
out the task of establishing basic and capital goods industries on a
large scale so that a strong base for industrial development in the
future could be built. Three steel Plants of one million tonnes
capacity each were set up in the public sector at Bhillai, Rourkela &
Durgapur besides the expansions and modernization programmes
undertaken in the private sector.
The Third Plan (1961-1966) also pressed forward with the
establishment of basic capital and producer goods industries – with
86
special emphasis on machine buildings programmes – so that the
growth of the economy in the subsequent plans could become self
sustaining Expenditure on industry in the Third Plan was Rs.1, 726
crore which was 20.1 per cent of the total expenditure of Rs.8577
crore under the plan.
On an average growth rate of Industrial output during this
phase was about 7% per annum.
(ii) Phase II (1965-1980) : Industrial Deceleration:
This phase was marked by industrial deceleration and
structural retrogression. The industrial growth rate declined to less
than an annual average of 5%. The slow growth was attributed to
inadequate investment in infrastructure sectors such as power
transportation, etc. Slow growth in agricultural sector caused a
decline in demand from this sector to industrial products.
Restrictive policy through licensing policy, MRTP & FERA Acts had
an adverse effect on private investment. Besides, the 1965 & 1971
wars, oil shock (oil price rise) in 1973, drought in 1965-66 had their
effect on the growth rate.
(iii) Phase III (1980-1991): Industrial Recovery:
The period of 1980s can be broadly termed as a period of
industrial recovery. The rate of industrial growth was 6.4% per
annum during 1981-85, 8.5% per annum during the Seventh plan
(1985-90) and 8.3% per annum in 1990-91. This growth was
impressive. As noted by Vijay Kelkar and Rajiv Kumar, ―this is a
marked upturn from growth rates of around 4% achieved during the
latter half of sixties and the seventies. This performance is also an
improvement upon the growth rates achieved during the First and
Second Plan periods.‖
Increase in investment, especially in the public sector, that
too in infrastructure, helped the industrial sector to get into a
recovery phase. Measures like increase in license capacity
scheme, fiscal incentives extension of broad banding, liberalization
of import of foreign technology and many more liberal measures
resulted into more investment and increased demand.
6.2.2 Growth in Post Reform Period (1991 Onwards):
87
The year 1991 ushered in a new era of economic
liberalization. The Government of India announced the New
Industrial Policy in 1991. A number of liberalization measures such
as scrapping of the licensing system, dilution of the role of public
sector, encouraging private investment in various fields, allowing
foreign direct investment (FDI) liberally in various sectors etc. led to
marked acceleration registered by the capital goods sector.
The average annual growth rate of industrial production was
5.7% annum during 1990-2000. The industrial growth rate was
only 2.3% in 1992-93. It rose to 6.0% in 1993-94. The rate of
growth shot up to as much as 13.0% in 1995-96 but fell to 6% in the
next year 1996-97. Some of the causes of unsatisfactory industrial
performance are: (a) exposure to external competition (b) the
infrastructural constraint (c) sluggish growth in export (d) slow down
in investment especially to agriculture etc.
After 2002-03, the industrial sector was on the path of the
revival. The growth rate of industrial production was 5.7% in 2002-
03, and picked up considerably to 7.0% in 2003-04, 804% in 2004-
05, 8.2% in 2005-06 & to as high as 1.5% in 2006-07. For the 8th
plan as a whole it comes out to 8.2% per annum. This revival in the
industrial growth rate can be attributed to; (a) growth of
infrastructure industries (b) building up of heavy & capital goods
industries (c) rapid growth of consumer durables (d) heavy foreign
direct investment & portfolio investment etc.
However with the onset of global financial crisis (2008-09
onwards) the industrial growth in India has also fallen and this trend
may continue for sometimes.
6.3 MAJOR ISSUE IN INDUSTRIAL SECTOR
Industrial sector along with its growth & progress gave rise to
many problems. The nature and degree of the issues of this sector
have changed to a certain extent during the reform period. The
major issues or problems are as follow.
1. Infrastructural Constraint:
Industrial development is impossible unless sufficiently
supported by infrastructure. Infrastructure includes transportation,
88
communication, power supply and wide network of developed
financial institutions. Growth of infrastructure not only improves the
supply side constraints in industrial production but also stimulates
additional demand required for additional growth. Unfortunately
despite of massive progress, bottlenecks in infrastructure still exists
& are posing challenges to increase industrial growth rate &
maintain the achieved growth rate.
2. Industrial Productivity:
Industrial productivity is measured in terms of labour, capital
and total factor productivity (TFP). According to the various studies
conducted, the TFP in India is low & was declining during the
reform period. Judged from any standard, industrial productivity in
India is much lower than other industrial countries. Qualitatively
poor material inputs and the poor work culture of Indian labour
force are responsible factors for the TFP in Indian industries.
3. Employment:
Under the reforms, as a part of rationalization, industries
were allowed to adopt Voluntary Retirement Scheme (VRS). Many
public and private sector undertakings have offered this scheme to
their employees. The public sector which had provided employment
opportunities to a large number of people is no more a source of
employment. No doubt the scheme has helped the overstaffed unit
to reduce the avoidable burden.
Following table explains growth of employment in the organized
sector.
Table 6.1: Rate of Growth of Employment in the Organized
Sector
(% per annum)
Sectors 1983-1994 1994-2005
Public Sector 1.53 -0.70
Private Sector 0.44 0.58
Total Organized 1.20 -0.31
The situation is alarming since unemployment has become a
serious problem in India. The Eleventh Five Year Plan however
has projected an increase in employment by 58 million as against
89
an increase in labour force by 45 million. This is expected to
reduce the unemployment rate below 5%. This seems to be a
dream since the global economy is contracting & Indian economy is
experiencing the heat of the slowdown as well.
4. Burden of Public Sector: Since 1956:
Government of India and also the State Governments have
made a massive investment in the public sector undertaking. The
Central Government through its public sector enterprises provided
the industrial base, and the required impetus for the
industrialization of the economy.
Unfortunately over a period of time the public sector
enterprises acquired many of the negative elements such as
corruption, nepotism, favoritism, red tapism, poor work culture,
political interference and so on. As a result a majority of them have
been running into huge loss. It is hoped the reforms under
liberalization would eliminate the negative aspects and make the
public sector undertakings function efficiently. As on March 31,
2007, there were 244 Central Public Sector Enterprises (CPSEs)
with the cumulative investment of Rs. 4,21,089 crore. During 2007,
156 CPSEs declared profits and 59 enterprises incurred loss.
5. Industrial Sickness:
It is defined as ― an industrial company which has at the
end of any financial year accumulated losses equal to or exceeding
its not worth and has also suffered cash losses in that financial year
and in the financial year immediately preceeding it.‖
Industrial sickness is the result of internal and external
factors. Internal factors are: (a) poor quality of top management,
(b)excessive centralization, (c) poor financial control, (d) project
appraisal deficiencies, (e) project management deficiencies, (f)
poor industrial relations, (g) diversion of funds, (h) excessive
overheads and (i) inaccurate estimation of cost & market demand.
External factors include (a) economic downturns (recession),
(b) competition, (c) Operating with excess capacity, (d) changes in
monetary and fiscal policy, (e) availability of finance at reasonable
cost, (f) availability of inputs including skilled labour (g)
infrastructural constraints, etc.
90
In order to rehabilitate the sick units, the Government
brought out many measures including establishment of Board of
Industrial & Financial Reconstructions (BIFR). The BIFR has so far
received 7,158 references under the Sick Industrial Companies Act
(SICA), of these, 5471 were registered, 1857 references were
dismissed, 825 were provided rehabilitation & 1337 companies
were recommended to be wound up.
6. Regional Imbalances:
Despite of Sixty years of Independence, the industrial
development is confined to only a few states like Maharashtra,
Gujarat and Tamilnadu. Some other states like Punjab, Karnataka,
Kerala, and Andhra Pradesh are making good progress. Yet the
disparities between the states or regions continue and in some
cases are even widened. This has led to continuation of migration
and overcrowding in the industrially advanced cities.
7. New Challenges:
India now is part and parcel of the New World order of
globalization through liberalization. As such its industries are open
to more competition at home as well as abroad. Till recently Indian
industries were functioning under protectionist policy of the
Government. Industries could avoid competition from foreign
Industries and at home enjoy almost a monopoly.
Under WTO, India has brought down its peak tariff rate to 10
percent. Now tough competition is faced by our industries not only
from the industries of developed countries but even from
developing counties especially from China. Indian industries are
required to accept the challenge and provide cost effective quality
product. At the same time there is also a risk of industries acquiring
monopoly power through merger & amalgamation. It is, therefore,
essential that the Regulatory Authorities should protect the interest
of consumers by preventing the industries from indulging in any
unfair practices.
6.4 INDUSTRIAL POLICY RESOLUTIONS
91
The Industrial policy of a country determines its industrial
investment, production, structure & growth pattern.
6.4.1. Industrial Policy Resolution 1948 (IPR-1948):
The IPR-1948 provided for the setting up of a mixed
economy. It had outlined the respective rate of the public and the
private sectors. The IPR-1948 divided industries into four broad
categories.
(a) The first category was considered to be the Exclusive monopoly of the Central Government. It covered the manufacturing of arms & ammunitions, the production and control of atomic energy and the ownership & management of rail transport.
(b) The second category was the mixed sector. It included six industries viz. coal, mineral oils, iron & steel, manufacture of aircraft, ship building, and manufacturing of telephone, telegraph & wireless apparatus (excluding radio in this category). The state was to have an exclusive right to set up new undertakings in this category. All the existing private sector enterprises in this category were permitted to develop for a period of ten years, after which the government would review the situation and take further decisions regarding acquiring any of the undertaking by paying compensation on a ―fair and equitable basis‖.
(c) The third category covered industries of basic importance and the central government would regulate them if found necessary to do so. The government did not take responsibility of developing such industries. The third category covered 18 industries such as salt, automobiles, heavy chemicals, fertilizers, power, cotton & woolen textile, cement, sugar, paper, newsprint, minerals etc.
(d) The fourth category included remaining industries, was left
open to private enterprise, industrial as well as co-operative.
6.4.2 Other major aspects of IPR-1948 were:
(a) Cottage and Small Scale Industries were given importance as
they were best suited for village enterprises, utilization of local
resources and employment generation.
(b) The need for foreign capital and enterprise was recognized in
the industrial development of the economy for technological
92
advancement but at the same time retaining the native control.
The IPR-1948 made it clear by saying ―as a rule, the major
interest in ownership, and effective control should always be in
Indian Land‖
(c) For the purpose of labour welfare, the IPR-1948, insisted on
better working conditions, payment of wages and labor
participation in management.
6.4.3 Industrial Policy Resolution 1956 (IPR-1956):
The 1948 policy remained in vogue for full eight years and
determined the nature and pattern of industrial development in the
county. Significant development took place in the country during the
First Five Year Plan (1951-56). Industries (Development and
Regulations) Act, was passed in 1951 and gave the government
the necessary experience and expertise in regulating and
controlling industries in the private sector. The government
accepted ―The socialist pattern of society‖ as the objectives of socio
economic policy. Because of these developments, a new
declaration of industrial policy seemed essential. This come in the
form of Industrial Policy Resolution of 1956.
The main objectives of IPR-1956 were:
(a) To accelerate the rate of economic growth and to speed up
industrialization.
(b) To expand the public sector to develop strategically important
industries.
(c) To increase employment opportunities.
(d) To prevent monopolies & concentration of economic power.
(e) To reduce inequalities of income.
(f) To encourage private sector.
(g) To expand the cottage, village & small scale industries.
(h) To attain balanced industrial development.
In the 1956-IPR, industries were classified into following three
categories:
93
Schedule A:
The first category included industries of ‗basic‘ and ‗strategic‘
importance. There were 17 such industries. These industries can
be grouped into following five classes : (1) defense industries, (ii)
heavy industries, (iii) minerals, (iv) transport & communication, and
(v) power of these four industries-arms & communication, atomic
energy, railways & air transport were to be the government
monopolies. In the remaining 13 industries, all new units were to
be established by the state. However, existing units in the private
sector were allowed to subsist & expand. The State could also
elicit the co operation of private sector in establishing new units in
these industries ‗when the national interest so required.‘
Schedule B:
The second group of 12 industries was listed in Schedule
‗B‘. There were: all other minerals (except minor minerals), road
transport, sea transport, machine tools, ferro-alloys and tool steels,
basic and intermediate products required by chemical industries
such as manufacture of drugs, dyestuffs & plastics, antibiotics &
other essential drugs, fertilizers, synthetic rubber, chemical pulp,
carbonization of coal, and aluminum and other non-ferrous metals
not included in the first category. In these industries, state would
increasingly establish new units and increase its participation but
would not deny the private sector opportunities to set up units or
expand existing units.
Schedule C:
It included all the remaining industries and their future
development was left to the initiative and enterprise of the private.
Government could also star any industry in which it was interested.
However, the main role of the State in the category was to provide
facilities to the private sector to develop itself.
6.4.3.1 Other important features of IPR-1956 were:
(i) The State would provide fair and non-discriminatory treatment
to the private sector by providing infrastructural facilities.
94
(ii) Village and Small Scale Industries would be encouraged
through various concessions and subsidies to improve their
competitive strength.
(iii) Balanced Regional development was focused to spread the
benefits of industrialization all over the country.
(iv) Labour welfare was given importance (improvement in working
conditions and standard of living of workers.)
6.5 NEW INDUSTRIAL POLICY 1991
With the introduction of Industrial Policy Resolution 1956, the
public sector became dominant sector and driver of economic
growth. However in the course of time it was realized that
excessive controls & restrictions have led to red-tapism, corruption
and inefficiency in the public sector. During 1980s the government
slowly started liberalizing the industrial policy along with its foreign
trade policy. Liberalization took further steps under the Congress
Government headed by Rajiv Gandhi.
In 1991, when Congress government came to power the
country was in an economic crisis particularly the balance of
payment situation was precarious. In a changing world economic
scenario the Government realized the need for liberalization to
overcome the damage done by the so called ―License-Permit Raj‖
system. Accordingly, the New Industrial Policy was announced on
July 24, 1991 as a part of the economic reform programmes. It was
a radical departure from the earlier industrial policies. It
substantially deregulated the industrial sector. It aimed at removing
the distortions of the past and increasing the gains already made,
improving productivity and gainful employment and also increasing
the competitiveness of Indian Industries.
The policy was announced in two parts. The first one was
concerned with medium and large industries; the second one was
concerned with development of Small Scale Industries (SSI). While
the earlier industrial policies emphasized the role of the public
sector, the new industrial policy assigned a priority role to the
private sector. It also envisaged the use of market mechanism to
achieve the various objectives.
6.5.1 Objectives of New Industrial Policy, 1991:
95
(a) Full utilization of indigenous capabilities of entrepreneurs and
thereby employment generation.
(b) Improvement in efficiency & productivity.
(c) Self-reliance.
(d) Greater investment in Research & Development and bring
new technology to attain international standards.
(e) Removing existing government regulations and restrictions on
industry.
(f) Encouraging competition.
(g) Development of backward areas and the small-scale sector.
(h) Improving efficiency of the public sector.
(i) Open the economy to the global market.
6.5.2 Highlights New Industrial Policy (NIP) 1991:
In order to achieve the above mentioned objectives,
government took a series of initiatives in the following areas:
1. Abolition of Industrial Licensing:
The licensing policy was introduced by the Government
through the Industrial (Development and Regulation) Act 1951, with
the objective of regulating the industrial sector and bringing about
proper economic development. In reality however, it had resulted
in delays in decision-making, corruption, red-tapism, efficiency etc.
The NIP, 1991 abolished all industrial licensing, irrespective
of the level of investment, except for 18 industries related to
security & strategic concerns, social reasons, over riding
environment reasons, hazardous chemical items of elitist
consumption. Delicensed industries do not need government
approval any more, but entrepreneurs are required to submit an
Industrial Entrepreneur Memorandum (IFM) to the Secretariat of
Industrial Approval.
96
The 18 industries for which licensing was kept necessary
were as under coal and lignite; petroleum ( other than rude) and its
distillation products; distillation, and brewing of alcoholic drinks;
sugar; animal fats and oils; cigars and cigarettes; asbestos and
asbestos-based products; plywood & other wood based products;
raw hides, skins and leather; tanned or dressed fur skins; motor
cars; paper & newsprint; electronic aerospace & defense
equipments; industrial explosives; hazardous chemicals; drugs and
pharmaceuticals; entertainment electronics; and white goods
(domestic refrigerators, washing machines, air conditioners, etc).
With the passage of time, most of these industries have also
been delicensed. Now, only five industries require licensing. These
are alcohol, cigarettes, hazardous, chemicals, electronics
aerospace and defense equipment & industrial explosives.
2. Public Sector’s Role Diluted:
The 1956 Policy Resolution had reserved 17 industries for
the public sector. The 1991 (NEP) , reduced this number to 8 (a)
arms & ammunition. (b) atomic energy, (c) coal & lignite, (d) mineral
oils, (e) mining of iron are, manganese are, chrome are, gypsum,
sulphur, gold & diamond, (f) mining of copper, lead, zinc, fin,
molybdenum and wolfram, (g) mineral specified in the schedule to
the atomic energy and (h) rail transport.
The NIP, 1991 also announced a greater degree of
autonomy to PSUs through the system of Memorandum of
Understanding (MOUs). The sick public sector units had to be
rehabilitated and reconstructed after getting the advice from the
Board for Industrial & Financial Reconstruction (BIFR). The
intention of the government to offer a part of its equity in PSUs to
the public, financial institutions, and workers etc. also announced in
this policy. A beginning in this direction was made in 1991-92 itself
by divesting part of equities of selected PSUs.
3. Abolition of MRTP Limit:
The government enacted the Monopolies and Restrictive
Trade Practices (MRTP) Bill in 1969 w.e.f. from 1970. The MRTP
firms were originally defined as enterprises or interconnected firms
that had assets of Rs. 20 crore or more or a dominant market share
(33% or more). In 1984, the dominant share was reduced to 25%
97
and in 1985, the asset limit was raised to Rs.100 crores such firms
were not allowed to expand their activities or appoint director
without the Government‘s permission. There were several
restrictions on mergers and amalgamation and takeovers in case of
such firms. All this restricted the growth, productive expansion and
efficiency of firms. Thus the NIP, 1991 scrapped the threshold limit
of assets in respect would now be on par with other firms. They
would also not require prior approved from the Government for
investments in delicensed industries. The new Act aims at
protecting the welfare of consumers by preventing and restricting
unfair trade practices.
4. Significant Role of Foreign Investment and Technology:
The NIP, 1991, widened the scope of foreign capital in
Indian Industries. This was done with the objective of improving the
balance of payments position, making advanced technology
available to domestic industries, modernizing industries and
improving their competitiveness. The policy specified a list of high
technology, high investment priorities industries wherein automatic
approval was to be given for direct foreign investment up to 51% of
foreign equity.
It consisted of industries like capital goods, entertainment
electronics, food processing etc. The foreign Investment Promotion
Board has been constituted with the primary objective of speeding
up the approval process for in India. Similarly, the use of foreign
brand name or trademark for sale of goods in India permitted.
Foreign equity upto 100% is particularly encouraged in export
oriented units (EOUs), power sector, electronics & software
technology parks. Moreover, foreign equity up to 24 % permitted in
small scale enterprises.
Foreign capital invested in India is allowed to be repatriated
with capital appreciation after payment of taxes. No permission
would be required for hiring foreign technicians and foreign testing
of indigenously developed technologies. Remittances for technical
services fees, subject to RBI approval can be made by companies.
6.6 EVALUATION OF NEW INDUSTRIAL POLICY 1991
The new industrial policy (NIP), 1991, has given a new
direction to the development of the industrial sector. Industrial
98
growth has picked up in recent years, after initial periods of
adjustment. Domestic and foreign investment in almost every
industrial sector has increased manifold. The economy is growing
at healthy rate after reforms were introduced. However, the
industrial growth has been erratic & fluctuating & has not resulted in
corresponding rise in employment.
Positive Impacts of the New Industrial Policy are:
1. Reduction in project cost & time:
The Policy changes related to licensing foreign investment
and foreign technology agreements have freed industries from
excessive government control. Thus time and money spent to
acquire licenses & approvals have been reduced resulting in low
project cost as well as less time required to complete the project.
In other words the gestation period has been shortened & efficiency
has increased.
2. Availability of foreign capital and technology:
Policies in the area of foreign investment and foreign
technology agreements would bring in more capital, technology and
managerial and technical performed from abroad. This would
increase the availability of such resources. The inflow of foreign
direct investment in 1991-92 was US $129 million which increased
to $43.29 billion in 2006. Telecommunications, electrical
equipments and services are the sectors that are attracting foreign
investment.
3. Performance of Public Sector:
Changed in the public sector policy would bring about better
allocation of public funds and improve efficiency of the public funds
and improve efficiency of the public sector. Closures, liquidation or
rehabilitation of sick public sector units will free resources for more
productive use. Greater efficiency and accountability of units in the
public sector should be ensured through implementations of
Memorandum of Understanding (MOUs). The performance of
public sector enterprises has improved considerably in recent
years. The reliance of this sector on budgetary resources declined
while their gross internal resources increased. The accumulated
99
losses of Control Public Sector Enterprises have also been
declining.
4. Restrictive Trade Practices:
Amendments in the MRTP Act would curb anti competitive
behavior and thus promote competition. Indian firms are now able
to expand and grow with greater ease after the amendment.
5. Benefits to Consumers:
The NIP and subsequently policy changes have made the
Indian market more competitive. This has benefited Indian
Consumers, who can now choose from a wide variety of good
quality products at competitive prices. Companies are now able to
change their product mixes to match changing consumer demand.
Easier capacity expansion has reduced shortages of essential
industrial items to large extent.
6. Internationalization of Indian Industries:
As Indian industries have become internationally
competitive, they are increasing their export orientation as well as
making their global presence felt through mergers and acquisitions.
7. The NIP has given greater autonomy to the Public Sector
Undertakings (PSUs):
This will lead to better performance, as there will be less
interference from the government and bureaucrats. Moreover, this
dilution of the public sector will help the government to divert its
attention to other essential sectors.
While the NIP 200 can promote growth and efficiency, it has
certain limitations also. Some of the adverse impacts of the policy
are:
1. Dominance of Multinational Firms:
According to H.K. Paranjape, certain sectors of the
economy, which have been opened to direct foreigner investments,
include areas where Indian firms have been well established for
years. Besides, these industries are in a position to develop
100
indigenous technology through R and D efforts. Inviting foreign
investment in these industries would make it possible for
transnational and multinational firms to dominate these sectors of
the Economy. The multinational firms would emerge as the most
dominant one and will destroy indigenous research and
development.
2. Unsuitable and Inferior Foreign Technology:
Use of foreign technology and managerial inputs may not be
suitable for Indian business conditions. MNCs are often reluctant to
use their state-of-the-art technology in their subsidiaries in
developing countries.
3. Unemployment:
The issue of employment generation has been overlooked
by this policy. Most of the industries encouraged by the NIP are
capital intensive, energy and import intensive. Moreover use of
foreign technology and excessive competition has increased capital
intensity in production process. This has had an adverse effect on
employment generation in the industrial sector. The MNCs have
very low absorption capacity of labour. The employment generation
capacity in the organized manufacturing sector has also reduced
since 1991.
4. Dilution of the Public Sector:
The dilution of the public sector from certain key areas like
infrastructure development has resulted in increased user charges
for many services like, power & roads, adversely affecting the poor.
Besides employment generation and job security provided by the
public sector has become a thing of the past.
5. MRTP Act:
The amendment of the MRTP Act and the relaxation of
regulations related to mergers, amalgamations and acquisitions
have resulted in emergence of large monopolies. This has
increased concentration of economic power and has adversely
affected small business.
101
6. Social Problems:
The policy has brought with social problems that are a direct
result of increasing unemployment and reduced job security. The
interests of workers who have been rendered jobless have not
been successfully dealt with by the government.
7. Industrial Sickness:
The NIP has not been able to tackle the growing industrial
sickness which continues to remain a major problem especially in
the small scale sector.
Thus the NIP has both positive as well as negative aspects.
It is a mixed bag. In the era of liberalization and globalization. India
cannot afford to have a policy of protection. While liberalization in
good to improve competition and efficiency, certain problems,
which affects labour have to be adequately dealt with.
6.7 SUMMARY
On the eve of Independence, India was industrially an
underdeveloped economy. Before 1991, the industrial sector was
dominated by public sector enterprises. The industrial sectors has
been going through rapid changes since the introduction of New
Industrial Policy, 1991. The overall business environment in the
economy has become competitive and encourages efficiently. The
private sector along with multinational firms is playing crucial role of
the Government as producers and as a regulator. This gives
government opportunities to shift its resources from basic
production units to the schemes for the up liftment of the poor &
marginalized.
6.8 QUESTIONS
1. Describe the growth pattern of the Industrial Sector in the
Planning Period.
2. Bring out the major issues in Industrial Sector of India.
3. Discuss the main features of Industrial Policy Resolutions
1948 and 1956.
102
4. Bring out the objectives and highlights of New Industrial Policy
1991.
5. Critically evaluate the New Industrial Policy 1991.
103
7
SMALL SCALE INDUSTRIES
UNIT STRUCTURE
7.0 Objectives
7.1 Introduction
7.2 Meaning and Classification
7.3 Role and Performance of Small Scale Industries
7.4 Problems of Small Scale Industries
7.5 Government Policies and Measures
7.6 Summary
7.7 Questions
7.0 OBJECTIVES
After reading this unit, you will come to know
• Meaning and Classification of Small Scale Industries, Cottage
Industries and tiny industries
• Significance of Small Scale Industries in India‘s economic
development
• Problems of Small Scale Industries and measures taken by government to solve them.
7.1 INTRODUCTION
The small scale industries played a very significant role in
the socio-economic development of India. Planners recognized the
importance of this sector soon after independence and accordingly
the sector was given a strategic position in the country‘s industrial
104
policy. The sector has contributed significantly to the economic
growth in terms of Gross Domestic Product, employment
generation and exports. Such industrial units are easy to start and
manage, as they require very little capital investment in comparison
with large industries.
7.2 MEANING AND CLASSIFICATION
In order to frame policies for the sector, the government
needs to indentify small units and address their problems. For the
purpose government had defined small scale enterprises on the
basis of following criteria.
Labour Force Criteria:
The Industrial (Development and Regulation) Act, 1951,
exempted units employing less than 50 workers, with power, and
less than 100 workers, without power, from registration. These
exempted sectors came to be referred to as the small scale sector.
Fixed Capital Investment Criteria:
In 1966 the small scale enterprise were defined as units
having investments in fixed assets not exceeding Rs.7.5 Lakh and
in case of ancillary units not exceeding Rs 10 Lakh. In the year
1975 the limit was raised to Rs 10 Lakh for small scale units and
Rs.15 Lakh for ancillary units. In April 1991 the investment limit
was further raised to Rs 60 Lakh and Rs. 75 Lakh respectively. In
addition a tiny sector was indentified and defined as units having
investment limit of less than Rs 5 Lakh.
In 1997 the investment limit of the small scale and ancillary
units was raised to Rs 3 crore and that of tiny units to Rs 25 Lakh.
In 1999, the investment limit of the small industries was brought
down to Rs 1 crore, but the limit of investment in tiny units has been
restrained as Rs 25 Lakh.
7.2.1 The Micro, Small and Medium Enterprises Act, 2006:
Under this Act, enterprises have been categorized broadly
into two categories: (A) those engaged in manufacturing and (b)
those engaged in providing rendering of services. Both categories
have been further classified into micro, small and medium
105
enterprises on the basis of their investments in plants and
machinery (for manufacturing enterprises) or in equipment (for
enterprises providing or rendering services).
A) Manufacturing Enterprises:
A micro enterprises is one in which the investment in plant &
machinery does not exceed Rs.25 Lakhs. In the small enterprise
the investment in plant and machinery is more than Rs 25 Lakh but
less than Rs.5 crore. A medium enterprise is one in which the
investment in plant and machinery is more than Rs 5 crore but does
not exceed Rs.10 Core.
Service Enterprises: Micro Enterprises:
Micro Enterprises-investment in equipment up to Rs.10
Lakhs, Small Enterprises-investment in equipment is between Rs
10 Lakhs and Rs.2 crore and Medium Enterprises investment in
equipment is more than Rs 2 crores but does not exceed Rs.5
Cores.
Classification:
Small Scale industries can be broadly classified into the
following three categories:
a. Cottage industries:
These industries provide part time /full time employment in
rural and semi-urban areas. They are characterizes by very low
degree of mechanization and are usually family based. Some units
belonging to this sector produce selective goods of high skill
workmanship like carpets, wooden and ivory carving, inlay work,
brassware etc. Other units in this category produce common
consumer goods that are less skill based like, footwear garments,
silk handloom textiles.
b. Agro-based Industries:
These industries are based on (a) processing of agricultural
produce and, b) providing inputs to agricultural sector. However,
these industries are not exclusively combined to the small scale
sector. They may be organized on a cottage scale, small scale or
even large scale. They have reasonably good export potential.
106
(B) Small and Medium Industries:
These industries can be divided into the following categories:
(a) Intermediate Group of Small Manufacturing Enterprises:
These units use more or less traditional methods of production
and produce a wide variety of goods. Technique of production
large urban based as their sources of inputs and markets are
in urban areas as they use hired labor and are usually not
family based.
(b) Modern Small Scale Manufacturing Enterprises:
These are small units using modern techniques of production.
They are generally located in large towns and cities and use
advanced technology. Machinery, equipment, components
and even raw materials used by some of these units are
imported. Their markets are either local or spread throughout
the country. Many of such units operate in the export market
as well.
(C) Small and Medium Enterprises Providing or Rendering
Services:
Besides manufacturing units, there are several small and
medium enterprises that provide or render various services
like software, business processes, financial service etc.
7.3 ROLE AND PERFORMANCE OF SMALL SCALE
INDUSTRIES
The small scale industries have played an important role in
India‘s industrial and economic development since Independence.
The role and performance of small and cottage industries in India‘s
economic development can be explained with the help of the
following points:
1. Contribution to industrial production:
The number of small scale units has increased from 109.49
Lakh units in 2002-03 to 128.44 Lakh units in 2006-07. During the
tenth plan (2002-2007), there has been continuous growth in the
production for small scale industries from 8.7% to 12.6. The
Production increased from Rs.306771 crore to Rs.471663 crore
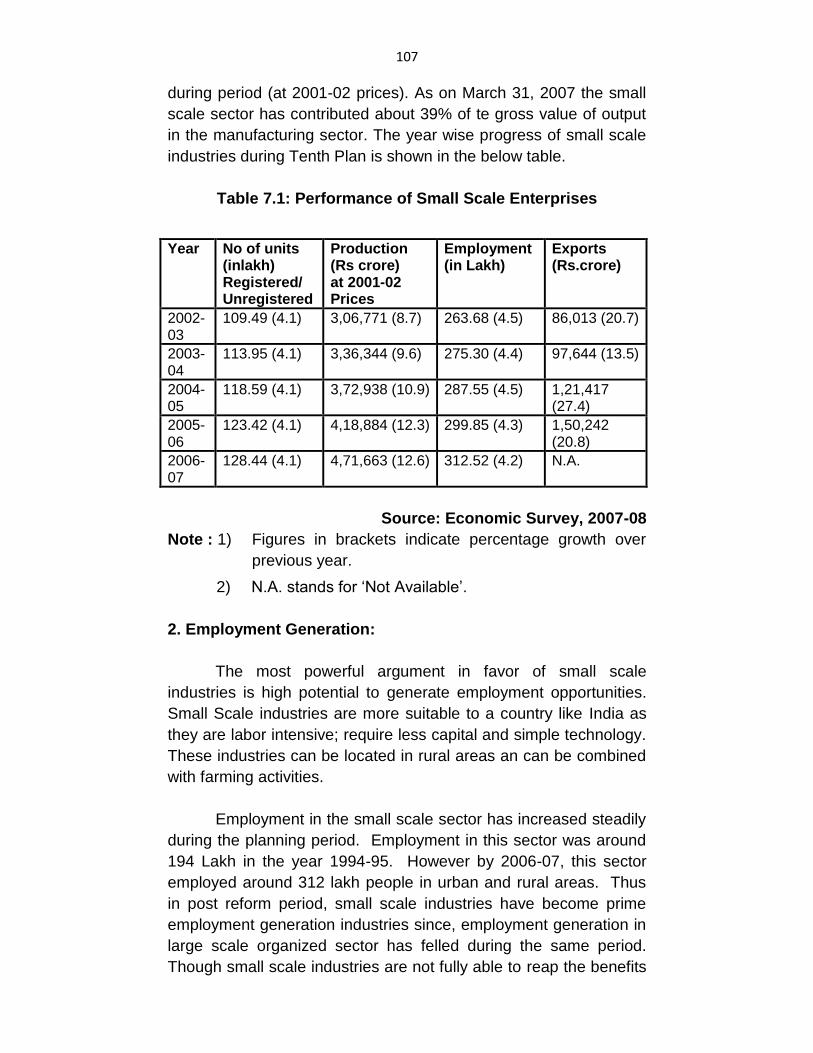
107
during period (at 2001-02 prices). As on March 31, 2007 the small
scale sector has contributed about 39% of te gross value of output
in the manufacturing sector. The year wise progress of small scale
industries during Tenth Plan is shown in the below table.
Table 7.1: Performance of Small Scale Enterprises
Year No of units (inlakh) Registered/UUnregistered
Production (Rs crore) at 2001-02 Prices
Employment (in Lakh)
Exports (Rs.crore)
2002-03
109.49 (4.1) 3,06,771 (8.7) 263.68 (4.5) 86,013 (20.7)
2003-04
113.95 (4.1) 3,36,344 (9.6) 275.30 (4.4) 97,644 (13.5)
2004-05
118.59 (4.1) 3,72,938 (10.9) 287.55 (4.5) 1,21,417 (27.4)
2005-06
123.42 (4.1) 4,18,884 (12.3) 299.85 (4.3) 1,50,242 (20.8)
2006-07
128.44 (4.1) 4,71,663 (12.6) 312.52 (4.2) N.A.
Source: Economic Survey, 2007-08
Note : 1) Figures in brackets indicate percentage growth over
previous year.
2) N.A. stands for ‗Not Available‘.
2. Employment Generation:
The most powerful argument in favor of small scale
industries is high potential to generate employment opportunities.
Small Scale industries are more suitable to a country like India as
they are labor intensive; require less capital and simple technology.
These industries can be located in rural areas an can be combined
with farming activities.
Employment in the small scale sector has increased steadily
during the planning period. Employment in this sector was around
194 Lakh in the year 1994-95. However by 2006-07, this sector
employed around 312 lakh people in urban and rural areas. Thus
in post reform period, small scale industries have become prime
employment generation industries since, employment generation in
large scale organized sector has felled during the same period.
Though small scale industries are not fully able to reap the benefits
108
of economies of scale, nevertheless these are significant avenues
of employment India.
3. Capital Formation:
Small Scale Industries help in capital formation. Since these
industries are more decentralized and spread throughout the
country, they can better mobilise untapped and unused savings
done by people living in remote areas. As these industries employ
a large section of the labour force, contribute to income generation,
saving and investments. Small scale industries require less capital
and thus help the large scale industries to have access the scare
capital and thus expand their businesses.
4. Promotion of Exports:
The small scale sector has been contributing to India‘s
export earnings through traditional and non traditional items. About
93 percent of the exports of this sector comes from no traditional
items like leather products, readymade garments, knitwear, sports
goods, processed food, chemical and allied products and
engineering goods. In 2002-03, exports from this sector was worth
Rs.86,013 corers. By 2004-05, it rose to Rs1,24,417 cores. Thus,
it helps in mobilizing the precious foreign exchange required by the
economy. The rate of growth of export earnings of this sector was
20.8 percent in 2005-06.
5. Contribution to Industrial Output and Support to Large Scale
Industries:
A large number of Small-Scale and ancillary units produce
products that directly and indirectly assist large-scale industries.
The large-scale manufacturing sector benefits from small-scale
manufacturing sector through supply of components, spare parts,
intermediates goods and support systems like processing and
maintenance.
The contribution of small scale sector to industrial output is
substantial. By 2005-06, this sector produced output to the tune of
Rs. 2,77,668 cores.
6. Equitable Distribution of Income and Wealth:
109
It is argued that large scale industries generally lead to
increased income inequalities and concentration of economic
power. On the other hand small industries ensure more equitable
distribution of national income and wealth. Ownership pattern of
these industries is more widespread thus reducing concentration of
economic power. Besides, they have higher potential to generate
employment, leading to income generation and better income
distribution.
Prof Dhar and Lydall, however have disputed this argument.
According to them, workers in small scale sector are paid much
less than the large scale sector, as they are not organized.
Nevertheless, one cannot deny the potential of this sector to
generate employment and provide income to a large numbers of
people.
7. Balanced Regional Development:
The growth pattern of large-scale industries shows
concentration in a few states like Maharashtra, West Bengal,
Tamilnadu and Gujrat. Besides, in each state they tend to get
localized in certain areas for example, in Maharashtra most of the
large scale industries are located in the Western Maharashtra i.e.
near Mumbai and Pune cities.
On the other hand small scale industries are more widely
spread throughout the country as many of them are set up to meet
the local needs and make use of locally available resources. They
can be thus effectively used to develop industrially backward areas.
For instance, widely spread small scale units in Punjab have
changed the economy of the agricultural state in the past few years.
Thus small scale industries help in removing regional imbalances.
8. Efficiency of small scale industries and Low cost of
production:
The cost of production in small-scale industries (SSI) is
said to be less when compared with large scale industries. An
important study conduct in 1999 by the Small Industries
Development Bank of India.(SIDBI) in association with National
Council of Applied Economic Research covering the period 1980-
94, reveals that the SSI investing only 7% to 15% of the total
manufacturing sectors capital contribute to nearly one fifth of the
110
total industrial output and 35 to 40% of total employment in the
industrial sector. Moreover, both labor productivity and capital
productivity in small scale sector grew at a faster rate than in the
large scale sector during 1980-1994. Since SSI sector is highly
labour intensive, it is desirable that this sector is promoted
especially for a labour supply economy like India.
9. Less Industrial disputes:
The supporter of small scale and cottage industries have
argued that as compared with large-scale industries, these
industries have less industrial disputes. While there are frequent
strikes and lock-outs in large industries, SSI do not face such
problems. Therefore, there is no loss of output in small-scale and
cottage industries.
However, this viewpoint is not totally correct. The fact is that
workers in large –scale units are organized and thus their strikes
are reported in the media. As against this, workers in SSI are not
organized and have no way of expressing their resentments. Any
worker who gives a vocal expression to his resentment is
immediately thrown out. Therefore, apparently the relations
between the employees and employees in a SSI seem to be
harmonious, while actually they are not. In case of cottage
industries, the question of disputes does not arise at all since the
main form of labour in these industries is family labour.
10. Use of Latent Resources:
Latent resources and skills can be exploited with the help of
SSIs. In the rural areas, various types of resources and
entrepreneurial skills are available establishing small-scale and
cottage industries.
Apart from the above, SSIs also confer a number of social,
economic and political benefits. They promote certain values like
co-operation self-reliance, leadership qualities etc. Such units also
promote national integration and ensure political stability.
Thus, the small-scale Industries Sector plays a pivotal role in
the Indian economy in terms of employment and growth which has
recorded a high rate of growth since independence in spite of stiff
competition from the large industrial sector.
111
7.4 PROBLEMS OF SMALL-SCALE INDUSTRIES
The small scale industries gave registered substantial
progress during the planning era. The government has supported
them in a number of ways. Despite this, all is not well with the
SSIs. The small-scale and cottage industries face a number of
problems. As a result, many small scale units turn sick and a large
number have to close down. The magnitude of sickness among the
SSIs can be analyzed from the fact that at the end of March 2006,
as many as 1,26,825 of the units were sick and an amount of Rs.
4981cr of bank credit was blocked in them. Only a small number of
these units have been identified by the banks as potentially viable.
A number of unviable SSI units are eventually closed down.
Followings are the major problems faced by the small and cottage
industries in India.
1. Inadequate finance and credit:
The scarcity of finance and credit is the main obstacle in the
developments of small scale units. The position of cottage and
village industries in this regard is even worse. The capital base of
the SSIs is usually very weak since they generally have partnership
or single ownership. The artisans or craftsmen running cottage
industries either run their business with whatever little capital they
possess or take credit from the money lenders or the traders who
supply them raw material. In many cases such credit is obtained
on a very high rate of interest and is thus exploitative in character.
The SSIs are somewhat better placed. However, the profit earned
by them is often not enough for investment purposes.
The credit need of this sector are met by institutional sources
of finance are the State Directorate of Industries, State Finance
Corporations, SIDBI, commercial and co-operative banks. The non-
institutional sources include money lenders, traders, agents,
indigenous bankers, friends & relatives. The commercial bankers
are highly reluctant to lend to this sector. Therefore many of these
units are forced to borrow from the non-institutional sources of high
rates of interest.
Interestingly, although commercial banks show that they
meet the priority, sector lending largest (including loans to SSIs) on
112
paper, their reluctance to lend to SSI units continues on account of,
what they allege (i) low recovery rates from the small firms and (ii)
higher cost of lending to the small firms.
2. Inadequate Supply of raw materials:
The supply of raw materials and intermediate products also
create problems for SSIs. These units do not get adequate supply
of raw materials at reasonable prices. Moreover, they have to
compete with big industries to get raw materials supply. The
majority of the SSIs depend on local sources for their raw material
requirements. The handloom industry depends for its requirement
of cotton on local traders. The traders often supply cotton on the
condition that the weavers would sell the cloth only to them when it
is ready. The weavers (SSI in this case) are subjected to double
exploitation at the hands of the traders. The traders sell cotton to
them at high prices and purchase the ready cloth at low prices.
Many modern small scale units now used imported raw
material. Whenever there is a difficulty in obtaining this raw material
either on account of the foreign exchange crisis or some other
reason, these industries have to suffer a severe setback.
Moreover, the SSIs get sub-standard raw material as better quality
raw material is generally sold to giant companies who demand
huge quantities.
3. Infrastructural Constraints:
Many SSIs which are productive and have potential to earn
high profits are being constrained by inadequate physical
infrastructure. The most severe constraint is power. Captive
generation at reasonable cost is out of question for small firms.
Therefore they have to depend on State Electricity boards for
meeting their requirement which do not supply regular & adequate
power. Transportation and communication infrastructures are also
universal constraints. In many SSI units (these relating to
beverages, tobacco, printing & publishing, basic chemicals, paints,
drugs & medicines) water supply is fast emerging as an important
infrastructural constraint.
4. Outdated Technology:
Only a few SSIs units use latest and advanced technology.
The rest of the units do not have access to such technology.
113
Machinery and other equipments in many SSIs have grown
obsolescent. On account of this reason while their costs of
production are high, the quality is inferior as compared to the large-
scale units. The use of low-grade technical know-how and skills
has resulted in low productivity in many industries.
5. Under Utilization of Capacity:
Many SSIs are not utilizing their capacity to the fullest extent.
Under utilization of capacity in this sector is a result of inadequate
demand and severe capital and resource constraints. This problem
has led to wastage of resources and high production cost. A
survey in 1987-88 has estimated that the capacity utilization in this
sector was only 48%. Thus SSIs become inefficient with high cost
of production.
6 Poor Marketing Facilities:
Most SSIs are unable to incur enough marketing expenses
to expand the size of their markets. They are very often forced to
restrict their sales to the local markets at low prices. The major
problems related with marketing are (i) Poor transportation &
communication services (ii) lack of standardization (iii) inadequate
market information, (iv) Stiff competition from the large scale sector,
(v) location difficulties and (vi) complicated marketing procedures
etc. The cost of promoting and selling the produce is very high and
these units do not have suitable holding capacity (warehousing)
and hence, sell their output at throw-away prices. The problem of
access to markets, both local and foreign, is major constraint facing
the small-scale entrepreneurs.
7. Problems of Sickness:
There are two main issues in respect of sick SSIs: (i)
existence of a large number of sick units which are non-viable; and
(ii) rehabilitation of potentially viable units. As on March 31, 2006
there were 1,26,824 sick SSI units which had obtained loans from
the banks to the tune of Rs 4,981 cr. Rehabilitation of sick units is a
very costly position . It involves rescheduling of past over dues with
concessions and interest amount due, additional credit for
modernization and technological up gradation and provision for
fresh working capital, Sickness in SSIs is attributed to a number of
114
factors like inefficiency in management, poor project planning,
dispute among partners and non-availability of credit.
8 Labour Problems:
Poor quality of labour also causes problems to some SSIs.
The problems are related to absenteeism, non-availability of the
right kind of labour, lack of skills and training, high wage rates in
some cases and inefficiency.
9. Export Related Problems:
The SSIs have contributed in a significant way to the
expansion and divergence of India‘s exports. In spite of several
policy measures announced by the Government to facilitate
exports, the sector continues to face problems like lack of
organized efforts to boost exports, internal levies and duties,
infrastructure problems, problems related to quality and standards,
non-tariff barriers put by importing countries, difficulties of cross-
cultural marketing and demand fluctuations in the world market.
10. Adverse effects of economic reforms and globalization:
With the onset of economic reforms in 1990s, there has
been considerable deregulation of industrial sector through
deregulation and dereservations, opening up the industrial sector to
both internal and external competition, lowering of tariffs, removal
of quantitative restrictions etc.
These ‗reforms‘ have had an adverse effect on the small-
scale sector. Cheaper and better quality imported goods are
posing a serious threat to small scale units operating in various
industries like chemicals, silk, auto components, toys, sports goods,
footwear etc. The most serious threat is being posed by cheap
Chinese imports as the so called ‗China Price‘. (Which is a rock-
bottom price) is forcing many small scale units to close down. For
example, since the imports of toys started in 1999-2000, the Indian
toy industry has been through a torrid time. More than half of the
toy manufacturers have already closed their businesses. The
share of Chinese players in the Indian toy market (which in worth
Rs 6000cr) is now as much as Rs 3,500 cr. In the case of ceramic
files industry, the overall share of tile imports from China has
increased from 39% in 2003-04 to as high as 8% in 2005-06.
115
The process of globalization has forced the small-scale units
to compete with cheap foreign imports on one hand and large
MNCs on the other. The new economic policy has also resulted in
strategic alliances between large domestic and foreign firms. The
small firms are finding it increasingly difficult to compete with these
large firms formed due to mergers and acquisitions.
11. Other Problems:
In addition to the problems stated above, the small-scale
units face a number of other problems like poor data base,
inefficient management, unchanging and unresponding production
pattern, burden of local taxes etc. The data base for the SSIs is
inadequate. There are two major sources of information on the
small-scale sector, viz. Small Industries Development Organization
(SIDO) and Central Statistical Organization (CSO). Complete
information for the small-scale sector as a whole is not available
from any of these sources. Since many new units come up every
year for different lines of production while existing units either
diversity or expand or in certain cases close down, upkeep of the
latest information is critical for policy decisions.
There has been lack of effective co-ordination among the
various support organizations set up over the period for the
promotion and development of these industries. Quality
consciousness has not been generated to the desired level despite
various measures taken in this regard. All these constraints have
resulted in a skewed cost structure placing this sector at a
disadvantage vis-à-vis the large industries, both in the domestic
and export markets.
7.5 GOVERNMENT POLICIES AND MEASURES
The small-scale have been assigned an important place by
the Government since Independence. A number of measures have
been taken to strengthen the SSIs. The policy decisions or
measures taken by Government in this regard can be broadly
classified into two parts : (i) Policy Prior to 1991 & (ii) New Small
Enterprise Policy 1991 (Post 1991)
7.5.1. Policy Prior to 1991:
116
A large number of steps were initiated by the Government of
India after Independence for the development of small scale and
cottage industries. These included the building up of organizational
structure, increase in the outlay for the development & small scale
and cottage industries, reservations for production, credit and
marketing facilities, concessions, exemptions etc.
a) Organisational Structure:
To promote growth of small-scale industries, Government
started setting up various boards and corporations since
Independence.
(i) A Cottage Industries Board was set up in 1947 itself. This was
split into the following three boards during the First Five Year
Plan – All India Handloom Board, All India Handicraft Baord
and All India Khadi and Village Industries Board. In addition,
three more boards were set up. These were the Small Scale
Industries Board, Coir Board and Central Silk Board. Thus at
the end of the First Five Year Plan, there were six boards
covering the entire field of small scale and cottage industries.
Together, they constituted the organizational structure through
which the promotional and developmental efforts of the State
were to be carried out.
(ii) National Small Industries Corporation Ltd. (NSIC) was set up
in 1955 to provide machinery to small-scale units on hire-
purchase basis and to assist these units in procuring orders
from government departments and offices.
(iii) Four Regional Small Industries Service Institutes, with a
number of branches, were set up to provide technical
assistance to the small scale industries.
(iv) Small Industries Development Organization (SIDO) was set up
in 1954. It functions as an apex body in the formulations of
policies and co-ordination of institutional activities for
sustained and organized growth of small-scale industries. It
has a large network of small industries service institutes,
branch institutes, tool rooms etc. SIDO has been renamed
Micro, small and Medium Enterprises Development
Organization.
117
(v) The programme of Industrial Estates was initiated in 1955.
The programme aimed at providing factory accommodation
and a number of facilities like power, water, transport, etc., at
one place.
(vi) The Programme of District Industrial Centre (DICs) was
introduced in May 179. The idea was to establish one agency
in each district called the DIC to provide and arrange a
package of assistance and facilities for credit guidance, raw
materials, training, marketing etc including the necessary help
to unemployed educated young entrepreneurs in general and
custom services. At present there are 422 DICs operating in
the country covering 431 districts (except Delhi, Mumbai,
Calcutta & Chennai)
b) Reservation for SSIs:
To protect small-scale units from competition from large-
scale units, government has reserved the production of a large
number of items for the small-scale sector. The list of reserved
items was expanded from 77 (first plan) to 873 items in Oct.1984 of
lately the number of reserved items has come down after economic
reforms.
C) Financial Assistance for SSIs:
Several schemes were introduced to provide financial
assistance to Small-Scale Industries. These include the Small
Industries Development Fund (SIDF) in 1986, National equity Fund
(NEF) in 1987 and the Single Window Scheme (SWS) in 1988.
Financial assistance to the small-scale sector is provided through
institutions like State Finance Corporations, National Small
industries Corporation, Commercial banks, NABARD (in rural areas
through co-operative banks and Regional Rural Banks) and Small
Industries Development Bank of India (SIDBI).
Small Industries Development Bank of India (SIDBI) was set
up in 1989 with a view to ensuring larger flow of assistance to the
small-scale units, the immediate thrust of SIDBI was on (i) initiating
steps for technological up gradation and modernization of existing
units; (ii) expanding the channels for marketing the products of
small scale sector; and (iii) promotion of employment-oriented
industries especially in semi-urban areas to create more
118
employment opportunities. The major activities of SIDBI are : (i)
refinance of loans and advances; (ii) discounting and re-discounting
of bills; (iii) extension of seed capitals soft loans; (iv)granting direct
assistance and refinancing of loans; (v) providing services like
factoring, leasing etc. and (vi) extending financial support to State
Small Industrial Development Corporations.
d) Other Measures:
A number of other measures were introduced from time to
time to promote the growth of small-scale and cottage industries.
Some of these measures were as follows:
(i) A Council for Advancement of Rural Technology (CART) was set up in Oct. 1982 to provide the necessary technical input to the rural industries.
(ii) Price and purchase preference was granted to products manufactured in the small-scale sector in government purchase programme.
(iii) Excise concessions were granted to both registered and unregistered units on a graded scale depending on turnover upto Rs.300 Lakh.
(iv) Full exemption was granted up to a turnover of Rs 30 lakh and concessional rate of excise duty was levied for a turnover exceeding Rs.30 lakh but not exceeding Rs 75 Lakh.
7.5.2 New Small Enterprise Policy, 1991 (Post Economic
Reforms):
The government announced a policy package for small, tiny
and village industries in August 1991 with the primary objective of
importing more vitality and growth impetus to this sector. Important
measures announced in this policy were as under:
(i) The investment limit for tiny units was raised from Rs.2 lakh to Rs 5 lakh. In 1997 this limit was further raised to Rs 25 lakh Moreover, the locational restrictions were done away. With this opened up the way for tiny units within the new movements limit & located in bigger towns (population of more than 50000) to become a part of the ‗tiny group‘.
(ii) The 1991 policy proposed a separate package for the promotion of tiny enterprises. While these enterprises were to be mainly entitled to one time benefits (like preference in land allocation /power connections, access to facilities for skill/technology up gradation.)
119
(iii) The third major change related to equity participation. Equity participation by other industrial units upto 24% or in SSIs was allowed. It was expected that this measure would provide a better link between the small and large industries.
(iv) A new concept of Limited or Restricted Partnership was introduced. Under this, one partner will have unlimited liability and others will have limited liability. This was considered as a positive measure as it would result in more inflow of capital especially from kith and kin of small-scale entrepreneurs.
(v) Some other features of the policy were:
(a) The policy proposed to meet the entire demand of the small and tiny units. The emphasis was shifted from ‗cheapness of credit‘ to ‗adequacy of credit‘.
(b) The scope of the National Equity Fund (NEF) scheme and Single Window Scheme (SWS) was enlarged.
(c) The policy provided for according priority to the tiny sector in the government purchase programme.
(d) Easy credit facilities have been offered by the Government to SSIs under priority lending. Procedures and conditions for obtaining credit from banks were liberalized.
(e) In 1994, Integrated Infrastructure Development Centres (IIDCs) were established for the better linkage between agriculture and industry.
(f) The Ninth Five Year Plan emphasized dereservation as it argued that dereservation would help a number of SSI units to upgrade their technology, improve quality of their products, expand their scale of operations and boost their exports. A number of rules and regulations related to finance have been liberalized by the Government. The plan also suggested the establishment of specialized branches to serve SSIs. Local areas banks to be managed by SSI associations and involving the banking finance companies in extending credit to SSIs.
Comprehensive Policy Package 2000 and Recent Policy
Measures: (2000)
A comprehensive policy package for the small-scale sector
was announced on August 30, 2000. The main highlights of this
policy are as follows:
(i) The excise duty exemption limit was increased from Rs.50 lakhs to Rs.1 crores.
120
(ii) Concessional loans were extended to certain industries for
technology up gradation.
(iii) Initiating the census of small scale industries after a gap of 12
years and it was supposed to cover the sickness of SSIs and
the causes for same.
(iv) Raising the limit of composite loans from Rs.10 lakh to Rs 25 lakh.
(v) Increasing the coverage of Integrated Infrastructure
Development (IID) scheme to progressively cover all areas in
the country with 50% reservation for rural areas and 50 per
cent of plots earmarked for tiny sector, etc.
(vi) In recent years, the government has been following policy of dereservation as it believes that this will help the SSI units to upgrade their technology and improve the quality of their products. As a result of this policy, the number of items reserved for the SSI sector came down from 836 in July 1989 to 114 in March 2007 and further to only 35 in February 2008.
Massive growth has taken place in the small-scale sector
during the period of planning. This sector now contributes over
39% to the gross turnover in the manufacturing sector 45 of
manufacturing exports and 33% of total exports. The Government
claims that a substantial part of the growth was due to its
promotional efforts.
7.6 SUMMARY
Small and cottage industries play a significant role in Indian
economy in terms of employment generation, capital formation,
export earnings and ensuring equitable distribution of income and
wealth. However, these units suffer from many drawbacks such as
inefficiency, poor utilization capacity, inadequate finance, raw
material and marketing facilities. Moreover they have competed
with large business houses both domestic as well as Multi-National
Companies. The Government of India has taken several steps to
strengthen and promote small and cottage industries in the form of
building up of organizational structure, increase in the outlay for the
development of SSIs reservations for production, credit and
marketing facilities, concessions & exemptions etc.
121
However, despite of the initiatives taken by the Government,
SSIs continue to face several problems. With the onset of new
economic policy, their problems have increased manifolds.
Nonetheless for balanced regional growth, equitable distribution of
income and wealth and optimum utilization of latent resources,
SSIs must be promoted as they have very high job potentials.
7.7 QUESTIONS
1) Bring out the significance of small-scale and cottage industries in India‘s economic development.
2) Discuss the various problems faced by small scale industries.
3) Make an account of measures undertaken by government to overcome the problem faced by SSIs.
122
8
PUBLIC SECTOR AND DISINVESTMENT
POLICY
UNIT STRUCTURE
8.0 Objectives
8.1 Introduction
8.2 Roles of public sector enterprises in India
8.3 Problem of public sector enterprises in India
8.4 Disinvestment policy objectives and need
8.5 Disinvestment process and performance
8.6 Summary
8.7 Questions
8.0 OBJECTIVES
After reading this chapter you will come to know:
Significance of public sector enterprises and the problems faced by them.
Meaning and objectives of disinvestment policy in India
Process and performance of disinvestment in India.
8.1 INTRODUCTION
123
Public sector enterprises constitute a major segment of industrial
activity in the Indian economy. They cover a wide range of activities in
basic and strategic industries like steel, coal, mineral and metals,
petroleum, heavy engineering, chemical, fertilisers etc. and they also
cover trading, transportation services, financial services, rural
development, development of small scale industries and so on. Prior to
1947, there was virtually no ―public sector‖ in the Indian economy. After
independence India adopted the mixed economy model based on co
existence of public and private sectors. The industrial policy Resolution
1956 gave public sector a strategic role in the Indian economy. The
argument in favour of expansion of public sector by Government was
accelerating growth rate of core sector of the economy to ensure easier
availability of articles of mass consumption to check prices of important
articles. However in late 80s, the process of liberalization was started and
the New Industrial Policy of 1991 saw dilution of the role of public sector.
It was argued that public sector enterprises have been inefficient and
hence privatisation and disinvestment of such enterprises was the only
solution to make them financially viable and efficient.
8.2 ROLE OF PUBLIC SECTOR IN INDIA
On the eve of independence Indian economy was absolutely
backward. The infrastructure, agriculture and industrial sector were in a
grim condition. Most of the enterprises were run by private individuals
since British period. In order to enhance growth rate, provide base for
rapid agricultural and industrial development the then policy makers
emphasised more on the role of public sector. Under socialist economic
planning State was asked to play greater role. The major objectives of
public sector in India can be concluded as:
(i) To promote rapid economic development through creation and expansion of infrastructure.
(ii) To generate financial resources for development
(iii) To promote redistribution of income and wealth.
(iv) To create employment opportunities.
(v) To promote balanced regional growth.
(vi) To encourage the development of small scale and ancillary industries, and
(vii) To promote exports on the one hand and import substitution on the other.

124
The public sector has played a very important role in the progress of
India‘s economic development. It has provided India with a large and
diversified industrial base, generated employment, developed indigenous
technology and earned foreign exchange through exports and saved
foreign exchange through import substitution. The role of public sector in
India can be elaborated with the help of the following points:
a) Share of public sector in employment:
The expansion of public sector in India has generate a fairly large
volume of employment. Public sector enterprises (PSEs) have gone a
long way in minimising the growing unemployment problem. There are
two important categories of public sector employment: (a) Government
administration and defence and other government services like health,
education, research and various activities to promote economic
development; and (b) public sector proper i.e. economic enterprises
owned by the Centre, State and local government. The total employment
in the public sector consisting of Central, State, Quasi governments and
local bodies as on March 31, 2005 was 180.1 lakh persons.
b) Public sector and capital Formation:
The role of public sector in collecting savings and investing them
during the planning era has been very important. During the planning
period, of the total investment, 50% to 60% has been allotted to the
public sector. However it has come down to 29.5% in the Ninth Plan, due
to increasing importance of the private sector. The Nationalised banks,
State Bank of India, Industrial Development Bank of India, LIC, UTI,GIC
etc have played an important role in collection, savings and mobilization
of resources. However, savings in the public sector itself are not
increasing. In fact, there has been a precipitous fall in the share of public
sector in gross domestic savings. Public Sector Saving was 19.6% during
Sixth plan which has come down to just 7.5% by Ninth plan.
c) Development of Infrastructure:
Rapid industrialisation of an undeveloped country like India
depends upon the creation of infrastructure or economic overheads such
as transportation, communication, power development, basic & key

125 industries etc. But creation of such economic overheads involves heavy
investments and long gestation period resulting into low yield. Thus these
investment were not attractive to the private sector in fifties & sixties.
Thus it was left to the government to develop them and most of the public
enterprises were set up in these industries. Thus by investing huge
money and creating infrastructure, the public sector has enabled the
economy to develop a strong infrastructure for the future economic
growth. The private sector has benefited immensely from these
investments by the public sector. Thus the contribution of public sector to
the Indian economy should therefore be judged from this angle and not
from the point of view of profit alone.
d) Strong Industrial Base:
The share of industrial sector (comprising manufacturing,
construction, electricity, gas and water supply) in GDP at factor cost has
increase slowly but steadily during the planning period from 13.6% (1950-
51) to 24.6% in (2006-07) . This shows the significance of the industrial
sector in the Indian economy. The govement has strengthened the
industrial base considerably by placing due emphasis on the setting up of
industries in the following fields iron & steel, heavy engineering, coal,
heavy electrical machinery, petroleum and natural gas, chemicals and
drugs and fertilizers etc. In highly areas such as copper, lead, coal ,
petroleum products, hydro and steam turbines the share of public sector
is 100%.
e) Public sector and export promotion:
Before Independence we were major importer of almost most of
the industrial produce. Thus along with promotion of exports, government
also aimed at substitution of imports i.e. producing importing goods
domestically and reducing imports and thus saving precious foreign
exchange. In the areas of export promotion the agencies like the Minerals
and Metals Trading Corporation and the State Trading Corporation have
contributed significantly.
Hindustan Steel Ltd, the Bharat Electronic Ltd., The Hindustan
Machine Tools etc have contributed to exports of light engineering goods.
Similarly many public sector enterprises were set up to produce import
substituted for the purpose of saving foreign exchange and achieve self
sufficiently. Bharat Heavy Electronic Ltd, Hindustan Antibiotics Ltd. The
126 Indian Drugs & Pharmaceuticals Ltd. Indian oil corporation, oil & natural
gas commission etc can be referred as a few examples.
f) Foreign Exchange Earnings:
The public sector enterprises have greatly contributed to the
export earning of our country and have helped to ease the balance of the
payment position. The foreign exchange earnings of the public sector
enterprises have been raising from Rs 35 crores in 1965-66 to Rs
20483cr in 1999-2000. The foreign exchange earnings of the Central
Public Sector Enterprises (CPSES) have increased from Rs 49954 corers
in 2005-06 to Rs 65620 cr in 2006-07, that is by 43% there is no denying
the fact that the export performance of the public sector enterprise has
been quite creditable.
g) Balanced Regional Development:
All the industrial policy resolutions emphasised on removal of
regional imbalances. In this context, the public sector has played an
important role through development of small scale and cottage industries.
Infrastructural facilities and various fiscal and monetary incentives are
given to the public sector decisions regarding location of public sector
enterprises gave due considerations to backward areas. Moreover,
decisions regarding location of public sector enterprises gave due
considerations to backward regions. Various steel plants such as Bhilai
steel plant, Rourkela Steel Plant, etc was set up by the public sector in
backward areas and they are of special importance from this point of
view.
h) Share in National Production:
Public sector has expanded into direct operation in various sectors
since Independence. The CPSEs contributed about 11.2% of GDP at
market prices in 2005-06. The CPSEs continued to be engaged in the
production and supply of a wide range of products and services. The
important ones are:
(i) Basic good like steels, cement and chemicals,
127 (ii) Capital good like pressure vessels, boilers and drilling rigs,
(iii) Intermediate goods like electricity and gas and
(iv) Large number of services like telecommunications, tourism,
warehousing, banking and so on.
i) Contribution to Exchequer:
Apart from generation of internal resources and payment of
dividend, public enterprises have been making substantial contribution to
the government exchequer through payment of corporate taxes, excise
duty, custom duty and other duties; in this way they help in mobilizing
funds for financing the needs for the planned development of the country.
The contribution helps to finance country‘s development activities. The
contribution of CPSEs to Central Exchequer has increased by 17.7% form
Rs 1,25,456cr, in 2005-2006 to Rs 1,47,635 crore in 2006-07.
j) Labour Welfare :
In terms of labour welfare, besides paying higher salaries, public
sector enterprise (PSEs) provided job security, incentives, adequate
training facilities, extensive welfare services, medical care, retirement
gratuity and other amenities PSEs have acted as a model employer. It
has been providing employment to people belonging to reserve
categories. But it should be noted that large scale employment
generation has in fact, led to a situation of excess manpower resulting in
rising public expenditure and low productivity over the years.
k) Preventing monopolies and concentration of economic power
In a capitalist economy where the public sector is practically non
existent or is of a very small size, economic power gets increasingly
concentrated in a few hands and inequalities of income and wealth
increase. During the period of planning in this country, it has been said
time and again that the expansion of public sector will help in putting a
brake on the tendency towards concentration of wealth and economic
power in the private sector. Public sector can help in reducing inequalities
in the economy in a number of ways. For instance (i) profits of the public
128 sector can be used directly by the government on the welfare
programmes of the poorer sections of community (ii) public sector can
adopt a discriminatory policy by supplying materials to small industrialists
at low prices and big industrialists at high prices (iii) public sector can give
better wages to the lower staff as compared to the private sector and can
also implement programmes of labour welfare, construction of colonies
and towerships for labourers, slum clearance etc and (iv) public sector
can orient production machinery towards the production of mass
consumption goods.
Thus, though the private sector has taken centre stage after
liberalisation existence of public sector is a must for providing
infrastructure and generating employment opportunities. In order to
remove regional imbalances public sector has to play a key role since
private sector is driven by profit motive.
8.3 PROBLEMS OF PUBLIC SECTOR ENTERPRISES
IN INDIA
The supporters of privatisation have argued that public sector is
inefficient with low productivity and creates public monopoly which
ultimately result into government bearing the burden in the form of
subsidies and thus making economy less competitive. The problems of
public sector enterprises are explained as follows:
a) Mounting Losses:
Huge investment made in the public sector have failed to generate
surplus for further expansion of the sector. Though many of the public
sector enterprises are now profit making units, their returns on investment
i.e. returns per units of capital employed are very low. This is proving to
be a drain on the government‘s budget and is partly responsible for the
huge fiscal deficit. Mounting loses of a large number of public enterprises
have been financed by drawing on limited budgetary resources; Most of
the losses incurred by PSEs are in the State Enterprises like irrigation
works State Electricity Board and oil companies.
129 b) Administrative Problems:
Administrative problems in public enterprises have been caused
due to factors like lack of autonomy to individual units, political
interference in determining the location & employment policies, lack of
accountability and defective decision making process. All these factors
have led to inefficient control over cost quality and productivity in case of
many public enterprises.
c) Problems related manpower:
Many public enterprises have become overstaffed and suffer from
poor manpower planning. In many cases employees are underemployed
i.e. their full potentials are not utilised. In very large enterprises, lack of
proper supervision has led to staff indiscipline. Other manpower related
problems are delays in appointment of staff and large scale corruption.
Many appointments at the top are not made on grounds of professional
competence of suitability but are determined by various political
considerations. Often management at the top is constituted of the
traditional administrative services of I.A.S. These non specialised, non
technical people are often unequal to the task of providing the requisite
managerial competence in the complex, capital intensive industrial
projects in the public sector. Political considerations have also contributed
to overstaffing of unskilled labour than in the private sector.
d) Under utilization of capacity:
Under utilization of capacity is another reason for the low level of
profitability in public sector enterprises. A large number of these
enterprises have operated at less than 50% of their capacity for a number
of years. In 1991, 46% of public enterprises operated with capacity
utilization of less than 75%. In 1993-94, about 22% of public enterprises
were operating with capacity utilization of less than 50%. This has
resulted in huge wastage of public resources. Besides low capacity
utilisation has increased per unit cost of production of public sector
enterprise, affecting their profits. The factors responsible for under
utilisation of capacity in public sector enterprises include inefficient
operation, poor management, labour disputes management of sick private
enterprises and political interference in day to day working etc.
130
e) Problem related to planning and Execution of projects:
Many public sector enterprises have been set up without proper
planning project appraisal and cost estimations. As per planning and
construction of projects is concerned, following problems had to be faced
(i) selection of site was not based on detailed soil investigation (ii) there
were serious commissions and understatements of several elements of
the projects; (iii) the actual costs of projects far exceed the original
estimates;(iv) the projects took much longer time to complete than
originally envisaged and (v) projects often embodied inappropriate
technology or product mix.
f) Delays in Completion of the projects:
Hardly any public sector unit is completed as per schedule. Many
projects have been delayed due to delay in acquisition of land, supply of
raw materials and capital equipment, approval procedures, law and other
disturbances and choice of wrong location. Delays in completion also
occurred due to the interlinking of projects steel plant with heavy
engineering plants or with coal mines or with railway facilities; electricity
generation with the manufacture towers and so by other public sector
units; post development with the production of cranes and other berthing
equipment by public sector enterprises.
g) Price Policy:
Generally price of public sector goods and services are
administered prices, decided under control and regulation of the
government and not guided by profit motive. Prices are based on
departmental decisions and not adhoc orders. In many cases prices are
fixed below the cost of production. Thus, the pricing structures of many
public enterprises are not rational and have been responsible for their
loss making status.
h) Red tapism and corruption:
131
Most of the public sector enterprises are directly controlled by
politicians and bureaucrats. Many times the delays to clear files are
orders are with the aim of helping someone near and dear. Unnecessary
delay and demand for bribe has resulted in red tapism and corruption
leading to high cost and poor returns by these units.
8.4 DISINVESTMENT POLICY OBJECTIVES AND
NEED
In order to restructure public sector investment and make it more
rational it was thought to be necessary to improve profitability, efficiency
and accountability of this sector. Disinvestment policy was adopted after
1991 as the process that would ensure this objective.
8.4.1 Meaning of Disinvestment Policy:
Disinvestment refers to the sale of the public sector equity to the
private sector and the public at large. Thus disinvestment leads to
privatisation. Privatisation is a process by which the government transfers
the productive activity from the public sector to the private sector. Thus
the term disinvestment is used to indicate the process of privatization.
Privatisation refers to any process that reduces involvement of the state
or the public sector in economic activities. It has been argued by the
supporters of privatisation that privatisation and therefore disinvestment
of public sector units, leads to competition and efficiency which results
into profitability. Thus the projects become viable and reduce burden of
the government. The rational, need and objectives of disinvestment and
privatisation are explained below.
8.4.2 Objectives and need for disinvestment:
According to the supporters of privatisation, the need and
rationale for privatisation and disinvestment are as follows:
(i) Improvement in efficiency and performance:
The private sector introduces the profit oriented decision making
process in the working of the enterprises leading to improved efficiency
132 and performance. Moreover, private ownership establishes a market for
managers, which improves the quality of management.
(ii) Raising Resources:
Through disinvestment of public enterprises the government
expects to raise resources to pay for the cost of closing down of
enterprises declared as ‗terminally sick‘ by the Board of Industrial and
Financial Reconstruction. These costs would primarily include expenses
relating to the Voluntary Retirement Schemes (VRS). These resources
will also be redeployed in much higher social priority areas such as basic
health, family welfare, primary education and social and economic
infrastructure.
(iii) Responsibility and Accountability:
While personnel in the public enterprise cannot be held
responsible (or accountable) for any lapse, the areas of responsibility in
the private sector are clearly defined. This makes it possible to take
people to last in the private sector units for any blunders committed by
them whereas in public sector unit it is easy to pass the buck. Even when
responsibility is defined in the public enterprises, there are too many
pressures and forces operation to reduce its effective implementation.
(iv) Privatisation leads to better service to costumers:
The very survival of private sector enterprises depends on
customer satisfaction since only such satisfaction can ensure more
widespread and repeat buying, whereas caring for the customer is
generally not a priority with public sector enterprises. Once privatisation
occurs, the need to create and sustain markets will lead to a sea change
in the attitude of these enterprises towards customers. Hence, quality of
service will improve. Thus disinvestments will benefit customers through
better quality, wider variety and lower prices of goods and services.
(v) Retiring (servicing) public debt:
133
A part of the proceeds (revenue) from privatization i.e. through
disinvestment can be used for retiring public debt, primarily by buying
back treasury bills from banks. Apart from this, Government can use a
part of the revenue for retaining and rehabilitation of the workers
displaced or affected as a result of closure and internal restructuring.
(vi) Modernization and technology upgradation:
Through disinvestment the government desires to modernize the
public sector and upgrade technology with the help of resources
generated
(vii) Eliminate Political Interference:
Privatisation of public enterprises will free than from political
interference and will increase efficiency, reduce unemployment and make
them more accountable. In case of public enterprises, political
interference is unavoidable. According to Bimal Jalan, former RBI
governor, political interference is unavoidable in public corporations and
is a major cause of decline in operational efficiency.‖ Most government
also impose non economic objectives on public enterprises.
(viii) Response time in the case of private sector is less:
In a quick changing business environment it often becomes
necessary to take spot decisions without having to worry too much about
not having consulted others. In fact ‗delayed decision making is often
equivalent to making no decision at all.‘ In public enterprises, the concept
of response time is totally absent as no one is willing to disturb the status
quo not so in the case of private sector enterprises. Because of the very
nature of management in these units it becomes easier to read to
changing situations fast.
(ix) Private units are subject to capital market discipline:
Private sector firms are subject to capital market disciplines and
scrutiny by financial experts. In fact, the ability to raise funds in the capital
market is crucially dependent on performance. Not so in the case of
public enterprises. On account of government ownership of these
134 enterprises, they have easy access to credit and budgetary support
irrespective of their performances.
Thus there is no compulsion for these enterprises to perform well.
Thus the overall objectives of privatisation and disinvestment are to
improve the performance of public enterprises so that they are in a
position to generate internal resources and become globally competitive.
8.5 DISINVESTMENT PROCESS AND PERFORMANCE
Some economists argued that the fiscal crisis of 1991 was a result
of the public sectors inability to generate adequate returns on investment.
The government attitude also changed markedly as is clearly
demonstrated in the following statement made in the New Industrial
Policy, 1991. ―After the initial exuberance of the public sector entering
new areas of problems are observed in the insufficient growth in
productivity, poor project management, over manning, lack of continuous
technological upradation, and inadequate attention to research &
development (R&D) and human resource development. In addition, public
enterprises have shown a very slow rate of return on the capital
investment. This has inhibited their ability to regenerate themselves in
terms of new investments as well as in technology development. The
result is that many of the public enterprises have become a burden rather
than being as asset to the government, 1991, advocate privatisation of
public sector enterprises.
The main approach of the government in this regard is bring down
its equity in all non strategic public sector undertakings to 26% (or lower)
and close down those public sector undertakings which cannot be
revived. The disinvestment programme began in 1991-92 and
government states in different public sector companies have been sold in
varying degrees by 2007-08. Till 1998-99, the government use to sell
minority states through domestic or international issue of shares in small
tranches every year. From 1999-2000 to 2001-05, the focus shifted to the
method of strategic sale involving an effective transfer of control and
management to a private entity, the argument being that the government
would get a better price from the private sector if it is ceding actual
control. The prominent companies that have witnessed strategic sale in
the recent past include modern foods, BALCO, CMC,VSNL,IBP, ITDC
Hotels, IPCL, Maruti Udyog Ltd etc. After 2004-2005, disinvestment
realisations have been through sale of small portions of equity.
135
8.5.1 Government Policies on Disinvestment:
The Government of India‘s policy on disinvestment was
announced in the new industrial policy of 1991 and subsequently through
the budget. The important policy measures are discussed below:
(i) New Industrial Policy, 1991:
The announcement of the New Industrial Policy, 1991, can be
considered as the starting point of policy initiative taken by the
government in the direction of disinvestment. In order to provide greater
autonomy to public enterprises and make them more accountable, the
government introduced the concept of Memorandum of Understanding
(MOU). MOUs are contract between the government and PSUs that
determine the project time, cost and functioning of the PSUs.
(ii) Committee on the Disinvestment of share in PSEs (Ramgarajan
Committee) April 1993:
The Committee recommended substantial disinvestments and
suggested that the best method for disinvestment is by offering shares of
PSEs to the general public at a fixed price. It state that the percentage of
equity to be divested could be up to 49% for industries exclusively
reserved for the public sector, so that the government can retain
managing control by holding 51% equity. In other cases, percentage of
equity diverted could be 74%, where an enterprise has dominant market
share.
(iii) Disinvestment Commission:
The government set up the disinvestment commission in 1996 for
working out terms and conditions related to disinvestment of government
equity in PSEs and PSUs. The commission presented 13 reports till
January 2002
136 (iv) Greater Autonomy to Navaratnas and Miniratnas:
In 1997-98 greater autonomy was granted to Nine PSEs referred
to as ―Navaratnas‖ (IOC,IPCL,ONGC,BPCL,HPCL,NTPC,SAIL,VSNL
AND BHEL). GAIL and MTNL have also been given the same status .
These enterprises, subject to certain guidelines, have full freedom to
make capital expenditure decision regarding joint ventures and setting up
of subsidiary offices abroad for technological and strategies alliance.
Greater functional and operational autonomy has been granted to 97
other PSUs referred to as ―Miniratnas‖.
(v) New Privatisation Policy 1998:
On August 7, 1998 a New Privatisation Policy was announced.
Following are the major features of the policy.
(a) Government to offload above 51% in strategic sales. This is now
raised to 74%.
(b) Disinvestment price to be market determined and not pre
fixed.
(c) Structural mechanism to speed up disinvestment process to be
put in place. Under the structural mechanism, PSUs selected for
disinvestment will be freed from administrative control of the
parent ministry and placed under a new body, to be created for
piloting the process.
(vi) Recent Developments:
In September 2003, the Supreme Court, in its judgement in the
case of disinvestment in Hindustan Petroleum Corporation Ltd. (HPCL)
and BPCL restrained the Central Government from proceeding with
disinvestment of those two oil companies. Several cases were filed,
challenging strategies sale of PSUs in various high courts. In May 2004,
with the congress led UPA coming to power it has been decided that
chronically loss making companies will either be sold off, or closed after
all the workers have got their legitimate due and compensation. However
this government does not favour privatisation of profit making public
sector companies. The existing Navatnas companies will not be
privatised, though they can raise resources from the capital market. This
137 was because the Central Government was formed with the help of left
parties. Since 2009, UPA has come to power again this time without the
support of left parties. Thus it is expected that the process of
disinvestment will get more momentum.
The government has decided to establish a Board for
Reconstruction of public sector enterprises to advise the government on
ways and mean for strengthening PSEs and make them more
autonomous and professional. The government has also approved the
constitutions of a National Investment Fund (NIF), made from the
proceeds from disinvestments. This fund will make investments and
social projects and in selected profitable and revivable PSEs.
8.5.b Disvetment Process or Methodologies:
The disinvestment policy of the government has been evolved and
over a period of time. Disinvestment of government equity in Central
Public Sector Enterprises (CPSEs) began in 1991-92. The following
methods were adopted;
(i) Sale of Minority Shares: From 1991-92 to 1999-2000.
Disinvestment was primarily through sale of minority share in small
lots. Under this method beginning of 1991-92, the government
offered shares for sale in‖ bundles‖ involving a combination of equity
from poor and good performers. In practice, rather than help the
government divest shares in loss making PSUs at reasonable
prices, bundling resulted in the government obtaining a very low
average price for each bundle, implying that prime shares were
handed over at rock bottom prices. In 1992-93, the government
abandoned the bundling of shares and sold shares of each
company separately by the auction method.
(ii) Strategic Sale: Since 1999-2000, government shifted to another
method the strategic sale of a PSU to a private sector company.
Under this method the government sells major portion of its own
stake to a strategic buyer an also hands over the management
control. The government resorted to strategic sale of a number of
companies Modern Foods India Ltd, VSNL,IPCL,BALCO, CMC
LTD, HTL LTD, IBP,ITDC (13Hotels), Hotel corporation of India PTL
, Hindustan Zinc Ltd, Maruti Udhyog Ltd etc. During 2003-2004,
government accumulated Rs 15547 crs. Proceeds from
disinvestment.
138 (iii) Listing of shares on domestic stock exchanges: At present the
policy is to list large profitable CPSEs on domestic exchanges.
(iv) Cross holdings: In the cases of cross holdings, the government
would sell a part of its share in one PSU to one or more other PSUs.
(v) Warehousing: Under the model of warehousing, government
owned financial institutions are expected to buy the governments
state in selected PSUs and hold them until, any third buyer
emerged.
(vi) Golden Share: The golden share concept was designed to protect
the government‘s interest in the PSUs. In this model, the
government retains a 26% state in the PSUs, but a lesser stake
does not make it a minority stake holder. Instead, this 26% share
will continue to give the government the status of majority
shareholder.
8.5.c Performances of Disinvestment Process:
The disinvestment process began in 1991-92. Since then, the total
proceeds from disinvestment upto May 2008 amounted to Rs 53423cr.
The performances of the disinvestment process can be explained with the
help of following tables.
Table 8.1 Disinvestment between 1991 & 2008
Item Amount Realised
(Rs in crores)
Percent
Receipts through sale of
minority share holding in
CPSEs
35,358.01
66.18
Receipts through sale of
majority of one CPSE to
another CPSE
1317.23
2.47
Receipts through strategic
sale
6344.35 11.88
Receipts from other related 4005.17 7.50
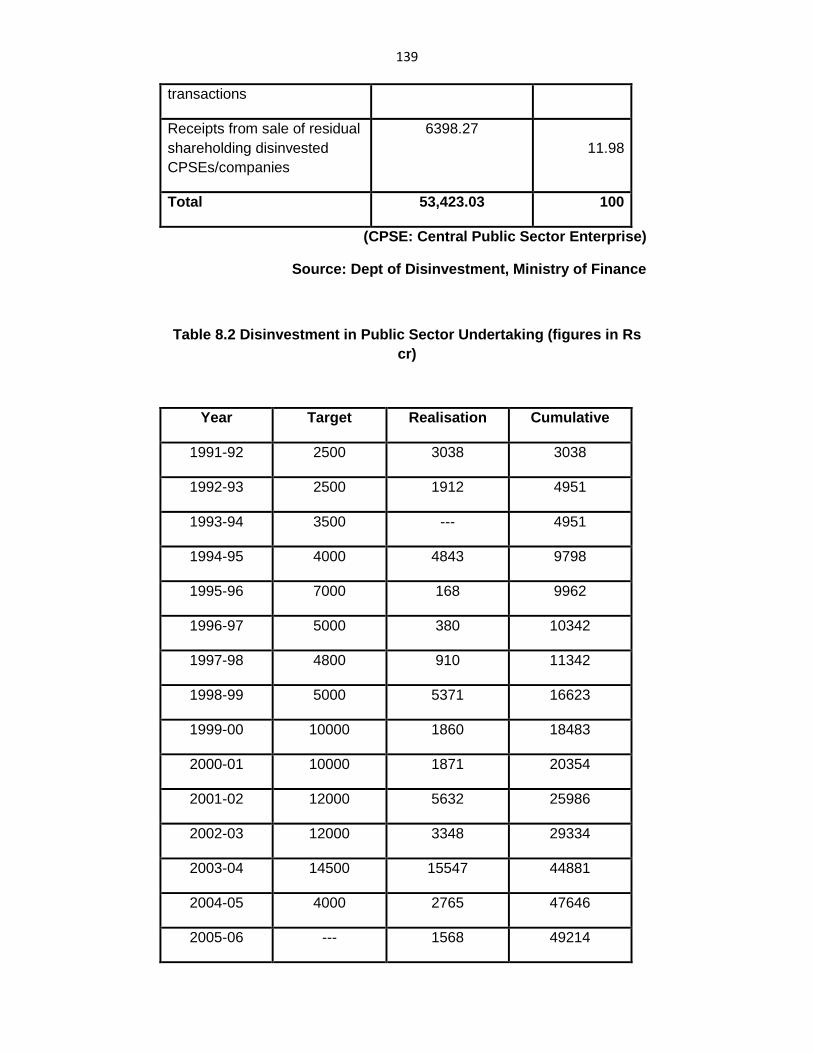
139
transactions
Receipts from sale of residual
shareholding disinvested
CPSEs/companies
6398.27
11.98
Total 53,423.03 100
(CPSE: Central Public Sector Enterprise)
Source: Dept of Disinvestment, Ministry of Finance
Table 8.2 Disinvestment in Public Sector Undertaking (figures in Rs
cr)
Year Target Realisation Cumulative
1991-92 2500 3038 3038
1992-93 2500 1912 4951
1993-94 3500 --- 4951
1994-95 4000 4843 9798
1995-96 7000 168 9962
1996-97 5000 380 10342
1997-98 4800 910 11342
1998-99 5000 5371 16623
1999-00 10000 1860 18483
2000-01 10000 1871 20354
2001-02 12000 5632 25986
2002-03 12000 3348 29334
2003-04 14500 15547 44881
2004-05 4000 2765 47646
2005-06 --- 1568 49214
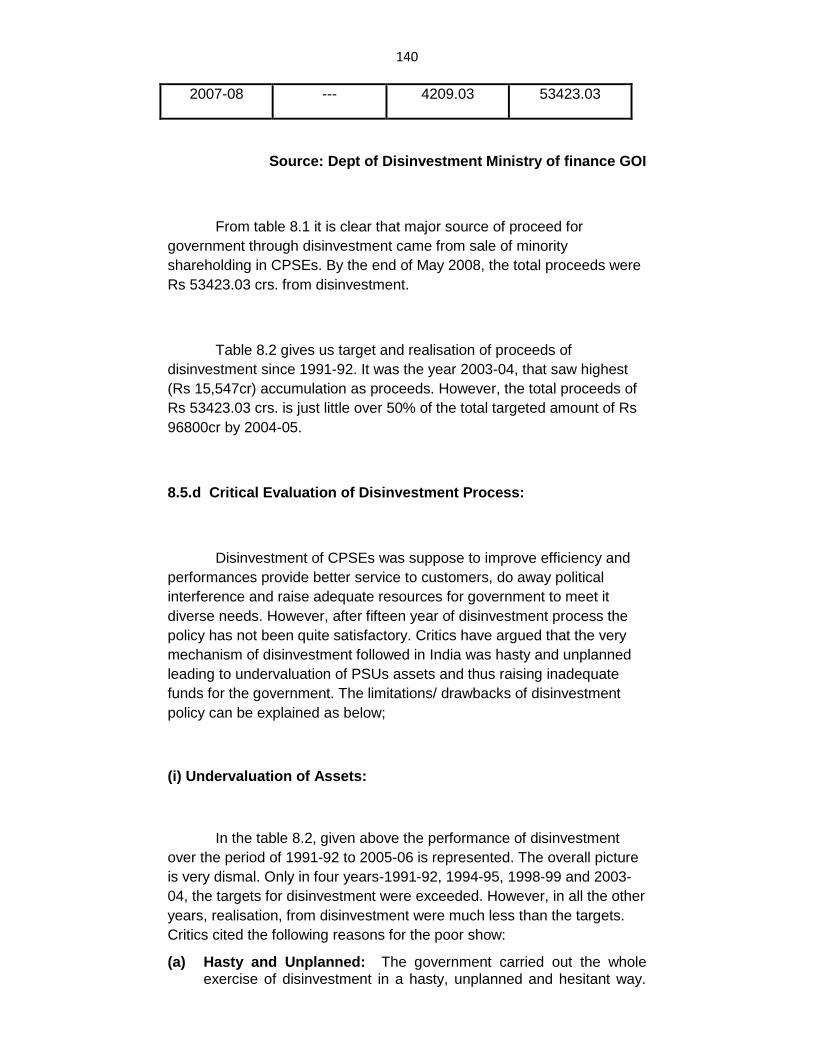
140
2007-08 --- 4209.03 53423.03
Source: Dept of Disinvestment Ministry of finance GOI
From table 8.1 it is clear that major source of proceed for
government through disinvestment came from sale of minority
shareholding in CPSEs. By the end of May 2008, the total proceeds were
Rs 53423.03 crs. from disinvestment.
Table 8.2 gives us target and realisation of proceeds of
disinvestment since 1991-92. It was the year 2003-04, that saw highest
(Rs 15,547cr) accumulation as proceeds. However, the total proceeds of
Rs 53423.03 crs. is just little over 50% of the total targeted amount of Rs
96800cr by 2004-05.
8.5.d Critical Evaluation of Disinvestment Process:
Disinvestment of CPSEs was suppose to improve efficiency and
performances provide better service to customers, do away political
interference and raise adequate resources for government to meet it
diverse needs. However, after fifteen year of disinvestment process the
policy has not been quite satisfactory. Critics have argued that the very
mechanism of disinvestment followed in India was hasty and unplanned
leading to undervaluation of PSUs assets and thus raising inadequate
funds for the government. The limitations/ drawbacks of disinvestment
policy can be explained as below;
(i) Undervaluation of Assets:
In the table 8.2, given above the performance of disinvestment
over the period of 1991-92 to 2005-06 is represented. The overall picture
is very dismal. Only in four years-1991-92, 1994-95, 1998-99 and 2003-
04, the targets for disinvestment were exceeded. However, in all the other
years, realisation, from disinvestment were much less than the targets.
Critics cited the following reasons for the poor show:
(a) Hasty and Unplanned: The government carried out the whole exercise of disinvestment in a hasty, unplanned and hesitant way.
141
As a result many public sector equities have been sold at a much lower value than what they should have fetched. Inadequate information about PSUs has prevented free, competitive and efficient bidding of shares, and a free trading of those shares.
(b) The government launched the disinvestment programme without creating the required conditions for its take off. This would be clear from the fact that it did not try to list the shares of the public sector enterprise on the stock exchanges. Thus, adequate efforts were not made to build up the much needed linkage between the public enterprises on the one hand and the capital market on the other. The government did not adopt suitable methods to oversees the disinvestment of public sector shareholding. The Department of Public Enterprise and the Finance Ministry adopted techniques and methods which resulted in for lower realisation than Justified.
On account of all these reasons there was considerable ―under
pricing‖ of public enterprises shares resulting in considerable loss to the
government.
For eg. as per the report of Comptroller and Auditor General of
India (CAG) 1993, govt sold HPCL share for Rs 243 against the market
price of Rs 550. Moreover, in case of NLC, its share was sold for Rs 11
against the market prices of Rs 82. Thus between 1991-92 and 1992-93,
the potential proceeds would have been Rs 12,554 cr, as against the
actual realization of only Rs 4,951 crore.
(ii) Increase in Unemployment:
One of the objectives of disinvestment to increase employment
opportunity. However, after almost fifteen years of disinvestment
programmes, rather than increase in employment, there is actually fall in
employment opportunities. Public sector undertaking have seen a net
reduction in employment from a level of 2.1 million employees in 1991-92
to a level of 1.74 million employees in 2000-01, a reduction in 20% over
this period. Till March 31, 2001, about 3.69 lakh employees had opted for
VRS.
(iii) Substitution of monopoly power:
At times sale of a PSU to a private company can only result in the
substitution of a public monopoly by a private monopoly. In such cases,
142 inefficiencies and monopoly power will merely be transferred to the
private sector, with the costs being borne by the consumers. This is also
termed as ―monopolistic exploitation by efficient private owners replaced
the inefficiencies of public ownership.‖ Hence it is not ownership that
promotes efficiency but competition. It is competitive environment, rather
than ownership, that promotes allocative efficiency.
(iv) Continued Deficits:
Despite the fact that disinvestment policy has adopted since 1991,
the fiscal and revenue deficits have been rising. The government has not
used the disinvestment proceeds to finance expenditure on capital
accounts; i.e the disinvestment policy has resulted in revenue expenditure
rather than capital generation. Administrative costs of the disinvestment
process have also been unduly high. Thus disinvestment itself is not the
solution to all problems faced by a developing country. In a country where
the market mechanism functions poorly, privatisation is not likely to
achieve much, unless it is accompanied by competitive environment and
adequate social security measures. India is yet to achieve both.
8. 6 SUMMARY
In the present era of globalisation and liberalisation, disinvestment
has become an economic compulsion. Thus it is difficult to reverse it.
Moreover, government find it very difficult to run the PSUs financially as
well in terms of management. In order to make the environment
competitive, private players must also be welcomed. Though
disinvestment programmes has not been planned and implemented
properly so far, the idea of disinvestment still holds good. For enhancing
efficiency and performance and raising resources disinvestment is a
must. By adopting a proper strategy for sale and supervision, the
disinvestment programme can be a successful one.
8.7 QUESTIONS
1. Explain the role of public sector enterprises in India?
2. Bring out the problems faced by PSUs in India?

143 3. Discuss the need and Objectives of disinvestment
4. Critically evaluated the performance of disinvestment programme in
India?
144
9 MODULE 4
POPULATION PROBLEM
UNIT STRUCTURE
9.0 Objectives
9.1 Introduction
9.2 Features of India‘s Population
9.3 Population and Economic Development
9.4 Population Policy
9.5 National Population 2000
9.6 Summary
9.7 Questions
9.0 OBJECTIVES
After reading this unit you will come to know:
Features and composition of India‘s Population.
Relationship between population and economic development
Various policy measures initiated by government with respect to population
9.1 INTRODUCTION
India is the second largest country of the world in terms of
population. Many people and policy makers consider the larger and the
growing population of the country as its critical problem. Of course to a
certain extent it is true. However if this huge population is converted into
human capital through education and health facilities, it can lead to very
high economic growth and equitable social justice. The acceleration of
population growth since 1947 has been the result of decline in the
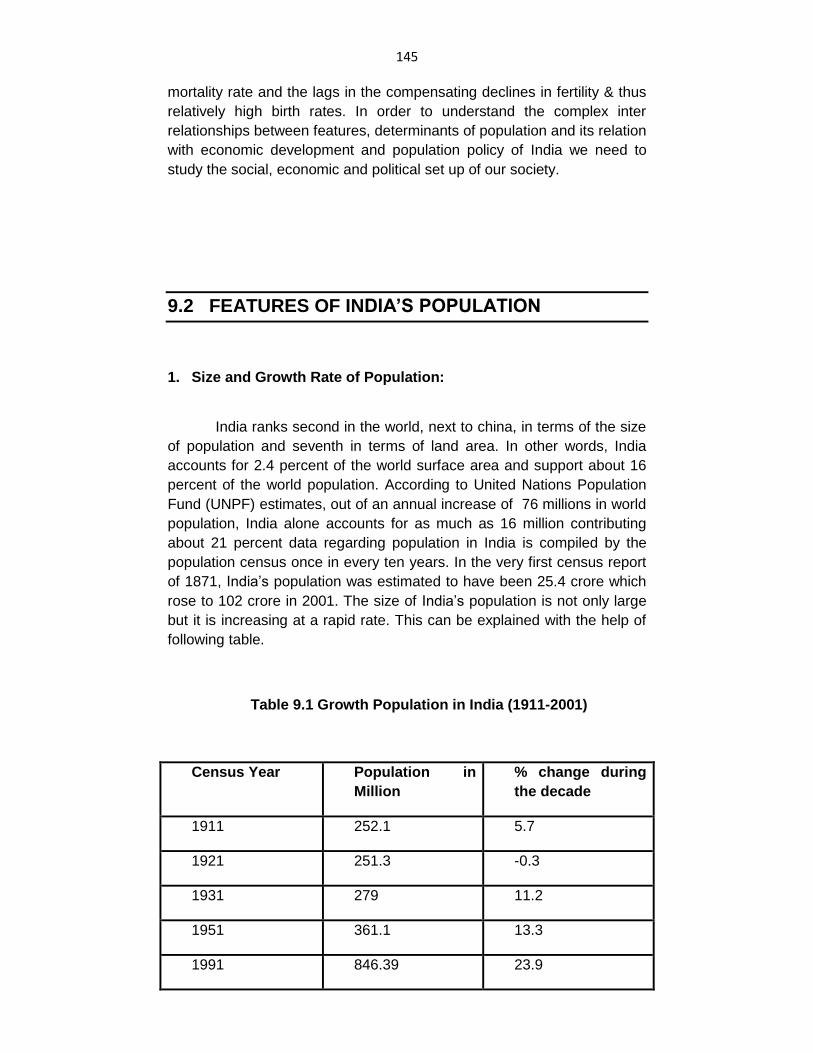
145 mortality rate and the lags in the compensating declines in fertility & thus
relatively high birth rates. In order to understand the complex inter
relationships between features, determinants of population and its relation
with economic development and population policy of India we need to
study the social, economic and political set up of our society.
9.2 FEATURES OF INDIA’S POPULATION
1. Size and Growth Rate of Population:
India ranks second in the world, next to china, in terms of the size
of population and seventh in terms of land area. In other words, India
accounts for 2.4 percent of the world surface area and support about 16
percent of the world population. According to United Nations Population
Fund (UNPF) estimates, out of an annual increase of 76 millions in world
population, India alone accounts for as much as 16 million contributing
about 21 percent data regarding population in India is compiled by the
population census once in every ten years. In the very first census report
of 1871, India‘s population was estimated to have been 25.4 crore which
rose to 102 crore in 2001. The size of India‘s population is not only large
but it is increasing at a rapid rate. This can be explained with the help of
following table.
Table 9.1 Growth Population in India (1911-2001)
Census Year Population in
Million
% change during
the decade
1911 252.1 5.7
1921 251.3 -0.3
1931 279 11.2
1951 361.1 13.3
1991 846.39 23.9
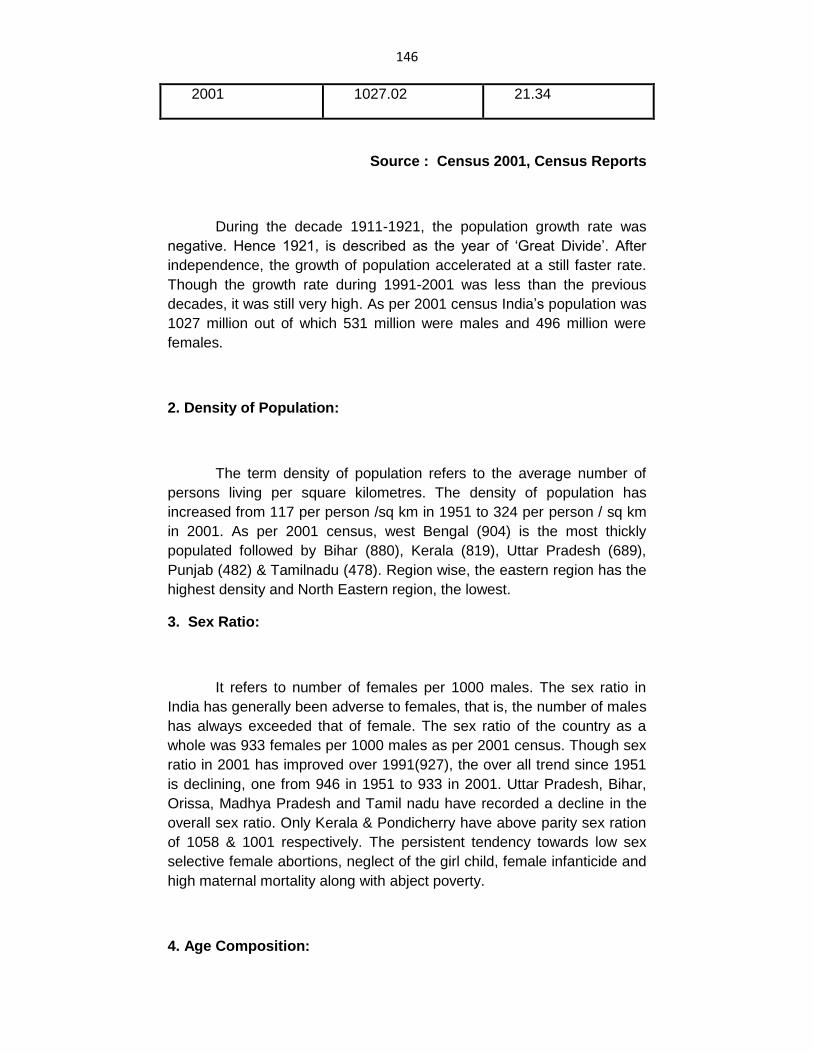
146
2001 1027.02 21.34
Source : Census 2001, Census Reports
During the decade 1911-1921, the population growth rate was
negative. Hence 1921, is described as the year of ‗Great Divide‘. After
independence, the growth of population accelerated at a still faster rate.
Though the growth rate during 1991-2001 was less than the previous
decades, it was still very high. As per 2001 census India‘s population was
1027 million out of which 531 million were males and 496 million were
females.
2. Density of Population:
The term density of population refers to the average number of
persons living per square kilometres. The density of population has
increased from 117 per person /sq km in 1951 to 324 per person / sq km
in 2001. As per 2001 census, west Bengal (904) is the most thickly
populated followed by Bihar (880), Kerala (819), Uttar Pradesh (689),
Punjab (482) & Tamilnadu (478). Region wise, the eastern region has the
highest density and North Eastern region, the lowest.
3. Sex Ratio:
It refers to number of females per 1000 males. The sex ratio in
India has generally been adverse to females, that is, the number of males
has always exceeded that of female. The sex ratio of the country as a
whole was 933 females per 1000 males as per 2001 census. Though sex
ratio in 2001 has improved over 1991(927), the over all trend since 1951
is declining, one from 946 in 1951 to 933 in 2001. Uttar Pradesh, Bihar,
Orissa, Madhya Pradesh and Tamil nadu have recorded a decline in the
overall sex ratio. Only Kerala & Pondicherry have above parity sex ration
of 1058 & 1001 respectively. The persistent tendency towards low sex
selective female abortions, neglect of the girl child, female infanticide and
high maternal mortality along with abject poverty.
4. Age Composition:
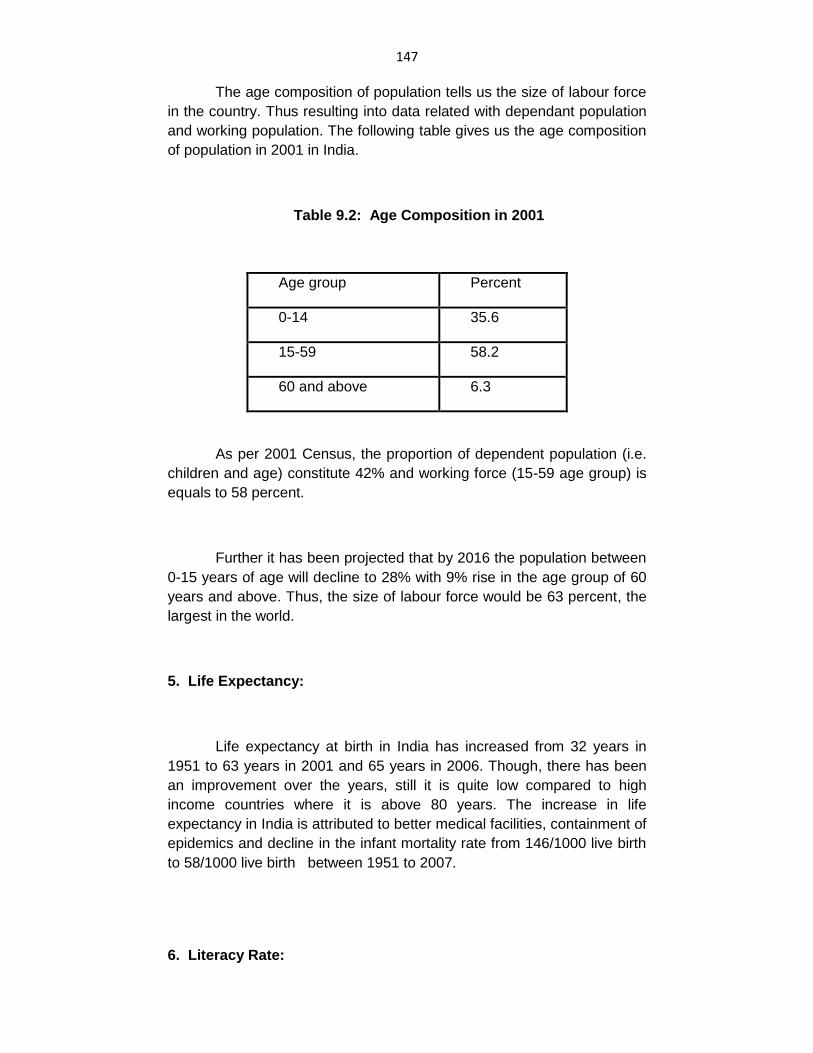
147
The age composition of population tells us the size of labour force
in the country. Thus resulting into data related with dependant population
and working population. The following table gives us the age composition
of population in 2001 in India.
Table 9.2: Age Composition in 2001
Age group Percent
0-14 35.6
15-59 58.2
60 and above 6.3
As per 2001 Census, the proportion of dependent population (i.e.
children and age) constitute 42% and working force (15-59 age group) is
equals to 58 percent.
Further it has been projected that by 2016 the population between
0-15 years of age will decline to 28% with 9% rise in the age group of 60
years and above. Thus, the size of labour force would be 63 percent, the
largest in the world.
5. Life Expectancy:
Life expectancy at birth in India has increased from 32 years in
1951 to 63 years in 2001 and 65 years in 2006. Though, there has been
an improvement over the years, still it is quite low compared to high
income countries where it is above 80 years. The increase in life
expectancy in India is attributed to better medical facilities, containment of
epidemics and decline in the infant mortality rate from 146/1000 live birth
to 58/1000 live birth between 1951 to 2007.
6. Literacy Rate:
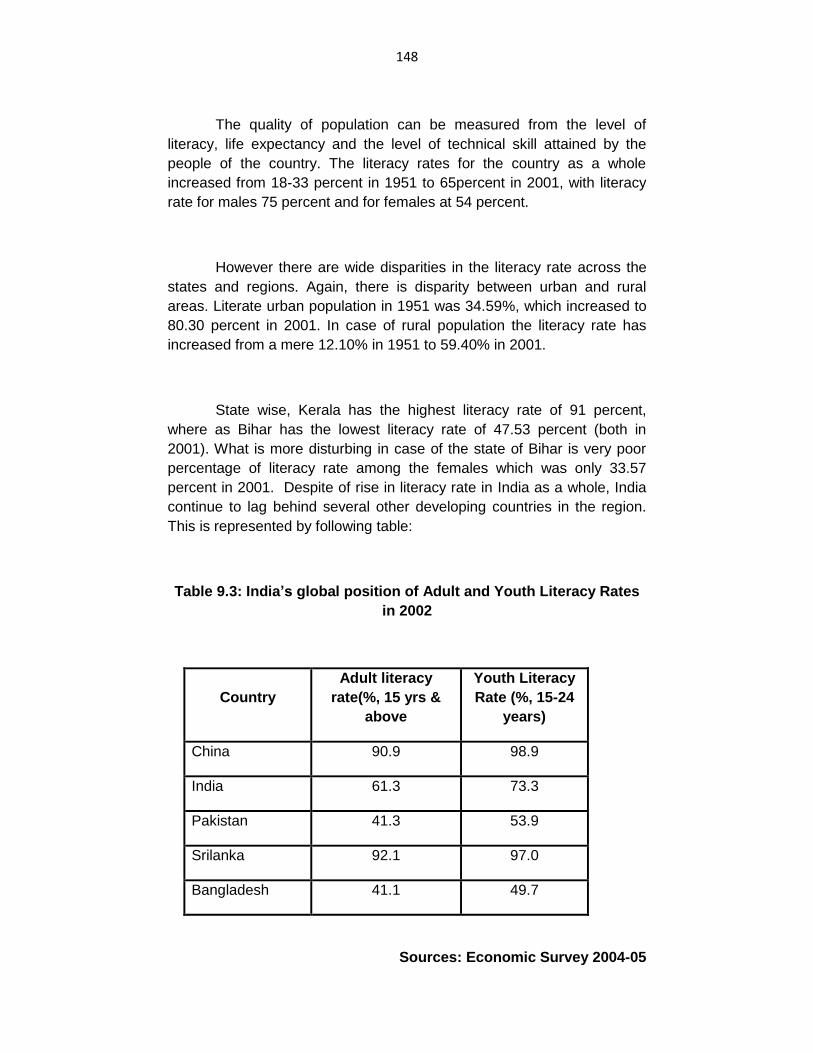
148
The quality of population can be measured from the level of
literacy, life expectancy and the level of technical skill attained by the
people of the country. The literacy rates for the country as a whole
increased from 18-33 percent in 1951 to 65percent in 2001, with literacy
rate for males 75 percent and for females at 54 percent.
However there are wide disparities in the literacy rate across the
states and regions. Again, there is disparity between urban and rural
areas. Literate urban population in 1951 was 34.59%, which increased to
80.30 percent in 2001. In case of rural population the literacy rate has
increased from a mere 12.10% in 1951 to 59.40% in 2001.
State wise, Kerala has the highest literacy rate of 91 percent,
where as Bihar has the lowest literacy rate of 47.53 percent (both in
2001). What is more disturbing in case of the state of Bihar is very poor
percentage of literacy rate among the females which was only 33.57
percent in 2001. Despite of rise in literacy rate in India as a whole, India
continue to lag behind several other developing countries in the region.
This is represented by following table:
Table 9.3: India’s global position of Adult and Youth Literacy Rates
in 2002
Country
Adult literacy
rate(%, 15 yrs &
above
Youth Literacy
Rate (%, 15-24
years)
China 90.9 98.9
India 61.3 73.3
Pakistan 41.3 53.9
Srilanka 92.1 97.0
Bangladesh 41.1 49.7
Sources: Economic Survey 2004-05
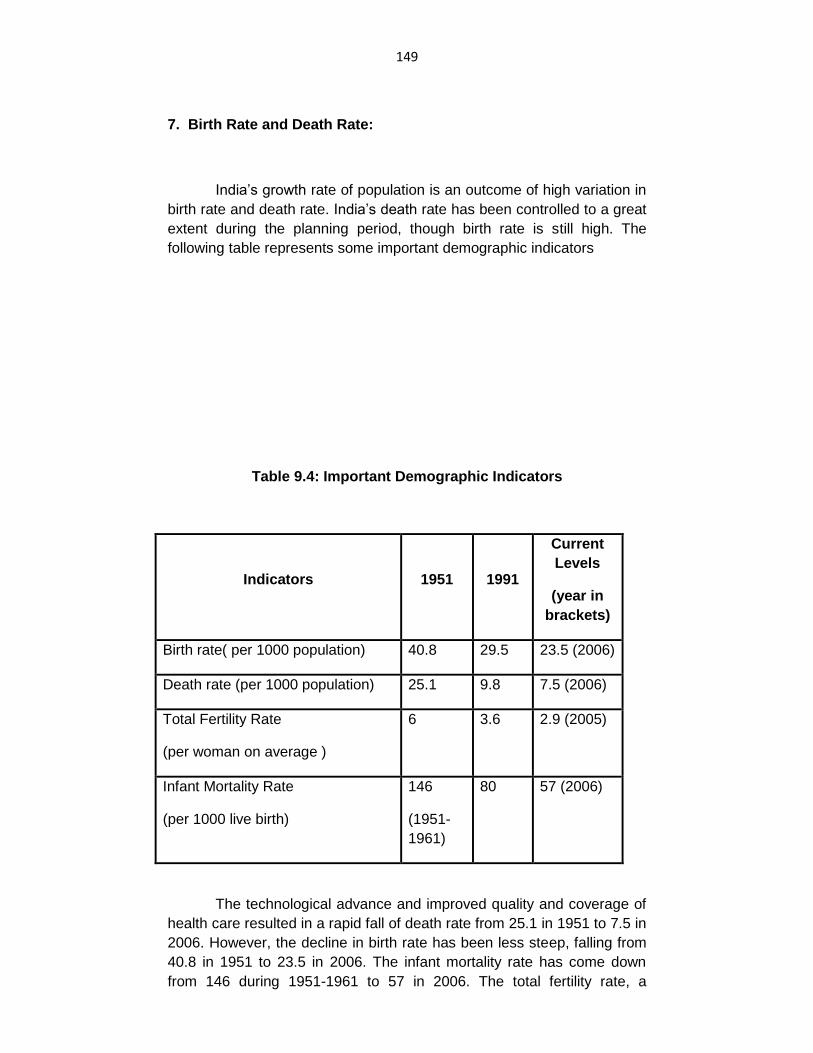
149
7. Birth Rate and Death Rate:
India‘s growth rate of population is an outcome of high variation in
birth rate and death rate. India‘s death rate has been controlled to a great
extent during the planning period, though birth rate is still high. The
following table represents some important demographic indicators
Table 9.4: Important Demographic Indicators
Indicators 1951 1991
Current
Levels
(year in
brackets)
Birth rate( per 1000 population) 40.8 29.5 23.5 (2006)
Death rate (per 1000 population) 25.1 9.8 7.5 (2006)
Total Fertility Rate
(per woman on average )
6 3.6 2.9 (2005)
Infant Mortality Rate
(per 1000 live birth)
146
(1951-
1961)
80 57 (2006)
The technological advance and improved quality and coverage of
health care resulted in a rapid fall of death rate from 25.1 in 1951 to 7.5 in
2006. However, the decline in birth rate has been less steep, falling from
40.8 in 1951 to 23.5 in 2006. The infant mortality rate has come down
from 146 during 1951-1961 to 57 in 2006. The total fertility rate, a
150 measure of the average number of children born to women during her
reproductive period, has declined from 6 in 1951 to 2.9 in 2005. Thus
taking into consideration the above features one can conclude that India‘s
population is passing through the ―Intermediate‖ stage or the 2nd stage of
demographic transition theory.
9.3 POPULATION AND ECONOMIC DEVELOPMENT
There are mixed views expressed by academicians and policy
makers on whether the large size of population and high growth rate of
population is an asset or a liability for India‘s population as a retarding
factor to economic growth and development have following arguments:
1. Too many people on too little land:
The process of economic development involves the utilization of
physical resources of a nation by the labour force of a country so that
productive potential in a country is realised. In this effort of development
there is no doubt that the labour force of the country makes a positive
contribution, but it is equally true that rapidly growing population retards
the process of development. The impact of rising population acting as a
drag on economic resources is felt in a variety of ways.
India accounts for 16% of the world population and has only 2.4%
of the world‘s land area. There is excessive pressure of population on
land. This result in severely high density of population and an adverse
land man ratio. As a result of large population, the average size of the
land holding becomes too small and uneconomic for the purpose of
cultivation. Beside due to the prevailing laws of inheritance and
succession the small farms are again divided and sub divided. All this
makes farming uneconomical. Mechanisation of farms becomes difficult,
leading to low agricultural productivity.
2. Population and Unemployment:
Though the government has many schemes to provide
employment such as Employment Guarantee Scheme, Jawahar Rozgar
151 Yojna etc. it has become increasingly difficult to create jobs for population
of this size. More and more people enter each year the labour market due
to increase in population. India has the largest labour force (working
population) in the world which is about 57 crore. Along with mass
unemployment, there is problem of disguised unemployment i.e. the
marginal productivity f labour is either zero or negative. This is also
known as open unemployment. Thus with rapid rise in population and
huge size of population leading to population explosion, without
corresponding increase in job opportunities has aggravated the problem
of unemployment as well as disguised unemployment.
3. Population and Food Supply:
Though food grains production has increased from 50 million
tonnes in 1950-51 to 208 million tonnes in 2004-05, the rise in population
from 361.1 millions to 1027 millions during the same time. Demand for
food outstrips its supply resulting in relative food shortage. Moreover, the
land under cultivation is decreasing year by year as urbanisation and
commercialisation take place. Since a major part of the increase in
population takes place in the rural areas, it‘s also signifies that the share
of family consumption in total food production will increase and much
less will be left over as marketable surplus.
4. Population and Poverty:
Standard of living of the people at the macro level is an indicator
of the extent of poverty. The standard of living depends on the per capita
income. Per capita income refers to an average income of the citizens of
the population and is given by:
National income
Per capita income =
Population
When the size of population is very large and is increasing, given
national, then per capita income is bound low. Thus, population explosion
152 brings poverty. It reduced per capita income which is measured as the
ratio of national income to the size of population.
5. Increase in Population and capital formation:
Since per capita income is low
due to large size of population the savings are also low and sometime
even negative. Since about 60% of our population is dependent on
agriculture for bread & butter, moreover many of them have marginal size
of land holdings, there is very little scope for savings & hence capital
formation.
6. Population and the Burden of Education, Medical care and
Housing:
Rising population increase the number of children and hence
demands higher expenditure on education, medical care, public health
and housing accommodation. Moreover it becomes difficult for public
authorities to providing these services at reasonable rate and in standard
form (quality). However there is another school of thought which
considers India‘s population as assets and talks of demographic
dividends, India can obtain from this relatively youngest country of the
world as the median age of our population is about 24 years. Dr.
Mannohan Singh, our Prime Minister looks at India‘s population as our
greatest resources. Prof. Jayati Ghosh from Jawaharlal Nehru University,
Delhi also advocates large doses of investment in areas like health,
infrastructure, education and sanitation, if India wants to take advantage
of its work force opportunities.
Economists, such as Coaled and Hoover have indicated that the
rate of economic growth in a developing country is primarily determined
by the growth of labour force and the amount of capital available per
labour. Besides former chairman of Infosys Technologies Ltd., Mr.
Narayana Murthy considers population as, ― a fuel for faster economic
growth. Since it is the demographic window of opportunity for the
country.‖ Thus to conclude , one can argue that it is not merely the size
of population that poses a problem what is more significant is
management of population i.e. transforming human beings into human
capital through quality education and better medical facilities.
153
9.4 POPULATION POLICY
Population policy is the policy of the Government which aims at
improving the quality of the citizens of the country and to seek balance
between size of population and resources required to provide decent
living to these citizens i.e. to control excess burden of population on scare
resources. India has been the first country in the world to adopt family
planning as a nation wide programme and to make it a part of
development strategy. To bring under control the fertility component of
growth, the government launched and officially sponsored family planning
programme in 1952. Since then under the banner of Red Triangle the
programme is being implemented. Initially the programme was restricted
to giving advice only.
The point to be noted here is India‘s population has been quite
large vis a vis other countries of the world. On the eve of Independence
despite partition, India‘s population was about 36 crore. This pressurised
economic growth coupled with problem like starvation, poor agricultural
production, frequent outbreak of cholera, malaria, plague etc. Hence it
was utmost important for the government to devise a policy aiming at
controlling of further growth rate of population. The following programmes
were under taken since Independence to control high population growth
rate.
a) The Fifties:
The National Family Planning Programmes which was launched
in 1952 aimed at reducing birth rate to the extent necessary to stabilize
the population at a level consistent with the requirement of national
economy. During the Second Five Year Plan the emphasis was placed on
motivation. The Second Five Year Plan adopted ‗Cafeteria Approach‘
which made all the contraceptives available to the couples. Efforts were
also mad to extend the family planning services to the rural areas.
b) The Sixties:
154
The Third Five Years Plan emphasised to change the attitude and
behaviour of the people, persuading then to accept the ‗small family
norm‘. During the 1960s sterilisation remained the focus of the National
Family Planning Programme. In April, 1996, a separate Department of
Family Planning was established with a view to co-ordinating the Centre
and the State programmes. Effort was made to popularise vasectomy and
to provide vasectomy services to rural areas, using a camp approach.
c) The Seventies:
The Fifth Plan Approach was more comprehensive. The
programme included child health, maternity health, nutrition services and
other welfare programmes. The Medical Termination of Pregnancy (MTP)
Act was passed in 1971 and it enabled women with unwanted pregnancy
to seek and obtain safe abortion services.
d) Population Policy 1976:
The schemes and measures adopted so far did not pay rich
dividents as birth rate control was concerned and hence the government
decided to introduce compulsory sterlisation as the principal instrument of
population control. Accordingly on April 16, 1976, an announcement of
new population policy was made. The specific targets of the programme
were to reduce the birth rate to 25% thousand at the end of the Sixth plan
(1985) whereby the rate of growth of population would fall to 1.4% by
1985. The programme was used arbitrarily, compulsorily and with
coercive hand. It led to the strongest possible revulsion against the
programme. In 1979, the Family Programme was renamed as Family
Welfare Programme which attempted to integrate family planning services
with those of maternal and child health and nutrition. In 1983, the
government of India formulated the National Health Policy, which
provided comprehensive framework for planning, implementation and
monitoring of health care services.
e) During the Eight Plan (1992-1997):
A new strategy for family planning was proposed in which a new
package of incentives and compensation were offered to the acceptors of
155 family planning programme. The main aim of Eighth Plan was containing
population growth. During this plan programmes like the child survival and
safe motherhood (SSSM) 1992 were introduced. Under this programme
efforts were made to provide integrated antenatal, intranatal and
postnatal care to women. Under child health care the pulse polio
programme aimed at eradication of polio by 2000 which was initiated in
1996.
f ) Ninth Plan (1997-2002):
To reduce population growth rate the Ninth Plan outlined the
following strategies.
(i) Improving quality and coverage of health care to women children
and adolescents, so that their felt needs for health care are fully
met.
(ii) Meeting all the felt needs of contraception through improved
availability access and quality of contraceptive care.
(iii) Reducing infant and maternal morbidity and mortality so that there is
reduction in the desire level of fertility.
(iv) Prevention and control of sexually transmitted diseases (STD)
including emerging problem of HIV or AIDS.
(v) Improving access to family planning services and to reduce the
number of unwanted pregnancies. During the same plan
Reproductive and Child Health (RCH) programme was launched
(1997). This programme combine fertility regulation, safe
motherhood, child survival and Reproductive Tract Infections (RTI)/
sexually Transmitted infections(STI) under one program. This
programme is primarily implemented through the primary health
care infrastructure. The overall goals of the program are reduce
maternal and infant mortality and morbidity and assure reproductive
health and choice to citizen and contribute thereby to stabilisation of
population.
156
g) Tenth Plan (2002-07):
The Tenth Plan aim at reduction in infant mortality rate to
45/1000 live births by 2007 and 28/1000 by 2012, reduction in maternal
mortality rate to 2/100 live births by 2007 and1/1000 by 2012 and
reduction in decadal growth rate of the population between 2001-2011 to
16.2% i.e 1.62% annum. To achieve these targets, it emphasises on the
following policies:
(i) Meeting all the unmet need for contraception to reduce unwanted
pregnancies
(ii) Integrated health care for women and children.
(iii) Implementation of reproductive and child health care programmes to
reduce infant mortality and reduce high desire fertility.
(iv) Meeting the health care needs of the family with emphasis on
involvement of men in planned parenthood.
(v) Janani Surakha Yojana(JSY) : It was launched in April 2005. It is a
safe motherhood intervention programme. It is an integrated
package of servies and cash benefit programme. The main
objectives are to reduce maternal and infant mortality by promoting
institutional delivery and making available quality care in pregnancy,
delivery and post delivery in the below poverty line (BPL) groups.
Government of India has now modified earlier compensation
scheme for sterilization. The payment to compensate has been
increased for loss of wages to those accepting sterilization.
i) Limited Success of Family Planning : The very high rate of growth of
population in India despite the implementation of the Family Planning
Programme since 1952 testifies that this programme has not been fully
successful. It has not been able to achieve target reduction in growth rate
of population. This can be explained with help of following causes/points.
157
(i) Insurance against high infant mortality rate: Although the rate of
infant mortality has declined considerably yet it is quite high compared to
developed countries. So to ensure the survival of certain number of
children the couples ventures to have sufficiently large number of them.
(ii) Lack of Political Will: The government has been setting the targets
and fixing huge outlays. However due to lack of co ordination in
implementing the schemes, the fruitful results are not obtained. There is
inadequate monitoring.
(iii) Social and Religious Customs: In the joint family system the
couples almost compete for children. The larger the family the more
powerful it is assumed to be. Moreover, the birth of a son is a must for
carrying out the last rites of the parents so that their souls are liberated.
Besides , by the poor the number of male children are considered to be
insurance and productive resources.
(iv) Centre State Relations: Resources are allocated between the
Centre & the States as per the recommendations of finance commissions.
Earlier one of the basis for the share of the States was the size of
population. In fact the larger the size of population the larger was the
share of the states weightage was given to the size of population in
determining the share of the State. Obviously then no State government
would have taken implementation of family planning very seriously.
Thus, family planning has still remained a policy, a project in India.
It has not yet become a movement. The basic problem however is not of
money, but of personnel, not one of the method but of motivation.
9.5 NATIONAL POPULATION POLICY 2000
The National Population Policy (NPP) 2000 outlines the long term
objectives as one ― to achieve a stable population by 2045, at a level
consistent with the requirements of sustainable economic growth, social
development and environment protection.‖ It recognizes the fact that
population stabilisation is as much a function of making reproductive
158 health care affordable for all as to the life quality improving services such
as primary and secondary education, sanitation, drinking water, housing,
transport, communication and empowering women and enhancing scope
for their employment.
a) Objectives of NPP 2000:
The NPP 2000 outlines immediate medium term and long term
objectives. The immediate objectives is to address the unmet needs of
contraception, health infrastructure, health personnel and to provide
integrated service delivery for basic reproductive and child health care.
The medium term objective is to bring the total fertility rates to
replacement level by 2010. The long term objective is to achieve a stable
population by 2045 at a level consistent with the requirement of
sustainable economic growth, social development and environmental
protection.
b) Measures to achieve stable population by 2045:
(i) Address the unmet needs for basic reproductive and child health
services supplies and infrastructure.
(ii) Make school education upto age 14 free and compulsory and
reduce dropouts at primary and secondary school level to below 20
percent for both boys and girls.
(iii) Reduce infant mortality rate below 30 per 1000 live births.
(iv) Reduce maternal mortality rate to below 100 per 100000 live births.
(v) Achieve universal immunization of children against all vaccine
preventable diseases.
(vi) Promote delayed marriage for girl not earlier than age 18 and
preferably after 20 years of age.
(vii) Achieve 80% institutional deliveries and 100 percent deliveries by
trained persons.
(viii) Access to Information, containing AIDS, prevention and control of
communicable diseases.
(ix) Incentives to adopt two child small family norm.
159 (x) A special reward for women who marry after 21 years of age and
opt for terminal method of contraception after the second child.
(xi) Health insurance covers for those who are below the poverty line
and who undergo sterilization after having two children.
(xii) Integrate Indian System of Medicine (ISM) in the provision of
reproductive and child health services and in reaching out to
households.
(xiii) Bring about convergence in implementation of related social sector
reforms so that family welfare becomes a people centred program.
c) Evaluation of National Population Policy 2000 :
No doubt the government of India has undertaking several
schemes and policies to check the growth rate of population and improve
the quality of human beings in the country, such programme have had but
little success. This is primarily because the policies and programmes are
not comprehensive in the sense these are independent of socio and
economic development of the society. Nowhere in the world, rate of
population growth has declined without the spread of education among
the masses and substantial improvement in their standard of living, and
yet in India these aspects have been very much ignored in the
government which is non receptive to the programme, clearly betrays the
understanding of the problem. Some of the basic drawbacks of the
National Policy on Population 2000 are as follows;
(i) Overemphasis on Contraceptives:
Most of the programmes, including National Population Policy
2000 formula tied in India to restrict the population growth were invariably
based on the assumption that by increasing the supply of contraceptives
and popularising their use, the problem could be solved. No one ever
seriously thought of raising the standard of living of the masses especially
in rural India to bring about a fall in the rate of population growth. Prof B.
R. Sen rightly assets that poverty f these people provides them an
inducement to have more children and perhaps this is the major causes
of our children this is the major causes of our population. To quote Prof. B
R Sen‖ therefore if population problem to be resolved in this country,
frontal attack has to be made on poverty, particularly in rural areas. This
will require extra developmental efforts in the countryside‖.
160
Kerala and Goa among other states in India, have successfully
brought down the birth rates to a great extent in last 30 years. This has
become possible largely due to spread of literacy, especially among
women and their better health care. Prof T N Krishnan has thus rightly
stressed,‖ both in kerla & Goa their demographic transitions were
preceded by health and educational transitions.‖ Therefore the
government in other states must learn from the experiences of Kerala &
Goa while formulation any program and policies on population.
(ii) Women Centric:
The cities of National Population Policy feel that this policy targets
only the women and make them solely responsible for making the
programme of family restriction a success. The cities strongly feel that the
men also should be involved in the participation of the policy because
both men and women are equal partners in their day to day life. Moreover
in India decision regarding size of family is predominantly taken by men
rather than women.
According to Dr Nina Puri, President, Family Planning Association
of India,‖ the new population policy provides incentives only to women to
accept terminal methods of contraception after the second child. It would
have been far better had the policy also provided similar incentives for
―men‖ for sterilisation after the second child.
(iii) Inadequate Infrastructure and underutilisation of Available
Infrastructure:
In order to meet latent demand for family planning especially in
the lower and middle income families there is inadequate infrastructure in
the form of government clinics and counsellors. At the same time
government hospitals are underutilised due to shortage of trained
manpower, inefficiency of motivational work of the staff improper
maintenance of infrastructural equipments etc.
(iii) Child as an Asset for poor family:
161
The lower strata of Indian population consists of about 60 percent
of population consider large family as an assets because:
(a) There are more earners in the family.
(b) Children share household chores and family enterprises and release
adults for full employment.
(c) Larger family acts as safeguard against the loss of family members
especially when infant mortality is high.
(d) In a large family, member get sustenance and company in old age.
(e) There is emotional satisfaction from children.
(f) The cost of bringing up children is less than the benefits from
children over lifetime.
d) Conclusion:
In the XIth Plan government of India has come out with the
Scheme of incentives to the male members of the society to sterilise after
second child and slowly and gradually it is reflection some positive
results. However, in order to check the growth rate of population we must
focus on education, health, services and economic development. The
birth rate will be controlled only when we overcome death rate (mortality
rate), provide decent jobs to the poor with wide spread education. Only
when cost of rearing children exceeds the benefit overtime, couple will
prefer to have less numbers of children. This had occurred only in upper
social and economic strata of population. Economic development must
bring about transformation in lower strata of population so that they
accept small family norm.
9.6 SUMMARY
As India poise to emerge as one of the powerful and strong
economies of the world in coming 20-25 years , large size of population
and high growth rate of population are two major concerns before the
country. However these two problems could be turned as blessing in
disguise if the country invests heavily on education and health
162 programmes to convert this population into huge manpower or human
capital. Then we shall be able to reap rich demographic dividends. So far
many schemes of family planning are undertaken by the government.
However due to lack of co ordination, inadequate medical facilities, poor
education, improper implementation and uneven economic, improper
implementation and uneven economic development these schemes have
not fully successful. To summarise and conclude, one can say that
national economic structure must be changed rapidly to guarantee the
viability of small family. Therefore economic development of the masses
is the best contraceptive.
9.7 QUESTIONS
1. Discuss the salient features of India‘s population
2. India‘s population is an Asset or Liability?
3. Development is the Best Contraceptive: comment.
4. Bring out the highlights of New Population Policy 2000.
5. Critically evaluate New Population Policy 2000.
6. Why was the family planning programme not acceptable to the
people?
163
10
LABOUR MARKET IN INDIA
UNIT STRUCTURE
10.0 Objectives
10.1 Introduction
10.2 Features of Indian Labour Market
10.3 Labour Market Segmentation in India
10.4 Role of Trade Unions
10.5 Impact of Liberalization on Employment
10.6 Exit Policy and Safety Net for Labour
10.7 Industrial Relations
10.8 Summary
10.9 Questions
10.0 OBJECTIVES
After reading this Unit, you will come to know;
• Common attributes of Labour.
• Features of Indian Labour Market.
• Features of Agricultural, industrial and tertiary sector labour
force market segmentation.
• Role of Trade Unions.
164
• Impact of Globalization & Liberalizations on Employment in
India.
• Exit Policy and Safety Net for Labour-Industrial relations.
10.1 INTRODUCTION
Labour market may be defined as a process by which
supplies of a particular type of labour and demand for that type of
labour balance or seek to obtain a balance. Though, the price of
labour, in terms of wage rate is determined by the forces of demand
for and supply of labour just as the price of any other commodity,
there are important difference between Commodity market and
labour market. They are as follow:
(a) The relationship between buyers and sellers in commodity
market is just temporary, whereas in labour market it does last
for longer period & thus personal factors also play important
role in the labour market, they can be easily ignored in
commodity market.
(b) In labour market there is diversity of rates i.e. for the same type of work the wages paid could be different. Again the productivity of different labourer for the same task would be different as well.
(c) In labour market, demand for labour is a derived demand whereas demand for a commodity is generally a direct demand.
Again in case of labour market the impact of psychological and social factors cannot be ignored. After the economic reforms of 1990s the recent study of the impact of these reforms (also known as Globalization & Liberalization) on employment levels in India has gained importance, along with which the Exit Policy and Safety Net for Labour too have been emphasized. Thus with this back grand , it therefore becomes necessary to discuss the major issues related with Labour market in India.
10.2 FEATURES OF INDIAN LABOUR MARKET
Broadly speaking, Indian labour market can be sub-divided
into agricultural labour, industrial labour and labour engaged in services. However, generally whenever we refer to labour market, we often mean organized laour force or organized industrial work force and its demand by those industries. In this chapter we shall discuss all types of Indian labour market.
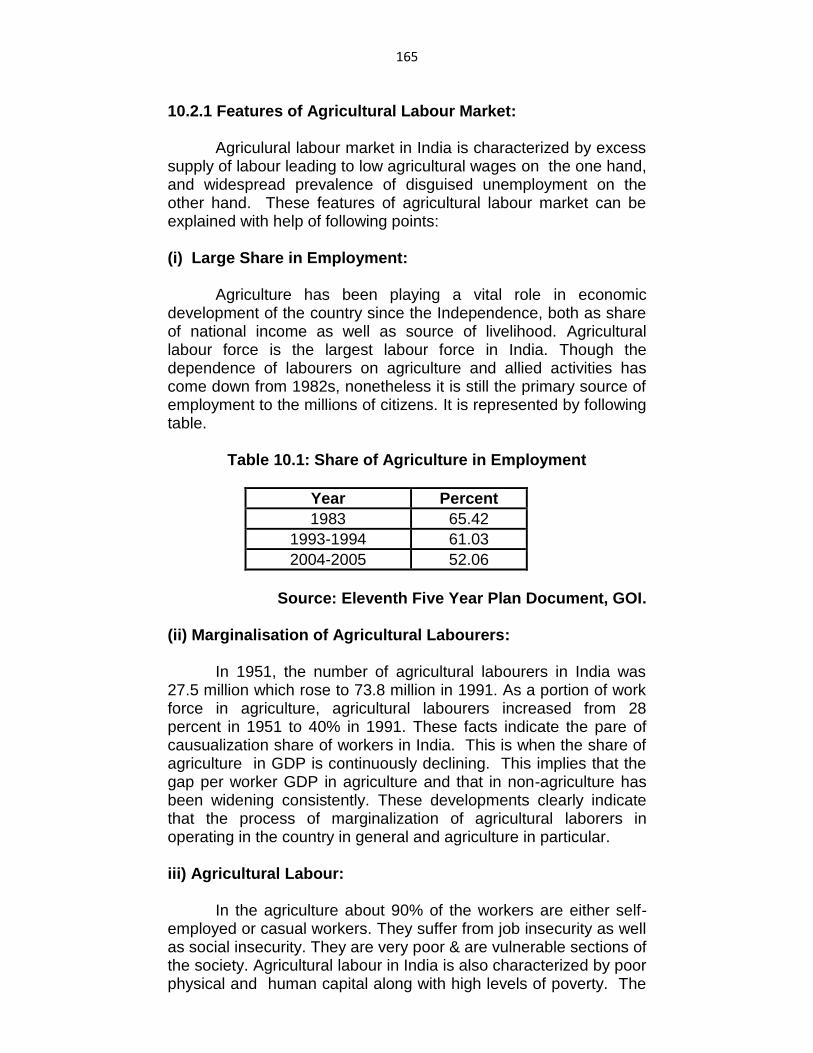
165
10.2.1 Features of Agricultural Labour Market:
Agriculural labour market in India is characterized by excess supply of labour leading to low agricultural wages on the one hand, and widespread prevalence of disguised unemployment on the other hand. These features of agricultural labour market can be explained with help of following points: (i) Large Share in Employment:
Agriculture has been playing a vital role in economic development of the country since the Independence, both as share of national income as well as source of livelihood. Agricultural labour force is the largest labour force in India. Though the dependence of labourers on agriculture and allied activities has come down from 1982s, nonetheless it is still the primary source of employment to the millions of citizens. It is represented by following table.
Table 10.1: Share of Agriculture in Employment
Year Percent
1983 65.42
1993-1994 61.03
2004-2005 52.06
Source: Eleventh Five Year Plan Document, GOI.
(ii) Marginalisation of Agricultural Labourers: In 1951, the number of agricultural labourers in India was 27.5 million which rose to 73.8 million in 1991. As a portion of work force in agriculture, agricultural labourers increased from 28 percent in 1951 to 40% in 1991. These facts indicate the pare of causualization share of workers in India. This is when the share of agriculture in GDP is continuously declining. This implies that the gap per worker GDP in agriculture and that in non-agriculture has been widening consistently. These developments clearly indicate that the process of marginalization of agricultural laborers in operating in the country in general and agriculture in particular. iii) Agricultural Labour: In the agriculture about 90% of the workers are either self-employed or casual workers. They suffer from job insecurity as well as social insecurity. They are very poor & are vulnerable sections of the society. Agricultural labour in India is also characterized by poor physical and human capital along with high levels of poverty. The
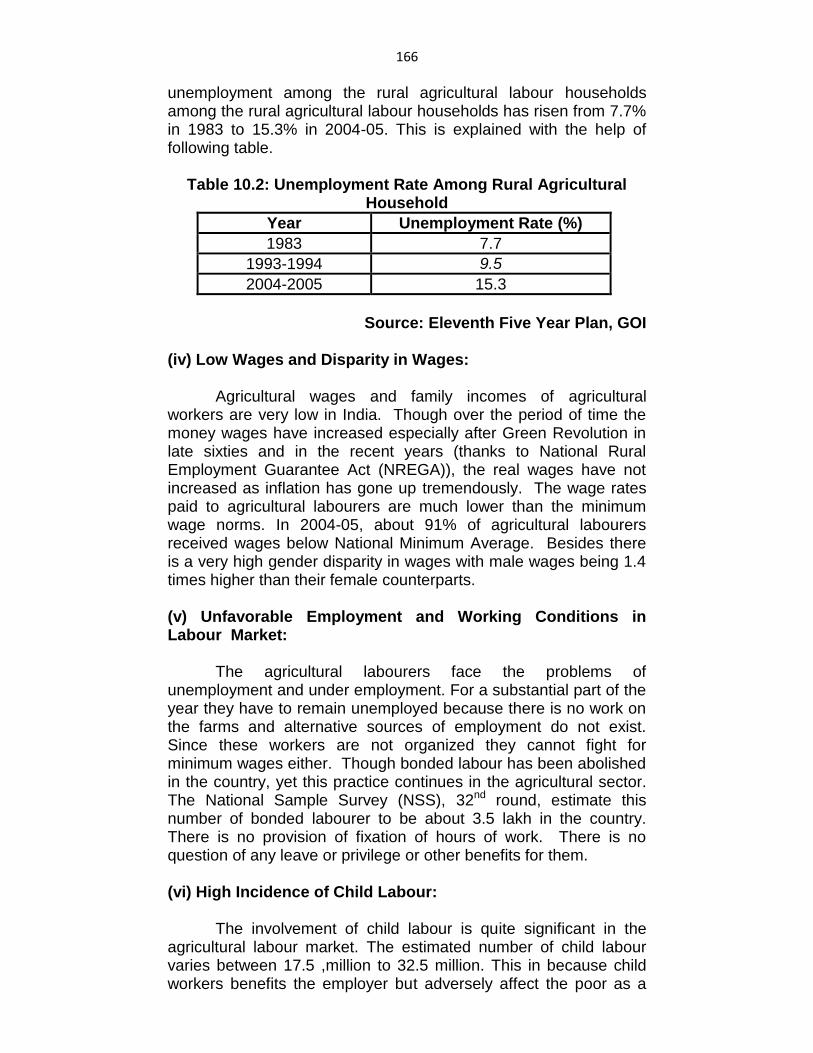
166
unemployment among the rural agricultural labour households among the rural agricultural labour households has risen from 7.7% in 1983 to 15.3% in 2004-05. This is explained with the help of following table.
Table 10.2: Unemployment Rate Among Rural Agricultural Household
Year Unemployment Rate (%)
1983 7.7
1993-1994 9.5
2004-2005 15.3
Source: Eleventh Five Year Plan, GOI
(iv) Low Wages and Disparity in Wages: Agricultural wages and family incomes of agricultural workers are very low in India. Though over the period of time the money wages have increased especially after Green Revolution in late sixties and in the recent years (thanks to National Rural Employment Guarantee Act (NREGA)), the real wages have not increased as inflation has gone up tremendously. The wage rates paid to agricultural labourers are much lower than the minimum wage norms. In 2004-05, about 91% of agricultural labourers received wages below National Minimum Average. Besides there is a very high gender disparity in wages with male wages being 1.4 times higher than their female counterparts. (v) Unfavorable Employment and Working Conditions in Labour Market: The agricultural labourers face the problems of unemployment and under employment. For a substantial part of the year they have to remain unemployed because there is no work on the farms and alternative sources of employment do not exist. Since these workers are not organized they cannot fight for minimum wages either. Though bonded labour has been abolished in the country, yet this practice continues in the agricultural sector. The National Sample Survey (NSS), 32nd round, estimate this number of bonded labourer to be about 3.5 lakh in the country. There is no provision of fixation of hours of work. There is no question of any leave or privilege or other benefits for them. (vi) High Incidence of Child Labour: The involvement of child labour is quite significant in the agricultural labour market. The estimated number of child labour varies between 17.5 ,million to 32.5 million. This in because child workers benefits the employer but adversely affect the poor as a
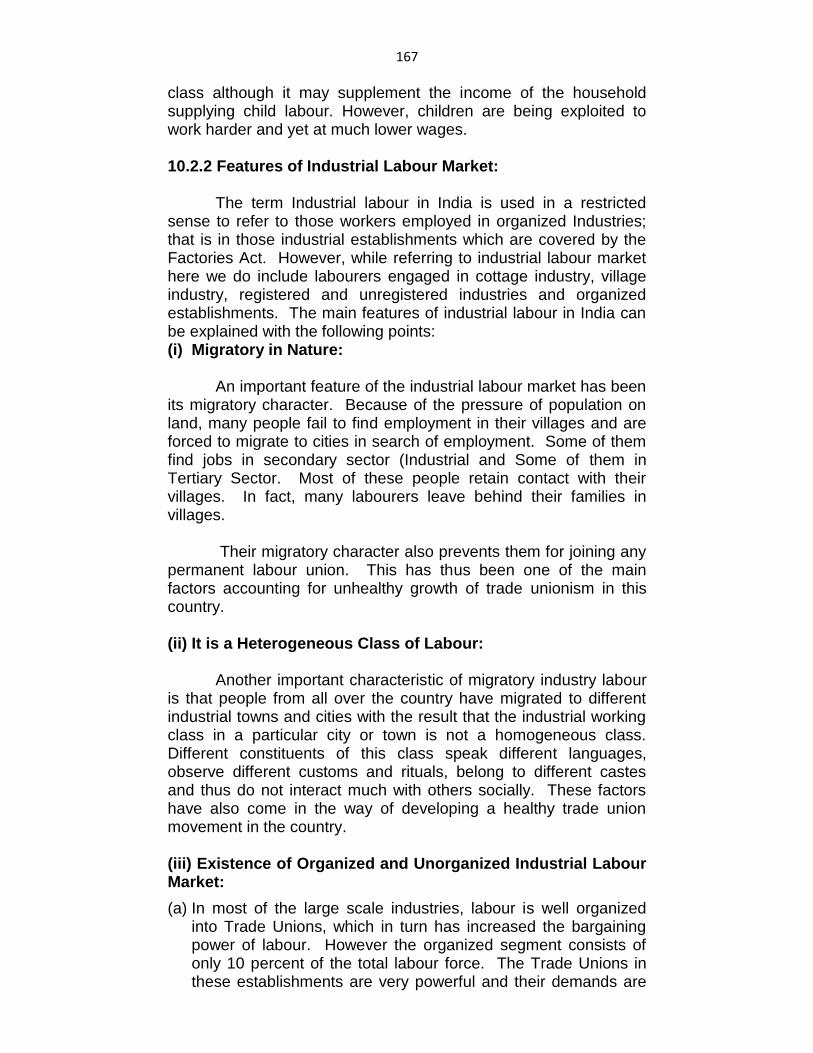
167
class although it may supplement the income of the household supplying child labour. However, children are being exploited to work harder and yet at much lower wages. 10.2.2 Features of Industrial Labour Market: The term Industrial labour in India is used in a restricted sense to refer to those workers employed in organized Industries; that is in those industrial establishments which are covered by the Factories Act. However, while referring to industrial labour market here we do include labourers engaged in cottage industry, village industry, registered and unregistered industries and organized establishments. The main features of industrial labour in India can be explained with the following points: (i) Migratory in Nature: An important feature of the industrial labour market has been its migratory character. Because of the pressure of population on land, many people fail to find employment in their villages and are forced to migrate to cities in search of employment. Some of them find jobs in secondary sector (Industrial and Some of them in Tertiary Sector. Most of these people retain contact with their villages. In fact, many labourers leave behind their families in villages. Their migratory character also prevents them for joining any permanent labour union. This has thus been one of the main factors accounting for unhealthy growth of trade unionism in this country. (ii) It is a Heterogeneous Class of Labour: Another important characteristic of migratory industry labour is that people from all over the country have migrated to different industrial towns and cities with the result that the industrial working class in a particular city or town is not a homogeneous class. Different constituents of this class speak different languages, observe different customs and rituals, belong to different castes and thus do not interact much with others socially. These factors have also come in the way of developing a healthy trade union movement in the country. (iii) Existence of Organized and Unorganized Industrial Labour Market:
(a) In most of the large scale industries, labour is well organized into Trade Unions, which in turn has increased the bargaining power of labour. However the organized segment consists of only 10 percent of the total labour force. The Trade Unions in these establishments are very powerful and their demands are
168
more or less met. According to Prof. Suresh D.Tendulkar ―Only about 10 percent of the total work force (consisting of organized labour, including government services) has benefited from the activist labour policy of the government.‖
(b) In most of the small-scale and village industries labour is unorganized. It does not have enough bargaining power, nor does it enjoy security of employment. These industries include (i) traditional industries based on traditional skills and techniques, and (ii) modern small-scale industries making use of modern technology as well as artisans‘ workshops engaged in activities such as repairing of various implements, machinery, vehicles etc.
(iv) Industrial Labour Market provides scope for faster horizontal, vertical and diagonal mobility:- A unit of industrial labour can move from one firm to the other nature of work remaining the same (horizontal mobility) or from a lower grade to the higher grade under same employment (Vertical Mobility) or it can move from one firm to the other firm in higher grade (diagonal mobility). (v) Dichotomy: A large number of establishments in the unorganized remain outside any regulation, while the organized sector has been regulated fairly stringently. It can be reasonably argued that the organized sector has provided too much of job-security for too long, while the unorganized sector has provided too little to too many. 10.2.3 Features of Tertiary Labour Market: Tertiary labour market includes workers employed in the following three sectors: (i) trade and commerce, (ii) transport, storage and communication, and (iii) other services - Other services include banking, non-banking financial intermediaries, insurance, real estate and dwellings etc. and government sector (public administration, defense and other government services.) (i) Demand for Labour in Tertiary Sector has been increasing: The service sector is currently the fastest growing sector of the Indian economy, and the employment growth in this sector has remained more than 5 per annum since 1990s. As the economy goes on developing and as the disposal income of those who are employed goes on increasing, their demand for non-agricultural product keeps on rising and to meet such growing demand there is
169
greater demand generated for services of labour in the Tertiary Sector. (ii) Tertiary Labour is More Organized in the Public Sector: Labour in public sector services such as banking, insurance, transportation is more organized, have their own trade unions and hence high bargaining power to press for their demands. (iii) High Potential for Technical Jobs: There is definitely high potential for more and more employment in the IT-related enterprises, telecommunication, trade, tourism, hotels, banking, insurance, health services, education, media, entertainment etc. (iv) High Vertical Mobility: There is more job security along with other benefits (particularly for White-Collard jobs) that are expected to be provided in the organized labour market. The wages are relatively higher in organized sector. However other service providers such as domestic help or vendor etc those form part of informal economy do not command good wages and other benefits. They are in the Unorganized Tertiary labour market & hence do not enjoy good bargaining power.
10.3 LABOUR MARKET SEGMENTATION IN INDIA
Labour market is much less homogeneous and integrated in
India than in developed countries. As a matter of fact it is fragmented into several segments and entry to certain segments. A labour market is segmented if it consists of sub-groups with little or no crossover capability or possibility. Segmentation can result in different groups of labour; for example man and woman receiving different wages for doing the same work; doctors and dress designers work in entirely different markets etc.
Alfred Marshall had first introduced the idea of ‗non-competition groups‘ in the labour-market in 1880s. Segmentation within the labour market occurs on account of difference due to gender, caste, region and human capital requirement so that it results in one or individual being relegated to secondary market or specific occupation and the others get entry into the primary market or occupation of their choice. Segmentation in the labour market is an outcome of sustained discrimination in the society over along period of time.
170
According to V.N.Kothari, ―Labour market segmentation refers to the distinctions in the nature of employment opportunities emanation in different sectors of the labour market. The quality of employment opportunities is judged by stability and security of jobs, emoluments, working conditions and career prospects. Different sectors in the economy generate jobs of varying quantities judged by the above criteria. The access to these jobs and the matter of selection to these jobs give rise to labour market processes which generates distinct labour market segments. Labour market segmentation may involve discrimination but discrimination by itself does not involve segmentation.‖ According to L. K. Despande, ― Labour market segmentation is a historical process whereby political and economic forces encourage division of labour market into separate sub-markets possessing different characteristic and behavioral rules.‖ 10.3.1 Classification of Labour Market Segmentation: Many theories have explained the emergence and persistence of segmented labour markets. Marshall‘s idea of ―non-competing group‖ has been developed into Labour Market-Segmentation. Theory which itself is being Studied under the two key formulations viz,
(i) The Dual (or Split) Labour Market Theory and
(ii) The Internal Labour Market Theory.
Both of these theories were developed in the United States of America in 1971 and 1975 respectively. (i) The Dual Labour-Market Theory (1971): This theory revolves round the identification of split between a Primary Sector and Secondary Sector with quite different wage and employment characteristics and processes. In a Primary Sector the workforce as a whole is motivated to serve their employers, because of higher wages, health benefits, and pension and job security. The Primary Sector generally contains the higher-glade, higher status, and better-paid jobs, with employers who offer the best terms and conditions. This sector is sometimes sub-divided into an upper and lower level. The primary workers try to prove themselves to their employers by portraying their skills and educational credentials. In Secondary Labour Market, everything is under complete control of the management. Workers in this job type either leave or are replaced quickly. The secondary jobs are mostly low-skilled,
171
require relatively little training, and can be learnt relatively quickly on the job. Wages in this market are low, and terms and conditions of the jobs are poor. (ii) The Internal Labour Market Theory (1975): The Internal Labour Market theory can be classified into Primary internal labour market and secondary internal labour market. Jobs in the Primary internal segment are those typical of the hard care of stable employees in a firm, need long on-the-job training in firm-specific skills, have security and good promotion prospects, a high span of discretion, and high material rewards. The Secondary internal Sector offer jobs that are generally low grade but with some on the job training, security and promotion prospectus. (iii) Other Classification of Labour Market Segmentation in India:
(A) Urban and Rural Labour Market Segmentation
(B) Organized and Unorganized Labour Market
(C) Gender-based Labour Market Segmentation
(D) Caste-wise Segmented Labour Market
(E) Education-wise Segmented Labour Market
(F) Public Sector, Private Sector, Joint Sector Labour Market Segmentation
(G) Risky Occupations (A) Urban and Rural Labour Market Segmentation:-
L.K.Deshpande Gerry Rodgers and John Harris have analyzed segmentation in urban labour market. In his study of labour market in Bombay, L.K.Deshpande refers to three segments:
(i) Factory Sector
(ii) Establishment Sector
(iii) Casual Labour Sector including self-employment as porters, rag pickers, shoe-shines, petty vendors etc.
Deshpande‘s classification of the urban sector is closer to
urban reality. He is of the opinion that rural stratification has been
carried over to urban labour market segmentation. He states, ―
Segmentation of the urban market begins in the rural areas. The
labour force is best differentiated by their ownership of assets,
tangible and intangible. Those who own no or inadequate physical
and human capital, end up in the periphery market as marginal
works. Others enter into the ‗better‘ sections of the urban labour
172
market. The process of migration and job-search play their role in
pre-entry discrimination against the poor. Lack of occupational and
inter-sectoral mobility keeps the majority of the poor combined to
the periphery.‖
The Urban labour market segmentation has ensured that
real earning of the factory labour are the highest, followed by the
earnings of the labour in the small establishment sector. The real
earnings of the casual labour are extremely low and have not
increased over the years.
Gerry Rodgers has suggested a seven-fold classification of
urban labour market as follow:
(i) Protected regular wage work
(ii) Unprotected long-term wage work
(iii) Unprotected regular short-term wage work
(iv) Unprotected irregular wage work
(v) Independent wage work
(vi) Small Capital owning Self-employed
(vii) Marginal Self-employed without capital
S.Joshi and T.Mulla have divided the urban labour force into three categories; (i) the modern labour force (ii) the informal labour force and (iii) the subsistence labour force which includes household servants, street vendors, people involved in repairing etc.
Rural Labour Market: Rural or agricultural labour market is the largest segment of the labour market in India. However, it is not a homogeneous and integrated unit. Asset distribution in terms of land ownership and caste hierarchy are very important in rural labour markets. Rural labour market mainly takes two forms: (i) Agricultural Labour Market (ii) Non-Agricultural Labour Market
Agricultural Labour can be further classified into four categories; (a) Landless labourers who are attached to the landlords, (b) Landless labourers who are independent but work for others, (c) Petty farmers owing small land holdings who devote their time working for others, and (d) Farmers who have economic land holdings but who have one or more of their children and dependent working for other prosperous farmers.
Besides, agricultural employment is seasonal, cyclical casual or even contractual. Majority of agricultural labour are uneducated and even illiterate and are thus more exploited.
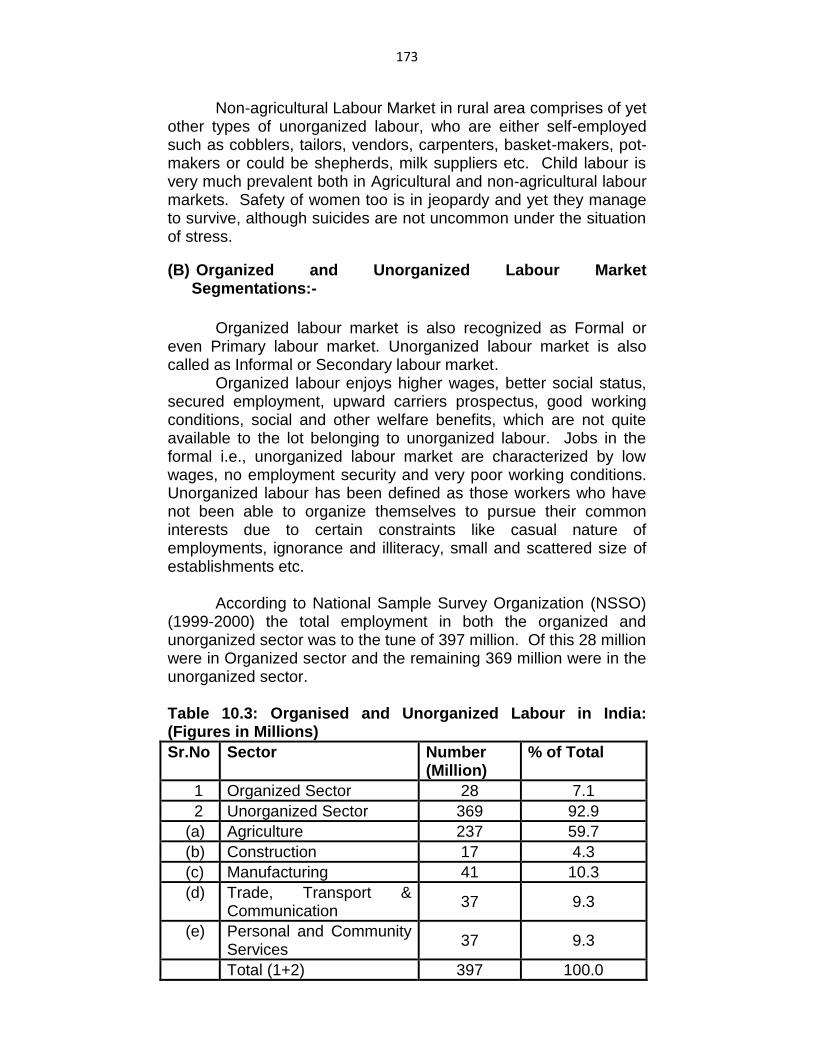
173
Non-agricultural Labour Market in rural area comprises of yet other types of unorganized labour, who are either self-employed such as cobblers, tailors, vendors, carpenters, basket-makers, pot-makers or could be shepherds, milk suppliers etc. Child labour is very much prevalent both in Agricultural and non-agricultural labour markets. Safety of women too is in jeopardy and yet they manage to survive, although suicides are not uncommon under the situation of stress.
(B) Organized and Unorganized Labour Market Segmentations:-
Organized labour market is also recognized as Formal or even Primary labour market. Unorganized labour market is also called as Informal or Secondary labour market. Organized labour enjoys higher wages, better social status, secured employment, upward carriers prospectus, good working conditions, social and other welfare benefits, which are not quite available to the lot belonging to unorganized labour. Jobs in the formal i.e., unorganized labour market are characterized by low wages, no employment security and very poor working conditions. Unorganized labour has been defined as those workers who have not been able to organize themselves to pursue their common interests due to certain constraints like casual nature of employments, ignorance and illiteracy, small and scattered size of establishments etc.
According to National Sample Survey Organization (NSSO) (1999-2000) the total employment in both the organized and unorganized sector was to the tune of 397 million. Of this 28 million were in Organized sector and the remaining 369 million were in the unorganized sector. Table 10.3: Organised and Unorganized Labour in India: (Figures in Millions)
Sr.No Sector Number (Million)
% of Total
1 Organized Sector 28 7.1
2 Unorganized Sector 369 92.9
(a) Agriculture 237 59.7
(b) Construction 17 4.3
(c) Manufacturing 41 10.3
(d) Trade, Transport & Communication
37 9.3
(e) Personal and Community Services
37 9.3
Total (1+2) 397 100.0
174
Source: National Sample Survey (1999-2000 )
From the above table, we can conclude that organized
sector accounted for 7.1% of total employment. Unorganized sector accounted for 92.9% of the total employment. In the Unorganized sector again 59.7% were employed in agriculture, 4.3% in construction, 10.3% in manufacturing, 9.3 % in trade, transport and communication and another 9.3% in personal and community services.
In the organized sector 69% were employed in the public
sector, whereas 31 % were employed in private sector, This shows that the share of organized private sector in total employment was just 2.2% whereas that of organized public sector was to the tune of 4.9%. (C) Gender-based Segmentation in Labour Market:
Women constitute a significant part of the work–force in India today. Until recently women were assumed to be home-maker and house-keepers; the role certainly played well. They were responsible mainly for upbringing of children and were the custodians of maintaining the family welfare of all, young and aged. Time permitting, they would involve in some social work or even undertake part-time work to enhance family income. They have been playing a conservative but constructive role.
To quote Sudha Deshpande; ―Women form one such group
which is prevented from having access to all jobs, primarily because they are women,‖ Besides, ―Women workers in handlooms, power looms and other small scale industries sector suffer from greater discrimination than in the large factory sector. Being illiterate and having no trade union support they are stuck in lower paid dead-end-jobs with no job prospects. Their extreme poverty leaves them no option but to cling to these jobs.‖
Of late, may be mainly due to being educated, Women have
preferred to be employed on full time basis. They have started specializing in different areas acquiring technical knowledge. They have been excelling in whatever work they have been doing outside home; besides perhaps even their regular domestic duties. A few of them have acquired very high status in their area of work. The Census of India (2001) has registered 25.60 per cent of female population as workers numbering 127.22 million in absolute terms out of a total female population of 496 million. The majority of women workers are employed in the rural areas. Amongst rural women workers, 87 percent are employed in agriculture as labourers and cultivators. Amongst the women workers in the urban
175
areas, 80% are employed in unorganized sector like household industries, petty trades and services, building and construction, etc.
Gender based discrimination implies that women are paid less and their services conditions are worse though their skill, qualifications and productivity may not be different from those of the men. Economists while explaining gender based discrimination attribute women‘s low wages to their lower productivity and overcrowding in inferior jobs. Sociologists believe that the subordination of women in the patriarchal system leads to their subordination in the labour market. (c) Caste-Wise Segmented Labour Market:
Caste-based labour market segmentation in India has been from the very ancient times. Traditionally, the Indian society was divided into four district groups, viz, the Brahmins, the kshatriyas, the vaishyas and shudras, each groups was to flood its predesigned nature of work, Shudras belonged to the lowest group. They were debarred from acquiring education or any form of skilled knowledge. They were suppsed to be doing low paid Jobs of harijans. Even today we have SC, ST, DT, NT belonging to backward class. No doubt in recent times the government has taken certain steps through the Reservation and Quota System to break through the traditional cast-based labour market segmentation. Same has been true in case of colour based and communication based labour market Segmentation. Even here efforts have been made to keep aside caste, colour, creed, Communication (language wise) segmentation aside and give equal opportunity to all these who deserve to be employed. Beside the above mentioned and broadly discussed Labour Market Segmentation. We can think of segmentation on the basis of
a) Education – viz., Educated, Uneducated, Less Educated
b) Literacy – viz., Literate, illiterate, less literate
c) Skill – viz., skilled, semi-skilled and unskilled
d) Productive and Unproductive labour
e) Public Sector, Private Sector and Joint Sector workers
10.4 ROLE OF TRADE UNIONS
Trade unions are voluntary organizations of works formed to
promote and protect the interests of workers through collective
bargaining. According to Karl Marx, the beginning of factory
system resulted in the emergence of trade unions. Workers started
176
organizing themselves into unions when factories started emerging
on big scale.
The Primary role of Trade Union is to protect and to promote
the interest of the workers by striving to improve the terms and
conditions of employment, to secure better wages and to make
better the working conditions of the workers.
10.4.1 History of Trade Union Movement in India:
The birth of Trade Union movement in India may be tracked
back to the first quarter of the 20th century. In 1920, the All-India
Trade Union Congress (AITUC) was set up to represent the interest
of the workers and also to co-ordinate the activities of all labour
organizations in the country. In 1926, the Trade Union act was
passed in India. The act gave a legal status to the registered trade
unions. Now the Trade Union movement has become more
widespread and also has taken deep roots. It is now better
organized and is on a more permanent footing.
10.4.2 Functions of Trade Union:
The important role of functions of Trade union as given by National
Commission on Labour are:
i) To secure for workers fair wages.
ii) To Safeguard Security of tenure and improve conditions of service
iii) To enlarge opportunities for promotions and training
iv) To improve working and living conditions.
v) To provide for educational, cultural and recreational facilities
vi) To cooperate in and facilitate technological advance by bordering the understanding of workers on its underlying issues.
vii) To promote identity of interest of the workers with their industry.
viii) To offer responsive cooperation in improving levels of production and productivity, discipline and high standard of quality; and generally
ix) To promote individual and Collective Welfare.
177
Beside these basic roles of the trade union the commission has also entrusted the following responsibilities on the Trade Union.
1) Promotion of national integration
2) Generally, influencing the socio-economic policies of the Community through active participation in their formulation at various levels; and
3) Instilling in their members a sense of responsibility towards industry and the community.
10.4.3 Impact of Trade Union: There are different views about the economic impact of trade unions. The unions can promote stability in the workforce by establishing grievance and arbitration procedures. An overall improvement in industrial relations enhances the productivity of workers. Further, if the union involves workers in activities that improve efficiency, the trade union can contribute to higher efficiency and productivity. On the other hand, the opponents of trade unions see the unions as monopolists who try to improve wages and working conditions of their members at the expense of consumers and unorganized workers. Further, trade union use, sometimes, their political power against structural adjustments in the economy. The trade unions in India have organized country wide several strikes to oppose industrial restructuring is outward orientations and the reform of state enterprises. The trade union has succeeded in drawing public attention to the inadequacy and drawbacks of the present social and economic order prevailing in the country. It has exposed the hardships which a large number of people have to bear at present.
10.5 IMPACT OF LIBERALIZATION ON EMPLOYMENT
The liberalization is one of the most important development
in the world economy. As a consequence the world economy is increasingly globalizing by the growing integration of national economies thorough trade and investment flows. Liberalization, privatization and globalization towards the turn of the 20th century have collectively played their role in reshaping the industrial scenario in India. The process of economic reforms in India was launched in July, 1991. It was a bold, decisive and imaginative attempt to put an end to the quota, permit and license system characterized by excessive regulation and control.
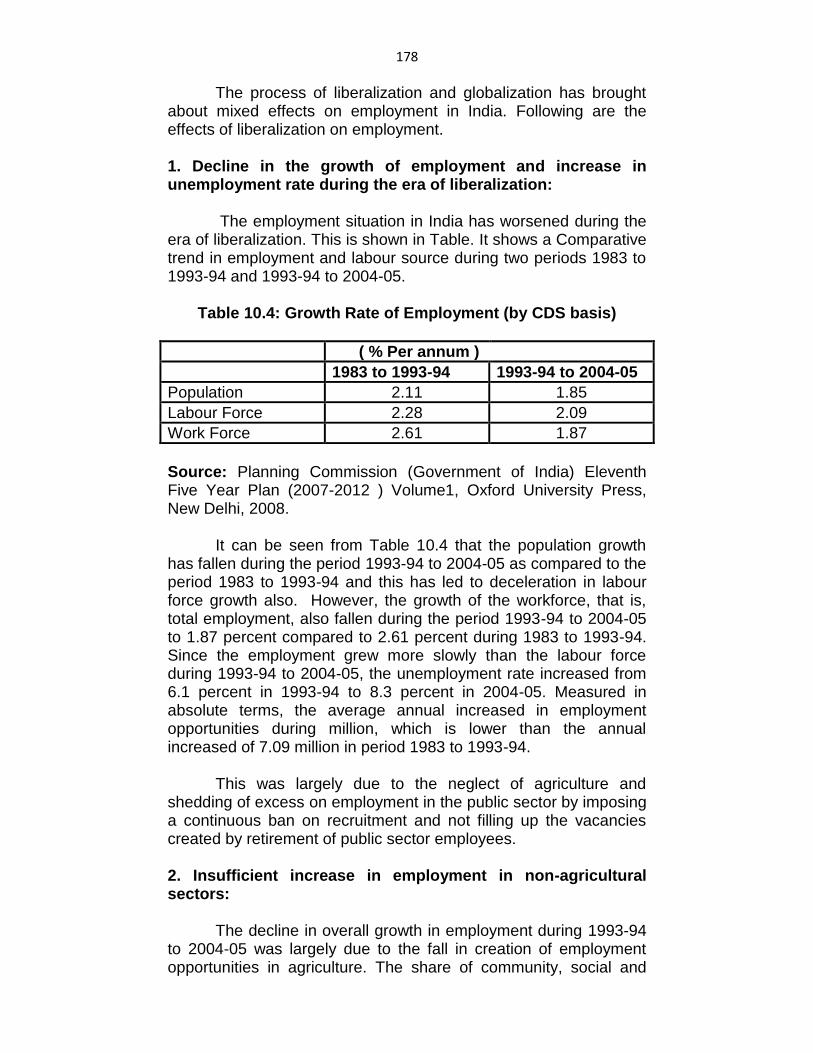
178
The process of liberalization and globalization has brought about mixed effects on employment in India. Following are the effects of liberalization on employment. 1. Decline in the growth of employment and increase in unemployment rate during the era of liberalization: The employment situation in India has worsened during the era of liberalization. This is shown in Table. It shows a Comparative trend in employment and labour source during two periods 1983 to 1993-94 and 1993-94 to 2004-05.
Table 10.4: Growth Rate of Employment (by CDS basis)
( % Per annum )
1983 to 1993-94 1993-94 to 2004-05
Population 2.11 1.85
Labour Force 2.28 2.09
Work Force 2.61 1.87
Source: Planning Commission (Government of India) Eleventh Five Year Plan (2007-2012 ) Volume1, Oxford University Press, New Delhi, 2008. It can be seen from Table 10.4 that the population growth has fallen during the period 1993-94 to 2004-05 as compared to the period 1983 to 1993-94 and this has led to deceleration in labour force growth also. However, the growth of the workforce, that is, total employment, also fallen during the period 1993-94 to 2004-05 to 1.87 percent compared to 2.61 percent during 1983 to 1993-94. Since the employment grew more slowly than the labour force during 1993-94 to 2004-05, the unemployment rate increased from 6.1 percent in 1993-94 to 8.3 percent in 2004-05. Measured in absolute terms, the average annual increased in employment opportunities during million, which is lower than the annual increased of 7.09 million in period 1983 to 1993-94. This was largely due to the neglect of agriculture and shedding of excess on employment in the public sector by imposing a continuous ban on recruitment and not filling up the vacancies created by retirement of public sector employees. 2. Insufficient increase in employment in non-agricultural sectors: The decline in overall growth in employment during 1993-94 to 2004-05 was largely due to the fall in creation of employment opportunities in agriculture. The share of community, social and
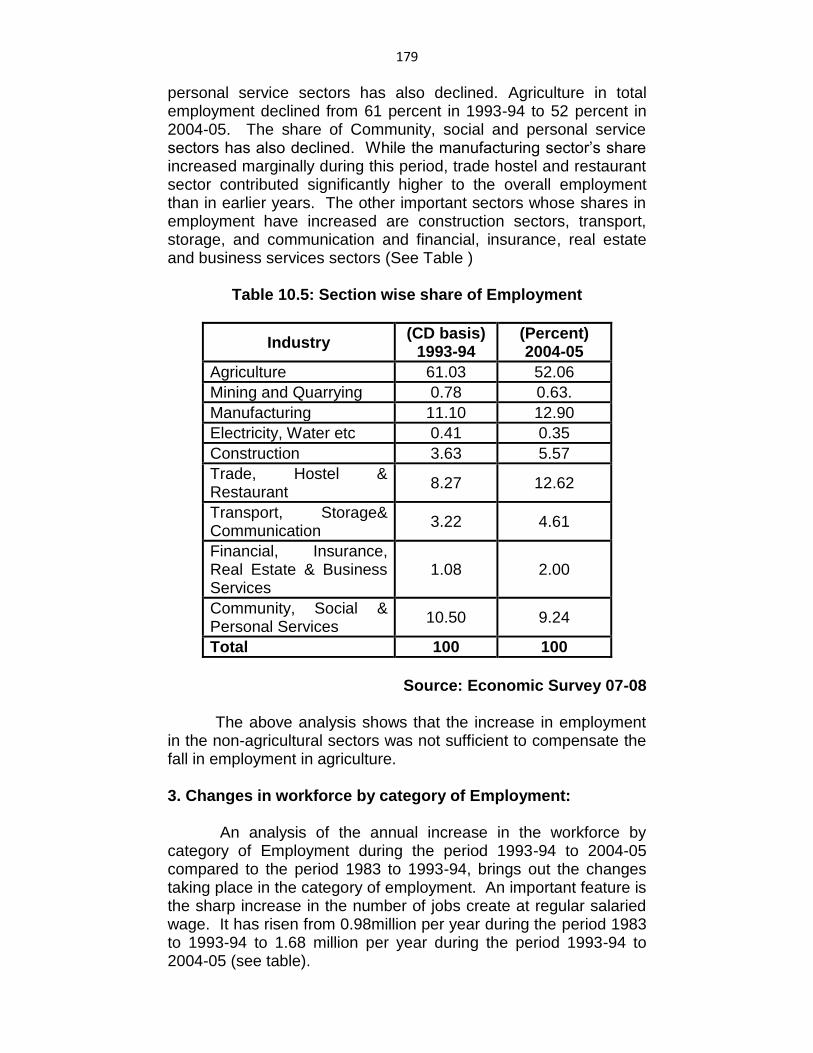
179
personal service sectors has also declined. Agriculture in total employment declined from 61 percent in 1993-94 to 52 percent in 2004-05. The share of Community, social and personal service sectors has also declined. While the manufacturing sector‘s share increased marginally during this period, trade hostel and restaurant sector contributed significantly higher to the overall employment than in earlier years. The other important sectors whose shares in employment have increased are construction sectors, transport, storage, and communication and financial, insurance, real estate and business services sectors (See Table )
Table 10.5: Section wise share of Employment
Industry (CD basis)
1993-94 (Percent) 2004-05
Agriculture 61.03 52.06
Mining and Quarrying 0.78 0.63.
Manufacturing 11.10 12.90
Electricity, Water etc 0.41 0.35
Construction 3.63 5.57
Trade, Hostel & Restaurant
8.27 12.62
Transport, Storage& Communication
3.22 4.61
Financial, Insurance, Real Estate & Business Services
1.08 2.00
Community, Social & Personal Services
10.50 9.24
Total 100 100
Source: Economic Survey 07-08
The above analysis shows that the increase in employment in the non-agricultural sectors was not sufficient to compensate the fall in employment in agriculture. 3. Changes in workforce by category of Employment: An analysis of the annual increase in the workforce by category of Employment during the period 1993-94 to 2004-05 compared to the period 1983 to 1993-94, brings out the changes taking place in the category of employment. An important feature is the sharp increase in the number of jobs create at regular salaried wage. It has risen from 0.98million per year during the period 1983 to 1993-94 to 1.68 million per year during the period 1993-94 to 2004-05 (see table).
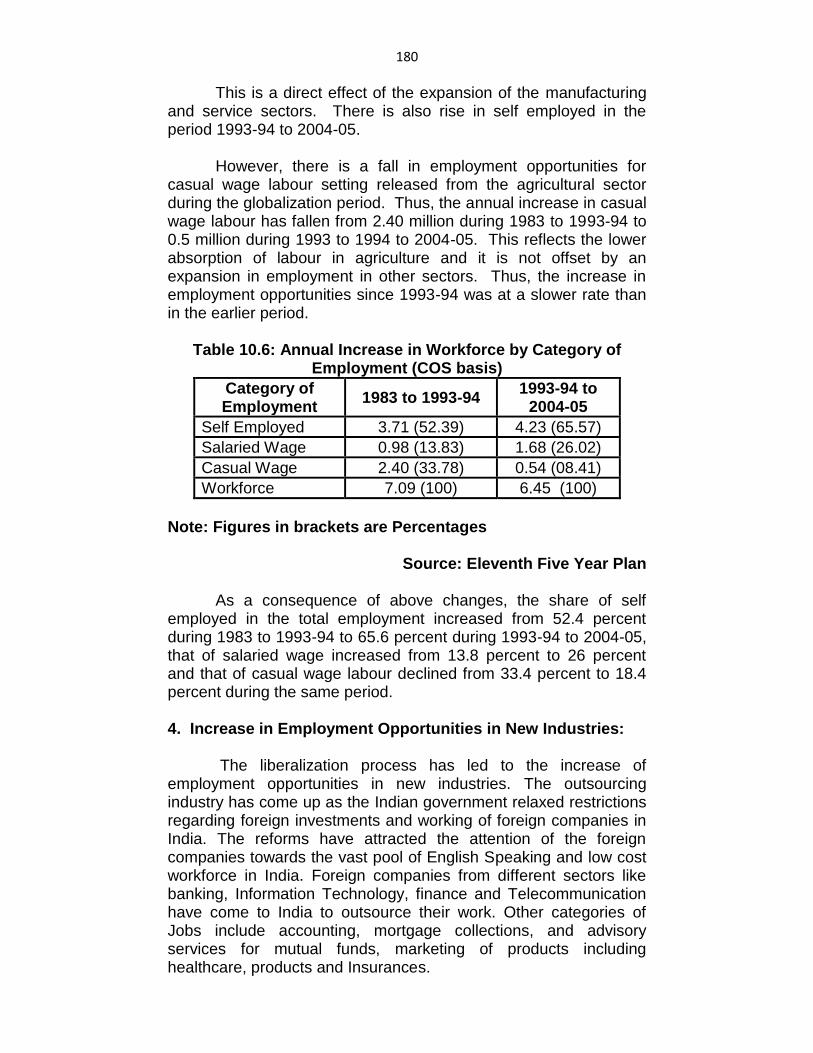
180
This is a direct effect of the expansion of the manufacturing and service sectors. There is also rise in self employed in the period 1993-94 to 2004-05. However, there is a fall in employment opportunities for casual wage labour setting released from the agricultural sector during the globalization period. Thus, the annual increase in casual wage labour has fallen from 2.40 million during 1983 to 1993-94 to 0.5 million during 1993 to 1994 to 2004-05. This reflects the lower absorption of labour in agriculture and it is not offset by an expansion in employment in other sectors. Thus, the increase in employment opportunities since 1993-94 was at a slower rate than in the earlier period.
Table 10.6: Annual Increase in Workforce by Category of Employment (COS basis)
Category of Employment
1983 to 1993-94 1993-94 to
2004-05
Self Employed 3.71 (52.39) 4.23 (65.57)
Salaried Wage 0.98 (13.83) 1.68 (26.02)
Casual Wage 2.40 (33.78) 0.54 (08.41)
Workforce 7.09 (100) 6.45 (100)
Note: Figures in brackets are Percentages
Source: Eleventh Five Year Plan
As a consequence of above changes, the share of self employed in the total employment increased from 52.4 percent during 1983 to 1993-94 to 65.6 percent during 1993-94 to 2004-05, that of salaried wage increased from 13.8 percent to 26 percent and that of casual wage labour declined from 33.4 percent to 18.4 percent during the same period. 4. Increase in Employment Opportunities in New Industries: The liberalization process has led to the increase of employment opportunities in new industries. The outsourcing industry has come up as the Indian government relaxed restrictions regarding foreign investments and working of foreign companies in India. The reforms have attracted the attention of the foreign companies towards the vast pool of English Speaking and low cost workforce in India. Foreign companies from different sectors like banking, Information Technology, finance and Telecommunication have come to India to outsource their work. Other categories of Jobs include accounting, mortgage collections, and advisory services for mutual funds, marketing of products including healthcare, products and Insurances.
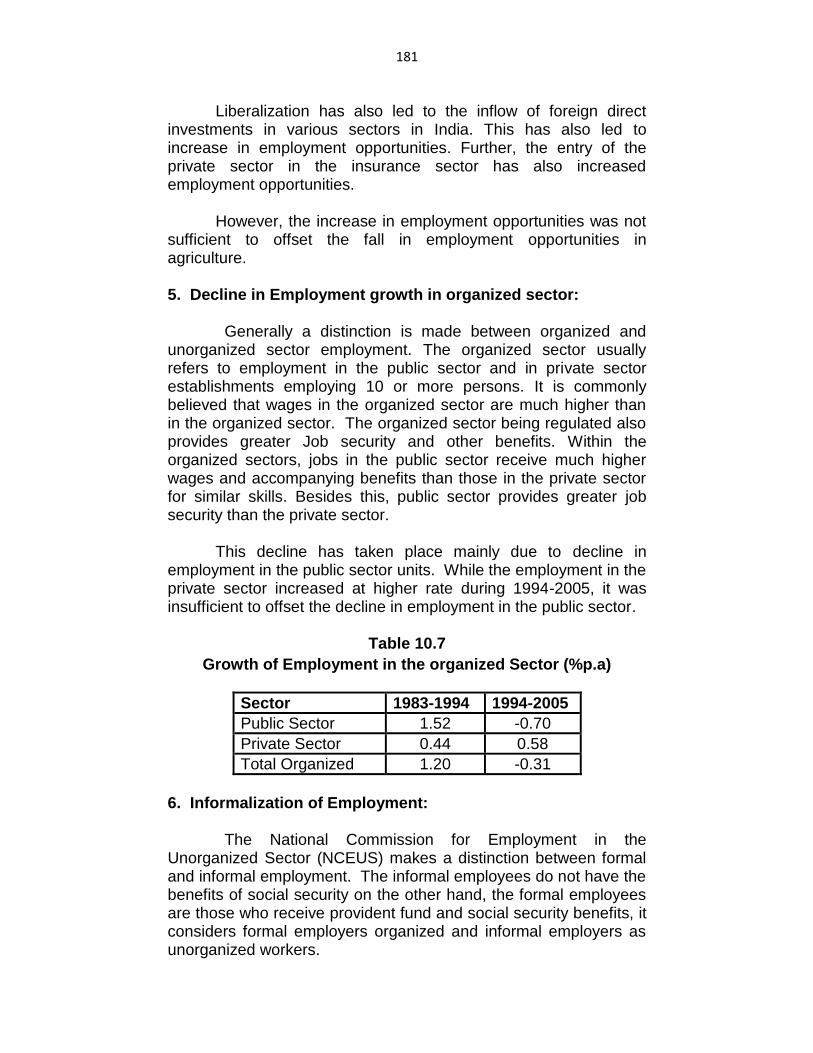
181
Liberalization has also led to the inflow of foreign direct investments in various sectors in India. This has also led to increase in employment opportunities. Further, the entry of the private sector in the insurance sector has also increased employment opportunities. However, the increase in employment opportunities was not sufficient to offset the fall in employment opportunities in agriculture. 5. Decline in Employment growth in organized sector: Generally a distinction is made between organized and unorganized sector employment. The organized sector usually refers to employment in the public sector and in private sector establishments employing 10 or more persons. It is commonly believed that wages in the organized sector are much higher than in the organized sector. The organized sector being regulated also provides greater Job security and other benefits. Within the organized sectors, jobs in the public sector receive much higher wages and accompanying benefits than those in the private sector for similar skills. Besides this, public sector provides greater job security than the private sector. This decline has taken place mainly due to decline in employment in the public sector units. While the employment in the private sector increased at higher rate during 1994-2005, it was insufficient to offset the decline in employment in the public sector.
Table 10.7
Growth of Employment in the organized Sector (%p.a)
Sector 1983-1994 1994-2005
Public Sector 1.52 -0.70
Private Sector 0.44 0.58
Total Organized 1.20 -0.31
6. Informalization of Employment: The National Commission for Employment in the Unorganized Sector (NCEUS) makes a distinction between formal and informal employment. The informal employees do not have the benefits of social security on the other hand, the formal employees are those who receive provident fund and social security benefits, it considers formal employers organized and informal employers as unorganized workers.
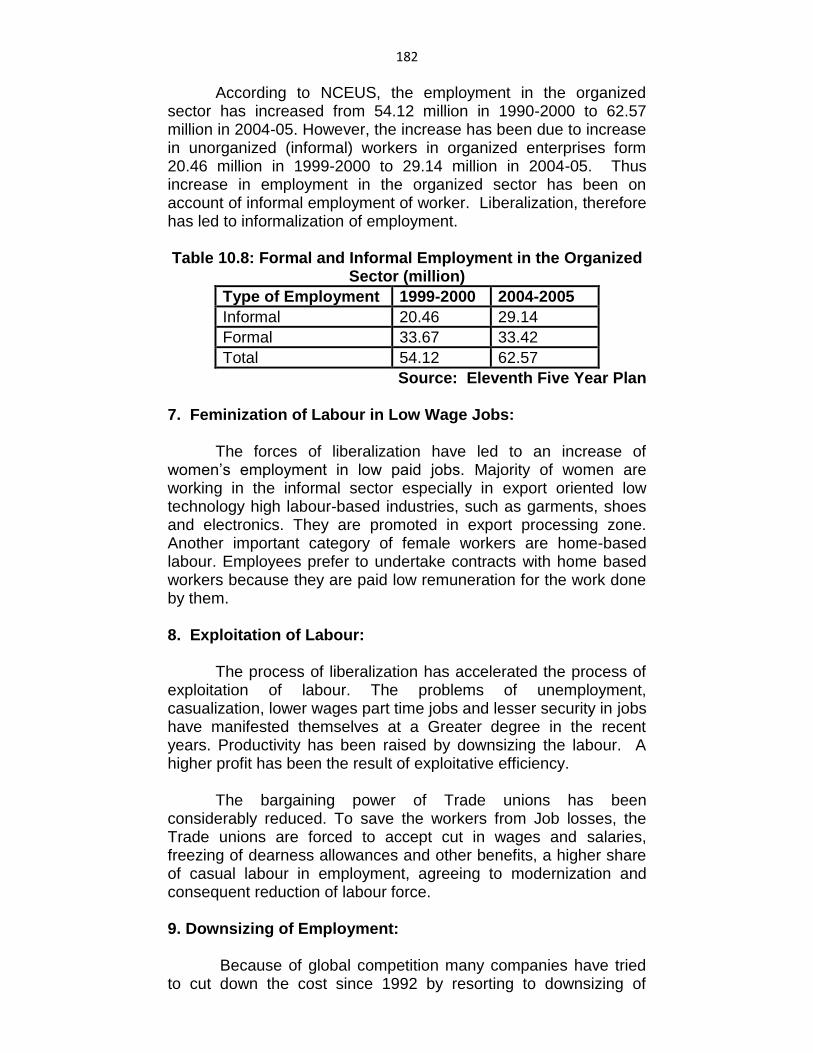
182
According to NCEUS, the employment in the organized sector has increased from 54.12 million in 1990-2000 to 62.57 million in 2004-05. However, the increase has been due to increase in unorganized (informal) workers in organized enterprises form 20.46 million in 1999-2000 to 29.14 million in 2004-05. Thus increase in employment in the organized sector has been on account of informal employment of worker. Liberalization, therefore has led to informalization of employment. Table 10.8: Formal and Informal Employment in the Organized
Sector (million)
Type of Employment 1999-2000 2004-2005
Informal 20.46 29.14
Formal 33.67 33.42
Total 54.12 62.57
Source: Eleventh Five Year Plan 7. Feminization of Labour in Low Wage Jobs: The forces of liberalization have led to an increase of women‘s employment in low paid jobs. Majority of women are working in the informal sector especially in export oriented low technology high labour-based industries, such as garments, shoes and electronics. They are promoted in export processing zone. Another important category of female workers are home-based labour. Employees prefer to undertake contracts with home based workers because they are paid low remuneration for the work done by them. 8. Exploitation of Labour: The process of liberalization has accelerated the process of exploitation of labour. The problems of unemployment, casualization, lower wages part time jobs and lesser security in jobs have manifested themselves at a Greater degree in the recent years. Productivity has been raised by downsizing the labour. A higher profit has been the result of exploitative efficiency. The bargaining power of Trade unions has been considerably reduced. To save the workers from Job losses, the Trade unions are forced to accept cut in wages and salaries, freezing of dearness allowances and other benefits, a higher share of casual labour in employment, agreeing to modernization and consequent reduction of labour force. 9. Downsizing of Employment: Because of global competition many companies have tried to cut down the cost since 1992 by resorting to downsizing of
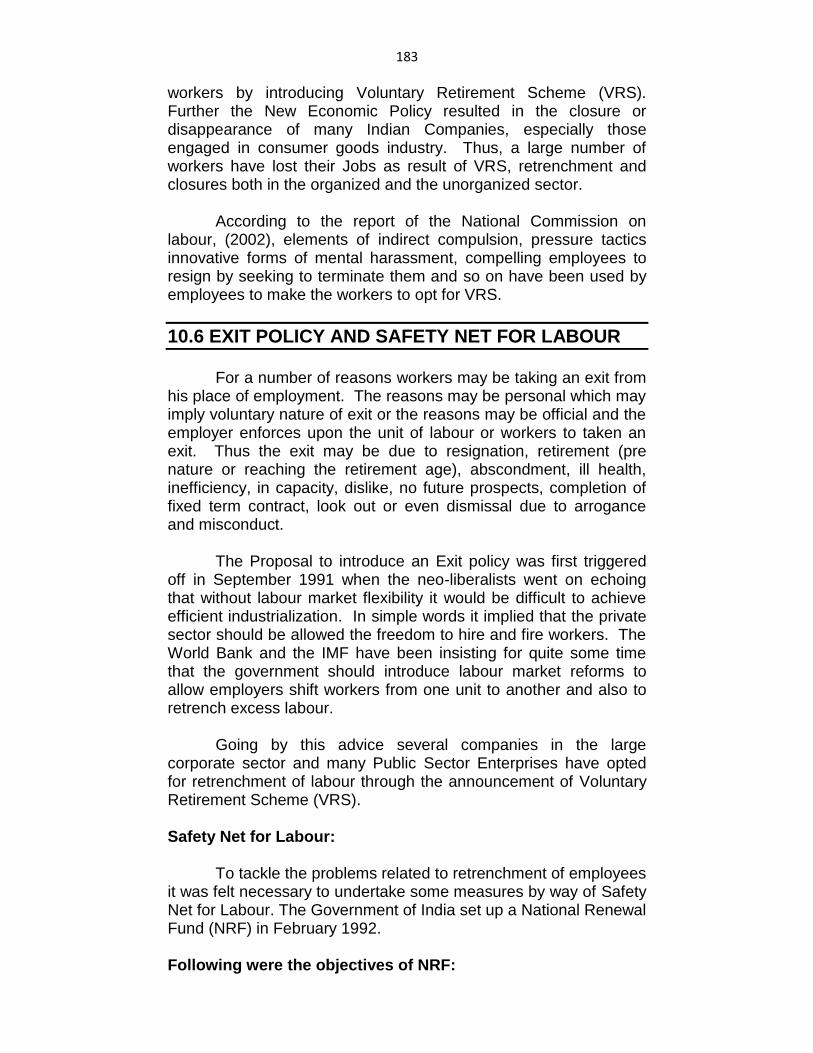
183
workers by introducing Voluntary Retirement Scheme (VRS). Further the New Economic Policy resulted in the closure or disappearance of many Indian Companies, especially those engaged in consumer goods industry. Thus, a large number of workers have lost their Jobs as result of VRS, retrenchment and closures both in the organized and the unorganized sector. According to the report of the National Commission on labour, (2002), elements of indirect compulsion, pressure tactics innovative forms of mental harassment, compelling employees to resign by seeking to terminate them and so on have been used by employees to make the workers to opt for VRS.
10.6 EXIT POLICY AND SAFETY NET FOR LABOUR
For a number of reasons workers may be taking an exit from his place of employment. The reasons may be personal which may imply voluntary nature of exit or the reasons may be official and the employer enforces upon the unit of labour or workers to taken an exit. Thus the exit may be due to resignation, retirement (pre nature or reaching the retirement age), abscondment, ill health, inefficiency, in capacity, dislike, no future prospects, completion of fixed term contract, look out or even dismissal due to arrogance and misconduct. The Proposal to introduce an Exit policy was first triggered off in September 1991 when the neo-liberalists went on echoing that without labour market flexibility it would be difficult to achieve efficient industrialization. In simple words it implied that the private sector should be allowed the freedom to hire and fire workers. The World Bank and the IMF have been insisting for quite some time that the government should introduce labour market reforms to allow employers shift workers from one unit to another and also to retrench excess labour. Going by this advice several companies in the large corporate sector and many Public Sector Enterprises have opted for retrenchment of labour through the announcement of Voluntary Retirement Scheme (VRS). Safety Net for Labour:
To tackle the problems related to retrenchment of employees it was felt necessary to undertake some measures by way of Safety Net for Labour. The Government of India set up a National Renewal Fund (NRF) in February 1992. Following were the objectives of NRF:
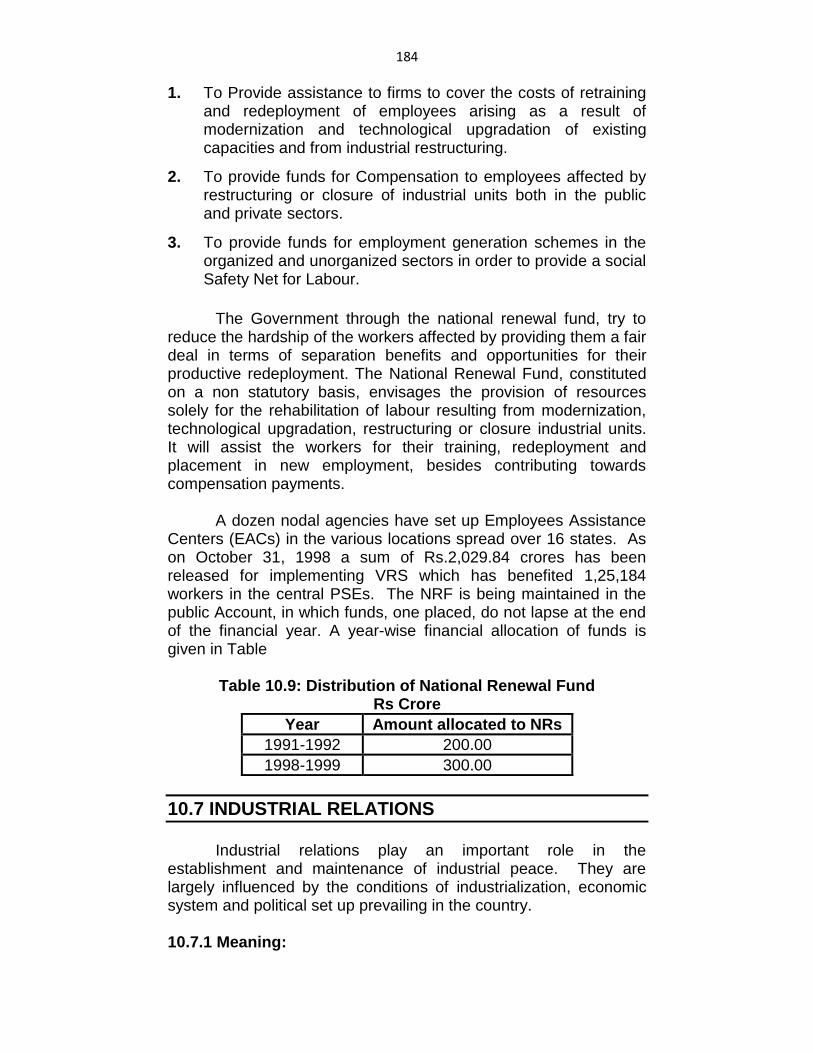
184
1. To Provide assistance to firms to cover the costs of retraining and redeployment of employees arising as a result of modernization and technological upgradation of existing capacities and from industrial restructuring.
2. To provide funds for Compensation to employees affected by restructuring or closure of industrial units both in the public and private sectors.
3. To provide funds for employment generation schemes in the organized and unorganized sectors in order to provide a social Safety Net for Labour.
The Government through the national renewal fund, try to reduce the hardship of the workers affected by providing them a fair deal in terms of separation benefits and opportunities for their productive redeployment. The National Renewal Fund, constituted on a non statutory basis, envisages the provision of resources solely for the rehabilitation of labour resulting from modernization, technological upgradation, restructuring or closure industrial units. It will assist the workers for their training, redeployment and placement in new employment, besides contributing towards compensation payments. A dozen nodal agencies have set up Employees Assistance Centers (EACs) in the various locations spread over 16 states. As on October 31, 1998 a sum of Rs.2,029.84 crores has been released for implementing VRS which has benefited 1,25,184 workers in the central PSEs. The NRF is being maintained in the public Account, in which funds, one placed, do not lapse at the end of the financial year. A year-wise financial allocation of funds is given in Table
Table 10.9: Distribution of National Renewal Fund Rs Crore
Year Amount allocated to NRs
1991-1992 200.00
1998-1999 300.00
10.7 INDUSTRIAL RELATIONS
Industrial relations play an important role in the
establishment and maintenance of industrial peace. They are largely influenced by the conditions of industrialization, economic system and political set up prevailing in the country. 10.7.1 Meaning:

185
Industrial Relations refer to the nature of co-operation between workers and the employers, sinking all the possible differences on the job and make the best use of available resources to achieve a win win situation in the area of operation, for ―United they win and divided they fail.‖ In short, the term industrial relations mean the relationship between employers and employees in the day-to-day working of industry. The problems related to wages, bonus, working conditions of employment, etc. gives rise to such relationships. According to Dale Yoder, industrial relations describe the relationships between management and employees or among employees and their organization that grow out of employment. According to him, Industrial relations also include recruitment, selection and training of workers, personal management and collective bargaining, policies and practices related to industrial relations. Industrial relations also deal with the relationship between the state and employers and workers organizations. It also covers the relations of the government with employers, workers and their organizations themselves. 10.7.2 Objectives and Principles of Industrial Relations: The objective of Industrial relations is to facilities production and to safeguard the interest of workers and employers/management by getting their cooperation. This involves regulation of working conditions and the promotion of better understanding between workers and managers. This process can help to avoid strikes and lockouts. A sound industrial relations rest on the following principles
1. A Good labour management relation depends upon the ability of Employees and trade unions to deal with their mutual problems freely, independently and responsibly.
2. The trade union and employers and their organizations should be able to resolve their problems through collective bargaining. Thus, collective bargaining is the corner stone of good industrial Relations.
3. Associating workers and employers organization with the government agencies will be helpful in the consideration of general, public, social and economic measures affecting employers and workers relations.
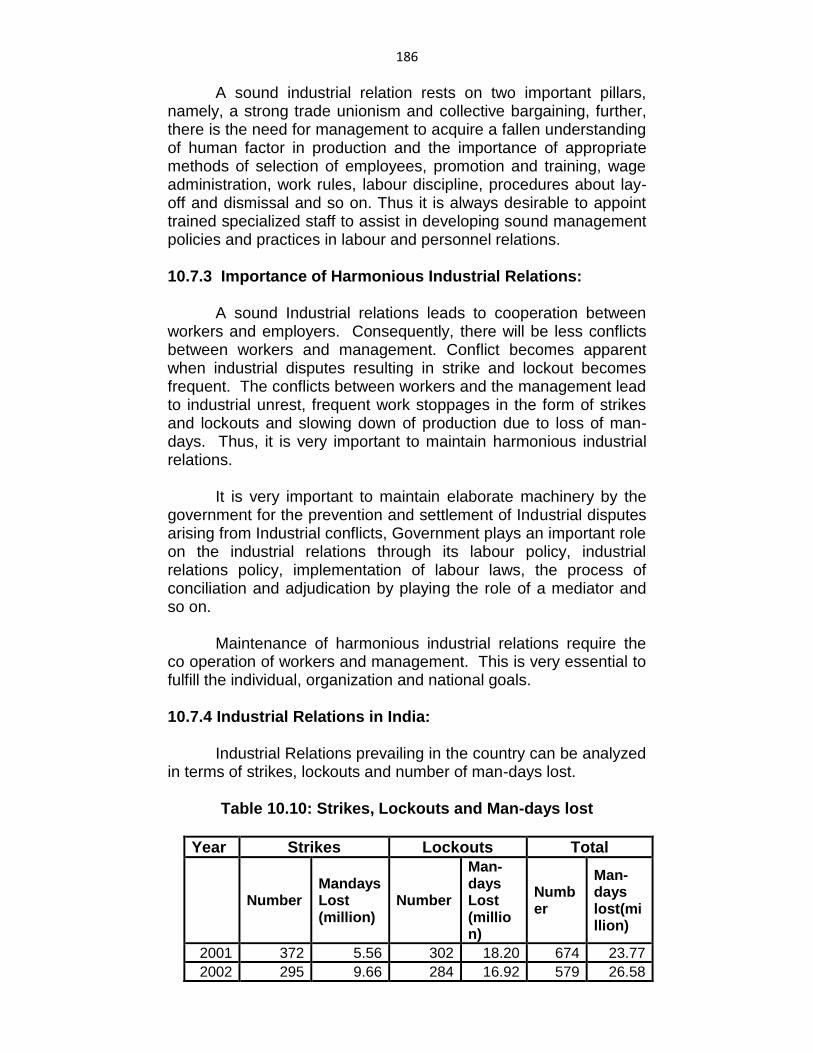
186
A sound industrial relation rests on two important pillars, namely, a strong trade unionism and collective bargaining, further, there is the need for management to acquire a fallen understanding of human factor in production and the importance of appropriate methods of selection of employees, promotion and training, wage administration, work rules, labour discipline, procedures about lay-off and dismissal and so on. Thus it is always desirable to appoint trained specialized staff to assist in developing sound management policies and practices in labour and personnel relations. 10.7.3 Importance of Harmonious Industrial Relations: A sound Industrial relations leads to cooperation between workers and employers. Consequently, there will be less conflicts between workers and management. Conflict becomes apparent when industrial disputes resulting in strike and lockout becomes frequent. The conflicts between workers and the management lead to industrial unrest, frequent work stoppages in the form of strikes and lockouts and slowing down of production due to loss of man-days. Thus, it is very important to maintain harmonious industrial relations. It is very important to maintain elaborate machinery by the government for the prevention and settlement of Industrial disputes arising from Industrial conflicts, Government plays an important role on the industrial relations through its labour policy, industrial relations policy, implementation of labour laws, the process of conciliation and adjudication by playing the role of a mediator and so on. Maintenance of harmonious industrial relations require the co operation of workers and management. This is very essential to fulfill the individual, organization and national goals. 10.7.4 Industrial Relations in India: Industrial Relations prevailing in the country can be analyzed in terms of strikes, lockouts and number of man-days lost.
Table 10.10: Strikes, Lockouts and Man-days lost
Year Strikes Lockouts Total
Number Mandays Lost (million)
Number
Man-days Lost (million)
Number
Man-days lost(million)
2001 372 5.56 302 18.20 674 23.77
2002 295 9.66 284 16.92 579 26.58
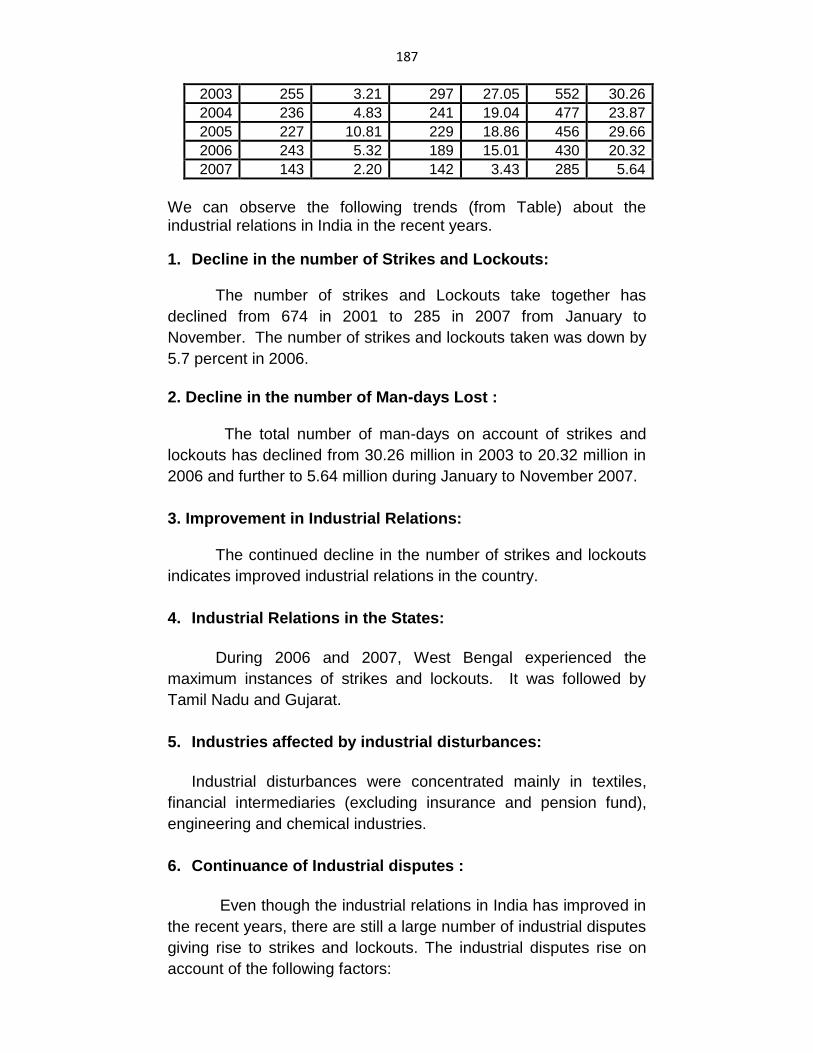
187
2003 255 3.21 297 27.05 552 30.26
2004 236 4.83 241 19.04 477 23.87
2005 227 10.81 229 18.86 456 29.66
2006 243 5.32 189 15.01 430 20.32
2007 143 2.20 142 3.43 285 5.64
We can observe the following trends (from Table) about the industrial relations in India in the recent years.
1. Decline in the number of Strikes and Lockouts:
The number of strikes and Lockouts take together has
declined from 674 in 2001 to 285 in 2007 from January to
November. The number of strikes and lockouts taken was down by
5.7 percent in 2006.
2. Decline in the number of Man-days Lost : The total number of man-days on account of strikes and
lockouts has declined from 30.26 million in 2003 to 20.32 million in
2006 and further to 5.64 million during January to November 2007.
3. Improvement in Industrial Relations:
The continued decline in the number of strikes and lockouts
indicates improved industrial relations in the country.
4. Industrial Relations in the States:
During 2006 and 2007, West Bengal experienced the
maximum instances of strikes and lockouts. It was followed by
Tamil Nadu and Gujarat.
5. Industries affected by industrial disturbances:
Industrial disturbances were concentrated mainly in textiles,
financial intermediaries (excluding insurance and pension fund),
engineering and chemical industries.
6. Continuance of Industrial disputes :
Even though the industrial relations in India has improved in
the recent years, there are still a large number of industrial disputes
giving rise to strikes and lockouts. The industrial disputes rise on
account of the following factors:
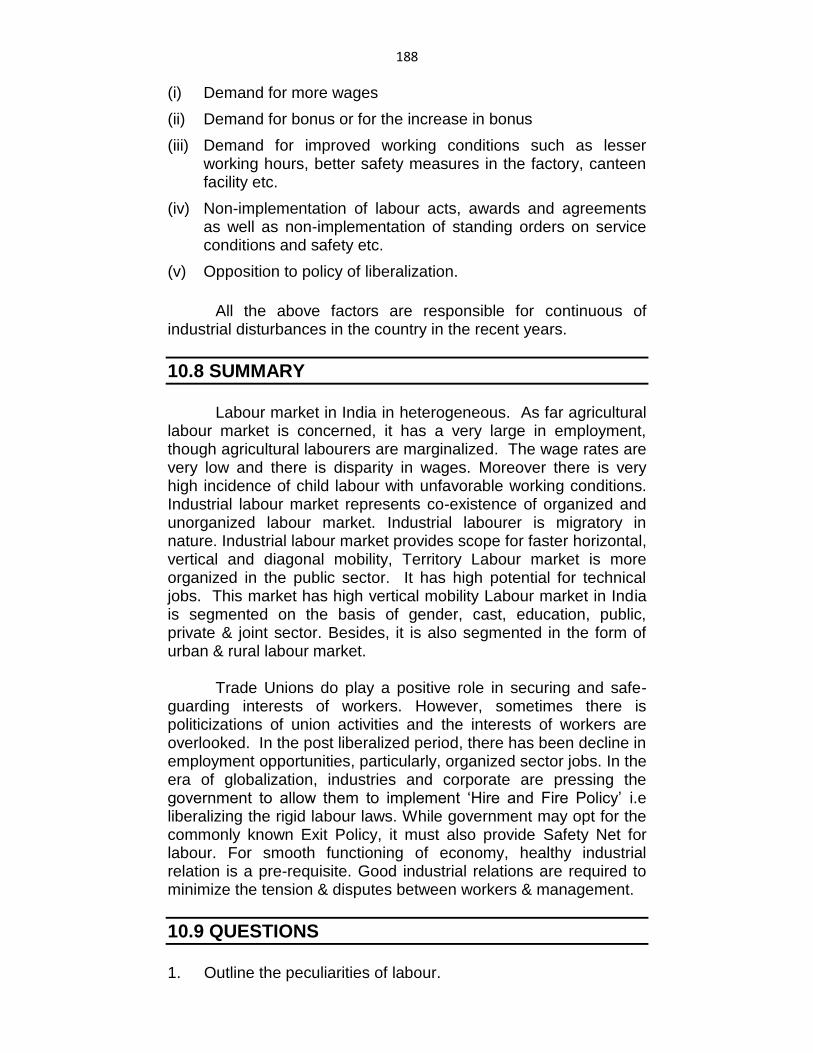
188
(i) Demand for more wages
(ii) Demand for bonus or for the increase in bonus
(iii) Demand for improved working conditions such as lesser working hours, better safety measures in the factory, canteen facility etc.
(iv) Non-implementation of labour acts, awards and agreements as well as non-implementation of standing orders on service conditions and safety etc.
(v) Opposition to policy of liberalization.
All the above factors are responsible for continuous of industrial disturbances in the country in the recent years.
10.8 SUMMARY
Labour market in India in heterogeneous. As far agricultural
labour market is concerned, it has a very large in employment, though agricultural labourers are marginalized. The wage rates are very low and there is disparity in wages. Moreover there is very high incidence of child labour with unfavorable working conditions. Industrial labour market represents co-existence of organized and unorganized labour market. Industrial labourer is migratory in nature. Industrial labour market provides scope for faster horizontal, vertical and diagonal mobility, Territory Labour market is more organized in the public sector. It has high potential for technical jobs. This market has high vertical mobility Labour market in India is segmented on the basis of gender, cast, education, public, private & joint sector. Besides, it is also segmented in the form of urban & rural labour market.
Trade Unions do play a positive role in securing and safe-
guarding interests of workers. However, sometimes there is politicizations of union activities and the interests of workers are overlooked. In the post liberalized period, there has been decline in employment opportunities, particularly, organized sector jobs. In the era of globalization, industries and corporate are pressing the government to allow them to implement ‗Hire and Fire Policy‘ i.e liberalizing the rigid labour laws. While government may opt for the commonly known Exit Policy, it must also provide Safety Net for labour. For smooth functioning of economy, healthy industrial relation is a pre-requisite. Good industrial relations are required to minimize the tension & disputes between workers & management.
10.9 QUESTIONS
1. Outline the peculiarities of labour.
189
2 Discuss the nature & types of labour.
3 Describe the role of trade Union in India.
4 Bring out the impact of liberalization on employment in India.
5 Write an essay on ‗Exit Policy and Safety Net for Labour‘.
6 Outline the causes of Labour discontentment leading to industrial disputes.
7 Explain the meaning, objectives and principles of industrial relations.
190
11
UNEMPLOYMENT IN INDIA
UNIT STRUCTURE
11.0 Objectives
11.1 Introduction
11.2 Meaning and Nature of unemployment in India
11.3 Cause of unemployment in India
11.4 Effect of unemployment in India
11.5 Measures to generate employment in India
11.6 Summary
11.7 Questions
11.0 OBJECTIVES
After reading this unit you will come to know;
The nature and extent of unemployment in India.
Primary causes of rural and urban unemployment.
Policy strategy for employment generation in India.
Socio economic effects of unemployment in India
Government policies to generate employment opportunities in India.
11.1 INTRODUCTION
Unemployment is a situation in which a person who is able and
willing to work at prevailing wage rate is no able to get the job. High
191 growth rate of labour force and inadequate expansion in the job
opportunities have intensified the problem of unemployment in India.
Unemployment generates socio economic and political consequences.
Prolonged mass unemployment results in mass poverty which further
leads to increase in economic and social offences. Therefore it becomes
utmost important to unravel the various causes of unemployment to
suggest some measure to control this socio economic disease of
unemployment in India.
11.2 MEANING AND NATURE OF UNEMPLOYMENT IN
INDIA
Unemployment is a situation in which a person who is able and
willing to work is not able to get the job. In India the unemployment is a
multi dimensional phenomenon. It is not restricted to any one sector or
group of population. It is a wide spread problem affecting at most every
segment of the society. The nature of unemployment in the country is
analysed by classifying the unemployment into 1) Rural unemployment 2)
Urban unemployment
1. Rural unemployment:
Since large percentage of Indian population reside in the rural
sector with the main occupation as agriculture and allied activities, it gives
rise to the problem of rural unemployment. The rural unemployment is
generally divided into disguised, seasonal and open unemployment.
a. Disguised unemployment:
There is considerable disguised unemployment in the agricultural
sector. It is a state of unemployment in which more people are engaged in
agricultural operations than required. The marginal productivity of such
workers is zero. It means that all the workers are not needed to maintain
the existing level of production. Even if some workers are withdrawn, the
same work can be done by fewer people.
b. Seasonal unemployment:
192
Another dimension of rural unemployment is the problem of
seasonal unemployment among the farmers. Agriculture by its very nature
is a seasonal activity. For a significant part of the year the Indian farmers
are out of work. In the absence of supplementary sources of employment
they remain unemployed during the slack agricultural season.
c. Open unemployment:
Those who do not have any work come under this category. They are
able and willing to work, but there is no work for them. Such unemployment
is in the nature of involuntary idleness. There is considerable open
unemployment among the landless agricultural workers with the decline of
cottage industries and handicraft many rural people have no alternative
means of livelihood. They have to depend upon the agricultural sector
which is already overcrowded.
The main cause responsible for rural unemployment are high
growth rate of population, illiteracy, dependency on monsoon, lack of rural
development and infrastructural facilities lack of mobility of people and so
on.
2. Urban Unemployment:
In urban areas, the main occupation is related to secondary and
tertiary sectors in which generally semi skilled and skilled labourers are
engaged. The main two types of unemployment in the urban sector are
industrial and educated unemployment.
a. Industrial unemployment:
Industrial unemployment is the result of slow growth of industrial
development vis a vis growth of labour force. There has been a tendency
for the rural people to migrate to urban areas in search of employment
further; unemployment in the industrial sector has increased due to low
growth rate of employment in the organised sector. Sectoral employment
elasticities with respect to GDP as well as the aggregate employment
elasticity have come down. The aggregate employment elasticity has come
193 down from 0.41 during the period 1983 to 1993-94 to 0.51 during the period
1993-94 to 1999-2000. This is due to a number of factors like slow
industrial growth, decay of small scale and cottage industries, deceleration
in the public sector employment including government employment and so
on.
b. Educated unemployment:
An important aspect of urban unemployment is the lack of job
opportunities for the educated people with increasing literacy level, the
problem of educated unemployment is becoming severe. University degree
holders and even professionally trained people are finding it difficult to get
jobs, unemployment among the educated is mainly due to over emphasis
on theoretical aspects of various subjects. The education system is out off
from ground realities of the India economy.
3. Extent of unemployment in India:
In India the National Sample Survey Organisation (NSSO) provides
information about unemployment and employment, on the basis of its
quinquennical surveys. The 61st round of the NSSO was conducted during
July 2004 to June 2005. The NSSO uses three different concepts.
i) Usual principal status (UPS) unemployment:
It is measured in number of persons. It shows number of persons
who remained unemployed for the major part of the year. The UPS
unemployment rate is regarded as the measure of chronic open
unemployment during the reference year.
ii) Current Weekly Status (CWS) unemployment:
It is also measured in number of person. It shows the number of
persons who did not find even an hour of work during the survey week. It is
also a measure of chronic unemployment, but with reduced reference
period of a week.

194 iii) Current Daily Status (CDS) unemployment:
It is measured in person days. It shows the number of persons who
did not find work on a day or some days during the survey week. It is
considered to be a comprehensive measure of unemployment, including
both chronic unemployment as well as underemployment on weekly basis.
The extent of unemployment in India is explained below.
1. Magnitude of unemployment:
The magnitude of unemployment as brought out by various rounds of
NSSD surveys is shown in table. The total number of unemployed in term
of CDS has increased from 24:34 million in 1983 to 37.74 million in 2004-
05 further, the unemployment rate ( by CDS) as a proportion 6.06 percent
in 1993-94 to 8.28 percent in 2004-05 (see table).
Table 11.1: Magnitude of unemployment in India (by COS basis)
Year
Number of
unemployed
(in mill on)
Unemployed rate as a
proportion of labour force
(percent)
1983 24.34 9.22
1993-94 20.27 6.06
2004-05 34.74 8.28
Source: Economic survey
2.High and increasing unemployment incidences among females:
The incidence of unemployment is significantly higher among
females than males both in rural and urban areas. The unemployment rates
(UPS) among the females in the rural areas has increased from 1.4% in
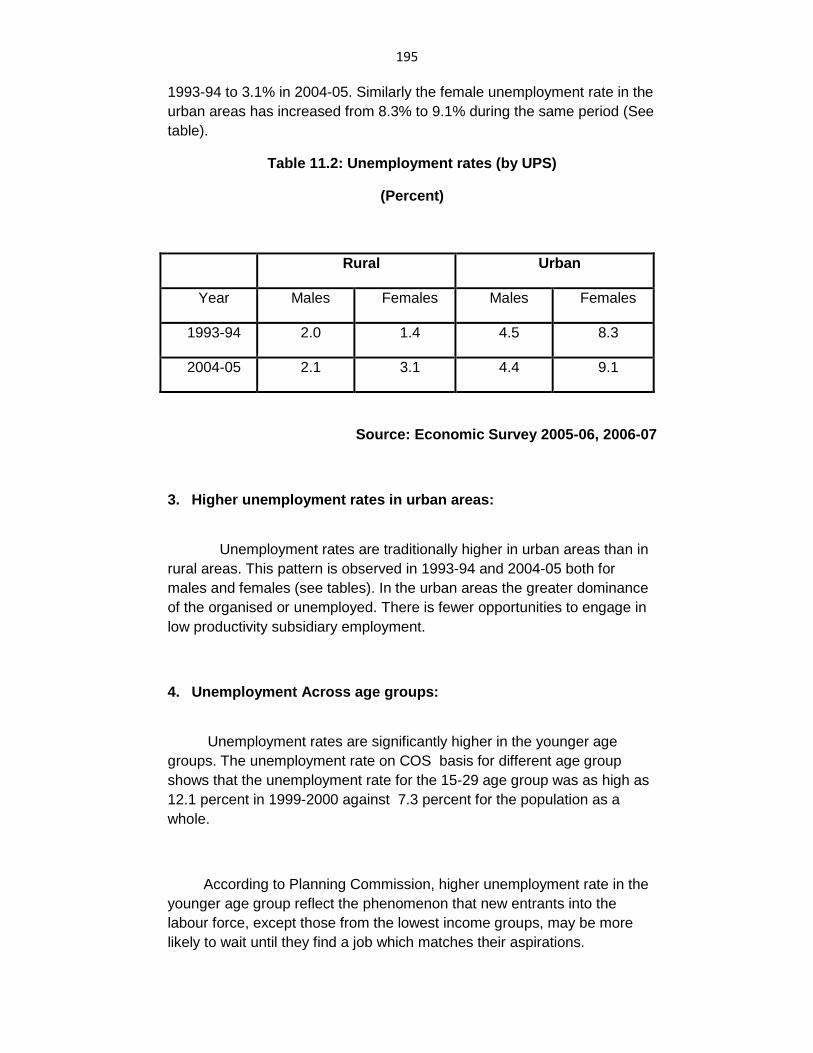
195 1993-94 to 3.1% in 2004-05. Similarly the female unemployment rate in the
urban areas has increased from 8.3% to 9.1% during the same period (See
table).
Table 11.2: Unemployment rates (by UPS)
(Percent)
Rural Urban
Year Males Females Males Females
1993-94 2.0 1.4 4.5 8.3
2004-05 2.1 3.1 4.4 9.1
Source: Economic Survey 2005-06, 2006-07
3. Higher unemployment rates in urban areas:
Unemployment rates are traditionally higher in urban areas than in
rural areas. This pattern is observed in 1993-94 and 2004-05 both for
males and females (see tables). In the urban areas the greater dominance
of the organised or unemployed. There is fewer opportunities to engage in
low productivity subsidiary employment.
4. Unemployment Across age groups:
Unemployment rates are significantly higher in the younger age
groups. The unemployment rate on COS basis for different age group
shows that the unemployment rate for the 15-29 age group was as high as
12.1 percent in 1999-2000 against 7.3 percent for the population as a
whole.
According to Planning Commission, higher unemployment rate in the
younger age group reflect the phenomenon that new entrants into the
labour force, except those from the lowest income groups, may be more
likely to wait until they find a job which matches their aspirations.
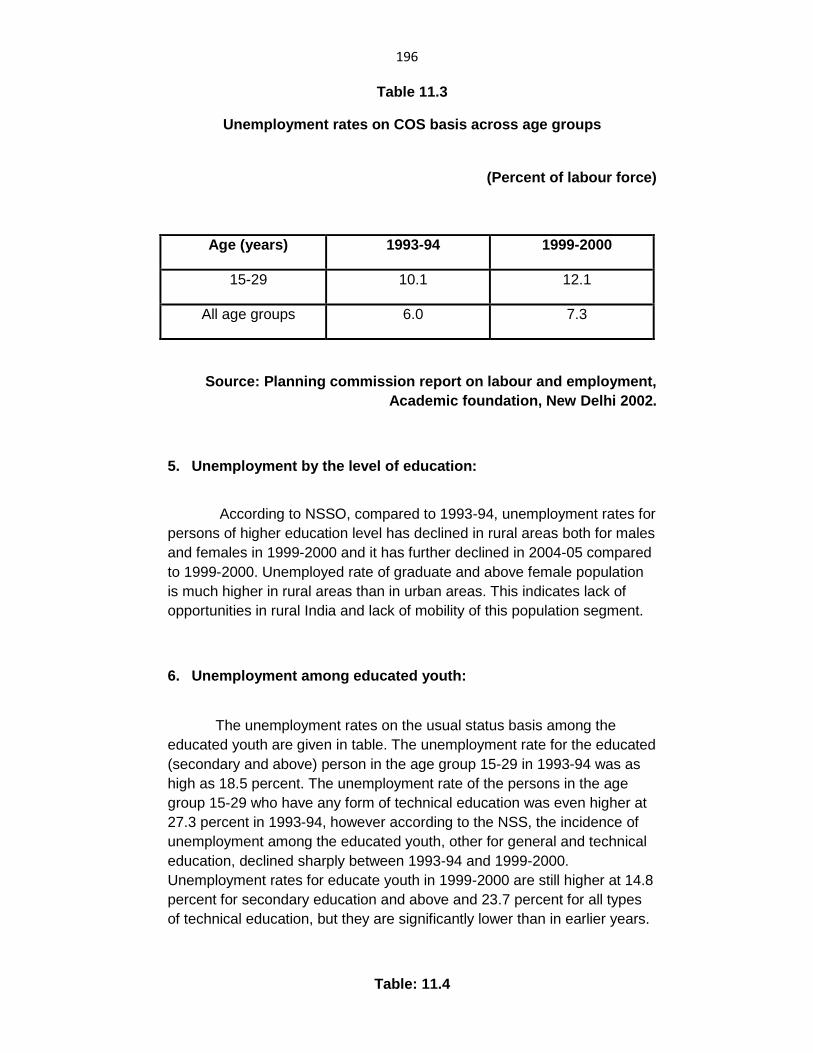
196
Table 11.3
Unemployment rates on COS basis across age groups
(Percent of labour force)
Age (years) 1993-94 1999-2000
15-29 10.1 12.1
All age groups 6.0 7.3
Source: Planning commission report on labour and employment,
Academic foundation, New Delhi 2002.
5. Unemployment by the level of education:
According to NSSO, compared to 1993-94, unemployment rates for
persons of higher education level has declined in rural areas both for males
and females in 1999-2000 and it has further declined in 2004-05 compared
to 1999-2000. Unemployed rate of graduate and above female population
is much higher in rural areas than in urban areas. This indicates lack of
opportunities in rural India and lack of mobility of this population segment.
6. Unemployment among educated youth:
The unemployment rates on the usual status basis among the
educated youth are given in table. The unemployment rate for the educated
(secondary and above) person in the age group 15-29 in 1993-94 was as
high as 18.5 percent. The unemployment rate of the persons in the age
group 15-29 who have any form of technical education was even higher at
27.3 percent in 1993-94, however according to the NSS, the incidence of
unemployment among the educated youth, other for general and technical
education, declined sharply between 1993-94 and 1999-2000.
Unemployment rates for educate youth in 1999-2000 are still higher at 14.8
percent for secondary education and above and 23.7 percent for all types
of technical education, but they are significantly lower than in earlier years.
Table: 11.4
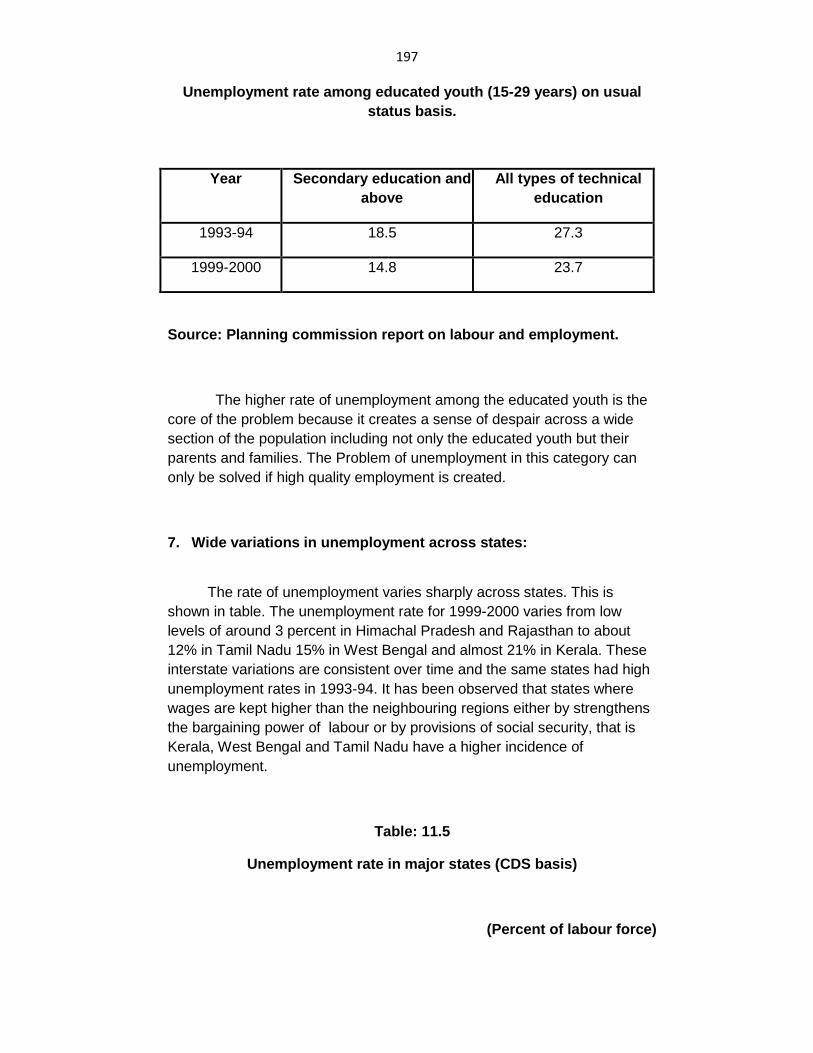
197
Unemployment rate among educated youth (15-29 years) on usual
status basis.
Year Secondary education and
above
All types of technical
education
1993-94 18.5 27.3
1999-2000 14.8 23.7
Source: Planning commission report on labour and employment.
The higher rate of unemployment among the educated youth is the
core of the problem because it creates a sense of despair across a wide
section of the population including not only the educated youth but their
parents and families. The Problem of unemployment in this category can
only be solved if high quality employment is created.
7. Wide variations in unemployment across states:
The rate of unemployment varies sharply across states. This is
shown in table. The unemployment rate for 1999-2000 varies from low
levels of around 3 percent in Himachal Pradesh and Rajasthan to about
12% in Tamil Nadu 15% in West Bengal and almost 21% in Kerala. These
interstate variations are consistent over time and the same states had high
unemployment rates in 1993-94. It has been observed that states where
wages are kept higher than the neighbouring regions either by strengthens
the bargaining power of labour or by provisions of social security, that is
Kerala, West Bengal and Tamil Nadu have a higher incidence of
unemployment.
Table: 11.5
Unemployment rate in major states (CDS basis)
(Percent of labour force)
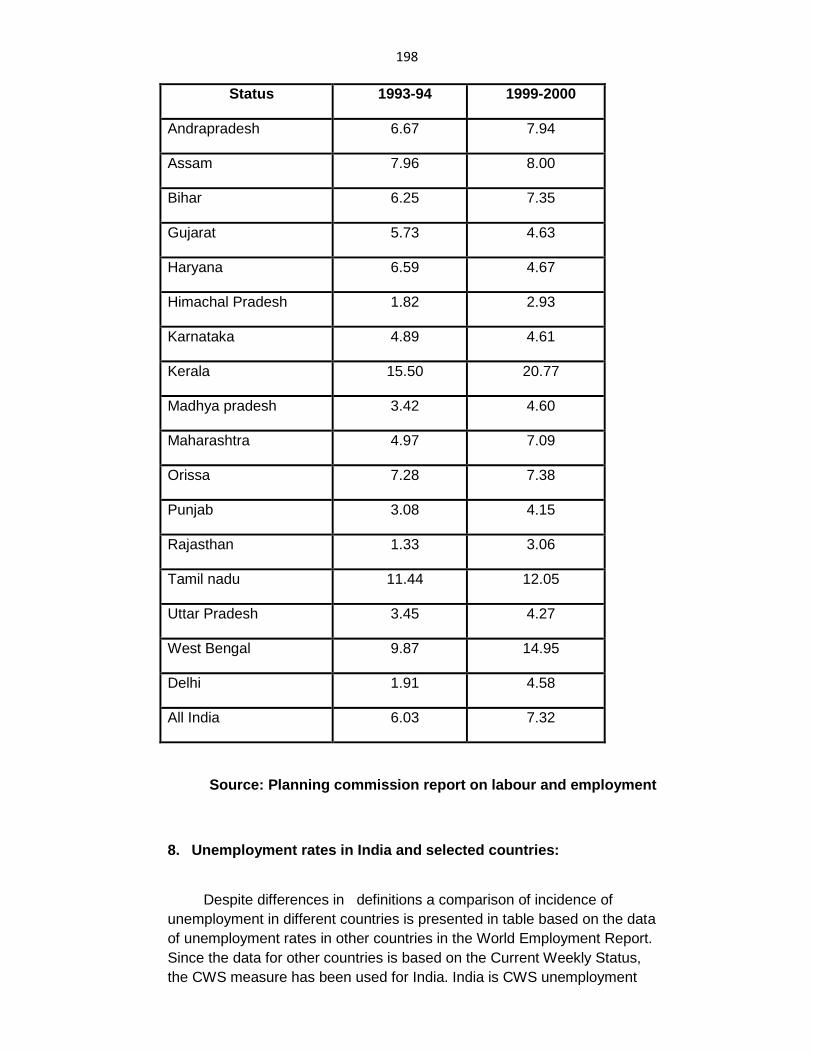
198
Status 1993-94 1999-2000
Andrapradesh 6.67 7.94
Assam 7.96 8.00
Bihar 6.25 7.35
Gujarat 5.73 4.63
Haryana 6.59 4.67
Himachal Pradesh 1.82 2.93
Karnataka 4.89 4.61
Kerala 15.50 20.77
Madhya pradesh 3.42 4.60
Maharashtra 4.97 7.09
Orissa 7.28 7.38
Punjab 3.08 4.15
Rajasthan 1.33 3.06
Tamil nadu 11.44 12.05
Uttar Pradesh 3.45 4.27
West Bengal 9.87 14.95
Delhi 1.91 4.58
All India 6.03 7.32
Source: Planning commission report on labour and employment
8. Unemployment rates in India and selected countries:
Despite differences in definitions a comparison of incidence of
unemployment in different countries is presented in table based on the data
of unemployment rates in other countries in the World Employment Report.
Since the data for other countries is based on the Current Weekly Status,
the CWS measure has been used for India. India is CWS unemployment
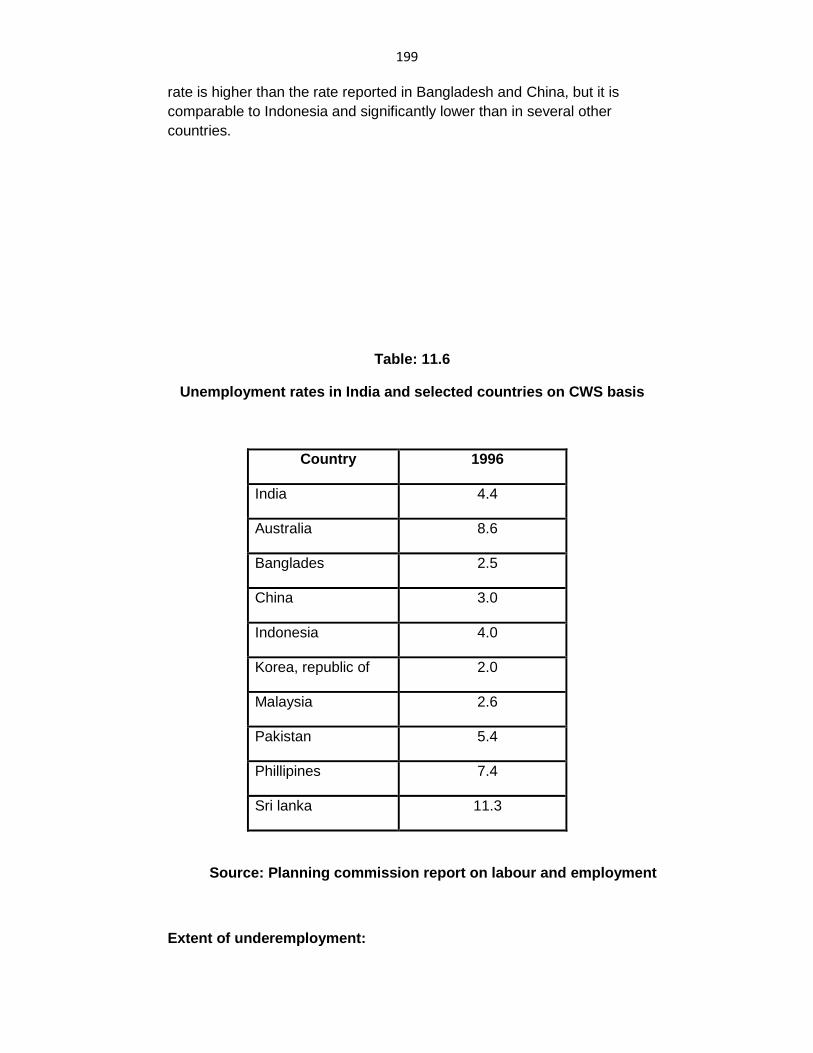
199 rate is higher than the rate reported in Bangladesh and China, but it is
comparable to Indonesia and significantly lower than in several other
countries.
Table: 11.6
Unemployment rates in India and selected countries on CWS basis
Country 1996
India 4.4
Australia 8.6
Banglades 2.5
China 3.0
Indonesia 4.0
Korea, republic of 2.0
Malaysia 2.6
Pakistan 5.4
Phillipines 7.4
Sri lanka 11.3
Source: Planning commission report on labour and employment
Extent of underemployment:
200
Underemployment arises due to two kinds of factors first, the labour
time of a person classified as employed over the reference period may not
be utilised fully. This kind of underemployment among the employed
persons is visible and hence, it is called visible under employment. Second,
the income from work over the reference period, is not adequate and hence
it cause underemployment. Such underemployment is referred to as
invisible underemployment is referred to as invisible underemployment. In
1993-94, 6.1 percent of the usually employed persons were seeking
addition work. On the basis of CWS we can observe the following trends in
under employment.
The underemployment rate declined gradually during the period
1983 to 1993-94 and with a faster rate between the period 1987-88 and
1993-94 in general and for female in particular. The problem of under
employment is seen to be more serious among males and more in rural
than in urban areas. During 1993-94, the under employment among usually
employed females was 19 percent in rural than in urban India. During 1993-
94, the underemployment among usually employed females was 19
percent in rural than in urban India. During 1993-94, the underemployment
among usually employed females was 19 percent in rural India and in rural
India and 12 percent in urban India. The corresponding percentages for
usually employed males were 4 and 2 only.
11.3 CAUSE OF UNEMPLOYMENT IN INDIA
High incidence of unemployment leads to mass poverty, high
growth rate of population and other socioeconomic evils. Following are the
causes of unemployment in India.
1. Population growth and increase in labour force:
The most important cause of Unemployment in India is high growth
rate of population, which in turn causes an increases in labour force.
Incidently, high rate of unemployment further increases population, as it
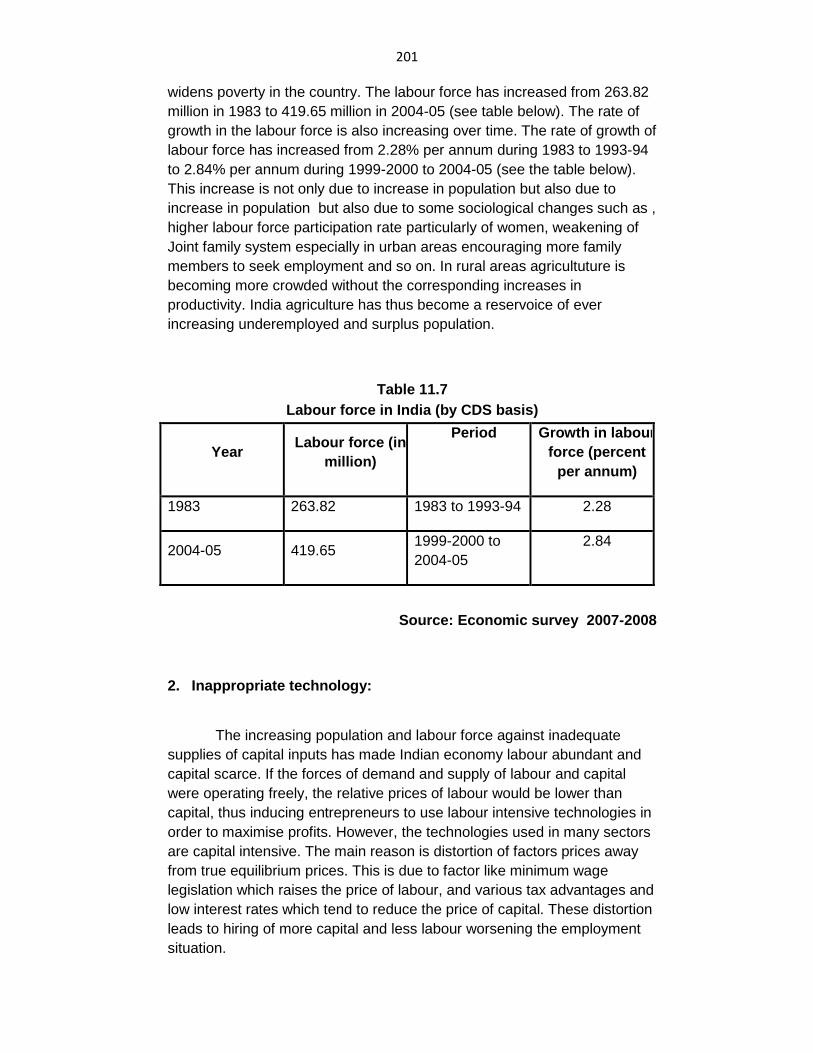
201 widens poverty in the country. The labour force has increased from 263.82
million in 1983 to 419.65 million in 2004-05 (see table below). The rate of
growth in the labour force is also increasing over time. The rate of growth of
labour force has increased from 2.28% per annum during 1983 to 1993-94
to 2.84% per annum during 1999-2000 to 2004-05 (see the table below).
This increase is not only due to increase in population but also due to
increase in population but also due to some sociological changes such as ,
higher labour force participation rate particularly of women, weakening of
Joint family system especially in urban areas encouraging more family
members to seek employment and so on. In rural areas agricultuture is
becoming more crowded without the corresponding increases in
productivity. India agriculture has thus become a reservoice of ever
increasing underemployed and surplus population.
Table 11.7
Labour force in India (by CDS basis)
Year Labour force (in
million)
Period Growth in labour
force (percent
per annum)
1983 263.82 1983 to 1993-94 2.28
2004-05 419.65 1999-2000 to
2004-05
2.84
Source: Economic survey 2007-2008
2. Inappropriate technology:
The increasing population and labour force against inadequate
supplies of capital inputs has made Indian economy labour abundant and
capital scarce. If the forces of demand and supply of labour and capital
were operating freely, the relative prices of labour would be lower than
capital, thus inducing entrepreneurs to use labour intensive technologies in
order to maximise profits. However, the technologies used in many sectors
are capital intensive. The main reason is distortion of factors prices away
from true equilibrium prices. This is due to factor like minimum wage
legislation which raises the price of labour, and various tax advantages and
low interest rates which tend to reduce the price of capital. These distortion
leads to hiring of more capital and less labour worsening the employment
situation.
202 3. Inappropriate education system:
The educational system in India is still inappropriate. There is a
strong preference among the young for general education over vocational
training. This is because general education has traditionally been seen as a
route to acquire government jobs which are highly valued. Further there is
also a problem with the supply side of vocational training. The physical
capacity of the existing training institutes is limited and the quality of
training provided is also not up to the mark. Training courses in government
run institutes are often not sufficiently reflective of market demand. There is
also a perception among the employers that the skills acquired by
graduates of these institutes are inadequate.
4. Slow Economic growth:
The overall economic development in Indian economy has not been
adequate to create sufficient employment opportunities in the country. The
volume of economic activities at present, determined largely by agriculture,
is low and the rate of increase in such activities is small. The non
agricultural sector, particularly the modern industrial sector, which was to
provide increasing opportunities of employment, is growing at a very slow
pace. The slow capital formation has also inhibited the growth potential
both in the agricultural and industrial sector. Thus, job creations were
always falling short of the number of job seekers causing backlog of
unemployment.
5. Lack of infrastructural facilities:
Lack of transportation, electricity, etc creates underutilised capacity.
This means that even if the productive unit has capacity to achieve 100%
employment but due to lack of infrastructure, it is unable to provide more
employment.
6. Protective labour laws in India:
Since Independence, labour laws for the workers in the organised
sector in India have mainly emphasized workers protection and welfare.
203 These laws give organised sector workers in India permanent employment
after a brief (typically one year or less) probation period. Employees can
not be fired without government permission (which is rarely given) even
when the firm becomes non viable.
In the public sector, employees typically receive fixed annual wage
increments unrelated to work performance. There is little incentive to work
hard which result in poor productivity strikes are often called at the slightest
pretext without even giving any notice, creating an atmosphere of
uncertainty about production schedules and exposing the employers (and
public) to considerable inconvenience. This uncertainty in production
schedules and poor productivity of workers leads to low demand for labour
through the use of more capital intensive technology by domestic
entrepreneurs and through by passing India in favour of other countries by
the foreign entrepreneurs. This eventually leads to low wages, fever jobs
and higher unemployment. This explains why India has experienced very
slow growth of employment and real earnings per employee since
Independence. If we want a rapid increase in employment and in real
earning per employee, and then there is an urgent need to reform the
labour laws in India.
11.4 EFFECTS OF UNEMPLOYMENT IN INDIA : SOCIO
ECONOMIC EFFECTS OF UNEMPLOYMENT IN INDIA
Unemployment may be visible or disguised in nature we know that
certain sections of the people remain voluntarily unemployed. Some even
voluntarily retire from their regular employment and others below certain
age and above certain age are also outside the employment market, and
yet we find that in India a large number of people who are seeking jobs are
not able to get employed. This includes even the educated unemployed.
Following could be the social economic effects of unemployment and under
employment.
i) Involuntary unemployment means no income and under employment means less or low income. One can just imagine the socio economic effects of no income and no work on the individuals concerned and again the repercussion of their actions and reactions on the society as a whole. Jobless life is joyless. There is a common saying ―Absence of occupation is not rest; A mind quite vacant is mind distressed.‖
204
Such unemployed people will get thoughts which may give rise to
many social problems. They may even resort to anti social activities
creating more problems for the society as a whole; or some may
sink into depression and invite problems related to ill health. Some
may develop ideas to rebel against the society which cannot
provide them enough work to help their families and themselves to
enjoy even two meals a day. An idle mind become a Devil‘s
workshop, such individuals become dangerous to society.
ii) The problem of unemployment is related not only to the uneducated section of society but we also have in India the problem of educated unemployment. In the year 2004, the data collected from the 947 employment exchanges revealed that out of 4.08 cores job seekers registered with them about 70 percent were educated employed; they may not remain permanently unemployed but the time lay between acquiring education and getting employment is simply lulling.
Spending time at their disposal becomes a problem and the
unemployed youth will waste their time in resorting to cheap
entertainment activities inviting more trouble and problems for
themselves and for the society as a whole in near future. Brain drain
among the more educated is also an indication that they would be
getting better job opportunities in their early years of youth else
where.
iii) Self employment too is not very easy and requires initial capital investment of late vocational course have been state at various educational institutes and vocational centres and placement agencies have been set up besides the Employment Exchange Bureaus. The employment guarantee scheme launched by the late Shri. V. S. Page in Maharashtra was very timely and laudable effort. Larger scale employment is being attempted for the skilled and semi skilled labour, may be in construction of roads and agro processing services recently an effort is being made to cover all 150 million rural household to provide employed to at least one member from each family for one hundred days at some minimum wage.
iv) Open employment or even disguised unemployment means no
addition to the total national output. There is no contribution made
by the unemployment to increase the national income (of course for
no fault of his own, perhaps) contribution to output remains nil and
consumption exist, which is certainly unavoidable. As there is no
contribution to national income the per capita income remains low
which add to the indexation of poverty. Unemployment also
aggravates the problems of unequal distribution of income and
wealth which widens the area of inequality and goes against the
objective of providing social justice.
v) Although bread is the stuff of life, man does not live by bread alone.
Every individual needs some earnings to meet his daily
requirement. An unemployed may have to beg, borrow or steal to
205
satisfy his basic needs. Besides that he also needs some security
against heavy odds and unfavourable circumstances, such as
sickness, accidents and old age. Hardly any social security
measures such as old age, pensions, and medical allowances are
made available to him. Much needs to be done in these areas by
the government. The unemployed, very often have to approach
money lenders, relatives and other friends to borrow. Under the
circumstances they get victimised by the mal intentions of the
creditors.
vi) Due to seasonal agricultural operations, closure of sick and weak
units, introduction of machines etc. the unemployed from the rural
areas migrate to the urban centres or even sub urban areas to seek
employment adding to the problem of urban unemployment.
Most of the socio economic effects that we have described under
the section of poverty can be endorsed in case of unemployment.
Thus our planners will have to tackle the twin problems of poverty
and unemployment simultaneously; population too will have to be
controlled so as to reduce the stress on the problem of
unemployment and more employment opportunities need to be
created to enable the country to achieve its objectives of sustained
economic growth with social justice and equity.
11.5 MEASURES TO GENERATE EMPLOYMENT IN
INDIA
The government has been financing various types of special
programmes designed to create additional employment opportunities to
supplement the employment generate by the economy in normal course.
Some of these programmes are targeted to provide wage employment or
self employment to specific target groups such as the poor in urban and
rural areas, women, scheduled castes and scheduled tribes. In addition to
targeted employment programmes, there are wage and self employment
programmes which are not targeted.
The individual programmes of wage employment and self
employment have been modified from time to time on basis of experience
gained and a substantial restructuring involving merger of similar
programmes had taken place recently some of the important programmes
are explained below.
206 1] Employment programmes for the rural poor:
The major ongoing employment programmes for the rural poor are
the Swarnajayanti Gram Swarozgar Yojna (SGSY), which is a self
employment programme involving merger of the rest while IRDP and its
various component programmes and Sampoorna Grameen Rozgar Yojana
(SGRY), which is a wage employment programme involving integration of
the schemes of Jawaharlal Gram Samriddhi Yojana (JGSY) and
Employment Assurance Scheme (EAS).
i) Self employment for the rural poor : from IRDP to SGSY:
Promotion of self employment for the rural poor has been an
important element in the overall employment strategy. The Integrated Rural
Development Programme (IRDP) started in 1980-81 has been major
instrument for this purpose.
Over the years a number of subsidiary and allied programme
evolved under the Umbrella of IRDP training such as Training of Rural
Youth for Self Employment (TRYSEM), the Development of Women and
Children in Rural Areas (DWCRA) and the Million Wells Schemes (MWS)
all of which were introduced in the seventh plan, the Ganga Kalian Yojana
(GKY) introduced in February 1997 and the Supply of Improved Toolkits to
Rural Artisans (SITRA) introduced in 1992.
ii) Swarnajayanti Gram Swarozgar Yojana:
All rural self employment programmes were merged into the
Swarnajayanti Gram Swarozgar Yojana (SGSY) on 1st April 1999 in order
to ensure greater integration of the programmes at the implementing level.
It aims at bringing the self employed above the poverty line by providing
them income generating assets through bank credit and government
subsidy. This scheme is being implemented as a centrally sponsored
scheme on cost sharing ratio of 75:25 between the centre and the states up
to December 2007, 27.37 lakh self help groups have been formed and
93.21 lakh swarozgaries have been assisted with a total outlay of about Rs
19,340 crore.
207 iii) Wage employment for rural area: from EAS to SGRY:
Employment Assurance Scheme (EAS) was launched in 1993 as a
major wage employment programme for the rural areas. It was initially
limited to the 1778 economically most backward blocks. In 1997, the
programme was extended to all blocks converting it to a geographically
universal programme. The Jawahar Gram Samriddhi Yojana (JGSY) was
introduced on 1st April 1999 as the restructured version of the Jawahar
Rozgar Yojana (JRY), which was itself initiated on 1st April 1989 by merging
two pre existing wage employment programmes, that is the National Rural
Employment Programme (NREP) with the Rural Landless Employment
Guarantee Programme (RLEGP).
iv) Sampoorna Grameen Rozgar Yojana (SGRY):
It was launched in September 2001 by integrating JGSY and EAS
Schemes. The objective of SGRY is to provide additional wage
employment along with food security creation of durable community, social
and economic assets and infrastructure development along with food
security, creation of durable community, social and economic assets and
infrastructure development in rural areas. It envisages generation of 100
crore man days of employment in a year. The cost is shared between the
Centre and States in the ratio of 75:25. In 2007-08 up to December 31,
2007, 11.60 crore person days of employment were generated.
v) National Food for Work Programme (NFFWP):
This programme was launched on November14, 2004 in 150 most
backward districts of the country for the generation of supplementary wage
employment. This programme is open to all rural poor who are in need of
wage employment and desire to do manual unskilled work.
vi) Rural Employment Generation Programmes (REGP):
It was launched in 1995. Its aim is to create self employment
opportunities in the rural areas and small towns. It is being implemented by
the Khadi and Village Industries Commission (KVIC). Under REGP
208 entrepreneurs can establish village industries by availing money assistance
from the KVIC and bank loans.
vii) National Rural Employment Guarantee Scheme (NREGS):
After the passing of NREG act in September, 2005, the NREGS
was implemented from February 2, 2006 in 200 identified districts of the
country. Its objective is to provide 100 days of guaranteed unskilled wage
employment to each rural household opting for it. The ongoing
programmes of SGRY and National Food for Work Programme have
been subsumed under NREGS in these districts. The NREGS has its
focus on works relating to water conservation, drought proofing (including
a forestation/tree plantation),land development, stood control/protection
and rural connectivity in terms of all weather roads, up to December
2006, it has generated 53.65 crore person days of employment
government has allocated Rs 11300 crore for NREGS in 2006-07.
2] Employment Programmes for the urban poor:
Along with the effort in rural areas there have been special
employment programmes for urban areas focussing on both wage
employment as well as self employment for the urban poor. The Urban Self
Employment Programme (USEP) and the Urban Wage Employment
Programmes (UWEP) are two special scheme of the Swarna Jayanti
Sahahari Rozgar Yojana (SJSRY). SJSRY was initiated in December 1997.
It replaced various programmes operated earlier. The urban wage
employment programme is a successor to an earlier wage employment
programme called scheme for urban wage employment which was a part of
Nehru Rozgar Yojana for urban areas. The SJSRY aims at providing
gainful employment to urban unemployed or underemployed poor by
encouraging the setting up of self employment ventures or provision of
wage employment. It is being funded on a 75:25 basis between centre and
the states. The number of urban poor assisted for setting up micro group
enterprises in 2007-08 was 0.44 lakh upto November, 2007. The number of
urban poor imparted skill training in 2007-08 was 0.60 lakh upto end of
November 2007. It also generated 6.77 lakh man days of employment in
2007-08 up to end of November 2007.
3] Self employment for educated youth:
In addition to the above programmes which are target to benefit
the poor in rural and urban areas the employment strategy was also tried
to provide employment opportunities for growing number of educated
youth who may not be from poor families but who face severe difficulties
in finding gainful employment. To meet this objective Self Employment for
Educated Urban Youth (SEEUY) programme was launched during 1983-
84. This was later incorporated into the Prime Minister‘s Rozgar Yojana

209 (PMRY) which was launched on 2nd October 1993. In 1994-95, PMRY
programme was extended to cover rural areas also. The programme
aimed at setting up 7 lakh micro enterprises during the Eighth Plan (1992-
97) providing employment to more than a million persons over the period.
4] Khadi and Village industries:
An important element in the government ‗s strategy to promote
employment in rural areas is the support providing for khadi and for a
number of traditional village industries including beekeeping, hand made
paper, jhari, oil , pickle, masala, dalia, aggarbatthi, leather products, soap,
etc. The promotion of Khadi and Village industries is the responsibility of
the Khadi and Village Industries Commission (KVJC) at the apex level
with statutory KVIC boards in each state which assist various
implementing agencies, including societies producers.
5] Other programmes:
Other programmes of Centres and States which are primarily for
generating self employment among special sectors of labour force are:
i) National minorities finance and Development Corporation.
ii) National Backward Classes‘ Finance and Development Corporation.
iii) National SC/ST Finance and Development Corporation.
iv) National Handicapped Finance and Development Corporation.
v) Training cum production centres (NORAD)
vi) Support for training and employments programme and
vii) National credit fund for women.
11.5.2 Policy strategy for employment generation in India :
The policy strategy to generate employment must try to achieve two
objectives.
1. Create more employment opportunities to absorb the net addition to
the labour force.
2 Improve the quality of existing employment in several sectors so
that the real wages rise through improved productivity.
The Planning Commission‘s task force on employment generation
has recommended the following policy strategy for employment
generation.
210
1) Accelerating Economic Growth:
Accelerating and sustaining a higher growth rate of the economy
is central to improving employment opportunities. The higher the rate of
economic growth, the larger will be the resultant employment. Achieving a
growth rate of 8% and sustaining the growth of rate into the future over a
period 10 years will require an appropriate macro economic policy frame
work. The economy has been growing at the rate of 8% and above. To
sustain this growth we have to pay special attention to three areas:
a) Enhancing the level of savings and investments.
b) Improving and expanding substantially the infrastructure facilities and
c) Continuing with the process of fiscal consolidation. It needs to be
stressed that without a substantial growth in GDP the problem of
unemployment can not be resolved.
2. Sector Specific Policies:
It is necessary to focus on policies in specific sectors which are
critical for employment generation and for the quality of employment
sector specific policies are intended to accelerate growth of labour
intensive sectors. Thus, special policy intervention is needed in following
sectors:
a) Agriculture and allied activities:
Acceleration of agriculture growth is important to increase labour
productivity in this sector and thus to improve the income of the people
dependent on agriculture, for this, it is necessary to increase investment
in agriculture especially in irrigation.
b) Food Processing:
211
This sector is highly underdeveloped compared to its potential
development of food processing could lead to agricultural diversification.
It would also provide significant non farm employment in rural areas.
C) Small Scale Industries (SSIs):
The small scale sector is an important source of industrial
dynamism and growth of employment. It has to be encouraged through
various policy initiatives such as,
i) Reforms in infrastructure development especially power will help
SSI development and the growth of employment in this sectors.
ii) State governments should reduce the burden of Inspector Raj
which is especially heavy on SSI units,
d) Services sector:
The services sector will be the major source of employment
generation in future providing about 70% of the new opportunities in the
economy. Thus measures have to be taken to remove constraints which
prevent rapid growth and modernization of the following sub sectors.
i) Travel and Tourism.
ii) Information Technology.
iii) Housing and real estate development
iv) Construction
v) Road transport.
vi) Distributive trade.
vii) Education and health services. Rapid growth and
modernisation of the above sectors will lead to expansion
in total employment.
3) Special Employment Programmes:
The trickle down effects of growth would be too small to provide
jobs to many, hence there is the need for supplementary programmes to
212 provide employment mainly to poor people who do no have the necessary
skills as well assets to gainfully employ themselves. There should be
special programme catering to the specific needs of landless labourers,
marginal farmers village artisans, tribal people living in remote areas of
the country and also people in hilly areas. The programmes may provide
direct employment or provide assets like animals, serving machines
hand/power driven looms etc. Special programme will also have to be
introduced to provide employment to the educated schemes like
operation flood, fishery project; block level planning etc can create large
employments opportunities.
4) Skill Development and Reforms in educational system:
Focused training will help to improve the capabilities of labour
force. As the economy grows and diversifies, we will need people with
varied skills. In fact, we need more technicians than engineers, more
Para medical staff than doctors. Our educational system is yet to adapt to
these problems. Even at school levels, vocational training has lost much
of its focus. There must be a constant effort to identify gaps in the supply
of labour and to provide training to unmake available the skills that are in
short supply.
Thus, efforts should be made to increase the vocational content of
education. The educational system must evolve in a manner which five
emphases on acquiring marketable skills. The role of the private sector in
providing education and training needs to be encouraged. In short, we
need to improve the employability of our labour force by matching the
supply with the demand for skills.
5) Improving Employment situations in poorer states:
Various in growth rates among the states have led to variations in
employment growth. Therefore a regionally balanced employment
strategy requires much faster growth rates of state domestic product in
the poor states. For this state government will have to adopt sector
specific policies to generate employment and to improve the qualities of
employment in the states.
213 6) Reforms of labour laws:
Our labour laws are widely regard as being too rigid. They
therefore have effect of discouraging growth of employment in the
organised sector. Labour reforms are a sensitive issue. It is extremely
important not to give the impression of going against the interest of
labour. At the same time, firms need to be given larger flexibility, in
dealing with labour. But this flexibility should not have effects against the
basic concerns of the labour. Such reforms in labour laws can generate
more employment and higher earnings per employee.
11.5.3 Evaluation of special employment programmes:
Although the resources devoted to the special employment
programmes have increased substantially the total volume of employment
create by these programmes is relatively small and has not been
increasing. If allowance is made of the fact that the official figures of
employment creation almost certainly exaggerate the numbers the real
condition of these programmes would be even smaller. This does not
mean that these programmes are not important.
1) Wages Employment Programmes:
They can play a very useful role in providing supplementary
employment to vulnerable sections of the population especially in
seasonal lean periods, which are common in agriculture. They are also a
potentially useful form of social safety net to deal with situations of
exceptional distress e.g. droughts. The wage employment programmes
should be focused as much as possible on maximising the developmental
impact on rural areas through the creation of durable assets in the area of
economic and social infrastructure
2) Self Employment:
The experience with self employment programmes aimed at the
poor is mixed. There has been some outstandingly successful examples
based on the self help groups involving women, but the general
214 experience with IROP has not been very encouraging. Part of the
problems is that it is not easy for individuals or families below the poverty
line to transform themselves into entrepreneurs capable of producing
marketable product and survive in competitive markets. The functioning of
self employment programmes need to be reoriented as much as possible
towards programmes supporting self help groups with the assistance of
NGOs with good track record.
3) Pradhan Mantri Rozgar Yojana (PMRY):
The experience with PMRY which relates to self employment for
educate youth is more encouraging. However, there are significant
weakness arising from very low recovery rates. On account of the likely
expansion in educated new entrants in the labour force in future, a PMRY
scheme has an important role to play in the future. There is need to shift
resources from programmed perceived to be more effective on the basis
of current monitoring and evaluations.
11.6 SUMMARY
Unemployment implies a tragic waste of human resources.
Unemployment generates serious economic, social and political
consequences. Prolonged condition of mass unemployment evidently
results in mass poverty. Mass unemployment leads to unrest and
encourages disruptive tendencies which weaken the socio economic
fabric of the community. The prime causes of rural and urban
unemployment in India are slow economic growth, high pressure of
population on agriculture, inappropriate education of population in
agriculture, inappropriate education system, lack of infrastructural
facilities, protective labour laws, lack of capital and enterprise, neglect of
rural development, joint family system, migration from rural areas etc.
Many policy initiatives are undertaken by Government of India such as
Pradhan Mantri Rozgar Yojana (PMRY), Swarna Jayanti Shahari Rozgar
Yojana (SJSRY), Valmiki Ambedkar Awas Yojana (VAMNAY),
Jawaharlal Nehru National Urban Renewal Mission (JNNURM). The
National Rural Employment Guarantee Scheme (NREGS) etc. However,
due to lack of co ordination between various implementing agencies, the
Government schemes could not achieve their target. India though may
well turn this vast pool of so called waste manpower to the reservoir of
human capital and thus enchasing―demographic divided‖ by imparting
quality and vocational education and providing better medical facilities.
215
11.7 QUESTIONS
1. Explain the nature and extent of unemployment in India.
2. What are the primary causes of unemployment in India?
3. ―Unemployment among the educated in increasing in India.‖ Justify
stating proper reason.
4. Unemployment is a socio economic evil. Comment.
5. Make an account of various measures taken by government to
generate employment in India.
216
12 MODULE 5
INDIA’S FOREIGN TRADE AND EXIM
POLICY
UNIT STRUCTURE
12.0 Objectives
12.1 Introductions
12.2 Composition of Export and Import
12.3 Direction of Trade
12.4 Causes of changes in composition and Direction of Trade
12.5 Export and Import Policy (EXIM Policy)
12.6 Summary
12.7 Questions
12.0 OBJECTIVES
After reading this unit you will come to know:
- Analyse, the trends and composition of India‘s foreign trade.
- Analyse, the direction of India is foreign trade.
- Explain, the causes of changes in composition and Direction of
India‘s foreign trade.
- Export and Import Policy.
12.1 INTRODUCTION
217
Foreign trade is considered as the ‗Engine of Growth‘.
Therefore it is quite important to study and analyse the changing
dynamics of India‘s foreign trade. India till recently was
predominantly a primary goods exporting and mainly an industrial
or manufactures importing country. In spite of its large geographical
area (seventh largest country) India‘s share in the world trade is
very small. Infact the share has gone down from 1.78 percent in
1950-51 to 0.69 percent in 1990. The low percentage in the world
trade brings out the fact that we have not yet exploited our
comparative advantage in many areas. Therefore, what is
necessary, for India, is to increase the volume of our exports and
bring in more commodities in our export basket. We also require to
exploit our latent talent to establish our comparative advantage in
new areas of goods and service.
12.2 COMPOSITION OF EXPORTS AND IMPORTS
In the pre-independence period based on classical
comparative cost theory, Britishers strongly believed that India was
a country well suited to supply raw-materials and other primary
goods and a good market for British manufactures accordingly at
the time of our independence our exports were predominantly of
primarily goods and imports were of manufactures.
At the beginning of the planning period our exports were
dominated by primary goods. They constituted more than two thirds
of our exports. Similarly our imports too were dominated by primary
goods mainly of essential consumers goods. During the second half
of the last century the composition of trade underwent a sea
change both in exports and imports. More than 70 percent of our
exports now are of manufactures. Imports are dominated by POL
products. Capital goods dominated our imports at the beginning of
the planning period and continued to be till the last quarter of the
20th century currently their share is around 15 percent.
12.2.1 Exports:
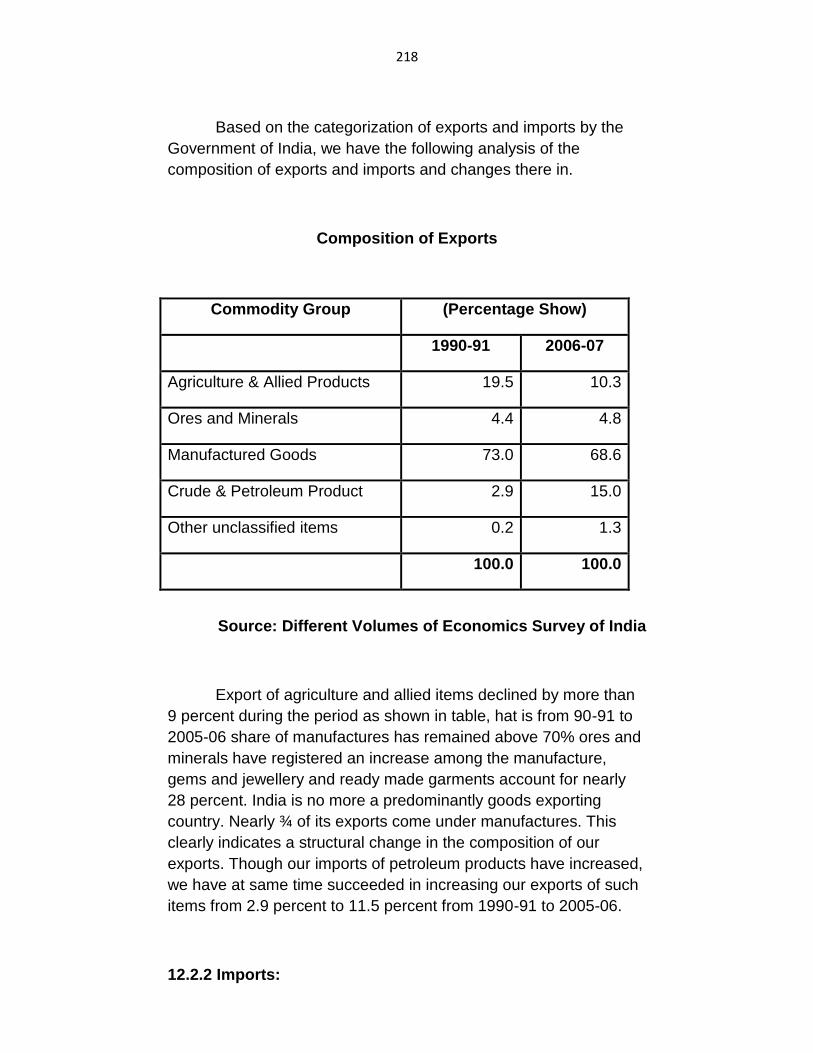
218
Based on the categorization of exports and imports by the
Government of India, we have the following analysis of the
composition of exports and imports and changes there in.
Composition of Exports
Commodity Group (Percentage Show)
1990-91 2006-07
Agriculture & Allied Products 19.5 10.3
Ores and Minerals 4.4 4.8
Manufactured Goods 73.0 68.6
Crude & Petroleum Product 2.9 15.0
Other unclassified items 0.2 1.3
100.0 100.0
Source: Different Volumes of Economics Survey of India
Export of agriculture and allied items declined by more than
9 percent during the period as shown in table, hat is from 90-91 to
2005-06 share of manufactures has remained above 70% ores and
minerals have registered an increase among the manufacture,
gems and jewellery and ready made garments account for nearly
28 percent. India is no more a predominantly goods exporting
country. Nearly ¾ of its exports come under manufactures. This
clearly indicates a structural change in the composition of our
exports. Though our imports of petroleum products have increased,
we have at same time succeeded in increasing our exports of such
items from 2.9 percent to 11.5 percent from 1990-91 to 2005-06.
12.2.2 Imports:
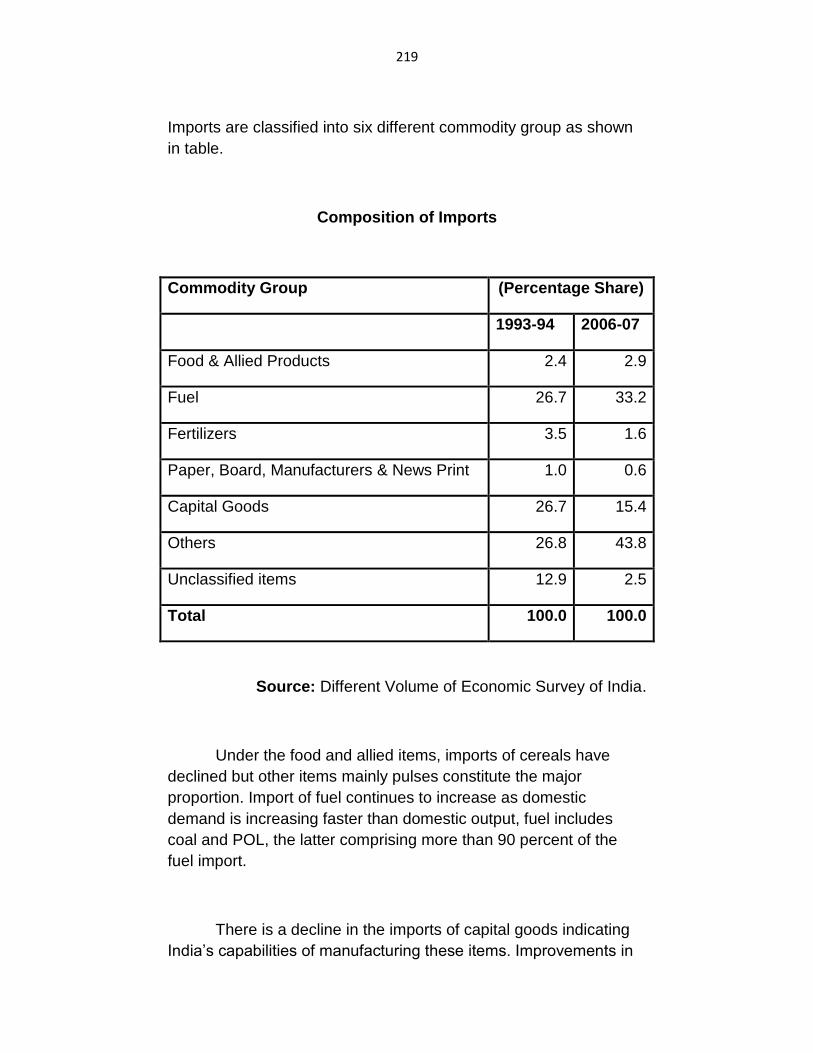
219
Imports are classified into six different commodity group as shown
in table.
Composition of Imports
Commodity Group (Percentage Share)
1993-94 2006-07
Food & Allied Products 2.4 2.9
Fuel 26.7 33.2
Fertilizers 3.5 1.6
Paper, Board, Manufacturers & News Print 1.0 0.6
Capital Goods 26.7 15.4
Others 26.8 43.8
Unclassified items 12.9 2.5
Total 100.0 100.0
Source: Different Volume of Economic Survey of India.
Under the food and allied items, imports of cereals have
declined but other items mainly pulses constitute the major
proportion. Import of fuel continues to increase as domestic
demand is increasing faster than domestic output, fuel includes
coal and POL, the latter comprising more than 90 percent of the
fuel import.
There is a decline in the imports of capital goods indicating
India‘s capabilities of manufacturing these items. Improvements in
220
technology and human capital enabled India to reduce its
dependency on developed countries for capital goods requirement.
Categorizing the imports into primary and non primary, the
latter dominates our imports. Increasing share of fuel is however
not an encouraging sign.
Composition of India‘s trade has undergone a positive
change. It is a remarkable achievement that we have transformed
ourselves from a predominantly primarily goods exporting country
into a non-primary goods exporting country under imports too our
dependence on food grains and capital goods has declined. The
trend indicates structural transformation of Indian economy, its
dynamism and its capabilities. At the same time our performance is
not upto the mark thanks to our poor work culture resulting in poor
competitiveness all pervading corruption and other negative traits
which dominate us.
The major items of India‘s Imports are – fuel, which includes
petroleum, oil & lubricants, capital goods, chemicals, gold & silver,
electronics goods, iron and steel and pearls. The major items of
India‘s exports are agriculture and allied products, ores and
minerals and manufactured goods, jewellery, and software
services.
12.3 DIRECTION OF TRADE
In the pre-independence period, the director of India &
foreign trade was determined not according to the comparative cost
advantages of India but by the colonial relations between India and
Britain.
The pattern continued for some years after Independence as
well since India had not till then explored the possibilities of
developing trade relations with other countries of the world. For
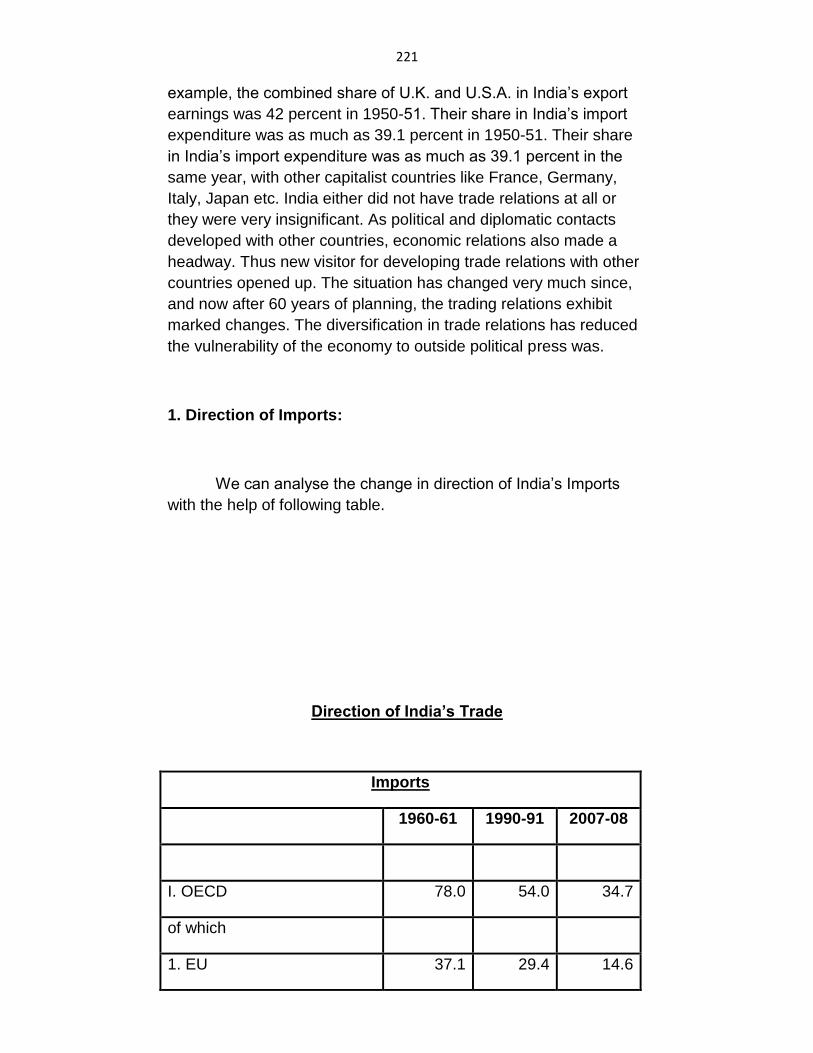
221
example, the combined share of U.K. and U.S.A. in India‘s export
earnings was 42 percent in 1950-51. Their share in India‘s import
expenditure was as much as 39.1 percent in 1950-51. Their share
in India‘s import expenditure was as much as 39.1 percent in the
same year, with other capitalist countries like France, Germany,
Italy, Japan etc. India either did not have trade relations at all or
they were very insignificant. As political and diplomatic contacts
developed with other countries, economic relations also made a
headway. Thus new visitor for developing trade relations with other
countries opened up. The situation has changed very much since,
and now after 60 years of planning, the trading relations exhibit
marked changes. The diversification in trade relations has reduced
the vulnerability of the economy to outside political press was.
1. Direction of Imports:
We can analyse the change in direction of India‘s Imports
with the help of following table.
Direction of India’s Trade
Imports
1960-61 1990-91 2007-08
I. OECD 78.0 54.0 34.7
of which
1. EU 37.1 29.4 14.6
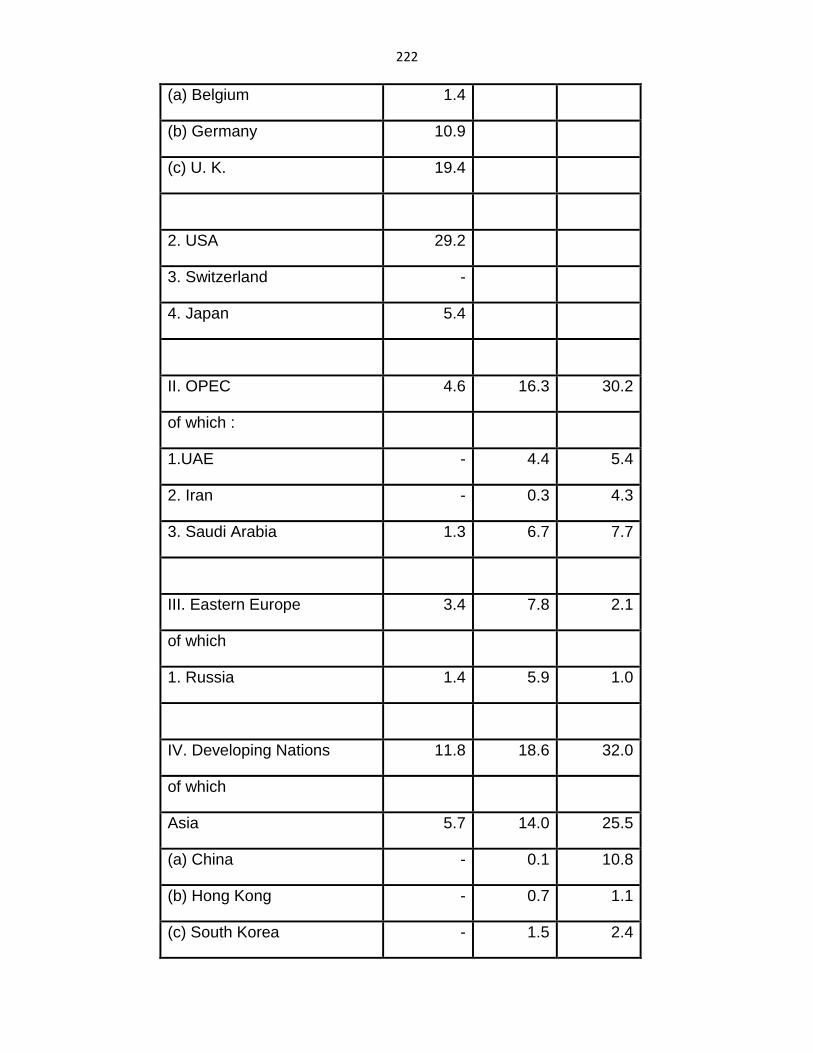
222
(a) Belgium 1.4
(b) Germany 10.9
(c) U. K. 19.4
2. USA 29.2
3. Switzerland -
4. Japan 5.4
II. OPEC 4.6 16.3 30.2
of which :
1.UAE - 4.4 5.4
2. Iran - 0.3 4.3
3. Saudi Arabia 1.3 6.7 7.7
III. Eastern Europe 3.4 7.8 2.1
of which
1. Russia 1.4 5.9 1.0
IV. Developing Nations 11.8 18.6 32.0
of which
Asia 5.7 14.0 25.5
(a) China - 0.1 10.8
(b) Hong Kong - 0.7 1.1
(c) South Korea - 1.5 2.4
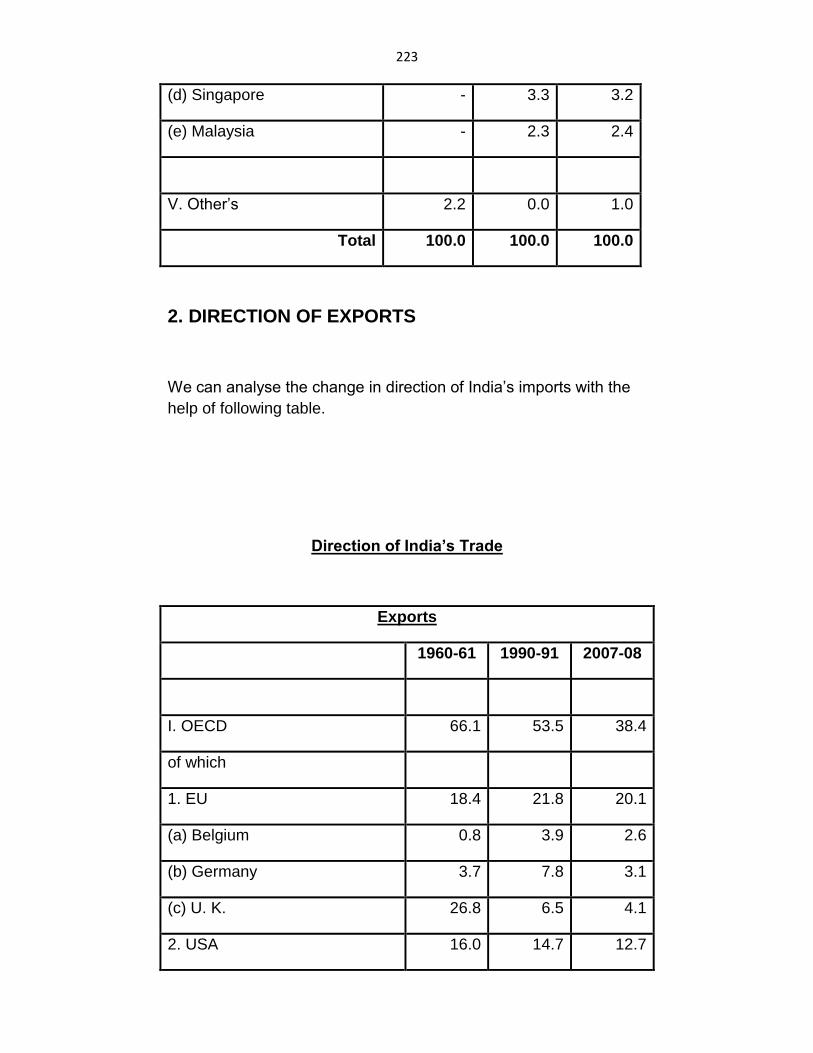
223
(d) Singapore - 3.3 3.2
(e) Malaysia - 2.3 2.4
V. Other‘s 2.2 0.0 1.0
Total 100.0 100.0 100.0
2. DIRECTION OF EXPORTS
We can analyse the change in direction of India‘s imports with the
help of following table.
Direction of India’s Trade
Exports
1960-61 1990-91 2007-08
I. OECD 66.1 53.5 38.4
of which
1. EU 18.4 21.8 20.1
(a) Belgium 0.8 3.9 2.6
(b) Germany 3.7 7.8 3.1
(c) U. K. 26.8 6.5 4.1
2. USA 16.0 14.7 12.7
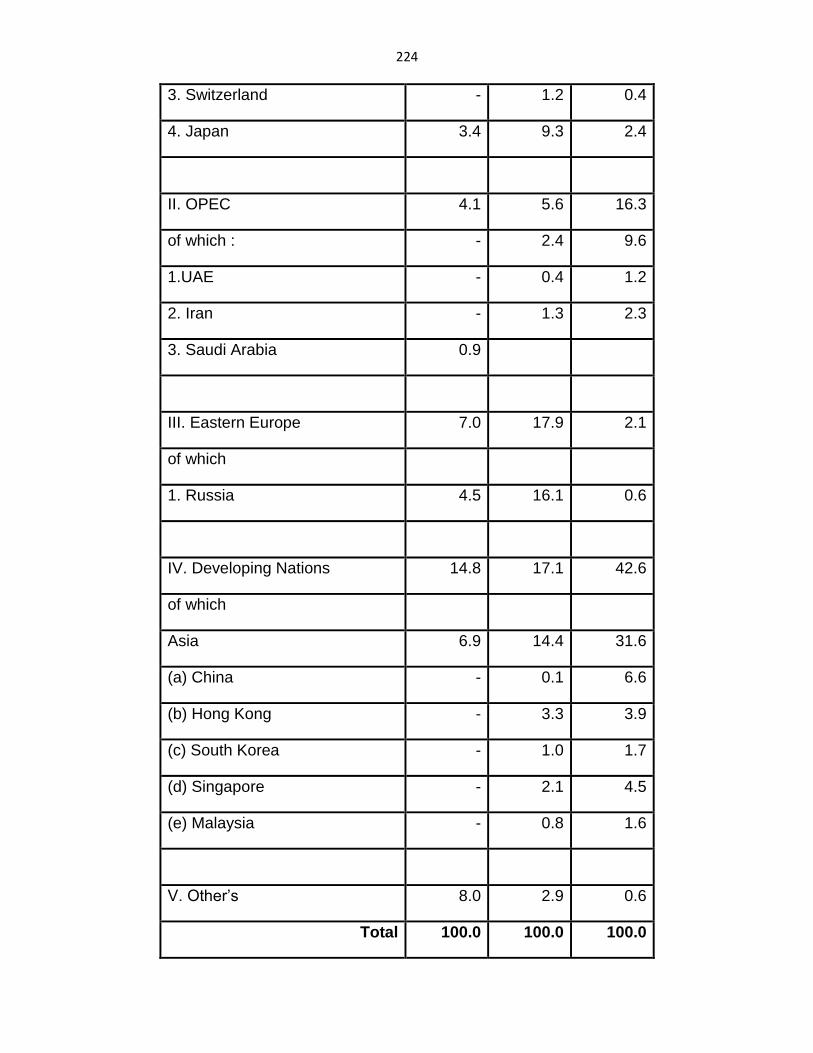
224
3. Switzerland - 1.2 0.4
4. Japan 3.4 9.3 2.4
II. OPEC 4.1 5.6 16.3
of which : - 2.4 9.6
1.UAE - 0.4 1.2
2. Iran - 1.3 2.3
3. Saudi Arabia 0.9
III. Eastern Europe 7.0 17.9 2.1
of which
1. Russia 4.5 16.1 0.6
IV. Developing Nations 14.8 17.1 42.6
of which
Asia 6.9 14.4 31.6
(a) China - 0.1 6.6
(b) Hong Kong - 3.3 3.9
(c) South Korea - 1.0 1.7
(d) Singapore - 2.1 4.5
(e) Malaysia - 0.8 1.6
V. Other‘s 8.0 2.9 0.6
Total 100.0 100.0 100.0
225
Imports:
For purpose of studying direction of trade India‘s trading
partners have been divided into five major groups in Table: OECD,
OPEC, Eastern Europe, Developing Nations and others. First
consider Imports. As is clear from the table, the importance of
OECD as a group declined considerably over the period 1960-61 to
2007-08. The share of this group in India‘s import expenditure was
78 percent in 1960-61 which fell to 34.7 percent in 2007-08. The
share of the group of oil exporting countries (OPEC) increased
considerably over time from 4.6 percent in 1960-61, the share of
this group in India‘s imports increased to 27.8 percent in 1980-81
and stood at 22.5 percent in 1999-2000. This shows that between
one-fourth and one fifth of India‘s Import expenditure has been due
to heavy dependence on this group of countries from meeting its
import requirements of crude oil. However, there was drastic
change in later years. The share of OPEC on India‘s import
expenditure fell to a mere 5.7 percent in 2002-03 and stood at 7.7
percent in 2005-06. On the other hand, the share of other countries
(the residual category) rose significantly to 27.4 percent in 2004-05
and further to 31.2 percent in 2005-06. This suggests a change in
sourcing of oil imports away from the OPEC region towards
residual category countries, however, there was drastic change
there after and the share of OPEC in India‘s import expenditure
rose to 31.8 percent in 2007-08 as oil imports from this region
increased markedly, as trade relations expanded with socialist
country the share of Eastern Europe in imports also increased
considerably town 3.4 percent in 1960-61 to 10.3 percent in 1980-
81 and stood at 7.8 percent in 1990-91. Due to the set back to
communist regions in this block in recent years (and particularly
due to the disintegration of USSR), the share of Eastern Europe in
imports declined considerably and was only 2.1 percent in 2007-08.
As is clear from table, developing nations (particularly of Asia) have
increased their share considerably in India‘s imports. They
accounted for 32.0 percent (i.e. a little loss than one third) of India‘s
import expenditure in 2007-08. Important facts regarding India‘s
country wise imports are as under.
In the year 1950-51, the share of U.K. in India‘s imports was
20.8 percent and that of U.S.A. was 18.3 percent. Thus the
226
combined share of these two countries was 39.1 percent. This
selected the colonial heritage of the country within a decade; the
picture started showing some changes. New trading partners like
West Germany, Canada and U.S.S.R. emerged. There was a
change in the relative position of U.K. and U.S.A. as well with the
latter pushing down the former to the second place. During the
planning period as a whole, India has obtained maximum imports
from U.S.A. the reason being that India has imported large scale
quantities of capital goods, intermediate products and food grains
(under P.L. 480 agreement) from that country with the expansion of
trading relations with Japan, West Germany and U.S.S.R., the
dependence on the U.K. declined considerably. Thus the share of
U.K. in India imports declined from 19.4 percent in 1960-61 to 1.9
percent in 2008-09. On the other hand the share of Japan
increased from 1.5 percent in 1950-51 to 5.4 percent in 1960-61.
However, there after it decreased in percentage terms to 6.5
percent in 1995-96 and 2.6 percent in 2008-09.
Another significant development was the expansion in
trading relations with the socialist countries especially the erstwhile
U.S.S.R. Imports from U.S.S.R. were negligible in 1950-51. In
1960-61 they amounted to a meagre Rs. 16 crore. However,
thereafter, they increased rapidly thanks to bilateral trade
agreements with that country. In 1984-85, the share of U.S.S.R.
was 10.4 percent and it displaced U.S.A. from the first place. The
picture changed thereafter. In 1985-86, U.S.A. was first, Japan
second and U.S.S.R. third in 1990-91, with a share of 12.1 percent,
U.S.A. occupied the first place. It was followed by Germany with a
share of 8.0 percent. Japan had the third position (share 7.5
percent), U.K. and Saudi Arabia share the fourth position with a
share of 6.7 percent each, Belgium had the fifth position (share 6.3
percent) while U.S.S.R. had the sixth position (share 5.9 percent)
with the disintegration of U.S.S.R. the direction of imports changed
markedly. In 2008-09, china occupied the first position in India‘s
imports (share 10.7 percent), followed by UAE (share 7.8 percent)
Saudi Arabia (share 6.6 percent) U.S.A. (share 6.1 percent), Iran
(share 4.1 percent) Germany (share 4.0 percent), Switzerland
(share 3.9 percent) and Australia (share 3.7 percent).
Exports:
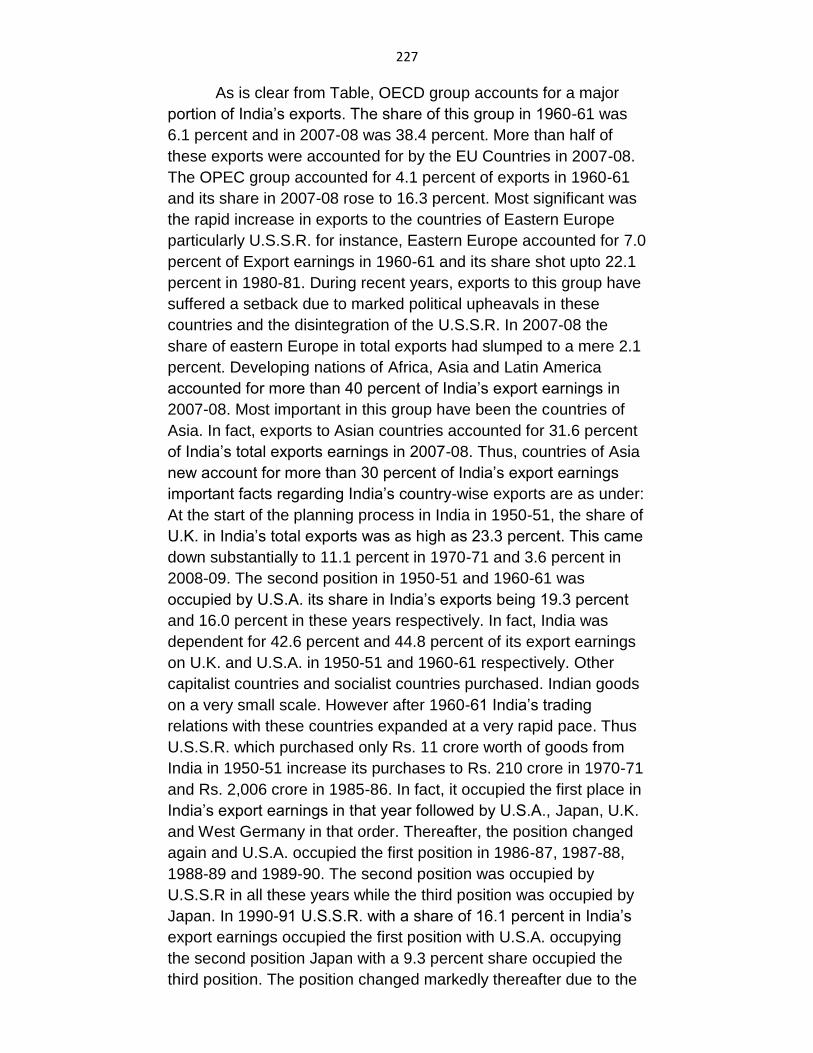
227
As is clear from Table, OECD group accounts for a major
portion of India‘s exports. The share of this group in 1960-61 was
6.1 percent and in 2007-08 was 38.4 percent. More than half of
these exports were accounted for by the EU Countries in 2007-08.
The OPEC group accounted for 4.1 percent of exports in 1960-61
and its share in 2007-08 rose to 16.3 percent. Most significant was
the rapid increase in exports to the countries of Eastern Europe
particularly U.S.S.R. for instance, Eastern Europe accounted for 7.0
percent of Export earnings in 1960-61 and its share shot upto 22.1
percent in 1980-81. During recent years, exports to this group have
suffered a setback due to marked political upheavals in these
countries and the disintegration of the U.S.S.R. In 2007-08 the
share of eastern Europe in total exports had slumped to a mere 2.1
percent. Developing nations of Africa, Asia and Latin America
accounted for more than 40 percent of India‘s export earnings in
2007-08. Most important in this group have been the countries of
Asia. In fact, exports to Asian countries accounted for 31.6 percent
of India‘s total exports earnings in 2007-08. Thus, countries of Asia
new account for more than 30 percent of India‘s export earnings
important facts regarding India‘s country-wise exports are as under:
At the start of the planning process in India in 1950-51, the share of
U.K. in India‘s total exports was as high as 23.3 percent. This came
down substantially to 11.1 percent in 1970-71 and 3.6 percent in
2008-09. The second position in 1950-51 and 1960-61 was
occupied by U.S.A. its share in India‘s exports being 19.3 percent
and 16.0 percent in these years respectively. In fact, India was
dependent for 42.6 percent and 44.8 percent of its export earnings
on U.K. and U.S.A. in 1950-51 and 1960-61 respectively. Other
capitalist countries and socialist countries purchased. Indian goods
on a very small scale. However after 1960-61 India‘s trading
relations with these countries expanded at a very rapid pace. Thus
U.S.S.R. which purchased only Rs. 11 crore worth of goods from
India in 1950-51 increase its purchases to Rs. 210 crore in 1970-71
and Rs. 2,006 crore in 1985-86. In fact, it occupied the first place in
India‘s export earnings in that year followed by U.S.A., Japan, U.K.
and West Germany in that order. Thereafter, the position changed
again and U.S.A. occupied the first position in 1986-87, 1987-88,
1988-89 and 1989-90. The second position was occupied by
U.S.S.R in all these years while the third position was occupied by
Japan. In 1990-91 U.S.S.R. with a share of 16.1 percent in India‘s
export earnings occupied the first position with U.S.A. occupying
the second position Japan with a 9.3 percent share occupied the
third position. The position changed markedly thereafter due to the
228
disintegration of the U.S.S.R. As is clear from the table, exports to
Russia accounted for only 0.6 percent of export earnings in 2008-
09. In 2008-09 U.A.E. with a share of 13.2 percent occupied the top
position. It was followed by U.S.A. (share 11.4 percent) China
(Share 5.1 percent) Singapore (share 4.1 percent), Hong Kong
(share 3.6 percent), U.K. (share 3.6 percent and Germany (share
3.4 percent) in that order.
12.4 CAUSES OF CHANGES IN COMPOSITION &
DIRECTION OF TRADE
12.4.1 Changes in Composition:
By the end of the 20th Century in the period of 50 years after
independence, India from a predominantly primary goods exporting
country has become a country whose exports comprise mainly non-
primary goods. Some of the factors responsible for this are :
(i) Qualitative change in human Capital :
Around 1950, India‘s 86.67 percent population was illiterate.
At present more than 60 percent population is literate. Literacy
increase productivity of labour force, besides other changes.
(ii) Technical and Scientific Education:
Under the British, education meant mainly training people
administrative work. During the five year plan period the nature and
structure of education under went a major change. A large number
of engineering colleges, technical institutions, research and
development (R & D) institutes provided technical and scientific
education. Medical colleges too contributed in improving health of
the people.
(iii) Industrialisation:
229
From the second five year plan onwards, industrial sector
was given importance. In order to industrialise the economy, priority
was given to capital goods producing countries. As a result India
not only produced many industrial products but acquired the
capacity to manufacture many sophisticated capital goods. This is
reflected. In the decline in our capital goods imports and increase in
their exports.
(iv) Tapping Resources :
Science and Technology has helped us tap untapped
resources and use them in efficient ways. New and additional
resources enabled us produce new products.
(v) Improvement in Service Sector:
India has slowly changed itself into a knowledge economy
thanks to its large number of scientific and trained manpower.
Besides there has been a multiple increase in the number of people
acquiring general higher education. All these changes has helped
us increase our exports of service. The above changes have also
made India a destination of outsourcing a variety of services by
developed countries.
(vi) Dynamic Changes:
Trade Theories in their original forms are static theories.
When we accept dynamic changes which an economy undergoes
over a period of time. The comparative cost enjoyed by a country in
the production of goods and services too changes. A country
acquires cost advantage in the existing as well as in new products,
perhaps losing cost advantage in some other goods and services
as a result of the above discussed dynamic changes. In a dynamic
economy, comparative advantage under goes changes.
230
(vii) Inward looking Trade Policy:
Till 1980‘s India followed an inward looking policy where by
domestic industries were protected from foreign competition. This
policy though criticized as one which violated the principle of
comparative coast advantage it nevertheless helped us build up an
industrial base. In the process with the emerging socio-economic
changes we could acquire comparative advantage in the production
of many goods and services.
12.4.2 Direction of Trade:
The importance of developed countries as export markets
and source of imports has been steadily declining. The share of
developing countries has registered an increase. The important
reasons are:
(i) Proximity: Geographical proximity of many developing
countries, specially Asian, West Asian and African countries and
the consequent advantage in transport cost has helped us increase
our exports to them.
(ii) Similar level of development: Most of the developing
countries are in a similar stage of development thus making taste
and demand for goods and service also similar. India could export
many of its consumer and producer goods to these countries, as
we have a cost advantage in their production.
(iii) Demand from best Developed Countries: India is in a
position to export capital goods technology and services needed by
the least developed countries. Being better placed in science and
technology. India could produce the type of capital goods and
technology that those countries are in need of.
12.5 EXPORT AND IMPORT POLICY ( EXIM POLICY)
231
12.5.1 EXIM POLICY IN THE PRE-REFORM PERIOD (1947-
1991):
During freedom struggle ‗Swadeshi Movement‘ has played
very important role. So even after independence anything ‗foreign‘
become a kind of symbol of imperialism. Hence during planning
period massive industrialization was initiated (Especially during the
second and the third five year plans) ‗Self-reliance became the long
term goal of the economy. As a result India started producing
everything from pin to planes and even satellite. In order to protect
domestic infant industries imports were severely restricted. A very
comprehensive policy to regulate imports was designed which
included import licensing import quotas and import duties. Imports
of consume goods were almost banned. At times imports of highly
essential consumer goods were allowed but that responsibility was
assigned to certain government agencies. Even imports of capital
goods were subjected to highly discretionary imports licensing
policy.
(i) Import Restriction :
The second five year plan began in 1956-57 with the aim of
rapid industrialization in diversified areas. This required large scale
imports of capital goods. This required large amount of foreign
exchange. In pre-Green Revolution Era Government also had to
import food grains to prevent starvation death during famines. So
rationing of scare foreign exchange become need of the hour. The
import licensing policy was designed to make optimum use of
scarce foreign exchange. The import licence specified, who can,
how much from where and for what purpose would import. Imports
were classified into different categories e.g. limited permissible,
automatic permissible and under open general licence (OGL). OGL
means imports are allowed without clearance from chief controller
of Imports and Exports. As imports expenses started increasing,
scarcity of foreign exchange became more and more acute. As a
result successively more and more commodities were brought
under Import regulations.
(ii) Import Substitution:
232
It means the country tries to produce those commodities
which it was importing earlier. In other wards country tries to be
self-reliant in the case of all its economic wants India planned
Import substitution in three phases.
i) Substitution of Imported consumer goods by domestic
production.
ii) Substitution of imported capital goods.
iii) Reduce depending on foreign technology and replace it by
indigenous technology.
Import restriction and import substitution both taken together are
called as ‗Inward looking‘ policy. In the initial phase of development
such inward looking policy encourages rapid industrialization but if
such policy is pursued over a long period of time, as it happened in
case of India, then it does more harm to the economy than good.
(iii) Import Liberalization in 1980 s :
Import liberalization began in 1977-78. During 80‘s
liberalization of imports was speeded up. The list of items under
Open General Licence Category started increasing. In 1978 only 79
items were under OGL but in late 80‘s more than 1000 items were
under OGL. Easy availability of imported industrial inputs
encouraged process of modernization in the Indian Industries . This
also increased use of imported inputs in export industry. As a result
Indian exports become more competitive in the world market.
(iv) Exports in Pre-Reform Period:
Though export promotion was always considered as
important policy goal in India, in reality for first three decades after
Independence export promotion was not given enough weightage.
Exports were only expected to earn enough foreign exchange so
that we can buy necessary imports. But in a situation where
233
demand for imports is ever increasing and imports are price
inelastic then aggressive promotion of exports becomes the only
way out. So from 1980s very positive Export promotion strategy,
was designed which included setting up of Export Processing Zone
(EPZs) and 100 percent Export Oriented Units (EOUs)
12.5.2 EXIM POLICY POST REFORM PERION (1991 ONWARD)
(i) New Economic Policy (NEP) Came into existence in 1991. The
policy ushered in many fundamental changes in the functionary of
the Indian economy Trade Reforms was one of the major thrust
areas of NEP. NEP was an outcome of two reasons (i) Honest
introspection of functioning of Indian economy revealed failure of
Licence, Permit, Quota, Raj and (ii) Pressure of International
agencies like IMF, to undertake massive restructuring of the
economy.
In 1995 India joined World Trade Organisation (WTO). So
liberalization of trade polices consistent with WTO norms became
obligatory.
(ii) HIGH LIGHTS OF NEW TRADE POLICY:
a. Simplification and liberalization of imports and exports : By
2001-02 all quantitative restriction on imports have been remove.
b. Reduction in maximum import Duty : Successive budgets
reduced highest rate of imports duty from 110 percent (before
1993-94) to about 10 percent of non-agricultural products.
c. Convertibility of Rupee : Rupee convertibility was introduced in
a phased manner. Initially partial convertibility was introduced on
trade account under which exporters had to surrender only 40
percent of their earning to the Government. Remaining 60 percent
234
they could keep with themselves. In March 1993 full convertibility
on trade account was introduced. Next Year in March 1994 rupee
became convertible on current account. Convertibility on capital
account is not yet hundred percent; but very rapidly India is moving
towards it.
d. Exchange Rate Reforms : Before Reforms India was following
the policy of ‗the Basket Peg‘ Indian rupee was pegged to a basket
of selected currencies. At present market sources of demand and
supply decide to rate of exchange, though RBI acts as a watch dog
and prevents excessive speculation.
e. Trading Houses : Under 1992-97 Trade Policy export houses
and trading houses were provided the benefit of self-certification
under the advance license system, which permits duty-free imports
for exports. New categories of trading houses were introduced such
as super star Trading houses. Efficient export units were rewarded
by giving them additional facilities and encouragement.
f. Special Economic Zone (SEZs) : SEZ is one of the major
export-promotion measures SEZ promises internationally
competitive and hassle – free environment for exports. Export
oriented unit scheme (EOUs) is complementary to SEZ scheme.
g. Market Access Initiative Scheme : This scheme helps
exporters in marketing their products abroad. It conducts market
surveys and create data base.
h. Exports of Services : EXIM Policy 2002-07 emphasized
export of services. More than 50% of India‘s GNP is generated in
service sector. So accordingly composition of exports also should
change. For this, service exporters are given incentives and
allowed duty free imports up to specified limit.
235
i. Tar benefits to facilitate ‘Convergence revolution : Three
integral parts of the convergence revolution – the Informational
Technology Sector, communication sector and Entertainment
industry are aggressively promoted.
j. Regional Advance Licensing Committee (RALC): This is to
speed up issue of licence to exporters. The decentralization will
save time and energy of exporters RALC is also empowered to
redress grievances of traders.
(iii) FOREIGN TRADE POLICY (FTP) 2004-09 :
On August 31, 2004 a new Foreign Trade Policy for the
period 2004-09 was announced by the union commerce and
Industry Minister Mr. Kamal Nath.
Main Features of FTP 2004-09:
(i) One major objective of FTP 2004-09 is to double India‘s share in
world exports from 0.75 percent to 1.5 percent by 2009.
(ii) FTP 2004-09 identified five Trust Sectors. These sectors are
with significant exports potentials and are labour intensive. These
are – Agriculture, handicrafts, handlooms, Gems and Jewellery and
leather and foot wear. E.g. for agriculture, Vishesh Krishi Upay
Yojana was introduced.
(iii) ‘Served from India’ : This is to promote export of services. For
this brand served from India needs to be developed Different
categories of services are offered different duty credit entitlements.

236
(iv) New categories of star houses were introduced as per their
export performance in recent years. According to their status
various facilities are granted to these houses.
(iv) Target plus Scheme: Exporters exceeding their annual target
of exports would be rewarded under this scheme in terms of
entitlement to duty free credit based on incremental export
earnings.
Setting up of free Trade and Warehousing Zone (FTWZs)
these are meant for creation of trade related infrastructure.
Fourth Supplement to foreign Trade Policy : (EXIM 2004-09) was
announced in April 2008. Highlights of the supplement are as
follows:
- Export target: 30 percent growth i.e. $ 200 billion in 2008-09.
- Target of reaching 5 percent in World Trade by 2020.
- To control inflation ban on exports of Inflation sensitive
commodities.
- Income tax exemption to EOU extended till 2010.
- DEPB (Duty Entitlement Pass Book Scheme) Extended upto
May 2009.
- Trade facilitations through Electronic Data information system to
match world class standard of two hours or less.
12.6 SUMMARY
Foreign trade is considered as the ‗Engine of Growth‘. India
till recently was predominantly a primary goods exporting and
mainly an industrial importing country. From the above analysis. It
is clear that India‘s foreign trade has witnessed drastic change in
237
India‘s foreign trade. Now India‘s export basket is composed of
technologically sophisticated capital goods, consumer durable
goods, IT services etc. The direction of India‘s foreign trade has
also experienced a sea change in it. There is a directional shift from
developed countries to the developing countries, particularly to
South East Asian countries, African countries, and Latin American
Countries. However, India still lacks its share in the world trade is it
countries to be less than 1 percent.
12.7 QUESTIONS
1. Explain the changes in composition of India‘s foreign trade
since 1991.
2. Discuss the directional change in India‘s foreign trade.
3. What are the causes of change in composition and direction
of foreign trade?
4. Write notes on:
(a) Composition of India‘s trade.
(b) India‘s trade with developing countries.
(c) Causes of changes in composition and direction of trade.
238
13
INDIA’S BALANCE OF PAYMENTMENTS
POSITION
UNIT STRUCTURE
13.0 Objectives
13.1 Introduction
13.2 Structure of Balance of Payments
13.3 India‘s Balance of Payments Position since 1991
13.4 Positive aspects of Recent Balance of Payments Position in
India
13.5 Causes of Balance of Payments Deficits
13.6 Export promotion – Ideal solution to correct Disequilibrium in
Balance of Payments
13.7 Summary
13.8 Questions
13.0 OBJECTIVES
After reading this unit you will come to know:
- The concept and structure of balance of payments.
- The current and capital account balances.
- Deficit and surpluses in the balances of payments.
- India‘s balance of payments position since 1991.
- Causes of balance of payments deficits.
- Solution to correct disequilibrium in balance of payments.
239
13.1 INTRODUCTION
Most of the exports and imports involve finance i.e. receipts
and payments in money. An account of all receipts and payments is
termed balance of payments. ―The balance of payments of a
country is a systematic record of all economic transactions between
the residents of the reporting country and residents of foreign
countries during a given period of time. The term ‗residents is
broadly interpreted as all individuals, businesses and governments
and their agencies, international organizations all classified as
foreign residents. Economic transactions which enter into the
balance of payments record, involve transfer of one country to the
residents of the rest of the world.
The balance of payments situation in India was satisfactory
in the first five year plan as the deficit in current account was
merely Rs. 42.3 crore. During this period, the trade deficit was
financed by net receipts from the invisibles and transfers. The
current account deficit was there fore very small.
However, the period since the second plan was marked by
extreme difficulties on the balance of payments front excepting a
few years, as foreign exchange payments consistently remained
higher than foreign exchange receipts. By the end of 1980, the
situation reached crisis point. The trade deficit stood at 3.2 percent
of GDP; the current account deficit increased to 2.2%. It was
necessary to finance the deficit by resorting once again in 2004-05
trade balance was - 5.3 percent of GDP. However, current account
deficit was only – 0.8 percent of GDP. The situation therefore was
very much under control.
13.2 STRUCTURE OF BALANCE OF PAYMENTS
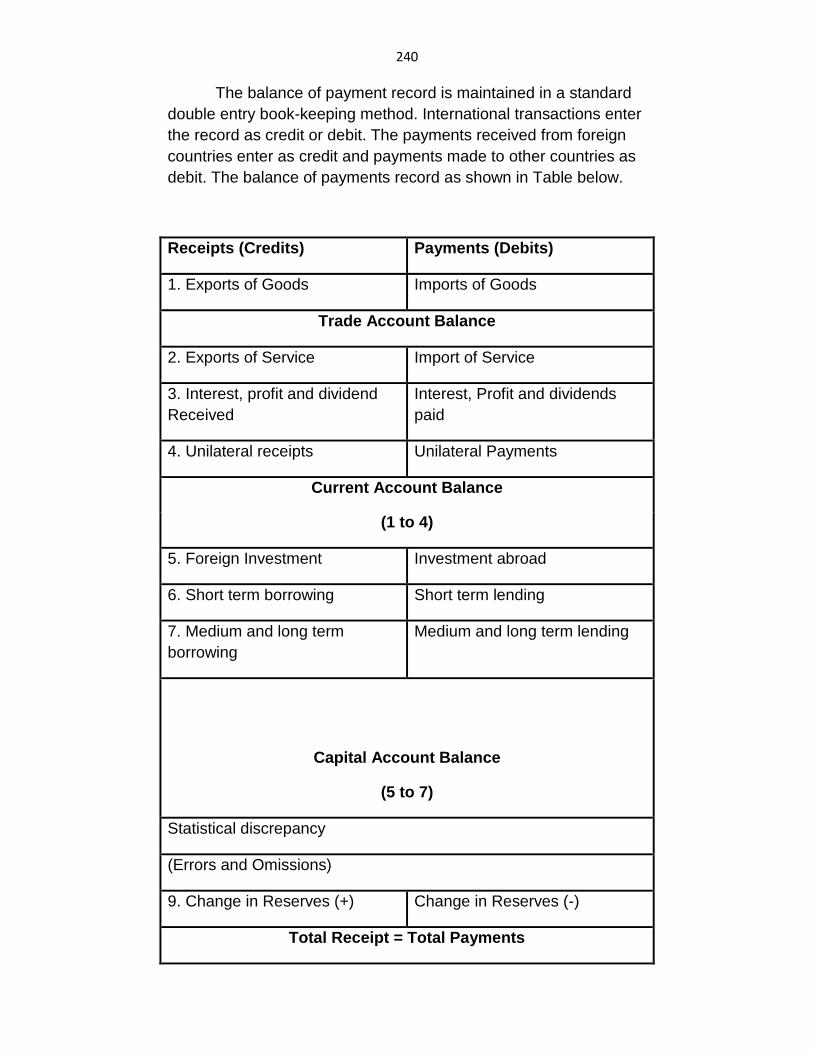
240
The balance of payment record is maintained in a standard
double entry book-keeping method. International transactions enter
the record as credit or debit. The payments received from foreign
countries enter as credit and payments made to other countries as
debit. The balance of payments record as shown in Table below.
Receipts (Credits) Payments (Debits)
1. Exports of Goods Imports of Goods
Trade Account Balance
2. Exports of Service Import of Service
3. Interest, profit and dividend
Received
Interest, Profit and dividends
paid
4. Unilateral receipts Unilateral Payments
Current Account Balance
(1 to 4)
5. Foreign Investment Investment abroad
6. Short term borrowing Short term lending
7. Medium and long term
borrowing
Medium and long term lending
Capital Account Balance
(5 to 7)
Statistical discrepancy
(Errors and Omissions)
9. Change in Reserves (+) Change in Reserves (-)
Total Receipt = Total Payments
241
13.2.a The Current and Capital Account:
The balance of Payment account is traditionally classified
into (i) current account and (ii) capital account. However it can be
vertically divided into many categories as per the requirements.
The current account includes No. 1, 2, 3 and 4 in above
table. They comprise (i) export and import of goods which are
traditionally referred as visible or tangible. Exports and imports, (ii)
exports and imports of services insurance, transport, profits and
dividends (iii) unilateral receipts or payments which are also
referred as transfer payments include gifts, donations, private
remittances etc. received by the residents or paid to the residents
of other countries. Such receipts and payments do not have any
counter obligation i.e. they are received free.
Exports are normally calculated f.o.b. (free on board) i.e. the
cost of transportation insurance etc. are not included in the value of
goods exported. The imports are calculated C.I.F. (Coast,
insurance and freight) i.e. the cost of transport and insurance etc.
are included. Though items non 1, 2, 3 and 4 come under current
account, the first two items attract more attention. The usual
differentiation is trade in goods and trade in services. The balance
between exports and import of goods is referred as balance of
trade. It is also referred as the balance of visible trade or as the
balance of merchandise trade. The net balance of exports and
imports in services is termed as the balance of invisible trade.
The net value of the balance of items nos 1 to 4 is called, the
balance on current account.
13.2.b The Capital Account Balance:
The capital account records all receipts and payments that
involve the residents of a country changing either their assets of
242
liabilities to residents of other countries. The transaction under this
title involve direct investment, portfolio investment and borrowings
and lending from and to other countries.
Direct investment is undertaken mostly by multinationals.
There may be few individuals who acquire same assets mainly in
the from of houses in some foreign country.
Portfolio investment refers to the acquisition of financial
assets in foreign countries. Purchase of shares of a foreign
company, bonds issued by a foreign government are some
examples. Investment are classified into short term and long term
investments. The short and long term indicate less of time
dimension but more of nature of assets. A purchase of government
bond usually comes under long time investments though it may
mature within a few months.
Acquiring of assets through direct or portfolio investment
appear as a negative item in the capital account of the balance of
payments record of the reporting country and as a positive item in
the capital account of the other country. All capital outflows
(investments or lending‘s) appear as negative (payments or debits)
items as the money goes out of the economy. Similarly all capital
inflows (foreign investments or borrowings from other countries) are
positive item though some of them may increase the liabilities of the
receiving country. To avoid any confusion it should be kept in mind
that all capital inflows are recorded as credit and outflows as debit.
The net value of all the items in the capital account is referred as
the balance on capital account.
Statistical discrepancy (errors and omissions) reflects
transactions that here not been recorded for various reasons and
so cannot be entered under a standard beading but must appear
since the full balance of payment account must sum to zero. It also
reflects the difficulties involved in recording accurately numerous
transactions that take place during a given period.
243
Foreign exchange reserves in item no. 9. shows the
reserves are held in the form of foreign currencies usually in hard
currencies like dollar, pounds etc. gold and special Drawing Rights
(SDRs), foreign exchange reserves are analogous to an individual‘s
holding of cash, they increase when the individual has a surplus in
his transaction and decrease when he has a deficit. If a country‘s
foreign exchange reserves aboard rise that transactions is a minus
item in that country‘s payments account because money is being
sent out of the country to purchase foreign financial assets. A
reduction in foreign exchange reserve abroad is a plus item as it
result in flow of foreign exchange or increase in that countries
liabilities (borrowings).
13.2.C The Basic Balance:
The basic balance is the sum of the current account and
capital account, when the two sides of the current and capital
account are equal i.e. when the difference between the two is equal
to zero, the basic balance is achieved. An increase in deficit or
reduction in surplus or a more from surplus to deficit is considered
worsening of the basis balance. Basic balance as Bo Sodersten
points out, need not necessarily be a happy state of affairs. A basic
balance achieved through long term borrowing from abroad may
lead to future problems at the time of repayment. Similarly an
outflow of capital may indicate a deficit currently but may earn
project and dividends in the future which will help to improve the
current account balance.
13.2.d Deficits and surpluses in the BOP:
The balance of payments always balances in a technical or
accounting sense. The balance in the balance of payment implies
that a net credit in any one of the items must have a counter part
net debit in another. When the total credits and debits of all
accounts balance, we say the balance of payment balance. A clear
picture of deficit or surplus is revealed when we examine that
balance of payments statements splitting it vertically into current
account and capital account. It is in the current account that the
244
surplus or deficit becomes more evident. A current account surplus
is achieved when the export of goods and services are greater than
their imports. A reserves situation results in deficit in current
account deficit has to be corrected by a accommodating inflow of
capital the balance of payments is in deficit. In other words if the
autonomus receipts are less than autonomous payment, the
balance of payments is said to be in deficit. It is in surplus when
such receipts are more than the payments.
13.2.e The Autonomous and Accommodating Capital Flows:
The balance of payment is broadly divided into current account and
capital account through the adjustment in the latter.
The inflow and outflow of foreign exchange are broadly divided into
(i) autonomous flow and (ii) accommodative flow.
Autonomous flows takes place in the ordinary course of
foreign trade they are independent of other items in the balance of
payments. Accommodative flow take place to equalize the balance
of payments. The distinction between the two can be brought out
clearly with the help of table given below
Autonomous and Accommodative Transaction
Credits $ Debits $
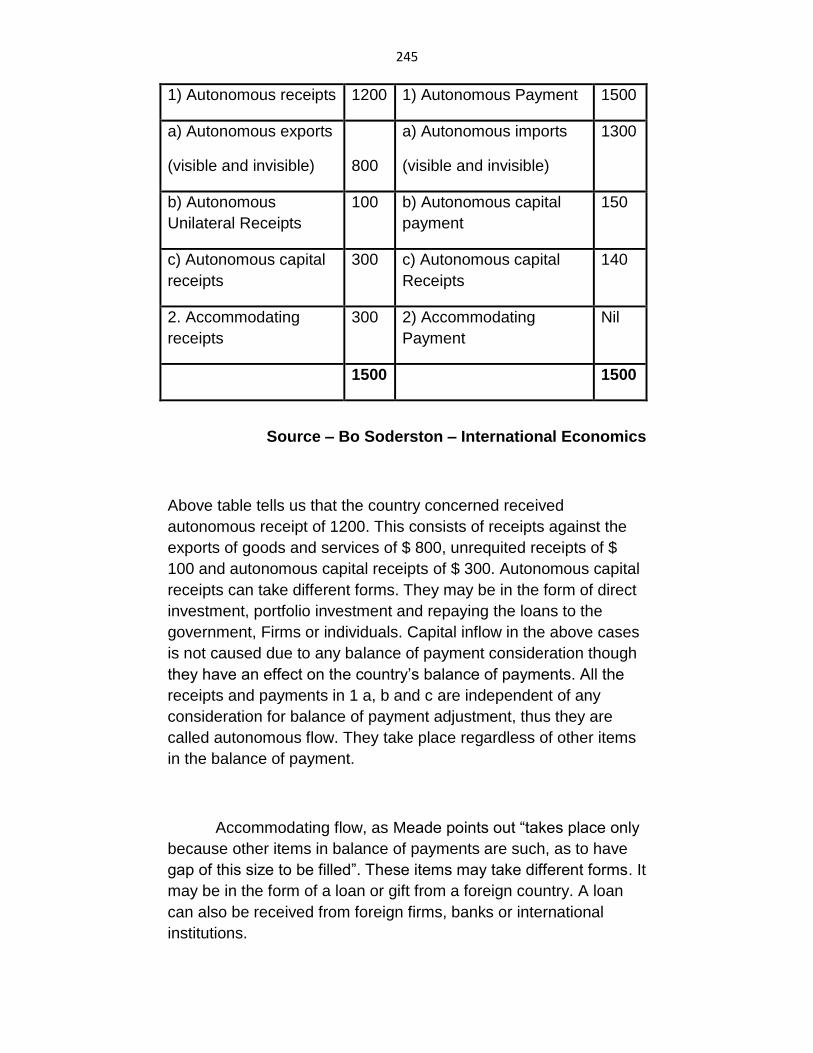
245
1) Autonomous receipts 1200 1) Autonomous Payment 1500
a) Autonomous exports
(visible and invisible)
800
a) Autonomous imports
(visible and invisible)
1300
b) Autonomous
Unilateral Receipts
100 b) Autonomous capital
payment
150
c) Autonomous capital
receipts
300 c) Autonomous capital
Receipts
140
2. Accommodating
receipts
300 2) Accommodating
Payment
Nil
1500 1500
Source – Bo Soderston – International Economics
Above table tells us that the country concerned received
autonomous receipt of 1200. This consists of receipts against the
exports of goods and services of $ 800, unrequited receipts of $
100 and autonomous capital receipts of $ 300. Autonomous capital
receipts can take different forms. They may be in the form of direct
investment, portfolio investment and repaying the loans to the
government, Firms or individuals. Capital inflow in the above cases
is not caused due to any balance of payment consideration though
they have an effect on the country‘s balance of payments. All the
receipts and payments in 1 a, b and c are independent of any
consideration for balance of payment adjustment, thus they are
called autonomous flow. They take place regardless of other items
in the balance of payment.
Accommodating flow, as Meade points out ―takes place only
because other items in balance of payments are such, as to have
gap of this size to be filled‖. These items may take different forms. It
may be in the form of a loan or gift from a foreign country. A loan
can also be received from foreign firms, banks or international
institutions.
246
According to W. M. Scammell‘s classification, every item in the
balance of payments can be autonomous as well as
accommodating. The only difference is that an accommodating flow
takes place to fill the gap between autonomous receipts and
payments. In above table $ 300 accommodating flow is recorded to
balance the balance of payments.
The concept of surplus and deficit becomes more clear when
the receipts and payment are viewed as autonomous and
accommodating in the above table autonomous receipts are $ 1200
and autonomous payments are $ 1500. The gap of $ 300 is the
deficit which is required to be bridged by an accommodating inflow
of $ 300. Therefore a deficit in balance of payment arises when
autonomous payment are more than autonomous receipts. A
surplus is the result of autonomous receipts being greater than
autonomous payments. The concept of surplus and deficit can be
restarted as follows.
Autonomous receipts > autonomous payments = Surplus
Autonomous receipts < autonomous payment = deficit
All the items under autonomous flows are those items
considered as the items above the line i.e. item no 1(a) (b) and (c)
in above table and the accommodating items as below the line i.e.
item no. 2 in above table. The line thus indicates the basic balance.
The balance of payments is in equilibrium if the autonomous
receipts are equal to autonomous payment. The balance of
payments balance when all the items above and below the line are
taken and the deficit in autonomous items is corrected by
accommodating items.
13.3 INDIA’S BALANCE OF PAYMENTS POSITION
SINCE 1991
The decade of 1990‘s started with a serious problem in
balance of payment. The Gulf crisis of 1990 led to an
unprecedented crisis in the balance of payments. The crisis
reached its peak in the summer of 1991 when the foreign currency
247
reserves had fallen to almost 11 billion, inflation had risen to an
annual rate of 17 percent, industrial production was falling and
overall economic growth had declined to 1.1 percent in 1990-91
when the oil prices increased to 3.1 percent GDP in 1990-91. There
was also deterioration in the invisibles account because of lower
remittances and higher interest payments. Foreign exchange
reserves started to decline from September 1990. They declined
from Rs. 5480 crores ($ 896 million) in January 1991. During this
period the Government had to take recourse to IMF to overcome
the balance of payment difficulties. The main factor responsible to
the sharp fall in reserves was the sharp rise in the imports of POL.
However, the payments crisis of 1990-91 was not simply due to
deterioration on the trade account it was accompanied by other
adverse developments on the capital account reflecting the loss by
confidence in the Government‘s ability to manage the situation
political uncertainty at home, coupled with rising inflation and
increase in fiscal deficit, led to a loss of international confidence.
India‘s recourse to the commercial borrowing totally dried up
as the credit rating agencies down graded India. Simultaneously
there began an outflow of non-resident Indian deposits. In addition
there were serious difficulties in the rolling over of short-term credit,
which was roughly of the order of $ 5 billion. While current account
deficit of the order of $ 8 billion was easily financed in 1988-89, a
deficit of $ 9.7 billion in 1990-91 become almost impossible to
finance.
By June 1991, the balance of payments crisis had become
over whelmingly a crisis of confidence. i.e. a crisis of confidence in
the Government‘s ability to manage the balance of payment. A
default on payments had become a serious possibility in June 1991
for the first time in the Indian history.
A default is essentially, a failure to repay debts, but it‘s a
ramifications are never confined to it. A default in payments
inevitably and normal payments arrangements suppliers become
reluctant to sell goods and services and insist on advance payment
through books of their own country. This leads to severe trade
disruption which in turn forces severe and prolonged import
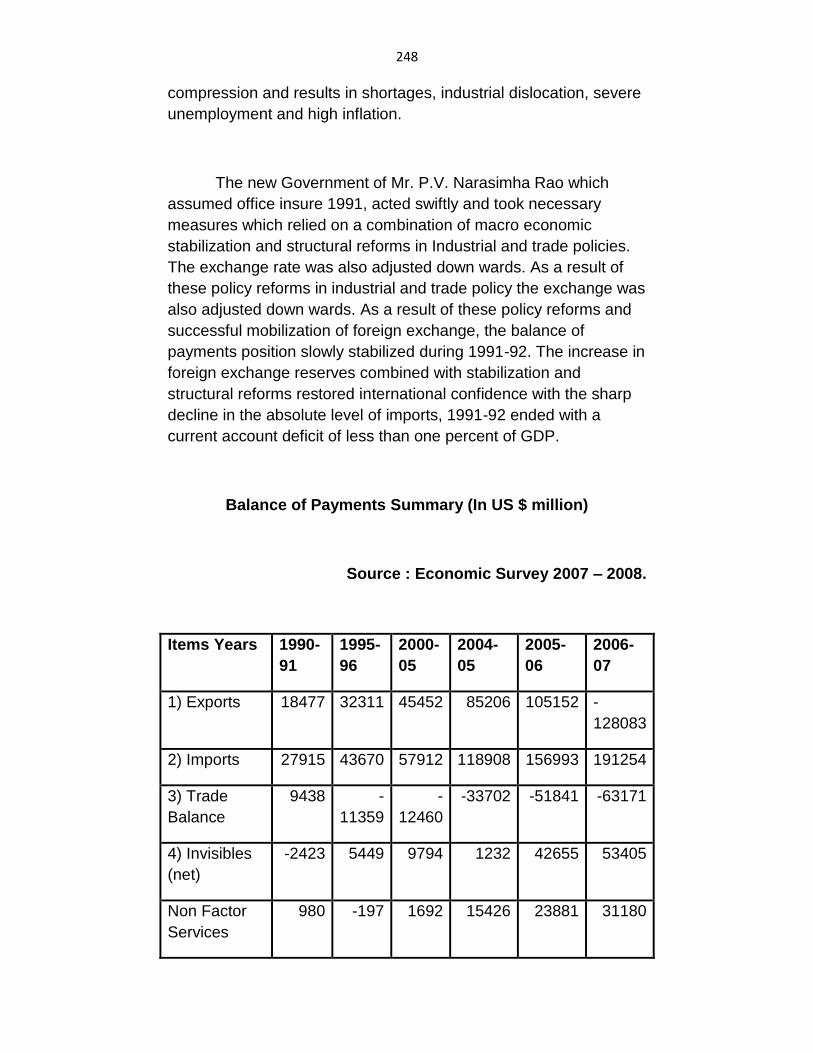
248
compression and results in shortages, industrial dislocation, severe
unemployment and high inflation.
The new Government of Mr. P.V. Narasimha Rao which
assumed office insure 1991, acted swiftly and took necessary
measures which relied on a combination of macro economic
stabilization and structural reforms in Industrial and trade policies.
The exchange rate was also adjusted down wards. As a result of
these policy reforms in industrial and trade policy the exchange was
also adjusted down wards. As a result of these policy reforms and
successful mobilization of foreign exchange, the balance of
payments position slowly stabilized during 1991-92. The increase in
foreign exchange reserves combined with stabilization and
structural reforms restored international confidence with the sharp
decline in the absolute level of imports, 1991-92 ended with a
current account deficit of less than one percent of GDP.
Balance of Payments Summary (In US $ million)
Source : Economic Survey 2007 – 2008.
Items Years 1990-
91
1995-
96
2000-
05
2004-
05
2005-
06
2006-
07
1) Exports 18477 32311 45452 85206 105152 -
128083
2) Imports 27915 43670 57912 118908 156993 191254
3) Trade
Balance
9438 -
11359
-
12460
-33702 -51841 -63171
4) Invisibles
(net)
-2423 5449 9794 1232 42655 53405
Non Factor
Services
980 -197 1692 15426 23881 31180
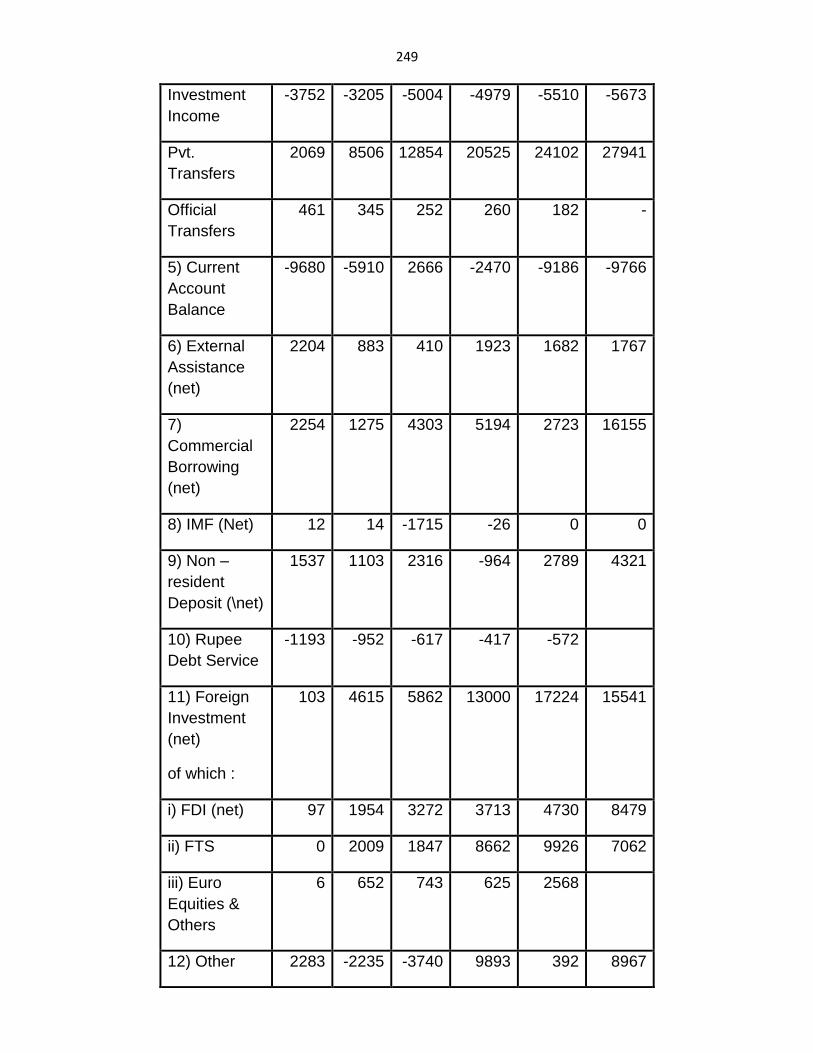
249
Investment
Income
-3752 -3205 -5004 -4979 -5510 -5673
Pvt.
Transfers
2069 8506 12854 20525 24102 27941
Official
Transfers
461 345 252 260 182 -
5) Current
Account
Balance
-9680 -5910 2666 -2470 -9186 -9766
6) External
Assistance
(net)
2204 883 410 1923 1682 1767
7)
Commercial
Borrowing
(net)
2254 1275 4303 5194 2723 16155
8) IMF (Net) 12 14 -1715 -26 0 0
9) Non –
resident
Deposit (\net)
1537 1103 2316 -964 2789 4321
10) Rupee
Debt Service
-1193 -952 -617 -417 -572
11) Foreign
Investment
(net)
of which :
103 4615 5862 13000 17224 15541
i) FDI (net) 97 1954 3272 3713 4730 8479
ii) FTS 0 2009 1847 8662 9926 7062
iii) Euro
Equities &
Others
6 652 743 625 2568
12) Other 2283 -2235 -3740 9893 392 8967
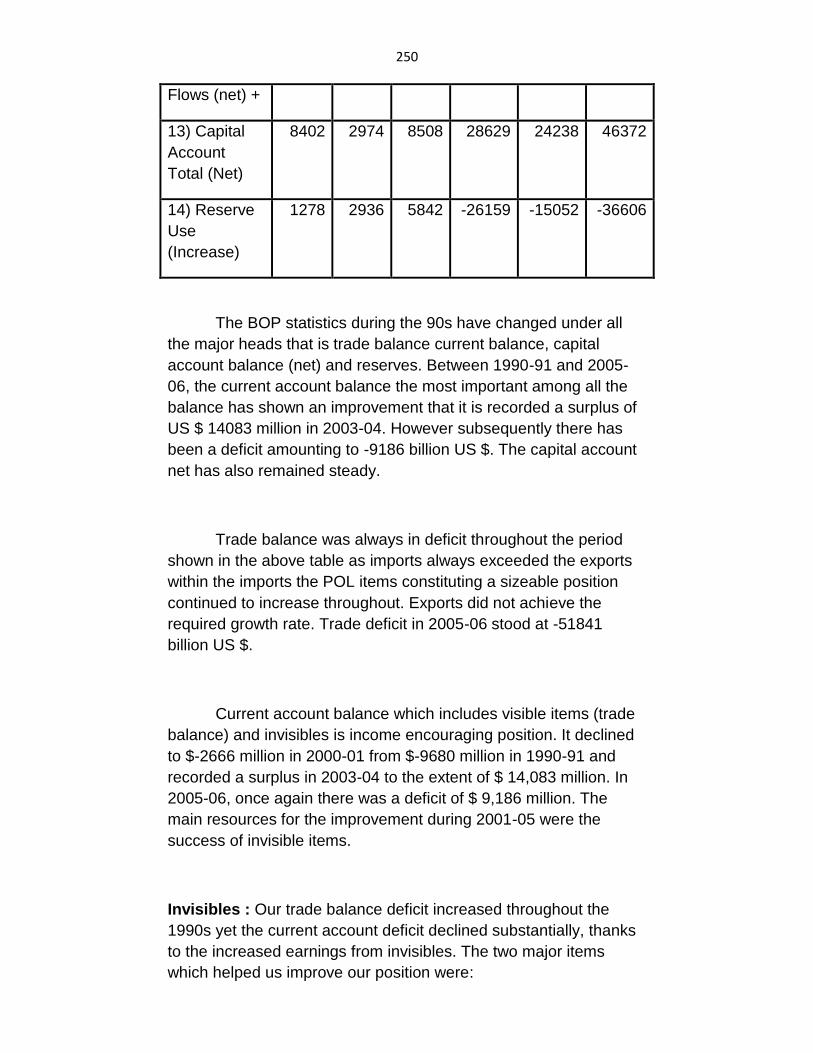
250
Flows (net) +
13) Capital
Account
Total (Net)
8402 2974 8508 28629 24238 46372
14) Reserve
Use
(Increase)
1278 2936 5842 -26159 -15052 -36606
The BOP statistics during the 90s have changed under all
the major heads that is trade balance current balance, capital
account balance (net) and reserves. Between 1990-91 and 2005-
06, the current account balance the most important among all the
balance has shown an improvement that it is recorded a surplus of
US $ 14083 million in 2003-04. However subsequently there has
been a deficit amounting to -9186 billion US $. The capital account
net has also remained steady.
Trade balance was always in deficit throughout the period
shown in the above table as imports always exceeded the exports
within the imports the POL items constituting a sizeable position
continued to increase throughout. Exports did not achieve the
required growth rate. Trade deficit in 2005-06 stood at -51841
billion US $.
Current account balance which includes visible items (trade
balance) and invisibles is income encouraging position. It declined
to $-2666 million in 2000-01 from $-9680 million in 1990-91 and
recorded a surplus in 2003-04 to the extent of $ 14,083 million. In
2005-06, once again there was a deficit of $ 9,186 million. The
main resources for the improvement during 2001-05 were the
success of invisible items.
Invisibles : Our trade balance deficit increased throughout the
1990s yet the current account deficit declined substantially, thanks
to the increased earnings from invisibles. The two major items
which helped us improve our position were:
251
i) non factor services, and software service. Exports emerged as
the second largest item of invisible receipts. Since 1995, its export
has registered on annual growth rate ranging from 50 to 55 percent.
During this period the private transfer receipts also increased
from $ 2069 million in 1990-91 to $ 24102 million in 2005-06. The
private remittances accounted to about 65 to 70 percent of the total
private transfers. The infusion of local redemption of non-resident
deposits since 1996-97 was another reason for progress shown this
item.
The current trend of outsourcing a number of Jobs by the
developed countries to the developing ones is also helping us to
get more jobs and earn additional foreign exchange.
Capital account has been positive throughout the period.
NRI deposits and foreign investments both portfolio and direct have
helped to a great extent, commercial borrowings have registered a
decline so also the external assistance.
Reserves have changed during this period depending on a
balance between current and capital account. An increase in inflow
under capital account has helped us to build up our foreign
exchange reserves making the county quite complex-table on this
count. In April 2007 we had $ 203 billion foreign exchange services.
13.4 POSITIVE ASPECTS OF RECENT BALANCE OF
PAYMENTS POSITION IN INDIA
After introduction of New Economic Policy, BOP situation
improved remarkably. The following factors helped in the
satisfactory performance on BOP front.
252
13.4.i) Foreign Direct Investments (FDI) and foreign
Institutional Investments (FII)
Increased substantially in the post-liberalization era. As a
result inflows on capital account were much more than the deficits
on the current account. Net inflows on capital account were $ 9882
million 1993-94 which had gone upto $ 46372 million 2006-07.
13.4. ii) NRI Deposits :
NRI deposits were $ 1205 million 1993-94 which have gone
up to $ 4321 million in 2006-07 which is little more than 9% of total
capital inflows of that years.
13.4. iii) Rise in external commercial borrowings during 80’s :
Share of external commercial borrowings was about 25% of
total capital inflows in the economy. In year 1998-99 it had gone up
to 55.4%. However, in the recent past about 1/3 of capital inflows
are in the form of commercial borrowings.
13.4.(iv) Increase in earnings from invisibles :
In 1993-94 Net invisibles were $ 2892 million. In 2006-07 net
invisibles were $ 53405 million. For the period 2001-04, earnings
from invisibles exceeded the deficit on trade balance. Even after
this period invisibles cover about 80-90% of trade deficit. Rapid
increase in software exports almost doubling of remittances in last
five years are major factors behind this.
13.5 CAUSES OF BALANCE OF PAYMENTS DEFICIT
253
13.5.1) Rise in Imports:
The rise in imports has been the most important factor
responsible for the large balance of payments Deficits. The imports
have risen from $ 27,915 billion in 1990-91 to 1,56,993 crore in
2005-06. In the early stages, particularly during the second and
third plans, imports consisted of capital goods like machines etc.
which were required to implement the heavy industry strategy of
industrial development. The share of capital good in total imports
declined in 1980 but started to pick up to the emphasis on
modernization and up gradation of technology of industrial and
infrastructural sectors.
The other important items of imports have been cereals and
edible oils. The edible oil imports started to rise after 1975-76 and it
constitutes a major item in imports. The share of POL imports
increased to about 29.5 percent of total imports in 2005-06. The
increase in POL imports coincided with the decline in domestic
production specially from off share fields. The growth of POL
imports have increased partly due to increase in crude oil price.
The causes for rapid expansion of imports can be summarized as :
a) India adopted inward looking strategy which required large
imports in the initial stage with a view to broaden industrial
base.
b) Increase in export related imports especially in the case of gems
and Jewellery and capital goods.
c) Increase in the imports of raw materials required for industries.
d) Rise in the price and volume of POL imports since 1974-75.
254
e) Increase in the import items required for economic growth under
liberalization and privatization.
f) A step rise in the price of creation raw materials.
13.5.2 Devaluation and Depreciation of the rupee :
An important factor contributing to the rise in the balance of
payment deficit has been the devolution of the rupee in 1966 and
1991. The Indian rupee was devalued vis a vis all major currencies.
This to as the sharpest depreciation of the rupee except for some
temporary appreciation. All these have led to an increase in the
price of imports.
Though exports have becomes cheaper, the low price and
income elasticity of demand for exports have resulted in a slow
increase in exports. Imports on the other hand have not declined
due to their low price elasticity of demand.
13.5.3 Slow rise in export earnings:
Even though export earnings rose, they were not sufficient
enough to meet the rising imports. A numbers of measures taken
by the government in the form of incentives or assistance to
exporters have led to an increase in exports in the recent years.
However, the rise in exports, particularly in recent years, has
neither been substantial nor continuous. The growth rate in exports
has not been sufficient enough to finance the rising imports.
13.5.4 Competition from other Countries:
255
India‘s exports are affected by competition from other
countries. India faces tough competition from developing countries
like Taiwan and South Korea in exports of manufactured items like
garments. In the case of natural products. India has to face
competition from Philippines, Indonesia, Malaysia, Latin American
and African Countries. Recently China has become a major
competition.
13.5.5 Debt-Service:
Another important factor contributing to the balance of
payments has been the rising obligation‘s to meet amortization
payment. This has involved large sums on the return of loans and
large and large interest payment. Fortunately it has decreased from
35.3 to 6.2 percent of current receipts. This has saved us from
landing in international debt trap. In the liberal and globalize world
order India‘s balance of payments problem may aggravate while
imports will be increasing exports will find it difficult to keep pace
with increased imports. Reduction in cost by increasing efficiency
and becoming more competitive are the solutions for problem.
13.5.6 The recent slow appreciation of rupee against US $ may
affect our exports as they become costlier. Imports are likely to
increases they would be cheaper.
13.6 EXPORT PROMOTION – IDEAL SOLUTION TO
CORRECT DISEQUILIBRIUM IN BALANCE OF
PAYMENTS.
India has been experiencing deficit in its balance of
payments since independence. Thus the ideal solutions to correct
disequilibrium in balance of payment is to continuously increase
and promote exports. Export expansion is the best way to tackle
this deficit in Balance of payments. Efforts should be made to
increase our exports of invisibles. This is because India traditionally
exports agro based products like tea, coffee etc. Which have very
256
low price in international market. Indian software exports have
already prove their credentials in the international market. What is
needed is India should emerge as major exporter of other services
such as education, tourism, health, services etc. India also need to
develop and improve its ports, infrastructure, banking system,
technology to facilitate smooth exports. Besides, India must also
explore the possibilities to expand the exports to developing
countries of South East Asia, Africa & Latin America.
13.7 SUMMARY
Balance of payments refers to the systematic records of all
economic transactions between the residents of a country and the
residents of the rest of the world. Balance of payments consists of
trade account, current account and capital account. In accounting
sense balance of payments always balances. However, in
economic and in real sense balances of payments are either in
surplus or in deficits. India‘s balance of payments are in deficits
since Independence. The major reasons for such as large deficits in
India‘s balance of payments are tremendous rise in import bill,
devaluation and depreciation of Rupee, slow rise in export
earnings, stiff competition from other emerging economies such as
China, Brazil, South Africa & even countries like Shrilanka,
Bangladesh etc. The positive aspects of recent balances of
payments in India is quite interesting. Though the import bill is still
high, the export earnings have been rising in the country. The best
method to correct the deficits in the balance of payments is to
promote and expand exports.
13.8 QUESTIONS
1) Define balance of payments. Describe the structure of
Balance of Payments.
2) Discuss the position of India‘s balance of payments since
1991.

257
3) What are the causes of rise in deficits in India‘s balance of
payments? Suggest the remedial measures.
4) Write notes on:
(a) Current Account Balance
(b) Capital Account Balance
(c) Devaluation.
258
14
Foreign Exchange Market, Exchange Rate
Policy and Convertibility and Foreign Capital
Flows
UNIT STRUCTURE
14.0 Objectives
14.1 Introduction
14.2 Functions of Foreign Exchange Market
14.3 Determination of Exchange Rate
14.4 India‘s Exchange Rate Policy
14.5 Convertibility of the Rupee
14.6 Foreign Capital Flows
14.7 Foreign Portfolio Investment and Foreign Direct Investment
14.8 Summary
14.9 Questions
14.0 OBJECTIVES
After reading this unit you will come to know:
- Nature and functions of foreign exchange market.
- Exchange rate determination.
- India‘s exchange rate policy before and after 1991.
- Current Account and Capital Account convertibility.
- Distinction between Foreign Portfolio Investment and Foreign
Direct Investment.
259
14.1 INTRODUCTION
Foreign exchange market is a place (or arrangement) where
the purchase and sale of foreign exchange takes place. It is a
world-wide market. Anywhere in the world, wherever and whenever
there is buying and selling of one currency with another country‘s
currency is known as foreign exchange market. Exchange rate
refers to price of a country currency vis-à-vis another country‘s
currency in other wards how many Rupees (Indian Currency) is
equals to the value of American Dollar (US currency). If one US $
can buy goods which forty Indian Rupee buy then the exchange
rate between US $ and Indian Rupee is 1 $ = Rupees 40.
Exchange rates are determined by the interaction of the household,
firms and financial institutions that buy and sell foreign currencies to
make international payments. The major participants in the foreign
exchange market are: (a) Commercial Banks (b) Corporations
engaging in International Trade (e) Non-Banking financial
institutions (d) Retail – Clients (e) Foreign Exchange Brokers and
(f) Central Banks.
Exchange rate convertibility refers to the ability of residents
and non-residents to exchange domestic currency for foreign
currency, without limit, whatever be the purpose of the transactions.
In India, partial convertability of Rupee (j) was introduced in the
Budget for 1992-93 and full convertabilty of Rupee on Trade
Account in the Budget for 1993-94. In August, 1994, India achieved
full convertibility of rupee on current account.
Foreign capital flows into an economy in the form of aid,
borrowings, portfolio and direct investments. Donations and grants
also form a very small portion of foreign capital inflows. Foreign
Capital plays pivotal role for the economic development of any
country particularly a developing economy such as India. The inflow
of foreign capital in a developing economy is associated with the
inflow of foreign expertise & advanced know how.
260
It is thus, interesting to clearly understand the complex
nature of foreign exchange market, players in the foreign exchange
market, determination of exchange rate factors, affecting exchange
rate forms of capital Flows. In this unit we would make an attempt
to analyse these terms and their impact on India‘s foreign trade.
14.2 FUNCTION OF FOREIGN EXCHANGE MARKET
The market in which international currency traders take
place is called the foreign exchange market. In the globalised world
efficiency of foreign exchange market effects foreign trade
considerably. Foreign exchange market broadly performs the
following three functions: (i) International transfer of purchasing
power (ii) credit for foreign exchange; and (iii) hedging foreign
exchange.
14.2.1 International Transfer of Purchasing Power:
Foreign trade involves two forms of transfers of purchasing
power; firstly, from one country to another, and secondly from one
currency to another. In foreign trade, movement of goods takes
place between two countries but the payments of claims arising of it
are to be made within the country through a clearing system
developed for the purpose. Indians require purchasing power in the
form of U.S. Dollar ($) to purchase goods and services from that
country. Similarly, residents of other countries require Indian
currency or any other acceptable currency for purchasing or
investing in India. Foreign exchange market helps transfer
purchasing power (currencies) between the people.
14.2.2 Provision of Credit Instruments and Credit:
The credit for foreign trade is made available through various
credit instruments. These are in the form of telegraphic transfer,
foreign exchange bill, drafts etc. Financial institutions especially
261
commercial banks facilitate generations and disbursal of credit to
finance international trade.
14.2.3 Hedging Foreign Exchange Risks (Coverage of Risk):
In the era of floating exchange rates, transactions in foreign
exchange markets involve risk as exchange rates fluctuate very
frequently. So in order to avoid this risk, dealers in foreign
exchange use hedging facility available in foreign exchange market.
Exporters and importers may cover the possible risk due to a future
change in the exchange rate through forward exchange market.
The forward exchange market is where buyers and sellers agree to
exchange currencies at some specified date in the future. The
economic agents involved in the forward markets can be divided
into three groups. They are: (a) Hedgers (b) Arbitrageurs & (c)
Speculators.
(i) Hedgers:
These are agents (usually firms) who enter the forward
exchange market to protect themselves against the risk arising out
of exchange rate fluctuations. To understand the risk, let us
assume an Indian importer who imports goods from U.S.A. worth $
50,000 has to make the payments in three months time. The spot
rate at the moment is Rs. 40=$ 1 which requires Rs. 20,00, 000.
Due to uncertainty of the market, if the importer fears a depreciation
of rupee, he will have to pay more than Rs. 40/- of rupee, $ 1 three
months hence. Therefore he may enter into buying dollar forward
today, through an agreement with commercial banks or authorized
agents. If he enters into an agreement to purchase at the rate of
Rs. 40.25, he does so as he fears the depreciation of rupee. After
three months he requires to pay an additional Rs. 12,500 more. If
the spot rate is more than Rs. 40.25 after 3 months then the
hedgers stand to gain. If it turns out to be only Rs. 40.00 or less
than that, hedgers are the losers. The advantage of forward market
which provides this facility makes the importers sure of the money
that he has to pay for obtaining $ 50,000.
262
(b) Arbitrageurs:
These are the agents casually banks who intends to make a
riskless profit out of discrepancies between interest rate
differentials and the forward discount and forward premium.
Arbitrageurs enter into arbitrage. This refers to purchase of an
asset in a low price market and its riskless sale in a higher price
market. This process leads to equalization of prices of an asset in
all the segments of the market. Difference in prices if at all, is not
more than transport or transaction cost.
Arbitrageurs will take advantage of the different exchange
rates prevailing in various foreign exchange markets due to interest
rate differentials. Let us explain this with an example suppose Rs. =
$ exchange rate prevailing in India is Rs. 50= 1$ and in USA Rs.
48= 1$. People will purchase dollars in USA and sell it in India
earning a profit of Rs. 2 per dollar. In the process increasing
demand for dollars in USA will push up the prices to Rs. 49 and
more supply of dollars will bring down the price of dollar (in India to
Rs. 49. Arbitrage, therefore helps equalize the exchange rate in
different markets.
(c) Speculators:
These are agents who intend marking a profit by taking the
advantage of changes in exchange rates. They participate in the
forward exchange market by entering into forward exchange deal.
They do so on the basis of their own calculation of the difference
between the forward rate and the spot rate that may prevail on a
future date. For example if a speculator enters to sell a dollar at Rs.
41.00 after three months with expectations of the dollar becoming
cheap and the spot rate after three months is Rs. 40 = 1 $, the
speculator purchase the dollar for spot (Rs. 40) and sells for the
agreed forward rate (Rs. 41), thus making a profit of Rs. 1 per
dollar. He may incur loss if the spot rate crosses Rs. 41.
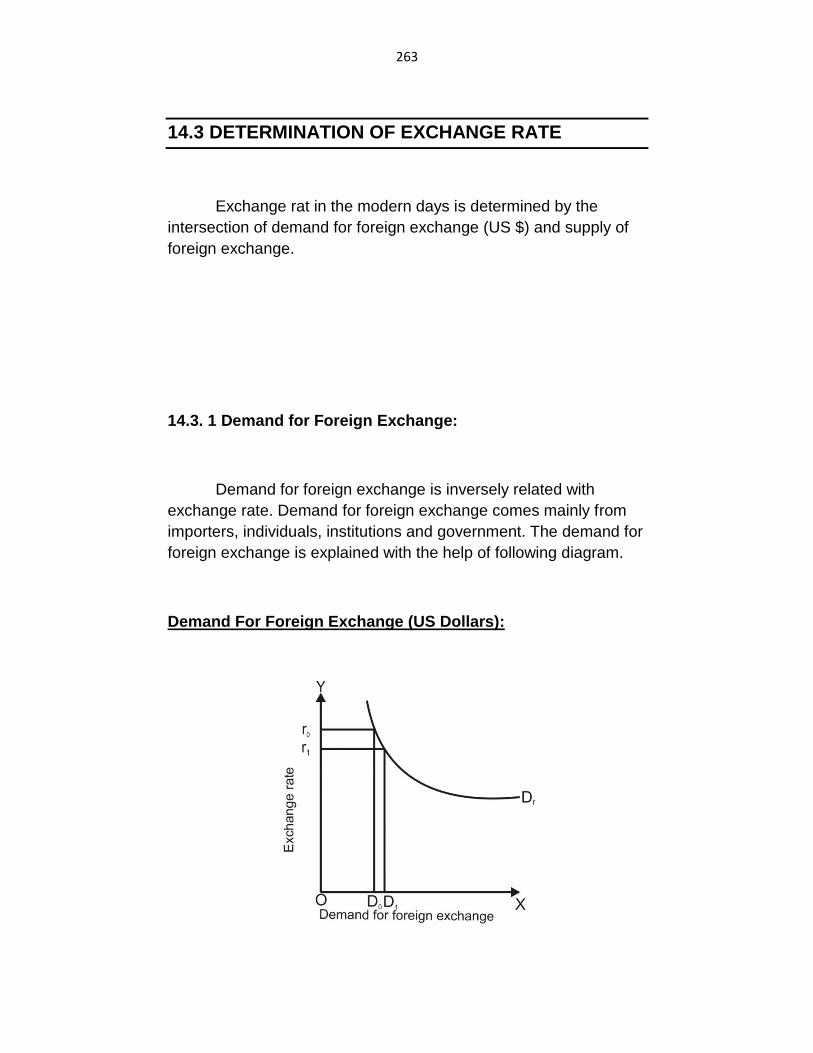
263
14.3 DETERMINATION OF EXCHANGE RATE
Exchange rat in the modern days is determined by the
intersection of demand for foreign exchange (US $) and supply of
foreign exchange.
14.3. 1 Demand for Foreign Exchange:
Demand for foreign exchange is inversely related with
exchange rate. Demand for foreign exchange comes mainly from
importers, individuals, institutions and government. The demand for
foreign exchange is explained with the help of following diagram.
Demand For Foreign Exchange (US Dollars):
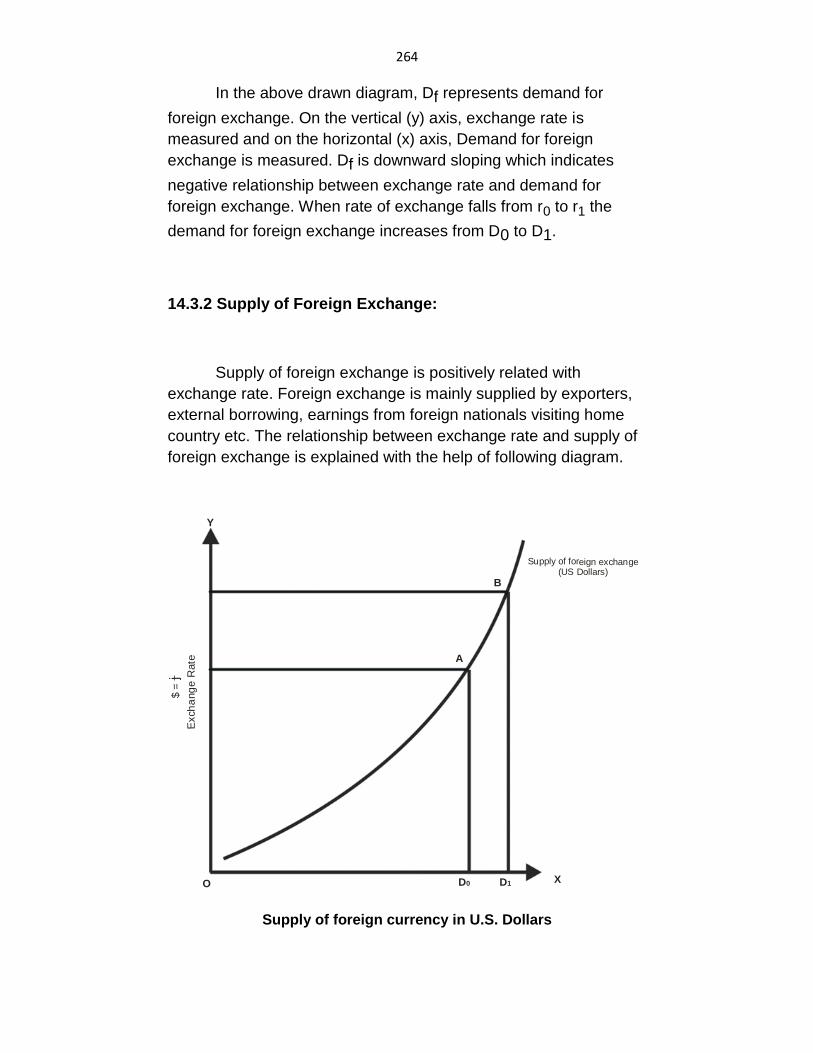
264
In the above drawn diagram, Df represents demand for
foreign exchange. On the vertical (y) axis, exchange rate is
measured and on the horizontal (x) axis, Demand for foreign
exchange is measured. Df is downward sloping which indicates
negative relationship between exchange rate and demand for
foreign exchange. When rate of exchange falls from r0 to r1 the
demand for foreign exchange increases from D0 to D1.
14.3.2 Supply of Foreign Exchange:
Supply of foreign exchange is positively related with
exchange rate. Foreign exchange is mainly supplied by exporters,
external borrowing, earnings from foreign nationals visiting home
country etc. The relationship between exchange rate and supply of
foreign exchange is explained with the help of following diagram.
Exch
ang
e R
ate
$ =
j
Supply of foreign exchange(US Dollars)
Y
O
B
A
D0 D1 X
Supply of foreign currency in U.S. Dollars
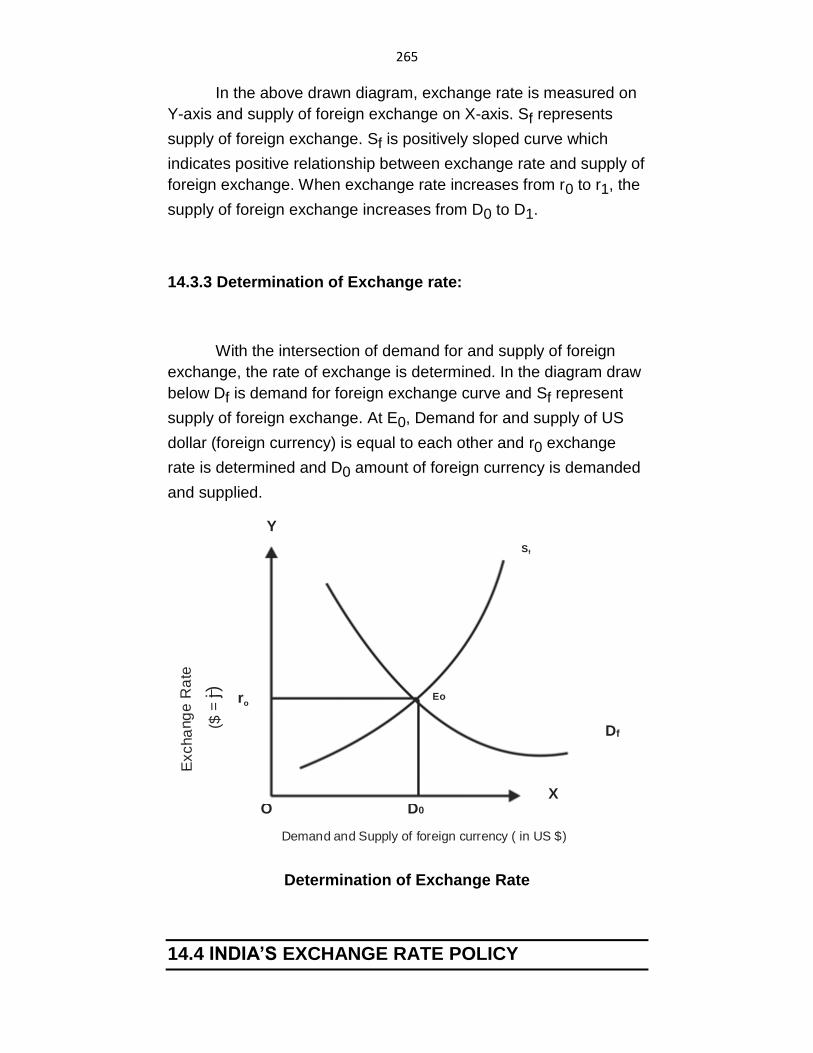
265
In the above drawn diagram, exchange rate is measured on
Y-axis and supply of foreign exchange on X-axis. Sf represents
supply of foreign exchange. Sf is positively sloped curve which
indicates positive relationship between exchange rate and supply of
foreign exchange. When exchange rate increases from r0 to r1, the
supply of foreign exchange increases from D0 to D1.
14.3.3 Determination of Exchange rate:
With the intersection of demand for and supply of foreign
exchange, the rate of exchange is determined. In the diagram draw
below Df is demand for foreign exchange curve and Sf represent
supply of foreign exchange. At E0, Demand for and supply of US
dollar (foreign currency) is equal to each other and r0 exchange
rate is determined and D0 amount of foreign currency is demanded
and supplied.
Excha
ng
e R
ate
($ =
j)
Demand and Supply of foreign currency ( in US $)
Y
O D0
Df
Eo
X
Sf
ro
Determination of Exchange Rate
14.4 INDIA’S EXCHANGE RATE POLICY
266
The foreign exchange rate gives the price of the foreign
currency in terms of domestic currency. Under the Gold standard
the exchange rate remains fixed and stable among the countries
and the adjustments in exchange rates are brought about by export
and import of gold. The main disadvantage of the Gold standard is
that the domestic economic policies are subject to consideration
relating to inflow and outflow of gold. It collapsed mainly because of
the conflict between the policy prescriptions required to meet the
domestic economic situations and the requirements necessitated
by gold flows. The IMF from its inception adopted a fixed exchange
rate system which permitted changes in exchange rates only in
case of ―fundamental disequilibrium‖ in the balance of payments.
The Bretton woods system collapsed in August, 1971 with
the abandonment of Bretton woods system, exchange rates of most
of countries have been floating. Under the floating exchange rates
the exchange rates moves up and down due to changes in demand
for and supply of currencies. The breakdown of the par value
system has, in general, encouraged countries to give more active
consideration to the exchange rates in domestic economic policies.
Exchange rate management plays a role complimentary to trade
policy. In the first decade of the floating exchange rate regime,
serious concerns were expressed on the volatility and misalignment
of currencies. However, in the more recent period there has been a
general acceptance of the floating exchange rate regime with all its
short comings. Now developing countries including India have
opted for a market determined exchange rate system.
Along with the changes in exchange rate system in the
world, India exchange rate policies to change the important
exchange rate policies adopted in India are the following.
14.4.1 India’s Exchange Rate Policy Till 1991Par Value of
Rupee till 1971:
267
Until the break-down of the Bretton Woods System in August
1971, the par value of the rupee was declared in terms of gold. The
Reserve Bank of India maintained the par value of the rupee within
the permitted margin of one percent on either side of the parity.
After the devaluation of the Rupee in 1966, the par value of the
rupee was fixed at 0.118489 grams of fine gold per rupee or Rs.
7.50 per US dollar. The RBI also kept the rupee pound rate stable
at Rs. 18 per pound sterling by its buying and selling operations in
the foreign exchange market. Since the dollar sold rate and pound
dollar rate were maintained stable by the monetary authorities of
U.S.A. and Britain respectively, the rupee exchange rate in terms of
gold, dollar and other countries remained stable.
14.4.2. U.S. dollar Rupee Link:
Following the suspension of convertibility of US dollar into
gold in August 1971, the government of India pegged the rupee to
the U.S. dollar. However, pound sterling contained to be used as an
intervention currency. ―An intervention currency is a foreign
currency, usually a reserve currency, which the central bank of a
particular country buys and sells at a fixed exchange rate with
respect to the domestic currency. The central bank enters into open
market operations in this currency to keep the exchange rate stable
vis-à-vis the domestic currency. The fluctuations in market demand
or supply of this currency do not affect its exchange rate because of
the actions of the central bank. ―Under the system of floating, the
exchange rates of all other currencies are determined by the
behaviour of the intervention currency against those currencies.
14.4.3 Pound – Sterling Rupee Peg:
Following the Smithsonian agreement on the realignment of
major currencies in December, 1971, the U.S. dollar was devalued
and other important major currencies were revalued and the
government of India decided to peg the rupee to pound sterling.
The central rupee – pound sterling rate was fixed at Rs. 18.9677 as
against the previous rate of Rs. 18 and, therefore rupee was
devalued by 5.1 percent against pound – sterling. It also continued
268
to be the intervention currency subsequently; British economy
faced a worsening of his balance of payments situation and a down
ward trend in her economic activities therefore U.K. decided to float
the pound-sterling on June 23, 1972. The exchange rate of the
rupee vis-à-vis other currencies came to be determined everyday
by the previous day‘s noon London market cross rates on June 26,
1972 to rupee was marginally revalued by reducing the central rate
to Rs. 18.9499 from Rs. 18.9677 per pound on June 4,1972 the
rupee was further revalued by 0.89 percent when the rupee-pound
sterling rate was fixed at Rs. 18.8001. This rate remained fixed till
July 2, 1975.
14.4.4 The Basket Peg:
Ever since the floating of pound sterling in June, 1972 the
exchange rate of the pound sterling witnessed a persistent down
ward movement in terms of US dollar. Along with it the rupee also
depreciated. Since India was under severe inflationary pressure
during this period, the indirect depreciation of the rupee helped to
maintain the competitiveness of our exports in the world market.
But, by October 1974 the Wholesale Price Index began showing a
downward trend. The establishment of domestic price stability
necessitated the maintenance of stability in the external value of
the rupee. By 1975 the pound sterling depreciated significantly.
Along with the depreciation of pound-sterling the rupee also sell
sharply against all major currencies further, there was sharp
fluctuations in the exchange rates of major currencies and
persistent uncertainty in the market which raised serious doubts
about the desirability of continuing the single currency peg.
Therefore in September 1975 Government of India took a decision
to delink the rupee from the pound and peg it to a basket of
selected currencies. The currencies as well as their weights in the
basket have been kept confidential by the RBI, probably to prevent
speculation against the rupee.
The changes in the rates of the rupee were determined by
the changes in the daily market value of the currency components
included in the basket. But the rate of rupee was expressed in
269
terms of pound-sterling which was continued to be the intervention
currency.
The rupee-pound parity would be altered when the value of
the currencies in the basket changed by more than 2.25 percent on
either side of the prevailing central rate until February 1979 and
since then by 5 percent. The change in the margin, which was
necessitated by large and erratic fluctuations in major currency
notes was expected to import a measure of stability to the
exchange rate of rupee.
With the continuous fluctuations in the exchange rates of the
currencies included in the basket the pound sterling rate was
adjusted from time to time in line with the changes in the exchange
rates of currencies in the basket for instance, the adjustment for
exchange rate between rupee and pound – sterling was made on
13 February, 1989 when the middle rate was fixed at Rs. 26.70 per
pound sterling. However, the basket link has helped to moderate
the variation in the rupee rates. In order to discourage speculation
in the foreign exchange markets on the likely changes in the rupee-
sterling rate and other foreign currency rates, the actual
composition of the basket has not been disclosed.
14.4.5 Exchange Rate Policy since 1991:
Over the last few years significant changes have been
brought to bear on the exchange rate resine as part of the overall
strategy to improve the functioning of the financial system for this
purpose a devaluation of rupee was undertaken in July 1991.
Simultaneously the EXIM scrip scheme was introduced under
which certain imports were permitted only against export
entitlement. The merits of scheme was that, besides providing
additional incentives to exporters through the premium on the
scripts, it tried to establish a quantitative link between imports and
exports. This was followed by a dual exchange rate arrangement
which entailed the surrender of 40 percent of the exchange
earnings at the official rate facilitating import of certain commodities
at the official exchange rate. During the period of the Liberalized

270
Exchange Rate Management System (LERMS) the foreign
exchange market performed well. It equilibrated 60 percent of
current receipts which were realized at the market exchange rate
with a large section of imports, which had to be financed by foreign
exchange obtained from the market. The LERMS introduced a
partial convertibility of the rupee. In 1993-94 Budget rupee was
made fully convertible on trade account. In august 1994 the rupee
was made fully convertible on current account. Thus in March 1993
the dual exchange rate system was dispensed with and the country
moved to a single market determined exchange rate system.
The important changes introduced in the exchange rate regime
since 1991 are discussed below:
(1) Exchange Rate Adjustment of 1991:
A downward adjustment of about 18 to 20 percent in the
external value of the Indian rupee against the major currencies was
effected in two steps on July 1 and 3, 1991.
The primary objective of the exchange rate adjustment was
to strengthen the country‘s external payments position. It was
expected to provide a reasonable incentive for export promotion
and encourage efficient import substitution activities and at the
same time to stem the flight of capital from India and discourage
flow of remittances from abroad through illegal channels.
To restore the competitiveness of our exports and bring
about a reduction in trade and current account deficits, a downward
adjustment of the rupee had become inevitable. Thus, the RBI
devalued Rupee in two steps in early July1991. On July 1, 1991 the
value of the Rupee was lowered by 8 to 9 percent against the major
currencies (the pound sterling, the US dollar, the deutsche mark,
the Yen and the French fane) on July 3, 1991, the value of the
Rupee was further lowered by 10 to 11 percent against the major
currencies.

271
(ii) Liberalised Exchange Rate Management System (LERMS) :
The LERMS was introduced in March 1992. It was a dual
exchange rate system. Under LERMS, 40 percent of foreign
exchange earnings of exports of goods and services are required to
be surrendered at the official exchange rate and the remaining 60
percent can be sold at a market determined rate. The foreign
exchange surrendered at official exchange rate is utilized to import
essential items such as petroleum, fertilizers or life savings drugs.
The foreign exchange converted at the market rate is available to
finance all other imports.
The LERMS had been introduced as a transitional
arrangement towards a unified exchange rate with current account
convertibility.
14.5 CONVERTIBILITY OF THE RUPEE
Convertibility essentially means the ability of residents and
non residents to exchange domestic currency for foreign currency,
without limit, whatever be the purpose of the transactions. A
distinction can be made between trade account, current account
and capital account convertibility.
14.5.1 Trade Account Convertibly:
India moved into a unified exchange rate system in 1993.
Rupee was made fully convertible on trade account from March
1993. This implies that money earned and required for transactions
on trade account is allowed to convert into domestic currency and
foreign currency respectively. This was the first step taken towards
full convertibility. The Government took this step towards
liberalization of our trade policy.
272
14.5.2 Current Account Convertibility:
According to article VIII of the International Monetary fund
articles of Agreement current accountability means that, ―No,
member shall, without the approval of the fund, impose restrictions
on the making of payments and transfers for current international
transactions.‖ According to Rangarajan. This implies that anyone,
whether domestic importers or foreign exporters, should be able to
exchange domestic money for foreign currency to settle any
transaction involving the purchase of goods and services from
abroad.‖
A major step towards current account convertibility was
taken by India in March 1993 when the exchange rate was unified
and transactions on trade account were faced from exchange
control. The determination of the exchange rate of the rupee was
felt to the market. The Budget speech for 1994-95 stated that ―The
time has come to take next step and move towards convertibility on
current account‖. Accordingly, the Reserve Bank announced
relaxation in payment restrictions in the case of a number of
invisible transaction upto a specified limit.
The final step towards current account convertibility was
taken in August 1994 and rupee was made convertible on the
current account of the balance of payments. India accepted the
obligation under article VIII of IMF, under which, India is committed
to forsake the use of exchange restriction on current international
transactions as an instruments in managing the balance of
payment. There has been further relaxation of restriction on current
transactions in 1995-96 and 1996-97. The process of current
account liberalization was carried forward further in 1997-98 and
there after.
14.5.3 Capital Account Convertibility:
273
Capital account convertibility implies the right to transact in
financial assets with foreign countries without restrictions. While
such a regime may stimulate greater flow of investment, there are
risks attached to it. The major risk is the possibility of capital flight.
Another risk is the possibility of macro-economic instability arising
from the movement of short term capital, very often described as
hot money. According to C. Ragarajan, ―a free movement of funds
will lead to integration of financial markets and therefore, an
efficient domestic financial system free from administrative
restrictions is a prerequisite for the introduction of capital account
convertibility.
Although the rupee is not freely convertible on the capital
account, convertibility exists in respect of certain constituent
elements of the capital account. Foreigners and Non Resident
Indians, undertaking direct and portfolio investments in India, are
permitted to bring in and repatriate their funds.
According to the R.B.I., ―It should be possible to introduce
convertibility on capital transactions in stages, giving greater
freedom regarding short term and long term borrowings. A further
strengthening of the reserve position will help in this regard. Its
structural strengthening will help to even out any volatility in the
flow of funds. The international capital markets will also have to
open up for our borrowers which can occur in a bigger way only
when the credit rating of the country improves. This again should
be possible as the macro economy stabilizes further and we are
able to further build up our foreign exchange reserves.‖
India is considering the possibility of introducing capital
account convertibility. Such a step will make India‘s foreign
exchange market totally free.
14.6 FOREIGN CAPITAL FLOWS
274
Most of the underdeveloped countries suffer from low level
of income and low level of capital accumulation. Foreign capital
flows into an economy especially in the form of inventible funds,
can have profound impact on the growth rate of an economy. Net
capital inflows into Indian economy have increased substantially in
the last 20 years.
14.6.1 Role of Foreign Capital:
Developing economies need foreign capital for the following
reasons:
(i) Investment Demand:
Very often, less developed countries face scarcity of
domestic capital due to low levels of savings. In order to meet their
investment demands for rapid economic development, they have to
resort to foreign capital, foreign capital on supplement domestic
resources to achieve the critical minimum investment to break the
vicious circle of poverty.
(ii) Initial Stage of Development:
A developing country may have potential savings that may
come forward as investment funds only after the country has
reached a certain level of development. Therefore, in the initial
stages of development such countries have to rely on foreign
capital.
(iii) Foreign Expertise:
Domestic capital and enterprises may lack the experience
and expertise to involve themselves in certain sectors of the
275
economy specially capital and technology intensive ones. In such
cases there is no option but to invite foreign capital.
(iv) Advanced Know-how:
Foreign capital brings in advanced technical know-how,
managerial skills and expertise from which a developing country
can benefit.
(v) Underdeveloped Capital Market:
Savings generated within an economy need to be mobilized
and converted into investment. For this purpose, a well developed
capital market is essential, which is absent in most underdeveloped
and developing countries. Therefore to meet their investment
demands in the initial stages of development, LDCs need to invite
foreign capital in some form or the other.
(vi) Balance of Payments Problems:
With deteriorating balance of payments that most developing
countries face, it becomes essential to encourage foreign capital
either in the form of borrowings or in the form of direct investments.
Foreign investments help to increase a country‘s exports and
reduce imports if such investments take place in export oriented
and import substituting industries.
14.6.2 Forms of Foreign Capital:
(i) Foreign Aid : A part of foreign capital is received on
concessional terms and is known as external assistance or foreign
aid. It may be received by way of loans and grants. Grants are in
the form of outright gifts. Loans qualify as aid only to the extent that
276
they bear a concessional rate of interest and have longer maturity
periods than commercial borrowings. Foreign aid has mostly been
given by foreign government of developed countries to developing
countries or by international institutions like IMF, World Bank, Asian
Development Bank.
(ii) Commercial Borrowings: Foreign capital is also acquired
through commercial or market borrowings. These are loans at
market rate of interest from international capital markets. Given the
increasing shortage of low cost external assistance, India since
1980-81, has had to rely on commercial borrowings from abroad for
meeting its capital requirements. These borrowings include credit
from official export agencies, and buyers and suppliers credits.
Since these borrowings involve short-term, high-cost funds,
government approvals are necessary for acquiring them. The
objective is to judiciously control the inflow of such funds, so that,
the external indebtedness of the country is not adversely affected.
The major part of these borrowings have been by public sector
undertakings and development financial institutions such as the
IDBI, ICICI, IFCI which assist private sector companies with
external finance.
(iii) Foreign Private Investment: Foreign Private Investment
comes into a country in two forms namely, foreign direct investment
and foreign portfolio investment. Direct investment takes different
forms like starting a subsidiary office or branch of effecting a foreign
collaboration. Foreign collaboration involves joint participation of
foreign and domestic capital.
Portfolio investment involves foreign companies and
financial institution subscribing to shares and debentures of
domestic companies. They involve no interest payment but only
share in profit.
(iv) Non – resident Investments and Deposits: The Non-
Resident deposits have been an important component of a county‘s
capital inflows, especially that of a LDC. In the recent year, in India,
277
NRI investments have been an important avenue of foreign capital
for the economy.
14.7 FOREIGN PORTFOLIO INVESTMENT AND
FOREIGN DIRECT INVESTMENT
14.7.1 Foreign Direct Investment (FDI):
FDI is channel mainly through multinational corporations.
These investments bring with them benefits like market access,
technology, management expertise etc. In 1980s there was a
remarkable change in the attitude of developing countries towards
FDIs. From an attitude of hostility and suspicion, these countries
are now actively promoting the inflow of FDI. In 1990s there was
considerable inflow of FDI to developing countries including India.
This was the combined result of the open door policy adopted by
these countries towards FDI and because these countries provided
attractive marketing and investment opportunities to multinational
corporations. According to World Development Report 1999-2000
by 1997, approximately half of all capital flows to developing
countries were in the form of FDI.
(i) In India FDI played a limited role till 1990: This was a result of
the restrictive policy followed by the Government towards FDI.
Foreign investment was allowed in areas of high-tech, sophisticated
and export-oriented. The normal ceiling for foreign investment was
40 percent of total equity capital, but a higher percentage of foreign
equity was considered in priority industries if the technology was
sophisticated and not available in the country or if the venture was
largely export oriented. FDI played an insignificant role in India‘s
development process. India‘s share of FDI in Gross capital
formation was only 0.2 percent as against the average of 6.1
percent for developing countries as a group. The net FDI in India
was about 1 percent of GDP in 2007-08.
278
(ii) The Policy towards foreign investments was liberalized in
june 1991. Since then the government has been consistently
pursuing the objective of attracting higher volumes of foreign
investments to augment resource availability in infrastructure and
other critical areas of the economy
(iii) Extent of FDI: Ever since the international economic relations
were guided by WTO frame work each country intended to become
liberal and attempted to attract an increased amount of foreign
direct investment. Since 1991 under the new economic policy, India
liberalized the conditions for FDI and opened up many areas for
FDI.
FDI in India was a mere $ 97 million in 1990-91 which
steadily increased and reached to $ 3557 million in 1997-98.
Subsequently it declined to $ 2155 in 1999-2000 and showed an
increase in 2001-02 reaching to $ 3904 million. In 2007 the FDI
amounted to US $ 23000 million.
Aggregate FDI inflows reached to US $ 6.2 billion in 2001-02
fell to US $ 405 billion in 2003-04 and after recent recovery it
reached to US $ 23.0 billion in 2006-07.
Companies registered in Mauritius and the U.S. were the
principal source of FDI into India followed by Japan and Germany.
The major portion of FDI was invested in computer hard ware
software, engineering industries, services, electronics, electrical
equipment, chemical and allied products, food and dairy products.
Developing countries are the main recipients of FDI India was
expected to attract a huge amount of FDI but unfortunately lagged
behind many other countries. Latin America and also China have
been far more successful than India.
(iv) Policy Measures to Attract FDI:
Since June 1991, the Government of India has introduced
many policy measures to attract FDI.
279
1. Automatic approval of direct foreign investment upto 51 percent
of foreign equity in 34 specified high priority capital intensive
and hi-technology industries. Existing companies with foreign
equity can also rise to 51 percent. Foreign direct investment has
also been allowed in exploration production and refining of oil
and marketing of gas.
2. The foreign Investment Promotion Board (FIPB) has been set
up to process applications in cases not covered by automatic
approval.
3. NRIs and overseas corporate bodies (OCBs) predominantly
owned by them are also permitted to invest upto 100 percent
equity in high priority industries with reparability of capital and
income investment is also allowed in export houses, trading,
hospitals, sick industries etc.
4. Disinvestment of equity by foreign investors has been allowed at
market rates on stock exchanges from 15 September 1992 with
permission to repatriate the proceeds of such disinvestment.
5. Provisions of the Foreign Exchange Regulation Act (FERA)
have been liberalized through an ordinance dated 9 January
1993 as a result of which companies with more than 40 percent
of foreign equity are also treated on par with fully Indian owned
company.
6. Foreign Companies have been allowed to use their trade marks
on domestic sales from 14 May 1992.
7. To boost FDI, project for electricity generation, transmission and
distribution as also roads and highways, ports and harbours and
vehicular foreign equity participation upto 100 percent under the
automatic route in 1998-99, provided foreign equity does not
exceed Rs. 1500 Crore. The government has also decided to
280
permit FDI upto 49 percent of the total equity, subject to licence,
in companies providing Global Mobile personal communication
by satellite (GMPCS) services.
8. A Foreign Investment Implementation Authority (FIIA) was
established in August 1999 within the Ministry of Industry in
order to ensure that approvals for Foreign Investments
(including NRI investments) are quickly translated into actual
investment inflows and that proposals fructify into projects. In
particular, in case where FIPB clearance is needed, approval
time has been reduced to 30 days.
9. Automatic Route for FDI except for a small negative list. Foreign
investors only need to inform the Reserve Bank of India within
30 days of bringing in their investment, and again within 30 days
of issuing any shares.
10. 100 percent investment is permitted in Non Banking Financial
Companies (NBFCs) may hold foreign 100% equity if they are
holding companies.
International Financial Institutions like Asian Development
Bank, International Financial Corporation, Common Wealth
Development Corporation German Investment and Development
Company (OEG) etc are allowed to invest in domestic companies
through automatic route, subject to SEBI / RBI specification and
sector specific caps on FDI.
Revised FDI Definition:
A committee was constituted in May 2002 to bring the
reporting system of FDI data in India into alignment with
international best practices. Based on the committee‘s
recommendation, the RBI has recently revised data of FDI flows
from the year 2000-01 onward by adopting a new definition of FDI.
281
The definition includes three categories of capital flows under FDI:
equity capital, reinvested earnings and other direct capital.
Previously, only equity capital was included.
Capital Appraisal of FDI inflow:
1. The actual inflow of FDI has been much less than approved
amounts.
2. Most of the approved inflows of FDI have been in the non-
manufacturing sectors. The share of the manufacturing sector to
total approved FDI was 85 percent in 1990. This came down to
35 percent over the period 1991-97.
3. Some economists are of the opinion that the increased inflow of
FDI to India is not a direct result of the reforms alone, but is an
impact of very large expansion of global FDI flows to developing
countries. This is a possible outcome of excess funds in the
global capital market and the expanding market sizes of the
developing countries.
4. Majority foreign ownership is on the rise. Most approvals in the
1990s have been in the range of 50-100 percent foreign
ownership and one third accounted for wholly foreign owned
subsidiaries. This has drastically altered the pattern of
ownership of business in India. Multinationals have increased
their stakes in their existing affiliates, the joint partnership mode
of operations have decline and mergers and acquisitions of
Indian companies by MNCs is on the rise.
5. The reasons for which FDIs were encouraged in the early
nineties were that this investment would improve efficiency in
the economy and expand and enhance India‘s export
capacities. Instead most FDIs seek to take advantage of India‘s
expanding domestic market.
6. The amount of FDI that has flown into the country so far is small
compared to than in other emerging economics like china.
14.7.2 Foreign Portfolio Investment:
282
Foreign portfolio investment in India take a variety of forms,
such as investments by Foreign Institutional Investors or FIIs, issue
of Global Depository Receipts and American Depository Receipts,
floating offshore funds by Indian corporates.
Inflows of foreign portfolio investment during 2000-01 were
US $ 2021 million of which the share of GORs/AORs was US $ 477
million, FIIs was US $ 1505 million and offshore funds and other
was US $ 39 million. In 2002 equity markets in developing
economies including India have remained largely subdued, this
affecting the inflow of FIIs. During April-October 2002, FII outflows
occurred for every month reaching a peak in June when there was
security tension in India. The adverse effects of a global slow down
and delayed recovery, on international capital markets are evident
from lower resources mobilization by Indian corporate through
GDR/ADR routes volume of equity finance raised by Indian firms
had dropped in 2001-02.
The policy related to portfolio investment is regularly
reviewed. In the Budget 2001-02, it was proposed to raise the limit
of portfolio investments by FIIS from the normal level of 24 percent
of the paid up capital of the company to 49 percent subject to the
approval of the General body of the shareholders by a special
resolution.
The aggregate portfolio investment inflows showed a
declining trend between 2000-01 and 2002-03 from a net inflow of
US $ 2590 million in 2000-01, it declined to US $ 1952 million in
2001-02 and further dropped to US $ 944 million in 2003-04. The
declining trend, however, witnessed a sharp reversal in 2003-04
when net portfolio investment stood at US $ 11356 million. This is
the result of the buoyant rate of the country‘s capital markets. After
reaching to US $ 12494 million in 2005-06 it declined to US $ 7062
in 2006-07.
The bulk of portfolio investments have come from FIIs . This
reflects improving investor perception about India.
283
14.8 SUMMARY
A well developed foreign exchange market is a pre-condition
for ensuring smooth international trade. It also helps in expanding
foreign trade. The exchange rate policy of a country must ensure
the exporters and importers that there would be more or less
stability in the exchange rate & thus less uncertainty about
fluctuations in the exchange rate. Since 1991 India has
experimented with dual exchange rate policy i.e. partly market
determined exchange rate and partly fixed exchange rate policy.
However in a phased manner the exchange rate now is completely
determined by market forces of demand & supply of foreign
exchange. India has adopted full rupee convertibility on trade
account and partial rupee convertibility on capital account. The
inflows of foreign capital is broadly classified as portfolio investment
and foreign direct investment (as the investment of capital inflows is
concerned). Though there has been an increase in foreign portfolio
investment, the foreign direct investment has not increased as per
expectations. The prime reasons rare high transaction cost
(corruption), delay in getting clearances etc.
14.9 QUESTIONS
1. Discuss the various functions of foreign exchange market. ?
2. Describe India‘s exchange rate policy since 1991.
3. Distinguish between Current Account and Capital Account
Rupee Convertibility.
4. Write notes on:
(a) Foreign Portfolio Investment
(b) Foreign Direct Investment
(c) Foreign Aid
(d) Hedging
(e) Role of Foreign Capital

284
285
15 WORLD TRADE ORGANISATION (WTO) AND
INDIA
UNIT STRUCTURE
15.0 Objectives
15.1 Introduction
15.2 Formation of WTO : GATT to WTO
15.3 Functions and Organisation of WTO
15.4 WTO Agreements
15.5 India‘s commitments to WTO
15.6 Impact on Indian Economy
15.7 WTO Negotiations
15.8 Issues and Recent Development
15.9 Summary
15.10 Questions
15.0 OBJECTIVES
After reading this unit you will come to know:
- Organisation of WTO and its functions
- WTO Agreements
- India‘s Commitments to WTO
- Impact of WTO on Indian Economy
- TRIPS, TRIMS and GATS
286
15.1 INTRODUCTION
Setting up of World Trade Organisation (WTO) in 1995, has
been the greatest event to occur, in recent times in international
trade relations. The purpose of WTO is to remove restrictions in
international trade. It is designed to play the role of a watch dog in
the spheres of trade in goods, trade in services, foreign investment,
intellectual property rights etc.
In the new era of globalization where the world economy is
undergoing significant changes, there is a need to study the impact
of the WTO on the Indian economy. We also need to review and
examine the challenges that the Indian economy will now be facing
in the area of trade as a result of the WTO agreements. Thus the
setting up of WTO has thrown up number of opportunities and
challenges.
15.2 FORMATION OF WTO : GATT TO WTO
After the world war II, many countries got down together to
work on ways and means to promote international trade. The result
was the signing of the General Agreement on Tarrifs and Trade
(GATT) by 23 countries in 1947. India was one of the founder
members of GATT. Over the years the membership of GATT has
increased to 143 countries. GATT was primarily concerned with the
promotion of international trade through tariff reductions, doing
away with non discriminatory practices among trading partners, and
evolving rules to counter protectionism.
GATT provided for reduction in tariffs and trade restrictions
in a phased manner over a period of time. In all, Eight Rounds of
Multilateral Trade Negotiations were held under the auspices of
GATT. The Eight Round was held in Uruguay, in 1986 and in
known as ‗Uruguay Round‘ This Round took more than Eight years
287
of complex negotiations. The final act was signed in April 1994 by
the member nations of GATT and this paved the way for the setting
up of WTO. The WTO agreement was singed by 104 member
nations GATT and it came into force from January 1, 1995. Thus,
WTO was set up on January 1, 1995. The former GATT was not
really an organization. It was merely a legal arrangement on the
other hand, the WTO is a new international organization set up as a
permanent body and is designed to play the role of a watch dog in
the spheres of trade in goods, trade in services, foreign investment,
intellectual property rights etc. India is one of the founder-member
of WTO. China and Taiwan entered the world trade body towards
the end of 2001. The present membership of WTO is 149 countries.
15.3 FUNCTIONS AND ORGANISATION OF WTO
15.3.1 Functions:
i) WTO is expected to promote international trade, for this it
must provided necessary administrative frame work.
ii) WTO should provide forum for negotiations among its
members.
iii) WTO should formulate rules of the trade and proper
mechanism for the settlement of disputes.
iv) WTO should take periodical review of its trade policy.
v) WTO should work in co-operation with the IMF and the world
bank.
vi) It administers the 29 Agreements contained in the final act of
the Uruguay Round of World trade.
vii) It oversees implementation of tariff cuts and reduction of non
tariff measures agreed to in the negotiations.
viii) It assists developing countries in implementing Uruguay
agreements through a Developments Division.
15.3.2 Organisation:
288
In WTO framework Ministerial Conference is the highest
decision making body, which has to meet at least once in two
years. Following Ministerial Conferences have been held; so far
viz. Singapore (9 – 13 December 1996), Geneva (18 – 20 May,
1998), Seattle (30 Nov. – 3 Dec., 1999) ; Doha (9 – 14 Nov. 2001);
Cancun (10 – 14 Sept. 2003); Hong Kong (13 – 18 Dec. 2005). The
seventh WTO Ministerial meeting was held in Geneva from Nov 30
– Dec. 3, 2009.
In addition to the Ministerial Conference there is a General
Council again Consisting of representatives of all the members. It
itself meets as the Disputes Settlements Body (DSB) and the trade
policy review committee. There are three separate councils under
General Council : Council for Trade in Goods; Council for trade in
services, council for Trade Related Aspects of Intellectual Property
Rights.
15.4 WTO AGREEMENTS
The main WTO agreements can be divided into the following
categories.
1) Agreement on agriculture: - This provides a frame work for the
long term reform of agricultural trade and domestic policies over the
years to come, with the objective of introducing increased market
orientation in agricultural trade. It provides for commitments in the
area of market access, domestic support and export competition.
The members have to transform their non-tariff barriers like quotas
into equivalent tariff measures. The tariffs resulting form this
transformation, as well as other tariffs on agricultural products, are
to be reduced on an average by 36 percent in the case of
developed countries and 24 percent in the case of developing
countries. The least developed countries were not required to make
any commitment for reduction.
289
2) Agreement on trade in textiles and clothing (Multi-fiber
Arrangement) : - This provides for phasing out the import quotas
on textiles and clothing in force under the multi-fiber arrangement
since 1974 over a span of 10 years, i.e. by the end of the
transaction period on January 1, 2005. As a result, quotas on
textiles and clothing have now been abolished.
3) Agreement on Market Access : - The Member nations will cut
tariffs on industrial and form goods by an average of about 37
percent. The USA and the European Union will cut tariff between
them by one half.
4) Agreement on TRIMs : The Agreement on Trade Related
Investment Measures (TRIMs) calls for introducing national
Treatment of foreign investments and removal of quantitative
restrictions. It identifies 5 investment innersoles which are in
consistent with the GATT provisions of according national treatment
and general elimination of quantitative restrictions.
5) Agreement of TRIPs : Trade Related Intellectual Property
Rights (TRIPs) pertain to patents and copyrights. Whereas earliest
on process patents were granted to food, medicines drugs and
chemical products. The TRIPS Agreement now provides for
granting product patents also in all these areas. Protection will be
available for 20 years for patents and 50 years for copyrights.
A transition period was allowed to all developing countries to give
effect to the provision of the TRIPs Agreement. The period expired
on January 1, 2005. Thus the regime of product patents has now
been introduced.
6) Agreement on Service: For the first time trade in services like
banking, insurance, travel, maritime transportation, mobility of
labour etc. was brought within the ambit of negotiations in the
Uruguay Round. The GATS (General Agreement on Trade in
Services) provides a multilateral frame work of principles and
290
services which should govern trade in services under conditions of
transparency and progressive liberalization. It spells out certain
obligations like grant of MFN status to the other member nations
with regard to trade in services, maintained of transparency and
also a commitment for liberalizations in general terms.
7) Disputes Settlement Body: Settlement of Disputes under
GATT was a never ending process. There was ample scope for
procedural delays, objections could be vanished at each stage of
the dispute settlement process, and penal reports could be rejected
by the offending party. The Disputes Settlement Body (DSB) set up
under WTO seeks to plug these loopholes and thus provided
security and predictability to multilateral trading system. It has now
been made mandatory to settle a dispute within 18 months. The
findings of the Disputes Settlement panels will be final and binding
on all parties concerned.
In addition to the above, the Uruguay Round also reached
agreements on the understanding and implications of certain
articles of GATT 1947 viz. reshipment inspection, rules of origin,
import licensing, antidumping measures and countervailing duties,
safeguards, subsidies etc.
15.5 INDIA’S COMMITMENTS TO WTO
The Government of India has made a number of Commitments to
WTO. The main commitments are in the following fields.
1) Tariff Lines:
As a member of the WTO, India bound about 67 percent of
its tariff lines where as prior to the Uruguay Round only 6 percent of
the tariff lines were bound (a country ―binds‖ a tariff rate by
committing that it will not raise tariff on that product beyond the
―bound‖ level) for non-agricultural goods, with few exceptions
291
ceiling bindings of 40 percent advalorem on finished goods and 25
percent on intermediate goods machinery and equipment were
undertaken. The phased reduction to be undertaken over the period
of March 1995 to the year 2005.
2) Quantitative Restrictions (QRs):
QRs on imports maintained on balance of payments ground
were notified to WTO in 1997 for 2,714 tariff lines at the eight digit
level in view of the improvements in India‘s balance of payments
the committee on balance of payments Restrictions had asked
India for a phase out for the QRs. An agreement between USA and
India was reached which envisaged the phasing out of all QRs by
India by April 1, 2001. In line with this agreement India removed
QRs on 714 items in the EXIM policy announced on March 31,
2000 and on the remaining 715 items in the EXIM policy
announced on March 31, 2001.
3) TRIPs :
The ruling of the two WTO dispute settlement panels
following the complaints made by the USA and European Union
that India had failed to meet its commitments under article 70.8
(requiring the setting up of the mail Box system) and Article 70.9
(granting of Exclusive Marketing Rights) made it obligatory for the
Government of India to make appropriate amendments to the
Patent Act, 1970 by the April 19, 1999. The Patents (Amendment)
Act, 1999 was passed by the Parliament in March, 1999 to provide
for Exclusive marketing Rights. This was followed by the adoption
of patents (Amendment) Act, 2002, in May 2002. In order to meet
its commitment to the WTO to introduce product patents by January
1, 2005, the Government of India promulgated an ordinance on
December 23, 2004.
292
This was followed by the adoption of patents (Amendments)
Act in March 2005. The new patent regime provides for patents in
drugs and farm products.
4) TRIMs:
Under the TRIMs Agreement, developing countries had a
transition period of 5 years up to December, 31, 1999 during which
they could continue to maintain measures inconsistent with the
Agreement provided these were duly notified. The Government of
India notified two TRIMs viz., that relating to local content
requirement in case of investment in 22 categories of consumer
items.
5) GATS:
Under the General Agreement on Trade in Services (GATS),
India made commitments in 33 activities. Foreign service providers
will be allowed to enter these activities. According to the activities
has been guided by consideration of national benefit (viz, the
impact on capital) inflows, technology, and employment).
15.6 IMPACT ON INDIAN ECONOMY
The signing of the WTO agreements will have far reaching
effects not only on India‘s foreign trade but also on its internal
economy. Some of the effects may be favourable, while many of
them will be adverse. The exact nature of the impact of the WTO
agreements on the Indian economy may not be very clear as yet,
but some analysis can be done on the broad and general import.
293
15.6.1 Favourable Impact:
a) Increase in Export earnings:
According to the estimates prepared by the world bank
OECD and GATT Secretariat, the overall trade impact, as a
consequence of the Uruguay Round Package will be an addition to
traded merchandise goods by $ 745 billion in the year 2005. The
largest increases would be in case of clothing (60 percent),
processed food and beverages (19 percent), agriculture, forestry
and fishery products (20 percent). In all these sectors India has
potential export competitiveness. Assuming that India‘s share in
world exports improves for the present 0.5 percent to 1 percent and
India is able to take advantage of the opportunities that are created,
the additional export earnings will be about $ 2.7 billion per year. A
more generous estimate ranges between $ 3.5 billion and $ 7 billion
worth of additional exports per year.
b) Agricultural Exports :
Reduction of trade barriers and domestic subsidies in
agriculture is likely to raise international prices of agricultural
products. India hopes to benefit earnings from agriculture. This
seems to be possible because all major agriculture development
programmes in India will be exempted from the provision of the
WTO Agreement. As a developing nation, India need not withdraw
agricultural subsidies as long as they remain within the specified
limits prescribed by the Agreement. Thus India hopes to take
advantage from the reduction of subsidies in the developed
countries.
c) Export of Textiles and Clothing :
With the phasing out of MFA, exports of textiles and clothing
will increase and this will be beneficial for India. However, there are
certain important issues that are to be considered as far as phasing
out of MFA is concerned while the developed countries demanded
a 15 year period for phasing out of MFA, the developing countries,
including India, insisted that it be done in 10 years. The Uruguay
Round accepted the demand of the latter. But the phasing out
294
schedule favours the developed countries because a major portion
of the quota regime is going to be removed only in the tenth year
,i.e. 2005. Therefore the developed countries do not have
immediate market access in case of textiles exports. By the time
the phasing out programme is complete, the developed countries
will already have geared themselves up to face competition by
improving quality and productive efficiency. Thus, even though it
may seem that India will gain from the phasing out of MFA, there
are several factors that will determine this. The removal of quotas
will benefit not only India but also every other country, thus India
will have to compete with china, Bangladesh, Pakistan, Vietnam,
Indonesia in the international Textile market. India can only gain
substantially if its own supply constraints are removed.
d) Multilateral rules and disciplines:
It is expected that the rules and disciplines related to
practices like anti-dumping, subsidies and countervailing measures,
safeguard and dispute settlements will create conditions of fair
trade and provide level playing ground for all trading countries.
Such conditions will benefit India in its efforts to globalize its
economy.
15.6.2 UNFAVOURABLE IMPACT:
i) TRIPs : Protection of Intellectual property rights has been one of
the major concerns of WTO. The Agreement on TRIPS at the
Uruguay Round weighs heavily in favour of multinational
corporations and developed countries as they hold a very large
number of patents. Agreement on TRIPs will work against India in
several ways and will lead to monopoly of the WTO, India has to
comply with the standards of the TRIPs and the changes should be
in order latest by the year 2004.
The Agreement on TRIPs goes against the Indian Patent Act, 1970
in the following ways :
295
a) Pharmaceutical Sector :
Under the Patent Act, 1970, only process patents are
granted to chemicals, drugs and medicines. This implies that an
Indian pharmaceutical company only needed to develop and patent
a process to produce a drug and it need not have invented the
drug. The company could legally manufacture once it had the
product patent. This proved beneficial for Indian pharmaceutical
companies as they were in a position to sell good quality medicines
at low prices. The Industry has grown rapidly after the passing of
the patent Act in 1970 and is now an exporter of drugs to other
nations. But under the Agreement on TRIPs product patents will
also be granted. This will benefit the MNCs and it is feared that they
will raise prices of medicines considerably keeping it out of reach of
the poor.
However, it should be noted that 97 percent of all drugs
manufactured in India are off patents and so will remain unaffected.
These cover most life savings drugs as well as drugs for common
diseases.
b) Agriculture:
The Agreement on TRIPs also extends IPRs to agriculture
through the patenting of plant varieties. This will have serious
implications for Indian agriculture, where government bodies and
agricultural universities carry out plant breeding and seed
production patenting of plant breeding and seed production
patenting of plant varieties would transfer all gains in the hands of
MNCs who will be in a position to develop almost all new varieties
with the help of their huge financial resources. It is also believed
that once the MNCs develop plant varieties they will also take over
seed production and will eventually control food production. In a
country where a large majority of the poor depend on agriculture for
their livelihood, these development will have serious consequence.
c) Micro Organisms :
296
Under TRIPs Agreement, patenting has been extended to
the large area of micro-organisms as well. Research in such life
forms are closely linked with the development of agriculture,
pharmaceuticals and Industrial biotechnology. Patenting of micro-
organisms will again benefit large MNCs that either already have
patents in these areas or will acquire them at a much faster rate
now. Thus the development of these three vital sectors will also be
in the hands of the MNCS.
ii) TRIMs : Agreement on TRIMs provide for treatment of foreign
investment on par with domestic investment. This Agreement too
weighs in favour of developed countries. There are no provision in
the Agreement to formulate international rules for controlling
restrictive business practices of foreign investors. In case of
developing countries like India complying with Agreement on
TRIMs would mean giving up any plan or strategy of self-reliant
growth based on locally available technology and resources.
iii) GATs : One of the major features of the Uruguay Round was
the inclusion of trade in services in the negotiations. This too will go
in favour of developed countries. It has been estimated that the size
of the world market in services was $ 1000 billion in 1993 of which
the share of developed countries was 95 percent. As far as India is
concerned the service industry here is developing rapidly and is not
as underdeveloped as in other developing countries. According to
the Agreement, India needs to open up its banking and insurance
sectors. As a result these social obligations. Indian firms will have
to compete with giant foreign firms in the service sector. Besides,
the foreign firms will be face to remit profits, royalties and interests
to the parent country, causing foreign exchange burden for India.
iv) Trade and non-tariff barriers (NTBs) : Several countries have
put up trade barriers and NTBs following the formation of the WTO.
This has adversely affected the exports of developing countries like
India. A report by the Union Commerce Ministry identified ----13
different NTBs put up by 16 countries against India. In case of
textiles, the major trade barrier is the form of MFA (Multi-fibre
arrangement) put up by the USA and the European Union. NTBs
affecting agricultural exports include EU regulations on fish
297
products. Australian ban on use pesticides and sales tax
discrimination, restrictions on tea by EU and Japan, Saudi Arabian
ban on frozen fish products etc. Others NTB‘s against India are on
human rights issues like use of child labour objected to by USA,
Canada and EU. Products that have been hit by these barriers
include textiles, pharmaceuticals, marine products floriculture,
basmati rice, carpets, sports goods, leather goods and several item
of food products.
v) LDC Exports : The sixth WTO Ministerial Conference took place
at Hong Kong in December 2005. In this conference some
important time frames were decided upon. It was agreed that all
developed country members and all developing countries declaring
themselves in a position to do so, will provide duty-free and quota-
free market access on a lasting basis to all products originating
from all least Developed Countries. India has agreed to this
commitment. This will have adverse effect on India. India exports
will now have to compete with cheap LDC exports internationally.
At the same time cheap LDC exports will come to the Indian market
and compete with domestically produced goods.
15.7 WTO NEGOTIATIONS
The Doha Round of trade negotiations at the WTO has been
underway since 2001. The Negotiations cover several areas such
as agriculture products, market access for Non-agricultural
products, TRIPs, rules covering anti dumping and subsidies and
trade facilitation. It is important to note that the conduct, conclusion
and entry into force of the outcome of negotiation are parts of a
single undertaking i.e. ―nothing is agreed until everything is
agreed.‖
While the year 2007 and 2008 saw intensive discussions in
the WTO and progress achieved on several complex subjects, the
negotiations were slow to resume following the December, 2008
break at the WTO. Based on discussions during the Mini-Ministerial
Meeting held in July, 2008, the chairs of the Negotiating Groups on
298
Agriculture and Non Agricultural Market Access (NAMA) brought
out fresh drafts of modalities for Agriculture and NAMA on
December 6, 2008. However, discussions on these texts began
only in September 2009 partly due to national elections in the US
and India and partly due to general standstill in Geneva and a
reluctance to negotiate seriously with a view to narrowing
difference.
Going by the political commitments expressed by WTO
members in International Fora, India took the initiative and hosted a
ministerial conference in New Delhi o September 3-4, 2009 which
was the first occasion since July 2008 for ministers representing
practically all shades of opinion and interests in the WTO to come
together. There was unanimous affirmation of the need to
expeditiously conclude the Doha Round, particularly in the present
economic situation, and for development remaining at the heart of
the Doha Round.
The Seventh WTO ministerial meeting which was the first full
ministerial meeting of the WTO in the aftermath of the global
economic melt down was held in Geneva from November 30 –
December 3, 2009. While the conference was not intended as a
negotiating forum, it provided a platform for different groups and
caucuses to assess the direction of the negotiations. India and her
coalition partners reiterated their commitment to upholding the
development dimension the centrality of the multilateral process
and the need to safe ground livelihood concerns, particularly of the
poor, subsistence farmers in their countries.
In services negotiations, the services clusters were held in
March-April 2009, October 2009 and November, 2009 in which
India participated actively. Other than multilateral and plurilateral
discussions, bilateral discussions were also held with important
trading partners wherein India conveyed its disappointment over
their ambiguous and inadequate signals in the key areas of our
interest which were conveyed earlier during the signaling
conferences of July 2008. India is actively participating in the
working party discussion on Domestic Regulations (WPDR) as
disciplining of DRs is an area of its interest.
299
In the current negotiations on rules, taking place in the
Negotiating Group on Rules (NGR), India is seeking strengthened
antidumping rules so as to prohibit the use of zeroing in dumping
margin calculation, strengthening of the rules for conduct of sunset
review and mandatory application of lesser duty. In the area of
subsidies, India is supposed to enlargement of the scope of
prohibited subsidies in the Agreement on subsidies and
countervailing measures (ASCM) and for limiting of the existing
flexibilities for developing countries. In the negotiations on new
disciplines on fisheries subsidies, India is seeking effective special
and differential treatment (S & D) for Developing countries,
particularly in the light of employment and livelihood concerns of
small, artisanal fishing communities and for retaining sufficient
―policy space‖ so as to enable it to develop its infrastructure.
Bilateral and Regional Cooperation:
Multilateral negotiations at the WTO continue to be at the
centre of India‘s trade negotiations. However, given the long and
protracted nature of these negotiating and recognizing the fact that
the regional cooperation would continue to feature for a long time in
world trade, India has been active in regional and bilateral trading
arrangements in recent years. RTAs which help in expanding
India‘s export market are considered as ―building blocks towards
the overall objective of trade liberalization and multilateral
negotiations.
Some of the recent development in the current year related
to bilateral and regional trade and cooperation are the following :
Indian – ASEAN CECA: A framework Agreement on
comprehensive Economic cooperation between ASEAN and India
was signed by the Prime Minister of India and the Heads of Nations
/ Governments of ASEAN members during the second ASEAN
India summit on October 8, 2003 in Bali, Indonesia the Agreement
on Trade in Goods was signed on August 13, 2009. India-ASEAN
300
Trade in Goods Agreement has come into effect on January 1,
2010. The Agreement provides for elimination of basic customs
duty on 80 percent of the tariff lines accounting for 75 percent of the
trade in a gradual manner. Negotiations towards trade in services
and investment are expected to conclude by August 2010.
India-South Korea Comprehensive Economic Partnership
Agreement (CEPA) : The Agreement was signed on August 7,
2009. It is India‘s first FTA with an DECD country. CEPA covers
trade in goods, investments and services and bilateral cooperation
in area of common interest under CEPA, tariffs will be educed or
eliminated on 93 percent of Korea‘s tariff lines and ----85 percent of
India‘s tariff lines. The Agreement will facilitate trade in services
through additional commitments made by both countries to case
movement of independent professional and contractual service
suppliers.
India-Japan CEPA : Agreement in goods services and investment
are under negotiation. Twelve meetings of the Joint Task Force
have so far been held. The 12th meeting of the JTF was held during
September 29, October 1, 2009 in Tokyo.
India – EU Trade and Investment Agreement : With the EU, a
broad-based bilateral Trade & Investment Agreement is being
negotiated Negotiations cover trade in goods, services and
investment, sanitary and phytosanitary measures, technical barriers
to trade, rules of origin, trade facilitation and customs cooperation
competition, trade defence mechanism. Government procurement,
dispute settlement, Intellectual Property Rights (IPR) and
Geographical Indications (GIs). Eight rounds of negotiation have so
far alternately been held at Brussels and New Delhi respectively,
the eighth round was held during January, 25-29, 2010 in New
Delhi.
India-European Face Trade Association (EFTA) : A broad based
bilateral trade and investment agreement is being negotiated with
EFTA countries. First round of negotiations took place in New Delhi
301
in October 2008. Fourth round of negotiations took place in New
Delhi in September 2009.
15.8 ISSUES AND RECENT DEVELOPMENT
Ever since the inception of WTO, the developed countries
have been pressuring for expansion of negotiating agenda. The
major issues and developments are :
15.8.1 Singapore Issues:
In the first ever Ministerial Conference held in Singapore in
1996 itself where developed countries demanded that the
negotiating mandate of WTO be broadened to include trade and
investments, trade and competition policy, government
procurement, trade facilitation, labour standards and environment
standards. Developing countries resisted these demands and
managed to put labour standards and environment off the WTO
agenda for the time being. The remaining four issues viz. (i)
investment (ii) competition policy (iii) Government Procurement and
(iv) trade facilitation are known as Singapore Issues.
Over these issues there are considerable differences of
opinion between developed and developing countries and between
developed countries as well. Developing countries like India argued
that all the four issues. i.e. Singapore issues have a strong
development dimension which focused organizations like the WTO
is not competent to handle.
Because of considerations such as these Singapore issues
emerged as a bone of contention between the developed and the
developing countries first at the Doha Meeting in 2001 and then at
Cancun Meeting in 2003. Because of developed countries
reluctance to reduce agricultural subsidies and provides more
market accession their agricultural to developing countries have
302
been taking cover behind the Singapore issues resulting in a
breakdown of all negotiations.
15.8.2 Doha Declaration:
The main features of the Doha Declaration (held at Doha, Qatar, in
Nov. 2001) are as follows:
(i) TRIPs and Public Health :
The major success claimed by developing countries
(particularly by India) was in the field of TRIPs and Public Health.
The separate declaration adopted on the issue stated that the
―TRIPS Agreement does not and should not prevent members from
taking measures to protect public health‖. In other words, the
Declaration made it clear that any member of the WTO has a right
to knock off patents on pharmaceutical products on public health
grounds.
(ii) Environment And Labour Issues :
Another area of conflict in WTO negotiations are
Environment and Labour related issues. Developing countries
demand that the rich nations should reduce carbon emission and
developed countries are blaming the rising developing economics
for high carbon emission. Again developed countries have been
asking the developing countries to introduce labour laws and make
them market friendly.
15.8.3 Cancun Fiasco:
The fifth WTO Ministerial Conference was held in Cancun,
Mexico between 10th to 14th Sept. 2003. The debate at Cancun was
focused on Two Issues : (a) liberalization of Agriculture and (b)
developing new multilateral disciplines on the Singapore Issues.
However with both developed and developing countries stuck to
their points, the final outcome was a breakdown in negotiations.
303
Though Cancun Conference ended in a fiasco. India played a key,
constructive role in building developing country unity and assertion
of the WTO, whose concrete forms are a G 20 nation alliance on
agriculture (known as G 20) whose chief spokesman in Brazil and
G 16, on the Singapore Issue led by Malaysia.
Subsequently, there have been further conferences but the
deadlock countries on agricultural subsidies, environment, labour
issues and market access to the developing countries. The only
silver lining in these subsequent WTO conferences is that
developing countries have become more united and assertive
which helps them negotiate in a healthy and competitive way.
15.9 SUMMARY
WTO was set up in 1995 with the aim of removing
restrictions or barrier from international trade. It is designed to play
the role of a watchdog in the sphere of trade in goods, trade in
service, foreign investment, intellectual property rights, etc.
The government of India has made commitments to WTO in
the following fields (i) tariff lines (ii) quantitative restrictions (iii)
TRIPS (iv) TRIMS and (v) General Agreements on Trade in
services (GATS). The benefits that India might derive from WTO
are (i) when world trade expands, India‘s trade will also increase (ii)
Phasing out of Multiple Fabric Agreement by 2005 will benefit India
as the export of textiles and clothing will increases (iii) Prospects for
agricultural exports will increase (iv) Multilateral rules and
disciplines will create a more favourable environment for trade. At
the same time India will have to make some homework at domestic
level to reap the benefits of these arrangements, such as
developments of infrastructure, making exports more competitive
improve labour laws check environmental degradation etc.
304
15.10 QUESTIONS
1. Discuss the objectives and functions of WTO.
2. Bring out the impact of WTO on Indian Economy.
3. Explain the WTO Agreements with respect is the following:
(a) TRIPs
(b) TRIMs
(c ) GATS

305