module 2 educator’s guide investigation 2 on human and physical landscapes, ... module 2...
TRANSCRIPT
1
What is industrialagriculture?Investigation OverviewThis investigation focuses on the
high-energy- and technology-using
system of commercial agriculture in the
developed, industrialized world. Students
investigate industrial agriculture as a system of
inputs and outputs, compare it to subsistence agriculture, examine its
effects on human and physical landscapes, and consider how changes in
technology are transforming the way it operates. A debate or forum
about industrial agriculture enables students to argue its advantages and
disadvantages and discuss the ability of agriculture to support future
populations without degrading the environment.
Time required:
Introduction and Part 1: One or two 45-minute sessions
Part 2: One or two 45-minute sessions
Parts 3 and 4: One or two 45-minute sessions
Part 5: One or two 45-minute sessions
MaterialsInvestigation Briefing and Log, one for each student
Computer with CD-ROM drive. The Mission Geography CD-ROM
contains color graphics needed for this activity.
Content PreviewIndustrial agriculture, which is typified by the highly productive commer-
cial agricultural system in the United States, is important to understand
because it produces most of the world’s food and fiber. But there are two
major issues: (1) because it relies on fossil fuels, which are nonrenew-
able resources, its ability to support world populations in the long run is
problematic, and (2) because it sometimes produces serious environ-
mental degradation, it may not be sustainable. Whether or not technol-
ogy can solve these problems is an open question.
Classroom ProceduresBeginning the Investigation1. The first sentence of the Briefing asks: “Where did your last meal
come from?”
• Ask if it came from subsistence agriculture, which students may
have studied previously in this module.
• Ask for student responses to initiate discussion.
• Then say that this investigation will help them understand the type
of agriculture that provides the food they eat.
Geography Standards
Standard 1: The World inSpatial Terms
How to use maps and other geo-graphic representations, tools, andtechnologies to acquire, process,and report information
• Produce and interpret maps and other
graphic representations to solve
geographic problems.
Standard 14: Environmentand Society
How human actions modify thephysical environment
• Evaluate the ways in which technology
has expanded the human capacity to
modify the physical environment.
• Explain the global impacts of human
changes in the physical environment.
• Develop possible solutions to sce-
narios of environmental change
induced by human modification of the
physical environment.
Standard 18: Uses ofGeography
How to apply geography to inter-pret the present and plan for thefuture
• Develop policies that are designed to
guide the use and management of
Earth’s resources and that reflect
multiple points of view.
Geography SkillsSkill Set 3: Organizing GeographicInformation
• Select and design appropriate forms
of graphs, diagrams, tables, and
charts.
Skill Set 4: Analyzing GeographicInformation
• Make inferences and draw conclu-
sions from maps and other geo-
graphic representations.
Module 2 Educator’s Guide Investigation 2

2
Alternative: This will take more time than #1
above.
The first sentence of the Briefing asks: “Where did
your last meal come from?” Have students
• list what they ate and drank for breakfast, lunch,
dinner, and snacks in one day;
• list the places of origin of each of those foods
and beverages by both interviewing managers at
stores and supermarkets and reading labels (A
Big Mac, a pizza, a mocha latte, and a banana
split have many ingredients and therefore many
places of origin.);
• collate the information for the class as a whole
into two lists: foods and places of origin of
foods; and
• mark the places of origin on a world map.
Focus class discussion on
• popularity of types of foods;
• spatial distributions and patterns of places of
origins of foods;
• speculations about how various foods are
produced, including any common elements of
agricultural production; and
• any problems or issues regarding agriculture
that students may know about.
Developing the Investigation2. Hand out copies of the Briefing and Log to each
student or to small groups of students.
• Students can work on this activity individually,
but it is recommended that they work in small
groups—pairs or triads are especially recom-
mended.
• You may wish to form groups to take sides in a
debate or in a forum, as suggested in Conclud-
ing the Investigation, #12 below.
3. Leaf through the materials with the students and
point out:
• the underlined questions to be answered on the
Log at the end of the materials (the answers to
the questions are found at the end of this
Educator’s Guide) and
• a schedule for completing the questions.
4. Have students read the Background and Objec-tives sections and then take any questions they
may have.
5. Set students working through the Briefing, begin-
ning with Part 1. How productive is industrialagriculture? which looks at the output of industrial
agriculture; Part 3 will look at the input side of the
system. Emphasize the importance of
• carefully studying and discussing the tables and
figures, including the satellite images;
• working on group answers to the Log questions;
and
• graphing the data from the 3 tables in Part 1—
graphing helps students grasp the relationships
and trends portrayed in the tables.
6. To monitor progress and to keep students moving
through the Briefing at roughly the same pace, ask
students to give their interpretations and examples of
• key concepts (e.g., input-output system, produc-
tion, productivity, landscape patterns, calorie
comparisons, sustainability, precision agricul-
ture, etc.),
• the satellite images, and/or
• use the Log questions (or other questions) to
generate class discussion.
7. The purpose of Part 2: What do the landscapesof industrial agriculture look like? is to help
students practice skills of satellite image interpreta-
tion and to learn that industrial agriculture is an
important geographic phenomenon because it
• creates many different landscape patterns on
Earth’s surface,
• transforms physical landscapes into human
landscapes, and
• varies from place to place because of environ-
mental and human differences.
Tell students that a geographic landscape can have
both physical and human characteristics.
8. Part 3: What inputs does industrial agriculturerequire? deals with the input side of the input-
output system.
• It helps students understand why industrial
agriculture is so productive, but
• it distinguishes different kinds of productivity—
those based primarily on labor inputs and those
based primarily on energy inputs from fossil
fuels.
9. Students may need assistance understanding
some of the arguments presented. For example:
• Eisenberg, quoted in Part 4: What problemsdoes industrial agriculture create? is criticiz-
ing industrial agriculture for its negative environ-
mental effects.
• Students should understand that industrial
agriculture requires inputs, such as fertilizer and
herbicides that can damage the environment if
they are misused.
Module 2 Educator’s Guide Investigation 2
3
• Although these practices can produce large
amounts of food and fiber in the short run, they
also have the potential to produce serious
environmental effects in the long run.
• Technological changes may have unintendedconsequences. For example, contaminated
water supplies may be an unintended negative
consequence of using chemical fertilizers to
increase production.
10. Of course, technological changes may, in turn, also
help address unintended negative consequences—
they may solve some of the negative environmental
effects of industrial agriculture. One such change
is the use of remote sensing for precision agricul-ture, which is presented in Part 5: How areimprovements in technology reshaping indus-trial agriculture? Precision agriculture is a
concept that students (especially urban students)
may find difficult.
• You may need to help students interpret the
images of agricultural landscapes.
• Students should understand that agricultural
fields are rarely uniform and therefore are not
uniformly productive.
• Fields will often have areas that are wet and dry,
high and low, salty and less salty, clayey and
sandy, and the like.
• Remote sensing and precision agriculture assist
in tailoring the appropriate amount of seed,
fertilizer, water, herbicides, and pesticides
needed to increase the productivity on small,
nonuniform areas within the larger fields.
• Such precision allows for better estimates of
inputs and outputs.
• Precision agriculture can also reduce negative
environmental effects, e.g., the use of too much
fertilizer, which can contaminate ground water.
11. At the end of Part 5, students compare the informa-
tion given on two images—one a black and white
land use map (Figure 9) and the other a color
enhanced satellite image (Figure 10).
• They are asked (Question 14) about how the
information available from the two images differs
and how the “new” information from the satellite
image might help them in farming this area in
North Dakota.
• The key to Question 14 offers a range of appro-
priate changes that students might offer.
Concluding the Investigation12. Organize a debate or a forum about industrial
agriculture. For example:
• What are the advantages and disadvantages
(“pros” and “cons”) of industrial agriculture?
• Will industrial agriculture be able to feed future
populations? Why?
• Is industrial agriculture environmentally sustain-
able? Why?
• To support their positions in a debate or discus-
sion, students should bring in new information to
supplement the data in this activity. For ex-
ample, perspectives favoring industrial agricul-
ture may be found on web-sites for Cargill (http:/
/www.cargill.com) and ADM (http://
www.admworld.com).
• Have students write statements that they believe
would represent the positions of key parties in
the debates about industrial agriculture, and
then have them use these statements in a
dialog/round-table. Examples of roles could be
a gene scientist working for Genentech, an ADM
executive, a World Wildlife Fund representative,
an official of the United Nations Food and
Agriculture Organization (FAO), and the Secre-
tary of the U.S. Department of Agriculture.
13. Have students create a graphic organizer summa-
rizing the inputs and outputs of industrial agricul-
ture. Use the space in the Log for Question 16.
14. Have students role-play an international panel of
experts charged with making policy recommenda-
tions for the improvement of industrial agriculture.
15. Debrief the investigation by discussing the Logs.
You may wish to use the Objectives listed at the
beginning of the Briefing to organize the debriefing.
Module 2 Educator’s Guide Investigation 2
4
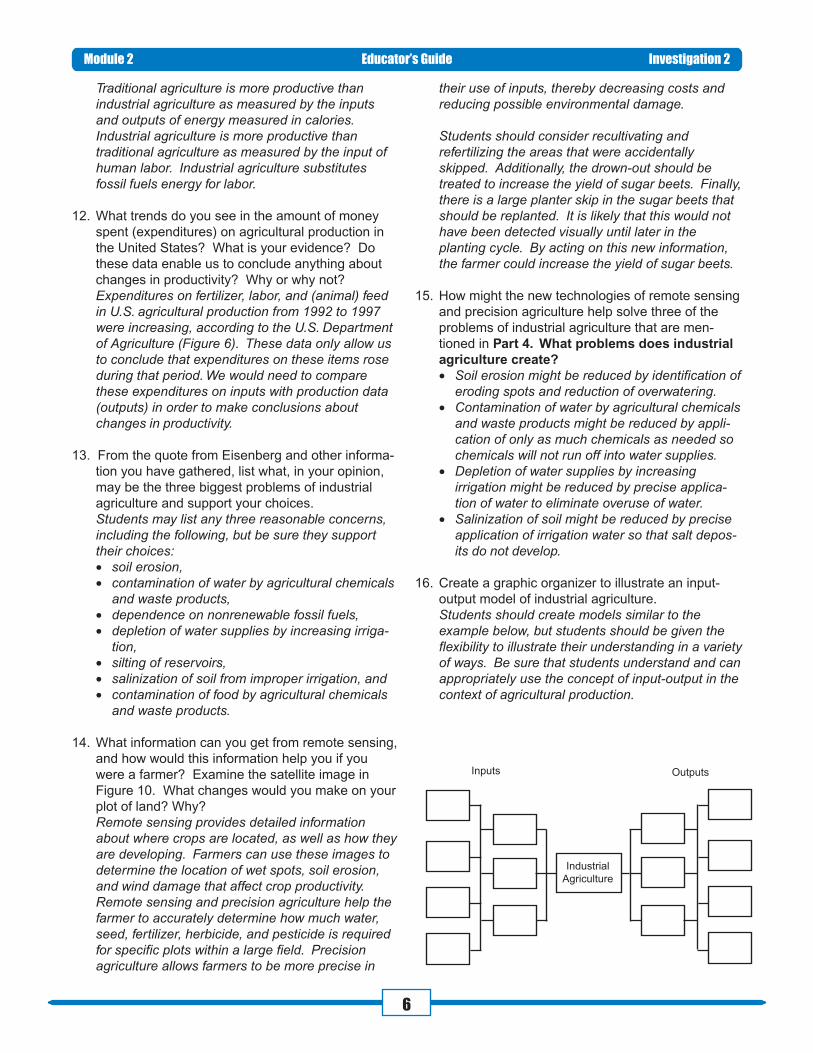
EvaluationLog1. Complete a graph of the data given in Table 1.
What do these data tell you about agricultural
trends?
Because of the dramatic increases in the productivity offarm labor, fewer and fewer farmers have producedmore and more food. Productivity rose very little from1900 to 1950 but made large gains from 1950 to 2000.
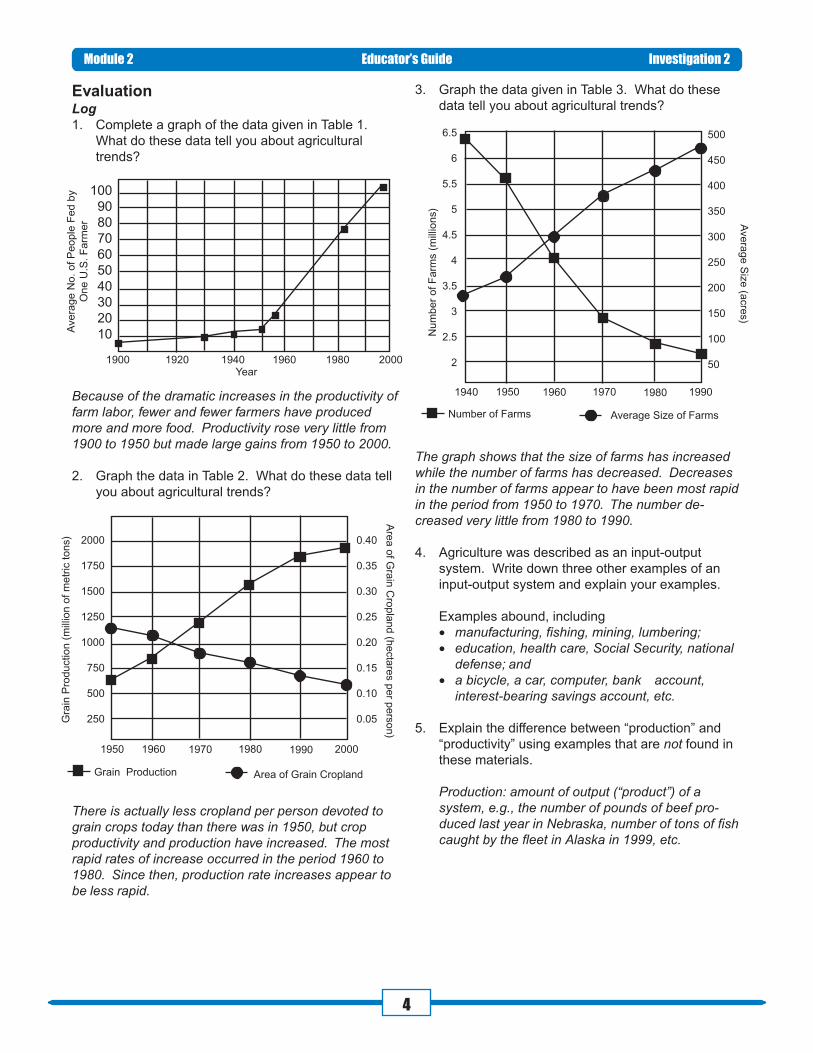
2. Graph the data in Table 2. What do these data tell
you about agricultural trends?
There is actually less cropland per person devoted tograin crops today than there was in 1950, but cropproductivity and production have increased. The mostrapid rates of increase occurred in the period 1960 to1980. Since then, production rate increases appear tobe less rapid.
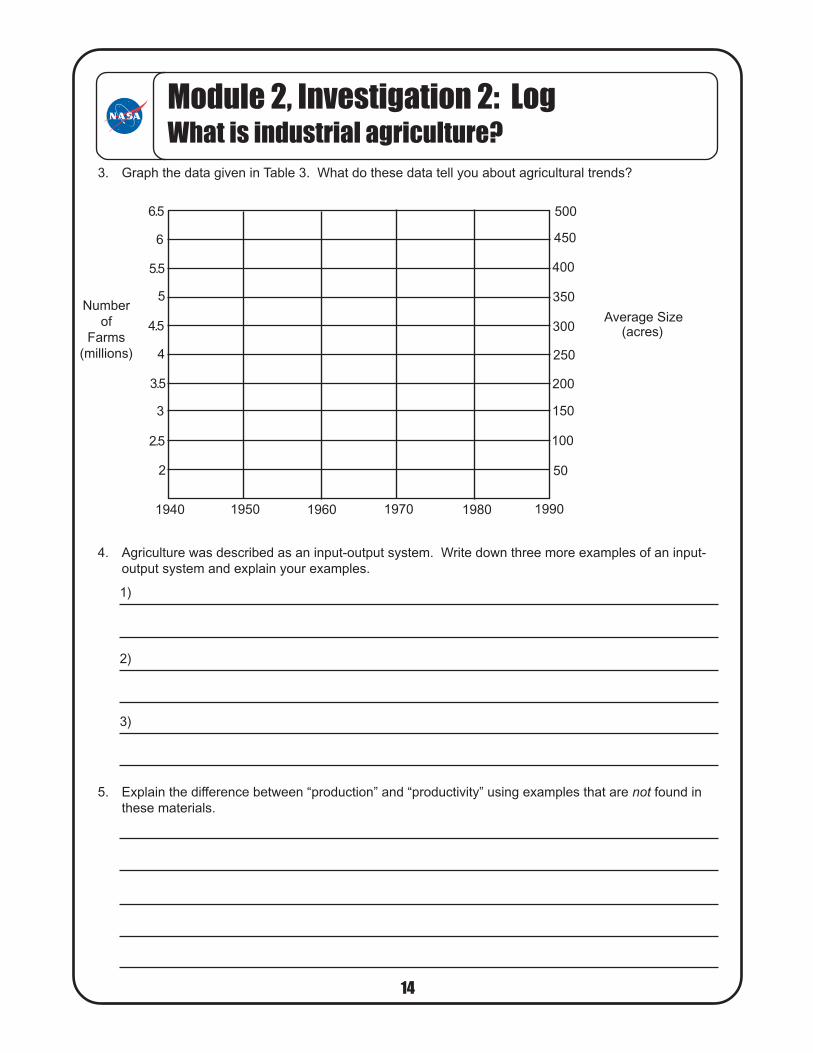
3. Graph the data given in Table 3. What do these
data tell you about agricultural trends?
The graph shows that the size of farms has increasedwhile the number of farms has decreased. Decreasesin the number of farms appear to have been most rapidin the period from 1950 to 1970. The number de-creased very little from 1980 to 1990.
4. Agriculture was described as an input-output
system. Write down three other examples of an
input-output system and explain your examples.
Examples abound, including
• manufacturing, fishing, mining, lumbering;• education, health care, Social Security, national
defense; and• a bicycle, a car, computer, bank account,
interest-bearing savings account, etc.
5. Explain the difference between “production” and
“productivity” using examples that are not found in
these materials.
Production: amount of output (“product”) of asystem, e.g., the number of pounds of beef pro-duced last year in Nebraska, number of tons of fishcaught by the fleet in Alaska in 1999, etc.
Module 2 Educator’s Guide Investigation 2
2000199019801950 1960 1970
0.40
0.35
0.30
0.25
0.20
0.15
0.10
0.05
2000
1750
1500
1250
1000
750
500
250Gra
in P
roduction (
mill
ion o
f m
etr
ic t
ons)
Area of Grain CroplandGrain Production
Are
a o
f Gra
in C
ropla
nd (h
ecta
res p
er p
ers
on)
1990198019701940 1950 1960
500
450
400
350
300
250
200
150
100
50
6.5
6
5.5
5
4.5
4
3.5
3
2.5
2
Num
ber
of F
arm
s (
mill
ions)
Average Size of FarmsNumber of Farms
Avera
ge S
ize (a
cre
s)
20001900
100
90
80
70
60
50
40
30
20
10
19801920 1940 1960
Avera
ge N
o.
of
People
Fed b
y
One U
.S. F
arm
er
Year

5
Productivity: ratio of input to output, or amount ofoutput per amount of input, e.g., 20 loaves of bread(the output) was produced with one hour of labor(an input) is a measure of productivity of labor; totalcosts of mining a ton of iron ore; etc.
6. Describe the trends in industrial agricultural pro-
duction and productivity in the 20th century.
• An American farmer fed seven people in 1900and 96 people in 1999.
• In 1920, about 30 percent of Americans werefarmers, but by 1990 only 2 percent farmed.
• Grain production expanded five times as muchsince 1900 as during the preceding 10,000years.
• From 1950 to 1989, the amount of grain crop-land in the world fell from 0.23 to 0.14 hectaresper person, yet the amount of grain productionrose from 650 to 1,700 million metric tons.
7. In Part 2: What do the landscapes of industrialagriculture look like? you were shown satellite
images of only a few examples of these land-
scapes. Write down two more examples of differ-
ent landscapes of industrial agriculture that you
have personally seen.
Examples abound:
• feed lots for hogs and cattle;• intensive vegetable production, such as pota-
toes, carrots, lettuce, onions, etc.;• intensive fruit and flower production, such as
oranges, apples, cherries, peaches, carnations,roses, etc.;
• packing houses, bakeries, and other industrialbuildings to process food and other agriculturalproducts;
• sheds for mass production of chickens, turkeys,and eggs; and
• grain elevators, bins, warehouses, railroad,truck, and port facilities for storage and shippingof agricultural products.
8. What are the characteristics of industrial agricul-
ture? In other words, what do all the examples of
this type of agriculture have in common? List as
many characteristics as you can:
• monocropping (only one crop per field)• use of manufactured fertilizers, herbicides, and
pesticides• use of hybrid or genetically altered seeds• use of specialized machinery: tractors, com-
bines, cultivators, seeders, pickers, balers,dryers, etc.
• use of irrigation (although some products ofindustrial agriculture are not irrigated, thetendency to irrigate has grown rapidly)
• all or nearly all of the product is distributed greatdistances and sold in specialized markets
9. What natural resource is used to make fertilizers,
pesticides, and farm machinery? List three other
agricultural inputs that come from this natural
resource.
Fossil fuels, particularly petroleum and natural gas,are used to make fertilizers, pesticides, and farmmachinery. Other inputs dependent on petroleumor natural gas include:• fuel to run farm machinery, such as tractors,
combines, irrigation pumps, and grain dryers;• fuel to run trucks, trains, and ships that distribute
the inputs to the farmer and the outputs to theconsumer; and
• energy used to process, package, and marketagricultural products.
10. Do you think the increasing use of fertilizer in
industrial agriculture is a practice that can be
sustained in the future? Why?
This question, which raises the fundamentalconcern of sustainability, requires more criticalthought than a yes or no answer. Sustainability is acontested term, but generally it is understood todenote a practice that does not unduly degradehuman and physical systems and will last into thefuture. The increasing use of energy-basedfertilizer will put a strain on the available sources offossil fuels. Unlike renewable resources such ashydroelectric, wind, and solar power, fossil fuels arefinite or nonrenewable resources. Also, fertilizeruse can have negative effects on soil and watersupplies. Therefore, it is possible to conclude thatthis is not a sustainable practice in the long-termfuture. On the other hand, improvements intechnology have contributed to better methods ofextracting fossil fuels without skyrocketing priceincreases. It is also possible to argue that technol-ogy will continually improve to meet demand, suchas by finding new ways to extract fossil fuels,finding alternative ways of producing and/orapplying fertilizers, and producing altered seedsthat require less fertilizer.
11. By what measure is “traditional” agriculture more
productive than industrial agriculture? By what
measure is industrial agriculture more productive
than traditional agriculture?
Module 2 Educator’s Guide Investigation 2
6
Traditional agriculture is more productive thanindustrial agriculture as measured by the inputsand outputs of energy measured in calories.Industrial agriculture is more productive thantraditional agriculture as measured by the input ofhuman labor. Industrial agriculture substitutesfossil fuels energy for labor.
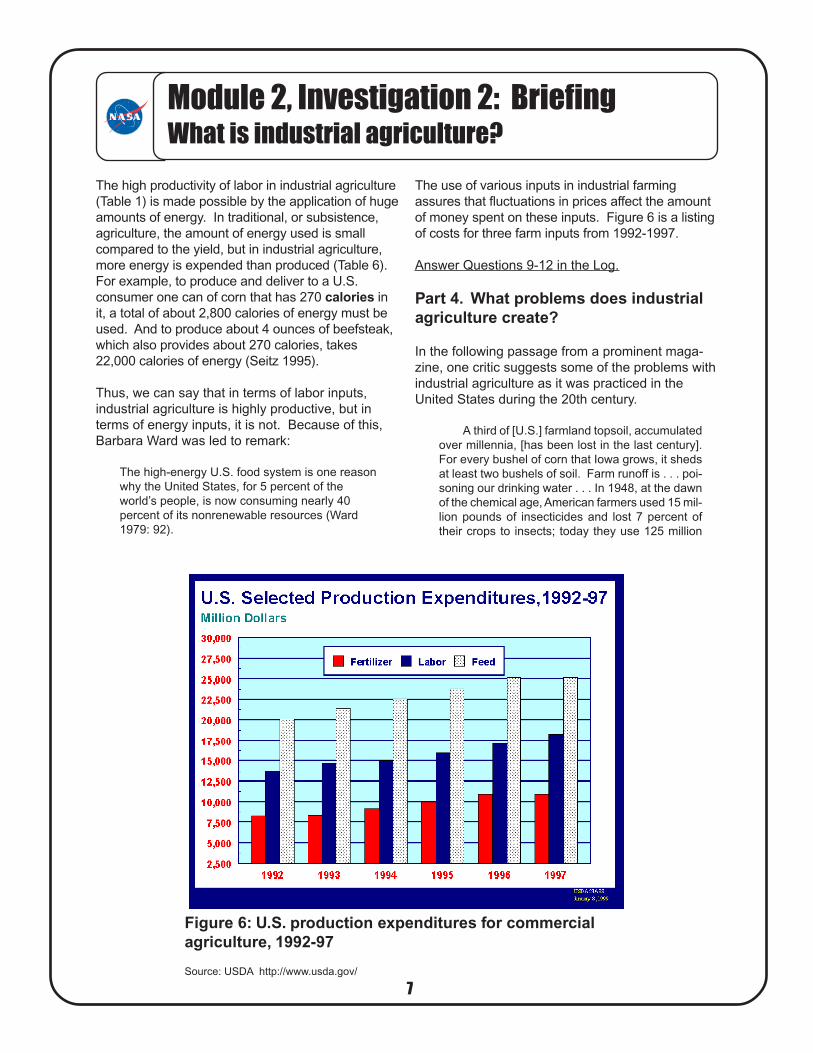
12. What trends do you see in the amount of money
spent (expenditures) on agricultural production in
the United States? What is your evidence? Do
these data enable us to conclude anything about
changes in productivity? Why or why not?
Expenditures on fertilizer, labor, and (animal) feedin U.S. agricultural production from 1992 to 1997were increasing, according to the U.S. Departmentof Agriculture (Figure 6). These data only allow usto conclude that expenditures on these items roseduring that period. We would need to comparethese expenditures on inputs with production data(outputs) in order to make conclusions aboutchanges in productivity.
13. From the quote from Eisenberg and other informa-
tion you have gathered, list what, in your opinion,
may be the three biggest problems of industrial
agriculture and support your choices.
Students may list any three reasonable concerns,including the following, but be sure they supporttheir choices:• soil erosion,• contamination of water by agricultural chemicals
and waste products,• dependence on nonrenewable fossil fuels,• depletion of water supplies by increasing irriga-
tion,• silting of reservoirs,• salinization of soil from improper irrigation, and• contamination of food by agricultural chemicals
and waste products.
14. What information can you get from remote sensing,
and how would this information help you if you
were a farmer? Examine the satellite image in
Figure 10. What changes would you make on your
plot of land? Why?
Remote sensing provides detailed informationabout where crops are located, as well as how theyare developing. Farmers can use these images todetermine the location of wet spots, soil erosion,and wind damage that affect crop productivity.Remote sensing and precision agriculture help thefarmer to accurately determine how much water,seed, fertilizer, herbicide, and pesticide is requiredfor specific plots within a large field. Precisionagriculture allows farmers to be more precise in
their use of inputs, thereby decreasing costs andreducing possible environmental damage.
Students should consider recultivating andrefertilizing the areas that were accidentallyskipped. Additionally, the drown-out should betreated to increase the yield of sugar beets. Finally,there is a large planter skip in the sugar beets thatshould be replanted. It is likely that this would nothave been detected visually until later in theplanting cycle. By acting on this new information,the farmer could increase the yield of sugar beets.
15. How might the new technologies of remote sensing
and precision agriculture help solve three of the
problems of industrial agriculture that are men-
tioned in Part 4. What problems does industrialagriculture create?• Soil erosion might be reduced by identification of
eroding spots and reduction of overwatering.• Contamination of water by agricultural chemicals
and waste products might be reduced by appli-cation of only as much chemicals as needed sochemicals will not run off into water supplies.
• Depletion of water supplies by increasingirrigation might be reduced by precise applica-tion of water to eliminate overuse of water.
• Salinization of soil might be reduced by preciseapplication of irrigation water so that salt depos-its do not develop.
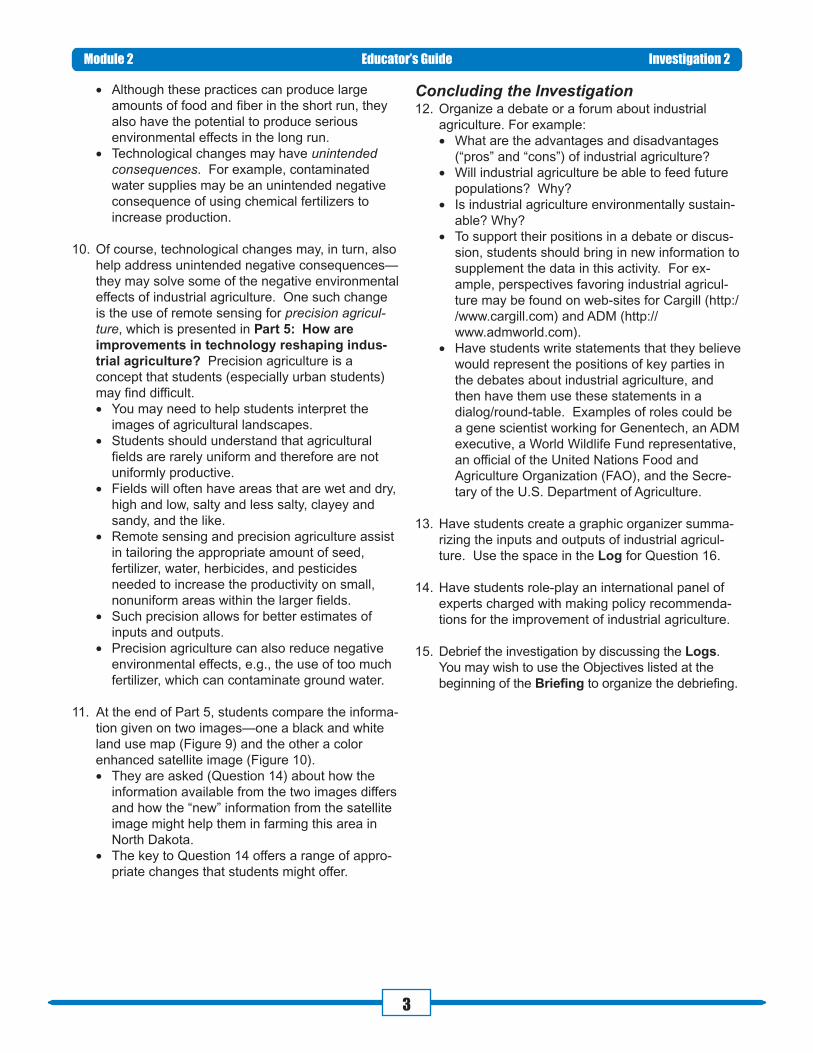
16. Create a graphic organizer to illustrate an input-
output model of industrial agriculture.
Students should create models similar to theexample below, but students should be given theflexibility to illustrate their understanding in a varietyof ways. Be sure that students understand and canappropriately use the concept of input-output in thecontext of agricultural production.
Module 2 Educator’s Guide Investigation 2
Industrial
Agriculture
Inputs Outputs
7
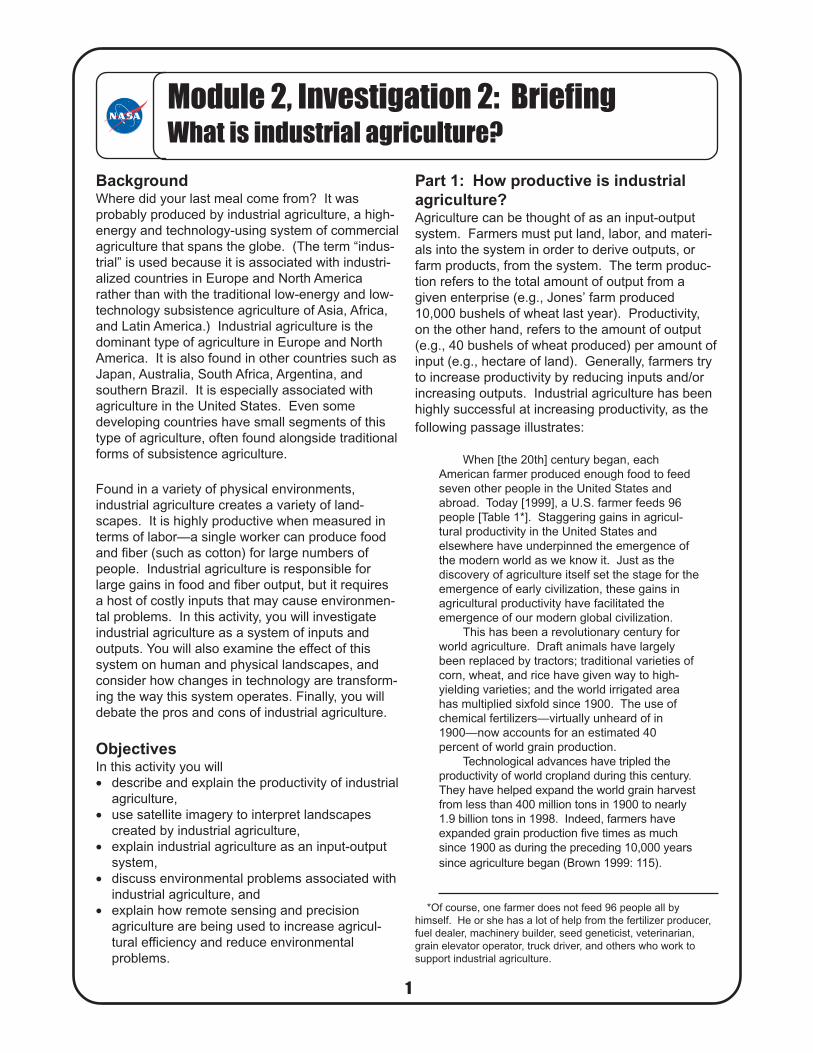
BackgroundWhere did your last meal come from? It was
probably produced by industrial agriculture, a high-
energy and technology-using system of commercial
agriculture that spans the globe. (The term “indus-
trial” is used because it is associated with industri-
alized countries in Europe and North America
rather than with the traditional low-energy and low-
technology subsistence agriculture of Asia, Africa,
and Latin America.) Industrial agriculture is the
dominant type of agriculture in Europe and North
America. It is also found in other countries such as
Japan, Australia, South Africa, Argentina, and
southern Brazil. It is especially associated with
agriculture in the United States. Even some
developing countries have small segments of this
type of agriculture, often found alongside traditional
forms of subsistence agriculture.
Found in a variety of physical environments,
industrial agriculture creates a variety of land-
scapes. It is highly productive when measured in
terms of labor—a single worker can produce food
and fiber (such as cotton) for large numbers of
people. Industrial agriculture is responsible for
large gains in food and fiber output, but it requires
a host of costly inputs that may cause environmen-
tal problems. In this activity, you will investigate
industrial agriculture as a system of inputs and
outputs. You will also examine the effect of this
system on human and physical landscapes, and
consider how changes in technology are transform-
ing the way this system operates. Finally, you will
debate the pros and cons of industrial agriculture.
ObjectivesIn this activity you will
• describe and explain the productivity of industrial
agriculture,
• use satellite imagery to interpret landscapes
created by industrial agriculture,
• explain industrial agriculture as an input-output
system,
• discuss environmental problems associated with
industrial agriculture, and
• explain how remote sensing and precision
agriculture are being used to increase agricul-
tural efficiency and reduce environmental
problems.
1
Part 1: How productive is industrialagriculture?Agriculture can be thought of as an input-output
system. Farmers must put land, labor, and materi-
als into the system in order to derive outputs, or
farm products, from the system. The term produc-
tion refers to the total amount of output from a
given enterprise (e.g., Jones’ farm produced
10,000 bushels of wheat last year). Productivity,
on the other hand, refers to the amount of output
(e.g., 40 bushels of wheat produced) per amount of
input (e.g., hectare of land). Generally, farmers try
to increase productivity by reducing inputs and/or
increasing outputs. Industrial agriculture has been
highly successful at increasing productivity, as the
following passage illustrates:
When [the 20th] century began, each
American farmer produced enough food to feed
seven other people in the United States and
abroad. Today [1999], a U.S. farmer feeds 96
people [Table 1*]. Staggering gains in agricul-
tural productivity in the United States and
elsewhere have underpinned the emergence of
the modern world as we know it. Just as the
discovery of agriculture itself set the stage for the
emergence of early civilization, these gains in
agricultural productivity have facilitated the
emergence of our modern global civilization.
This has been a revolutionary century for
world agriculture. Draft animals have largely
been replaced by tractors; traditional varieties of
corn, wheat, and rice have given way to high-
yielding varieties; and the world irrigated area
has multiplied sixfold since 1900. The use of
chemical fertilizers—virtually unheard of in
1900—now accounts for an estimated 40
percent of world grain production.
Technological advances have tripled the
productivity of world cropland during this century.
They have helped expand the world grain harvest
from less than 400 million tons in 1900 to nearly
1.9 billion tons in 1998. Indeed, farmers have
expanded grain production five times as much
since 1900 as during the preceding 10,000 years
since agriculture began (Brown 1999: 115).
Module 2, Investigation 2: BriefingWhat is industrial agriculture?
*Of course, one farmer does not feed 96 people all by
himself. He or she has a lot of help from the fertilizer producer,
fuel dealer, machinery builder, seed geneticist, veterinarian,
grain elevator operator, truck driver, and others who work to
support industrial agriculture.
82
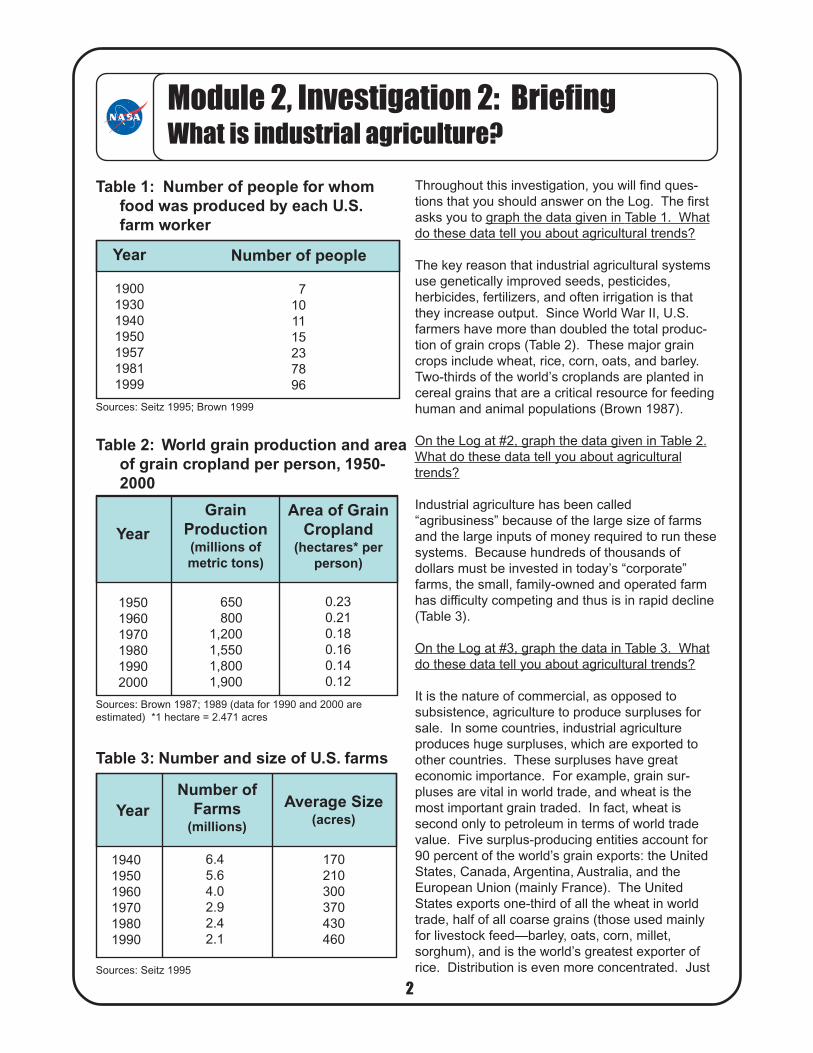
Throughout this investigation, you will find ques-
tions that you should answer on the Log. The first
asks you to graph the data given in Table 1. What
do these data tell you about agricultural trends?
The key reason that industrial agricultural systems
use genetically improved seeds, pesticides,
herbicides, fertilizers, and often irrigation is that
they increase output. Since World War II, U.S.
farmers have more than doubled the total produc-
tion of grain crops (Table 2). These major grain
crops include wheat, rice, corn, oats, and barley.
Two-thirds of the world’s croplands are planted in
cereal grains that are a critical resource for feeding
human and animal populations (Brown 1987).
On the Log at #2, graph the data given in Table 2.
What do these data tell you about agricultural
trends?
Industrial agriculture has been called
“agribusiness” because of the large size of farms
and the large inputs of money required to run these
systems. Because hundreds of thousands of
dollars must be invested in today’s “corporate”
farms, the small, family-owned and operated farm
has difficulty competing and thus is in rapid decline
(Table 3).
On the Log at #3, graph the data in Table 3. What
do these data tell you about agricultural trends?
It is the nature of commercial, as opposed to
subsistence, agriculture to produce surpluses for
sale. In some countries, industrial agriculture
produces huge surpluses, which are exported to
other countries. These surpluses have great
economic importance. For example, grain sur-
pluses are vital in world trade, and wheat is the
most important grain traded. In fact, wheat is
second only to petroleum in terms of world trade
value. Five surplus-producing entities account for
90 percent of the world’s grain exports: the United
States, Canada, Argentina, Australia, and the
European Union (mainly France). The United
States exports one-third of all the wheat in world
trade, half of all coarse grains (those used mainly
for livestock feed—barley, oats, corn, millet,
sorghum), and is the world’s greatest exporter of
rice. Distribution is even more concentrated. Just
Module 2, Investigation 2: BriefingWhat is industrial agriculture?
Table 3: Number and size of U.S. farms
Sources: Seitz 1995
YearNumber of
Farms(millions)
Average Size(acres)
1940
1950
1960
1970
1980
1990
6.4
5.6
4.0
2.9
2.4
2.1
170
210
300
370
430
460
Table 1: Number of people for whomfood was produced by each U.S.farm worker
Number of people
7
10
11
15
23
78
96
Year
1900
1930
1940
1950
1957
1981
1999
Sources: Seitz 1995; Brown 1999
Table 2: World grain production and areaof grain cropland per person, 1950-2000
Year
Sources: Brown 1987; 1989 (data for 1990 and 2000 are
estimated) *1 hectare = 2.471 acres
GrainProduction(millions ofmetric tons)
650
800
1,200
1,550
1,800
1,900
Area of GrainCropland
(hectares* perperson)
1950
1960
1970
1980
1990
2000
0.23
0.21
0.18
0.16
0.14
0.12

93
five privately-owned corporations control 85
percent of U.S. grain exports, 80 percent of
Argentina’s wheat exports, 90 percent of Australia’s
sorghum, and 90 percent of all wheat and corn
from the European Union. Of the five multinational
corporations—Cargill, Continental, Bunge and
Born, Louis Dreyfus, and Andre Carnac—only
Cargill began in the United States. The others
started in Europe in the 19th century. These
international giants have interests in banks, rail-
roads, shipping, and insurance as well as in
agriculture (Marshall 1991).
Cargill and Archer Daniels Midland (ADM), another
U.S.-based agribusiness, have far-flung operations.
For example, Cargill markets, processes, and
distributes products at locations in 60 countries
(http://www.cargill.com). ADM’s worldwide trans-
portation network, which includes 13,000 railcars,
2,250 barges, and 1,200 trucks, links over 205
domestic and internationally based plants to
process cereal grains and oilseeds into many
products used for food, beverages, and animal
feed markets worldwide <http://
www.admworld.com>.
Answer questions 4, 5, and 6 in the Log.
Part 2. What do the landscapes ofindustrial agriculture look like?Industrial agriculture creates many different land-
scapes, including dry land cereal farming, beef
feed lots, apple orchards, and irrigated rice fields,
to name only a few. Consider, for example, a
landscape of corn and wheat near Dodge City,
Kansas (Figure 1).
Figure 1: Arkansas River and DodgeCity, Kansas, October 1995
Thousands of farm fields along the Arkansas River in western
Kansas are featured in this photograph. The Arkansas River is
observable as the dark line in the center of the picture. Dodge
City (left center), a distribution center in this wheat and
livestock area, also produces agricultural implements and
supplies. How do you think all those circles were made?
Source: http://earth.jsc.nasa.gov/
photoinfo.cgi?PHOTO=STS073-704-092
Module 2, Investigation 2: BriefingWhat is industrial agriculture?
Figure 2: Center-pivot irrigation insouth-central Nebraska (1986)
Source: http://www-geoimages. berkeley.edu/
GeoImages/Starrs/CENPIVOT.html
104
As with many human traces on the landscape,
industrial agriculture typically produces regular-
looking patterns, which are readily observed and
interpreted from above with satellite imagery. In
the landscapes in Figures 1 and 2, the patterns are
rectangles and circles. Rectangular crop fields
derive from the land survey system in this part of
the United States—the system of townships and
ranges based on longitude and latitude. The
rectangles in this image are wheat fields, which are
probably not irrigated. However, superimposed on
this essentially rectangular system are very large
circles. What are they?
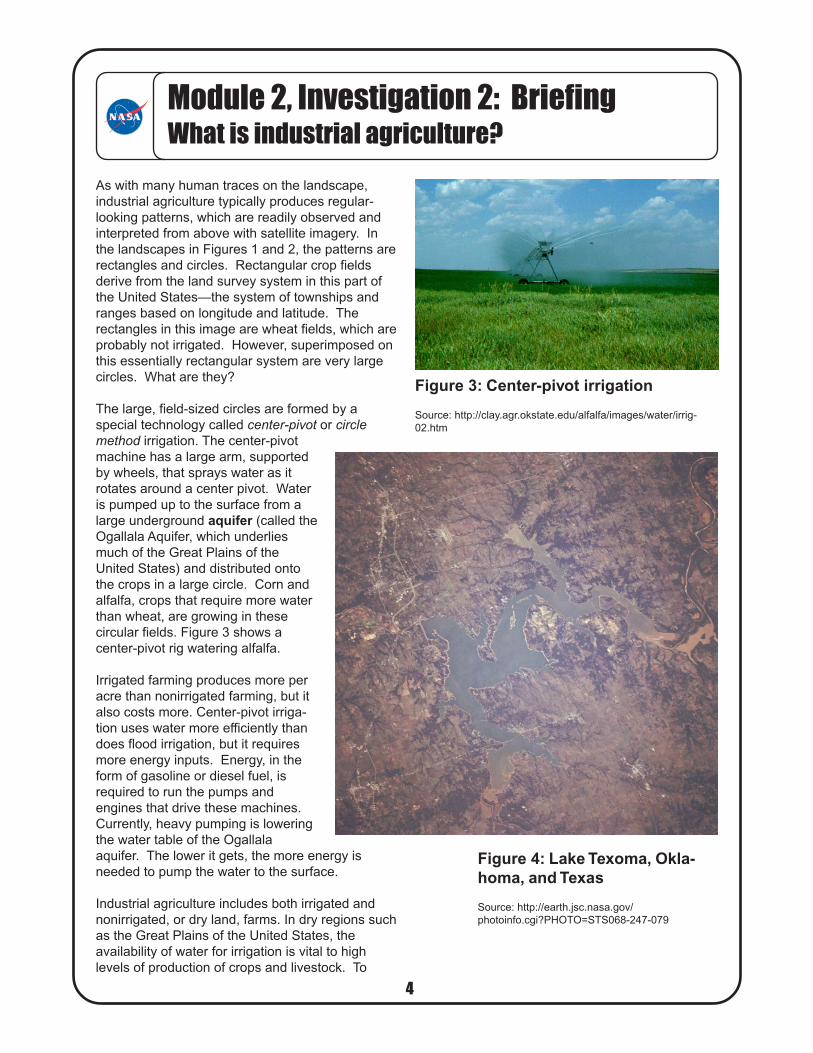
The large, field-sized circles are formed by a
special technology called center-pivot or circlemethod irrigation. The center-pivot
machine has a large arm, supported
by wheels, that sprays water as it
rotates around a center pivot. Water
is pumped up to the surface from a
large underground aquifer (called the
Ogallala Aquifer, which underlies
much of the Great Plains of the
United States) and distributed onto
the crops in a large circle. Corn and
alfalfa, crops that require more water
than wheat, are growing in these
circular fields. Figure 3 shows a
center-pivot rig watering alfalfa.
Irrigated farming produces more per
acre than nonirrigated farming, but it
also costs more. Center-pivot irriga-
tion uses water more efficiently than
does flood irrigation, but it requires
more energy inputs. Energy, in the
form of gasoline or diesel fuel, is
required to run the pumps and
engines that drive these machines.
Currently, heavy pumping is lowering
the water table of the Ogallala
aquifer. The lower it gets, the more energy is
needed to pump the water to the surface.
Industrial agriculture includes both irrigated and
nonirrigated, or dry land, farms. In dry regions such
as the Great Plains of the United States, the
availability of water for irrigation is vital to high
levels of production of crops and livestock. To
Figure 3: Center-pivot irrigation
Source: http://clay.agr.okstate.edu/alfalfa/images/water/irrig-
02.htm
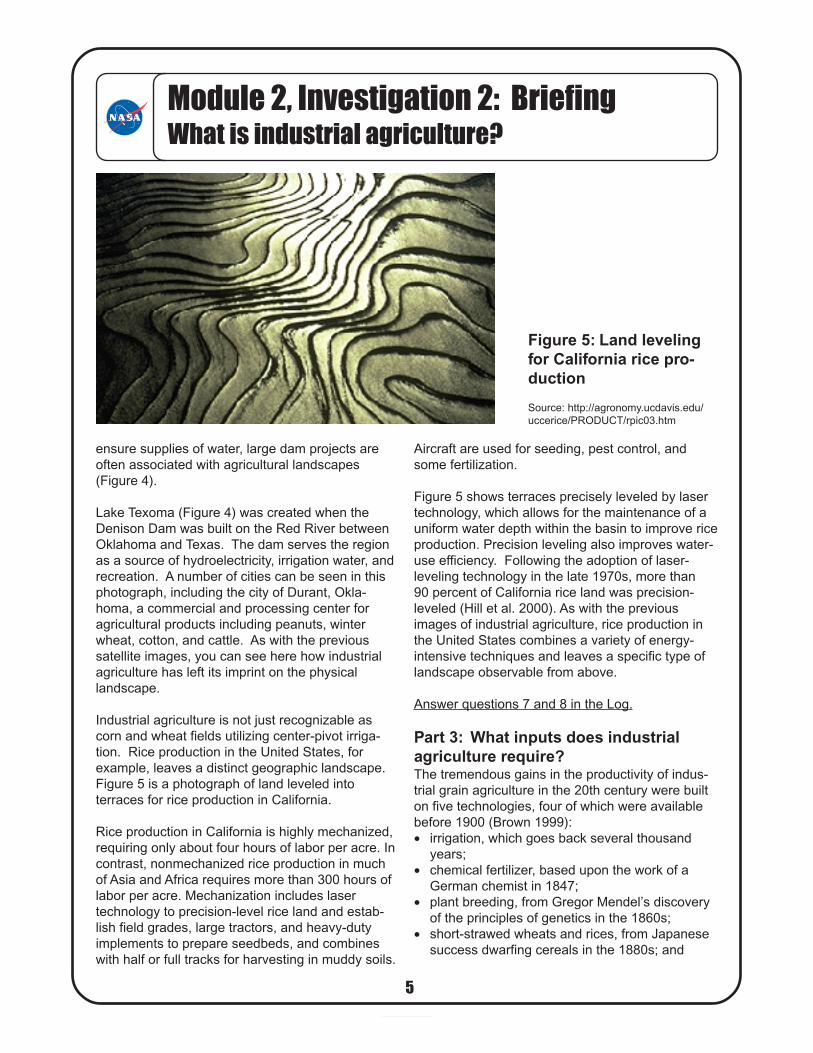
Figure 4: Lake Texoma, Okla-homa, and Texas
Source: http://earth.jsc.nasa.gov/
photoinfo.cgi?PHOTO=STS068-247-079
Module 2, Investigation 2: BriefingWhat is industrial agriculture?
115
ensure supplies of water, large dam projects are
often associated with agricultural landscapes
(Figure 4).
Lake Texoma (Figure 4) was created when the
Denison Dam was built on the Red River between
Oklahoma and Texas. The dam serves the region
as a source of hydroelectricity, irrigation water, and
recreation. A number of cities can be seen in this
photograph, including the city of Durant, Okla-
homa, a commercial and processing center for
agricultural products including peanuts, winter
wheat, cotton, and cattle. As with the previous
satellite images, you can see here how industrial
agriculture has left its imprint on the physical
landscape.
Industrial agriculture is not just recognizable as
corn and wheat fields utilizing center-pivot irriga-
tion. Rice production in the United States, for
example, leaves a distinct geographic landscape.
Figure 5 is a photograph of land leveled into
terraces for rice production in California.
Rice production in California is highly mechanized,
requiring only about four hours of labor per acre. In
contrast, nonmechanized rice production in much
of Asia and Africa requires more than 300 hours of
labor per acre. Mechanization includes laser
technology to precision-level rice land and estab-
lish field grades, large tractors, and heavy-duty
implements to prepare seedbeds, and combines
with half or full tracks for harvesting in muddy soils.
Aircraft are used for seeding, pest control, and
some fertilization.
Figure 5 shows terraces precisely leveled by laser
technology, which allows for the maintenance of a
uniform water depth within the basin to improve rice
production. Precision leveling also improves water-
use efficiency. Following the adoption of laser-
leveling technology in the late 1970s, more than
90 percent of California rice land was precision-
leveled (Hill et al. 2000). As with the previous
images of industrial agriculture, rice production in
the United States combines a variety of energy-
intensive techniques and leaves a specific type of
landscape observable from above.
Answer questions 7 and 8 in the Log.
Part 3: What inputs does industrialagriculture require?The tremendous gains in the productivity of indus-
trial grain agriculture in the 20th century were built
on five technologies, four of which were available
before 1900 (Brown 1999):
• irrigation, which goes back several thousand
years;
• chemical fertilizer, based upon the work of a
German chemist in 1847;
• plant breeding, from Gregor Mendel’s discovery
of the principles of genetics in the 1860s;
• short-strawed wheats and rices, from Japanese
success dwarfing cereals in the 1880s; and
Figure 5: Land levelingfor California rice pro-duction
Source: http://agronomy.ucdavis.edu/
uccerice/PRODUCT/rpic03.htm
Module 2, Investigation 2: BriefingWhat is industrial agriculture?

126
• hybrid corn, from development in 1917 at the
University of Connecticut.
One should add to this list the application of huge
amounts of energy, especially petroleum, which is
needed to
• manufacture, transport, and operate farm
machinery;
• build and operate irrigation systems;
• manufacture, transport, and apply pesticides
and herbicides;
• mine, manufacture, and transport fertilizers; and
• process, package, transport, and
display food.
How have farmers increased their yield in
grain crops while utilizing less agricultural
area (Table 2)? Agricultural systems use
a variety of inputs to improve their yield.
One of the most important inputs to
industrial agriculture is fertilizer produced
from petroleum. Table 4 documents the
amount of fertilizer use throughout the
world.
Changes in the use of fossil fuels and
other energy inputs in agriculture over
time are shown in Table 5.
Module 2, Investigation 2: BriefingWhat is industrial agriculture?
Table 6: Calories* of energy used to produce 1 calorie of food invarious food production systems
* A measure of heat energy, 1 calorie will raise 1 gram of water 1 degree Celsius.
Source: Adapted from Paul R. Ehrlich et al. 1977. Ecoscience: Population, Resources, Environment,p. 349. W. H. Freeman and Company
Calories Traditional Agriculture Industrial Agriculture
10-20
5-10
2-5
1-2
0.5-1
0.2-0.5
0.1-0.2
0.05-0.1
0.02-0.05
Coastal fishing
Low-intensity eggs
Range-fed beef
Low-intensity corn, peanuts
Wet rice
Wet rice
Ocean fishing
Feedlot beef
Intensive eggs
Modern milk from grass-fed cows
Intensive soybeans and peanuts
Intensive corn
Intensive wheat, potatoes
Intensive rice
Table 5: Energy use in world agriculture(millions of barrels of oil)
Notes: *Fuel = fuel for tractors and other farm machines, including irrigation
equipment. **Other = energy used to (1) synthesize pesticides and
herbicides, (2) manufacture farm machinery, (3) apply fertilizer, and (4) dry
grain. Figures are estimates because no reliable data exist.
Source: Brown 1987
Year Fuel* FertilizerManufacture
1950
1960
1970
1980
1985
160
321
498
789
940
70
133
310
552
646
Other **
46
91
162
268
317
Sources: Brown 1987; 1997; 1999
Table 4: World fertilizer use, 1950-1995
Year Millions ofMetric Tons
1950
1960
1970
1980
1990
1995
14
27
63
112
140
120
137
The high productivity of labor in industrial agriculture
(Table 1) is made possible by the application of huge
amounts of energy. In traditional, or subsistence,
agriculture, the amount of energy used is small
compared to the yield, but in industrial agriculture,
more energy is expended than produced (Table 6).
For example, to produce and deliver to a U.S.
consumer one can of corn that has 270 calories in
it, a total of about 2,800 calories of energy must be
used. And to produce about 4 ounces of beefsteak,
which also provides about 270 calories, takes
22,000 calories of energy (Seitz 1995).
Thus, we can say that in terms of labor inputs,
industrial agriculture is highly productive, but in
terms of energy inputs, it is not. Because of this,
Barbara Ward was led to remark:
The high-energy U.S. food system is one reason
why the United States, for 5 percent of the
world’s people, is now consuming nearly 40
percent of its nonrenewable resources (Ward
1979: 92).
The use of various inputs in industrial farming
assures that fluctuations in prices affect the amount
of money spent on these inputs. Figure 6 is a listing
of costs for three farm inputs from 1992-1997.
Answer Questions 9-12 in the Log.
Part 4. What problems does industrialagriculture create?
In the following passage from a prominent maga-
zine, one critic suggests some of the problems with
industrial agriculture as it was practiced in the
United States during the 20th century.
A third of [U.S.] farmland topsoil, accumulated
over millennia, [has been lost in the last century].
For every bushel of corn that Iowa grows, it sheds
at least two bushels of soil. Farm runoff is . . . poi-
soning our drinking water . . . In 1948, at the dawn
of the chemical age, American farmers used 15 mil-
lion pounds of insecticides and lost 7 percent of
their crops to insects; today they use 125 million
Module 2, Investigation 2: BriefingWhat is industrial agriculture?
Figure 6: U.S. production expenditures for commercialagriculture, 1992-97
Source: USDA http://www.usda.gov/

148
pounds and lose 13 percent. Because most agri-
cultural chemicals are made from fossil fuels, we
[use] three calories of energy to produce each calo-
rie of food we eat . . . In contrast, Tsembaga farm-
ers in New Guinea, using Neolithic slash-and-burn
methods, [use] less than a 10th of a calorie for each
calorie they eat. For each American man, woman,
and child, our agriculture [uses] 160 pounds of ni-
trogen, phosphate, and potash fertilizer each year,
and 325 gallons of water each day. The Ogallala
aquifer of the Great Plains held enough water
40 years ago to fill Lake Huron; in another 20 years
it may be too low to pump. The great dams of the
West are silting up. Sloppy irrigation and poor drain-
age . . . have caused [salty] conditions on 10 per-
cent of our crop and pasture land. Should we es-
cape the fate of the ancient empires that were done
in by erosion, we may instead face that of the
Sumerians, whose civilization crumbled as their soil
turned salty (Eisenberg 1989: 59).
Answer Question 13 in the Log.
Part 5: How are improvements in tech-nology reshaping industrial agriculture?
The use of remote sensing and precision agricul-ture is a promising attempt to reduce the reliance
upon certain inputs, while improving both crop
productivity and the environment. At the present
time, diminishing crop prices coupled with in-
creased costs have led to numerous attempts by
farmers to increase yields per acre. Increasing
irrigation, fertilizer, insecticide, and herbicide have
been attempted, and excessive applications of
these inputs means more costs and increased
environmental pollution. As a result, industrial
agriculture is moving toward the use of remote-
sensing technologies and precision agriculture, a
farming technology that attempts to specify the
exact quantities of water, fertilizer, herbicide, and
pesticide needed. Precision agriculture is being
used to identify when and where these inputs
should be applied to each specific field.
At the Global Hydrology and Climate Center in
Huntsville, Alabama, managed by the Marshall
Space Flight Center, NASA scientists are collabo-
rating with university scientists in Alabama and
Georgia to apply remote-sensing technology to
support precision farming (NASA Marshall News
1999). In precision farming, growers break fields
down into regions, or cells, analyzing growth
characteristics of each cell and improving crop
health and yield by applying precise amounts of
seed, fertilizer, herbicides, and pesticides as
needed. Traditionally, farmers have lacked the
ability to make close analyses of specific cells.
When they fertilized their crops, they simply spread
the fertilizer uniformly across the entire field.
Improvements in technology, including the use of
remote sensing, allow farmers to tailor the amount
of this agricultural input more precisely.
Remote sensing uses instruments on airplanes or
orbiting satellites to gather information about
Earth’s surface. These instruments, which mea-
sure electromagnetic radiation, including thermal
energy reflected or emitted by all natural and
synthetic objects, can be an excellent tool for
increasing agricultural production. As Doug
Rickman, lead scientist for the Global Hydrology
and Climate Center, stated:
We can fly over an area and precisely map its
plant quality and soil makeup—including mineral
variation and organic carbon content—in
approximately 6-foot increments. Farmers have
sought this ability for 30 years (NASA Marshall
News 1999).
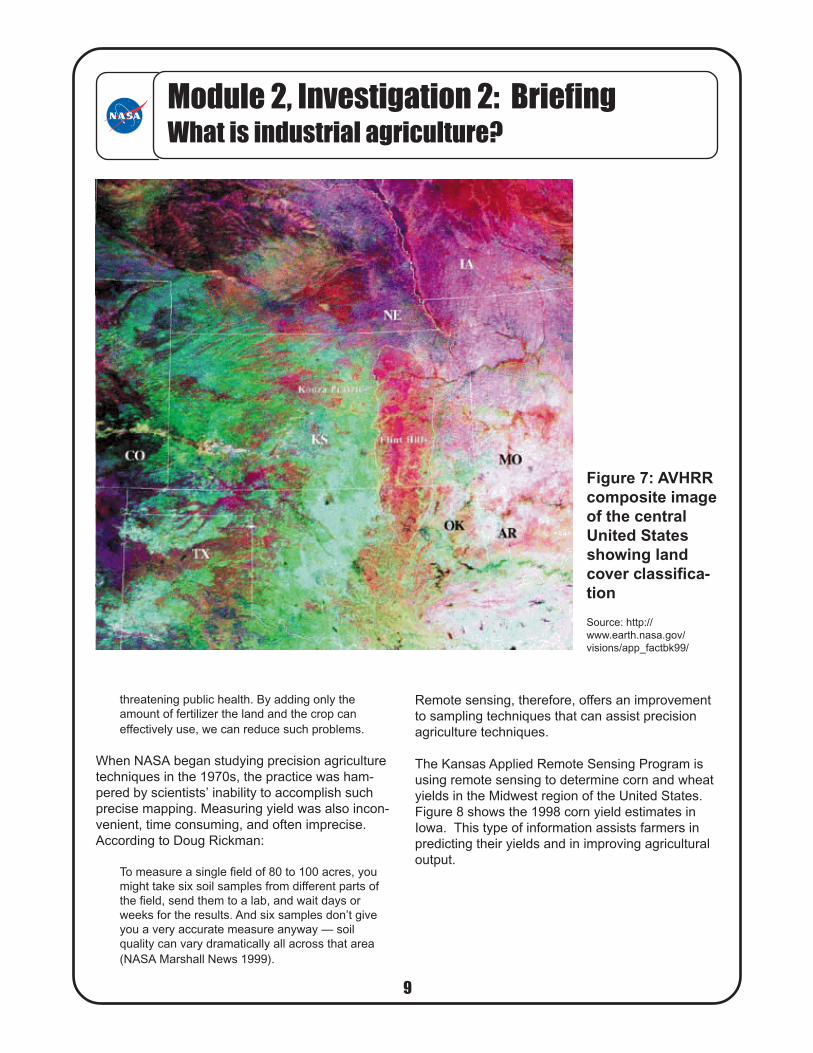
Figure 7 is a remote-sensing image of land types of
the Midwest. The various colors indicate different
types of land systems that scientists can then
identify to assist agricultural production.
Using remote sensing, scientists can identify areas
that will naturally have a low yield and reduce the
amount of fertilizer applied. As Paul Mask, profes-
sor of agronomy at Auburn University, stated:
If the maximum capability of an area is 50
bushels an acre, there is no need to fertilize for
120 bushels. It does no good (NASA Marshall
News 1999).
Such precise crop maintenance benefits society in
another way, according to Mask:
Excess nitrogen can leak into groundwater.
Other fertilizers can increase pollution problems,
Module 2, Investigation 2: BriefingWhat is industrial agriculture?
159
threatening public health. By adding only the
amount of fertilizer the land and the crop can
effectively use, we can reduce such problems.
When NASA began studying precision agriculture
techniques in the 1970s, the practice was ham-
pered by scientists’ inability to accomplish such
precise mapping. Measuring yield was also incon-
venient, time consuming, and often imprecise.
According to Doug Rickman:
To measure a single field of 80 to 100 acres, you
might take six soil samples from different parts of
the field, send them to a lab, and wait days or
weeks for the results. And six samples don’t give
you a very accurate measure anyway — soil
quality can vary dramatically all across that area
(NASA Marshall News 1999).
Figure 7: AVHRRcomposite imageof the centralUnited Statesshowing landcover classifica-tion
Source: http://
www.earth.nasa.gov/
visions/app_factbk99/
Module 2, Investigation 2: BriefingWhat is industrial agriculture?
Remote sensing, therefore, offers an improvement
to sampling techniques that can assist precision
agriculture techniques.
The Kansas Applied Remote Sensing Program is
using remote sensing to determine corn and wheat
yields in the Midwest region of the United States.
Figure 8 shows the 1998 corn yield estimates in
Iowa. This type of information assists farmers in
predicting their yields and in improving agricultural
output.

1610
Figure 8: 1998 Iowa corn yields measured as NVDI(greenness) of crops so yield predictions can bemade
In the first half of the corn growing season, strong winds and several isolated
hailstorms did large amounts of damage to the corn crops in Iowa. This image is used
to demonstrate that the areas damaged by the storms had reduced yields.
Source: http://www.kars.ukans.edu/products/iowa.htm
Module 2, Investigation 2: BriefingWhat is industrial agriculture?
The Upper Midwest Aerospace Consortium
(UMAC) is another group investigating the use of
remote sensing for increasing agricultural output.
UMAC is providing remote-sensing data to sugar
beet growers in the Red River Valley in North
Dakota, an important sugar beet producing region.
UMAC scientists use aerial crop scouting to
examine an area of 6 miles by 10 miles covering
St. Thomas Township in North Dakota. Let’s
imagine how this type of information is helpful to
farmers.
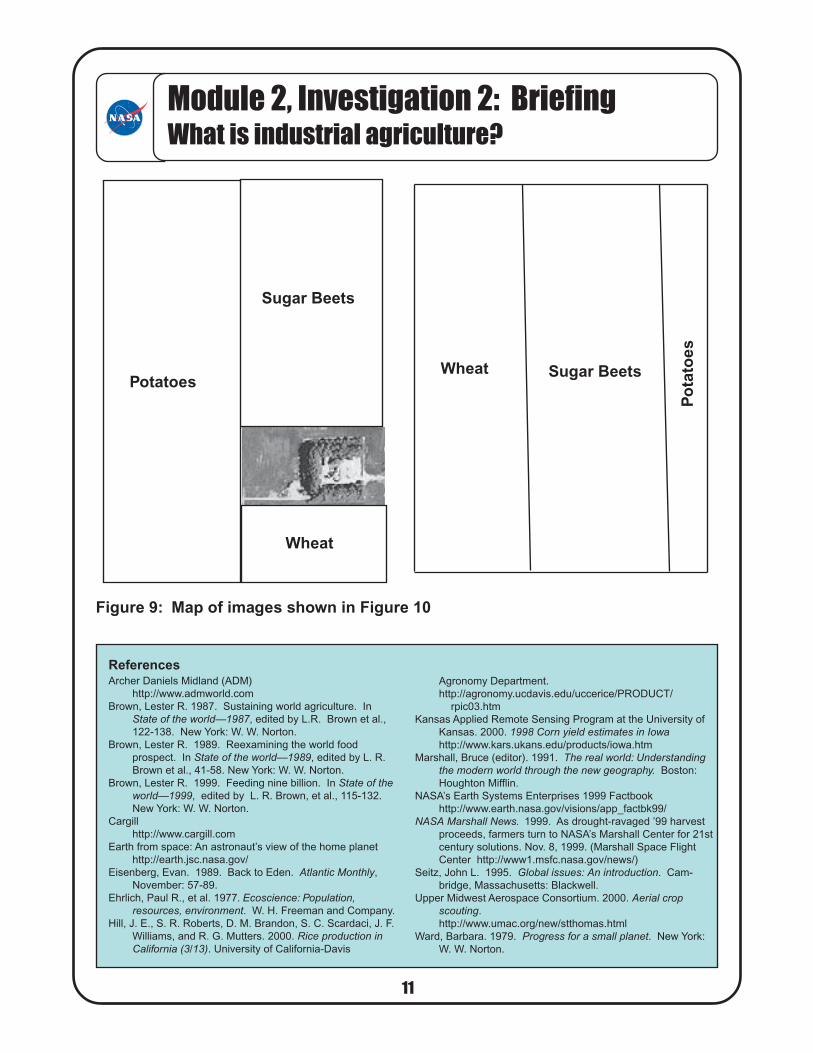
Scenario: Imagine that you own the farmland
mapped in Figure 9. Notice that you have three
crops (wheat, sugar beets, and potatoes) distrib-
uted together on the land. You have decided to
buy a satellite image of your plot so you can look at
a precision agriculture image of the plot to deter-
mine any needed changes. You buy Figure 10.
Answer Question 14 in the Log.
For industrial agriculture to increase output while
reducing the need for inputs that put strains on the
environment, techniques like precision agriculture
will need to be utilized in the future. Remote
sensing and other satellite technologies will be
extremely useful in reducing the need for fertilizers
and pesticides, while also improving crop yields.
Answer Question 15 in the Log.
1711
ReferencesArcher Daniels Midland (ADM)
http://www.admworld.com
Brown, Lester R. 1987. Sustaining world agriculture. In
State of the world—1987, edited by L.R. Brown et al.,
122-138. New York: W. W. Norton.
Brown, Lester R. 1989. Reexamining the world food
prospect. In State of the world—1989, edited by L. R.
Brown et al., 41-58. New York: W. W. Norton.
Brown, Lester R. 1999. Feeding nine billion. In State of theworld—1999, edited by L. R. Brown, et al., 115-132.
New York: W. W. Norton.
Cargill
http://www.cargill.com
Earth from space: An astronaut’s view of the home planet
http://earth.jsc.nasa.gov/
Eisenberg, Evan. 1989. Back to Eden. Atlantic Monthly,
November: 57-89.
Ehrlich, Paul R., et al. 1977. Ecoscience: Population,resources, environment. W. H. Freeman and Company.
Hill, J. E., S. R. Roberts, D. M. Brandon, S. C. Scardaci, J. F.
Williams, and R. G. Mutters. 2000. Rice production inCalifornia (3/13). University of California-Davis
Module 2, Investigation 2: BriefingWhat is industrial agriculture?
Figure 9: Map of images shown in Figure 10
Agronomy Department.
http://agronomy.ucdavis.edu/uccerice/PRODUCT/
rpic03.htm
Kansas Applied Remote Sensing Program at the University of
Kansas. 2000. 1998 Corn yield estimates in Iowahttp://www.kars.ukans.edu/products/iowa.htm
Marshall, Bruce (editor). 1991. The real world: Understandingthe modern world through the new geography. Boston:
Houghton Mifflin.
NASA’s Earth Systems Enterprises 1999 Factbook
http://www.earth.nasa.gov/visions/app_factbk99/
NASA Marshall News. 1999. As drought-ravaged ’99 harvest
proceeds, farmers turn to NASA’s Marshall Center for 21st
century solutions. Nov. 8, 1999. (Marshall Space Flight
Center http://www1.msfc.nasa.gov/news/)
Seitz, John L. 1995. Global issues: An introduction. Cam-
bridge, Massachusetts: Blackwell.
Upper Midwest Aerospace Consortium. 2000. Aerial cropscouting.
http://www.umac.org/new/stthomas.html
Ward, Barbara. 1979. Progress for a small planet. New York:
W. W. Norton.
Sugar Beets
Po
tato
es
Wheat
Wheat
Potatoes
Sugar Beets
1812
Module 2, Investigation 2: BriefingWhat is industrial agriculture?
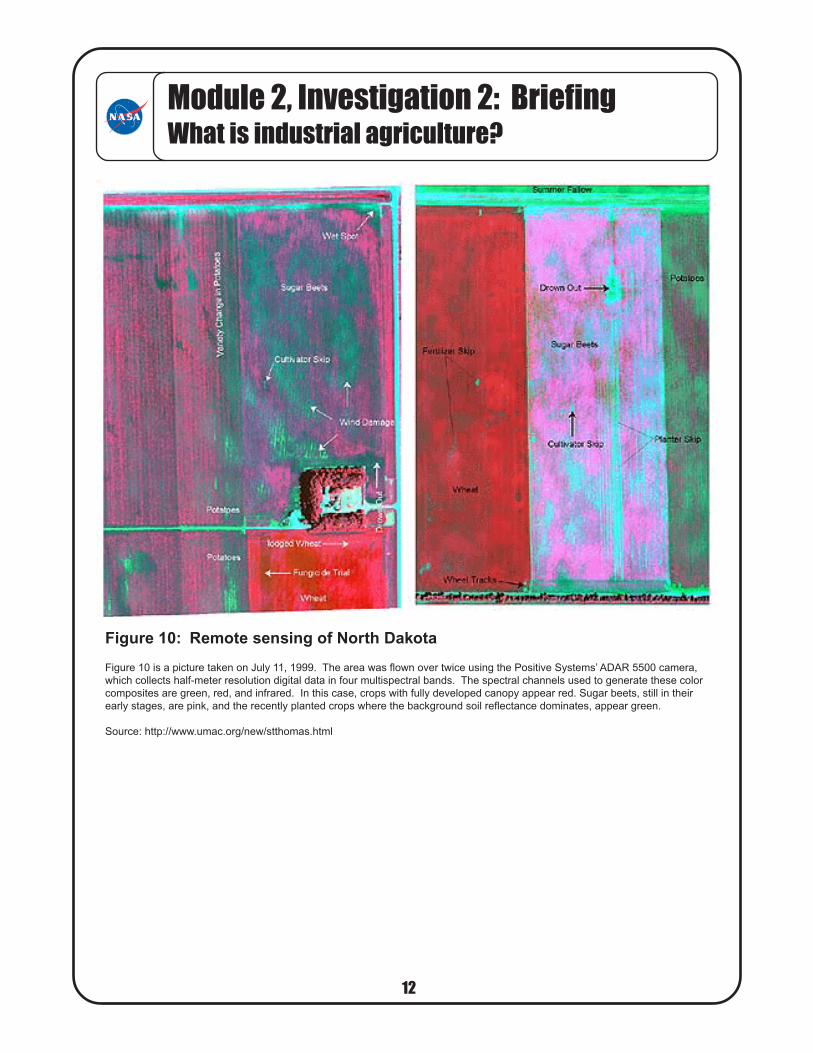
Figure 10: Remote sensing of North Dakota
Figure 10 is a picture taken on July 11, 1999. The area was flown over twice using the Positive Systems’ ADAR 5500 camera,
which collects half-meter resolution digital data in four multispectral bands. The spectral channels used to generate these color
composites are green, red, and infrared. In this case, crops with fully developed canopy appear red. Sugar beets, still in their
early stages, are pink, and the recently planted crops where the background soil reflectance dominates, appear green.
Source: http://www.umac.org/new/stthomas.html

1913
Module 2, Investigation 2: LogWhat is industrial agriculture?
1. Complete the graph of the data given in Table 1. What do these data tell you about agricultural
trends?
2. Graph the data given in Table 2. What do these data tell you about agricultural trends?
20001900
100
19801920 1940 1960
Avera
ge N
um
ber
of
Pe
ople
Fed b
y O
ne U
.S.
Farm
er
Year
90
10
20
30
40
80
70
60
50
Gra
in P
roduction
(mill
ion o
f m
etr
ic t
ons) A
rea o
f Gra
in C
ropla
nd
(hecta
res p
er p
ers
on)
2000199019801950 1960 1970
250
500
750
1000
1250
0.05
0.10
0.15
2014
3. Graph the data given in Table 3. What do these data tell you about agricultural trends?
4. Agriculture was described as an input-output system. Write down three more examples of an input-
output system and explain your examples.
5. Explain the difference between “production” and “productivity” using examples that are not found in
these materials.
Module 2, Investigation 2: LogWhat is industrial agriculture?
1)
2)
3)
6.5
6
5.5
5
4.5
4
3.5
3
2.5
2
1940 1950 1960 1970 1980 1990
500
450
400
350
300
250
200
150
100
50
Average Size(acres)
Number
of
Farms
(millions)
2115
6. Describe the trends in industrial agricultural production and productivity in the 20th century.
7. In Part 2: What do the landscapes of industrial agriculture look like? you were shown satellite
images of only a few examples of these landscapes. Write down two more examples of different
landscapes of industrial agriculture that you have personally seen.
8. What are the characteristics of industrial agriculture? In other words, what do all the examples of this
type of agriculture have in common? List as many characteristics as you can.
9. What natural resource is used to make fertilizers, pesticides, and farm machinery? List three other
agricultural inputs that come from this natural resource.
Module 2, Investigation 2: LogWhat is industrial agriculture?
1)
2)
3)
1)
2)

22
10. Do you think the increasing use of fertilizer in industrial agriculture is a practice that can be sustained
in the future? Why or why not?
11. By what measure is “traditional” agriculture more productive than industrial agriculture? By what
measure is industrial agriculture more productive than traditional agriculture?
12. What trends do you see in the amount of money spent (expenditures) on agricultural production in the
United States? What is your evidence? Do these data enable us to conclude anything about changes
in productivity? Why?
16
Module 2, Investigation 2: LogWhat is industrial agriculture?
2317
Module 2, Investigation 2: LogWhat is industrial agriculture?
1)
2)
3)
1)
2)
3)
13. From the quote from Eisenberg and other information you have gathered, list what, in your opinion,
may be the three biggest problems of industrial agriculture, and support your choices.
14. What information can you get from remote sensing, and how would this information help you if you
were a farmer? Examine the satellite image in Figure 10. What changes would you make on your
plot of land and why?
15. How might the new technologies of remote sensing and precision agriculture help solve three of the
problems of industrial agriculture mentioned in Part 4. What problems does industrial agriculturecreate?

2418
Mod
ule
2, In
vest
igat
ion
2: L
ogW
hat i
s in
dust
rial
agr
icul
ture
?
16
. C
reate
a g
raphic
org
aniz
er
to illu
str
ate
the
inputs
and o
utp
uts
of
industr
ial agriculture
.
Ind
ust
rial
Ag
ricu
ltu
re
Inp
uts
Ou
tpu
ts