module 3: adding code to a report module … · code can be written using the c/al editor on...
TRANSCRIPT

3 - 1
MODULE 3: ADDING CODE TO A REPORT
Module Overview When you create reports in Microsoft Dynamics® NAV, start by defining the data model for the report, by filling in the data item(s) in the Report Dataset Designer.
In addition to properties, for every data item there are also triggers available. Triggers can contain C/AL code that is executed when the trigger occurs.
The report includes the following triggers:
• OnInitReport()
• OnPreReport()
• OnPostReport()
For every data item that you add in the DataItem designer window the following triggers are available:
• OnPreDataItem()
• OnAfterGetRecord()
• OnPostDataItem()
The request page of a report has the following triggers:
• Documentation()
• OnInit()
• OnOpenPage()
• OnClosePage()
• OnFindRecord(Which : Text) : Boolean
• OnNextRecord(Steps : Integer) : Integer
• OnAfterGetRecord()
• OnNewRecord(BelowxRec : Boolean)
• OnInsertRecord(BelowxRec : Boolean) : Boolean
• OnModifyRecord() : Boolean
• OnDeleteRecord() : Boolean
• OnQueryClosePage(CloseAction : Action None) : Boolean
• OnAfterGetCurrRecord()
Microsoft Official Training Materials for Microsoft Dynamics ® Your use of this content is subject to your current services agreement

Reporting in Microsoft Dynamics® NAV 2013
3 - 2
The controls on the request page each have the following triggers:
• OnValidate()
• OnLookup(VAR Text : Text) : Boolean
• OnDrillDown()
• OnAssistEdit()
• OnControlAddIn(Index : Integer;Data : Text)
In reports, triggers are typically used to perform calculations and to control whether to output sections. You can use triggers to control how data is selected and retrieved in a more complex and effective way than you can achieve by using properties.
An RDLC report layout does not contain triggers. Instead, you can use expressions. Expressions are related to properties in RDLC reports.
This module will focus on the important features that you must know to be able to develop RDLC reports.
Objectives
The objectives are:
• Explain how coding can be used in reports.
• Work with expressions.
• Learn how to use expressions.
• Examine frequently used expressions.
• Describe the components of the Sales Invoice report.
Microsoft Official Training Materials for Microsoft Dynamics ® Your use of this content is subject to your current services agreement

Module 3: Adding Code to a Report
3 - 3
Using Variables and C/AL Code in a Report The reports built in the previous modules are designed by using the designers, controls and properties.
In reports, you can also add code. The code is used for advanced report functionalities that cannot be achieved by using properties. Additionally, the code can be used for retrieving and calculating data, but also for formatting purposes (and dynamically hiding and showing data sections).
Code can be written using the C/AL Editor on different levels:
• Report triggers
• Data item triggers
• Request page triggers
• Request page control triggers
Previous modules described how the logical design of a report applies to Report Definition Language Client-side (RDLC) report layouts. If you use code to filter or sort a specific data item, the code will be reflected in the dataset that is generated.
But not all code is written on the data item level. Many reports have a request options page that uses options that affect the way a report is printed. Well-known options include the following: Show details, Print amounts in Local Currency, Top X (where X can be a number selected by the user such as Top 5, Top 10), Show Sales (LCY) or Balance (LCY). The information from the Request page is stored in variables that are evaluated in runtime.
Report Triggers
In reports, triggers are typically used to perform calculations and verification. You can use triggers to control how data is selected and retrieved in a more complex and effective way than you can achieve by using properties.
OnInitReport
This trigger is executed before the Request page is run and before any table views or filters are set. This trigger performs any processing that is required before the report is run, such as initializing global variables. It can also stop the report.
Microsoft Official Training Materials for Microsoft Dynamics ® Your use of this content is subject to your current services agreement

Reporting in Microsoft Dynamics® NAV 2013
3 - 4
OnPreReport
This trigger executes after the Request page is run. The table views and filters for the report data items are set while this trigger is executed. As this trigger is executed after the Request page is processed, you have access to any filters the user has set. If you want to print the settings of these filters in the report, you can retrieve them by using the function: String := Record.GETFILTERS and then by using the text string as the source expression for a control in a section of the report.
OnPostReport
This trigger is executed after all data items are processed. The trigger is not run if the report is stopped manually or if you are using the QUIT function before processing has concluded.
Because this trigger is executed after the report is processed, you can use it to inform users about the result of the report run.
Additionally, because this trigger is executed before the End Write Transaction, you can also give the user the opportunity to roll back changes to the database by leaving the report that has the QUIT; function.
OnPreDataItem
This trigger is executed before a data item is processed, and after the associated variable is initialized and table views and filters are set.
You can use this trigger to add more filtering beyond what is established by the DataItemLink property (Reports) or DataItemTableView property. For example, use this trigger if you have to filter an indented data item based on the result of a calculation. Use the SETRANGE or SETFILTER function to add more delimiters.
OnPostDataItem
This trigger executes after the last record in the data item is processed but before the OnPostReport trigger is executed, if it is the last data item of the report.
Use this trigger to perform any cleanup or post processing that is required after a data item is processed. For example, if you create a nonprinting report where records are updated, you can update all the records with the modification date as follows:
MODIFYALL("Modification Date",TODAY);
Microsoft Official Training Materials for Microsoft Dynamics ® Your use of this content is subject to your current services agreement

Module 3: Adding Code to a Report
3 - 5
OnAfterGetRecord
Use this trigger to perform any processing that is required, based on the values in the fields of the individual records of a data item.
If the record contains FlowFields, you can put CALCFIELDS statements in this trigger to have them calculated. Although it is typically easier to use the CalcFields property to have it done automatically, there are situations where you have to use this trigger to perform the calculation explicitly. For example, if you apply FlowFilters based on the context of the report to the FlowFields inside this trigger, you must recalculate the FlowFields after you have applied the FlowFilters.
Another example is when you must retrieve information from a table that is external to the report. This is the situation when the records of a data item contain fields that are foreign keys (meaning the fields that are primary keys in other tables), and you want to extract additional information from the related tables. For example, in a report, the records in a data item might contain a field that has a Vendor code. However, you want to print the full name and address of the vendor. You use this trigger to retrieve the information so that you can print it in your report.
Microsoft Official Training Materials for Microsoft Dynamics ® Your use of this content is subject to your current services agreement

Reporting in Microsoft Dynamics® NAV 2013
3 - 6
Trigger Execution Order
When you run a report, the report triggers are called in a specific order.
The ReportTriggersExecution figure describes the order in which report triggers are executed.
FIGURE 3.1: REPORT TRIGGERS EXECUTION ORDER
When you start the report run, the OnInitReport trigger is called. If the OnInitReport does not end the processing of the report, then the request page for the report is run, if it is defined. The page triggers for the request page are called. On the request page, you select the options that you want for this report. You can also decide to cancel the report run. If you decide to continue, then the OnPreReport trigger is called. At this point, no data is processed. When the OnPreReport trigger is executed, the first data item is processed if the processing of the report is not ended in the OnPreReport trigger.
When the first data item is processed, the next data item is processed in the same manner. When there are no more data items, the OnPostReport trigger is called to do any necessary post processing, for example, removing temporary files.
Microsoft Official Training Materials for Microsoft Dynamics ® Your use of this content is subject to your current services agreement

Module 3: Adding Code to a Report
3 - 7
Note: If you define two functions that have the same name, one defined in a report and the other in a table that is referenced by the report, you cannot start the function that is defined in the report directly. By default, a call to the function invokes the function that is defined in the table. This behavior occurs when the function is called from a source expression or a trigger.
How a Data Item is Processed
Before the first record is retrieved, the OnPreDataItem trigger is called, and after the last record is processed, the OnPostDataItem trigger is called.
Between these two triggers, the data item records are processed. Processing a record means executing the record triggers and outputting data. After a record is retrieved from the data item, the OnAfterGetRecord (Data Items) trigger is called.
If there is an indented data item, then the records in this data item are processed.
When there are no more records to be processed in a data item, control returns to the point from which processing is initiated. For an indented data item, this means the next record of the data item on the next highest level. If the data item is already on the highest level, then control returns to the report.
Check the Value of Printed Variables
In a RDLC report layout, when a Boolean value appears on a report, the value is printed as "true" or "false" in the target language.
In some cases, you might want to change the printed value of a Boolean variable in a RDLC report layout to "yes" or "no" instead of "true" or "false."
This can be performed in two ways: either you change the SourceExpr property of the text box that displays the Boolean variable to FORMAT(BooleanVariable), or you set the Value property of the text box in the RDLC report layout to an expression such as =IiF(Fields!BooleanVariable.Value = False, "No", "Yes").
The same applies to date values. When you create a RDLC layout for a report, you must modify date values so that they are formatted correctly. You can use a similar procedure for the boolean variables to verify or change the format of a date. You can set the format in the report by using the FORMAT() function, or by using an expression to define the format of the date.
Microsoft Official Training Materials for Microsoft Dynamics ® Your use of this content is subject to your current services agreement

Reporting in Microsoft Dynamics® NAV 2013
3 - 8
Best Practice: In the C/AL code, you can use both the numeric value and the text representation to check the value that is selected for an option variable. A RDLC report layout does not provide the following functionality: strings will be handled as normal strings. It is recommended that you work with the numeric value of the option variables in the RDLC report layouts so that multilanguage functionality will not be an issue.
Demonstration: Using Option Strings in Multilanguage Implementations
In a RDLC report layout, an option variable is handled as a typical string, not an option string. If you have a Multilanguage application, handling the option as a normal string will cause problems in the displayed report. You must manually convert the option string to an integer variable and then use the integer variable in the RDLC report layout.
An example of a report that uses an option variable that is converted to an integer variable is report 12345671, Customer Top 10 List. The request page has an option variable, ShowType. You can use this option variable to select to display either Sales (LCY) or Balance (LCY) in the report. The value of the ShowType variable is assigned to an integer variable, ShowTypeNo, in the OnAfterGetRecord trigger.
Demonstration Steps
1. Assign the option string to an integer variable. a. In the development environment, on the Tools menu, click
Object Designer. b. In Object Designer, click Report, select the report that you want
to modify, and then click Design. c. On the View menu, select C/AL Globals. d. In the C/AL Globals window, on the Variables tab, there’s an
integer variable. You use this variable for the integer value of an existing option variable.
For example, in report 12345671, Customer -Top 10 List 2, you have an option variable on the request page named ShowType. On the report, there’s integer variable called ShowTypeNo.
e. In the C/AL Editor, there’s a line of code in the OnAfterGetRecord trigger of the Customer Data Item to assign the option string to an integer value.
Microsoft Official Training Materials for Microsoft Dynamics ® Your use of this content is subject to your current services agreement

Module 3: Adding Code to a Report
3 - 9
For example, in report 12345671, you have the following line of code.
ShowTypeNo := ShowType;
f. In Report Dataset Designer, add a Column with ShowTypeNo as the value of the Data Source field.
g. On the File menu, select Save. h. In the Save window, select the Compiled check box, and then
click OK. 2. Use the integer variable instead of the option string in the layout.
a. In Object Designer, click Report, select the report that you want to modify, and then click Design.
b. On the View menu, select Layout. c. In Microsoft Visual Studio, in the Report.rdlc file, use the integer
variable instead of the option variable, such as in expressions.
In report 111, the ShowTypeNo integer variable is used in expressions on the bar chart and the pie chart.
Demonstration: Change the Printed Value of a Boolean Field.
In a RDLC report layout, when a Boolean value appears on a report, the value is printed as "True" or "False" in the target language.
In some cases, you might want to change the printed value of a Boolean variable or field in a RDLC report layout. You can change the value to "Yes" or "No" instead of "True" or "False".
Demonstration Steps
1. Change the printed value of a Boolean field.
a. In the development environment, on the Tools menu, click Object Designer.
b. In Object Designer, click Report, select the report for which you want to change the printed values of Boolean variables or fields, and then click the Design button.
c. In Report Dataset Designer, find the column for the Boolean variable or field that you want to change.
d. In the Data Source field, change the <BooleanVariable> to FORMAT(<BooleanVariable>).
Microsoft Official Training Materials for Microsoft Dynamics ® Your use of this content is subject to your current services agreement

Reporting in Microsoft Dynamics® NAV 2013
3 - 10
e. For example, in report 12345671 you could apply this for the field Customer.Blocked.
f. On the File menu, select Save. g. In the Save window, select the Compiled check box, and then
click OK.
Demonstration: Format Decimal Values
When you create RDLC layout for a report, a format variable is created for each decimal variable. The format information from the Column properties in Report Dataset Designer is stored in the format variable. Decimal values are formatted in the RDLC layout by using the format variable. If you create controls that use decimal values in a RDLC report layout, then in Visual Studio Report Designer, you must manually specify to use the format variable for the formatting.
Demonstration Steps
1. Format decimal values.
a. In the development environment, on the Tools menu, click Object Designer.
b. In Object Designer, select Report, select a report that you want to modify, and then click Design.
c. On the View menu, select Layout. d. In Visual Studio, in the report.rdlc file, right-click the text box that
displays a decimal value, and then select Text Box Properties. e. In the Text Box Properties window, select the Number tab.
f. In the Category list, select Custom, and then click the function button (fx) next to the custom format field.
g. In the Expression window, click Fields (DataSet_Result), select the format variable from the list, and then click OK.
h. For example, if the Value field on the General tab is =Fields!Customer__Sales__LCY__.Value, then the expressions for the format on the Number tab should be =Fields!Customer__Sales__LCY__Format.Value.
Microsoft Official Training Materials for Microsoft Dynamics ® Your use of this content is subject to your current services agreement

Module 3: Adding Code to a Report
3 - 11
Demonstration: Format Date Values
You can modify date values in Report Dataset Designer to specify how they are formatted in the layout of a report.
Demonstration Steps
1. Format date values. a. In the development environment, on the Tools menu, click
Object Designer.
b. In Object Designer, click Report, select a report that you want to modify, and then select Design.
c. In Report Dataset Designer, in the Data Source field of a Column that contains a date, use the FORMAT function that has the date. For example, instead of entering TODAY in the Data Source field, enter FORMAT(TODAY,0,4).
d. Use the parameters of the FORMAT function to specify the length and the exact format that you want for the date.
e. On the File menu, click Save. f. In the Save window, select the Compiled check box, and then
click OK.
Working with Report Expressions Expressions are widely used in a report for various purposes. They can be used for data manipulation (retrieve, calculate, format, group, sort and filter data) and formatting.
Expressions are used to provide dynamic flexibility for controlling the content and appearance of a report. In most cases, expressions are used to obtain the following kinds of functionality in your report:
• Aggregations on data to show the sum, average, percentage, or product of a particular rowset.
• Conditional formatting, where text or background formatting changes based on logic that you define.
• Conditional text, where a report title varies, depending on who is running the report.
• Concatenated text from multiple dataset fields and constants.
• Data filtering (after it is retrieved from the data source).
• Data grouping and sorting.
• Dynamic page header and page footer content.
Microsoft Official Training Materials for Microsoft Dynamics ® Your use of this content is subject to your current services agreement

Reporting in Microsoft Dynamics® NAV 2013
3 - 12
On the report design surface, expressions appear as simple or complex expressions.
Simple expressions contain a reference to a single dataset field or built-in field. Simple expressions are created for you automatically (for example, when dragging a field from a dataset onto a text box), or you can type them directly into a data region cell or text box on the design surface.
Complex expressions can contain multiple built-in references, operators, and function calls combined with simple expressions.
An expression is written in Microsoft® Visual Basic®. An expression begins with an equal sign (=) and consists of references to dataset fields, constants, operators, functions, and other built-in report collections.
During report processing, each expression evaluates to a single value that replaces the expression when a report is rendered.
Knowing how to create and use expressions is a fundamental skill that will help you create rich full-featured reports.
How to Create Expressions
You can create expressions in a report definition by using the Expression window, or by typing the expression syntax directly into a text box, a property in the Properties window, or a group, sort and filter expression field.
Using the Expression window has many advantages over manually entering the expressions. Other than a large work area, it offers context-sensitive global collection item choices, statement completion, and syntax checking.
Expressions are created by using Microsoft Visual Basic language syntax.
Microsoft Official Training Materials for Microsoft Dynamics ® Your use of this content is subject to your current services agreement

Module 3: Adding Code to a Report
3 - 13
The Expression Editor
When you open the Expression window, the following dialog box appears.
FIGURE 3.2: THE EXPRESSION WINDOW
The Expression window can be used to add and edit expressions. It is divided into a number of panes.
The top pane, the Expression pane, shows the current expression for the selected text box or property. You can edit the expression in the pane by using the keyboard and by double-clicking items in the bottom panes.
The bottom middle pane, the Item pane, contains all items that are available in the selected category. The contents of the pane are updated when a new category is selected in the Category pane. For example, the Globals category contains items such as ExecutionTime, UserId and Language.
At the right side you can have one large pane, the Field pane, or two smaller panes (the Description and the Example pane). Which panes appear depends on the selected Category. The Field pane contains all elements that are available in the selected Item and Category. The contents of the Field pane are updated when you select a new Item. If the selected Item has no fields, the Field pane will be replaced by the Description and Example panes. The Description pane shows a description of the selected Item. However, the Example pane displays an example of the selected item.
Microsoft Official Training Materials for Microsoft Dynamics ® Your use of this content is subject to your current services agreement

Reporting in Microsoft Dynamics® NAV 2013
3 - 14
For example, when you select the Program Flow category (under Common Functions), the Item category will show the three functions in the category. The Description pane will show a small description of the selected Item, and the Example pane shows the syntax of the selected function.
When you build an expression, you can double-click any element in the bottom panes to have it inserted automatically in the Expression pane. As the Expression pane suggests, you can build additional expressions by using Microsoft Visual Basic language syntax.
The Expression pane supports features such as IntelliSense, statement completion, colored syntax and syntax checking so that you can easily detect syntax errors. You can move and resize the Expression Editor to have a larger work surface.
In some windows (for example, on the Sorting tab in the Table Properties window) you can create multiple expressions that will be combined during report processing. However, you can use the Expression window to edit only one expression at a time.
Accessing the Expressions Window
The Expression editor can be accessed in various ways, depending on the current position in the Visual Studio Report Designer. You can open the Expression Editor for the following items:
• Text box on a report
• Property in the Properties page
• Groups tab on data region properties
• Sorting tab on data region properties
• Filter tab for datasets, data regions, or data region groupings
• Document map label on a data region group
• Parent group on a data region group
Microsoft Official Training Materials for Microsoft Dynamics ® Your use of this content is subject to your current services agreement

Module 3: Adding Code to a Report
3 - 15
On the design surface, you can right-click any text box control and select Expression, as is shown in the Expression Shortcut In Text Box figure.
FIGURE 3.3: EXPRESSION SHORTCUT IN TEXT BOX WINDOW
Several properties in the Properties window, such as Visibility, BackgroundColor and Value, support both fixed options and expressions as a first option in the drop-down list. Select <Expression> in the drop-down list to enter an expression in the Value column for a property.
Microsoft Official Training Materials for Microsoft Dynamics ® Your use of this content is subject to your current services agreement

Reporting in Microsoft Dynamics® NAV 2013
3 - 16
FIGURE 3.4: EXPRESSION SHORTCUT IN BACKGROUNDCOLOR PROPERTY WINDOW
Expressions can also be entered in various dialog boxes such as the Grouping and Sorting Properties and the Tablix Properties window. In these windows, expressions can be either selected directly from a drop-down list, or they can be entered by clicking the fx button to set specific properties. For example, in the Table Properties window, on the General tab, the fx button is available to define Tooltips.
Valid Expression References
The following table shows the types of references that you can include in a report expression.
The table indicates which of these references are built-in, and which references, you must identify to the report processor so that the function calls can be resolved during report processing.
Items Description of functions and how to reference them Reporting Functions
Built-in. Functions that provide aggregate values on report items, and other utility functions that support aggregation. The Aggregate implementation is supplied by each data provider.
Microsoft Official Training Materials for Microsoft Dynamics ® Your use of this content is subject to your current services agreement

Module 3: Adding Code to a Report
3 - 17
Items Description of functions and how to reference them Reporting Collections
Built-in.
• Globals
• User
• Fields
• ReportItems
• Datasets
• Parameters
Custom Code Built-in. Add your Visual Basic code through the Report Properties menu, Code tab. You can define public constants, variables, subroutines, and functions for your use in each report definition.
Visual Basic Run-time Library
Built-in.
System.Math Built-in.
System.Convert Built-in.
.NET Framework (common language runtime) Classes
Add fully qualified references in your expression. For example, System.Text.StringBuilder
In addition to the use of the built-in functions, to add more functions, you can add code or external references to your report. To add custom code to your report, select Report, and then select Report Properties in Visual Studio Report Designer. On the Code tab, you can add the custom code (variables, functions, procedures, and so on) to enrich your report.
Microsoft Official Training Materials for Microsoft Dynamics ® Your use of this content is subject to your current services agreement

Reporting in Microsoft Dynamics® NAV 2013
3 - 18
When you open Visual Studio Report Designer to create a report, several functions are automatically added to the Code tab.
FIGURE 3.5: THE CODE TAB OF THE REPORT PROPERTIES WINDOW
The functions that are added all relate to the presentation and formatting of data. Although you can add any code to the report by using the Code tab, it is recommended that you do not include code that is part of the report's business logic.
Expression always start with the "=" sign. This indicates that the statement following the equal sign is an expression that will be evaluated by the reporting engine. Most expressions consist of a single constant value. For example, the FontName property of a text box can have several constant values, such as Arial, Tahoma, Verdana, and so on. The Width property is less restrictive: the values are not predefined.
You can also use a combination of functions, variables and constants to build a more complex expression.
To refer to a collection or element from an expression, use the standard Visual Basic syntax. For example, to refer to the value of a specific field (in the Fields collection), use the =Fields("FieldName").Value expression. An alternative way to reference the same value is to use =Fields!FieldName.Value. In this case the (parent) collection and the (child) element are concatenated by an exclamation mark. An element and its properties are always separated by a "." (period).
Microsoft Official Training Materials for Microsoft Dynamics ® Your use of this content is subject to your current services agreement

Module 3: Adding Code to a Report
3 - 19
Syntax errors are detected and indicated automatically. However, syntax errors do not prevent you from importing the RDLC data into Microsoft Dynamics NAV. When you try to save and compile the report in the Object Designer, some errors in the RDLC report layout might be indicated. For example, if an incorrect syntax for the IIF() statement is used, or if the Value property of a text box in the Page Header section is set to a data field from the dataset, you will receive an error message. Other errors might appear when the report is run.
When you use Visual Studio Report Designer, you can also check for errors. In the Build Menu, select Build Solution. The report is parsed for syntax errors and if any are found a message is displayed at the bottom of the window in the Error List. The Error List in Visual Studio Report Designer figure shows an example.
FIGURE 3.6: ERROR LIST IN VISUAL STUDIO REPORT DESIGNER SCREEN SHOT
In the Error List in Visual Studio Report Designer figure, the error indicates a typing error in the Value expression for the field Name_Customer:
Code example
=Fields!Name_Cstomer.Value
Should be
=Fields!Name_Customer.Value
Note: Other than the items in the previous table, you can also add custom assemblies and classes to reports. However, only trusted managed assemblies are supported. More information about how to create trusted managed assemblies can be found on: http://msdn.microsoft.com
Microsoft Official Training Materials for Microsoft Dynamics ® Your use of this content is subject to your current services agreement

Reporting in Microsoft Dynamics® NAV 2013
3 - 20
Understanding and Using Simple and Complex Expressions
The previous lesson described how expressions are widely used in reports for various purposes.
Knowing how to create and use expressions is a fundamental skill that will help you create rich full-featured reports.
This lesson will describe the different data collections that can be used in expressions.
Understanding Display Text for Expressions
Simple expressions use symbols to indicate whether the reference is to a field, a parameter, a built-in collection, or the ReportItems collection. The following table shows examples of display and expression text.
Item Display text example Expression text example
Dataset fields [Sales] [SUM(Sales)]
[FIRST(Store)]
=Fields!Sales.Value =Sum(Fields!Sales.Value)
=First(Fields!Store.Value)
Report parameters [@Param] [@Param.Label]
=Parameters!Param.Value =Parameters!Param.Label
Built-in fields [&ReportName] =Globals!ReportName.Value
Literal characters that are used for display text
\[Sales\] [Sales]
Complex expressions
<<Expr>> ="Page " & Globals!PageNumber & " of " & Globals!TotalPages
Using Constant Collections in Expressions
A constant consists of literal text or text that is predefined. The report processor has access to the predefined constants so that when you include them in an expression, the values they represent are substituted in the expression before it is evaluated.
Microsoft Official Training Materials for Microsoft Dynamics ® Your use of this content is subject to your current services agreement

Module 3: Adding Code to a Report
3 - 21
The Constants collection is mostly used in simple expressions. Simple expressions are frequently used to set properties throughout the report.
The content of the Constant category depends on the selected property. When you select the Color property of a text box, it contains the possible colors. When you select the Hidden property (in the Visibility property collection), the category contains two constants: True and False.
Literal Text
In an expression, literal text is text that is in double quotation marks. You can also type text directly into a text box without double quotation marks if it is not part of an expression. If the text box value does not begin with an equal sign (=), the text is treated as literal text. The following table shows several examples of literal text in an expression.
Constant Display text Expression text
Report run at: <<Expr>> ="Report run at: " & Globals!ExecutionTime
CRONUS International Ltd.
CRONUS International Ltd.
CRONUS International Ltd.
[Bracketed display text]
\[Bracketed display text\]
[Bracketed display text]
RDL Constants
You can use constants defined in Report Definition Language (RDL) in an expression. In the Expression dialog box, constants appear when you create an expression for a report property that only accepts certain valid values, also known as enumerated types.
The following table shows two examples.
Property Description Values
TextDecoration Specifies special text formatting such as underlining.
Default, None, Underline, Overline, LineThrough
FontStyle Specifies the style of the font.
Default, Normal, Italic
Microsoft Official Training Materials for Microsoft Dynamics ® Your use of this content is subject to your current services agreement

Reporting in Microsoft Dynamics® NAV 2013
3 - 22
Visual Basic Constants
You can use constants defined in the Visual Basic run-time library in an expression.
The following table shows two examples.
Constant Description
vbCrLf The Visual Basic constant for a carriage return followed a new line. For example, the following expression shows the time stamp for report processing and the user on two lines in a single text box:
=Globals!ExecutionTime & vbCrLf & User!UserID
DateInterval.Day The Visual Basic constant that you use to designate the day part of a date time value in a DatePart function call. For example, for the date January 10, 2008, the following function returns the number 10:
=DatePart("d",Globals!ExecutionTime)
CLR Constants
You can use constants defined in the .NET Framework common language run-time (CLR) classes in an expression. The following table shows an example of a system-defined color.
Constant Description
MistyRose When you create an expression for a report property that is based on background color, you can specify a color by name. Valid names are listed in the Expression dialog box.
Microsoft Official Training Materials for Microsoft Dynamics ® Your use of this content is subject to your current services agreement

Module 3: Adding Code to a Report
3 - 23
Demonstration: Using a Constant in the Report Header
Mort is creating a new report. He adds a Page Header to the report and will now add a text box that contains the execution time and user ID. To show both values in one text box he uses the constant VBCRLF.
Demonstration Steps
1. In the newly added text box, add an expression to show the execution time and user ID:
a. Right-click the text box and select: Expression. b. The Expression Designer window opens. c. Type the following expression:
=Globals!ExecutionTime & vbCrLf & User!UserID
The Expression With A Constant figure shows the expression.
FIGURE 3.7: EXPRESSION WITH A CONSTANT WINDOW
Using Global Collections in Expressions
The following global collections can be referenced from expressions:
• Constants
• DataSets
• DataSources
• Fields
Microsoft Official Training Materials for Microsoft Dynamics ® Your use of this content is subject to your current services agreement

Reporting in Microsoft Dynamics® NAV 2013
3 - 24
• Globals
• Parameters
• ReportItems
• User
The following table describes each global collection and explains when you can reference the collection from an expression.
Global Collection Description Fields Represents the collection of fields of the dataset
that are available to the report. Available after data is retrieved from Microsoft Dynamics NAV into the dataset.
ReportItems Represents the collection of text boxes for the report item, such as the text boxes that are contained in a table data region, page header, or page footer. Available during report processing.
User Represents a collection of data about the user running the report, such as the language setting or the user ID. Always available. User!UserID is frequently used to filter results in reports. User!Language is used to make specific settings dependent on the language of the user.
DataSets Represents the collection of datasets referenced from the body of a report definition. Does not include data sources used only in page headers or page footers.
Globals Represents global variables useful for reports, such as the report name or page number. Always available.
Parameters Represents the collection of report parameters when you use Labels or use the IncludeCaption property.
More detailed information about some frequently used functions is described in the next lesson.
Microsoft Official Training Materials for Microsoft Dynamics ® Your use of this content is subject to your current services agreement

Module 3: Adding Code to a Report
3 - 25
Using Report Functions in Expressions
Report Viewer provides a set of built-in functions that you can include in an expression. Built-in functions include the Microsoft .NET Framework common language runtime (CLR) classes and Visual Basic run-time library functions. For convenience, you can view the most frequently used functions in the Expression dialog box, where they are listed by category: Text, Date and Time, Math, Inspection, Program Flow, Aggregate, Financial, Conversion, and Miscellaneous. Those less typically used functions do not appear in the list but can still be used in an expression.
You can use built-in functions within expressions to manipulate the data within report items, properties, and other areas in the report. Built-in functions are used to aggregate data in datasets, data regions, and groups, and return other data.
You can use aggregate functions in expressions for any report item. All data that is used for an aggregate calculation must be the same data type. To convert data that has multiple numeric data types to the same data type, use conversion functions such as the following: CInt(), CDbl() or CDec().
The following table describes the aggregate functions that are supported by Reporting Services.
Function Description Aggregate Returns a custom aggregate of the specified
expression, as defined by the data provider.
Avg Returns the average of all non-null values from the specified expression.
Count Returns a count of the non-null values from the specified expression.
CountDistinct Returns a count of all non-null distinct values from the specified expression.
CountRows Returns a count of rows within the specified scope.
First Returns the first value from the specified expression.
Last Returns the last value from the specified expression.
Max Returns the maximum value from all non-null values of the specified expression.
Min Returns the minimum value from all non-null values of the specified expression.
RowNumber Returns a running count of all rows in the specified scope.
Microsoft Official Training Materials for Microsoft Dynamics ® Your use of this content is subject to your current services agreement

Reporting in Microsoft Dynamics® NAV 2013
3 - 26
Function Description RunningValue Uses a specified function to return a running
aggregate of the specified expression.
StDev Returns the standard deviation of all non-null values of the specified expression.
StDevP Returns the population standard deviation of all non-null values of the specified expression.
Sum Returns a sum of the values of the specified expression.
Var Returns the variance of all non-null values of the specified expression.
VarP Returns the population variance of all non-null values of the specified expression.
Reporting Services provides the following additional aggregate functions that you can use within expressions.
Function Description InScope Indicates whether the current instance of an item is
within the specified scope.
Level Returns the current level of depth in a recursive hierarchy.
Previous Returns the previous instance from the specified scope.
Each aggregate function uses the Scope parameter. This defines the scope in which the aggregate function is performed.
A valid scope is the name of a grouping, dataset, or data region. Only groupings or data regions that directly or indirectly contain the expression can be used as a scope. For expressions within data regions, Scope is optional for all aggregate functions. If you are omitting the Scope parameter, the scope of the aggregate is the innermost data region or grouping to which the report item belongs. Information related to Scope includes the following:
• Specifying a scope of Nothing sets the scope to the outermost data region to which the report item belongs.
• For expressions outside data regions, Scope refers to a data table or business object.
• If a report contains more than one dataset, Scope is required.
• If a report contains only one dataset and Scope is omitted, the scope is set to the dataset.
Microsoft Official Training Materials for Microsoft Dynamics ® Your use of this content is subject to your current services agreement

Module 3: Adding Code to a Report
3 - 27
• The Nothing keyword cannot be specified for report items outside a data region.
• The Scope parameter cannot be used in page headers or footers.
Demonstration: Using a Report Function in an Expression
The management of Cronus International Ltd. asked Mort to add row numbers to the report 123456711 Resource List2. Mort knows this can be easily performed by using the RowNumber function. He will implement this in the existing report.
Demonstration Steps
1. Add a row number to report 123456711 Resource – List2:
a. Select Tools, Object Designer to open the Object Designer. b. Select File, Import. c. Browse to the report R123456711.fob. d. Click OK to start the import.
e. In the dialog box, choose to open the Import Worksheet window. f. In the Action column, verify that the action is set to Create. g. Click Open to import the object in the database. h. In the Object Designer, select report 123456711 Resource – List2
and then click Design. i. In the Report Dataset Designer click View, and then select Layout. j. In Visual Studio Report Designer, right-click the column header of
the first row in the table. k. Select Insert Column, Left. l. In the newly added column, in the text box on the detail row
enter the following expression:
=RowNumber(Nothing)
Microsoft Official Training Materials for Microsoft Dynamics ® Your use of this content is subject to your current services agreement

Reporting in Microsoft Dynamics® NAV 2013
3 - 28
m. Save and close Visual Studio and then save and close the Report Dataset Designer.
n. Run the report. The result will resemble this:
FIGURE 3.8: REPORT WITH ROWNUMBER WINDOW
Understanding scope
The term scope can specify different concepts, depending on the context. The following list describes the different concepts.
Scope for report items in report processing
When the report data and the report layout are combined at run time, each report item is processed. A Tablix data region is processed from the outside into more restrictive sets of data as the Tablix row groups and column groups are processed. So, a group is contained by a data region. A child group and its siblings are contained by its parent group. For example, a toggle item for a group must be a text box in the same group scope or in any that contains a group scope.
Scope for aggregate functions
The report processor evaluates each aggregate expression in a named scope or the default scope, as is described here.
A named scope can be the name of a dataset, a data region, or a group.
Microsoft Official Training Materials for Microsoft Dynamics ® Your use of this content is subject to your current services agreement

Module 3: Adding Code to a Report
3 - 29
The default scope depends on the report item property that the report processor is evaluating. For example, the default scope for a Tablix cell in a data region with row and column groups is the innermost row group and column group to which the cell belongs. The default scope for a cell in a table without groups is the details group. On the design surface, a Tablix data region provides visual elements that you can use to help determine a cell's available scopes. Group bars appear before and next to the Tablix data region to show which rows or columns belong to a group. When a cell is selected, group indicators show the active, innermost groups to which the cell belongs.
For a text box on the design surface, there is no default scope. You must specify the name of the dataset to use, for example, =First(Fields!Sales.Value,"Dataset1").
When you call a built-in function and specify a named scope, check the function reference to determine which scopes are valid. For example, for Sum, you can specify the default scope or a containing scope.
The following scopes list the containing order from outermost (greater) to innermost (reduced) and describe the data that they represent:
Report dataset
Specifies the report dataset linked to the data region or to a report item in the report body. The data that is used for aggregation is from the report dataset after dataset filter expressions are applied.
Data region
Specifies data from the data region after data region filter and sort expressions are applied. Group filters are not used when calculating aggregates for data regions.
Row and column groups
Specifies the data after the group expressions and group filters are applied for the parent group and child groups. For the purposes of identifying scope containment, every parent group contains its child groups.
Nested data regions
Specifies the data for the nested data region in the context of the cell to which it is added, and after the nested data region filter and sort expressions are applied.
Microsoft Official Training Materials for Microsoft Dynamics ® Your use of this content is subject to your current services agreement

Reporting in Microsoft Dynamics® NAV 2013
3 - 30
Row and column groups for the nested data regions
Specifies the data after the nested data region's group expressions and group filters are applied.
When a built-in function states that you must specify the current scope or a containing scope, you cannot specify a scope that is lower or at the same level in a containment order than the current scope. For example, from a row in a row group that has a child group, you cannot specify the name of the child group as a scope, nor can you specify a sibling row group. You must use the default scope or specify a scope that is higher in the containment order.
Expression Examples Expressions are frequently used in reports. These include expressions to change the appearance of data in a report, change properties of report items, and affect how data is retrieved (filtering and sorting expressions).
Many expressions in a report contain functions. You can format data, apply logic, and access report metadata by using these functions:
• String functions
• Date and Time functions
• Conversion functions
• Decision functions
• Report functions
This lesson describes some expressions that can be used for common tasks in a report.
String Functions
String functions can be used to manipulate string values in a report. You can use several functions to do the following tasks:
• Concatenate fields and constants by using concatenation operators and Visual Basic constants.
• Format dates and numbers.
• Return substrings.
• Change the format of strings.
Combine more than one field by using concatenation operators and Visual Basic constants. The following expression returns two fields, each on a separate line in the same text box:
Microsoft Official Training Materials for Microsoft Dynamics ® Your use of this content is subject to your current services agreement

Module 3: Adding Code to a Report
3 - 31
Concatenation
=Fields!FirstName.Value & vbCrLf & Fields!LastName.Value
Format dates and numbers in a string with the Format function. The following expression displays values of the StartDate and EndDate fields in long date format:
Format dates and numbers
=Format(Fields!StartDate.Value, "D") & " through " & Format(Fields!EndDate.Value, "D")
If the text box contains only a date or number, you should use the Format property of the text box to apply formatting instead of the Format function within the text box.
Return Substrings
The Right(), Len(), and InStr() functions are useful for returning a substring, for example, trimming DOMAIN\username to just the user name. The following expression returns the part of the string to the right of a backslash (\) character from a report global named User:
Returning a substring
=Right(Globals!User.Value, Len(Globals!User.Value) - InStr(Globals!User.Value, "\"))
Change the Format of Strings
The Regex functions from the .NET Framework System.Text.RegularExpressions are useful for changing the format of existing strings, for example, formatting a telephone number. The following expression uses the Replace function to change the format of a ten-digit telephone number in a field from "nnn-nnn-nnnn" to "(nnn) nnn-nnnn":
Regular expression
=System.Text.RegularExpressions.Regex.Replace(Fields!Phone.Value, "(\d{3})[ -.]*(\d{3})[ -.]*(\d{4})", "($1) $2-$3")
Microsoft Official Training Materials for Microsoft Dynamics ® Your use of this content is subject to your current services agreement

Reporting in Microsoft Dynamics® NAV 2013
3 - 32
Date and Time Functions
Date functions are used to analyze and format a date in a report. To format a date, you can either select a predefined format or define a custom format by using several date and time functions, such as the following:
• DatePart
• Year
• Month
• MonthName
• Day
• Weekday
• WeekdayName
• Hour
• Minute
• Second
You can also perform date calculations (by using functions such as DateDiff() and DateAdd()) and converting a string to a date by using CDate().
Now() returns a Date value containing the current date and time according to your system.
Examples
The Today function provides the current date. This expression is used in a text box to display the date on the report, or in a parameter to filter data based on the current date.
Code Example
=Year(Fields!OrderDate.Value)
The DateAdd() function is useful for supplying a range of dates based on a single parameter. The following expression provides a date that is six months after the date from a field named StartDate.
Code example
=DateAdd(DateInterval.Month, 6, Fields!StartDate.Value)
The Year() function displays the year for a particular date. You can use this to group dates together or to display the year as a label for a set of dates. This expression provides the year for a given group of sales order dates. The Month() function and other functions are also used to manipulate dates.
Microsoft Official Training Materials for Microsoft Dynamics ® Your use of this content is subject to your current services agreement

Module 3: Adding Code to a Report
3 - 33
Code example
=Year(Fields!OrderDate.Value)
Conversion Functions
You can use Visual Basic functions to convert a field from one data type to a different data type. Conversion functions are used to convert the default data type for a field to the data type needed for calculations or to combine text. Examples are CInt, CStr, CDate, CDec, CDbl, CBool, CLng, CSng, CShort.
The following expression converts the constant 500 to type Decimal:
Code Example
=CDec(500)
Program Flow Functions
You can use decision functions to evaluate a logical or relational condition and return a specific value that is based on the result of the evaluation.
The IIF() function returns one of two values, depending on whether the expression is true or not. The following expression uses the IIF() function to return a Boolean value of True if the value of LineTotal exceeds 100. Otherwise it returns False:
Code Example
=IIF(IsNothing(Fields!LargePhoto.Value),True,False)
You can use multiple IIF() functions (also known as "nested IIFs") to return one of three values, depending on the value of PercentCompleted. The following expression can be positioned in the fill color of a text box to change the background color, depending on the value in the text box.
Code example
=IIF(Fields!PctComplete.Value >= 10, "Green", IIF(Fields!PctComplete.Value >= 1, "Blue", "Red"))
Values that are greater than or equal to 10 are displayed with a green background, values between one and nine are displayed with a blue background, and a value that is less than one is displayed with a red background.
A different way to obtain the same functionality is to use the Switch() function. The Switch() function is useful when you have three or more conditions to test.
Microsoft Official Training Materials for Microsoft Dynamics ® Your use of this content is subject to your current services agreement

Reporting in Microsoft Dynamics® NAV 2013
3 - 34
The Switch() function returns the value associated with the first expression in a series that evaluates to true:
Code example
=Switch(Fields!PctComplete.Value >= 10, "Green", Fields!PctComplete.Value >= 1, "Blue", Fields!PctComplete.Value = 1, "Yellow", Fields!PctComplete.Value <= 0, "Red",)
Values greater than or equal to 10 are displayed with a green background, values between one and nine are displayed with a blue background, a value equal to one is displayed with a yellow background, and a value that is zero or less is displayed with a red background.
The following line of code tests the value of the ImportantDate field and returns "Red" if it is more than a week old, and "Blue" otherwise. This expression can be used to control the Color property of a text box in a report item:
Code example
=IIF(DateDiff("d",Fields!ImportantDate.Value, Now())>7,"Red","Blue")
Test the Null Value
In the following example, you will test the value of the PhoneNumber field. If the field is null (Nothing in Visual Basic), "No Value" is returned; otherwise the phone number value is returned. This expression can be used to control the value of a text box in a report item.
Code example
=IIF(Fields!PhoneNumber.Value Is Nothing,"No Value",Fields!PhoneNumber.Value)
The following expression can be used to control the Hidden property of an image report item. In the following example, the image specified by the field [LargePhoto] is displayed only if the text value of the field is not null.
Code example
=IIF(IsNothing(Fields!LargePhoto.Value),True,False)
Microsoft Official Training Materials for Microsoft Dynamics ® Your use of this content is subject to your current services agreement

Module 3: Adding Code to a Report
3 - 35
Report Functions
Reporting functions are built-in functions for use in expressions to calculate aggregate data in datasets, data regions, and groups. Additionally, reporting functions are used to retrieve other data values, such as the first or last value on a report page. Two of the most important functions are the Sum() and the RowNumber() function.
Sum()
The Sum() function can total the values in a group or data region. This function can be useful in the header or footer of a group. The following expression displays the sum of data in the Order group or data region:
Code Example
=IIF(RowNumber("table1") Mod 2 = 0, "LimeGreen", "Transparent")
You can also use the Sum() function for conditional aggregate calculations. For example, if a dataset has a field that is named State with possible values Not Started, Started and Finished, the following expression, when it is positioned in a group header, calculates the aggregate sum for only the value Finished.
RowNumber()
When the RowNumber() function is used in a text box in a data region, it displays the row number for each instance of the text box in which the expression appears. This function can be useful to number rows in a table. It can also be useful for more complex tasks, such as providing page breaks based on number of rows.
The scope that you specify for RowNumber() controls when renumbering begins. The Nothing keyword indicates that the function starts the count at the first row in the outermost data region. To start the count within nested data regions, use the name of the data region. To start the count in a group, use the name of the group.
Code example
=RowNumber(Nothing)
The following line of code is used to evaluate whether the record in a data region control named table1 is located on an odd or even row number.
Microsoft Official Training Materials for Microsoft Dynamics ® Your use of this content is subject to your current services agreement

Reporting in Microsoft Dynamics® NAV 2013
3 - 36
Code example
=Iif(RowNumber("table1") Mod 2, "PaleGreen", "White")
It can be used to work with alternating background colors.
Appearance of Report Data
You can use expressions to manipulate how data appears on a report. For example, you can display the values of two fields in a single text box, display information about the report, or affect how page breaks are inserted in the report.
Page Headers and Footers
When you design a report, you might want to display the name of the report and page number in the report footer.
The following expression provides the name of the report and the time that it is run. It can be positioned in a text box in the report footer or in the body of the report. The time is formatted with the .NET Framework formatting string for short date:
Code Example
=Globals.ReportName & ", dated " & Format(Globals.ExecutionTime, "d")
The following expression, positioned in a text box in the footer of a report, provides the page number and total pages in the report:
Code example
=Globals.PageNumber & " of " & Globals.TotalPages
Page Breaks
In some reports, you might want to position a page break at the end of a specified number of rows instead of, or in addition to, on groups or report items. To do this, create a group that contains the groups or detail records that you want, add a page break to the group, and then add a group expression to group by a specified number of rows.
The following expression uses the Ceiling() function. When it is positioned in the group expression, it assigns a number to each set of 25 rows. When a page break is defined for the group, this expression results in a page break every 25 rows.
Microsoft Official Training Materials for Microsoft Dynamics ® Your use of this content is subject to your current services agreement

Module 3: Adding Code to a Report
3 - 37
Code example
=CInt(Ceiling(RowNumber(Nothing)/25))
For the user to be able to set a value for the number of rows for each page, create a variable RowsPerPage (the number can be added as a variable to the request options page) and then base the group expression on the variable, as is shown in the following expression:
Code example
=CInt(Ceiling(RowNumber(Nothing)/Fields!RowsPerPage.Value))
On the Group Header, remember to check the Page Break at End option.
A similar technique is also used in the Sales Invoice report, to have multiple copies of the report printed. This is explained in the next lesson.
Properties
Expressions are not only used to display data in text boxes. They can also be used to change how properties are applied to report items. You can change style information for a report item, change its visibility, or use dynamic URLs.
• Formatting
• Visibility
• URLs
Formatting
The following expression, when it is used in the Color property of a text box, changes the color of the text, depending on the value of another field, in this case the Profit field:
Code Example
=Iif(Fields!Profit.Value < 0, "Red", "Black")
To refer to the value of the current field, use the Fields!FieldName syntax, or use the Visual Basic object Variable Me.
The following expression, when it is used in the BackgroundColor property of a report item in a data region, alternates the background color of each row between pale green and white:
Microsoft Official Training Materials for Microsoft Dynamics ® Your use of this content is subject to your current services agreement

Reporting in Microsoft Dynamics® NAV 2013
3 - 38
Code example
=Iif(RowNumber(Nothing) Mod 2, "PaleGreen", "White")
If you use an expression for a specified scope (for example the table called Employees in the report), it might be necessary to indicate the dataset for the aggregate function. Therefore, replace the Nothing value by the name of the data region control that corresponds to the scope.
Visibility
You can show and hide items in a report by using the visibility properties for the report item. In a data region such as a table, when you work with the items for the first time, you can hide detail rows based on the value in an expression.
The following expression, when it is used the first time for visibility of detail rows in a group, it shows the detail rows for all sales exceeding 90 percent in the PctQuota field:
Code example
=Iif(Fields!PctQuota.Value>.9, False, True)
The following expression, when set in the Hidden property of a table, shows the table only if it has more than 12 rows:
Code example
=IIF(CountRows()>12,true,false)
URLs
You can customize URLs (Uniform Resource Locator) by using report data and also conditionally control whether URLs are added as an action for a text box.
The following expression, when it is used as an action on a text box, generates a customized URL that specifies the dataset field EmployeeID as a URL parameter.
Code example
="http://adventure-works/MyInfo?ID=" & Fields!EmployeeID.Value
The following expression conditionally controls whether to add a URL in a text box. This expression depends on a variable named IncludeURLs that lets a user decide whether to include active URLs in a report. This expression is set as a Hyperlink action (select Properties, and then select the Navigation tab) on a text box.
Microsoft Official Training Materials for Microsoft Dynamics ® Your use of this content is subject to your current services agreement

Module 3: Adding Code to a Report
3 - 39
Code example
=IIF(Parameters!IncludeURLs.Value,"http://adventure-works.com/productcatalog",Nothing)
Custom Code
You can use custom code in a report. Custom code is either embedded in a report or stored in a custom assembly which is used in the report.
To add code to a report in Visual Studio Report Designer, select Report, and then select Report Properties. On the Code tab, you can create your own custom code (functions and variables) to enrich the report functionalities.
It is recommended not to add custom code that executes business logic; instead, use it to add presentation related code.
As an example, one of the most common calculations in reports is division. When you divide numeric variables, you have to be careful with NULL and 0 (zero) values because, when you divide a variable by NULL or by 0, it results in a runtime error and or, NaN being returned in the reports. (NaN means Not a Number; it is a value or symbol that is generated as the result of an operation on invalid input terms, especially in floating-point calculations. A typical example is calculating the square root of a negative number.
To avoid this, you can create a function that checks the terms and returns the numeric result or, if there is an accidental error, a user-friendly value.
The sample division function can resemble this:
Code Example
Public Shared Function Divide(Num1 as double, Num2 as double) AS object
IF ISNOTHING(Num2) Or Num2 = 0 Then
Divide ="n/a"
ELSEIF Num1 = 0 THEN
Divide = 0
ELSE
Divide = Num1 / Num2
END IF
End Function
Microsoft Official Training Materials for Microsoft Dynamics ® Your use of this content is subject to your current services agreement

Reporting in Microsoft Dynamics® NAV 2013
3 - 40
You can then call this function from an expression such as this:
=Code.Divide(1, 0)
Instead of calling the Code.Divide function, use an expression with an IIf() statement in each text box where you want to calculate the division. Adding custom code increases the maintainability of your report code.
A similar example calls an embedded method called FixSpelling(). This substitutes "Bicycle" for all occurrences of the text "Bike" in the SubCategory field. The example assumes that the following function is embedded on the report's Code tab.
Code example
Public Function FixSpelling(ByVal s As String) As String
Dim strBuilder As New System.Text.StringBuilder(s)
If s.Contains("Bike") Then
strBuilder.Replace("Bike", "Bicycle")
Return strBuilder.ToString()
Else :
Return s
End If
End Function
To have the values replaced at run time for each record in the report, set the Value property of the SubCategory field to:
=Code.FixSpelling(Fields!SubCategory.Value)
The following example calls an embedded code method called ToUSD(). This converts the StandardCost field value to a dollar value.
Microsoft Official Training Materials for Microsoft Dynamics ® Your use of this content is subject to your current services agreement

Module 3: Adding Code to a Report
3 - 41
Code example
=Code.ToUSD(Fields!StandardCost.Value)
Custom Variables
The following example shows how to define some custom constants and variables.
Code example
Public Const MyNote ="Authored by John Doe"
Public Const NCopies As Int32 = 2
Public Dim MyVersion As String ="123.456"
Public Dim MyDoubleVersion As Double = 123.456
Although custom constants and variables do not appear in the Expression Editor Constants view (which only displays built-in constants), you can add references to them from any expression, as is shown in the following examples. These are treated as Variants.
Code example
=Code.MyNote
=Code.NCopies
=Code.MyVersion
=Code.MyDoubleVersion
When you create a new report in Microsoft Dynamics NAV 2013, some custom functions are made available in the Code tab of the report properties. The following section will highlight those functions.
BlankZero transforms a 0 (zero) value into a blank. Use this function when it is required not to show 0 (zero) values.
Microsoft Official Training Materials for Microsoft Dynamics ® Your use of this content is subject to your current services agreement

Reporting in Microsoft Dynamics® NAV 2013
3 - 42
Code example
Public Function BlankZero(ByVal Value As Decimal)
if Value = 0 then
Return ""
end if
Return Value
End Function
The BlankPos function will only return negative or zero values. When a positive number (or decimal) is passed into this function, it will not return a value. Use this function if it is required only to show negative or zero values.
Code Example
Public Function BlankPos(ByVal Value As Decimal)
if Value > 0 then
Return ""
end if
Return Value
End Function
The BlankZeroAndPos function will only return negative values. When a positive number (or decimal) is passed into this function, it will not return a value. Use this function if it is required only to show negative values.
Code example
Public Function BlankZeroAndPos(ByVal Value As Decimal)
if Value >= 0 then
Return ""
end if
Return Value
End Function
Microsoft Official Training Materials for Microsoft Dynamics ® Your use of this content is subject to your current services agreement

Module 3: Adding Code to a Report
3 - 43
The BlankNeg function will only return positive or zero values. When a negative number (or decimal) is passed into this function, it will not return a value. Use this function if it is required only to show positive or zero values.
Code example
Public Function BlankNeg(ByVal Value As Decimal)
if Value < 0 then
Return ""
end if
Return Value
End Function
The BlankNegAndZero function will only return positive values. When a negative number (or decimal) is passed into this function, it will not return a value. Use this function if it is required only to show positive values.
Code Example
Public Function BlankNegAndZero(ByVal Value As Decimal)
if Value <= 0 then
Return ""
end if
Return Value
End Function
Microsoft Official Training Materials for Microsoft Dynamics ® Your use of this content is subject to your current services agreement

Reporting in Microsoft Dynamics® NAV 2013
3 - 44
Demonstration: Specify a Rounding Precision
In Visual Studio Report Designer, you can use the ROUND function to round a double-precision floating-point value to the nearest integer. However, this function does not have options for changing the precision to which you want to round. For example, you cannot round to the nearest tenth or nearest hundredth of a number, only to the nearest integer. To specify precision when you use the ROUND function, you must multiply the number by a factor of 10, call the ROUND function, and then divide the rounded number by the same factor of 10. The factor that you select depends on the degree of precision that you want. For example, if you want to round the number 12.3456 to the nearest hundredth, you would multiply 12.3456 by 100 to receive 1234.56. Next, call the ROUND function on 1234.56. The ROUND function rounds to the nearest integer. This results in the number 1235. Finally, divide the rounded number, 1235, by the factor, 100, to receive 12.35. This result is the same as rounding the original number, 12.3456, to the nearest hundredth.
Demonstration Steps
1. Use an expression to specify rounding precision. a. In the development environment, on the Tools menu, click
Object Designer. b. In Object Designer, click Report, select a report that contains a
number that you want to round with precision greater than the nearest integer, for example report 123456771 Customer Top 10 List2 and then click Design.
c. In the View menu, select Layout. d. In Visual Studio, in the Report.rdlc file, right-click the text box
that has the number that you want to round, for example textbox SalesLCY_Customer (second row, fifth column) and then click Expression.
e. In the Expression window, change the expression to the following.
=ROUND(Fields!SalesLCY_Customer.Value*10)/10
f. In this example, Fields!SalesLCY_Customer.Value is the numeric value that you want to round. Factor is a factor of 10, and it depends on the degree of precision that you want.
g. Select the OK button to close the Expression window. h. Save and compile the report.
Microsoft Official Training Materials for Microsoft Dynamics ® Your use of this content is subject to your current services agreement

Module 3: Adding Code to a Report
3 - 45
2. Add code to specify rounding precision. a. In the development environment, on the Tools menu, click
Object Designer. b. In Object Designer, click Report, and then select a report that
contains a number that you want to round with precision greater than the nearest integer, and then select Design.
c. On the View menu, click Layout. d. In Visual Studio, in the Report.rdlc file, on the Report menu,
select Report Properties. e. In the Report Properties window, select the Code tab.
f. Add the following lines of code to the Code tab in the Custom Code textbox, if the function is not already present.
3. The following code example shows a function that calls the ROUND function and uses the previous procedure to specify precision.
Code Example
Shared Pct as Decimal
Public Function CalcPct(Amount1 as Decimal, Amount2 as Decimal) as Decimal
if Amount2 <> 0 then
Pct = Amount1 / Amount2 * 100
else
Pct = 0
end if
REM Rounding precision = 0.1
Return ROUND(10*Pct)/10
End Function
a. Click OK to close the Report Properties window b. Save and compile the report.
Microsoft Official Training Materials for Microsoft Dynamics ® Your use of this content is subject to your current services agreement

Reporting in Microsoft Dynamics® NAV 2013
3 - 46
Anatomy of the Sales Invoice Report In Microsoft Dynamics NAV 2013, the Sales Invoice report (report 206) is used to print sales invoices. Technically, the Sales Invoice report can be difficult to understand. However, because the Sales Invoice report is built similar to other reports in Microsoft Dynamics NAV 2013, you must understand how it is designed.
This lesson provides an overview of the Sales Invoice report, and it will also focus on the RDLC report layout.
The Data Model
The logical design for the Sales Invoice report includes the following data model:
• Sales Invoice Header
o Integer (CopyLoop)
Integer (PageLoop)
Integer (DimensionLoop1)
Sales Invoice Line
o Integer (Sales Shipment Buffer)
o Integer (DimensionLoop2)
o Integer (AsmLoop)
Integer (VATCounter)
Integer (VATCounterLCY)
Integer (Total)
Integer (Total2)
There are two primary tables that are used to create a sales invoice—the Sales Invoice Header and the Sales Invoice Line.
In this report, some supporting variables are used to access information from tables that do not fit into the data model.
Supplemental tables, such as Payment Terms, Shipment Method and Company Information, are used to expand the code fields that are used in the invoice tables, to more descriptive text. The Company Information table is used to retrieve information about the company that is preparing the invoice.
The report also uses a virtual table: Integer. The Integer table is used for the logical loops that are run through during report execution.
Microsoft Official Training Materials for Microsoft Dynamics ® Your use of this content is subject to your current services agreement

Module 3: Adding Code to a Report
3 - 47
The Triggers
If you compare the report earlier versions and view the triggers of the data items in the report, not much new code is added. An explanation of the code changes for each data item follows.
CopyLoop - OnPreDataItem
The CopyLoop data item is executed for each Sales Invoice Header. The function of this data item is to have multiple copies of the report printed in one report run.
Although the CopyLoop is not the top-level data item in the report, it controls the printing of the whole report. All other data items depend on this data item and are repeated for each copy loop. (The Sales Invoice Header data item is mainly only used for filtering and data retrieval purposes.) If a sales invoice has more than one page, all pages are printed in the PageLoop cycle, which is subordinated to the CopyLoop cycle. If two copies of the report will be printed, all pages of the invoice will be printed before the invoice is printed again. If multiple reports will be printed, all copies of the first invoice will be printed before the next invoice is printed.
Because the Reportviewer client supports only one body section, a workaround must be used to be able to print it multiple times, depending on the number of copies required. To have the pages of the invoice grouped by invoice header, a new integer variable OutputNo is introduced. The variable is used to control the number of copies of a report and it is also used to group the pages and copies of the report. To make the variable available in the dataset, it is added as a column in the report dataset designer in the integer (PageLoop) data item.
In the OnPreDataItem trigger of the CopyLoop data item, a piece of code is added that initializes a new Integer variable, OutputNo.
Code Example
NoOfLoops := ABS(NoOfCopies) + Cust."Invoice Copies" + 1;
IF NoOfLoops <= 0 THEN
NoOfLoops := 1;
CopyText := '';
SETRANGE(Number,1,NoOfLoops);
OutputNo := 1;
Microsoft Official Training Materials for Microsoft Dynamics ® Your use of this content is subject to your current services agreement

Reporting in Microsoft Dynamics® NAV 2013
3 - 48
On the Customer Card, you can define how many additional copies are required for every customer, when you print the document. In this trigger that value is fetched for the customer and is added to the NoOfCopies variable. A text will be added on all copies of the invoice. For this a variable is used: CopyText.
The integer data item is then filtered from one to the required number of copies.
Best Practice: When you work with integer data items it is important to apply a filter. If you omit this, there is a risk of creating an unintended large loop. The range of the integer table is -1,000,000,000 to 1,000,000,000. By applying a filter to the Integer virtual table, you can easily access a subset or range of numbers that can be used to control looping in reports.
CopyLoop - OnAfterGetRecord
In the OnAfterGetRecord trigger, two segments of code are added.
Code example
IF Number > 1 THEN BEGIN
CopyText := Text003;
OutputNo += 1;
END;
CurrReport.PAGENO := 1;
TotalSubTotal := 0;
TotalInvoiceDiscountAmount := 0;
TotalAmount := 0;
TotalAmountVAT := 0;
TotalAmountInclVAT := 0;
TotalPaymentDiscountOnVAT := 0;
The first piece of code is used to increment the OutputNo value for each copy of the report. For the first copy of the report, OutputNo will equal one, for the second copy, OutputNo will be two, and so on. The OutputNo value is used to group the data in the report.
Microsoft Official Training Materials for Microsoft Dynamics ® Your use of this content is subject to your current services agreement

Module 3: Adding Code to a Report
3 - 49
The second segment of code is used to reset several variables to zero for each copy of the report. The variables are used to display the different subtotals in the RDLC report layout.
Sales Invoice Line - OnAfterGetRecord
As previously mentioned, the subtotals are calculated and stored in variables for the RDLC report layout. To calculate the totals, the following piece of code is added:
Code Example
PostedShipmentDate := 0D;
IF Quantity <> 0 THEN
PostedShipmentDate := FindPostedShipmentDate;
IF (Type = Type::"G/L Account") AND (NOT ShowInternalInfo) THEN
"No." := '';
VATAmountLine.INIT;
VATAmountLine."VAT Identifier" := "VAT Identifier";
VATAmountLine."VAT Calculation Type" := "VAT Calculation Type";
VATAmountLine."Tax Group Code" := "Tax Group Code";
VATAmountLine."VAT %" := "VAT %";
VATAmountLine."VAT Base" := Amount;
VATAmountLine."Amount Including VAT" := "Amount Including VAT";
VATAmountLine."Line Amount" := "Line Amount";
Microsoft Official Training Materials for Microsoft Dynamics ® Your use of this content is subject to your current services agreement

Reporting in Microsoft Dynamics® NAV 2013
3 - 50
IF "Allow Invoice Disc." THEN
VATAmountLine."Inv. Disc. Base Amount" := "Line Amount";
VATAmountLine."Invoice Discount Amount" := "Inv. Discount Amount";
VATAmountLine.InsertLine;
TotalSubTotal += "Line Amount";
TotalInvoiceDiscountAmount -= "Inv. Discount Amount";
TotalAmount += Amount;
TotalAmountVAT += "Amount Including VAT" - Amount;
TotalAmountInclVAT += "Amount Including VAT";
TotalPaymentDiscountOnVAT += -("Line Amount" - "Inv. Discount Amount" - "Amount Including VAT");
The totals are added as columns in the report dataset designer Sales Invoice Line data item and converted to dataset fields at run time.
Microsoft Official Training Materials for Microsoft Dynamics ® Your use of this content is subject to your current services agreement

Module 3: Adding Code to a Report
3 - 51
The Layout
View the layout of the report. There are many controls and tables both in the header and in the body.
FIGURE 3.9: RDLC REPORT LAYOUT OF THE SALES INVOICE
Microsoft Official Training Materials for Microsoft Dynamics ® Your use of this content is subject to your current services agreement

Reporting in Microsoft Dynamics® NAV 2013
3 - 52
Some controls have red text and are invisible controls. The Hidden property in the Visibility property collection is set to True.
The Body
In the upper-left corner of the Body section two hidden tables are visible. The right table has three columns and contains the logo from the Company Information table. The picture is converted to text for it to be stored in a text box, by using the Convert.ToBase64String() function.
The left table contains four columns. Each column contains specific information that is available through variables. The first column contains all fields for the customer's address. The second column includes information about the company address. The third column contains much information coming from the Company Information table. The fourth column contains all kinds of information related to the Sales Invoice Header: fields from the Sales Invoice Header (such as Due Date), fields from the Salesperson/Purchaser table, and other elements.
Microsoft Official Training Materials for Microsoft Dynamics ® Your use of this content is subject to your current services agreement

Module 3: Adding Code to a Report
3 - 53
The following table shows the names and values of the four text boxes.
Name Value Expression CustAddr =Fields!CustAddr1.Value+Chr(177) +
Fields!CustAddr2.Value+Chr(177)+
Fields!CustAddr3.Value+Chr(177)+ Fields!CustAddr4.Value+Chr(177)+ Fields!CustAddr5.Value+Chr(177)+
Fields!CustAddr6.Value+Chr(177)+ Fields!CustAddr7.Value+Chr(177)+ Fields!CustAddr8.Value+Chr(177)+ Fields!BilltoCustNo_SalesInvHdr.Value + Chr(177) +
Fields!VATRegNo_SalesInvHdr.Value + Chr(177) + Fields!YourReference_SalesInvHdr.Value + Chr(177) + Fields!No_SalesInvHdr.Value + Chr(177) + Fields!HdrOrderNo_SalesInvHdr.Value + Chr(177) +
Fields!PostingDate_SalesInvHdr.Value + Chr(177) + Fields!DueDate_SalesInvHdr.Value + Chr(177) + Cstr(Fields!PricesInclVATYesNo_SalesInvHdr.Value) + Chr(177) +
First(Fields!DocDate_SalesInvHdr.Value) + Chr(177) + Fields!SalesPurchPersonName.Value+ Chr(177) + Fields!DocumentCaptionCopyText.Value+Chr(177)+ Fields!PaymentTermsDesc.Value+Chr(177)+
Fields!ShipmentMethodDesc.Value + Chr(177) + Fields!CompanyAddr1.Value + Chr(177) + Fields!CompanyAddr2.Value + Chr(177) +
Fields!CompanyAddr3.Value + Chr(177) + Fields!CompanyAddr4.Value + Chr(177) + Fields!CompanyAddr5.Value + Chr(177) + Fields!CompanyAddr6.Value + Chr(177) +
Fields!CompanyInfoPhoneNo.Value + Chr(177)+ Fields!OrderNoText.Value+ Chr(177)+ Fields!EMail.Value + Chr(177)+ Fields!HomePage.Value + Chr(177)+
Fields!CompanyInfoVATRegNo.Value + Chr(177)+ Fields!CompanyInfoGiroNo.Value + Chr(177)+ Fields!CompanyInfoBankName.Value + Chr(177)+ Fields!CompanyInfoBankAccNo.Value
Microsoft Official Training Materials for Microsoft Dynamics ® Your use of this content is subject to your current services agreement

Reporting in Microsoft Dynamics® NAV 2013
3 - 54
In each expression, Chr(177) is used to separate the different data parts in each group. When the GetData() function is called, data in the group is split by using the Split function that has Chr(177) as a separator.
This kind of hidden information is included in a table header row and not in a table detail row (because it is only needed one time). Using a table detail row can affect report execution time.
Later in the Body section, several tables are visible that are used to display the various blocks of information that must be included in the report.
The HeaderDim table contains information regarding the dimensions of the sales invoice header. The table is only printed when the Show Internal Information option is checked in the request options page. In the DimensionLoop of the report, all dimensions for the posted sales invoice header will be run through and stored in a text variable. The first header row in the table will be printed the first time the DimensionLoop cycle is run through. The second header row will be printed in all other loops.
The TableLines table contains all details of the Sales Invoice Line table. The first header row contains the field captions. (Parameters!) The table contains two groups. The two group header rows display the details of the Sales Invoice Line. The Hidden property for these rows is set in a way that the first row header is printed for sales invoice lines where the Type field is <blank> and the second header is printed for the other sales invoice lines.
Code Example
=Iif(Fields!Type_SalesInvLine.Value = " ", false, true)
=Iif(Fields!Type_SalesInvLine.Value = " ", true, false)
The first detail rows contain details regarding the posted shipments, the dimensions and posted assembly line information for the sales invoice line. Again visibility options are defined to show or hide the rows when necessary. The group footer rows are used to show the different subtotals. The table properties are set to repeat the table header row on each page. (see property RepeatOnNewPage)
The Table_VAT table contains all value-added tax (VAT) related specifications from the VATCounter data item. The first two (header) rows of the table contain captions. The detail row shows all details for the VATCounter data item. The table footer row displays the totals for the VAT Amount Specifications.
The Table_VATLCY table contains all VAT related specifications from the VATCounterLCY data item. The first three (header) rows of the table contain captions and information about the exchange rates of the amounts. The detail row shows all details for the VATCounter data item. The table footer row displays the totals for the VAT Amount Specifications in local currency.
Microsoft Official Training Materials for Microsoft Dynamics ® Your use of this content is subject to your current services agreement

Module 3: Adding Code to a Report
3 - 55
Finally, the TableShipToAddress table contains shipping information for the sales invoice header. It contains three header rows (with a table caption and some customer information) and detail rows (including the Ship-To Address information). This table is placed inside a second List (list2). The table is not shown if the Sell To Customer is the same as the Bill To Customer.
Code Example
=(First(Fields!SelltoCustNo_SalesInvHdr.Value)= First(Fields!BilltoCustNo_SalesInvHdr.Value))
The List Control
All tables in the body are positioned inside a list control. A list is a data region that presents data arranged in a freeform manner. You can arrange report items to create a form with text boxes, images, and other data regions that are positioned anywhere within the list. The list is considered a large form and it will be printed as such.
When you delete a list control, all controls that are positioned inside a list control will be deleted too.
Microsoft Official Training Materials for Microsoft Dynamics ® Your use of this content is subject to your current services agreement

Reporting in Microsoft Dynamics® NAV 2013
3 - 56
You can also use the List control to group its content. In this report the List is grouped first on [Sales_Invoice_Header_No_] and then on [OutputNo] as is shown in the group properties:
FIGURE 3.10: LIST GROUP PROPERTIES SCREEN SHOT
The code in the CopyLoop – OnAfterGetRecord trigger makes sure the OutputNo variable is incremented for every required copy. You can use this value to group upon in the List control and to display the content of the list as many times as copies are required.
Microsoft Official Training Materials for Microsoft Dynamics ® Your use of this content is subject to your current services agreement

Module 3: Adding Code to a Report
3 - 57
As an example, when you run the Sales Invoice report, and in the request options form request 2 copies like in the following screenshot:
FIGURE 3.11: NUMBER OF COPIES 2 WINDOW
then in the report you can consult the generated dataset and notice that the dataset is duplicated 2 times as you can see in the following screenshot:
Microsoft Official Training Materials for Microsoft Dynamics ® Your use of this content is subject to your current services agreement

Reporting in Microsoft Dynamics® NAV 2013
3 - 58
FIGURE 3.12: NUMBER OF COPIES DATASET WINDOW
So instead of a dataset that contains 4 rows it now contains 12 rows (1 original and 2 copies).
The report also contains a header, as we will explain in the next lesson. A header (and footer) will be shown above (below) the body, unless specified otherwise in their properties.
The Header
At the top of the Header section, there is a hidden textbox (textbox71). The purpose of this control is to retrieve information that is stored (hidden) in the Body and to load it into custom variable. To do this, the text boxes use the custom functions SetData() that is defined in the report.
Code Example
=Code.SetData(ReportItems!CustAddr.Value,1)
The SetData() function has two parameters. The first parameter, NewData, is the data value that is stored in the custom variable. The second parameter, Group, is an integer that refers to the custom data variable that is used.
Microsoft Official Training Materials for Microsoft Dynamics ® Your use of this content is subject to your current services agreement

Module 3: Adding Code to a Report
3 - 59
Code Example
Public Function SetData(NewData as Object,Group as integer)
If Group = 1 and NewData > "" Then
Data1 = NewData
End If
If Group = 2 and NewData > "" Then
Data2 = NewData
End If
If Group = 3 and NewData > "" Then
Data3 = NewData
End If
If Group = 4 and NewData > "" Then
Data4 = NewData
End If
End Function
The custom data variable is defined as shared variables of the type Object.
Code Example
Shared Data1 as Object
An object is a more complex data type. Unlike simple data types (such as integer, string, boolean, and so on), it can contain more complex data values, such as data that can be broken down into smaller pieces. In this case, the data variables can be considered as arrays. This means that they contain multiple values. Shared means that they are available throughout the whole report.
When the report is run and the header is rendered, it starts with the text boxes at the top. From evaluating the expression that is set in the Value property of the text boxes, the data is retrieved from the hidden text boxes in the body and loaded into the custom variables. As a first parameter, the function takes an element from the ReportItems collection.
Microsoft Official Training Materials for Microsoft Dynamics ® Your use of this content is subject to your current services agreement

Reporting in Microsoft Dynamics® NAV 2013
3 - 60
Note: The ReportItems built-in collection is the set of text boxes from report items such as rows of a data region or text boxes on the report design surface. The ReportItems collection includes text boxes that are in the current scope of a page header, page footer, or report body. This collection is determined at run time by the report processor and the report renderer.
The current scope changes as the report processor successively combines report data and the report item layout elements as the user views pages of a report. You can use the ReportItems built-in collection to produce dictionary-style page headers that show the first and last items on each page.
After the hidden text boxes, the three image controls are rendered. The Value property of the Image controls is set to: =Convert.ToBase64String(Fields!CompanyInfoXPicture.Value) where x represents an integer between 1 and 3 (both included)).
Now, the other text boxes in the page header will be rendered.
Each of these textboxes is using the GetData() function, which has two parameters. The first parameter, Num, is an integer value that refers to the element in the custom data variable. The second parameter, Group, refers to the data variable that is used. There are four groups: one for the customer address, one for the shipping address, one for the company information and one for the sales invoice header.
In the GetData() function, the data is extracted from the variable using the Choose() and Split() functions.
The Split() function takes a string argument, divides the string into elements by using the space character as the delimiter, and returns a string array. It has two parameters: the string to split (CStr(Data1)) and the space delimiter (Chr(177)). The CStr() function is used to convert the custom variable to string. The string array is then passed as a second parameter to the Choose() function.
The Choose() function selects and returns a value from a list of arguments. The first parameter, Num, determines which element will be retrieved from the string array. For example:
Microsoft Official Training Materials for Microsoft Dynamics ® Your use of this content is subject to your current services agreement

Module 3: Adding Code to a Report
3 - 61
Code Example
=Code.GetData(22,1)
will return element 1 in the custom variable Data2. This corresponds to the Company Name (the first element in the CompanyAddr array).
After the header is rendered, the Body will be rendered.
Print Header Information on Multiple Pages
In the earlier version of Microsoft Dynamics NAV, hidden fields needed to be included in the body of the report to successfully create the client report definition (RDCL) report layout. Typically, the hidden fields are added to the table in the body of the RDLC report layout.
However, if the report includes more than one table, the header information will not display on the pages that display the the next tables. Instead, the header information only displays on the page that has the first table. For reports such as document reports (invoices, credit memos) that include multiple tables and require header information on each page, make sure that you do the following:
• Create hidden text boxes in one table to obtain the data.
• Create a function to save the data. You will call this function from one or more hidden fields in the header section.
• Create a function to retrieve the data. You will call this function from one or more displayed text boxes in the header section.
This also applies to tables that span multiple pages. To pass information from one page to the next, it must be included as a hidden column in the data regions control that spans multiple pages. However, there is an alternative solution. This alternative is to include the information in a hidden text box in the body section (outside the data region control) and make the text box move with the data region control. To do this, select the text box properties, check the Repeat report item that has data region on every page and then specify the data region control that can span multiple pages.
Remember that headers and footers in the client report definition (RDLC) report layouts have the following limitations:
• Expressions in a header or footer can refer to only one report item.
• There can be only one header, one body, and one footer in a report.
Microsoft Official Training Materials for Microsoft Dynamics ® Your use of this content is subject to your current services agreement

Reporting in Microsoft Dynamics® NAV 2013
3 - 62
The Number of Copies Option
Frequently, for document type reports the request page displays an option for the number of copies to print. In a client report definition (RDLC) report layout, a copy is the same as a new document that must start on a new page. You must add code to set and update the copy number, group the data based on the copy number, and then specify a page break at the end of the group.
To Add Code to the Report for the Number of Copies
Previously, this module described the code that is added to the data item trigger in the report that is required to initialize and increment the copy number. Also mentioned earlier is that the OutputNo must be added to the dataset of the report.
To group data based on the copy number, follow these steps.
1. In the development environment, on the View menu, click Layout. 2. In Microsoft Visual Studio Report Designer, in the report.rdlc file,
right-click the row to group on, and then click Edit Group.
3. In the Group Properties window, on the General tab, under Group on, select the next blank line to add a grouping, and then select =Fields!OutputNo.Value from the drop-down list.
4. In the Group window, click the Sorting tab.
5. Select a blank line, and then select =Fields!OutputNo.Value from the drop-down list.
To specify the page break for the report, follow these steps.
1. Select the List control and select Row Groups.
2. Click selectGroup Properties. 3. In the Page Break tab, check the Between each instance of a group
option.
4. Click OK to close the Group Properties window.
Reset Page Numbers
On some reports, you might want to group sets of data together and reset the page number after each group.
For example, in the standard application, report 206, Sales Invoice, displays sales invoices that are grouped by sales invoice number.
To reset the page number to one for each group of data, you must modify code on the client report definition (RDLC) report layout.
Microsoft Official Training Materials for Microsoft Dynamics ® Your use of this content is subject to your current services agreement

Module 3: Adding Code to a Report
3 - 63
To reset page numbers, follow these steps.
1. In the development environment, click Object Designer. 2. In Object Designer, click Report, select a report to modify, and then
click Design. 3. On the View menu, click Layout. 4. In Microsoft Visual Studio, in the Report.rdlc file, on the Report
menu, select Report Properties. 5. In the Report Properties window, select the Code tab. 6. Add the following code in the Custom code text box:
Code Example
REM Reset Page Number: Shared offset As Integer Shared newPage As Object Shared currentgroup1 As Object Shared currentgroup2 As Object Shared currentgroup3 As Object
Public Function GetGroupPageNumber(ByVal NewPage As Boolean, ByVal pagenumber As Integer) As Object If NewPage Then offset = pagenumber - 1 End If Return pagenumber - offset End Function
Public Function IsNewPage(ByVal group1 As Object, ByVal group2 As Object, ByVal group3 As Object) As Boolean newPage = False If Not (group1 = currentgroup1) Then newPage = True currentgroup1 = group1 Else If Not (group2 = currentgroup2) Then newPage = True currentgroup2 = group2 Else If Not (group3 = currentgroup3) Then newPage = True currentgroup3 = group3 End If End If End If Return newPage End Function
Microsoft Official Training Materials for Microsoft Dynamics ® Your use of this content is subject to your current services agreement

Reporting in Microsoft Dynamics® NAV 2013
3 - 64
7. In Visual Studio, in the Report.rdlc file, right-click the text box in the header that displays the page number, and then select Expression.
8. In the Expression window, enter the following expression: =Code.GetGroupPageNumber(ReportItems!NewPage.Value,Globals!PageNumber)
9. In the Body of the layout, create a new text box called NewPage.
10. Right-click the NewPage text box that you created in step 8, and then select Properties.
11. In the Properties window, on the General tab, enter the following in the Value field. =Code.IsNewPage(Fields!<grouping field1>[,<grouping field2>,<grouping field3>]) For example, if you are grouping by document type, then grouping field1 is Document_Type.Value.
To use more than three groupings, you can modify the code in the IsNewPage function.
To use less than three groupings, you can either modify the code in the IsNewPage function or use a static value for one or more of the function parameters.
Microsoft Official Training Materials for Microsoft Dynamics ® Your use of this content is subject to your current services agreement

Module 3: Adding Code to a Report
3 - 65
Lab 3.1: Adding Conditional Formatting to a Report - Part I
Scenario
The RDLC report layout of the Item Catalog is already designed. Now it is time to fine-tune the report. You must add conditional formatting to make the report more user-friendly:
• Table headers must be printed with a LightGrey background.
• The Picture column must have a caption.
• Rows must be printed with alternating colors.
• Negative inventory values must be displayed in bold and in red.
• The Image control must be hidden automatically when an item has no picture.
The result must resemble this:
In Lab 3.2, you will use expressions to add other functionality.
Microsoft Official Training Materials for Microsoft Dynamics ® Your use of this content is subject to your current services agreement

Reporting in Microsoft Dynamics® NAV 2013
3 - 66
Objectives
In this lab, you will continue designing the Item Catalog. You will use expressions to change visibility options and formatting.
Exercise 1: Step by Step
Task 1: Change the Background Color for the Header Row
High Level Steps 1. Change the BackgroundColor of the captions.
Detailed Steps 1. Change the BackgroundColor of the captions.
a. Open report 123456724 in Visual Studio Report Designer. b. In the header row of the table control, select the text boxes
containing the No., Description, Base Unit of Measure, Unit Price, Inventory and Picture field captions.
c. In the Properties window, set the BackgroundColor property to LightGrey.
Task 2: Change the Background Colors for the Detail Row
High Level Steps 1. Change the BackgroundColor of the details.
Detailed Steps 1. Change the BackgroundColor of the details.
a. On the detail row of the table control, select the text boxes containing the No. Description, Base Unit of Measure, Unit Price and Inventory fields.
b. In the Properties window, in the BackgroundColor property, select <Expression...>.
c. In the Expression window, enter the following expression: =Iif(RowNumber(Nothing) Mod 2 = 0, "PaleGreen", "Transparent")
d. Click OK to close the Expression window.
Microsoft Official Training Materials for Microsoft Dynamics ® Your use of this content is subject to your current services agreement

Module 3: Adding Code to a Report
3 - 67
Task 3: Change the Color of Negative Inventory Values to Red
High Level Steps 1. Change the color of negative inventory values to red.
Detailed Steps 1. Change the color of negative inventory values to red.
a. On the detail row, select the text box containing the Inventory field.
b. In the Properties window, in the Color property, select <Expression...>.
c. In the Expression window, enter the following expression: =Iif(Fields!Inventory_Item.Value < 0, "Red", "Black")
d. Click OK to close the Expression window. e. In the Properties window, expand the Font property collection. f. In the FontWeight property, select <Expression...>. g. In the Expression window, enter the following expression:
=Iif(Me.Value < 0, "Bold", "Normal") h. Click OK to close the Expression window.
Task 4: Change the Visibility Option for the Picture Field
High Level Steps 1. Change the Visibility option for the Picture field.
Detailed Steps 1. Change the Visibility option for the Picture field.
a. On the detail row, select the Image control. b. In the Properties window, expand the Visibility property
collection. c. Clear the ToggleItem property. d. In the Hidden property, select <Expression...>. e. In the Expression window, enter the following expression:
=Iif(IsNothing(Fields!Picture_Item.Value),true,false) f. Click OK to close the Expression window.
Microsoft Official Training Materials for Microsoft Dynamics ® Your use of this content is subject to your current services agreement

Reporting in Microsoft Dynamics® NAV 2013
3 - 68
Task 5: Repeat the Column Captions on Each Page
High Level Steps 1. Repeat the Column Captions on each page.
Detailed Steps 1. Repeat the Column Captions on each page.
a. Select Tablix Properties. The Tablix Properties window will appear.
b. On the General tab, check the Repeat header rows on each page option.
c. Click OK to close the Tablix Properties window.
Task 6: Run the Report
High Level Steps 1. Run the report.
Detailed Steps 1. Run the report.
a. Exit Visual Studio.
b. Save and import the RDLC changes. c. Save and compile the report in the Report Designer. d. Run the report from the File, Run menu.
Microsoft Official Training Materials for Microsoft Dynamics ® Your use of this content is subject to your current services agreement

Module 3: Adding Code to a Report
3 - 69
Lab 3.2: Adding Conditional Formatting to a Report – Part II
Scenario
The Item Catalog report is used by CRONUS International Ltd. salespeople during the daily order process. Therefore, detailed inventory information and pictures are included. Then, a copy of the report that requires less detailed inventory information is sometimes provided to customers.
To support both requests with the same report, you must change the report so that the user has the option to print the inventory as a numeric value or as an icon that indicates the inventory status:
• Inventory > 0: show a green check mark
• Inventory = 0: show a blue question mark
• Inventory < 0: display a red cross
The result will resemble this:
FIGURE 3.14: ITEM CATALOG WITH IMAGES
Microsoft Official Training Materials for Microsoft Dynamics ® Your use of this content is subject to your current services agreement

Reporting in Microsoft Dynamics® NAV 2013
3 - 70
Objectives
In this lab, you will continue designing the Item Catalog. You will use expressions to change visibility options and formatting. Additionally, you will introduce a Request Options page and work with multiple headers and detail rows.
Exercise 1: Step by Step
Task 1: Add a Boolean Variable to the Development Environment
High Level Steps 1. Add a Boolean Variable to the development environment.
Detailed Steps 1. Add a Boolean Variable to the development environment.
a. Open report 123456732 in the Object Designer. b. Click View, C/AL Globals.
c. On the Variables tab, on a blank line, enter GraphicalInventory in the Name column. Select Boolean in the DataType column.
d. Close the C/AL Globals window.
e. Save and compile the report.
Task 2: Change the Report Dataset Designer
High Level Steps 1. Change the Report Dataset Designer.
Detailed Steps 1. Change the Report Dataset Designer.
a. Open the report in the Object Designer. b. In the report dataset designer, add a new column to the end. c. Select Column as the Data Type.
d. Type GraphicalInventory as the Data Source. e. Type GraphicalInventory as the Name. f. Close the report dataset designer. g. Save and compile the report.
Microsoft Official Training Materials for Microsoft Dynamics ® Your use of this content is subject to your current services agreement

Module 3: Adding Code to a Report
3 - 71
Task 3: Design the Request Options Page
High Level Steps 1. Design the Request Options page.
Detailed Steps 1. Design the Request Options page.
a. Open the report in the Object Designer. b. Select View, Request page.
c. The Request Options Page Designer will be opened. Because the report did not contain a request page yet, the window is blank.
d. On the first blank line, enter “My Request Page” in the Caption column.
e. On the same line, select Container in the Type and ContentArea in the SubType column.
f. On the second line, enter Options in the Caption column. g. In the Type and SubType column, select Group.
h. On the third line, enter Graphical Inventory in the Caption column.
i. Select Field in the Type column. j. In the SourceExpr column, enter GraphicalInventory.
k. Click the Close button in the upper-right corner to close the Request Options Page Designer.
l. Save and compile the report.
Task 4: Embed the Images in the Report
High Level Steps 1. Embed the Images in the Report.
Detailed Steps 1. Embed the Images in the Report.
a. Open the report in Visual Studio Report Designer.
b. Select View Report Data. c. In the Images folder, Select the Add Image menu. d. Browse to the folder containing select InvGreen.png.
e. Click Open to import the image. f. In the Images folder, Select the Add Image menu.
Microsoft Official Training Materials for Microsoft Dynamics ® Your use of this content is subject to your current services agreement

Reporting in Microsoft Dynamics® NAV 2013
3 - 72
g. Browse to the folder containing select InvRed.png. h. Click Open to import the image.
i. In the Images folder, Select the Add Image menu. j. Browse to the folder containing select InvCross.png. k. Click Open to import the image.
Task 5: Add an Additional Table Header Row
High Level Steps 1. Add an Additional Table Header Row.
Detailed Steps 1. Add an Additional Table Header Row.
a. Click the cell containing the No_ItemCaption in the table header row.
b. Right-click the row handle for the table header row and select Insert Row Below.
c. In the first header row, select the first five cells and press Ctrl+C to copy the selection to the clipboard.
d. Select the first cell on the newly added header row and press Ctrl+V.
e. Select the sixth cell on the header row.
f. In the Properties window, set the BackgroundColor property to No Color.
Task 6: Add an Additional Table Detail Row
High Level Steps 1. Add an additional table detail row.
Detailed Steps 1. Add an additional table detail row.
a. Right-click the row handle for the table detail row and select Insert Row – Inside Group - Below.
b. In the first detail row, select all cells and press Ctrl+C to copy the selection to the clipboard.
c. Select the first cell on the newly added detail row and press Ctrl+V.
The table detail row will be duplicated.
Microsoft Official Training Materials for Microsoft Dynamics ® Your use of this content is subject to your current services agreement
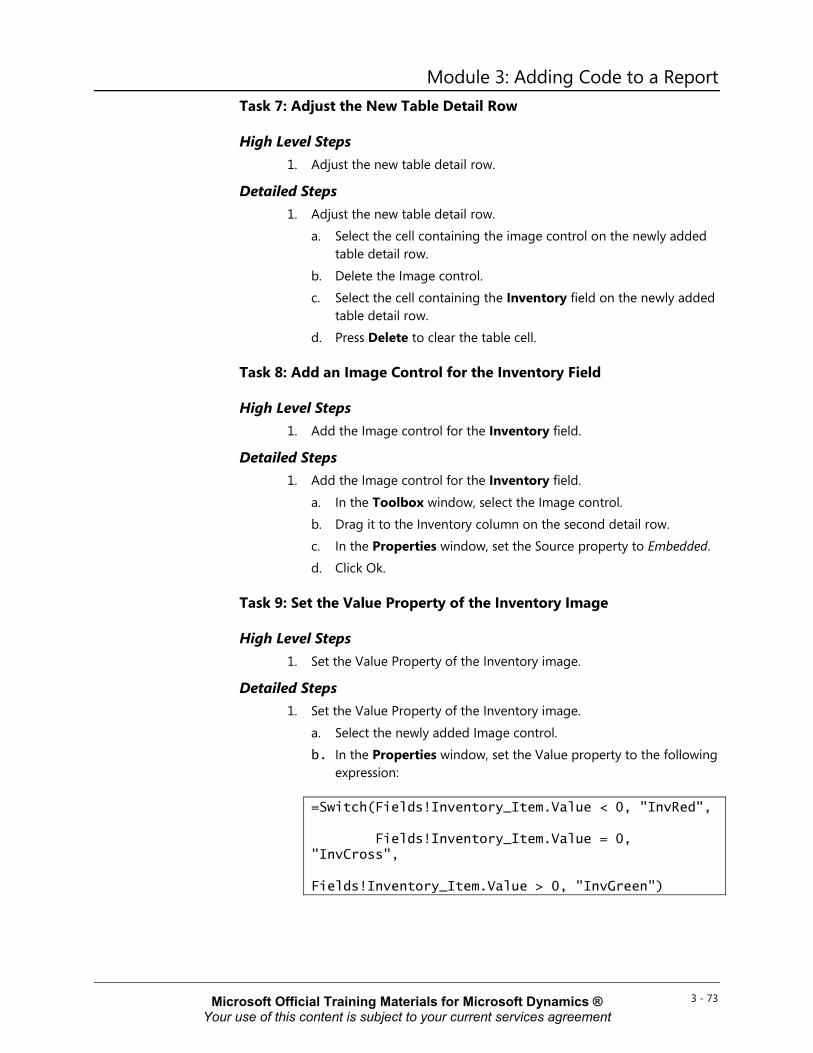
Module 3: Adding Code to a Report
3 - 73
Task 7: Adjust the New Table Detail Row
High Level Steps 1. Adjust the new table detail row.
Detailed Steps 1. Adjust the new table detail row.
a. Select the cell containing the image control on the newly added table detail row.
b. Delete the Image control. c. Select the cell containing the Inventory field on the newly added
table detail row. d. Press Delete to clear the table cell.
Task 8: Add an Image Control for the Inventory Field
High Level Steps 1. Add the Image control for the Inventory field.
Detailed Steps 1. Add the Image control for the Inventory field.
a. In the Toolbox window, select the Image control. b. Drag it to the Inventory column on the second detail row. c. In the Properties window, set the Source property to Embedded. d. Click Ok.
Task 9: Set the Value Property of the Inventory Image
High Level Steps 1. Set the Value Property of the Inventory image.
Detailed Steps 1. Set the Value Property of the Inventory image.
a. Select the newly added Image control. b. In the Properties window, set the Value property to the following
expression:
=Switch(Fields!Inventory_Item.Value < 0, "InvRed",
Fields!Inventory_Item.Value = 0, "InvCross",
Fields!Inventory_Item.Value > 0, "InvGreen")
Microsoft Official Training Materials for Microsoft Dynamics ® Your use of this content is subject to your current services agreement

Reporting in Microsoft Dynamics® NAV 2013
3 - 74
Task 10: Change the Visibility of the Table Header Row
High Level Steps 1. Change the Visibility of the Table Header Row.
Detailed Steps 1. Change the Visibility of the Table Header Row.
a. Click the cell containing the Item No. caption in the first table header row (the row including the Picture caption). The table row handle will now be displayed.
b. Click the row handle for the first table header row to select the whole table row.
c. In the Properties window, expand the Visibility property collection.
d. In the Hidden property, select <Expression...>.
In the Expression window, enter the following expression: =Iif(Fields!GraphicalInventory.Value = 0, False, True)
e. Click OK to close the Expression window. f. Click the cell containing the Item No. caption in the second table
header row (the row that does not include the Picture caption). The table row handle will now be displayed.
g. Click the row handle for the second table header row to select the entire table row.
h. In the Properties window, expand the Visibility property collection.
i. In the Hidden property, select <Expression...>.
In the Expression window, enter the following expression: =Iif(Fields!GraphicalInventory.Value = 0, True, False)
j. Click OK to close the Expression window.
Task 11: Change the Visibility of the Table Detail Row
High Level Steps 1. Change the Visibility of the Table Detail Row.
Detailed Steps 1. Change the Visibility of the Table Detail Row.
a. Click the cell containing the Item No. field in the first table detail row. The table row handle will now be displayed.
b. Click the row handle for the first table detail row to select the entire table row.
Microsoft Official Training Materials for Microsoft Dynamics ® Your use of this content is subject to your current services agreement

Module 3: Adding Code to a Report
3 - 75
c. In the Properties window, expand the Visibility property collection.
d. In the Hidden property, select <Expression...>.
In the Expression window, enter the following expression: =Iif(Fields!GraphicalInventory.Value = 0, false, true)
e. Click OK to close the Expression window.
f. Click the cell containing the Item No. in the second table detail row (the row that does not include the Picture field). The table row handle will now be displayed.
g. Click the row handle for the second table detail row to select the entire table row.
h. In the Properties window, expand the Visibility property collection.
i. In the Hidden property, select <Expression...>.
In the Expression window, enter the following expression: =Iif(Fields!GraphicalInventory.Value = 0, true, false)
j. Click OK to close the Expression window.
Task 12: Change the Alternating Colors for the Table Detail Row
High Level Steps 1. Change the alternating colors for the Table Detail Row.
Detailed Steps 1. Change the alternating colors for the Table Detail Row.
a. On the second detail row of the table control, select the text boxes containing the No. Description, Base Unit of Measure and Unit Price fields.
b. In the Properties window, in the BackgroundColor property, select <Expression...>.
In the Expression window, enter the following expression: =Iif(RowNumber(Nothing) Mod 2 = 0, "LightBlue", "Transparent")
c. Click OK to close the Expression window.
Microsoft Official Training Materials for Microsoft Dynamics ® Your use of this content is subject to your current services agreement

Reporting in Microsoft Dynamics® NAV 2013
3 - 76
Task 13: Run the Report
High Level Steps 1. Run the report.
Detailed Steps 1. Run the report.
a. Exit Visual Studio. b. Save and import the RDLC changes.
c. Save and compile the report in the Report Designer. d. Run the report from the File, Run menu.
The Request Page of the report now shows an option called "Graphical Inventory." If you check the option, the result resembles the figure ITEM CATALOG WITH IMAGES, at the beginning of the lab.
Microsoft Official Training Materials for Microsoft Dynamics ® Your use of this content is subject to your current services agreement

Module 3: Adding Code to a Report
3 - 77
Lab 3.3: Cleaning Up the Report and Using the Company Logo from the Database
Scenario
In Lab 3.2 Adding Conditional Formatting to a Report, you introduced the Graphical Inventory option, to solve multiple end-user requests with one report. You created multiple header and detail rows that are printed, depending on the selected option.
Because of this, when you print the report that has Graphical Inventory information, there are empty lines in between every two detail rows. Additionally, you will replace the embedded company logo by the picture that is stored in the Microsoft Dynamics NAV database.
You will solve these issues by using custom code and variables.
Objectives
In this lab, you will use custom code to finish report. You will add controls to the body section and use the company logo information in the header section. Additionally, you will replace the embedded company logo by the company logo that is stored in the Microsoft Dynamics NAV database.
Exercise 1: Step by Step
Task 1: Delete the Embedded Company Logo from the Report
High Level Steps 1. Delete the embedded company logo from the report.
Detailed Steps 1. Delete the embedded company logo from the report.
a. Select View, Report, Data. b. In the Images folder, select the Cronus Company logo, and use
the Delete button to remove the image.
Microsoft Official Training Materials for Microsoft Dynamics ® Your use of this content is subject to your current services agreement

Reporting in Microsoft Dynamics® NAV 2013
3 - 78
Task 2: Add the Database Picture to the Page Header
High Level Steps 1. Add the database picture to the page header.
Detailed Steps 1. Add the database picture to the page header.
a. Select the Image control in the page header section. b. In the Properties window, set the Source property to Database.
c. In the Properties window, set the MIME Type property to image/bmp.
d. In the Properties window, set the Value property to the following expression: =First(Fields!CompanyPicture.Value, "DataSet_Result")
Task 3: Add the Report Execution Time, the Page Number and the Total Number of Pages to the Header
High Level Steps 1. Add the report execution time, the page number and the total
number of pages to the header.
Detailed Steps 1. Add the report execution time, the page number and the total
number of pages to the header. a. In the Toolbox window, select the Text box control and drag it to
the Page Header section, under the Image control. b. In the Properties window, set the Value property to the following
expression: ="Page " & Globals!PageNumber & "/" & Globals!TotalPages.
c. In the Toolbox window, select the Text box control and drag it to the Page Header section.
d. In the Properties window, set the Value property to the following expression: ="Date Printed: " & FormatDateTime(Globals!ExecutionTime, DateFormat.LongDate)
Microsoft Official Training Materials for Microsoft Dynamics ® Your use of this content is subject to your current services agreement

Module 3: Adding Code to a Report
3 - 79
Task 4: Update the Tablix Control Visibility Settings
High Level Steps 1. Update the Tablix control visibility settings.
Detailed Steps 1. Update the Tablix control visibility settings.
a. Select a text box in the first row of the Tablix to visualize the row handler.
b. Right-click the row handler and select the Row Visibility option. c. In the Row Visibility window, in the property Show or hide
based upon an expression, enter the following expression: i. =Iif(Fields!GraphicalInventory.Value = 0,
False, True)
d. Select the OK button to close the Expression Editor. e. Select the OK button to close the Row Visibility window.
f. Select a text box in the second row of the Tablix to visualize the row handler.
g. Right-click the row handler and select the Row Visibility option. h. In the Row Visibility window, in the property Show or hide
based upon an expression, enter the following expression: i. =Iif(Fields!GraphicalInventory.Value = 0,
True, False)
i. Select the OK button to close the Expression Editor. j. Select the OK button to close the Row Visibility window. k. Select a text box in the third row of the Tablix to visualize the row
handler.
l. Right-click the row handler and select the Row Visibility option. m. In the Row Visibility window, in the property Show or hide
based upon an expression, enter the following expression: i. =Iif(Fields!GraphicalInventory.Value = 0,
False, True)
n. Select the OK button to close the Expression Editor. o. Select the OK button to close the Row Visibility window.
p. Select a text box in the fourth row of the Tablix to visualize the row handler.
Microsoft Official Training Materials for Microsoft Dynamics ® Your use of this content is subject to your current services agreement

Reporting in Microsoft Dynamics® NAV 2013
3 - 80
q. Right-click the row handler and select the Row Visibility option. r. In the Row Visibility window, in the property Show or hide
based upon an expression, enter the following expression: i. =Iif(Fields!GraphicalInventory.Value = 0,
True, False)
s. Select the OK button to close the Expression Editor. t. Select the OK button to close the Row Visibility window.
Task 5: Run the Report
High Level Steps 1. Run the report.
Detailed Steps 1. Run the report.
a. Exit Visual Studio. b. Save and import the RDLC changes.
c. Save and compile the report in the Report Designer. d. Run the report from the Start, Run menu.
Microsoft Official Training Materials for Microsoft Dynamics ® Your use of this content is subject to your current services agreement

Module 3: Adding Code to a Report
3 - 81
Module Review Module Review and Takeaways
This module described how to create and use expressions in a report for different purposes:
• Formatting of strings, dates and numbers
• Visibility options to implement show and hide interactivity effects
• Code for optimal data retrieval
• Grouping expressions
The module also described how to add custom code and custom variables to a report. Additionally, it provided a better understanding of the sales invoice report.
Test Your Knowledge
Test your knowledge with the following questions.
1. Which decision functions can be used in expressions in Visual Studio Report Designer?
( ) Iif()
( ) Switch()
( ) Case()
( ) Select Case()
2. Can nested IiF() statements be used?
( ) No.
( ) Yes, but only up to two levels.
( ) Yes
( ) None of the answers is correct.
Microsoft Official Training Materials for Microsoft Dynamics ® Your use of this content is subject to your current services agreement

Reporting in Microsoft Dynamics® NAV 2013
3 - 82
3. Which function is used to identify the row number in a data region control?
( ) Row
( ) RowNo
( ) RowNumber
( ) NoRow
4. Which expression returns the name of the Windows user (without the domain name) that is running a RDLC report?
( ) =Right(USERID, Len(USERID))
( ) =Right(User!UserID, Len(User!UserID) - InStr(User!UserID, "\"))
( ) =Right(Report!UserID, Len(Report!UserID) - InStr(Report!UserID, "\"))
( ) You cannot do this because the Reportviewer does not use Windows accounts.
5. What is not true about expressions?
( ) Expressions can be used for sorting.
( ) Expressions can be used to determine the visibility of controls.
( ) Expressions can be used for formatting.
( ) Expressions cannot be used to insert page breaks in a report.
6. What is true about Custom Code in a report?
( ) Functions that are defined in the C/AL are automatically added to the RDLC report layout when you use the Create Layout Suggestion option.
( ) Custom Code is available in the Expression window when you use the Code collection.
( ) Custom Code can be added in various areas in Visual Studio Report Designer.
( ) Custom Code must be added by using Visual Basic syntax.
Microsoft Official Training Materials for Microsoft Dynamics ® Your use of this content is subject to your current services agreement

Module 3: Adding Code to a Report
3 - 83
Test Your Knowledge Solutions
Module Review and Takeaways
1. Which decision functions can be used in expressions in Visual Studio Report Designer?
(√) Iif()
( ) Switch()
( ) Case()
( ) Select Case()
2. Can nested IiF() statements be used?
( ) No.
( ) Yes, but only up to two levels.
(√) Yes
( ) None of the answers is correct.
3. Which function is used to identify the row number in a data region control?
( ) Row
( ) RowNo
(√) RowNumber
( ) NoRow
4. Which expression returns the name of the Windows user (without the domain name) that is running a RDLC report?
( ) =Right(USERID, Len(USERID))
(√) =Right(User!UserID, Len(User!UserID) - InStr(User!UserID, "\"))
( ) =Right(Report!UserID, Len(Report!UserID) - InStr(Report!UserID, "\"))
( ) You cannot do this because the Reportviewer does not use Windows accounts.
Microsoft Official Training Materials for Microsoft Dynamics ® Your use of this content is subject to your current services agreement

Reporting in Microsoft Dynamics® NAV 2013
3 - 84
5. What is not true about expressions?
( ) Expressions can be used for sorting.
( ) Expressions can be used to determine the visibility of controls.
( ) Expressions can be used for formatting.
(√) Expressions cannot be used to insert page breaks in a report.
6. What is true about Custom Code in a report?
( ) Functions that are defined in the C/AL are automatically added to the RDLC report layout when you use the Create Layout Suggestion option.
(√) Custom Code is available in the Expression window when you use the Code collection.
( ) Custom Code can be added in various areas in Visual Studio Report Designer.
( ) Custom Code must be added by using Visual Basic syntax.
Microsoft Official Training Materials for Microsoft Dynamics ® Your use of this content is subject to your current services agreement