module 8: investigative tools. 2 investigative tools overview ping traceroute iperf bwctl ndt...
TRANSCRIPT
Module 8: Investigative Tools
2
INVESTIGATIVE TOOLS OVERVIEW
• Ping
• Traceroute
• Iperf
• BWCTL
• NDT
• TCPDUMP
• TCPtrace
• Wireshark (Ethereal)

3
PING
4
HOW DOES PING WORK?
Makes use of Internet Control Message Protocol (ICMP) messages
• Sends timed ICMP ECHO_REQUEST packets
• Listens for ICMP ECHO_REPLY packets
• Prints a line with RTT for each reply
• Statistical summary when finished
• minimum, maximum and average RTT
• Shows packet loss
5
PING: USEFUL PURPOSES
What you might read out of ping statistics:
• host reachability
• RTT
• host load
• routing changes (different TTLs)
• load balancers (constant different RTT values, same TTLs)
• estimate of packet loss rate
• rate limits (uniform loss statistics)

6
PING: DRAWBACKS AND LIMITATIONS (1)
RTT reported by PING may be too low:
• Tiny packets sent via ICMP (by default)
• ‘Real traffic’ uses different protocols
• No influence on transit traffic
• Does not include “application time”
Or too high:
• Host busy (esp. Routers)
7
PING: DRAWBACKS AND LIMITATIONS (2)
Filtering
• Many devices will not respond to ping
• Hosts behind Firewalls / NAT
• Routers (filter/rate limits)
• A destination may in fact be reachable even though an ICMP Echo Request times out
8
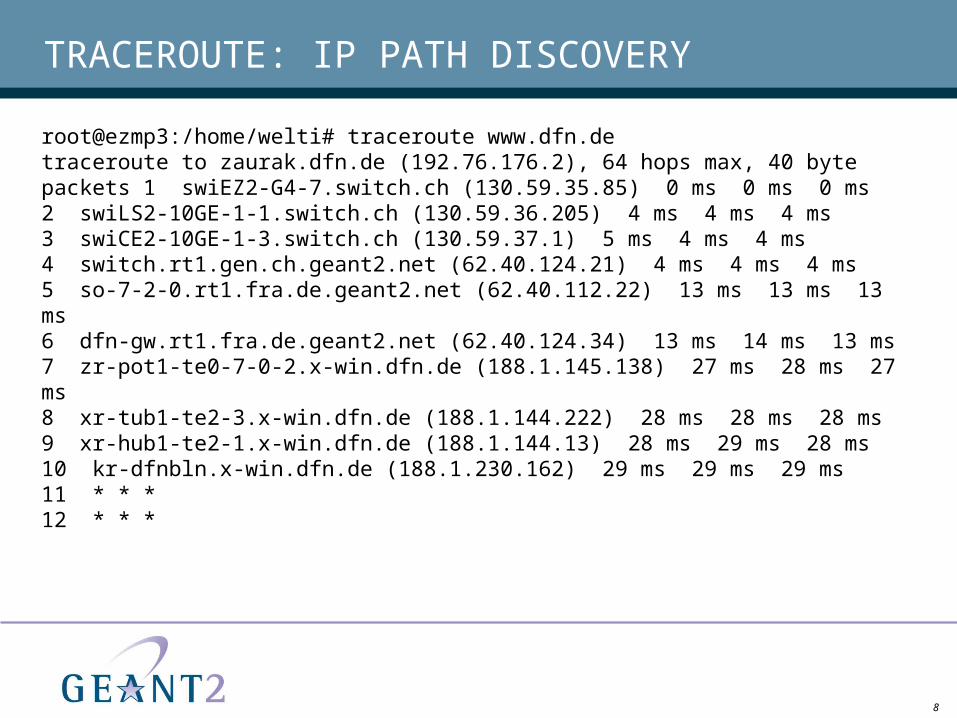
TRACEROUTE: IP PATH DISCOVERY
root@ezmp3:/home/welti# traceroute www.dfn.detraceroute to zaurak.dfn.de (192.76.176.2), 64 hops max, 40 byte packets 1 swiEZ2-G4-7.switch.ch (130.59.35.85) 0 ms 0 ms 0 ms2 swiLS2-10GE-1-1.switch.ch (130.59.36.205) 4 ms 4 ms 4 ms3 swiCE2-10GE-1-3.switch.ch (130.59.37.1) 5 ms 4 ms 4 ms4 switch.rt1.gen.ch.geant2.net (62.40.124.21) 4 ms 4 ms 4 ms5 so-7-2-0.rt1.fra.de.geant2.net (62.40.112.22) 13 ms 13 ms 13 ms6 dfn-gw.rt1.fra.de.geant2.net (62.40.124.34) 13 ms 14 ms 13 ms7 zr-pot1-te0-7-0-2.x-win.dfn.de (188.1.145.138) 27 ms 28 ms 27 ms8 xr-tub1-te2-3.x-win.dfn.de (188.1.144.222) 28 ms 28 ms 28 ms9 xr-hub1-te2-1.x-win.dfn.de (188.1.144.13) 28 ms 29 ms 28 ms10 kr-dfnbln.x-win.dfn.de (188.1.230.162) 29 ms 29 ms 29 ms11 * * *12 * * *

9
HOW DOES TRACEROUTE WORK? (1)
Traceroute
• Discovers forward path to destination IP address.
• Sends stimulus packets (either ICMP or UDP) with increasing times to live (TTL)
• Begins with TTL of 1
• Each packet increments TTL by 1
Each router along the path should receive a packet with a TTL of 1. Responds by sending an ICMP ‘TTL exceeded’ message back to the source.
10
HOW DOES TRACEROUTE WORK? (2)
When TTL is high-enough to reach destination, a different response packet is generated
• ICMP ECHO or ICMP Destination unreachable – port unreachable
Traceroute tool then displays the different ‘hops’ it has discovered, including:
• Hop address (the IP address from which the ICMP / response was sent)
• Round-trip times (RTT)
• Asterisks where responses are missing
• “Bang-something” (!<x>) codes where error conditions were encountered (due to filtering etc.)
11
TRACEROUTE: PURPOSE
What you might read from a traceroute output:
• Forward route
• Router response times
• Routing loops
• Router CPU load
• Filters
• Routing blackholes

12
TRACEROUTE: FORWARD ROUTE / RTT
root@ezmp3:/home/welti# traceroute www.dfn.detraceroute to zaurak.dfn.de (192.76.176.2), 64 hops max, 40 byte packets 1 swiEZ2-G4-7.switch.ch (130.59.35.85) 0 ms 0 ms 0 ms2 swiLS2-10GE-1-1.switch.ch (130.59.36.205) 4 ms 4 ms 4 ms3 swiCE2-10GE-1-3.switch.ch (130.59.37.1) 5 ms 4 ms 4 ms4 switch.rt1.gen.ch.geant2.net (62.40.124.21) 4 ms 4 ms 4 ms5 so-7-2-0.rt1.fra.de.geant2.net (62.40.112.22) 13 ms 13 ms 13 ms6 dfn-gw.rt1.fra.de.geant2.net (62.40.124.34) 13 ms 14 ms 13 ms7 zr-pot1-te0-7-0-2.x-win.dfn.de (188.1.145.138) 27 ms 28 ms 27 ms8 xr-tub1-te2-3.x-win.dfn.de (188.1.144.222) 28 ms 28 ms 28 ms9 xr-hub1-te2-1.x-win.dfn.de (188.1.144.13) 28 ms 29 ms 28 ms10 kr-dfnbln.x-win.dfn.de (188.1.230.162) 29 ms 29 ms 29 ms11 * * *12 * * *
13
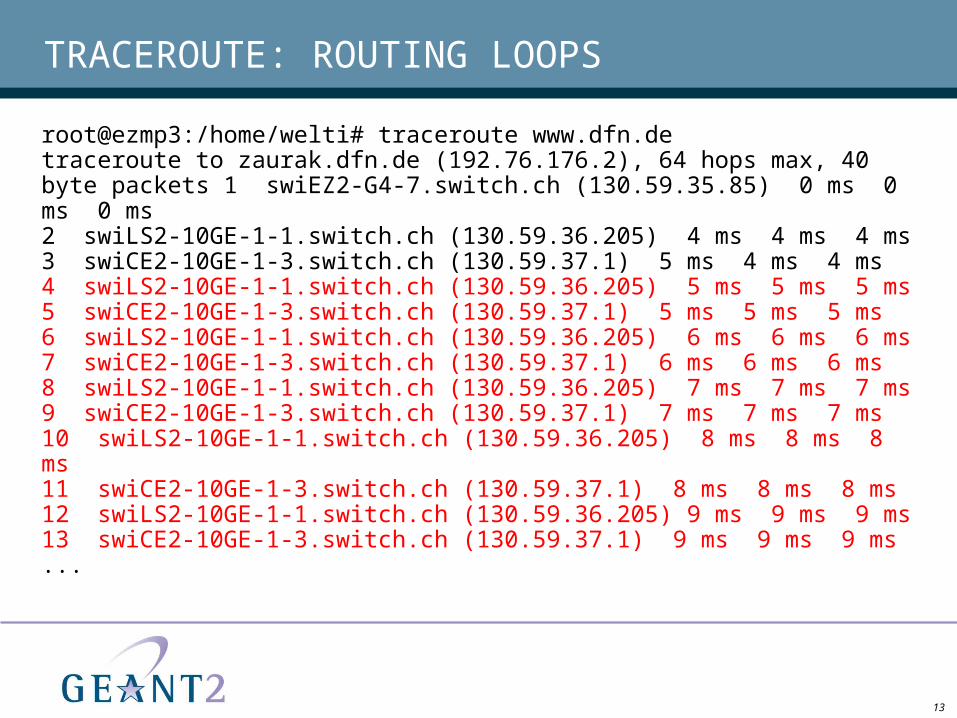
TRACEROUTE: ROUTING LOOPS
root@ezmp3:/home/welti# traceroute www.dfn.detraceroute to zaurak.dfn.de (192.76.176.2), 64 hops max, 40 byte packets 1 swiEZ2-G4-7.switch.ch (130.59.35.85) 0 ms 0 ms 0 ms2 swiLS2-10GE-1-1.switch.ch (130.59.36.205) 4 ms 4 ms 4 ms3 swiCE2-10GE-1-3.switch.ch (130.59.37.1) 5 ms 4 ms 4 ms4 swiLS2-10GE-1-1.switch.ch (130.59.36.205) 5 ms 5 ms 5 ms5 swiCE2-10GE-1-3.switch.ch (130.59.37.1) 5 ms 5 ms 5 ms6 swiLS2-10GE-1-1.switch.ch (130.59.36.205) 6 ms 6 ms 6 ms7 swiCE2-10GE-1-3.switch.ch (130.59.37.1) 6 ms 6 ms 6 ms8 swiLS2-10GE-1-1.switch.ch (130.59.36.205) 7 ms 7 ms 7 ms9 swiCE2-10GE-1-3.switch.ch (130.59.37.1) 7 ms 7 ms 7 ms10 swiLS2-10GE-1-1.switch.ch (130.59.36.205) 8 ms 8 ms 8 ms11 swiCE2-10GE-1-3.switch.ch (130.59.37.1) 8 ms 8 ms 8 ms12 swiLS2-10GE-1-1.switch.ch (130.59.36.205) 9 ms 9 ms 9 ms13 swiCE2-10GE-1-3.switch.ch (130.59.37.1) 9 ms 9 ms 9 ms...

14
TRACEROUTE: BUSY ROUTERS
root@ezmp3:/home/welti# traceroute www.dfn.detraceroute to zaurak.dfn.de (192.76.176.2), 64 hops max, 40 byte packets 1 swiEZ2-G4-7.switch.ch (130.59.35.85) 0 ms 0 ms 0 ms2 swiLS2-10GE-1-1.switch.ch (130.59.36.205) 4 ms 4 ms 4 ms3 swiCE2-10GE-1-3.switch.ch (130.59.37.1) 5 ms 4 ms 4 ms4 switch.rt1.gen.ch.geant2.net (62.40.124.21) 4 ms 4 ms 4 ms5 so-7-2-0.rt1.fra.de.geant2.net (62.40.112.22) 13 ms 13 ms 13 ms6 dfn-gw.rt1.fra.de.geant2.net (62.40.124.34) 55 ms 58 ms 53 ms7 zr-pot1-te0-7-0-2.x-win.dfn.de (188.1.145.138) 27 ms 28 ms 27 ms8 xr-tub1-te2-3.x-win.dfn.de (188.1.144.222) 28 ms 28 ms 28 ms9 xr-hub1-te2-1.x-win.dfn.de (188.1.144.13) 28 ms 29 ms 28 ms10 kr-dfnbln.x-win.dfn.de (188.1.230.162) 29 ms 29 ms 29 ms11 * * *12 * * *

15
TRACEROUTE: RATE LIMITS
root@ezmp3:/home/welti# traceroute www.dfn.detraceroute to zaurak.dfn.de (192.76.176.2), 64 hops max, 40 byte packets 1 swiEZ2-G4-7.switch.ch (130.59.35.85) 0 ms 0 ms 0 ms2 swiLS2-10GE-1-1.switch.ch (130.59.36.205) 4 ms 4 ms 4 ms3 swiCE2-10GE-1-3.switch.ch (130.59.37.1) 5 ms 4 ms 4 ms4 switch.rt1.gen.ch.geant2.net (62.40.124.21) 4 ms * *5 so-7-2-0.rt1.fra.de.geant2.net (62.40.112.22) 13 ms 13 ms 13 ms6 dfn-gw.rt1.fra.de.geant2.net (62.40.124.34) 13 ms 14 ms 13 ms7 zr-pot1-te0-7-0-2.x-win.dfn.de (188.1.145.138) * 28 ms 27 ms8 xr-tub1-te2-3.x-win.dfn.de (188.1.144.222) 28 ms 28 ms 28 ms9 xr-hub1-te2-1.x-win.dfn.de (188.1.144.13) 28 ms 29 ms 28 ms10 kr-dfnbln.x-win.dfn.de (188.1.230.162) 29 ms 29 ms 29 ms11 * * *12 * * *
16
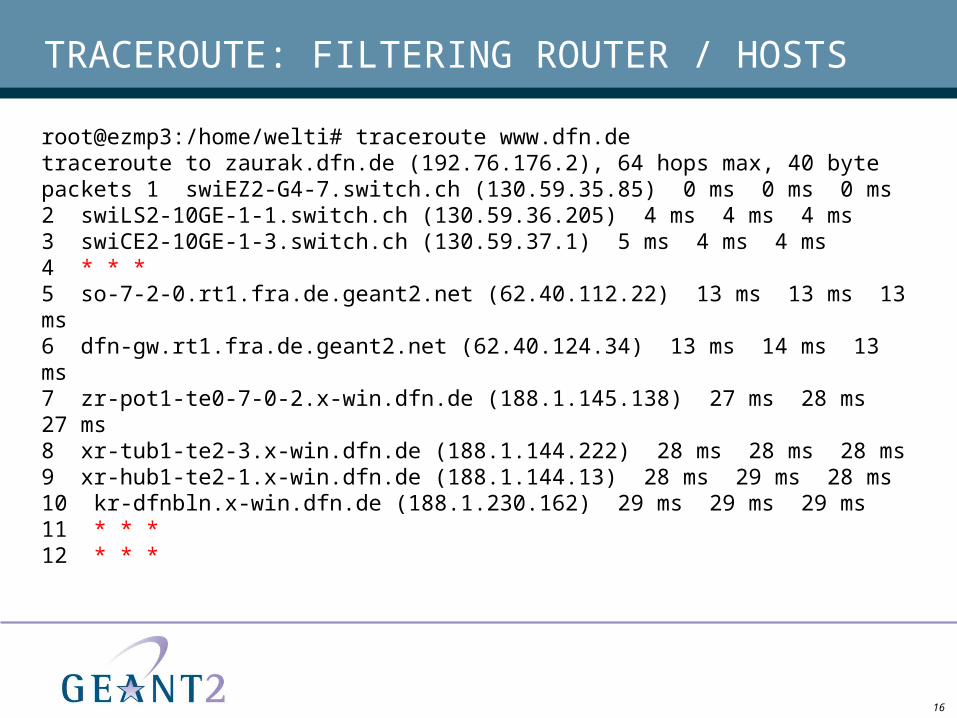
TRACEROUTE: FILTERING ROUTER / HOSTS
root@ezmp3:/home/welti# traceroute www.dfn.detraceroute to zaurak.dfn.de (192.76.176.2), 64 hops max, 40 byte packets 1 swiEZ2-G4-7.switch.ch (130.59.35.85) 0 ms 0 ms 0 ms2 swiLS2-10GE-1-1.switch.ch (130.59.36.205) 4 ms 4 ms 4 ms3 swiCE2-10GE-1-3.switch.ch (130.59.37.1) 5 ms 4 ms 4 ms4 * * *5 so-7-2-0.rt1.fra.de.geant2.net (62.40.112.22) 13 ms 13 ms 13 ms6 dfn-gw.rt1.fra.de.geant2.net (62.40.124.34) 13 ms 14 ms 13 ms7 zr-pot1-te0-7-0-2.x-win.dfn.de (188.1.145.138) 27 ms 28 ms 27 ms8 xr-tub1-te2-3.x-win.dfn.de (188.1.144.222) 28 ms 28 ms 28 ms9 xr-hub1-te2-1.x-win.dfn.de (188.1.144.13) 28 ms 29 ms 28 ms10 kr-dfnbln.x-win.dfn.de (188.1.230.162) 29 ms 29 ms 29 ms11 * * *12 * * *

17
TRACEROUTE: ROUTING PROBLEMS
root@ezmp3:/home/welti# traceroute www.dfn.detraceroute to zaurak.dfn.de (192.76.176.2), 64 hops max, 40 byte packets 1 swiEZ2-G4-7.switch.ch (130.59.35.85) 0 ms 0 ms 0 ms2 swiLS2-10GE-1-1.switch.ch (130.59.36.205) 4 ms 4 ms 4 ms3 swiCE2-10GE-1-3.switch.ch (130.59.37.1) 5 ms 4 ms 4 ms4 * * *5 * * *6 * * *7 * * *8 * * *9 * * *10 * * *11 * * *12 * * *
18
TRACEROUTE: ROUTING PROBLEMS WHERE?
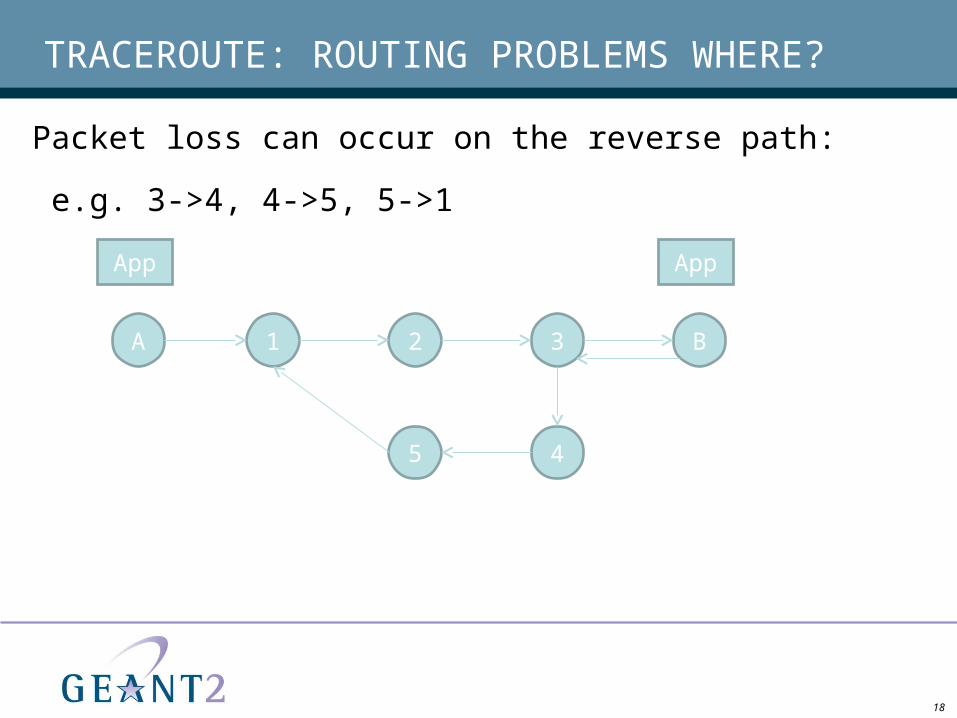
Packet loss can occur on the reverse path:
e.g. 3->4, 4->5, 5->1
A 1 2 3 B
45
AppApp
19
TRACEROUTE: LIMITATIONS (1)
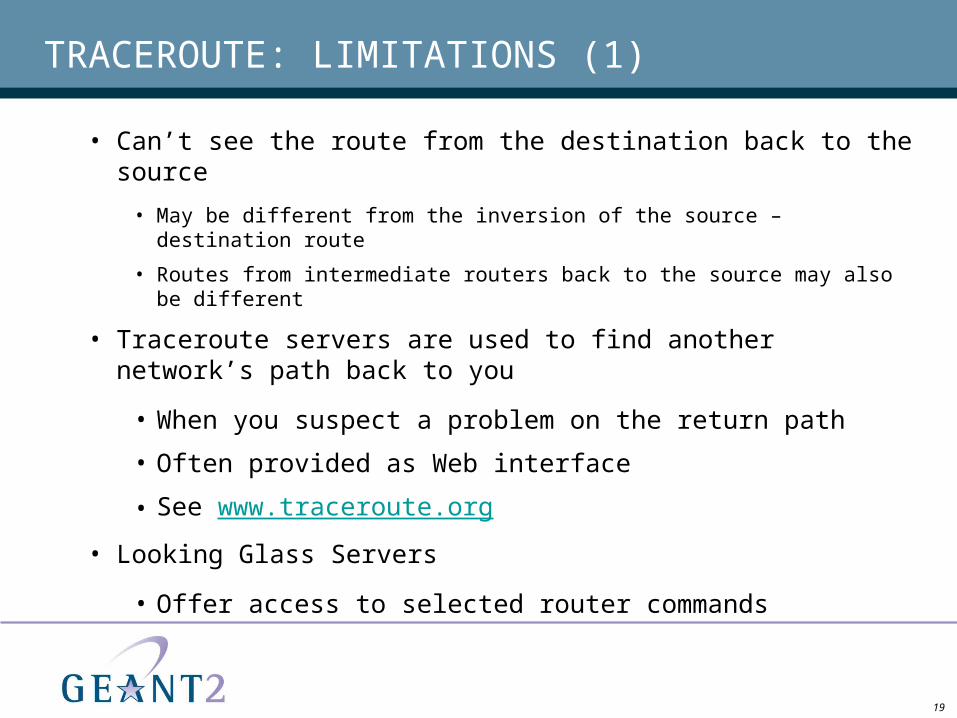
• Can’t see the route from the destination back to the source
• May be different from the inversion of the source – destination route
• Routes from intermediate routers back to the source may also be different
• Traceroute servers are used to find another network’s path back to you
• When you suspect a problem on the return path
• Often provided as Web interface
• See www.traceroute.org
• Looking Glass Servers
• Offer access to selected router commands
20
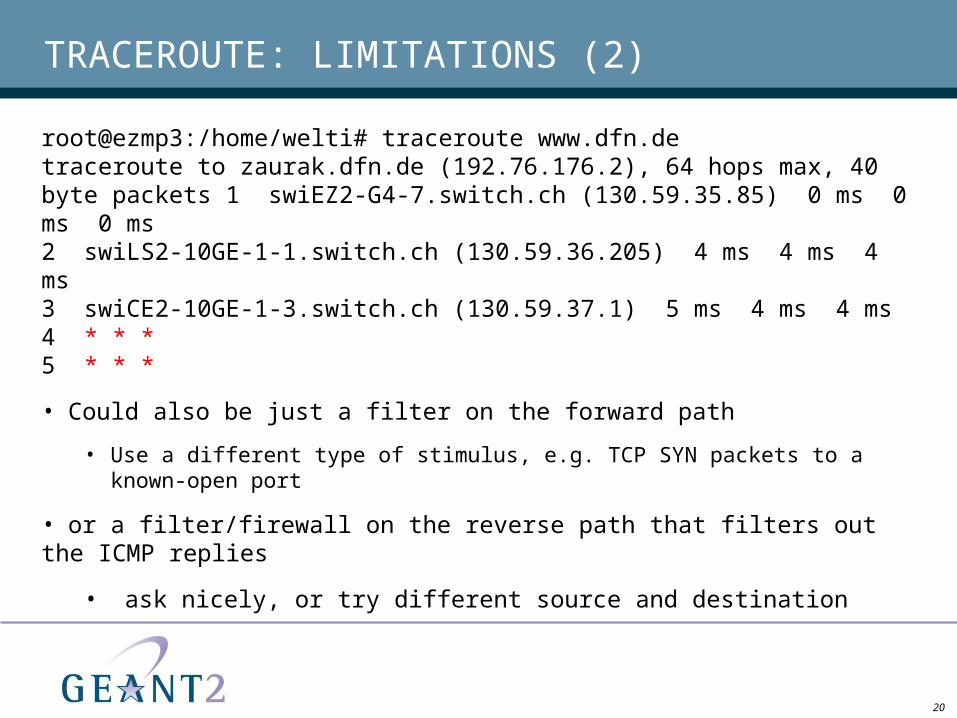
TRACEROUTE: LIMITATIONS (2)
root@ezmp3:/home/welti# traceroute www.dfn.detraceroute to zaurak.dfn.de (192.76.176.2), 64 hops max, 40 byte packets 1 swiEZ2-G4-7.switch.ch (130.59.35.85) 0 ms 0 ms 0 ms2 swiLS2-10GE-1-1.switch.ch (130.59.36.205) 4 ms 4 ms 4 ms3 swiCE2-10GE-1-3.switch.ch (130.59.37.1) 5 ms 4 ms 4 ms4 * * *5 * * *
• Could also be just a filter on the forward path
• Use a different type of stimulus, e.g. TCP SYN packets to a known-open port
• or a filter/firewall on the reverse path that filters out the ICMP replies
• ask nicely, or try different source and destination
21
TRACEROUTE: LIMITATIONS (3)
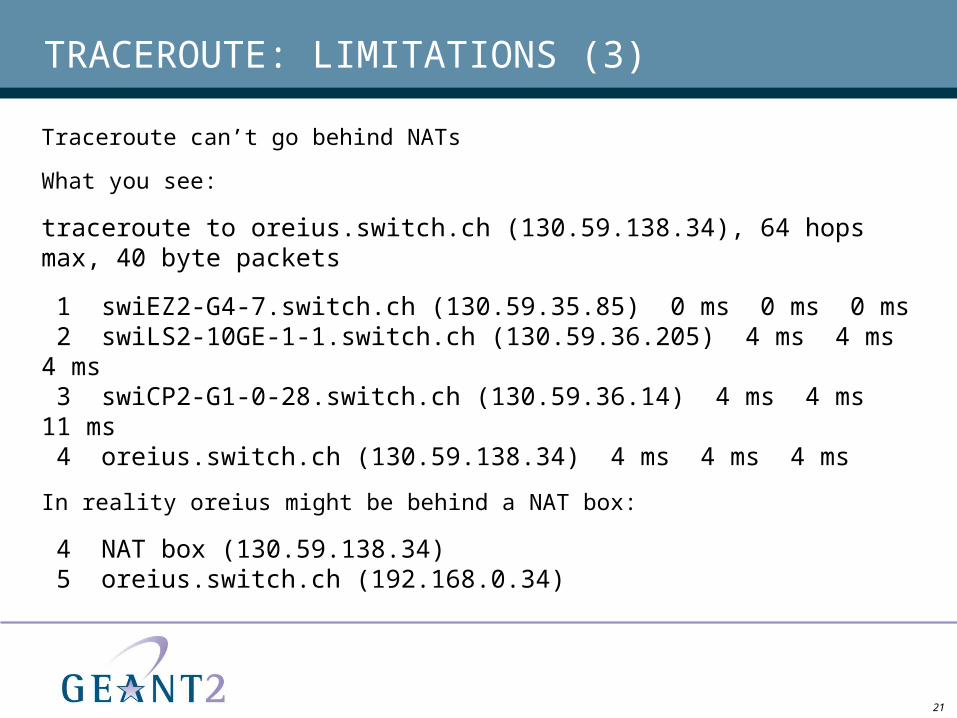
Traceroute can’t go behind NATs
What you see:
traceroute to oreius.switch.ch (130.59.138.34), 64 hops max, 40 byte packets
1 swiEZ2-G4-7.switch.ch (130.59.35.85) 0 ms 0 ms 0 ms 2 swiLS2-10GE-1-1.switch.ch (130.59.36.205) 4 ms 4 ms 4 ms 3 swiCP2-G1-0-28.switch.ch (130.59.36.14) 4 ms 4 ms 11 ms 4 oreius.switch.ch (130.59.138.34) 4 ms 4 ms 4 ms
In reality oreius might be behind a NAT box:
4 NAT box (130.59.138.34) 5 oreius.switch.ch (192.168.0.34)

22
TRACEROUTE: LIMITATIONS (4)
Traceroute can’t see layer 2 devices (switches, middleboxes, firewalls)
What you see:
traceroute to oreius.switch.ch (130.59.138.34), 64 hops max, 40 byte packets
1 swiEZ2-G4-7.switch.ch (130.59.35.85) 0 ms 0 ms 0 ms 2 swiLS2-10GE-1-1.switch.ch (130.59.36.205) 4 ms 4 ms 4 ms 3 swiCP2-G1-0-28.switch.ch (130.59.36.14) 4 ms 4 ms 11 ms 4 oreius.switch.ch (130.59.138.34) 4 ms 4 ms 4 ms
In reality oreius might be behind a couple of switches or a layer 2 firewall:
4 core switch 5 distribution switch 6 access switch 7 oreius.switch.ch (192.168.0.34)
23
TRACEROUTE: LIMITATIONS (5)
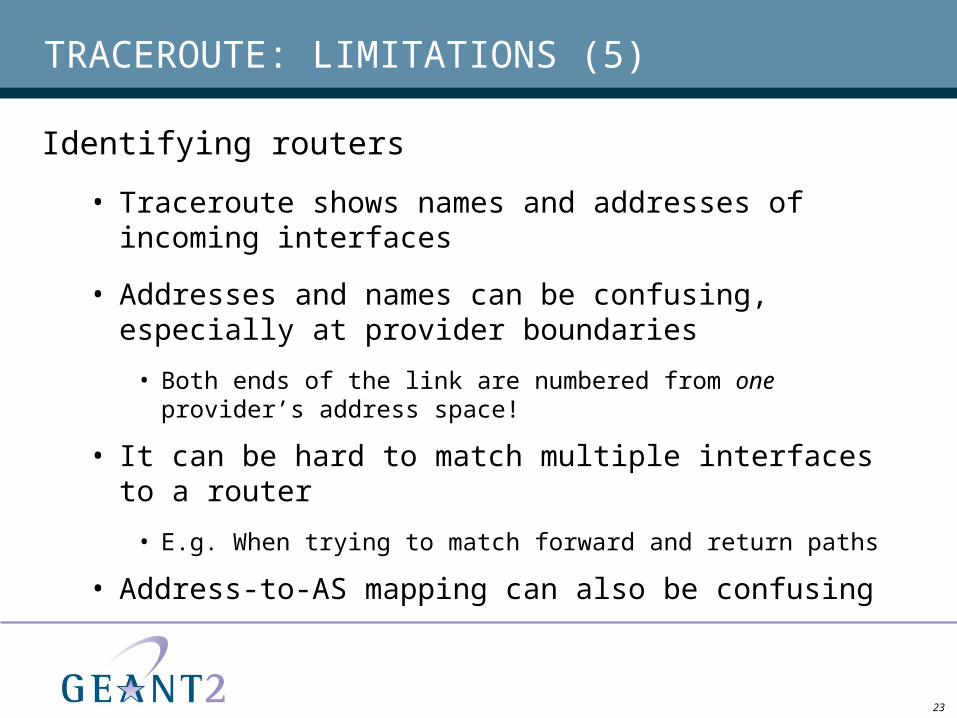
Identifying routers
• Traceroute shows names and addresses of incoming interfaces
• Addresses and names can be confusing, especially at provider boundaries
• Both ends of the link are numbered from one provider’s address space!
• It can be hard to match multiple interfaces to a router
• E.g. When trying to match forward and return paths
• Address-to-AS mapping can also be confusing
24
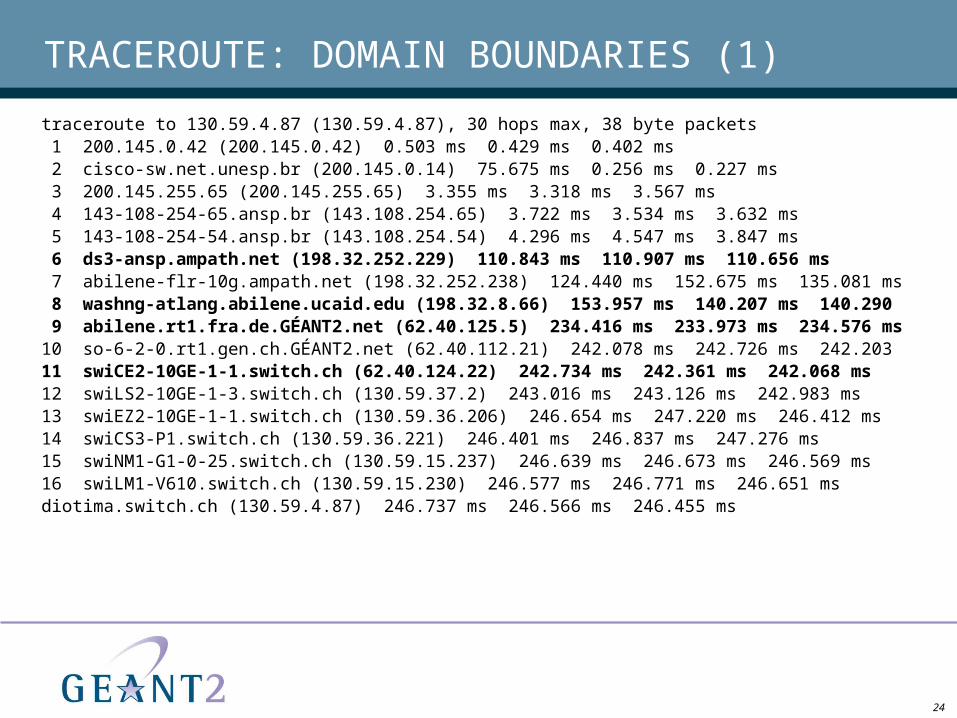
TRACEROUTE: DOMAIN BOUNDARIES (1)
traceroute to 130.59.4.87 (130.59.4.87), 30 hops max, 38 byte packets 1 200.145.0.42 (200.145.0.42) 0.503 ms 0.429 ms 0.402 ms 2 cisco-sw.net.unesp.br (200.145.0.14) 75.675 ms 0.256 ms 0.227 ms 3 200.145.255.65 (200.145.255.65) 3.355 ms 3.318 ms 3.567 ms 4 143-108-254-65.ansp.br (143.108.254.65) 3.722 ms 3.534 ms 3.632 ms 5 143-108-254-54.ansp.br (143.108.254.54) 4.296 ms 4.547 ms 3.847 ms 6 ds3-ansp.ampath.net (198.32.252.229) 110.843 ms 110.907 ms 110.656 ms 7 abilene-flr-10g.ampath.net (198.32.252.238) 124.440 ms 152.675 ms 135.081 ms 8 washng-atlang.abilene.ucaid.edu (198.32.8.66) 153.957 ms 140.207 ms 140.290 9 abilene.rt1.fra.de.GÉANT2.net (62.40.125.5) 234.416 ms 233.973 ms 234.576 ms10 so-6-2-0.rt1.gen.ch.GÉANT2.net (62.40.112.21) 242.078 ms 242.726 ms 242.20311 swiCE2-10GE-1-1.switch.ch (62.40.124.22) 242.734 ms 242.361 ms 242.068 ms12 swiLS2-10GE-1-3.switch.ch (130.59.37.2) 243.016 ms 243.126 ms 242.983 ms13 swiEZ2-10GE-1-1.switch.ch (130.59.36.206) 246.654 ms 247.220 ms 246.412 ms14 swiCS3-P1.switch.ch (130.59.36.221) 246.401 ms 246.837 ms 247.276 ms15 swiNM1-G1-0-25.switch.ch (130.59.15.237) 246.639 ms 246.673 ms 246.569 ms16 swiLM1-V610.switch.ch (130.59.15.230) 246.577 ms 246.771 ms 246.651 msdiotima.switch.ch (130.59.4.87) 246.737 ms 246.566 ms 246.455 ms
25
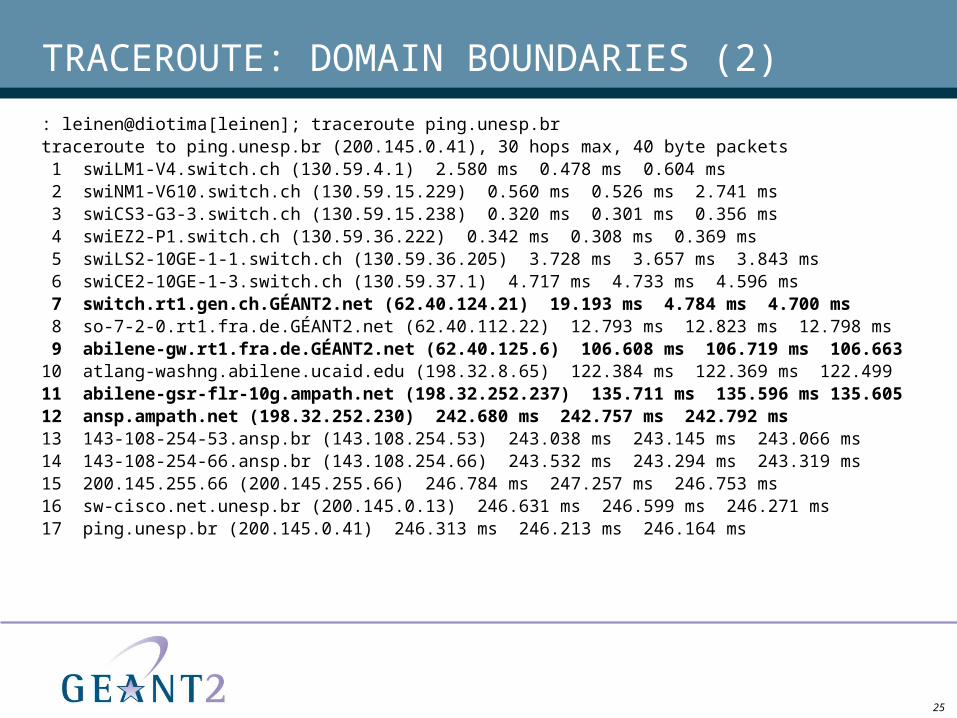
TRACEROUTE: DOMAIN BOUNDARIES (2)
: leinen@diotima[leinen]; traceroute ping.unesp.brtraceroute to ping.unesp.br (200.145.0.41), 30 hops max, 40 byte packets 1 swiLM1-V4.switch.ch (130.59.4.1) 2.580 ms 0.478 ms 0.604 ms 2 swiNM1-V610.switch.ch (130.59.15.229) 0.560 ms 0.526 ms 2.741 ms 3 swiCS3-G3-3.switch.ch (130.59.15.238) 0.320 ms 0.301 ms 0.356 ms 4 swiEZ2-P1.switch.ch (130.59.36.222) 0.342 ms 0.308 ms 0.369 ms 5 swiLS2-10GE-1-1.switch.ch (130.59.36.205) 3.728 ms 3.657 ms 3.843 ms 6 swiCE2-10GE-1-3.switch.ch (130.59.37.1) 4.717 ms 4.733 ms 4.596 ms 7 switch.rt1.gen.ch.GÉANT2.net (62.40.124.21) 19.193 ms 4.784 ms 4.700 ms 8 so-7-2-0.rt1.fra.de.GÉANT2.net (62.40.112.22) 12.793 ms 12.823 ms 12.798 ms 9 abilene-gw.rt1.fra.de.GÉANT2.net (62.40.125.6) 106.608 ms 106.719 ms 106.663 10 atlang-washng.abilene.ucaid.edu (198.32.8.65) 122.384 ms 122.369 ms 122.499 11 abilene-gsr-flr-10g.ampath.net (198.32.252.237) 135.711 ms 135.596 ms 135.60512 ansp.ampath.net (198.32.252.230) 242.680 ms 242.757 ms 242.792 ms13 143-108-254-53.ansp.br (143.108.254.53) 243.038 ms 243.145 ms 243.066 ms14 143-108-254-66.ansp.br (143.108.254.66) 243.532 ms 243.294 ms 243.319 ms15 200.145.255.66 (200.145.255.66) 246.784 ms 247.257 ms 246.753 ms16 sw-cisco.net.unesp.br (200.145.0.13) 246.631 ms 246.599 ms 246.271 ms17 ping.unesp.br (200.145.0.41) 246.313 ms 246.213 ms 246.164 ms
26
PLEASE POPULATE DNS INVERSE MAPPINGS
Generate inverse zones from forward zones
• This can be done automatically
• Especially useful for IPv6 (where hand-inverting is very hard)
• Include neighbour interfaces (see below)
• Let each end of an inter-domain link choose the name for their end
• That way, traceroute hops identify routers, not links (more useful)
27
PATHCHAR (PER HOP BANDWIDTH)
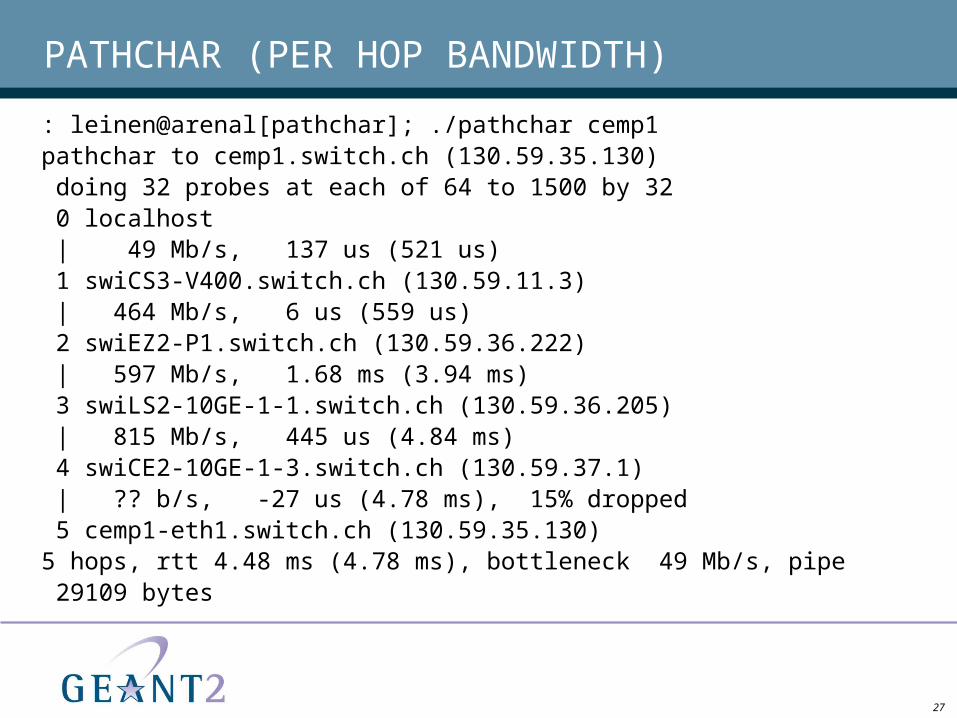
: leinen@arenal[pathchar]; ./pathchar cemp1pathchar to cemp1.switch.ch (130.59.35.130) doing 32 probes at each of 64 to 1500 by 32 0 localhost | 49 Mb/s, 137 us (521 us) 1 swiCS3-V400.switch.ch (130.59.11.3) | 464 Mb/s, 6 us (559 us) 2 swiEZ2-P1.switch.ch (130.59.36.222) | 597 Mb/s, 1.68 ms (3.94 ms) 3 swiLS2-10GE-1-1.switch.ch (130.59.36.205) | 815 Mb/s, 445 us (4.84 ms) 4 swiCE2-10GE-1-3.switch.ch (130.59.37.1) | ?? b/s, -27 us (4.78 ms), 15% dropped 5 cemp1-eth1.switch.ch (130.59.35.130)5 hops, rtt 4.48 ms (4.78 ms), bottleneck 49 Mb/s, pipe 29109 bytes

28
IPERF (1)
iperf:
• Most used tool in PERT cases
• Measurement of end-to-end network performance
• Memory-to-memory TCP or UDP data transfers
• iperf must be installed at both ends of the link
29
IPERF (2)
What statistics does iperf measure?
• TCP
• Throughput
• UDP
• “Receivable” Throughput
• Jitter
• Lost / total datagrams

30
IPERF TCP EXAMPLES
Server:
welti@atitlan:~$ iperf -s------------------------------------------------------------Server listening on TCP port 5001TCP window size: 171 KByte (default)------------------------------------------------------------[ 4] local 130.59.31.2 port 5001 connected with 130.59.35.86 port 39696[ 4] 0.0-10.0 sec 1.11 GBytes 953 Mbits/sec
Client:
welti@ezmp3:~$ iperf -c atitlan------------------------------------------------------------Client connecting to atitlan, TCP port 5001TCP window size: 4.00 MByte (default)------------------------------------------------------------[ 3] local 130.59.35.86 port 39693 connected with 130.59.31.2 port 5001[ 3] 0.0-10.0 sec 1.12 GBytes 960 Mbits/sec
31
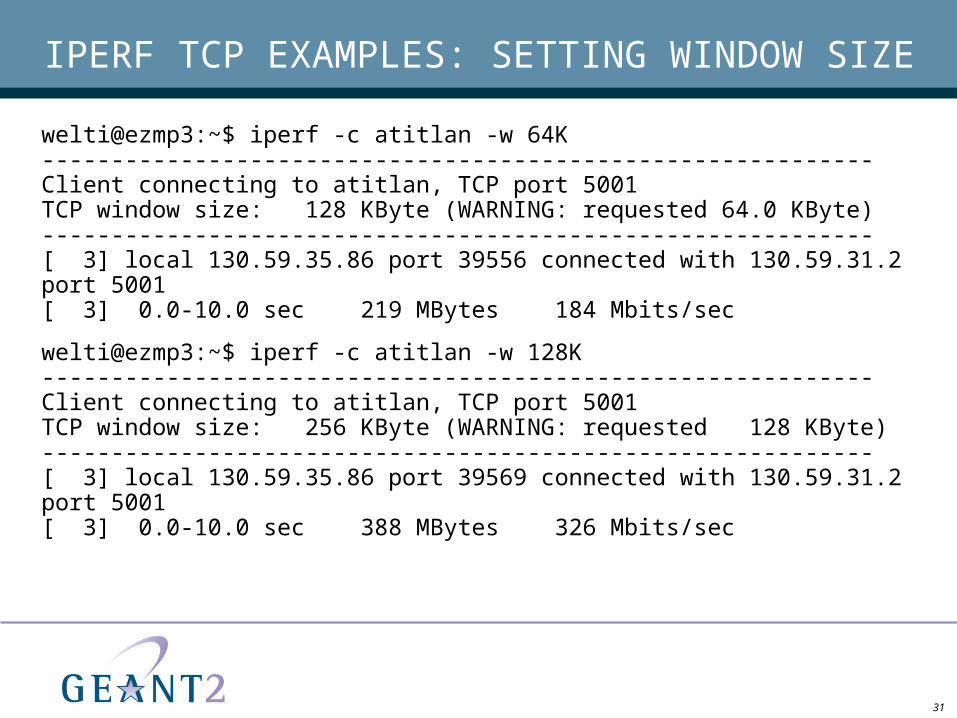
IPERF TCP EXAMPLES: SETTING WINDOW SIZE
welti@ezmp3:~$ iperf -c atitlan -w 64K------------------------------------------------------------Client connecting to atitlan, TCP port 5001TCP window size: 128 KByte (WARNING: requested 64.0 KByte)------------------------------------------------------------[ 3] local 130.59.35.86 port 39556 connected with 130.59.31.2 port 5001[ 3] 0.0-10.0 sec 219 MBytes 184 Mbits/sec
welti@ezmp3:~$ iperf -c atitlan -w 128K------------------------------------------------------------Client connecting to atitlan, TCP port 5001TCP window size: 256 KByte (WARNING: requested 128 KByte)------------------------------------------------------------[ 3] local 130.59.35.86 port 39569 connected with 130.59.31.2 port 5001[ 3] 0.0-10.0 sec 388 MBytes 326 Mbits/sec
32
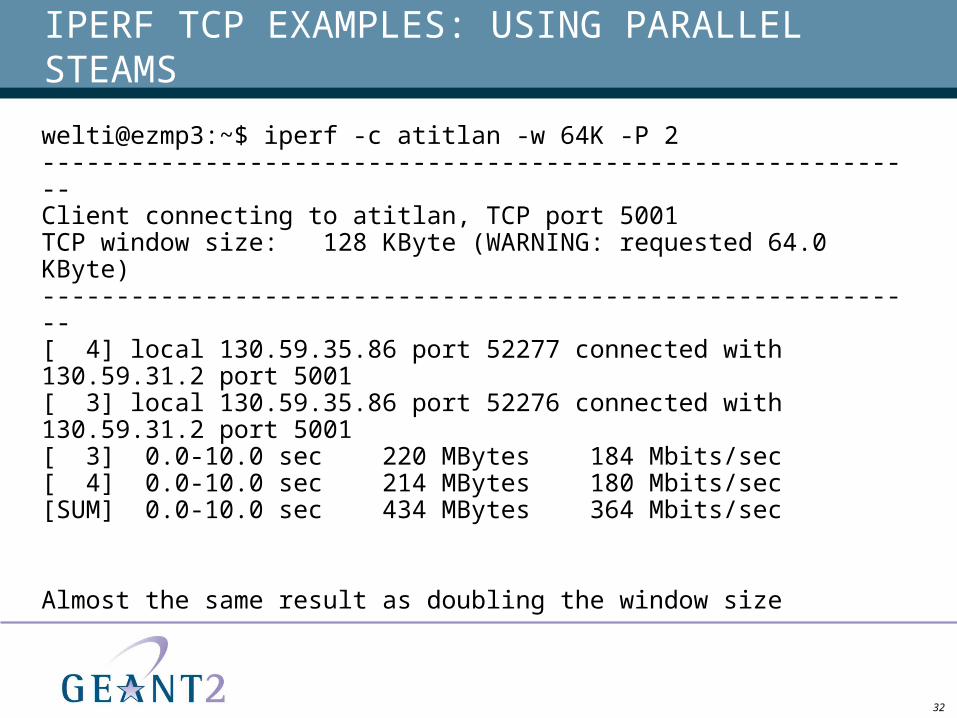
IPERF TCP EXAMPLES: USING PARALLEL STEAMS
welti@ezmp3:~$ iperf -c atitlan -w 64K -P 2------------------------------------------------------------Client connecting to atitlan, TCP port 5001TCP window size: 128 KByte (WARNING: requested 64.0 KByte)------------------------------------------------------------[ 4] local 130.59.35.86 port 52277 connected with 130.59.31.2 port 5001[ 3] local 130.59.35.86 port 52276 connected with 130.59.31.2 port 5001[ 3] 0.0-10.0 sec 220 MBytes 184 Mbits/sec[ 4] 0.0-10.0 sec 214 MBytes 180 Mbits/sec[SUM] 0.0-10.0 sec 434 MBytes 364 Mbits/sec
Almost the same result as doubling the window size
33
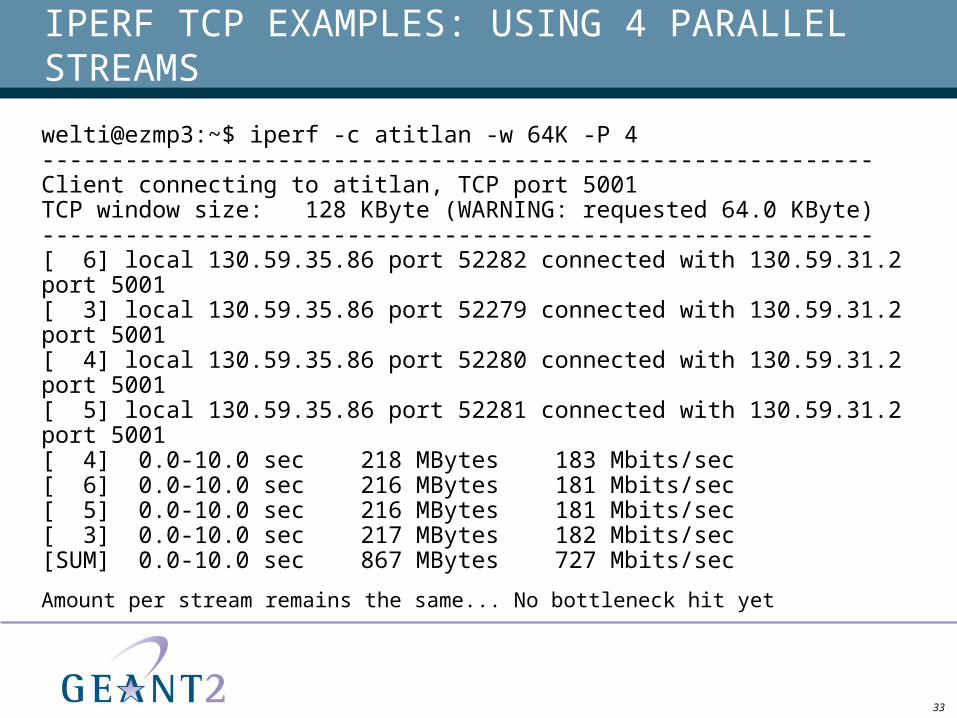
IPERF TCP EXAMPLES: USING 4 PARALLEL STREAMS
welti@ezmp3:~$ iperf -c atitlan -w 64K -P 4------------------------------------------------------------Client connecting to atitlan, TCP port 5001TCP window size: 128 KByte (WARNING: requested 64.0 KByte)------------------------------------------------------------[ 6] local 130.59.35.86 port 52282 connected with 130.59.31.2 port 5001[ 3] local 130.59.35.86 port 52279 connected with 130.59.31.2 port 5001[ 4] local 130.59.35.86 port 52280 connected with 130.59.31.2 port 5001[ 5] local 130.59.35.86 port 52281 connected with 130.59.31.2 port 5001[ 4] 0.0-10.0 sec 218 MBytes 183 Mbits/sec[ 6] 0.0-10.0 sec 216 MBytes 181 Mbits/sec[ 5] 0.0-10.0 sec 216 MBytes 181 Mbits/sec[ 3] 0.0-10.0 sec 217 MBytes 182 Mbits/sec[SUM] 0.0-10.0 sec 867 MBytes 727 Mbits/sec
Amount per stream remains the same... No bottleneck hit yet
34
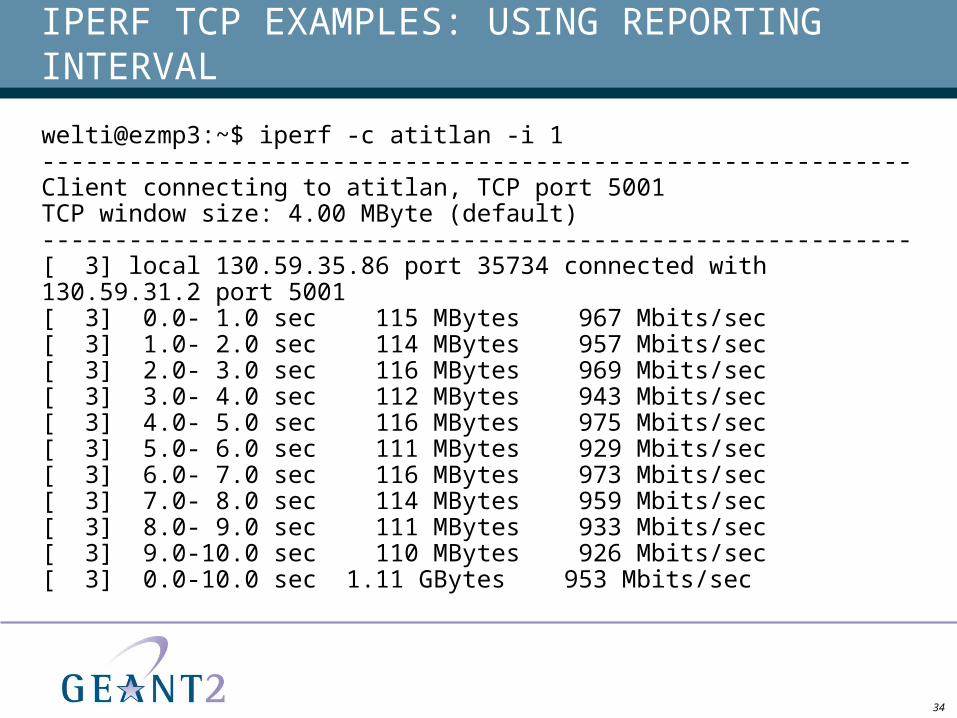
IPERF TCP EXAMPLES: USING REPORTING INTERVAL
welti@ezmp3:~$ iperf -c atitlan -i 1------------------------------------------------------------Client connecting to atitlan, TCP port 5001TCP window size: 4.00 MByte (default)------------------------------------------------------------[ 3] local 130.59.35.86 port 35734 connected with 130.59.31.2 port 5001[ 3] 0.0- 1.0 sec 115 MBytes 967 Mbits/sec[ 3] 1.0- 2.0 sec 114 MBytes 957 Mbits/sec[ 3] 2.0- 3.0 sec 116 MBytes 969 Mbits/sec[ 3] 3.0- 4.0 sec 112 MBytes 943 Mbits/sec[ 3] 4.0- 5.0 sec 116 MBytes 975 Mbits/sec[ 3] 5.0- 6.0 sec 111 MBytes 929 Mbits/sec[ 3] 6.0- 7.0 sec 116 MBytes 973 Mbits/sec[ 3] 7.0- 8.0 sec 114 MBytes 959 Mbits/sec[ 3] 8.0- 9.0 sec 111 MBytes 933 Mbits/sec[ 3] 9.0-10.0 sec 110 MBytes 926 Mbits/sec[ 3] 0.0-10.0 sec 1.11 GBytes 953 Mbits/sec
35
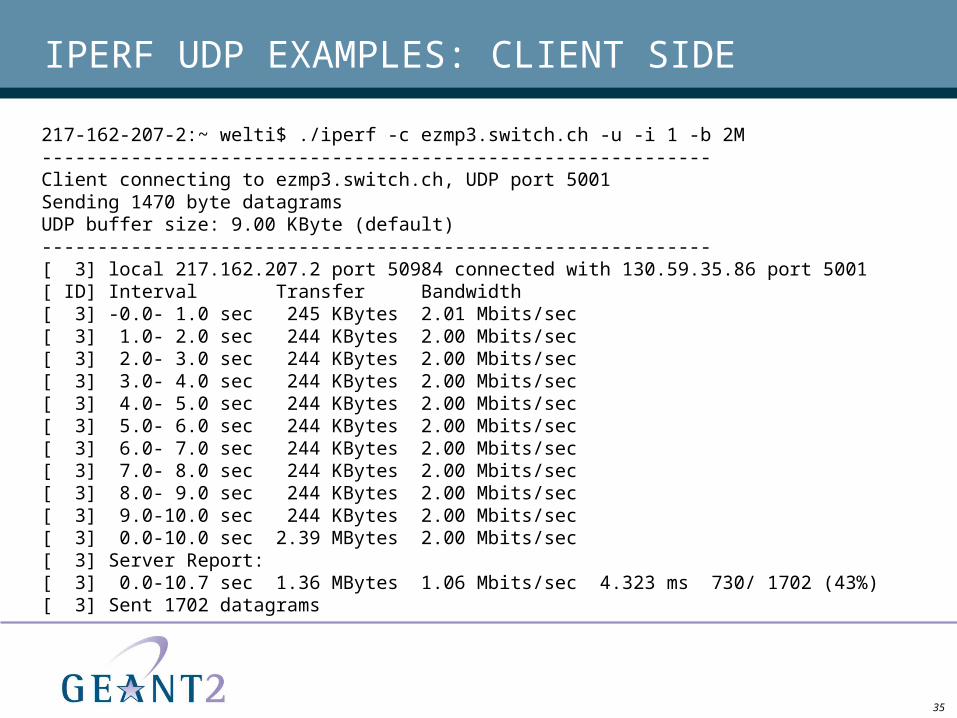
IPERF UDP EXAMPLES: CLIENT SIDE
217-162-207-2:~ welti$ ./iperf -c ezmp3.switch.ch -u -i 1 -b 2M------------------------------------------------------------Client connecting to ezmp3.switch.ch, UDP port 5001Sending 1470 byte datagramsUDP buffer size: 9.00 KByte (default)------------------------------------------------------------[ 3] local 217.162.207.2 port 50984 connected with 130.59.35.86 port 5001[ ID] Interval Transfer Bandwidth[ 3] -0.0- 1.0 sec 245 KBytes 2.01 Mbits/sec[ 3] 1.0- 2.0 sec 244 KBytes 2.00 Mbits/sec[ 3] 2.0- 3.0 sec 244 KBytes 2.00 Mbits/sec[ 3] 3.0- 4.0 sec 244 KBytes 2.00 Mbits/sec[ 3] 4.0- 5.0 sec 244 KBytes 2.00 Mbits/sec[ 3] 5.0- 6.0 sec 244 KBytes 2.00 Mbits/sec[ 3] 6.0- 7.0 sec 244 KBytes 2.00 Mbits/sec[ 3] 7.0- 8.0 sec 244 KBytes 2.00 Mbits/sec[ 3] 8.0- 9.0 sec 244 KBytes 2.00 Mbits/sec[ 3] 9.0-10.0 sec 244 KBytes 2.00 Mbits/sec[ 3] 0.0-10.0 sec 2.39 MBytes 2.00 Mbits/sec[ 3] Server Report:[ 3] 0.0-10.7 sec 1.36 MBytes 1.06 Mbits/sec 4.323 ms 730/ 1702 (43%)[ 3] Sent 1702 datagrams
36
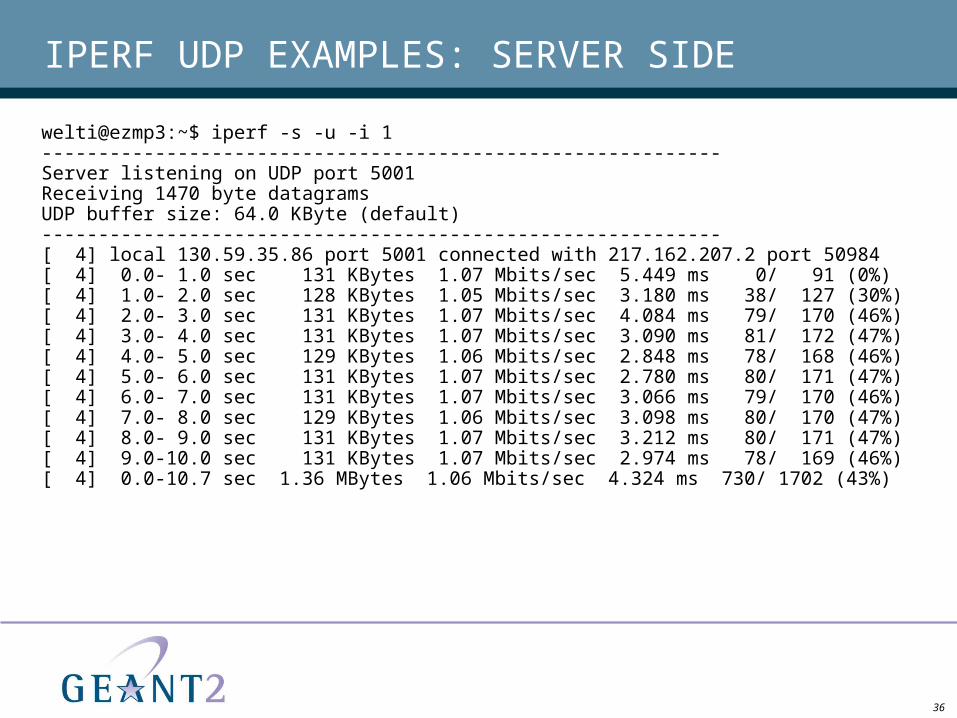
IPERF UDP EXAMPLES: SERVER SIDE
welti@ezmp3:~$ iperf -s -u -i 1------------------------------------------------------------Server listening on UDP port 5001Receiving 1470 byte datagramsUDP buffer size: 64.0 KByte (default)------------------------------------------------------------[ 4] local 130.59.35.86 port 5001 connected with 217.162.207.2 port 50984[ 4] 0.0- 1.0 sec 131 KBytes 1.07 Mbits/sec 5.449 ms 0/ 91 (0%)[ 4] 1.0- 2.0 sec 128 KBytes 1.05 Mbits/sec 3.180 ms 38/ 127 (30%)[ 4] 2.0- 3.0 sec 131 KBytes 1.07 Mbits/sec 4.084 ms 79/ 170 (46%)[ 4] 3.0- 4.0 sec 131 KBytes 1.07 Mbits/sec 3.090 ms 81/ 172 (47%)[ 4] 4.0- 5.0 sec 129 KBytes 1.06 Mbits/sec 2.848 ms 78/ 168 (46%)[ 4] 5.0- 6.0 sec 131 KBytes 1.07 Mbits/sec 2.780 ms 80/ 171 (47%)[ 4] 6.0- 7.0 sec 131 KBytes 1.07 Mbits/sec 3.066 ms 79/ 170 (46%)[ 4] 7.0- 8.0 sec 129 KBytes 1.06 Mbits/sec 3.098 ms 80/ 170 (47%)[ 4] 8.0- 9.0 sec 131 KBytes 1.07 Mbits/sec 3.212 ms 80/ 171 (47%)[ 4] 9.0-10.0 sec 131 KBytes 1.07 Mbits/sec 2.974 ms 78/ 169 (46%)[ 4] 0.0-10.7 sec 1.36 MBytes 1.06 Mbits/sec 4.324 ms 730/ 1702 (43%)
37
IPERF: PURPOSE
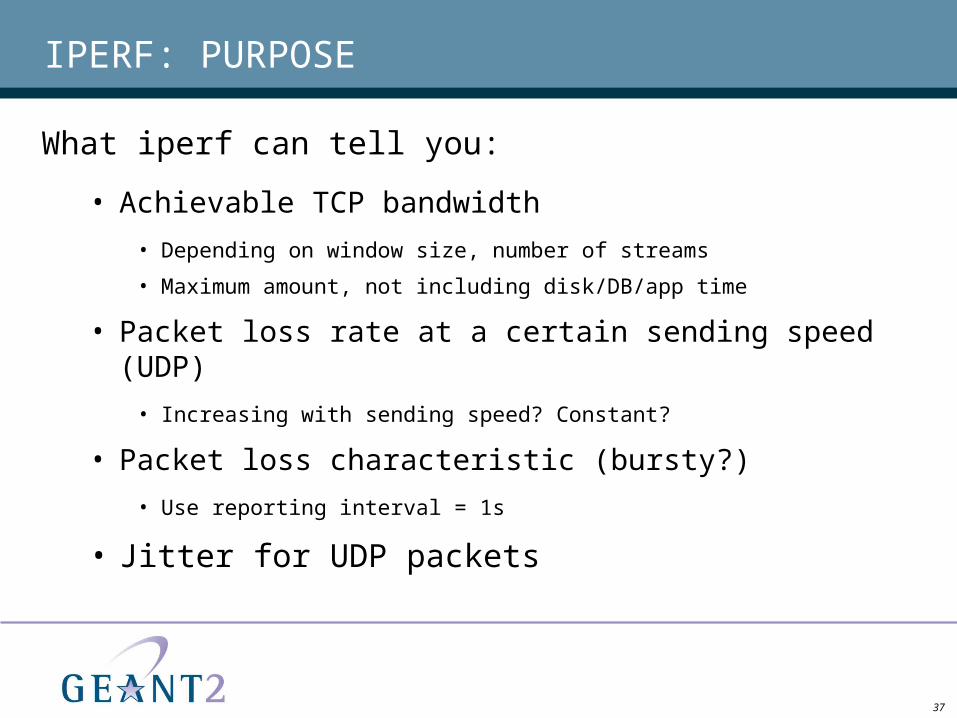
What iperf can tell you:
• Achievable TCP bandwidth
• Depending on window size, number of streams
• Maximum amount, not including disk/DB/app time
• Packet loss rate at a certain sending speed (UDP)
• Increasing with sending speed? Constant?
• Packet loss characteristic (bursty?)
• Use reporting interval = 1s
• Jitter for UDP packets
38
EVERYDAY IPERF USAGE
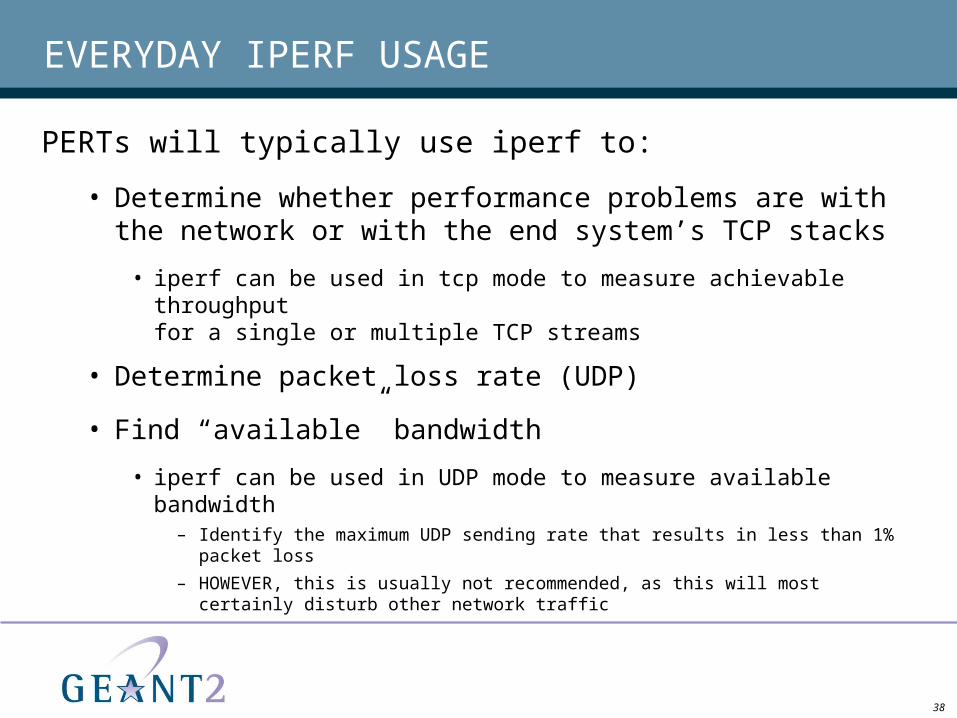
PERTs will typically use iperf to:
• Determine whether performance problems are with the network or with the end system’s TCP stacks
• iperf can be used in tcp mode to measure achievable throughputfor a single or multiple TCP streams
• Determine packet loss rate (UDP)
• Find “available” bandwidth
• iperf can be used in UDP mode to measure available bandwidth– Identify the maximum UDP sending rate that results in less than 1% packet loss
– HOWEVER, this is usually not recommended, as this will most certainly disturb other network traffic
39
LIMITATIONS OF IPERF (1)
Trust only the results on the server side
• sender returns before all data is sent (still in TCP stack)
• Stops sending after amount of seconds
• only receiver can tell when transfer really finished
• amount of data is the same, but duration different
• only receiver knows lost packets (UDP)
40
LIMITATIONS OF IPERF (2)
Counter overflow in iperf reports:
• In some versions, iperf reports suffer from 32-bit integer overflow. This can lead to average throughput being displayed incorrectly.
TCP buffer allocation:
• Linux allocates twice the requested amount whensetting a window size with the –w option
Options must be in the right order:
• Make sure that –s or –c are your first options
41
BANDWIDTH TEST CONTROLLER (BWCTL)
What is BWCTL?
• Stands for Bandwidth Test Controller
• Command line application that wraps iperf
• Includes scheduling and policy daemon
• Initiates and reports the results of iperf tests
• Developed by Internet2
Determines which tests are allowable based upon the policy restrictions configured by the system administrator.
42
WHY WAS BWCTL DEVELOPED? (1)
Iperf is often used to investigate multi-domain network performance issues.
Iperf must be installed at both ends of the path you want to test.
To run an iperf test without BWCTL, you will need either:
• A user account at each end of the path
Or
• The NOC at each end of the path to set up the test for you

43
WHY WAS BWCTL DEVELOPED? (2)
With BWCTL installed, the NOC can create a security policy that stipulates who can run what sort of iperf tests using their hosts.
• You don’t need a user account on each host to run an iperf test
• NOC no longer has to set up each test
• Process is quicker and easier for the tester and the NOC
BWCTL will also ensure that simultaneous tests are not run
• Simultaneous test traffic can distort test results
44
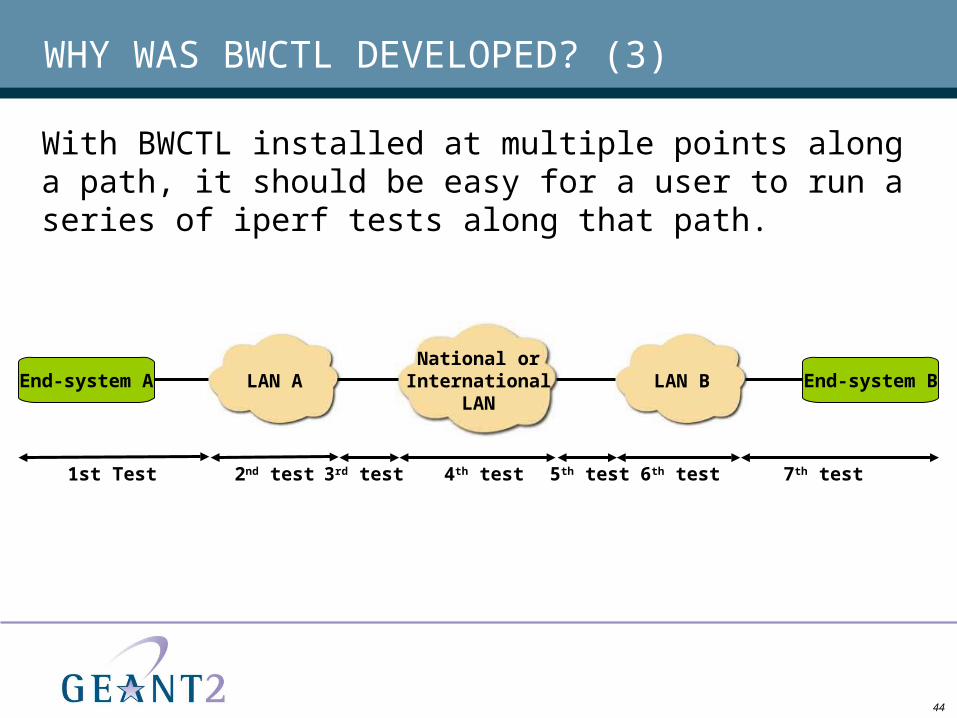
WHY WAS BWCTL DEVELOPED? (3)
With BWCTL installed at multiple points along a path, it should be easy for a user to run a series of iperf tests along that path.
LAN A LAN BEnd-system A End-system BNational or
InternationalLAN
1st Test 2nd test 3rd test 4th test 5th test 6th test 7th test
45
HOW DOES BWCTL WORK? (1)
Under BWCTL:
• Network administrators can configure hosts as iperf endpoints
• Hosts can be iperf clients (packet senders) or servers (packet receivers)
• BWCTL can contact iperf clients on different hosts to schedule and run a test
46
HOW DOES BWCTL WORK? (2)
BWCTL classifies an incoming connection by:
• User name and AES key combination
Or
• IP / netmask
Once the incoming connection is classified, BWCTL determines what types and intensities of tests are allowed.
BWCTL ensures that conflicting tests are not run at the same time.
47
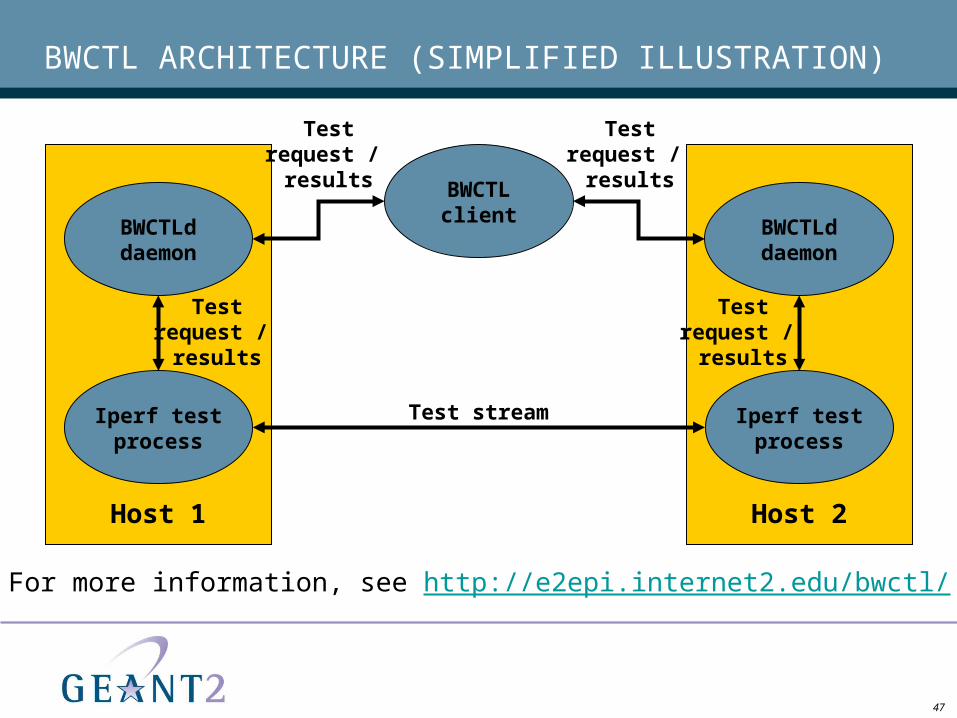
BWCTL ARCHITECTURE (SIMPLIFIED ILLUSTRATION)
BWCTLclient
BWCTLddaemon
Iperf testprocess
Host 1
BWCTLddaemon
Iperf testprocess
Host 2
Test stream
Testrequest /
results
Testrequest /
results
Testrequest /
results
Testrequest /
results
For more information, see http://e2epi.internet2.edu/bwctl/
48
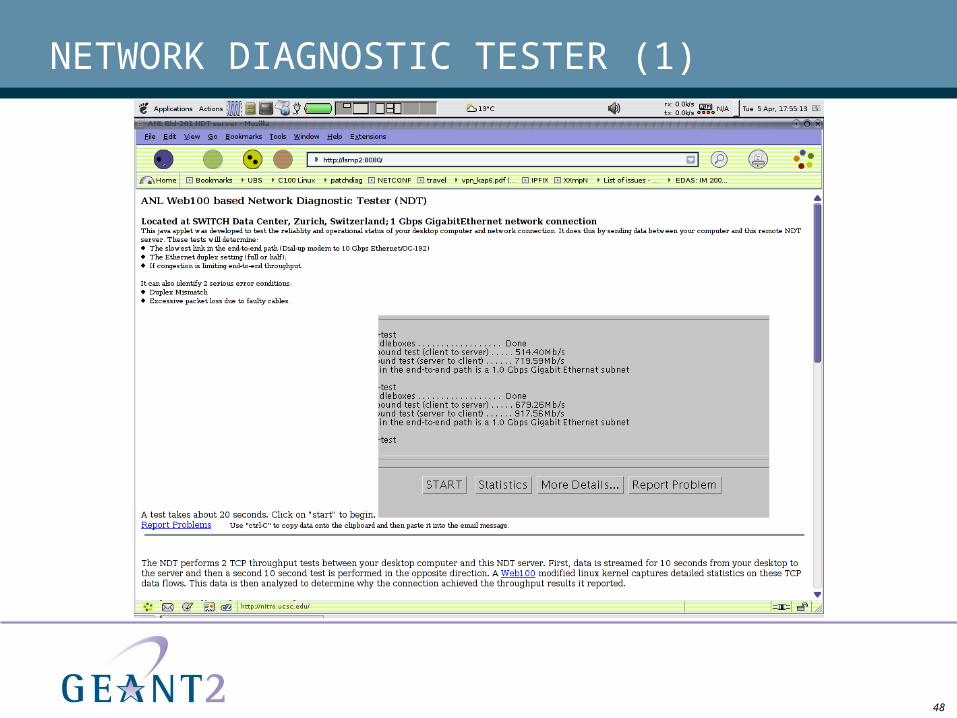
NETWORK DIAGNOSTIC TESTER (1)
49
NETWORK DIAGNOSTIC TESTER (2)
Network Diagnostic Tester (NDT):
• Web-based diagnostic tool for TCP configuration and connectivity
• Produced by the Web100 project (www.web100.org)
• Client-side:
• Java applet
• Server-side:• Simple TCP test (similar to iperf)• Gathers fine-grained TCP statistics using Web100 KIS
– requires patched Linux kernel on the server
• Analyzes these Web100 measurements and sends results to client applet
50
NETWORK DIAGNOSTIC TESTER (3)
Reports include
• Upstream/downstream rates achieved
• Probable bottlenecks (TCP buffers, network congestion)
• “Probable duplex mismatch” indication
• Lots of low-level statistics from Web100
51
NETWORK DIAGNOSTIC TESTER (4)
SWITCH’s experience of NDT:• NDT is an easy-to-use tool for end-users providing
interesting output
• Consider installing a well-connected NDT server in your network
• The Web100 patches didn't cause major problems for us, except they don't work with TOE (TCP Offload Engine) adapters such as some 10GE cards, and you cannot always use the latest Linux kernel version
• Works nicely with state-of-the art configurations (jumbo frames, SACK etc.) and helps identify problems with those features for remote users
SWITCH provides a server under ndt.switch.ch

52
ACTIVITIES
Case Study:
• Running a UDP iperf Test
Case Study:
• Running a TCP iperf Test
Exercise:
• Using an NDT Server
53
STREAM ANALYSIS WITH TCPDUMP (1)
tcpdump:
• An early TCP/IP diagnostic tool run from the command line
• Carries out passive monitoring
• Intercepts (‘sniffs’) packets transmitted over a network that match a particular expression
• Outputs flat file containing the packet headers
• Files are in libpcap format
• You can use the –s parameter to capture the payload and higher level protocols as well as the packet headers
54
STREAM ANALYSIS WITH TCPDUMP (2)
Filtering
• tcpdump can filter the packet headers that it captures by matching them against an expression.
• Understands Boolean search operators
• Can use the following as arguments:– Host name
– IP addresses
– Network names
– Protocols
– And others…
55
TCPDUMP FILTER EXPRESSIONS
You can append an expression to the command line to filter captured packets. This is made up of:
• type
• Can be host, net or port.host
• host is the default
• dir
• Can be src, dst, src or dst, src and dst
• Proto
• Stands for ‘protocol’
• Common types are ether, ip, tcp, udp, arp
• If not protocol is given, then all protocols are considered
56
TCPDUMP FILTER EXPRESSIONS – SOME EXAMPLES (1)
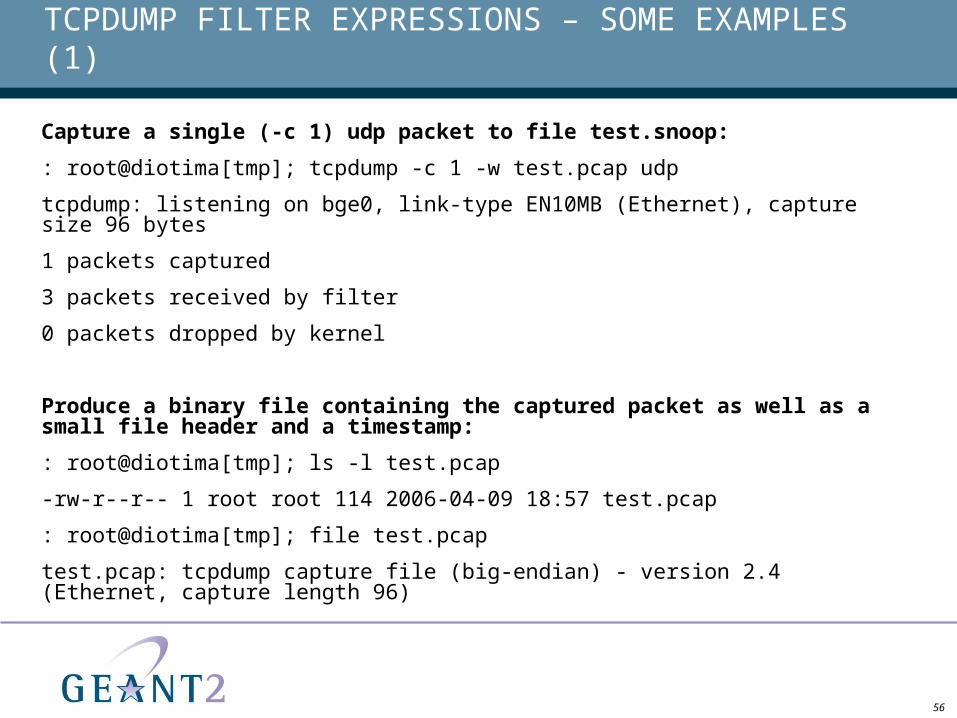
Capture a single (-c 1) udp packet to file test.snoop:
: root@diotima[tmp]; tcpdump -c 1 -w test.pcap udp
tcpdump: listening on bge0, link-type EN10MB (Ethernet), capture size 96 bytes
1 packets captured
3 packets received by filter
0 packets dropped by kernel
Produce a binary file containing the captured packet as well as a small file header and a timestamp:
: root@diotima[tmp]; ls -l test.pcap
-rw-r--r-- 1 root root 114 2006-04-09 18:57 test.pcap
: root@diotima[tmp]; file test.pcap
test.pcap: tcpdump capture file (big-endian) - version 2.4 (Ethernet, capture length 96)
57
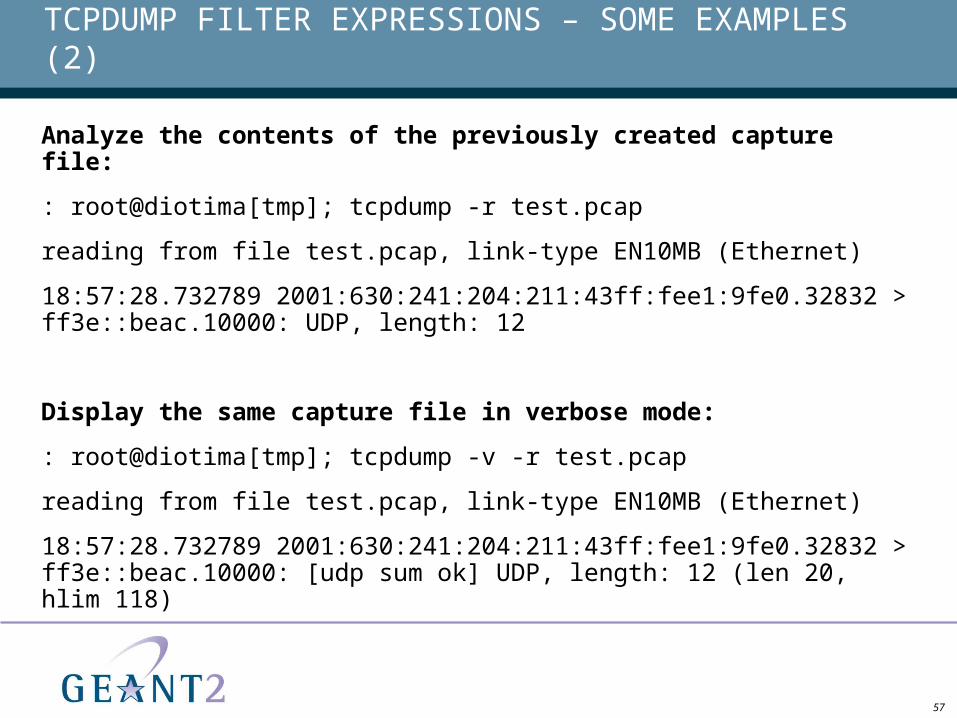
TCPDUMP FILTER EXPRESSIONS – SOME EXAMPLES (2)
Analyze the contents of the previously created capture file:
: root@diotima[tmp]; tcpdump -r test.pcap
reading from file test.pcap, link-type EN10MB (Ethernet)
18:57:28.732789 2001:630:241:204:211:43ff:fee1:9fe0.32832 > ff3e::beac.10000: UDP, length: 12
Display the same capture file in verbose mode:
: root@diotima[tmp]; tcpdump -v -r test.pcap
reading from file test.pcap, link-type EN10MB (Ethernet)
18:57:28.732789 2001:630:241:204:211:43ff:fee1:9fe0.32832 > ff3e::beac.10000: [udp sum ok] UDP, length: 12 (len 20, hlim 118)
58
TCPTRACE
What does Tcptrace do?
• Analyses TCP and UDP sessions captured with Tcpdump
• Provides statistics and information
• Supports several graphing options
Useful in diagnosing problems with TCP sessions.
59
TCPTRACE USAGE
Examples of Tcptrace usage:
• tcptrace trace.log
• Shows the sessions in a tcpdump log
• tcptrace –o3-4 –lrW trace.log
• Shows detailed information about sessions 3 and 4 (including long statistics, RTT information, window information etc.)

60
EXAMPLE TCPTRACE OUTPUT
TCP connection 3:
host e: elvis.tigo.cl:2199
host f: cemp1.switch.ch:2630
complete conn: yes
first packet: Fri Sep 29 11:03:12.044472 2006
last packet: Fri Sep 29 11:13:26.934554 2006
elapsed time: 0:10:14.890081
total packets: 559379
….
….
max win adv: 5991424 bytes
min win adv: 35840 bytes
avg win adv: 5977948 bytes
…
…
RTT samples: 2
RTT min: 281.4 ms
RTT max: 281.7 ms
RTT avg: 281.5 ms ……
61
WIRESHARK (1)
• Subsumes tcpdump's functionality
• Features graphical user interface
• You can ‘drill down’ into header structure of captured packets
• Extensible design
• Abundance of protocol “dissectors” even for new / exotic protocols
• Includes many useful analysis tools
• Works under Windows (requires WinPcap)
• Formerly called ‘Ethereal’

62
WIRESHARK (2)
63
WIRESHARK AND TCPDUMP
You can use Wireshark and tcpdump together:
• Use tcpdump (possibly remotely) to capture packets to .pcap file
• Analyze later using Ethereal
• Ethereal understands many other trace file formats (Solaris snoop etc.)
64
PACKET TRACES: HINTS AND TIPS (1)
Capture enough (you can always filter later)
• tcpdump's default capture length is small (96 bytes)
• use something like -s o if you are interested in payloads
• Seemingly unrelated traffic can impact performance
• E.g. Web pages from foo.example.com may load slowly because of the images from advertisements.example.net
• But may have to filter aggressively when there is a lot of background traffic
65
PACKET TRACES: HINTS AND TIPS (2)
Collecting on several points can be very useful
• On the endpoints of the communication
• Near “suspicious” intermediate points (firewall)
• Synchronized clocks (e.g. by NTP) are very useful for matching traces
Address-to-name resolution can slow display and causes traffic
• With tcpdump, consider using -n or tracing to file (-w file)
66
ACTIVITIES
Case Study:
• Using TCPDUMP to Capture ICMP Packets
Case Study:
• Using TCPDUMP and Wireshark Together
Case Study:
• Identifying the Effects of a Middlebox
Module 9: How Middleboxes Impact Performance
68
WHAT IS A MIDDLEBOX?
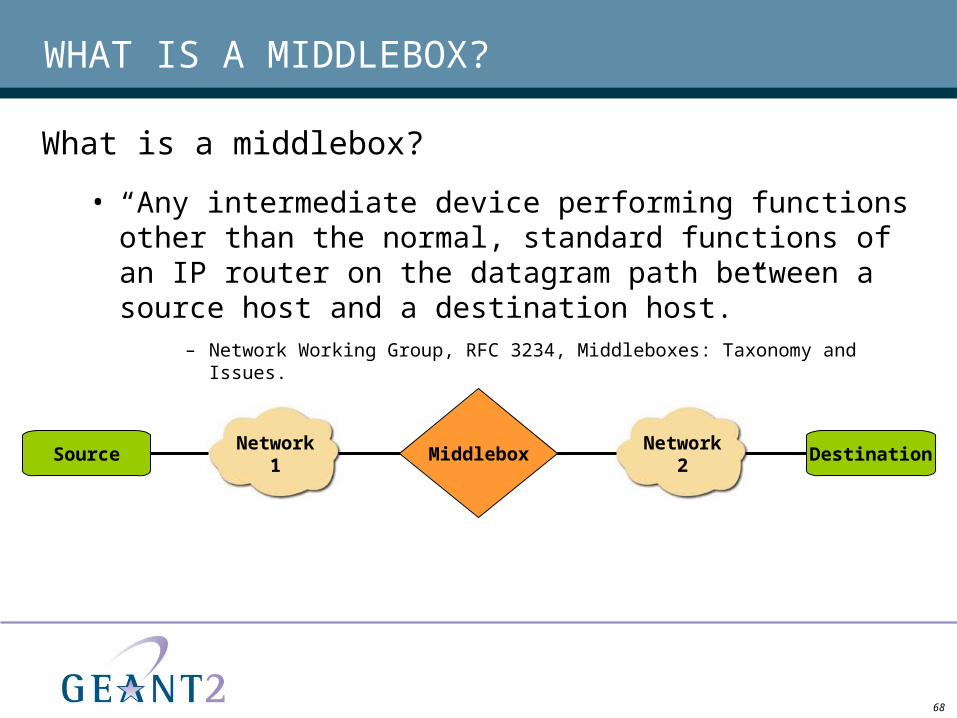
What is a middlebox?
• “Any intermediate device performing functions other than the normal, standard functions of an IP router on the datagram path between a source host and a destination host.”
– Network Working Group, RFC 3234, Middleboxes: Taxonomy and Issues.
Network1
Network2
Source Middlebox Destination
69
WHAT DO MIDDLEBOXES DO?
Middleboxes may:
• Drop, insert or modify packets.
• Terminate one IP packet flow and originate another.
• Transform or divert an IP packet flow in some way.
Middleboxes are never the ultimate end-system of an application session.
70
EXAMPLES OF MIDDLEBOXES
• Firewalls
• Network Address Translators
• Traffic Shapers
• Load Balancers

71
MIDDLEBOXES AND ‘CLASSIC’ TCP / IP
Traditionally:
• Networks have ceded control to the end-points of a connection.
• Only function carried out ‘in the middle’ was IP routing
Middleboxes change this:
• They spread functionality throughout the network.
72
WHAT ISSUES DO MIDDLEBOXES INTRODUCE?
Challenges represented by middleboxes:
• Networking protocols were not designed with middleboxes in mind.
• We have to deal with connections that are compromised by crashed middleboxes.
• Middleboxes are often hidden points of failure.
• Middleboxes may require configuration and management.
• You must take middleboxes into account when diagnosing network failures or poor performance.
• Some key services may not operate ‘through’ middleboxes (e.g. video conferencing)
73
FIREWALLS
A firewall is an agent that screens network traffic, blocking traffic that it believes to be inappropriate or dangerous.
Examples:
• Block telnet connections from the internet
• Block FTP connections to the internet from internal systems not authorised to send files
• Act as an intermediate server handling SMTP and HTTP connections
Can be divided into two categories:
• IP Firewalls
• Application Firewalls

74
FIREWALLS IN THE PATH: EXAMPLE
BackboneNetwork
NREN ANetwork
NREN BNetwork
Campus XNetwork
Campus YNetwork
Video conferenceconnection
Video conferenceconnection
Firewalls are potential obstacles to (UDP) media streams

75
IP FIREWALLS
Features of an IP firewall:
• Simplest form of firewall, usually contained in a router
• Inspects each individual packet’s IP and Transport headers. Decides whether to forward or discard based on configured policies. Examples:
• Disallows incoming traffic to certain port numbers
• Disallows traffic to certain subnets
• Does not alter the packets it allows through
• Not visible as protocol end-point
By rejecting some packets, may cause connectivity problems that are difficult to identify and resolve.
76
APPLICATION FIREWALLS
Features of an application firewall:
• Acts as protocol end-point and relay
• E.g. SMTP client / server or web proxy agent
• May:
• Implement ‘safe’ subset of the protocol
• Perform extensive protocol validity checks
• Use an implementation methodology to minimise likelihood of bugs
• Run in an insulated ‘safe’ environment
77
PROBLEMS ASSOCIATED WITH FIREWALLS
ICMP (Internet Control Message Protocol) messages are often blocked, as they may be perceived as a security risk.
• Applications dependent upon them, such as PING, will return fallacious results
• Path discovery black holes can be created
• Legitimate traffic can be delayed or completely blocked
78
NETWORK ADDRESS TRANSLATORS
What does a Network Address Translator do?
• Dynamically assigns unique address to a host
• Translates appropriate address field in inbound and outbound packets
Network Address Translation is often built into routers.
79
LOAD BALANCERS
Motivation is typically to balance load across a pool of servers.
Divert packets from intended IP destination or make the destination ambiguous.
Session state? Debugging?
Sometimes it works, sometimes it doesn’t