module i corporate finance 1. the time value of money
TRANSCRIPT

Module I CORPORATE FINANCE
1. THE TIME VALUE OF MONEY
An enterprise must select the best combination on investment, financing and dividends. The decision to purchase new plants and equipments and to introduce a new product in the market requires the use of capital allocating techniques. The firm must determine whether future benefits are sufficiently large to justify current outlays.
The first step towards making capital allocating decisions is to develop the mathematical tools of the time value of money. The passage of time between the outflows and inflows in a typical investment situation results in different current values associated with cash flows that occur at different points in time.
It is not rational to assess an investment by adding up all the cash inflows and outflows and by comparing the values without considering when the cash flows occur.
A monetary unit received in the future is worth less than a monetary unit received at the present for four primary reasons:
a). the presence of positive rates of inflation reduces the purchasing power of a monetary unit through time.
b). the opportunity cost of lost earnings as the monetary unit could have been invested and earned a return between now and a certain time point in the future.
c). the uncertainty of future values due to the risk of default or nonperformance of investments.
d). human preferences typically involve impatience or the preference to consume goods and services now rather than in the future.
Interest rates represent the price paid to use money for some period of time. Interest rates are meant to compensate lenders and savers for foregoing the use of money for some interval of time. Lenders of capital receive interest, and borrowers pay interest due to the positive time value of money.
For example a lender who provides 1000 lei today at a 10% interest per year is paid back 1100 lei at the end of the year. The 100 lei compensate the lender for not making an alternative investment, for giving up personal consumption or for the risk that the money might not have been repaid.
Managers are often confronted with investment options with different length lives, different sized investments, differing financing terms, differing tax implications, etc. In all cases the cash flows associated with an investment are converted to similar terms and then converted to their equivalent values at a common point in time by using tools and techniques that collectively comprise the concepts known as the Time Value of Money.
1). Simple and compound interest. Future Values of Present Sums
Consider an initial value V0 deposited in an accumulating account at an annual interest rate r. Assuming that the interest earnings are never withdrawn, after one period the account will be worth the initial principal plus interest earnings V1 = V0 + r×V0 = V0×(1 + r)
For the second period of time the amount will be worth its initial value at the beginning of the period V0×(1 + r) plus the interest r×V0×(1 + r).

V2 = V0×(1 + r) + r×V0×(1 + r) = V0×(1 + r)2
………………………………….
Vn = V0×(1 + r)n
FV = PV×(1 + r)n
n = the final period in time
FV = future value
PV = present value
r = the interest rate per period of time
2). Present Values of Future Sums
This is the first basic principle in finance. The present value of a delayed payoff may be found by multiplying the payoff by a discount factor which is less than 1.
Calculate the present value of 100 lei to be received 1,2,3,4 and 5 years from now at 7% interest.
Year 1 2 3 4 5
Discount factor 1/1.07 = 0.934
1/1.072 = 0.873
1/1.073 = 0.816
1/1.074 = 0.763
1/1.075 = 0.713
Present value 93.4 87.3 81.6 76.3 71.3
Wrap-up for 1). & 2) and examples:
Investing means spending money now (t0) to buy assets that will yield cash flow(s) in the future (t1), (t2), (t3) … Timing of the cash flow(s) matters!
Interest is a key factor affecting the time value of money, for example: investing £100 for 10 years at 8% yields £216 and investing £100 for 10 years at 2% yields £122.
One-period investment: present value (PV), future value (FV), rate of return (r)
You are investing a given amount (present value, PV) now (t0) at the rate of return (r) for one year. After a year (t1) you receive the amount invested (PV) plus the income (r • PV): this is the future value (FV) of the investment. Hence:
(1) FV = PV + r • PV = PV • (1+r)
And by rearranging and solving for PV yields
(2) PV = FV • [1/(1+r)]
And by rearranging and solving for r yields
(3) (1+r) = FV/PV or r = [(FV/PV) – 1]

EXAMPLES:
Q: What is the FV of £150 invested at 7% for one year?
A: FV = £150 • (1 + 0.07) = £160.5
Q: What is the rate of return (r) on £150 invested for one year if the FV (value in t1) is £180?
A: £180 = £150 • (1 + r) hence: r = [(£180/£150) – 1] = 0.2 = 20%
Q: What is the PV of £180 paid next year (t1) if r = 5%?
A: £180 = PV • (1 + 0.05) hence: PV = £180 • [1/(1+ 0.05)] = £180 • 0.952 = £171.4
Multi-period investment with compounding of interest
You are investing an amount at the rate r for three years. Annual interest payments (PV • r) are reinvested at the rate r for the remainder of the three-year period (compounding). After three years you get: FV = PV•(1 + r)•(1 + r)•(1 + r) = PV•(1 + r)3. Hence, for n-period investments with compounding:
(1) FV = PV • (1+r)n (1+r)n is called compound factor
(2) PV = FV • [1/(1+r)n] 1/(1+r)n is called discount factor
(3) (1+r)n = FV/PV and r = [(FV/PV)1/n – 1]
EXAMPLES
Q: What is the FV of £150 invested for 4 years at 7%?
A: FV = £150 • (1 + 0.07)4 = £150 • 1.311 = £196.6
Q: What is the rate of return (r) on £150 invested for 4 years, if the FV is £180?
A: £180 = £150 • (1 + r)4 hence: r = [(£180/£150)1/4 – 1] = (1.20.25 -1) = 0.047 = 4.7%
Q: What is the PV of £180 paid after 10 years (t10) if r = 5%?
A: £180 = PV • (1 + 0.05)10 hence: PV = £180 • [1/(1+ 0.05)10] = £180 • 0.614 = £110.5
3). Analyzing Investments
Money is invested now for an expected return sometime in the future.
Net cash flows for three hypothetical investments are shown in the next table. Each investment has a life of 4 years and brings a total net cash flow of 120000 lei. The discount rate is 8%.
Investment A Investment B Investment C Year
Net
cash flow
Discount
factor
Present
value
Net
cash flow
Discount
factor
Present
value
Net
cash flow
Discount
factor
Present
value
1 30000 0.925 27777 15000 0.925 13889 45000 0.925 41666
2 30000 0.857 25720 25000 0.857 21433 35000 0.857 30007
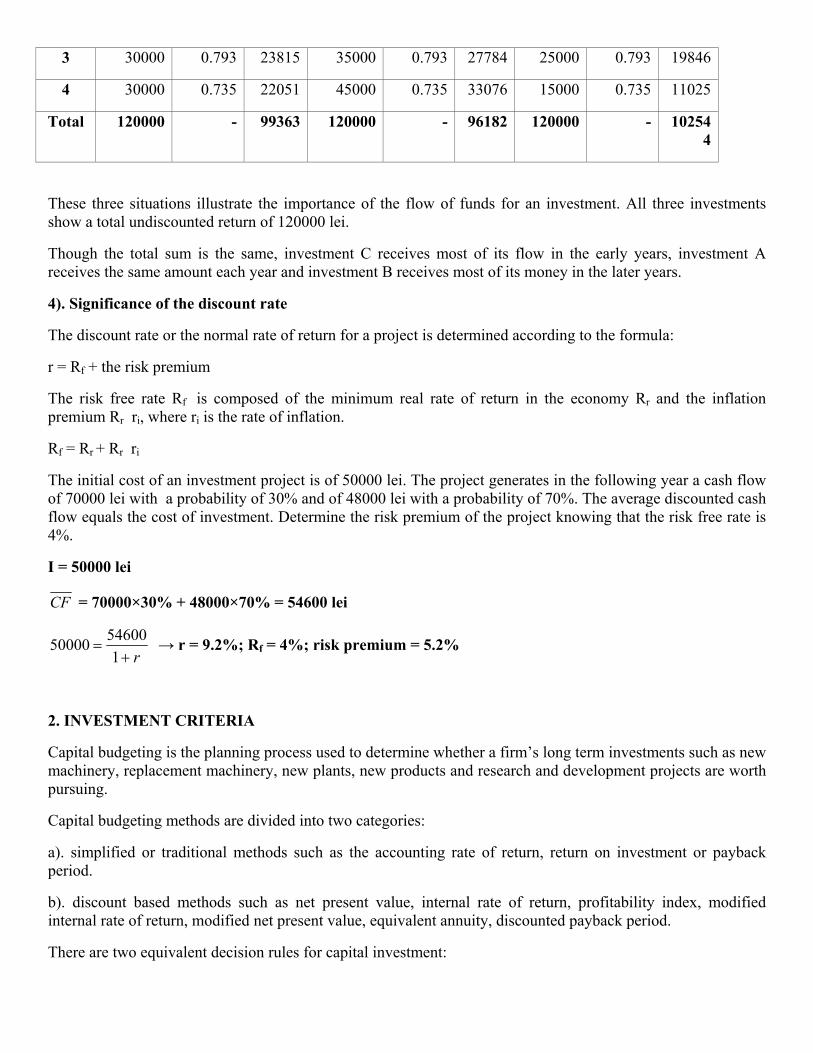
3 30000 0.793 23815 35000 0.793 27784 25000 0.793 19846
4 30000 0.735 22051 45000 0.735 33076 15000 0.735 11025
Total 120000 - 99363 120000 - 96182 120000 - 102544
These three situations illustrate the importance of the flow of funds for an investment. All three investments show a total undiscounted return of 120000 lei.
Though the total sum is the same, investment C receives most of its flow in the early years, investment A receives the same amount each year and investment B receives most of its money in the later years.
4). Significance of the discount rate
The discount rate or the normal rate of return for a project is determined according to the formula:
r = Rf + the risk premium
The risk free rate Rf is composed of the minimum real rate of return in the economy Rr and the inflation premium Rr ri, where ri is the rate of inflation.
Rf = Rr + Rr ri
The initial cost of an investment project is of 50000 lei. The project generates in the following year a cash flow of 70000 lei with a probability of 30% and of 48000 lei with a probability of 70%. The average discounted cash flow equals the cost of investment. Determine the risk premium of the project knowing that the risk free rate is 4%.
I = 50000 lei
CF = 70000×30% + 48000×70% = 54600 lei
r+=
15460050000 → r = 9.2%; Rf = 4%; risk premium = 5.2%
2. INVESTMENT CRITERIA
Capital budgeting is the planning process used to determine whether a firm’s long term investments such as new machinery, replacement machinery, new plants, new products and research and development projects are worth pursuing.
Capital budgeting methods are divided into two categories:
a). simplified or traditional methods such as the accounting rate of return, return on investment or payback period.
b). discount based methods such as net present value, internal rate of return, profitability index, modified internal rate of return, modified net present value, equivalent annuity, discounted payback period.
There are two equivalent decision rules for capital investment:

1). Net present value rule: accept investments with positive net present values.
2). Rate of return rule: accept investments that offer rates of return in excess of their opportunity cost of capital.
The rate of return of an investment is simply the profit as a proportion of the initial outlay:
1. Net Present Value NPV
The net present value is the total present value of a time series of cash flows. This method uses the time value of money in order to appraise long term projects. Future cash inflows and outflows are discounted back to their present value and then are summed up.
∑= +
=n
tt
t
rCFNPV
0 )1(
t = the time of the cash flow
r = the discount rate
CFt = the net cash flow at time t (inflow minus outflow)
Usually the first cash flow CFo is a negative one, a cash outflow that equals the initial required investment which is the funding of the project.
The discount rate is often referred to as the hurdle rate or the opportunity cost of capital. The opportunity cost of capital for a project is the expected rate of return demanded by investors in common stocks and other securities subject to the same risk as the project. For example, if the capital required for a project A can earn a certain percent elsewhere we will use this discount rate in the NPV calculation to allow a direct comparison to be made between project A and the alternative. When you discount the project’s expected cash flow at its opportunity cost of capital, the resulting present value is the amount that investors (including your own company’s shareholders) would be willing to pay for the project.
As an alternative to the opportunity cost of capital the firm’s weighted average cost of capital after tax is often used as a discount factor.
As a conclusion, the selection of the discount rate is dependent on the use to which it will be put. If the intent is simply to determine whether a project will add value to the company, using the firm’s weighted average cost of capital may be appropriate. If trying to decide between alternative investments in order to maximize the value of the firm, the opportunity cost of capital would probably be a better choice.
The concept of net present value allows efficient separation of ownership and management of the corporation. A manager who invests only in assets with positive net present values serves the best interest of each one of the firm’s owners. Each shareholder wants three things:
a). to be as rich as possible, that is to maximize current wealth;
b). to transform that wealth into whatever time pattern of consumption he or she desires, providing they have free access to competitive capital markets;
c). to choose the risk characteristics of that consumption plan. They can also choose the risk characteristics of their consumption plan by investing in more or less risky securities.
Managers of the corporation have just one fundamental task: to maximize net present value.
Check: A corporation must decide whether to adopt an investment project. The project implies costs and

incoming cash flows over five years. The immediate cash outflow is 50000 lei (the investment initial cost), while the other cash outflows for the following years are expected to be 5000 lei per year. Starting with the following year the expected cash inflows are 40000 lei per year. The required rate of return is 10%. Using the NPV criteria decide whether this project should be adopted.
leiNPV 60945)1,01(
35000)1,01(
35000)1,01(
35000)1,01(
35000)1,01(
3500050000 54321 =+
++
++
++
++
+−=
Yes, it should be
adopted.
2. Internal Rate of Return IRR
The internal rate of return is the annualized effective compounded return rate which can be earned on the invested capital. it is an indicator of the efficiency or quality of an investment as opposed to the net present value, which indicates the magnitude of an investment.
The IRR is compared to any alternate cost of capital including an appropriate risk premium (investing in other projects, buying bonds, putting money in a bank account, etc). If the IRR is greater than the rate of return that could be earned by alternate investments of equal risk then the project is a good investment.
In general if the IRR is greater than the project’s cost of capital the project will add value for the company. Given a series of cash flows involved in a project, the IRR is that rate for which the net present value equals zero.
0)1(0
=+∑
=
n
tt
t
rCF
Example: Knowing that for a 19% discout rate the net present value of an investment project is of 59.476,35 lei, and for a 30% discout rate the net present value of an investment project is of – 2.841,32 lei, determine the internal rate of return of the project.
( ) ( )( ) ( )−−+
+∗−+=
NPVNPVNPVrrrIRR imimim minmaxmin
= ( ) ( )32,284135,5947635,59476%19%30%19−−
∗−+
= %498,299544058,0%11%19 =∗+
3. Profitabily Index PI
The Profitability Index (PI), also known as value investment ratio (VIR), is the ratio of payoff to investment of a proposed project. It is a useful tool for ranking projects because it allows managers to quantify the amount of value created per unit of investment.
The ratio is calculated as follows:
A profitability index of 1 indicates breakeven. Any value lower than one would indicate that the project's PV is less than the initial investment. As the value of the profitability index increases, so does the financial attractiveness of the proposed project.
Rules for selection or rejection of a project:
If PI > 1 then accept the project;
If PI < 1 then reject the project .
3. ACCOUNTING STATEMENTS AND CASH FLOW
1. The balance sheet
The balance sheet is the accountant’s picture of the firm’s accounting value at a certain moment. The two sides of the balance sheet (assets on the left and liabilities plus stockholder’s equity on the right) illustrate what the firm owns and how it is financed. The strength of a company’s balance sheet can be evaluated by three broad categories of investment – quality measurements: working capital adequacy, asset performance and capital structure.
The accounting definition that underlines the balance sheet and describes the balance is:
Assets ≡ Liabilities + Stockholder’s equity
a) The assets in the balance sheet are listed in order by the length of time it normally takes to convert them to cash. The asset side depends on the nature of the business and how management chooses to conduct it. Management must make decisions about cash versus marketable securities, credit versus cash sales, whether to make or buy commodities, whether to lease or purchase items, the types of business in which to engage, and so on.
Current assets are the most liquid and include cash and those assets that will be turned into cash within a year from the date of the balance sheet. Accounts receivable is the amount not yet collected from customers for goods and services sold to them. Inventory is composed of raw materials to be used in production, work in process and finished goods.
Fixed assets are the least liquid kind of assets. Tangible fixed assets include property, plant and equipment. These assets do not convert to cash from normal business activity and they are not usually used to pay expenses, such as payroll. Some fixed assets are not tangible. We include here the value of a trademark or the value of a patent.
So, accounting liquidity refers to the ease and quickness with which assets can be converted to cash. The more liquid a firm’s assets, the less likely the firm is to experience problems meeting short-term obligations. Thus, the probability that a firm will avoid financial distress can be linked to the firm’s liquidity. Unfortunately, liquid assets frequently have lower rates of return than fixed assets (cash for example don’t generate any investment income).
To the extent to which a firm invests in liquid assets, it sacrifices an opportunity to invest in more profitable investment vehicles.
b). The liabilities and the shareholder’s equity are listed in the order in which they must be paid. They reflect the two types and proportions of financing, which depend on management’s choice of capital structure, as between debt and equity and between current debt and long-term debt.

Liabilities are obligations of the firm that require a payout of cash within a stipulated time period. Many liabilities involve contractual obligations to repay a stated amount and interest over a period. Liabilities are debts and are frequently associated with nominally fixed cash burdens, called debt service.
The stockholder’s equity is defined as the difference between the assets and the liabilities of the firm. Actually equity is what stockholders would have remaining after the firm discharged its obligations. Stockholders’ equity is a claim against the firm’s assets that are residual and not fixed. In general terms, when the firm borrows, it gives the bondholders first claim on the firm’s cash flow. Bondholders can sue the firm if the firm defaults on its bond contracts. This may lead the firm to declare itself bankrupt.
c). Value versus cost. The accounting value of a firm’s assets is frequently referred to as the carrying value or the book value of the assets. The terms carrying value and book value are unfortunate. They specifically say value when in fact the accounting numbers are based on cost. This misleads many readers of financial statements to think that the firm’s assets are recorded at the true market values. Market value is the price at which willing buyers and sellers trade the assets. It would be only a coincidence if accounting value and market value were the same. In fact, management’s job is to create a value for the firm that is higher than its cost.
The same balance sheet offers different information to different analysts. It depends on what the analyst wishes to extract. A banker may look at a balance sheet for evidence of accounting liquidity and working capital. a supplier may also note the size of accounts payable and therefore the general promptness of payments. Many users of financial statements, including managers and investors, want to know the value of the firm not its cost. This isn’t found on the balance sheet. In fact, many of the true resources of the firm do not appear on the balance sheet: good management, proprietary assets, favorable economic conditions, and so on.
2. The Income Statement
The income statement measures performance over a specific period of time, usually a year. The accounting definition of income is:
Revenue – Expenses ≡ Income
The income statement includes several sections. The operations section reports the firm’s revenues and expenses from principal operations. Revenue is recognized on an income statement when the earnings process is virtually completed and an exchange of goods or services has occurred. Therefore, the unrealized appreciation in owning property will not be recognized as income. This provides a device for smoothing income by selling appreciated property at convenient times. Among other things, the nonoperating section of the income statement includes all financing costs, such as interest expense. A second section may report as a separate item taxes on income, meanwhile the last section reveals the net income and its destination. Net income is sometimes expressed per share of common stock (earnings per share EPS).
The matching principle dictates that revenues be matched with expenses. Thus the income is reported when it is earned or occurred, even though no cash flow has necessarily occurred.
3. Net Working Capital and Financial Cash Flow
Net working capital is current assets minus current liabilities. Net working capital is positive when current assets are greater than current liabilities. This means the cash that will become available over the next year is greater than the cash that must be paid out.
Current assets – Current liabilities = Net Working Capital
In addition to investing in fixed assets a firm can invest in net working capital. This is called the change in net working capital and is the difference between the net working capital in two running years. The change in the net working capital is usually positive in a growing corporation.

Application The balance sheet of a corporation includes the following elements : -cash 157; -property, plant and equipment 1274; -long term liabilities 562; -intangible assets 221; -notes payable 53; -inventories 280; -accounts receivable 270; -preferred stock 39; -depreciation 460; -accounts payable 197; -common stock 32; -retained earnings 347; -capital surplus 327; -accrued expenses 205. Compose the balance sheet and calculate the net working capital (NWC) and the change in the net working capital knowing that in the previous year the net working capital was 240. Balance sheet - lei-
ASSETS Suma LIABILITIES AND STOCKHLDERS’
EQUITY
Suma
Current assets: -cash -accounts receivable -inventories Total current assets
157 270 280 707
Current liabilities: -accounts payable -notes payable -accrued expenses Total current liabilities
19753
205455
Total longterm liabilities 562Fixed assets: -property, plant, equipment -depreciation -net property, plant, equipment -intangible assets Total fixed assets
1274
(460)
814
221 1035
Stockholders’ equity: -preffered stock -common stock -capital surplus -retained earnings Total equity
3932
327347725
TOTAL ASSETS 1742 TOTAL LIABILITIES AND EQUITY
1742
Net working capital = = Total current assets – Total current liabilities = 707 - 455 = 252 Change in net working capital = = NWC1 – NWC0 = 252 – 240 = 12

The most important item that can be extracted from financial statements is the actual cash flow. Cash flow is not the same as the net working capital. For example, increasing inventory requires the use of cash. Because both inventory and cash are current assets, the net working capital is not affected by this process, meanwhile the cash flow decreases.
If the value of a firm’s assets is always equal to the value of the liabilities, and the value of the equity, the cash flow from the firm’s assets CF(A) must equal the cash flows to the firm’s creditors CF(B) and equity investors CF(S):
CF(A) ≡ CF(B) + CF(S)
The first step in determining cash flows of the firm is to figure out the cash flow from operations. Operating cash flow is generated by business activities, including sales of goods and services. Operating cash flow reflects tax payments but not financing, capital spending or changes in net working capital. Another component of cash flow involves changes in fixed assets. The net change in fixed assets equals sales of fixed assets minus the acquisition of fixed assets. The result is the cash flow used for capital spending. Finally cash flows are also used for making investments in net working capital.
Total cash flow = Operating cash flow – Capital spending – Additions to net working capital
The economic value of assets is intimately connected to their future incremental cash flows. However, cash flow does not appear on an income statement. There are several noncash items that are expenses against revenues, but do not affect cash flow. The most important of these is depreciation. Depreciation reflects the accountant’s estimation of the cost of equipment used up in the production process. Even if from an accounting perspective depreciation is a cost, from a finance perspective the cost of the asset is the actual negative cash flow incurred when the asset is acquired and no the annual installments of depreciation expense deduced form revenues during several years by the accountants. Another noncash expense is deferred taxes which derive from differences between accounting income and true taxable income. From an accounting perspective deferred taxes represent a liability for the firm and are reflected on the balance sheet as deferred tax liability. From a financial perspective, though, deferred taxes are not a cash outflow.
4. DEPRECIATION METHODS
Depreciation is the process by which a company allocates an asset's cost over the duration of its useful life. Each time a company prepares its financial statements, it records a depreciation expense to allocate a portion of the cost of the buildings, machines or equipment it has purchased to the current fiscal year. The purpose of recording depreciation as an expense is to spread the initial price of the asset over its useful life. For intangible assets - such as brands and intellectual property - this process of allocating costs over time is called amortization. Depreciation refers to prorating a tangible asset's cost over that asset's life.
Each country adapts and combines the „classical” depreciation systems and develops its own depreciation methods which are correlated to that country’s fiscal policy. The law in Romania recognizes 3 depreciation methods: straight-line depreciation; declining-balance depreciation and accelerated depreciation.
1. The straight-line method requires that the same depreciation norm be used for a constant depreciation basis for the entire life-time of the fixed asset. This method is derived from the straight-line system. This method is considered to be the simplest one. It requires simple computation and the cost of the asset is attributed constantly over the entire life-time of the asset.
The straight line method takes an estimated scrap value of the asset at the end of its life and subtracts it from its original cost. The result is then divided by management's estimate of the number of useful years of the asset. The company expenses the same amount of depreciation each year.

Straight line depreciation = (Original costs of asset – Scrap value)/Estimated asset life
2. The declining-balance method recognizes a higher depreciation cost earlier in an asset’s life-time. This method writes-off depreciation costs more quickly than the straight-line method. Generally, the purpose behind this is to minimize taxable income. The depreciation norm given by the straight-line method is adjusted by the following coefficients:
a) 1,5 if the life-time of the fixed asset is from 2 to 5 years; b) 2 if the life-time of the fixed asset is from 5 to 10 years; c) 2,5 if the life-time of the fixed asset is longer than 10 years.
The yearly depreciation charge is used in two ways:
-without taking into account obsolescence;
-by taking into account obsolescence.
Obsolescence is the state of being which occurs when an object, service or practice is no longer wanted even though it may still be in good working order. Obsolescence frequently occurs because a replacement has become available that is superior in one or more aspects. Typically, obsolescence is preceded by a gradual decline in popularity.
1. The declining-balance method without taking into account obsolescence
When determining the yearly charge without taking into account obsolescence we should proceed as follows:
-in the first year, the norm is applied to the innitial value of the fixed asset;
-for the following years, the same norm is used but each year it is applied to the net book-value from the previous one. This procedure is repeated as long as the yearly charge remains higher than the one determined using the straight line method. When the yearly charge computed like this becomes equal to or smaller than the one determined using the straight line method, we switch and from that year on, the straight line method will be used for the net book-value.
Example: Determine the annual depreciation for a fixed asset with a 5000lei value and a lifetime of 9 years.
The depreciation norm:
%22,2210091210012 =××=××=
UlNd
-lei-
No. of years
Annual depreciation Net book value
1 5.000 x 22,22% = 1.111 3.889
2 3.889 x 22,22% = 864 3.025
3 3.025 x 22,22% = 672 2.353
4 2.353 x 22,22% = 523 1.830

5 1.830 x 22,22% = 407 1.423
6 356 1.067
7 356 711
8 356 355
9 355 -
2. The declining-balance method taking into account obsolescence
When determining the yearly charge, taking into account obsolescence, the following factors need to be considered:
-the innitial value for the first year and the net book-value for all the following years of the lifetime;
-the standard life time, as given in the directory;
-the declining-balance depreciation norm;
-the time period for which the yearly charge will be computed, i.e. the time period for full depreciation, further divided in the two components: declining-balance and straight-line.
Example: For a fixed asset having an initial cost of 4.000 lei and a standard lifetime of 20 years, we are given the following:
-its declining balance depreciation norm is 12,5%;
-the time period for which the yearly charge will be computed is 12 years
-this 12 year time period for full depreciation is divided into two components: 4 years on declining-balance and 8 years on straight-line;
Determine its annual depreciation by using the declining-balance method taking into account obsolescence.
-lei-
Year Annual depreciation Net book value
1 4.000 x 12,5% = 500 3.500
2 3.500 x 12,5% = 438 3.062
3 3.062 x 12,5% = 383 2.679
4 2.679 x 12,5% = 335 2.344
5 293 2.051
6 293 1.758
7 293 1.465
8 293 1.172

9 293 879
10 293 586
11 293 293
12 293 -
3. The accelerated depreciation method uses a combined approach. For the first year, it is allowed to use any depreciation norm that does not exceed 50%. For the following years a new depreciation norm is computed using the straight line approach. This norm is then applied to the net book-value of the fixed asset after the first year. This depreciation method recognized by the Romanian law is in fact a straight-line method, but uses two different depreciation norms for the first and the following years.
Example: Determine the annual depreciation of a fixed asset with a 6000 lei value and a 7 year life time by using the accelerated depreciation method.
-lei-
Year Annual depreciation Net book value
1 6.000 x 50% = 3.000 3.000
2 500 2.500
3 500 2.000
4 500 1.500
5 500 1.000
6 500 500
7 500 -
5. RISK, RETURN AND CAPITAL MARKET EQUILIBRIUM
Securities derive their value from the cash flow they are expected to generate. Since the cash flow will be received over future periods, there is need to discount these future flows in order to derive a present value or price for the security.
Assuming that we are valuing the security over a single holding period (say, a year) we can illustrate the process of valuation with a particularly simple model:
, r = discount rate (1)
The model indicates that the present value or current price P0 of the security is the cash flow (dividends or coupons) received over the period plus the expected price at the end of the period P1, discounted back at the rate r.
The discount rate is alternatively referred to as a required return and is composed of two elements:

r = Rf + the risk premium (2)
a). a risk free return Rf , which is generally considered to comprise a real return component and an inflation premium. The real return Rr is the basic investment compensation that investors demand for forgoing current consumption; that is the compensation for saving. Investors also require a premium to compensate for inflation. The real return and inflation premium are a basic return demanded by all investors, so the risk free return is a return component required of all securities.
b). a risk premium which is made up of the following elements: (1) interest rate risk, (2) purchasing power risk, (3) business risk and (4) financial risk. The premium that investors require to compensate the risk will differ across securities as the perceived exposure to the risk elements is high or low for the security.
By rearranging equation (1) we can obtain directly the discount rate r. In this form it is usual to think of the discount rate as a return expected by investors, that is, an expected return.
(3)
We can also use equation (3) for calculating the return earned on a security over a past period (realized return). This time we would insert a realized return for the cash flow and an actual ending period price rather than expected values of these variables.
In calculating the return for a common stock, it is helpful to think of the realized return as consisting of a yield component – dividend divided by beginning-of-period-price – and a capital gain component, which is the percentage change in price over the period.
(5)
The estimated or expected return of a portfolio of securities is merely a weighted average of the expected returns of the individual securities of which the portfolio is composed.
(6)
(7)
wi = the security’s proportion of the portfolio;
= the expected return of security i (average return of a period);
rit = the realized return of stock i at time t;
N = the total number of securities comprised in the portfolio;
T = the total number of observations (time moments).
eg. What is the expected return of a portfolio of which stock A with an expected return of 10% constitutes 60% and of which stock B with an expected return of 12% constitutes 40%?
In addition to determining the rate of return it is also important to assess the risk or uncertainty that may be associated with earning the return.

The variance of return and standard deviation of return are alternative statistical measures that are proxies for the uncertainty or risk of return. These statistics in effect measure the extent to which returns are expected to vary around an average over time. Extensive variations around the average would indicate great uncertainty regarding the return to be expected.
The variance is merely the average of the squared deviations of the individual returns from the average.
2 (8)
Standard deviation = (9)
6. CAPITAL MARKET THEORY AND TOOLS OF PORTFOLIO MANAGEMENT
While standard deviation and variance measure the riskiness of a security in an absolute sense, there is also need to consider the riskiness of a security within the context of an overall portfolio of securities.
The riskiness of a portfolio will depend on how a security blends with the existing securities and contributes to the overall risk of a portfolio. The covariance is a statistic that measures the riskiness of a security relative to others in a portfolio of securities.
In essence the way securities vary with each other affects the overall variance, hence the risk of the portfolio.
If the securities move counter to each other than the covariance is a negative value. If the securities move consistently in tandem than the covariance is positive.
To facilitate interpretation it is useful to standardize the covariance. Dividing the covariance between two securities by the product of the standard deviation of each security produces a variable with the same properties as the covariance but scaled to a range of -1 to +1. The measure is called the correlation coefficient.
Negative correlation is desirable in a security because such a security has great risk reducing potential in a portfolio context. Anyway in pragmatic settings it is difficult to find negatively correlated securities.
So the variance or risk of a portfolio is not simply a weighted average of the variances of the individual securities in the portfolio. There is also need to consider the relationship between each security in the portfolio and every other security as measured by the covariance of returns.
For a portfolio of two securities i and j the risk measured by the portfolio variance is calculated as follows:
where wi and wj are the proportions that securities i and j represent in the portfolio.
The risk of a portfolio measured by the variance is a weighted average of the variances of the individual securities plus the covariance between each security and every other security in the portfolio. By diversifying the portfolio (increasing the number of securities) investors manage to substantially reduce the risk.

Diversification works because prices of different stocks do not move exactly together. Yet most of the stocks that the investor can actually buy are tied together in a web of positive covariances which set the limit to the benefits of diversification.
The risk that potentially can be eliminated by diversification is called diversifiable risk, specific risk, unsystematic risk or residual risk. This specific risk stems from the fact that many of the perils that surround an individual company are peculiar to that company and perhaps its immediate competitors.
But there is also some risk that can’t be avoided regardless of how much the portfolio is diversified. This risk is generally known as market risk, systematic risk or undiversifiable risk. Market risk stems from the fact that there are other economy wide perils which threaten all businesses. That is why stocks have a tendency to move together. And that is why investors are exposed to market uncertainties no matter how many stocks they hold.
7. THE CAPITAL STRUCTURE OF THE CORPORATION
A firm’s basic resource is the stream of cash flows produced by its assets. When the firm is financed entirely by common stock, all those cash flows belong to the stockholders. When it issues both debt and equity securities it undertakes to split up the cash flows into two streams, a relatively safe stream that goes to the debt holders and a more risky one that goes to the stockholders.
The firm’s mix of different securities is known as its capital structure. The choice of capital structure is fundamentally a marketing problem. The firm attempts to find the particular combination of securities that maximizes its overall market value.
After analyzing a number of factors, a firm establishes a target capital structure it believes is optimal, which is then used as a guide for raising funds in the future. This target might change over time as conditions vary, but at any given moment the firm’s management has a specific capital structure in mind, and individual financing decisions should be consistent with this target. If the actual proportion of debt is below the target level, new funds will probably be raised by issuing debt, whereas if the proportion of debt is above the target, stock will probably be sold to bring the firm back in line with the target debt/assets ratio.
Capital structure policy involves a trade-off between risk and return. Using more debt raises the riskiness of the firm’s earnings stream, but a higher proportion of debt generally leads to a higher expected rate of return. A higher risk associated with greater debt tends to lower the stock’s price. Therefore, the optimal capital structure is the one that strikes a balance between risk and return to achieve the ultimate goal of maximizing the price of the stock.
Capital structure decisions are influenced by six primary factors:
• The first is the firm’s business risk, or the riskiness that would be inherent in the firm’s operations if it used no debt. The greater the firm’s business risk, the lower the account of debt that is optimal.
• The second key factor is the firm’s tax position. A major reason for using debt is that interest is tax deductible, which lowers the effective cost of debt. However, if much of a firm’s income is already sheltered from taxes by accelerated depreciation for example, its tax rate will be low, and debt will not be as advantageous as it would be to a firm with a higher effective tax rate.
• The third important consideration is financial flexibility, or the ability to raise capital on reasonable terms under adverse conditions. Corporate treasures are aware that a steady supply of capital is necessary for stable operations, which, in turn, are vital for long-run success. When money is tight in the economy, or when a firm is experiencing operating difficulties, a strong balance sheet is needed to obtain funds from suppliers of capital. Thus, it might be advantageous to issue equity to strengthen the firm’s capital base and financial stability.

• The fourth debt-determining factor has to do with managerial attitude (conservatism or aggressiveness) with regard to borrowing. Some managers are more aggressive than others, hence some firms are more inclined to use debt in an effort to boost profits. This factor does not affect the optimal, or value-maximizing capital structure, but it does influence the target capital structure a firm actually establishes.
• Growth Rate. Firms that are in the growth stage of their cycle typically finance that growth through debt, borrowing money to grow faster. The conflict that arises with this method is that the revenues of growth firms are typically unstable and unproven. As such, a high debt load is usually not appropriate. More stable and mature firms typically need less debt to finance growth, as its revenues are stable and proven. These firms also generate cash flow, which can be used to finance projects when they arise.
• Market conditions can have a significant impact on a company's capital-structure condition.
These six points largely determine the target capital structure, but operating conditions can cause the actual capital structure to vary from the target at any given time.
8. THE COST OF CAPITAL The cost of capital is the term used in the field of financial investment to refer to the cost of a company’s funds, both debt and equity. So, the cost of capital includes the cost of debt and the cost of equity. The Cost of Equity In financial theory, the cost of equity is the return that stockholders require for a company. The traditional formula for cost of equity (COE) is the dividend capitalization model:
A firm's cost of equity represents the compensation that the market demands in exchange for owning the asset and bearing the risk of ownership.
The Cost of Debt
The cost of debt is the effective rate that a company pays on its current debt. This can be measured in either before- or after-tax returns; however, because interest expense is deductible, the after-tax cost is seen most often.
The Weighted Average Cost of Capital (WACC) The weighted average cost of capital is the calculation of a firm's cost of capital in which each category of capital is proportionately weighted. All capital sources - common stock, preferred stock, bonds and any other long-term debt - are included in a WACC calculation.
The WACC equation is the cost of each capital component multiplied by its proportional weight and then summing:
where: rE = cost of equity
rD = cost of debt

E = market value of the firm's equity
D = market value of the firm's debt
V = E + D
E/V = percentage of financing that is equity
D/V = percentage of financing that is debt
Tc = corporate tax rate
9. DIVIDENDS AND DIVIDENDS POLICIES
The dividend policy is the trade-off between retaining earnings on the one hand and paying out cash and issuing new shares on the other.
1. Types of Dividends
The dividend is set by the firm’s board of directors. Dividends come in different forms:
a). cash dividends; b). stock dividends; c). stock split; d). share repurchase.
Stock dividends and stock splits are very much alike. Both increase the number of shares but the company’s assets, profits and total value are unaffected. So, both reduce value per share. The distinction between them is technical. A stock dividend is shown in the accounts as a transfer from retained earnings to equity capital, whereas a split is shown as a reduction in the par value of each share. When a firm wants to pay cash to its shareholders it usually declares a cash dividend. The alternative is to repurchase its own stocks. The required shares are usually kept in the company’s treasury and can be resold if the company needs money.
2. Method of Dividend Payments
The announcement of the dividend states that the payment will be made to all those stockholders who are
registered on a particular record date.
When dividend has been declared it becomes a debt of the firm and cannot be rescinded.
Dividends are normally paid quarterly and, if conditions permit, the dividend is increased once a year.
3. Dividend Payout Ratio
The dividend payout ratio is the percentage of earnings paid to shareholders in dividends.
The part of the earnings not paid to investors is left for investment to provide for future earnings growth. Investors seeking high current income and limited capital growth prefer companies with high dividend payout ratio. Investors seeking capital growth may prefer lower payout ratio because capital gains are taxed at a lower rate. High growth firms in early life generally have low or zero payout ratios. As they mature they tend to return more of the earnings back to investors.
4. Dividend policy
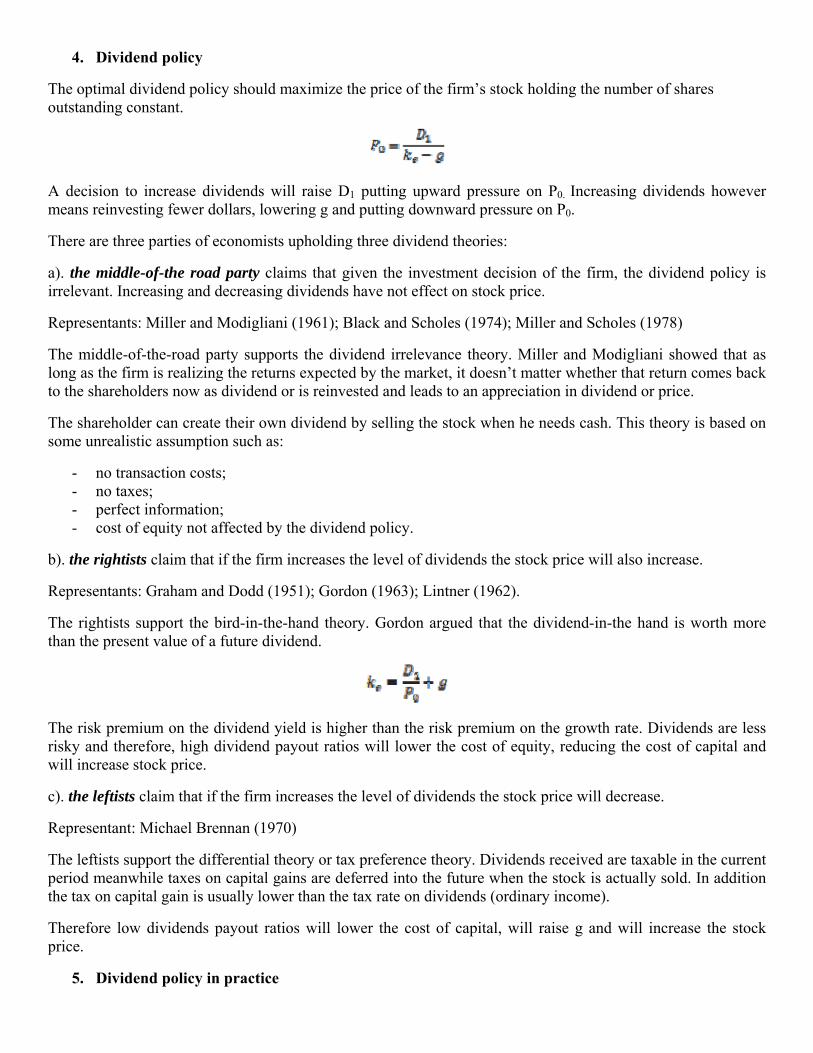
The optimal dividend policy should maximize the price of the firm’s stock holding the number of shares outstanding constant.
A decision to increase dividends will raise D1 putting upward pressure on P0. Increasing dividends however means reinvesting fewer dollars, lowering g and putting downward pressure on P0.
There are three parties of economists upholding three dividend theories:
a). the middle-of-the road party claims that given the investment decision of the firm, the dividend policy is irrelevant. Increasing and decreasing dividends have not effect on stock price.
Representants: Miller and Modigliani (1961); Black and Scholes (1974); Miller and Scholes (1978)
The middle-of-the-road party supports the dividend irrelevance theory. Miller and Modigliani showed that as long as the firm is realizing the returns expected by the market, it doesn’t matter whether that return comes back to the shareholders now as dividend or is reinvested and leads to an appreciation in dividend or price.
The shareholder can create their own dividend by selling the stock when he needs cash. This theory is based on some unrealistic assumption such as:
- no transaction costs; - no taxes; - perfect information; - cost of equity not affected by the dividend policy.
b). the rightists claim that if the firm increases the level of dividends the stock price will also increase.
Representants: Graham and Dodd (1951); Gordon (1963); Lintner (1962).
The rightists support the bird-in-the-hand theory. Gordon argued that the dividend-in-the hand is worth more than the present value of a future dividend.
The risk premium on the dividend yield is higher than the risk premium on the growth rate. Dividends are less risky and therefore, high dividend payout ratios will lower the cost of equity, reducing the cost of capital and will increase stock price.
c). the leftists claim that if the firm increases the level of dividends the stock price will decrease.
Representant: Michael Brennan (1970)
The leftists support the differential theory or tax preference theory. Dividends received are taxable in the current period meanwhile taxes on capital gains are deferred into the future when the stock is actually sold. In addition the tax on capital gain is usually lower than the tax rate on dividends (ordinary income).
Therefore low dividends payout ratios will lower the cost of capital, will raise g and will increase the stock price.
5. Dividend policy in practice
In practice investors prefer to have the firm retain and reinvest earnings if they can earn a higher risk adjusted return.
a). the residual dividend policy suggests that dividends should be that part of earnings which cannot be invested at a rate at least equal to the WACC.
Residual dividend policy steps:
1. determine the optimal capital budget; 2. determine the retained earnings that can be used to finance the capital budget; 3. use retain earning to supply as much of the equity investment in the capital budget as necessary; 4. pay dividends only if there are left-over earnings.
b). the stable (predictable) dividend policy according to which firms try to keep the dividend constant. It is never reduced. However it may be increased if management is certain that future earnings will support such a high dividend.
Stable dividend policy steps:
1. pay a predictable dividend every year; 2. base optimal capital budget on residual retained earnings.
The greatest danger in adopting a stable dividend policy is that once it is established it cannot be changed without seriously affecting investors’ attitude and the financial standing of the company.
10. FINANCIAL ANALYSIS
The objective of financial analysis is to rearrange data from financial statements into financial ratios that provide information about the main areas of financial performance such as:
1. Short-term solvency measures the ability of a firm to meet its short-run financial obligations. If a corporation has sufficient cash flow it is able to avoid defaulting on its financial obligations and thus avoid experiencing financial distress.
Accounting liquidity measures short-term solvency and is often associated with net working capital, the difference between current assets and current liabilities (debts that are due within one year from the data of the balance sheet). The basic source from which to pay current liabilities is current assets.
a). current ratio =
If a firm is having financial difficulty it may not be able to pay its bills (accounts payable) on time or it may need to extend its bank credit (notes payable). As a consequence current liabilities may rise faster than current assets and the current ratio may fall as a sign of financial trouble.
The current ratio should be calculated over several years for a historical perspective and it should be compared to the current ratios of other firms with similar operating activities.
b). quick ratio =
Quick assets are those current assets that are quickly convertible into cash. They are obtained by subtracting inventories from current assets. It is important to determine a firm’s ability to pay off current liabilities without relying on the sale of inventories.

2. Ratios of activity are constructed to measures how effectively the firm’s assets are being managed. By comparing assets with sales we can find out how quickly assets are used to generate sales.
a). total asset turnover =
This ratio is intended to indicate how effectively a firm is using its assets. If the asset turnover ratio is high the firm is presumably using its assets effectively in generating sales. If the ratio is law, the firm is not using its assets up to their capacity and must either increase sales or dispose of some of the assets. One problem in interpreting this ratio is that it is maximized by using older assets because their accounting value is lower than newer assets. Also firms with relatively small investments in fixed assets, such as retail and wholesale trade firms tend to have high ratios of total asset turnover when compared with firms that require a large investment in fixed assets, such as manufacturing firms.
b). receivables turnover =
average collection period =
The receivable turnover ratio and the average collection period provide some information on the success of the firm in managing its investment in accounts receivable. The actual value of these ratios reflects the firm’s credit policy. If a firm has a liberal credit policy the amount of its receivables will be higher than would otherwise be the case. One common rule of thumb that financial analysis use is that the average collection period of a firm should not exceed the time allowed for payment in the credit terms by more than 10 days.
c). inventory turnover =
days in inventory =
The inventory ratios measures how quickly inventory is produced and sold. They are significantly affected by the production technologically of goods being manufactured. (It takes longer to produce a gas turbine engine than a loaf of bread.) The ratios also are affected by the perishability of the finishing goods.
The ratio of days in inventory is the number of days it takes to get goods produced and sold. It is called shelf life for retail and wholesale trade firms. A large increase in the ratio of days in inventory could suggest an ominously high inventory of unsold finished goods or a change in the firm’s product mix to goods with longer production periods.
The method of inventory valuation can materially affect the computed inventory ratios. Thus, financial analysts should be aware of the different inventory valuation methods and how they might affect ratios.
3. Financial leverage is related to the extent to which a firm relies on debt financing rather than equity. Measures of financial leverage are tools in determining the probability that the firm will default on its debt contracts. The more debt a firm has the more likely it is that the firm will become unable to fulfill its contractual obligations. In other words, too much debt can lead to a higher probability of insolvency and financial distress.
On the positive side debt is an important form of financing and provides a significant tax advantage because interest payments are tax deductible. If the firm uses debt, creditors and equity investors may have conflicts of interest. Creditors may want the firm to invest in less risky ventures than those the equity investors prefer.

a). debt ratio =
debt-equity ratio =
equity multiplier =
Debt ratios provide information about protection of creditors from insolvency and the ability of firms to obtain additional financing for potentially attractive investment opportunities. The accounting value of debt may differ substantially from its market value because no adjustment is made for the current level of interest rates which may be higher or lower than when the debt was originally issued or risk.
b). interest coverage =
This ratio emphasizes the ability of the firm to generate enough income to cover interest expense. Interest expense is an obstacle that a firm must surmount if it is to avoid default. The ratio of interest coverage is directly connected to the ability of the firm to pay interest. However, it would probably make sense to add depreciation to income in computing this ratio and to include other financing expenses, such as payments of principal and lease payments.
A large debt burden is a problem only if the firm’s cash flow is insufficient to make the required debt service payments. This is related to the uncertainty of future cash flows. Firms with predictable cash flows are frequently said to have more debt capacity than firms with high uncertain cash flows. One possible way to do this is to calculate the standard deviation of cash flows relative to the average cash flow.
4. Profitability ratios measure the extent to which a firm is profitable. Accounting profits are the difference between revenues and costs. However the real profitability of a firm is difficult to conceptualize and to measure.
Many business opportunities involve sacrificing current profits for future profits. All new products require large start-up costs and as a consequence produce law initial profits. Thus current profits can be a poor reflection of true future profitability. Another problem with accounting based measures of profitability is that they ignore risk. It would be false to conclude that two firms with identical current profits were equally profitable if the risk of one was greater than the other.
a). net profit margin =
gross profit margin =
Profit margins express profits as a percentage of total operating revenue. They reflect the firm’s ability to produce a project or service at a low cost or a high price. Profit margins are not direct measures of profitability because they are based on total operating revenue not on the investment made in assets by the firm or equity investors. Trade firms tend to have low margins and service firms tend to have high margins.
b). net return on assets =
gross return on assets =

One of the interesting aspects of return on assets (ROA) is how some financial ratios can be linked together to compute ROA. One implication of this is usually referred to as the DuPont system of financial control. This system highlights the fact that ROA can be expressed in terms of the profit margin and asset turnover. The basic components of the system are as follows:
ROA = Profit margin Asset turnover
ROA (net) =
ROA (gross) =
Firms can increase ROA by increasing profit margins and asset turnover. Competition limits their ability to do so simultaneously so they tend to face a trade-off between turnover and margin.
c). ROE =
The most important difference between ROA and ROE is due to financial leverage.
ROE = Profit margin Asset turnover Equity multiplier
ROA
ROE =
Apparently financial leverage always magnifies ROE. Actually this occurs only when ROA (gross) is greater than the interest rate on debt.
d). payout ratio =
retention ratio =
retained earnings = net income – dividends
The payout ratio is the proportion of net income paid out in cash dividends and the retention ratio is the proportion of net income retained by the corporation for future investments.

Module II INSURANCE
Chapter 1. Risk To understand what insurance is and how it works, we must first understand the concept of risk.
1.1. The Nature of Risk
Definition of Risk. Risk is the chance or uncertainty of loss. Risk is not the loss itself, but the uncertainty that a
loss might occur.
Table no.1 Certainty vs. Uncertainty
Level of Uncertainty Characteristics Examples
None (certainty) Outcomes can be predicted with precision
Physical law, natural sciences
Level 1 (objective uncertainty) Outcomes are identified and probabilities are known (calculated)
Games of chance: cards, dice, mortality in large groups of individuals
Level 2 (subjective uncertainty) Outcomes are identified, probabilities are unknown (but can be estimated)
Investments, insurable risks
Level 3 Outcomes are not fully identified and probabilities are unknown
Space exploration, genetic research
1.2. Pure vs. Speculative Risks
Speculative risks represent a category of risks that, when undertaken, result in an uncertain degree of gain or
loss. All speculative risks are made as conscious choices and are not just a result of uncontrollable
circumstances. Speculative risk is the opposite of pure risk.
The risk management solution that involves insurance is concerned almost exclusively with situations in which
no gain is possible – termed pure risks. Pure risks are a category of risks in which loss is the only possible
outcome; there is no beneficial result. Pure risk is related to events that are beyond the risk-taker's control and,
therefore, a person cannot consciously take on pure risk. For example, the possibility that a person's house will
be destroyed due to a natural disaster is pure risk. In this example, it is unlikely that there would be any
potential benefit to this risk. There are products that can be purchased to mitigate pure risk. For example, home
insurance can be used to protect homeowners from the risk that their homes will be destroyed.
For pure risk to exist, it must be possible for loss to occur. Much of the job of a risk manager involves
estimating future losses and the variability of those future outcomes.

1.3. Attitude towards Risk
Risk adverse
• The premium is larger than the average loss
Risk neutral
• The premium is equal to the average loss
Risk seeker
• The person accepts risk at less than the average loss
1.4. Measurement of Risk
In finance, the standard deviation is regarded as the measure of risk. Standard deviation is the most common
statistical measure of variability. To provide some meaningful measure of risk, economists often use the square
root of the variance, the standard deviation, as a measure of risk. Larger standard deviations represent greater
risk.
If we have to compare two distributions with different means we would need to consider the coefficient of
variation (CV) (standard deviation of a distribution divided by its mean) as the relative value of risk.
Xi = value of observation i
N = number of observations
CV = Std. Dev. / Mean
The most important probabilities for risk managers are those associated with frequency and severity of losses
during a specified period of time. The average number of claims per year for a certain period is a measure called
frequency (claims / year).The size of the loss in term of value of losses per claim is called severity (losses /
claims).
1.5. The Law of Large Numbers
∑=
−−=N
ii NXXVariance
1
2 )1/()(
VarianceDev. Std. =
,/1∑=
=N
ii NXMean

The law of large numbers holds that as a sample of observations is increased in size, the relative variation about
the mean declines. This enables insurance companies to pool together many unpredictable individual loss
exposures and make them collectively predictable. The larger the sample size, the lower the relative risk.
Basically, the law of large numbers is a statistical axiom which states that the larger the number of exposure
units independently exposed to loss, the greater the probability that actual loss experience will equal expected
loss experience. In some instances, insurers can virtually eliminate their risk of loss by securing a large enough
number of units in an insured group.
1.6. Elements of pure risks
An important criterion for the law of large numbers to operate effectively is that all risks observed are
‘homogeneous’ or similar. The elements of risks can be described in terms of exposures, perils and hazards.
A) Exposure – denote the property or person facing a condition in which losses are possible.
The pure risks may cause personal, property or liability loss exposures.
1) Personal Loss Exposures – exposure to premature death, sickness, disability, unemployment, dependent
old age
2) Property Loss Exposures – associated with - ‘real’ property (buildings)
- ‘personal’ property (automobiles, contents of buildings)
3) Liability Loss Exposures – under the legal system one can be held responsible for causing damage to
others
Loss exposures may be due to – Accidental Causes – risks covered by the insurance industry
- Catastrophic Causes – risks that are hard to insure privately (floods,
hurricanes, terrorism attacks)
B) Perils – are the immediate causes of loss
1) Natural perils – cannot be controlled by people
2) Human perils – can be controlled by individuals
3) Economic perils – losses caused by recessions, employee strikes
Table 2. Types of perils
Natural perils Human perils
Insurable Difficult to insure (uninsurable)
Insurable Difficult to insure (uninsurable)
Windstorm Flood Theft War
Lightning Earthquake Vandalism Radioactive contamination
Natural combustion Epidemic Hunting accident Civil unrest
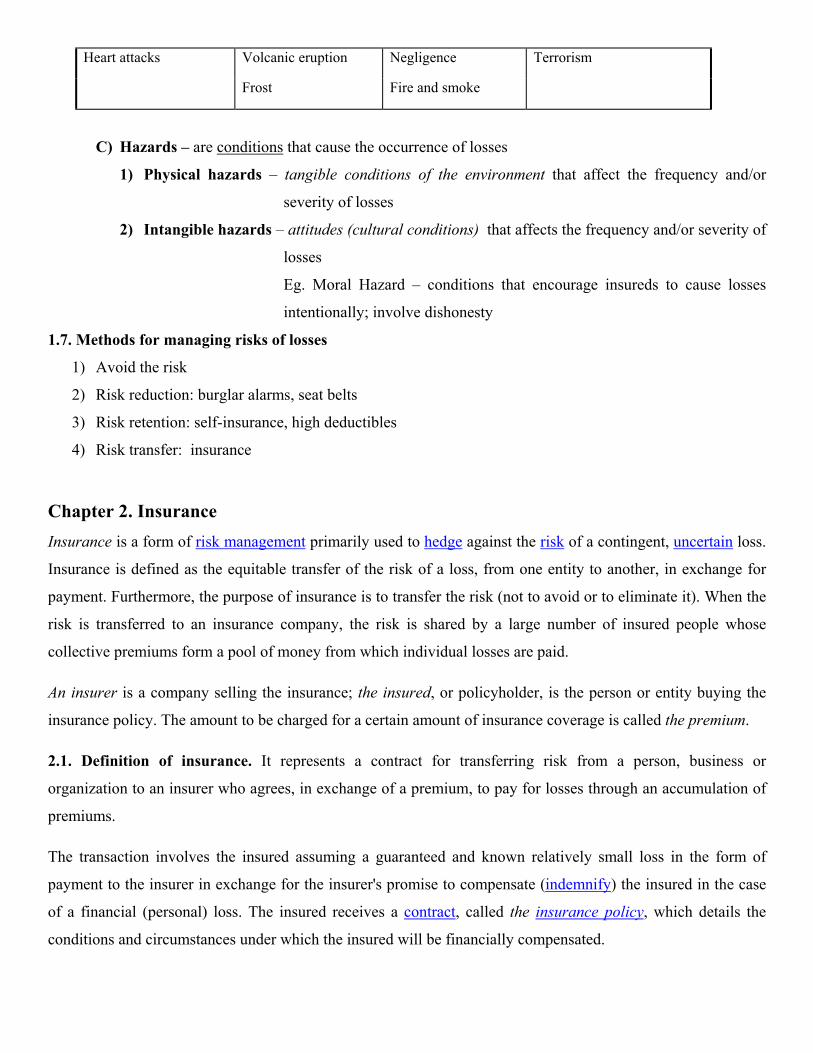
Heart attacks Volcanic eruption Negligence Terrorism
Frost Fire and smoke
C) Hazards – are conditions that cause the occurrence of losses
1) Physical hazards – tangible conditions of the environment that affect the frequency and/or
severity of losses
2) Intangible hazards – attitudes (cultural conditions) that affects the frequency and/or severity of
losses
Eg. Moral Hazard – conditions that encourage insureds to cause losses
intentionally; involve dishonesty
1.7. Methods for managing risks of losses
1) Avoid the risk
2) Risk reduction: burglar alarms, seat belts
3) Risk retention: self-insurance, high deductibles
4) Risk transfer: insurance
Chapter 2. Insurance Insurance is a form of risk management primarily used to hedge against the risk of a contingent, uncertain loss.
Insurance is defined as the equitable transfer of the risk of a loss, from one entity to another, in exchange for
payment. Furthermore, the purpose of insurance is to transfer the risk (not to avoid or to eliminate it). When the
risk is transferred to an insurance company, the risk is shared by a large number of insured people whose
collective premiums form a pool of money from which individual losses are paid.
An insurer is a company selling the insurance; the insured, or policyholder, is the person or entity buying the
insurance policy. The amount to be charged for a certain amount of insurance coverage is called the premium.
2.1. Definition of insurance. It represents a contract for transferring risk from a person, business or
organization to an insurer who agrees, in exchange of a premium, to pay for losses through an accumulation of
premiums.
The transaction involves the insured assuming a guaranteed and known relatively small loss in the form of
payment to the insurer in exchange for the insurer's promise to compensate (indemnify) the insured in the case
of a financial (personal) loss. The insured receives a contract, called the insurance policy, which details the
conditions and circumstances under which the insured will be financially compensated.

2.2. Characteristics of insurance
1. Existence of risk (risk transfer)
2. Loss sharing (risk distribution)
3. Discrimination (classification of risks)
1. Risk transfer:
Insurance is created by an insurer that assumes the financial aspect of risks transferred to it by insureds. The
insurer promises to pay whatever loss may occur as long as is not larger than the amount of insurance sold. In
return for accepting this risk the insurer receives a premium. Through the premium the policyholder has paid a
certain expense in order to transfer the risk of a possible large loss. The insurance contract stipulates what types
of losses will be paid by the insurer.
2. Loss sharing:
The premiums required by the insurer to assume risk are used to compensate those who incur covered losses.
Loss sharing is accomplished through premiums; therefore, group losses are shared by the group members. This
is the essence of pooling.
The premiums are intended to reflect each insured’s expected loss. For this purpose the actuaries, charged with
determining appropriate rates (prices) for coverage, estimate the probability of loss and the corresponding
severity (size) of loss. These estimates are made for a series of categories of insureds that are similar with
regard to their probability and severity of losses.
An underwriter determines which category is appropriate for each insured. Actuaries combine the probability
and size information to arrive at an average or expected loss.
Estimates are based on empirical (in this case, observed) data or theoretical relationships, making them
objective estimates. When the actuary must rely on judgment rather than facts, the estimates are termed
subjective. In most cases, both objective and subjective estimates are used in setting rates. For example the
actuary may begin with industry-determined rates based on past experience and adjust them to reflect the
actuary’s “feelings” about the insurer’s own expected experience.
Predictions
The insurer is not required to predict which of the insureds will experience loss. The insurer needs to know only
how many in the group will experience loss. The large pool of exposures for which the insurer has assumed risk
provides the insurer with a base upon which to make predictions. The larger is that base, the more accurate the
prediction.

This statistical phenomenon through which the pooling of experience reduces risk is the law of large numbers.
We are aware of how this law applies to human mortality, fires, auto accidents because their probability is
revealed in a relatively short time. For other events, such as earthquakes, tidal wave, and typhoons, it may take
centuries for the law of law numbers to reveal a pattern.
3. Discrimination: The Essence of Pooling
In order for the law of large numbers to work, the pooled exposures must have approximately the same
probability of loss (it must follow the same probability distribution). In other words, the exposure need to be
homogeneous (similar). Insureds need to discriminate (classify) exposures according to expected loss. For this
reason, twenty-year-old insureds with relatively low rates of mortality are charged lower rates for life insurance
than are sixty-year-old insureds, holding factors other than age constant.
If the two groups of dissimilar risk exposures were charged the same rate, problems would arise because rates
reflect average loss costs. Thus, a company charging the same rate to both twenty-year-old insureds and sixty-
year-old insureds would charge the average of their expected losses. The pooling will be across ages, not by
ages. Having a choice between a policy from this company and one from a company that charged different rates
based on age, the sixty-year-old insureds would choose this lower-cost, single-rate company while the young
insureds would not.
This phenomenon of selecting an insurer that charges lower rates for a specific risk exposure is known as
adverse selection because the insureds know they represent higher risk, but want to enjoy lower rates.
Adverse selection occurs when insurance is purchased more often by people with higher than average expected
losses. Insurance is of greater use to insureds whose losses are expected to be high. The solution is for the
insurers to charge higher premiums to insureds with higher expected losses. Often the insurer does not have
enough information to be able to distinguish completely among insureds (exception the cases of life insurance
for younger versus older insureds). Furthermore, the insurer wants to aggregate in order to use the law of large
numbers.
Adverse selection can result in greater than expected losses. Insurers try to identify such people so they can
either be rejected or put in the appropriate rating class of similar insureds with similar loss probability. Many
insurers, for example, require medical examinations for applicants of life insurance.
Some insurance policies provisions are designed to reduce adverse selection.
Eg:- the suicide clause in life insurance contracts excludes coverage if a policyholder takes his or her own life
within a specified period, generally one or two years;

- the pre-existing conditions provision in health insurance policies is designed to avoid paying benefits to people
who buy insurance because they are aware of an ailment that will require medical attention or disable them in
the near future.
2.3. Characteristics of insurable risks
Insurance involves pooling funds from many insured entities (known as exposures) to pay for the losses that
some may incur. The insured entities are therefore protected from risk for a fee, with the fee being dependent
upon the frequency and severity of the event occurring. In order to be insurable, the risk insured against must
meet certain characteristics in order to be an insurable risk. Insurance is a commercial enterprise and a major
part of the financial services industry, but individual entities can also self-insure through saving money for
possible future losses.
Risk which can be insured by private companies typically share seven common characteristics:
1. Large number of similar exposure units: Since insurance operates through pooling resources, the majority of
insurance policies are provided for individual members of large classes, allowing insurers to benefit from the
law of large numbers in which predicted losses are similar to the actual losses. Exceptions include Lloyd's of
London, which is famous for insuring the life or health of actors, sports figures and other famous individuals.
However, all exposures will have particular differences, which may lead to different premium rates.
2. Definite loss: The loss takes place at a known time, in a known place, and from a known cause. The classic
example is death of an insured person on a life insurance policy. Fire, automobile accidents, and worker injuries
may all easily meet this criterion. Other types of losses may only be definite in theory. Occupational disease,
for instance, may involve prolonged exposure to injurious conditions where no specific time, place or cause is
identifiable. Ideally, the time, place and cause of a loss should be clear enough that a reasonable person, with
sufficient information, could objectively verify all three elements.
3. Accidental loss: The event that constitutes the trigger of a claim should be fortuitous, or at least outside the
control of the beneficiary of the insurance. The loss should be pure, in the sense that it results from an event for
which there is only the opportunity for cost. Events that contain speculative elements, such as ordinary business
risks or even purchasing a lottery ticket, are generally not considered insurable.
4. Large loss: The size of the loss must be meaningful from the perspective of the insured. Insurance premiums
need to cover both the expected cost of losses, plus the cost of issuing and administering the policy, adjusting
losses, and supplying the capital needed to reasonably assure that the insurer will be able to pay claims. For
small losses these latter costs may be several times the size of the expected cost of losses. There is hardly any
point in paying such costs unless the protection offered has real value to a buyer.

5. Affordable premium: If the likelihood of an insured event is so high, or the cost of the event so large, that the
resulting premium is large relative to the amount of protection offered, it is not likely that the insurance will be
purchased, even if on offer. Further, as the accounting profession formally recognizes in financial accounting
standards, the premium cannot be so large that there is not a reasonable chance of a significant loss to the
insurer. If there is no such chance of loss, the transaction may have the form of insurance, but not the substance.
6. Calculable loss: There are two elements that must be at least estimable, if not formally calculable: the
probability of loss, and the attendant cost. Probability of loss is generally an empirical exercise, while cost has
more to do with the ability of a reasonable person in possession of a copy of the insurance policy and a proof of
loss associated with a claim presented under that policy to make a reasonably definite and objective evaluation
of the amount of the loss recoverable as a result of the claim.
7. Limited risk of catastrophically large losses: Insurable losses are ideally independent and non-catastrophic,
meaning that the losses do not happen all at once and individual losses are not severe enough to bankrupt the
insurer; insurers may prefer to limit their exposure to a loss from a single event to some small portion of their
capital base. Capital constrains insurers' ability to sell earthquake insurance as well as wind insurance in
hurricane zones. In the US, flood risk is insured by the federal government. In commercial fire insurance it is
possible to find single properties whose total exposed value is well in excess of any individual insurer's capital
constraint. Such properties are generally shared among several insurers, or are insured by a single insurer who
syndicates the risk into the reinsurance market.
2.4. Insurers’ Business Model
Underwriting and investing
The business model is to collect more in premium and investment income than is paid out in losses, and to also
offer a competitive price which consumers will accept. Profit can be reduced to a simple equation: Profit =
earned premium + investment income - incurred loss - underwriting expenses.
Insurers make money in two ways:
1.Through underwriting, the process by which insurers select the risks to insure and decide how much in
premiums to charge for accepting those risks;
2.By investing the premiums they collect from insured parties.
The most complicated aspect of the insurance business is the actuarial science of ratemaking (price-setting) of
policies, which uses statistics and probability to approximate the rate of future claims based on a given risk.
After producing rates, the insurer will use discretion to reject or accept risks through the underwriting process.

Underwriting is the process of classifying potential insured into appropriate risk classifications in order to
charge the correct rate. Note that not all applications for insurance are acceptable and fair discrimination is
necessary to reduce adverse selection.
Underwriters use the following three financial ratios to help them accomplish their task:
Loss ratio = incurred losses/ earned premiums; high loss ratios may indicate that an insurance company
may need better risk management policies to guard against future possible insurance pay-outs.
Expense ratio = underwriting expenses/ written premiums
Combined ratio = loss ratio + expense ratio ; the combined ratio measures claim losses and operating
expenses against earned premiums; a ratio below 100% represents a measure of profitability and the
underwriting efficiency of an insurance firm; ratios above 100% denote a failure to earn sufficient
premiums to cover expected claims.
Claims
Claims and loss handling is the materialized utility of insurance; it is the actual "product" paid for. Claims may
be filed by insureds directly with the insurer or through brokers or agents. The insurer may require that the
claim be filed on its own proprietary forms, or may accept claims on a standard industry form.
Insurance company claims departments employ a large number of claims adjusters supported by a staff of
records management and data entry clerks. Incoming claims are classified based on severity and are assigned to
adjusters whose settlement authority varies with their knowledge and experience. The adjuster undertakes an
investigation of each claim, usually in close cooperation with the insured, determines if coverage is available
under the terms of the insurance contract, and if so, the reasonable monetary value of the claim, and authorizes
payment.
In managing the claims handling function, insurers seek to balance the elements of customer satisfaction,
administrative handling expenses, and claims overpayment leakages. As part of this balancing act, fraudulent
insurance practices are a major business risk that must be managed and overcome. Disputes between insurers
and insureds over the validity of claims or claims handling practices occasionally escalate into litigation.
Marketing
Insurers will often use insurance agents to initially market or underwrite their customers. An agent legally
represents the insurance company. A broker represents a customer. Insurance broker finds sources for contracts
of insurance on behalf of their customers.

Agents can be captive, meaning they write only for one company, or independent, meaning that they can issue
policies from several companies. The existence and success of companies using insurance agents is likely due to
improved and personalized service.
Traditionally, the distribution systems used to market insurance are classified as follows:
Exclusive agency system = a distribution system through which agents represent only one company or a group
of companies under similar management.
Direct writer system = a system for selling insurance wherein the insurer sells directly to the insured via its
employees.
Independent agency system = is a system for the distribution of insurance through independent contractors
which represent different companies.
Chapter 3. Technical Elements of Insurance 1. The insurance subjects
The insurer: The juridical person that administrates the insurance fund and takes the obligation to pay
to the insured either the indemnity or the sum insured.
The insured: Any physical or juridical person that contracts the insurance and has the right to collect
the indemnity or the sum insured.
The contracting of the insurance
e.g. The accident insurances subscribed by the tourism agencies for their clients.
The beneficiary is mentioned in the contract by nominalization; the beneficiary is the person entitled to
collect the sum insured or the indemnity.
Obs. May be a third part person, unknown at the moment of subscribing a liability insurance.
2. The insurance objects may be
The insured property
The insured person
The insured liability
3. The insured risk is the chance of loss.
Only pure risks are insurable risks.
4. The insurable interest represents a chance of financial loss or a personal or financial interest in the insured
property or individual.

5. The sum insured (Sa) represents the upper limit of the insurer’s engagement towards the insured, if the
insured risk (peril) occurs. It’s settled by the insurance contract.
Property insurance – the sum insured is established in accordance with the value of the insured
property.
Obs. The indemnity cannot exceed the loss suffered by the insured, it cannot exceed the real value of the
property when the event occurred and it cannot exceed the sum insured.
Obs. The sum insured is established by the insured for voluntary insurances or by law for compulsory
insurances.
Life and health insurance – – the sum insured is established by the insured because the life and health
of humans cannot be estimated in money.
Liability insurance – the limitation of the insurer responsibility usually operates here, limitation by
event (after each event the insurer’s guarantee is reconstituted) or by insurance year.
6. The insurance premium represents the payment a policyholder agrees to make for an insurance policy.
When insured parties experience a loss for a specified peril, the coverage entitles the policyholder to make a
claim against the insurer for the covered amount of loss as specified by the policy. The fee paid by the insured
to the insurer for assuming the risk is called the premium.
The premium has two parts:
-net (pure, risk) premium – the part of the premium which is sufficient to pay for losses and loss adjustment
expenses;
-the loading – the part of an insurance rate designed to cover expenses, profit and a margin for contingencies
(reserve fund).
Gross premium (Pb) = net premium (Pn) + the loading (L)
The net premium and the loading constitute the gross premium (Pb) or the commercial premium. So, the gross
premium is obtained by adding to the net premium the loading of net premium with the following destinations:
L: l(1) -> for constituting the reserve fund 0.25
Insurance premiums from many insureds are used to fund accounts reserved for later payment of
claims — in theory for a relatively few claimants — and for overhead costs. So long as an insurer
maintains adequate funds set aside for anticipated losses (called reserves), the remaining margin is an
insurer's profit.
l(2) -> for financing preventive actions 0
l(3) -> for covering the insurers expenses; chosen between 0.10- 0.25
l(4) -> technical profit of the insurer; chosen between 0- 0.15
The insurance premium measured in monetary units is a function of two factors: the ratio and the sum insured.

Premium(Pa) = the ratio (Ct)* sum insured (Sa)
The ratio is the charge for a monetary unit of insurance used as a basis for the calculation of premium. Ct =
Gross premium for every x monetary unit insured
In order to stimulate the concern of the insureds for the insured property, the Bonus-Malus system has been
introduced in the international practice. The Bonus clause stipulates that the insured that are not generating
indemnity payments benefit from premium reductions in the next year. The Malus clause stipulates that the
insureds that are generating repeated indemnity payments are subject to premium raise.
7. The damage, the average, the loss (Pg)
The damage represents the loss, in monetary expression, of an insured good as a result of the
occurrence of the covered risk (peril).
The average represents any loss, expense or prejudice to a transport facility or a commodity during
transportation.
A. Transport insurance: the particular (simple) average refers to the damage suffered only by the transport
facility or by the transported commodities in the period between their departure from the deposit until their
arrival at destination.
B. Marine insurance: the general (gross) average is a specific type of average, brought about the men,
consisting of a loss that was caused intentionally to the ship or to the transported commodities in order to save
both the ship and the freight.
Eg. In order to save the ship a part of the freight is jetted into the sea, so the participants at the expedition will
share the loss of the sacrificed goods.
8. The indemnity (Dp). Covering systems in property insurance.
To "indemnify" means to make whole again, or to be reinstated to the position that one was in, to the extent
possible, prior to the happening of a specified event or peril. An insured is "indemnified" against the loss
covered in the policy.
In order to determine the indemnity, the following two situations and variants have to be considered:
Situation 1 Total loss Pg=Vr (the property is entirely destroyed)
Situation 2 Partial loss Pg<Vr
a. Sa ≥ Vr (overinsurance)
b. Sa < Vr (underinsurance)
Situation 1 Total loss Pg=Vr
a. Sa ≥ Vr (overinsurance)
then Dp = Pg

b. Sa < Vr (underinsurance)
then Dp = Sa
Situation 2 Partial loss Pg<Vr
If the insured property wasn’t entirely destroyed, the indemnity is settled as a function of the covering system:
1.Proportional covering system
a. if the insurance was settled for a sum insured greater or equal than the real value of the good, then the
indemnity equals the damage.
Sa ≥ Vr then Dp = Pg
b. In the case of under insurance the indemnity represents only a part of the damage, corresponding to
the degree of covering by insurance
Sa < Vr then Dp = Pg* Sa/Vr
2.First risk covering system – the system guarantees a complete indemnification for the partial damages up to
maximum the sum insured.
Dp = Pg ≤ Sa
3.The limited covering system (with franchise) - The franchise is the part of the damage that stays in the
charge of the insured; it is the portion of any claim that is not covered by the insurance provider.
The franchise may be settled as a fixed sum, as a percentage from the damage or from the sum insured or in a
mixed system (a percentage but minimum a fixed sum; Ff=MAX{%Pg; F}).
The franchise may be
a. Deductible – its value is substracted from any damage
Sa ≥ Vr then Dp = Pg - F
Sa<Vr then Dp = Pg - F ≤ Sa
b. Non-deductible – it acts only for smaller damages, greater damages being totally indemnified
Sa ≥ Vr then
1.Pg< F => Dp = 0
2.Pg>F => Dp = Pg
Sa<Vr then
1.Pg< F => Dp = 0
2.Pg>F => Dp = Pg ≤ Sa
The arguments and motivations that support the introducing of the limited covering system are the following:

The need to release the insurer from small damages – the deductible assumes that small damages are
not indemnified, so the insurer concentrates over the important damages;
The declining in insurance cost – the number of small damages not paid represent an economy for the
insurer, so he has the possibility to set smaller premiums for these insurances or to offer premium
reductions;
The preventive function of the system – the insured will be more careful than in the case of complete
insurance, knowing that in case of damage he has to pay a part of it.
9. The period of insurance represents the period of time at which the rights and obligations of the parts refer
to and it’s stipulated in the contract. Furthermore, for property and liability insurances the contracts are
concluded for a period of insurance of maximum one year while for life insurances the period can be of
5,10,12,20, 30 years or undetermined (lifelong insurances).
Practical examples for computing the indemnity according to the covering systems:
Problem 1. Regarding a property insurance contract we have the following information.
Vr=7500 mu
Sa=5000 mu
Pg=6050 mu
F=5% Pg.
Determine the indemnity of the insured
a) in the proportional covering system
b) in the first risk covering system
c) in the limited covering system with deductible franchise
Pg < Vr
Sa<Vr underinsurance
a) Dp=Pg * Sa/Vr => Dp = 6050* 5000/7500 = 4033 mu
b) Dp=Pg≤Sa => Dp = 5000 mu
c) Dp=Pg-F≤Sa => Dp = 6050-0.05*6050=5747 ≤ 5000 => Dp=5000
Problem 2. Knowing
Vr=7500 mu
Sa= 5000 mu
Pg=3750
F=250 mu, determine the indemnity in the
a) proportional covering system
b) first risk covering system

c) limited covering system with non-deductible franchise
Pg<Vr
Sa<Vr underinsurance
a) Dp= Pg*Sa/Vr => Dp=3750*0.667=2500 mu
b) Dp=Pg≤Sa => Dp=3750 mu
c) Pg>F => Dp=Pg≤Sa => Dp= 3750 mu
Problem 3. Knowing
Vr=1500 mu,
Sa=2000 mu ,
Pg=780 mu ,
F=10%Pg, but minimum 50 mu, determine the indemnity
a) in the proportional covering system
b) in the first risk covering system
c) in the limited covering system with deductible franchise(Ff=MAX {10%Pg, 50}
Pg<Vr
Sa>Vr overinsurance
a) Dp=Pg => Dp = 780 mu
b) Dp=Pg≤Sa =>Dp = 780mu
c) Ff = 78
Dp = Pg - Ff => Dp =780-78=702 => Dp=702
Problem 4. Knowing
Vr=3000 mu
Sa=2200mu,
Pg=2850mu,
F = 5% Sa, but min 100 mu, determine the indemnity
a) in the proportional covering system
b) first risk covering system
c) limited covering system with deductible franchise (Ff=MAX 10%Pg, 100)
Pg<Vr
Sa<Vr underinsurance
a) Dp=Pg*Sa/Vr=> Dp=2850*2200/3000=2090 mu
b) Dp=Pg ≤ Sa => Dp=2200 mu

c) Ff=110 => Dp=Pg-Ff ≤Sa => Dp=2850-110= 2740 ≤ Sa => Dp=2200 mu
Chapter 4. The Insurance Contract A contract represents a legal agreement between two or more competent parties that promises a certain
performance in exchange for a certain consideration.
1. Requirements of a contract
• Competent parties – A contract is not valid unless it is made between competent parties under the law.
Examples of incompetent parties: a minor, a person who is insane or under the influence of drugs or alcohol.
• Legal purpose – a contract that is against public policy or in violation of the law, is not enforceable.
Eg A contract of insurance to cover losses caused by the insured’s own arson would be illegal and contrary to
public policy.
• Offer and acceptance (agreement) – a contract must involve at least two parties: one who makes the offer
and one who accepts it. An offer is a promise that requires an act or another promise in exchange; acceptance
occurs when the other party agrees to the offer.
• Consideration is the price each party demands for agreeing to carry out his or her part of the contract. The
consideration given by the insured is the premium payment; the consideration given by the insurer is the
promise to pay for losses suffered by the insured.
2. Characteristics of insurance contracts
• Principle of Indemnity - the insurer agrees to pay no more and no less than the actual loss suffered by the
insured. The principle of indemnity is related to the requirement of insurable interest and the exclusion of
speculative risks, so an insured can be indemnified to the extent of his/her insurable interest. The principle of
indemnity is supported by the right of subrogation: it gives the insurer whatever claim against third parties the
insured may have as a result of the loss for which the insurer paid.
• Personal – an insurance contract insures the person who owns the property (not the property).
• Aleatory – under an aleatory contract one party’s performance depends on an uncertain event, so the
exchange of value might appear to be unequal.
• Adhesion – for contracts of adhesion, one party has greater power over the other party in drafting the
contract. For insurance contracts the insurer has greater power over drafting the contract (prepares the
provisions of the contract) while the insured simply adheres to the policy terms. Ambiguity occurs when the
insurer doesn’t make the terms and agreements of the policy perfectly clear, and the courts usually resolve any
ambiguity in policy wording in favour of the insured.
• Unilateral – only the insurance company is legally bounded to perform its part of the agreement. The
insureds are not legally obligated to pay premiums. If insureds stop paying premiums, the insurance company
can cancel coverage, but can’t take the policyholder to court for breaking the contract.
• Contract of Utmost Good Faith – the insurance company relies on the truthfulness and integrity of the
applicant when issuing a policy. The insured relies on the company’s promise and capability to provide
coverage and pay claims.
• Conditional – an insurance policy includes a number of conditions that both the insured and the insurer must
comply with. The insurer can refuse to perform if the insured does not satisfy certain conditions contained in the
contract.
3. Parts of an insurance contract
3.1. Declarations are statements that identify the covered person or organization and give information about the
loss exposure and the amount of coverage provided; they can include the period of coverage and the limitations
of liability (maximum amount payable).
3.2. Insuring agreement (clauses) – are a general statement of the promises the insurer makes to the insured,
stating the losses for which the insured will be indemnified; it describes the type of property covered and the
perils against which it is insured.
a. Variation in insurance clauses (either simple, such as in life insurance, or package policies -> several
insurance clauses, one for each major type of coverage)
b. Named- perils policy covers losses caused by the listed perils vs. Open- perils policy covers losses caused
by all perils except those excluded – very few policies are “all risk” in the sense of covering every conceivable
peril.
c. Exposures to loss are defined in the insuring agreement as basis of valuation (actual cash value; replacement
cost) and types of losses covered.
3.3. Conditions – state the ground rules for the policy, describing the responsibilities and the obligations of the
insured and insurer
a. Notice and proof of loss – the insurer has to be notified when the event, accident or loss occurs. If
notice is not made within a reasonable time after the loss, the insurer is relieved of all liability under contract
b. Suspension of coverage - the insurer is released from liability for some risk situations he wants to avoid.
c. Cooperation of the insured - the insured must fulfil certain conditions before the insurer will pay for
losses. The purpose of cooperation clause is to force the insured to perform the way they would if they did not
have insurance.
d. Protection of property after loss – the insured is required to protect the property after a loss in order to
reduce the loss as much as possible

3.4. Exclusions and exceptions
The main reasons for this part are to avoid financial catastrophe for the insurer, to exclude intentional losses, to
avoid duplication of coverage and to reduce adverse selection.
A policy may exclude specific locations, perils, property or losses.
3.5. Endorsements are used with property or casualty policies while riders are used for life/health policies. A
rider or endorsement makes a change in the contract to which it is attached. It may increase or decrease the
coverage, change the premium, correct a statement, or make any number of other changes.

MODULE III. PORTFOLIO MANAGEMENT
1. RISK, RETURN AND DIVERSIFICATION Securities derive their value from the cash flow they are expected to generate. Since the cash flow will be received over future periods, there is need to discount these future flows in order to derive a present value or price for the security.
Assuming that we are valuing the security over a single holding period (say, a year) we can illustrate the process of valuation with a particularly simple model:
, r = discount rate (1)
The model indicates that the present value or current price P0 of the security is the cash flow (dividends or coupons) received over the period plus the expected price at the end of the period P1, discounted back at the rate r.
The discount rate is alternatively referred to as a required return and is composed of two elements:
r = Rf + the risk premium (2)
a). a risk free return Rf , which is generally considered to comprise a real return component and an inflation premium. The real return Rr is the basic investment compensation that investors demand for forgoing current consumption; that is the compensation for saving. Investors also require a premium to compensate for inflation. The real return and inflation premium are a basic return demanded by all investors, so the risk free return is a return component required of all securities.
b). a risk premium which is made up of the following elements: (1) interest rate risk, (2) purchasing power risk, (3) business risk and (4) financial risk. The premium that investors require to compensate the risk will differ across securities as the perceived exposure to the risk elements is high or low for the security.
By rearranging equation (1) we can obtain directly the discount rate r. In this form it is usual to think of the discount rate as a return expected E(R) by investors, that is, an expected return.
(3)
We can also use equation (3) for calculating the return earned on a security over a past period (realized return). This time we would insert a realized return for the cash flow and an actual ending period price rather than expected values of these variables.
In calculating the return for a common stock, it is helpful to think of the realized return as consisting of a yield component – dividend divided by beginning-of-period-price – and a capital gain component, which is the percentage change in price over the period.
(4)
The estimated or expected return of a portfolio of securities is merely a weighted average of the expected returns of the individual securities of which the portfolio is composed.
(5)
(6)
wi = the security’s proportion of the portfolio;
= the expected return of security i (average return of a period);

rit = the realized return of stock i at time t;
N = the total number of securities comprised in the portfolio;
T = the total number of observations (time moments).
eg. What is the expected return of a portfolio of which stock A with an expected return of 10% constitutes 60% and of which stock B with an expected return of 12% constitutes 40%?
In addition to determining the rate of return it is also important to assess the risk or uncertainty that may be associated with earning the return.
Risk can be considered a factor which makes the actual return on an investment to be different from the expected one. Risk can also be defined as the uncertainty of future events that can generate financial losses. It doesn’t matter what kind of investment an investor is willing to make in order to avoid risk as long as every investment has a certain level of uncertainty with respect to the future returns. Risk cannot be completely eliminated and in some cases the level of risk is quite high.
In order to measure the level of risk on an investment, the first step is to compute the holding period returns and to estimate their likelihood. In this way a list of possible outcomes is created. This list contains both the holding period returns and the probability of each outcome.
The list of possible HPRs with associated probabilities is called the probability distribution of HPRs. The probability distribution lets us derive measurements for both the reward and the risk of the investment. The reward from the investment is its expected return, which you can think of as the average HPR you would earn if you were to repeat an investment in the asset many times. The expected return also is called the mean of the distribution of HPRs and often is referred to as the mean return. (Bodie, Kane, Marcus – Essentials of investments, pg 121)
In addition to determining the rate of return, it is also important to assess the uncertainty that may be associated with earning the return. The variance of return and standard deviation of return are alternative statistical measures for the risk of return.
The variance of return and standard deviation of return are alternative statistical measures that are proxies for the uncertainty or risk of return. These statistics in effect measure the extent to which returns are expected to vary around an average over time. Extensive variations around the average would indicate great uncertainty regarding the return to be expected.
The variance is merely the average of the squared deviations of the individual returns from the average.
2 (7)
Standard deviation = (8)
The statistics measure the extent to which returns are expected to vary around an average over time. Extensive variation would indicate great uncertainty regarding the return to be expected.
If possible scenarios with associated probabilities have been identified then expected return and risk will be computed based on the following relations:
(9)
(10)
(11)

E(R) – expected return; p(i) – probability of scenario i; E(Ri) – possible outcome in scenario i; - standard deviation;
While standard deviation and variance measure the riskiness of a security in an absolute sense, there is also need to consider the riskiness of a security within the context of an overall portfolio of securities.
The riskiness of a portfolio will depend on how a security blends with the existing securities and contributes to the overall risk of a portfolio. The covariance is a statistic that measures the riskiness of a security relative to others in a portfolio of securities.
In essence the way securities vary with each other affects the overall variance, hence the risk of the portfolio.
(12)
If the securities move counter to each other than the covariance is a negative value. If the securities move consistently in tandem than the covariance is positive.
To facilitate interpretation it is useful to standardize the covariance. Dividing the covariance between two securities by the product of the standard deviation of each security produces a variable with the same properties as the covariance but scaled to a range of -1 to +1. The measure is called the correlation coefficient.
(13)
Negative correlation is desirable in a security because such a security has great risk reducing potential in a portfolio context. Anyway in pragmatic settings it is difficult to find negatively correlated securities.
So the variance or risk of a portfolio is not simply a weighted average of the variances of the individual securities in the portfolio. There is also need to consider the relationship between each security in the portfolio and every other security as measured by the covariance of returns.
For a portfolio of two securities i and j the risk measured by the portfolio variance is calculated as follows:
(14)
where wi and wj are the proportions that securities i and j represent in the portfolio.
The risk of a portfolio measured by the variance is a weighted average of the variances of the individual securities plus the covariance between each security and every other security in the portfolio. By diversifying the portfolio (increasing the number of securities) investors manage to substantially reduce the risk. Diversification works because prices of different stocks do not move exactly together. Yet most of the stocks that the investor can actually buy are tied together in a web of positive covariances which set the limit to the benefits of diversification.
The risk that potentially can be eliminated by diversification is called diversifiable risk, specific risk, unsystematic risk or residual risk. This specific risk stems from the fact that many of the perils that surround an individual company are peculiar to that company and perhaps its immediate competitors.
But there is also some risk that can’t be avoided regardless of how much the portfolio is diversified. This risk is generally known as market risk, systematic risk or undiversifiable risk. Market risk stems from the fact that there are other economy wide perils which threaten all businesses. That is why stocks have a tendency to move together. And that is why investors are exposed to market uncertainties no matter how many stocks they hold.
In order to determine the contribution of an individual security to the risk of a well diversified portfolio it is necessary to measure its market risk. The sensitivity of a security to market movements is called beta (β).

(15)
where is the covariance between stock i’s return and the market return and is the risk of the market measured by the variance of the market return.
Stocks with beta greater than 1 tend to amplify the overall movements of the market and are called offensive or aggressive stocks. Stocks with betas between 0 and 1 tend to move in the same direction as the market but not as far. They are called defensive stocks.
The difference between the return on the market and the risk free rate is termed the market risk premium (rm-rf). The return on the risk-free asset is not affected by what happens to the market. The risk free asset has a beta of zero. The risk free asset has a risk premium of zero. The market portfolio has a beta of 1 and a risk premium of (rm-rf).
But what is the expected risk premium when beta is not 0 or 1? The answer to that question is given by the capital asset pricing model CAPM. In a competitive market the expected risk premium varies in direct proportion to beta.
CAPM: ri – rf = βi (rm-rf)
expected risk premium = beta × market risk premium
E(r)
SML (security market line)
rm M (market portfolio)
rf
0 1 beta
When the equation of the CAPM is plotted in expected return-beta coordinates it yields a straight line. The line is determined by the return on the risk-free asset which has a beta of zero and the expected return on the market which has a beta of one.
2. PORTFOLIO OPTIMIZATION
2.1 THE MEAN-VARIANCE MODEL
Harry Markowitz formulated in 1952 a theory which established the bases for optimal portfolio selection and revolutionized the field of financial analysis. He established a model to determine “efficient portfolios”, namely those portfolios, which for a given return minimize investors’ risk or for a given risk maximize investors return. The model is named mean-variance model, because it uses the mean to establish the expected return and the variance to measure the risk.
Mean-variance management is realized in two steps. First, efficient portfolios are being determined without taking into consideration investor’s option. Second, the efficient portfolio which maximizes investor’s satisfaction is being selected.

Efficient portfolio selection
Source: after Todea A., 2006, Investiţii, Ed. Casa Cărţii de Ştiinţă, Cluj-Napoca, pg. 124
Markowitz model is based on a series of hypothesis:
1. Investment decision is taken under conditions of risk. In this way the future return of a financial asset is a random variable.
2. The returns of different financial asset do not fluctuate independently. They are correlated, with covariance different than zero.
3. The behavior of investors is characterized by a certain degree of risk aversion. 4. Investors are rational, regardless the fact that their preferences are subjective. 5. Investors have the same horizon of decision and that is a single period.
In order to determine the optimal portfolio, an investor has to go through two phases:
1. All possible solutions will be divided into two parts. First containing all efficient solutions and the second containing the inefficient solutions.
2. The efficient solution which maximizes investor’s utility will be identified.
Any investor will select a portfolio which is located on the curve that borders the area of feasible portfolios, in the figure below. Portfolios 2 and 3 will be preferred to portfolios 1 and 4. The upper part of the curve, the place where the efficient portfolios are located, was named by Markowitz as the efficient frontier.
Identifying the efficient frontier
I1
I2
σ(Rp)
E(Rp
)

Source:after Cobbaut R., 1994, Théorie Financière, Ed. Economica, Paris, pg. 98
2.1.1 The efficient frontier without the risk‐free asset
The analytical technique for obtaining the efficient frontier of risky assets was developed by Markowitz in 1951. The first thing that needs to be done is to determine the risk-return opportunity set. The target is to build portfolios in the northwestern part of the graph, in terms of expected return and standard deviation from the universe of securities.
The graph that connects all the northwestern portfolios is the efficient frontier of risky assets. It represents the set of portfolios that offers highest expected return for each level of standard deviation. These portfolios are efficiently diversified. The combination between expected return and standard deviation of an individual asset is located inside the efficient frontier.
When investors choose among portfolios on the efficient frontier, they take into consideration only portfolios that are above the minimum-variance portfolios. They have the some risk as the ones below the minimum-variance portfolios, but they offer a higher expected return.
Some constraints may block an investor from choosing portfolios from the efficient frontier. Short sale restrictions are a possible constraint. The optimization program is design to include a constraint to make sure that the expected dividend yield will be equal or greater than the desired level.
In general, managers can create an efficient frontier to meet any particular objective. If investors want those constraints to be satisfied, then they have to pay a price. An efficient frontier which is subject to some constraints offers a lower reward-variability ratio.

Portfolio optimization procedure
Source: after Cobbaut R., 1994, Théorie Financière, Ed. Economica, Paris, pg. 102
The efficient frontier is formed through the combination of N risky assets, and it has the smallest variance for a given expected return E*. In order to determine the proportions you have to minimize the variance of the portfolio given by the following formula:
(16) Under the following restrictions:
; (17)
; (18)
Using the Lagrange multiplayer, we minimize the following equitation:
(19)
We make the partial differential of the equation in respect to and obtain the following system with N+2 equations and N+2 unknowns.
B’
C
B
A
E(Rp)
σ(Rp)
∞=Φ
1=Φ 0=Φ

The system can be also written under matrices form: C x X=K, while C is the vector for variance and covariance, X is the vector for the unknowns. The proportion of each asset in the portfolio can be expressed therefore through the following: X= ;
2.1.2 The efficient frontier with the risk‐free asset
The risk-free asset was introduced in the portfolio of risky assets by Sharpe, in different combinations in relation to the risk-profile of the investor. Investment strategies invoked by Sharpe are restricted by the existence on the financial market of an asset with positive return and risk equal to zero.
The existence of such an asset has some conditions:
1. The absence of the credit risk 2. The absence of the interest rate risk 3. To forecast the rate of inflation 4. The absence of the liquidity risk
The introduction of the risk-free asset in the portfolio modifies the efficient frontier from a curve to a straight line. The slope will offer reliable elements for measuring the price of the market risk. The optimization of a portfolio with the risk-free asset assumes two operations:
1. Determining the optimal risky portfolio that is unique for all investors regardless of their risk aversion.
2. Building the final portfolio through the optimal combination between the portfolio of risky assets and the risk-free asset depending on the investor preferences.
The efficient frontier with the risk free asset
Source: after Bodie Z., A. Kane, A.J. Marcus, 2001, Essentials of Investments, McGraw-Hill, pg. 201
Considering a portfolio built by investing the proportion wZ from the buget in a portfolio A located on the efficient frontier and the proportion (1- wZ) from the budget in the risk-free asset.
O
Z
σ(Rp)
E(Rp
)
LACZ Rf
Fi Ff

fZZZP RwREwRE )1()()( −+= (20)
)()( 222ZZP RwR σσ = (21)
As E(RP) and )(2PRσ are linear functions on wZ, all portfolios composed after the indicated model will belong
to RfZ. The same operation can be repeted for each point of the efficient frontier between Z and O, which is the tangency point between RfO with the initial efficent frontier (Fi). The efficient portfolios are located on the O line and have the following characteristics:
fOOOP RwREwRE )1()()( −+= (22)
)()( 222OOP RwR σσ = (23)
The equation of the line that goes through points and O has the following formula:
)()(
)()( P
O
fOfp R
RRRE
RRE σσ
−+= (24)
Portfolios located on the O line are dominating the portfolios located on the initial efficient frontier.
It is noticeable from the graph that an investor would borrow at the risk-free rate for investing in portfolio O, because the section between O and the efficient frontier is dominating the section between O and the initial efficient frontier. Portfolio O is to be considered a benchmark.
2.2 INDEX MODELS AND EFFICENT PORTFOLIO CONSTRUCTION
2.2.1.The single index model
The single index model was developed by William Sharpe in his doctoral thesis in 1963. This one factor model is based on the theory of price formation of financial assets in an uncertain medium.
Sharp’s apotheosis is given by the following regression:
(25)
is the return of i at the moment t
are the linear parameters of the regression
is a economic index( GDP, stock index)
is a random variable , with the expected value zero, with constant variance(homoskedasticity), no autocorrelation.
Studies have shown that the index that explains the best, the return of an asset, is the market return. Therefore the equation can be written as follows, using the market return and it is called the market model:
(26)
The β coefficient is very important in choosing which assets to integrate in one’s portfolio.
The market has a β of 1. According to the value of β, we have the following cases:

1. β<1: this kind of securities are defensive titles, because they move in the same direction as the market but amortize the movements of the market and therefore are far less exposed to the market risk.
2. β=1 : this kind of securities move in the same direction and in the same proportion as the market. The investor is fully exposed to the market risk.
3. β>1 : this securities are offensive securities, they amplify the movements of the market and are attractive in the period when prices of financial assets go up.
2.2.2 The multi index model The multi index model is a further development of Sharp’s model, and does not really only on the correlation between the return on the portfolio and the market return, but takes into consideration other factors as well. These factors can be macroeconomic variables like exchange rates. Inflation rates, unemployment rate, interest rates; or specific attributes like the book to market ratio or the momentum effect. The objective is to simplify the determination of the matrix of variance and covariance.
(27)
Where is the sensibility of the portfolio to the factor k.
3. CAPITAL MARKET EQUILIBRIUM MODELS
3.1 THE CAPITAL ASSETS PRICING MODEL
Treynor, Sharpe and Lintner developed the capital asset pricing model or CAPM in the early 1960s. The model starts from a series of assumptions which determined a series of versions of the CAPM:
1. Investors have the same forecast horizon, represented by a single period. 2. The transparency and free information on the financial market. 3. The absence of taxation and transaction costs. 4. The atomicity of financial investments. 5. All investments are perfectly liquid and divisible. 6. Investors are risk-averse and have a rational behavior. 7. Homogeneous anticipations which make possible the derivation of the model.
Efficient portfolios with risky assets and with risk free asset are built depending on the risk aversion of the investor. The new efficient portfolios located on the capital market line are dominating all other inefficient portfolios from the financial market, the only exception being the efficient market portfolio.
On the new efficient frontier, there are unique prices, normal return, depending on the risk taken by the investor. For the same type of risk there is only one unique price.
The model has the merit of identifying the two components of normal return for any risky security and the merit of discovering the linear relationship between normal expected return and the amount of risk taken by the investor, in buying a portfolio of risky asset or a risky security.
The Capital Market Line (CML) indicates the relationship between expected return and risk of a portfolio, and shows the appropriate measure of risk for the portfolio. The CML describes the risk premiums for efficient portfolios as a function of the standard deviation of the portfolio. The standard deviation represents an appropriate measure of risk for portfolios that include investor’s total investment.

The capital market line
Source: after Farrell J.L., 1997, Portfolio Management, McGraw-Hill, pg. 57
Capital market line has the following equation:
(28)
= expected return on the market; = market risk; = portfolio risk; = risk-free rate
The slope of the capital market is a constant which indicates the supplementary expected return per unit of supplementary risk taken. . The CML shows the relationship risk-return and measures the risk for
efficient portfolios. A passive strategy that uses CML as an optimal line of capital allocation is a strong alternative to the active strategies. The passive investor will benefit from the efficient market portfolio.
The Security Market Line (SML) indicates the relationship between the expected return and the risk of individual securities, and shows an appropriate measure of the security risk.
The SML describes the risk premiums of individual assets, which measure the contribution of an individual asset in the value of the standard deviation of the portfolio. This contribution is measured by beta coefficient of volatility.
The security market line
M
σ(Rp)
E(Rp
)
Rf
CML

Source: after Farrell J.L., 1997, Portfolio Management, McGraw-Hill, pg. 61
The portfolio’s risk determines the risk premiums desired by the investors. They will be remunerated for the systematic risk which they will have to take. That is the reason why the risk premium of an asset is direct proportional with the beta (β) coefficient of the asset.
SML equation is the following:
(29) Sharpe highlights two aspects of the CAPM:
1. A rational investor will always create a combination between a market portfolio and a risk-free asset. 2. The in excess rate of return compared with the risk-free interest rate, depends only on the beta
coefficient.
The SML represents a benchmark in the evaluation of investments performance. At a measured level of risk indicated by beta, the SML indicated the rate of return which would remunerate the investor for taking a certain risk. The assets that are correctly evaluated will be located on the SML.
3.2 THE ARBITRAGE PRICING THEORY
The arbitrage pricing theory was developed by Ross in 1970 as an alternative model of equilibrium in securities markets. The model doesn’t depend on the notion of underlying market portfolio. It derives returns from the properties of the process that generates stock return and involves arbitrage to define equilibrium.
The arbitrage pricing theory is based on some assumption:
1. Investors have homogeneous beliefs. 2. Investors are risk-averse utility maximizes. 3. Markets are perfect, thus factors like transaction costs are irrelevant.
The APT doesn’t assume:
1. A single-period investment horizon. 2. That there are no taxes. 3. Investors can freely lend and borrow at the risk-free rate. 4. Portfolios are not selected on a mean-variance basis.
M
βi
E(Ri)
Rf
SML
1
E(Rm
)

An extra assumption of APT is that security returns are linearly related to a set of indices representing those underlying factor that give rise to stock returns. The market portfolio has no special role in the APT, but it may or may not be one of the factors influencing security prices.
The APT is based on the law of the unique price where two similar securities as risk and return class cannot have different selling prices. The relationship between expected return and the β coefficient of a portfolio is similar to that of the CAPM.
In the simplest form, APT uses the market as unique influence factor of the securities return. In this case the return will be:
(30)
When building a well diversified portfolio the specific risk is completely eliminated and the return becomes:
(31)
If β is zero the equation becomes , case in which α different than zero would generate arbitrage opportunities: the investor is borrowing at the risk-free rate and invests at the risk-free rate plus the alpha of the portfolio. The only case for eliminating the arbitrage opportunities is for α coefficient to be zero.
(32) The CAPM formula was obtained without any assumptions regarding investors’ preferences or their access to the market portfolio.
(33)
The APT model is usually applied to well diversified portfolios and not to individual securities. Both models, APT and CAPM, are pretty hard to test, but none of the tests showed which one is superior. Each model offers a good motivation of market equilibrium. For APT the motivation is the arbitrage process and for the CAPM the motivation is the diversification and the advantage of efficient portfolios. The problem in the case of APT is the identification of the factors that explain the financial assets return.
In order to generalize the model we will consider the impact of more than one factor. Let k be the number of factors that are expected to explain the return on financial securities:
(34)
where βi,k is the sensitivity coefficient of stock i to the factor k;
Fk,t is the return on factor k at time t.
Even if it is based on a different economical logic, the arbitrage theory leads to an equilibrium model of stocks prices equivalent to the CAPM and sustaining the validity of the last one. This aspect is even more important if we consider the role of the CAPM in the development of portfolio theory
It identifies the risk components: systematic and specific risk;
It offers a benchmark for stock valuation;
It builds the framework for evaluating portfolios performance.
tifk
tkikifti RFRR ,,, )( εβα +−+=− ∑

4. MARKET EFFICENCY AND INVESTMENT STRATEGIES
4.1 EMH – EFFICIENT MARKET HYPOTHESIS The concept of market efficiency has been thoroughly researched during the last four decades, one of the first authors to approach the subject being Fama (1969). When talking about efficiency of capital markets, this implies that the information available on the market must be reflected accurately in the prices of the stocks. In order for the prices to fulfill this condition, a certain consideration that has to be taken into account is the degree of liquidity on the capital market. Liquidity refers to the degree to which the assets are sold on the market without incurring significant price changes. There is a necessity for high liquidity on a capital market in order to consider it efficient, because the higher the level of transactions on the market within the same price boundaries, the higher the probability of a more accurate reflection in them of the available information. Transaction costs on the capital market represent another term related to market efficiency. It is trivial to argue that for whichever market, the costs incurred with transactions of different financial assets have to be minimized. Lower costs allow prospects of higher profits gained from these transactions, which increases the efficiency on the market. A term often mentioned when talking about efficiency of a capital market is information. Information is the principal factor on which investors decide when choosing to invest in a certain financial asset. Therefore, it should not be surprising that a very important measure for market efficiency is the information quality available for the financial assets sold on the market.
The efficiency of the capital markets has three different dimensions: the informational efficiency, the operational efficiency and the allocational efficiency.
The most important one is the informational efficiency. Informational efficiency is the degree to which financial assets’ prices on a certain market accurately reflect the available information that can affect them in any way. Investors have always been keen on discovering whether there is a predictable pattern of movement for the prices of the financial assets on the market, in order to identify a method of selecting the most profitable assets in their portfolios.
One of the most important studies on market efficiency belongs to Eugene Fama. In his paper “Efficient Market Hypothesis” he sustains the idea that prices in the market should follow a random walk trend.
The random walk movements of prices reflect the fact that an investor can’t use any known method in order to predict some trends, and given an informational efficient market, the investor can’t beat the market. Prices reflect the past and present available information, and any predictable information is included already in the price movements. The only elements that may be able to affect current prices are new and unpredictable information which appears on the market, which, by its nature, cannot be estimated. On an efficient market, the expected gains are in strong relation with the assumed risks, and there are no possibilities of very high profits.
Fama (1970) classified the informational efficiency according to the spectrums of information incorporated in prices:
a. Weak efficiency: the available information in this category refers to historical data regarding the stock. This form of efficiency is based on the hypothesis that all past prices, short interest or short sales are already reflected in the current price. A corollary obtained from here is that technical analysis is useless to obtain relevant price forecasts, because the easiness of gathering the past information would have already been reflected in the current prices.
b. Semi-strong efficiency: a more large approach to information that contributes to current price trend. This is the most widely accepted form of informational efficiency, because it states that not only do past information reflect themselves in current prices, but also all the currently available information. Elements such as information in the balance sheets of the companies, the dividend policy, PER, merger, stock splits, that are considered important in fundamental analysis will have already been reflected in the prices of the stocks.

In this case, research made by analysts in order to discover opportunities of larger gains on the market will not succeed in making the investors better off. It only pays off for large mutual funds to invest money in researching the market, because despite the low share allocated to market research the absolute value gained by being more informed is quite high.
c. Strong efficiency: this view of informational efficiency is a little extreme, due to the fact that the price of a financial asset is considered to reflect all the information available, regardless to whether they are public or private. This type of efficient market does not make place for any type of superior gain, and no information is left uncovered. However, in practice it is often difficult to differentiate between private and public information on a market, and there are certain categories of traders considered better informed than others (for example corporate officers). Therefore, it is uncertain to assess the cause of their superior gain, be it the access to private information or the investors’ superior abilities.
The efficient market hypothesis states that if a market is efficient, there are no possibilities of beating the market by obtaining abnormal returns.
4.2 INVESTMENT STRATEGIES
Portfolio construction process is based on investor’s risk preferences and his expected return. The portfolio administration process can be divided in three stages as follows:
Strategic allocation of assets: this stage is known in the literature as the Policy Asset Allocation. First of all investor’s objectives are established and according to those objectives different asset classes are allocated in the portfolio for the long-run. Also at this stage, the benchmark for the portfolio is chosen. The assets with the highest expected return are the most risky. Bonds are evaluated in comparison to the interest earned on the long-term government bonds. Securities evaluation is more complex and can be done through three different methods: the dividend discount model, an analysis of the historical return of the stock exchange indexes and through a scenario method. The last method implies the constriction of different scenarios which also take into account the socio-political and economical factors and their implication on the assets. It is also important to determine the correlations between the asset classes and then establish the optimal proportion of each class in the portfolio, according to Markowitz optimal portfolio selection theory.
Tactical allocation: This stages implies the continuous adjustment of the portfolio taking into account short term opportunities. This implies a good market forecasting ability. None the less, the structure of the portfolio is not altered completely, it remains actually close to the initial one.
Title selection: At this stages titles are selected from each asset class by managers who specialize in different asset classes, according to different evaluation and optimization methods.
4.2.1 Passive investment strategies
The investor estimates that there is no available information to authorize him to configure his portfolio in a different way from the market. The market is represented by an index. In this case the solution is to follow the market with minimal costs. There are three basic techniques use in constructing a passive portfolio: full replication, sampling and quadratic optimization. The full replication technique requires adding in the portfolio securities from the index basket, taking into consideration their proportions in the index basket. The sampling technique requires the selection and acquisition of the most representative securities from the index basket. The stocks with the highest weightings in the basket are purchased. If the dividends are reinvested then a problem would appear because investors will need to purchase fewer securities to adjust the portfolio. In this case, there will be a difference between index return and the portfolio return which leads to tracking errors. The quality of the portfolio

depends mainly on these tracking errors, and on the degree in which the portfolio return deviate from the returns of the benchmark. The quadratic optimization technique involves the use of a computer program to minimize the tracking errors. The program uses historical information regarding the correlations and the changes between securities. Another type of passive management is the index management with active component, which aims to overcome the index without exposing the portfolio to a greater risk than the market risk. Portfolio insurance is management technique which aims to limit the decrease of the portfolio to a certain level.
Passive management offers a series of advantages like: a good diversification of the portfolio and specific risk reduction, lower management costs, transparency, minimal costs for a good risk diversification for private investor with reduced capital.
4.2.2 Active investment strategies
The purpose of active portfolio management is to obtain higher performances compared with the benchmark chosen by the manager. When choosing a benchmark, the management strategy adopted and the assets included in the portfolio will be considered. A benchmark has to be reliable and not easy to beat. The benchmark is the passive correspondent of an active portfolio.
The managers who adopt an active strategy are based on certain level o market inefficiency. Active management can be done at the level of asset classes, case in which the discussion is about active asset allocation, and also at the level of individual securities, case in which the discussion is about stock selection.
In the case of active asset allocation, the active manager will change permanently the weightings of asset classes in the portfolio according to his forecasts regarding the market movements. The ability to forecast the market movements is known as market timing.
The asset allocation process is a complex process and implies four steps:
1. Determine the eligible asset in the portfolio 2. Determine the expected returns for a specific period of time 3. Using some portfolio optimization techniques to build efficient portfolios 4. Choosing the portfolio that offers the highest return for the tolerated level of risk
In the case of stock selection, the managers look for the level of under- or overvaluation of a security. The managers search for undervalued stock, because they can bring important gains. The managers have to overtake some problems regarding the benchmark: high transaction costs and the higher risk of the active portfolio.
For the active management there are the following types of risk: market risk, group risk and specific risk. Regarding this, there are three active strategies: market timing, which is a strategy base on market forecast; group rotation, which is a strategy based on the analysis of various industrial sectors and their weightings change in the portfolio; and stock selection, which is a strategy based on increasing the weights of the undervalued securities in the portfolio.
Combining active and passive strategies, the main mutual funds investment strategies can be identified: total passivity regarding all components, security, group and market; passivity regarding market and group combined with active security selection; and active management regarding all components.
5. PORTFOLIO PERFORMANCE EVALUATION
The interest for mutual funds performance evaluation has increased during the last decades together with the role played by institutional investors on the financial markets.
Many recent studies have tried to answer the question whether active management ads value to the portfolio. For a „mean-variance” investor the question may be expressed differently: adding stocks to an actively
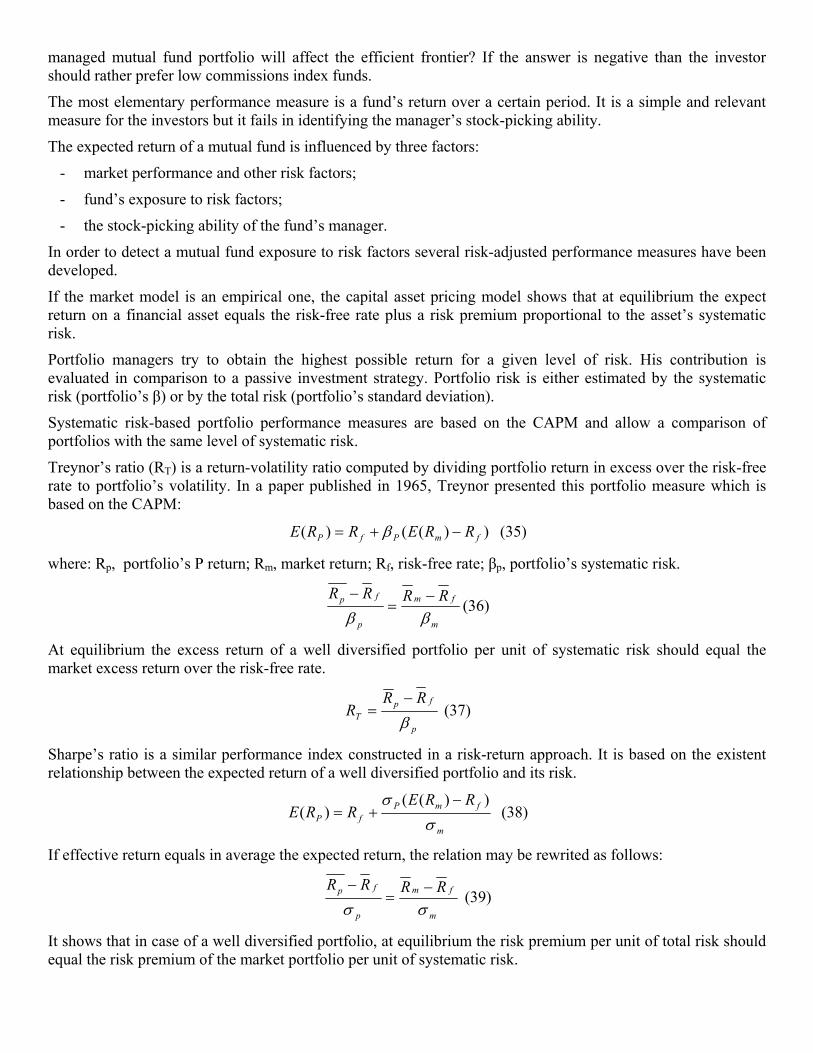
managed mutual fund portfolio will affect the efficient frontier? If the answer is negative than the investor should rather prefer low commissions index funds.
The most elementary performance measure is a fund’s return over a certain period. It is a simple and relevant measure for the investors but it fails in identifying the manager’s stock-picking ability.
The expected return of a mutual fund is influenced by three factors:
- market performance and other risk factors;
- fund’s exposure to risk factors;
- the stock-picking ability of the fund’s manager.
In order to detect a mutual fund exposure to risk factors several risk-adjusted performance measures have been developed.
If the market model is an empirical one, the capital asset pricing model shows that at equilibrium the expect return on a financial asset equals the risk-free rate plus a risk premium proportional to the asset’s systematic risk.
Portfolio managers try to obtain the highest possible return for a given level of risk. His contribution is evaluated in comparison to a passive investment strategy. Portfolio risk is either estimated by the systematic risk (portfolio’s β) or by the total risk (portfolio’s standard deviation).
Systematic risk-based portfolio performance measures are based on the CAPM and allow a comparison of portfolios with the same level of systematic risk.
Treynor’s ratio (RT) is a return-volatility ratio computed by dividing portfolio return in excess over the risk-free rate to portfolio’s volatility. In a paper published in 1965, Treynor presented this portfolio measure which is based on the CAPM:
))(()( fmPfP RRERRE −+= β (35)
where: Rp, portfolio’s P return; Rm, market return; Rf, risk-free rate; βp, portfolio’s systematic risk.
m
fm
p
fp RRRRββ−
=−
(36)
At equilibrium the excess return of a well diversified portfolio per unit of systematic risk should equal the market excess return over the risk-free rate.
p
fpT
RRR
β−
= (37)
Sharpe’s ratio is a similar performance index constructed in a risk-return approach. It is based on the existent relationship between the expected return of a well diversified portfolio and its risk.
m
fmPfP
RRERRE
σσ ))((
)(−
+= (38)
If effective return equals in average the expected return, the relation may be rewrited as follows:
m
fm
p
fp RRRRσσ−
=−
(39)
It shows that in case of a well diversified portfolio, at equilibrium the risk premium per unit of total risk should equal the risk premium of the market portfolio per unit of systematic risk.

Sharpe’s ratio corresponds to the right term of the above relation:
)( p
fpp R
RRRS
σ−
= (40)
Jensen’s coefficient (Jp) measures the return unexplained by the CAPM. If managers expectations achieve in average the equation of the CAPM may be empirically estimated based on a regression model:
tftmtpfttp RRRR εβ +−=− )( (41)
where all variables are ex-post data and εt is the residual variable.
It is possible to identify an inferior or a superior fund performance in comparison to the market portfolio by observing the value of the intercept in the following regression:
tftmtppfttp RRRR εβα +−+=− )( (42)
If mangers expectations are averagely achieved, the performance measure proposed by Jensen will verify the equation:
)()( fmpfpp RRRR −−−= βα (43)
In order to rank portfolios Jensen’s alpfa must be divided to the beta coefficient of each portfolio under comparison.
Concept check
1. A share of stock of company A is now selling for 23.5 lei. A financial analyst summarizes the
uncertainty about the rate of return on the stock by specifying three possible scenarios:
Business conditions
Scenario, s Probability, p End-of-year price
Annual dividend
High-growth 1 0.35 35 4.4
Normal growth 2 0.3 27 4
No growth 3 0.35 15 4
What are the holding period returns for a one-year investment in this stock for each of the three scenarios? Calculate the expected HPR and standard deviation of the HPR?
2. At the beginning of last year you invested 4000 lei in 80 shares of a corporation. During the year the corporation paid a dividend of 5 lei per share. At the end of the year you sold the 80 shares for 59 lei a share. Compute your total HPY on these shares and indicate how much was due to the price change and how much was due to the dividend income.
3. During the past five years you owned two stocks that had the following annual rates of return:
Year Stock T Stock B
1 0.19 0.08
2 0.08 0.03
3 -0.12 -0.09
4 -0.03 0.02

5 0.15 0.04
a). Compute the arithmetic mean annual rate of return for each stock. Which stock is most desirable by this measure?
b). Compute the standard deviation of the annual rate of return for each stock. By this measure which is the preferable stock?
c). Compute the coefficient of variation for each stock. By this relative measure of risk, which stock is preferable?
d). Compute the geometric mean rate of return for each stock. Discuss the difference between the arithmetic mean return and the geometric mean return for each stock. Relate the difference in the mean returns to the standard deviation of the return for each stock.
4. Consider stocks A and B with the following monthly returns:
Stock 1 2 3 4 5 6 7 8 9 10 11 12
A (%) 5 -3 -8 7 9 -4 8 -5 1 7 1 -5
B (%) 10 2 -13 5 6 2 10 -2 0 4 6 3
a. Determine the HPR for an investor who bought the two stocks at January 1 and sold them at December 31.
b. Determine the HPR of a portfolio composed of 70% A and 30% B.
5. During the past year you had a portfolio that combined government T-bills in proportion of 15%, long term government bonds in proportion of 35% and common stocks. The rates of return on each of them were:
T-bills 5.5%
Long-term government bonds 7.5%
Common Stocks 11.6%
During the year the consumer price index was 120%. Compute the real rate of return on your portfolio.
6. A panel of economists has estimated that the long-run real growth rate over the next five years will average 3%. The central bank estimates that the average annual rate of inflation during this five years will be about 4%. What would your required rate of return be on common stocks if you wanted a 5% risk premium?
7. Consider stocks A and B with the following monthly returns:
Stock 1 2 3 4 5 6 7 8 9 10 11 12
A (%) 5 -3 -4 7 9 -4 8 -5 1 7 1 -5
B (%) 10 5 -4 15 2 7 -5 8 -5 3 3 4
Stock Mean Variance Standard deviation
A 1.42% 0.28% 5.29%
B 1.92% 0.43% 6.6%
Cov(A,B) = -0.0563%
a. compute the expected risk and return of a portfolio composed of 40% stock A and 60% stock B.
b. what is the contribution of each stock to portfolio’s return and risk?

8. Consider stocks A and B with the following monthly returns:
Stock 1 2 3 4 5
A -2% 3% 1% 6% 4%
B 1% -2% 4% 5% 3%
a. what is the expected return and risk of a portfolio composed of 30% A and 70% B?
b. what is the contribution of each stock to portfolio’s return and risk?
c. what is the structure of the portfolio of minimum risk?
9. A stock is observed during a semester:
Month December January February March April June July
Price 650 700 680 710 720 730 750
Dividend - - - 20 - - -
a. determine the arithmetic and logarithmic returns of this stock;
b. what is the HPR and the average return in each case?
c. measure the risk of this stock;
d. measure the impact of reinvesting the dividend on the return of the stock.
10. Consider the following portfolios:
Portfolio Proportion of A Proportion of B Return Variance Standard deviation
P1 0% 100% 1.92% 0.436% 6.6%
P2 20% 80% 1.82% 0.272% 5.22%
P3 40% 60% 1.72% 0.175% 4.18%
P4 60% 40% 1.62% 0.144% 3.79%
P5 80% 20% 1.52% 0.179% 4.23%
P6 100% 0% 1.42% 0.281% 5.3%
a. Draw the frontier of these portfolios
b. Which ones are efficient portfolios?
c. What is the return and risk of the minimum risk portfolio?
V(RA) = 0.00280764
V(RB) = 0.00435764
Cov (A, B) = -0.0005632
11. Consider three stocks A, B and C with the following characteristics:
Stock A B C
Return 1.08% 0.54% 0.57%
Variance 0.329% 0.082% 0.053%

Covariance (A,B) 0.164548%
Covariance (A,C) -0.131639%
a. Construct 6 portfolios composed of A and B and 6 portfolios composed of A and C using the following proportions: 0%, 20%, 40%, 60%, 80% and 100%. Determine the expected return and risk of each portfolio.
b. What is the return and risk of the minimum risk portfolio composed of A and B? Draw the efficient frontier of P1-P6.
c. What is the return and risk of the minimum risk portfolio composed of A and C?
Draw the efficient frontier of P1-P6.
13. Consider three stocks A, B and C with the following matrix of variance and covariance:
Stock A B C
A 0.01 0.0098 0.004
B 0.0098 0.0196 0.0112
C 0.004 0.0112 0.04
Knowing that: E(RA) = 0.08; E(RB) = 0.1; E(RC) = 0.12 determine the structure and risk of an efficient portfolio of which expected return is:
a). E*(Rpf) = 0.09
b). E*(Rpf) = 0.1
14. Consider stock A of which expected return is 11,62% and variance 0,33% and the risk free rate of 7%.
a. Construct 6 portfolios composed of A and the risk free asset using the following proportions: 0%, 20%, 40%, 60%, 80% and 100%. Determine the expected return and risk of each portfolio.
b. Draw the efficient frontier of these portfolios. Compute the slope of the efficient frontier.
15. Consider two efficient portfolios which combine the portfolio of risky assets and the risk-free asset and have the following characteristics:
Portfolio P1 P2
Epf 11 12.2
σpf. 10 12
a. write the equation of the efficient frontier and draw the efficient frontier
b. consider portfolio P3 on the efficient frontier constructed only of risky assets. The standard deviation of this portfolio is 14. What is the expected return of this portfolio?
c. explain how can be constructed a portfolio P4 with an expected return of 15.
16. Consider three efficient portfolios composed of risky assets only with the following characteristics:
Portfolio P1 P2 P3
Epf 2 4 6
σpf. 5 7 10

a. estimate the parameters of the efficient frontier represented by the equation:
Epf = a + b σpf. + c σ2pf. and draw it.
b. What is the expected return of portfolio P4 of which risk is 6?
c. If you invest 70% of your financial resources in P3 and 30% in the risk-free asset Rf what return and risk do you expect?

MODULE IV: BANK MANAGEMENT
I. OVERVIEW ON BANKING ACTIVITY
Financial intermediaries are firms that pool the savings or investments of many people and lend or invest
the money to other companies or people to earn a return. Financial intermediaries include banks, investment
companies, insurance companies, and pension funds. Banks lend the money of depositors to businesses and
others, and pay depositors interest or provide them with valuable services, such as checking and electronic
funds transfers. Investment companies allow small retail investors to pool their money together to reduce the
diversifiable risks of investments and to profit from the expertise of professional money managers. Insurance
companies pool the premiums of the insured to pay for the losses of a few of the insured, thereby preventing
a financial catastrophe for the sufferers. Pension funds pool the contributions of workers to invest for greater
returns, so that a pension income can be provided to the workers after they retire.
The assets and liabilities of financial intermediaries are primarily financial instruments. Loans, stocks, bonds,
and other investments are their assets while the deposits and payment obligations, such as the insurance
company's obligation to pay for a loss or the pension funds obligation to pay retirees an income, are their
liabilities.
Financial intermediaries make a profit from the difference from what they earn on their assets and what they
pay in liabilities. So why don't people loan their money directly and earn all of the interest instead of getting
only a portion? Or why doesn't a business simply sell stock or bonds directly to the public to save on the
investment banking fee or on interest rates that would probably be less than what a bank would charge?
One reason is because financial intermediaries provide valuable services that cannot be obtained by direct
lending or investing. Banks, for instance, offer depositors safety for their funds. They have vaults for the
safekeeping of cash and other valuables and deposits are insured by the government. Banks also provide
payment services that reduce the hassle of paying bills and also provide a record of those payments.
Insurance companies provide financial protection in case of a loss, even if that loss is much greater than the
premiums paid by the insured.
Another major reason for using financial intermediaries is because they reduce the risk of information
asymmetry, where the receiver of the funds knows more about their financial condition and their intentions
than do the giver of those funds. Financial intermediaries have expertise in assessing the risk of the applicant
for funds that reduces adverse selection and moral hazard. They have easy access to various databases that
provide information on both individuals and businesses, and they have expertise in doing their own research
and monitoring.
Internal Financing, Indirect Finance, And Direct Finance
Sources of funding for businesses can be categorized as either internal or external financing. External finance
can be further categorized as either indirect or direct financing. Direct finance is the financing obtained by
selling stocks and bonds directly to the public in the financial markets. Direct finance provides the lowest
cost of funds from external sources, but it requires a company that is well established with an appreciable
income and substantial assets; otherwise, investors would be reluctant to lend or invest in the company due to
the lack of information and assets.
Indirect finance is the financing obtained from financial intermediaries. Financial intermediaries can lend or
invest money in smaller businesses because they can do a better job of investigating the company, assessing
its risks, and securing assets for collateral against loans. Indirect financing costs more than direct financing,
but financial intermediaries can invest or lend money to businesses that would otherwise not be able to get
external financing.
However, most businesses, especially many small businesses, cannot obtain any form of external financing.
They have to rely entirely on internal financing, which is the money obtained either from the business
owners or from the income earned by the business.
According to some recent statistics, more than 80% of all financing in most countries is internal. This is because
most businesses don't have substantial net worth or assets, and so it is difficult to offset the risk that information
asymmetry presents, even for financial intermediaries.
Depository Institutions (Banks)
Depository institutions (banks), which includes commercial banks, savings and loans, and credit unions,
receive money from depositors to lend out to borrowers. Nondepository institutions, such as finance
companies, rely on other sources of funding, such as the commercial paper market. Because depository
institutions receive funds from the public for safekeeping and are major sources of credit and the main
providers of a payment system, these institutions are more heavily regulated than nondepository institutions.
Depository institutions provide 4 important services to the economy:
1. they provide safekeeping services and liquidity;
2. they provide a payment system consisting of checks and electronic funds transfers;
3. they pool the money of many savers and lend it out to people and businesses; and
4. they invest in securities.

The 1st 3 services are so important in any economy that when banks fail, the economy suffers. The credit
crisis of 2008 and 2009 underscored the primary importance of banks and why governments all over the
world propped up their banks with trillions of dollars.
Bank Balance Sheet: Assets, Liabilities, and Bank Capital
A balance sheet (statement of condition, statement of financial position) is a financial report that shows
the value of a company's assets, liabilities, and owner's equity at a specific period of time, usually at the end
of an accounting period, such as a quarter or a year. An asset is anything that can be sold for value.
A liability is an obligation that must eventually be paid, and, hence, it is a claim on assets. The owner's
equity in a bank is often referred to as bank capital, which is what is left when all assets have been sold and
all liabilities have been paid. The relationship of the assets, liabilities, and owner's equity of a bank is shown
by the following equation:
Bank Assets = Bank Liabilities + Bank Capital
A bank uses liabilities to buy assets, which earns its income. By using liabilities, such as deposits or
borrowings to finance assets such as loans to individuals or businesses, or to buy interest earning securities,
the owners of the bank can leverage their bank capital to earn much more than would otherwise be possible
using only the bank's capital.
Assets: Uses Of Funds
Assets earn revenue for the bank and include cash, securities, loans, and property and equipment that allow it
to operate.
Cash
One of the major services of a bank is to supply cash on demand, whether it is a depositor withdrawing
money or writing a check, or a bank customer drawing on a credit line. A bank also needs funds to pay bills,
but while bills are predictable in both amount and timing, cash withdrawals by customers are not.
Hence, a bank must maintain a certain level of cash compared to its liabilities to maintain solvency. A bank
must hold some cash as reserves, which is the amount of money held in a bank's account at the Federal
Reserve (Fed). The Federal Reserve determines the legal reserves, which is the minimum amount of cash
that banks must hold in their accounts to ensure the safety of banks and also allows the Fed to
effect monetary policy by adjusting the reserve level. Often, banks will keep excess reserves for greater
safety.

To do business at its branches and automated teller machines (ATMs), a bank also needs vault cash, which
includes not only cash in its vaults, but also cash elsewhere on a bank's premises, such as in teller drawers,
and the cash in its ATM machines.
Some banks, usually smaller banks, also have accounts at larger banks, called correspondent banks which
are usually larger banks that often borrow from the smaller banks or perform services for them. This
relationship makes lending expeditious because many of these smaller banks are rural and have excess
reserves whereas the larger banks in the cities usually have a deficiency of reserves.
Another source of cash is cash in the process of collection. When a banks receives a check, it must present
the check to the bank on which it is drawn for payment, and, previously, this has taken several days.
Nowadays, checks are being processed electronically and many transfers of funds are being conducted
electronically instead of using checks. So this category of cash is diminishing significantly, and will probably
disappear when all financial transactions finally become electronic.
Securities
The primary securities that banks own are United States Treasuries and municipal bonds. These bonds can be
sold quickly in the secondary market when a bank needs more cash, so they are often referred to
as secondary reserves.
The recent credit crisis has also underscored the fact that banks held many asset-backed securities as well.
United States banks are not permitted to own stocks, because of the risk, but, ironically, they can hold much
riskier securities called derivatives.
Loans
Loans are the major asset for most banks. They earn more interest than banks have to pay on deposits, and,
thus, are a major source of revenue for a bank. Often banks will sell the loans, such as mortgages, credit
card and auto loan receivables, to be securitized into asset-backed securities which can be sold to investors.
This allows banks to make more loans while also earning origination fees and/or servicing fees on the
securitized loans.
Loans include the following major types:
business loans, usually called commercial and industrial (C&I) loans
real estate loans
residential mortgages
home equity loans
commercial mortgages

consumer loans
credit cards
auto loans
interbank loans
Liabilities: Sources of Funds
Liabilities are either the deposits of customers or money that banks borrow from other sources to use to fund
assets that earn revenue. Deposits are like debt in that it is money that the banks owe to the customer but they
differ from debt in that the addition or withdrawal of money is at the discretion of the depositor rather than
dictated by contract.
Checkable Deposits
Checkable deposits are deposits where depositors can withdraw the money at will. These include all
checking accounts. Some checkable deposits, such as NOW, super-NOW, and money market accounts pay
interest, but most checking accounts pay very little or no interest. Instead, depositors use checking accounts
for payment services, which, nowadays, also include electronic banking services.
Before the 1980s, checkable deposits were a major source of cheap funds for banks, because they paid little
or no interest on the money. But as it became easier to transfer money between accounts, people started
putting their money into higher yielding accounts and investments, transferring the money when they needed
it.
Nontransaction Deposits
Nontransaction deposits include savings accounts and time deposits, which are basically certificates of
deposits (CDs). Savings accounts are not used as a payment system, which is why they are categorized as
nontransaction deposits and is also the reason why they pay more interest. Savings deposits of yore were
mostly passbook savings accounts, where all transactions were recorded in a passbook. Nowadays,
technology and regulations have allowed statement savings where transactions are recorded electronically
and may be viewed by the depositor on the bank's website or a monthly statement is mailed to the depositor;
and money market accounts, which have limited check writing privileges and earn more interest than either
checking or savings accounts.
A Certificate of Deposit (CD) is a time deposit where the depositor agrees to keep the money in the account
until the CD expires. The bank compensates the depositor with a higher interest rate. Although the depositor
can withdraw money before the CD expires, banks charge a hefty fee for this. There are 2 types of certificates
of deposit (CDs): retail and large. A retail CD is for less than $100,000 and is generally sold to individuals. It
cannot be resold easily. Large CDs are for $100,000 or more and are highly negotiable so they can be easily
resold in the money markets. Large negotiable CDs are a major source of funding for banks.
Nontransaction deposits in depository institutions are now insured to $250,000 by the Federal Deposit
Insurance Corporation (FDIC).
Borrowings
Banks also borrow money, usually from other banks in what is called the federal funds market, so-called
because funds kept in their reserve accounts at the Federal Reserve are called federal funds. Banks with
excess reserves, which are usually smaller banks located in smaller communities, lend to the larger banks in
metropolitan areas, which are usually deficient in reserves.
The interbank loans in the federal funds market are unsecured, so banks only lend to other banks that they
trust. Part of the reason for the 2007 - 2009 Credit Crisis is that banks didn't know which other banks were
holding risky mortgage-backed securities that were beginning to default in large numbers, so they stopped
lending to each other, forcing banks to restrict their lending to the public, which caused the supply of money
to decline and the economy to contract.
Banks also borrow from nondepository institutions, such as insurance companies and pension funds, but most
of these loans are collateralized in the form of a repurchase agreement (aka repo), where the bank gives the
lender securities, usually Treasuries, as collateral for a short-term loan. Most repos are overnight loans that
are paid back with interest the very next day.
As a last resort banks can also borrow from the Federal Reserve (Fed), though they rarely do this since it
indicates that they are under financial stress and unable to get funding elsewhere. However, during the credit
freeze in 2008 and 2009, many banks borrowed from the Fed because they could not get funding elsewhere.
Bank Capital
Banks can also get more funds either from the bank's owners or, if it is a corporation, by issuing more stock.
For instance, 19 of the largest banks that received federal bailout money during the credit crisis raised $43
billion of new capital in 2009 by issuing stock because their reserves were deemed inadequate in response to
stress testing by the United States Treasury.
New Accounting Rules for Valuing Assets
Bank capital, which is equal to the value of total assets minus total liabilities, is the bank's net worth.
However, recent accounting changes have made it more difficult to determine a bank's true net worth.
Banks were having a tough time in early 2009. The credit crisis has caused many defaults on mortgages,
credit cards, and auto loans, forcing them to increase their loan loss reserves and to devalue many of the

asset-backed securities that they held based on these loans. Consequently, banks were suffering major losses.
A major contributor to these losses was because the asset-backed securities that were still held by the banks
had to be valued by mark-to-market rules, and since no one was buying these toxic securities, their mark-to-
market value was very low.
To restore confidence in the banking system, the government allowed some changes to the accounting rules
that artificially increased the revenues of the banks. The Financial Accounting Standards Board (FASB)
allowed banks to value their assets according to fair value, as determined by the banks. However, many
critics assert that there will be more defaults on the underlying loans of these securities, and, thus, will have
to be accounted for in the future.
Banks also didn't have to write down assets that they intended to keep to maturity. Here, again, critics argued
that there will probably be many more defaults on the underlying loans, especially since the unemployment
rate is still rising, so they will be forced to write them down in the future.
Additionally, banks could record income on their books if the value of the debt falls in the market. The
reason for this allowance is because they could buy back their own debt in the market, thus reducing their
debt for a fraction of its face value. However, critics have pointed out that if a bank doesn't have the money to
buy back its debt, it could still record the reduced value as revenue even though the bank would have to pay
the principal back by the debt's maturity.
Citigroup is a good example of how much the new accounting rules can change the income reported by a
bank. According to this Bloomberg article, the $1.6 billion profit reported by Citigroup under the new
accounting rules for its 1st quarter in 2009 would be reduced to a $2.5 billion loss under the old accounting
rules.
II. PAYMENTS INSTRUMENTS
Categories of money
B1. Banknotes
Banknotes originated in two forms: drafts which were the receipts attesting the value held in an account and
bills which were issued with a promise to covert at a later date.
The perception of banknotes as money has evolved over time. Originally, money was based on precious metal.
When banknotes appeared they were seen as essentially promissory notes and as they became more widely
used, they were accepted as equivalent to precious metals. With the gradual removal of precious metals from
the monetary system, banknotes evolved to represent fiat money.

Convertibility represents the ability to exchange a note for some other kind of value (gold or other currencies).
If a note is payable on demand for a fixed unit, it is said to be fully convertible to that unit.
Limited convertibility occurs when there are restrictions in the time, place, manner or amount of exchange.
Under the gold standard, banknotes were payable in gold coins. Similarly, under the silver standard, banknotes
were payable in silver coins. Under the bimetallic standard, banknotes were payable in either gold or silver
coins at the option of the debtor (issuing bank). Under the gold exchange standard, banks of issue were obliged
to redeem their currencies in gold bullion or in US Dollars, which in turn were redeemable in gold bullion at the
rate of $35/ounce. The US abandoned the gold standard, and thus bullion convertibility, in 1971.
In a broad sense, convertibility represents the legal feature of a currency to be freely exchanged on market in
other currencies without restrictions regarding the purpose, the solicitant, and the amount of exchange.
The IMF statute groups the member countries’ currencies in:
a). Convertible currencies: Each member shall buy balances of its currency held by another member if the
latter, in requesting the purchase, demonstrates that the balances to be bought have been recently acquired as a
result of current transactions; or their conversion is needed for making payments for current transactions.
The buying member shall have the option to pay either in special drawing rights, or in the currency of the
member making the request.
b). Inconvertible currencies: currencies of the countries which maintain restrictions on payments and transfers
for current international transactions.
c). Freely usable currencies: a freely usable currency means a currency that 1) is widely used to make payments
for international transactions, and 2) is widely traded in the principal exchange markets.
The convertibility adoption in Romania took place in several stages:
1. 1991: the adoption of internal current account convertibility
2. 1997: the adoption of external current convertibility (Article VIII of IMF statute)
3. 1999: liberalization of long and medium term of capital inflows
4. April 2005: operations in ROL denominated deposits accounts opened by foreigners with resident
financial institutions
5. June 2005: operations in current and deposits account opened by residents abroad
6. September 2006: operations in securities and other open market instruments.
7. The last liberalization of capital flows represented the full liberalization of capital account and, thus, full
convertibility of RON.

B2. Credit money
Credit money is any future claim against a physical or legal person that can be used for the purchase of goods
and services. In terms of the money supply credit money is generally associated with that part of M2 which is
not M0 and it is the most important component of money supply. Credit money is reflected in liabilities of the
bank’s balance sheet.
Credit money can be used for the payment of the goods and services or for the settlement of debts through the
banking transfer.
B2.1. Types of accounts
Banks offer customers three major types of accounts: checking accounts, saving accounts and loan (credit)
accounts.
a). A checking account (transactional account in North America, current account in other countries) is a
deposit account held at a bank or other financial institutions for the purpose of securely and quickly providing
frequent access to funds on demand, through a variety of different channels. Because money is available on
demand these accounts are also referred to as demand accounts or demand deposit accounts.
Checking accounts are primarily meant for businessmen, firms, companies, public enterprises etc. that have
numerous daily banking transactions. They are opened for convenience of the business, hence they are non-
interest bearing accounts.
In a checking account, a customer can deposit any amount of money. These accounts allow unlimited number of
withdrawals subjected to availability of funds. Even if checking accounts have usually credit balance, they can
have debit balance in the case of overdrafts.
An overdraft occurs when withdrawals from a checking account exceed the available balance, which gives the
account a negative balance. If there is a prior agreement with the account provider for an overdraft protection
plan, and the amount overdrawn is within this authorized overdraft, then interest is normally charged at the
agreed rate. If the balance exceeds the agreed terms, then fees may be charged and higher interest rate might
apply.
A checking account can be linked to another account, such as a savings account, or to an existing line of credit
such as a credit card. Once the link is established, when an item is presented to the account that would result in
an overdraft, funds are transferred from the linked savings account or linked credit account to cover the
overdraft. A nominal fee is usually charged for each overdraft transfer, and if the linked account is a credit card
or other line of credit, the consumer may be required to pay interest under the terms of that account.
b). A saving account is an account mainly used for savings, the interest being earned on the amount deposited.
The interest is normally higher than on a current account.
A saving account is reflected in the liabilities of the bank’s balance sheet.
There can be different types of saving accounts: saving account for demand deposits; saving account for time
deposits; saving accounts for collateral deposits: for letters of credit, bank letters of guarantee, certificate
cheques, etc.
c). A loan account is an account which is set up for a customer once her/his loan is approved. Such an account
is used for the loan granted for precise purposes (a car, a house, an investment, etc.). It is reflected in the assets
of a bank’s balance sheet.
B2.2. Methods of payment
A method of payment represents the way in which the settlement is organized in terms of assurance in advance
or lack of assurance of the payment.
There are two main methods of payment:
B2.2.1. Methods which assure the payment in advance:
1.1 The letter of credit - a contractual agreement between a bank, known as the issuing bank, on behalf of one
of its customers, authorizing another bank, known as the advising or confirming bank, to make payment to the
beneficiary. The issuing bank, on the request of its customer, opens the letter of credit. It makes a commitment
to honor drawings made under the credit. The beneficiary is normally the provider of goods and/or services,
being entitled to payment as long as he can provide the documentary evidence required by the letter of credit.
An advising bank, usually a foreign correspondent bank of the issuing bank, will advise the beneficiary.
The confirming bank (the correspondent bank) may confirm the letter of credit for the beneficiary.
Types of letters of credit
a). Confirmed Letter of Credit: a letter of credit, issued by a foreign bank, which has been verified and
guaranteed by a domestic bank in the event of default by the foreign bank or buyer. Typically, it will be sought
when a domestic exporter seeks assurance of payment from a foreign importer.
b). Commercial Letter of Credit: assures the seller that the bank will provide payment for any goods or
merchandise shipped to the bank’s customer, assuming the seller provides any required documentation of the
transaction and its shipment of the purchased goods.

c). Irrevocable Letter of Credit: includes a guarantee by the issuing bank that if all of the terms and conditions
set forth in the letter are satisfied by the beneficiary, the letter of credit will be honored.
d). Revocable Letter of Credit: may be cancelled or modified after its date of issue, by the issuing bank.
e). Standby Letter of Credit: in the event that the bank’s customer defaults on a payment to the beneficiary,
and the beneficiary’s documents prove of its loss consistent with any terms set forth in the letter, a standby L/C
may be used by the beneficiary to secure payment from the issuing bank.
1.2 Bank letter of guarantee - a guarantee made by a bank on behalf of a customer (usually an established
corporate customer) making the bank a co-signer for one of its customer’s purchases in case that the customer
fails to deliver the payment.
A guarantee is a written contract stating that in the event of the borrower being unable or unwilling to pay the
debt with a merchant, the bank will act as a guarantor and pay its client’s debt to the merchant. The initial claim
is still settled primarily against the bank’s client, and not the bank itself. Should the client default, then the bank
agrees in the bank guarantee to pay for its client’s debts. This is a type of contingent guarantee.
B2.2.2. The acceptance is the second method of payment which does not assure the payment in advance. It
requires the consent of the payer regarding the payment given either through the acceptance of some payment
instruments issued by the beneficiary or through the issuing from its own initiative of the payment instruments.
B2.3. Payment instruments
B2.3.1 The payment order is an unconditional order given by the issuer to a credit institution to put an amount
of money at a beneficiary’s disposal. To put a certain amount of money at the beneficiary’s disposal, on the
basis of a payment order, means to pay or cause the payment of the specified amount of money.
Payment order shall include the following legal provisions: number and series of document; order of payment;
payer’s name and bank; payer’s account; beneficiary’s name and bank; beneficiary’s account; amount and
purpose of payment; payer’s signature.
B2.3.2 The bill of exchange is the document through which a person, the drawer or the issuer, gives an order to
another person, the drawee, to pay at maturity, an amount of money to a third person, the payee, or upon his
order.
B2.3.3 The promissory note is a document through which the issuer undertakes to pay to the payee, or upon his
order, an amount of money, at maturity, in a certain place. Consequently, the promissory note intervenes

between two and not three persons, as is the case of the bill of exchange. It does not contain the payment order
addressed to another person, but only the acknowledgment of issuer’s own payment obligation.
B2.3.4 The check is a document through which the drawer gives an unconditional order to a bank, the drawee,
where the drawer has available funds to pay another person, the payee, upon presenting the writ.
B2.4. Payment system
A payment system comprises the procedures and associated computer networks used to settle financial
transactions in money and capital markets, and to transfer funds between financial institutions. Payment and
settlement systems have been growing in importance over the past two decades in the majority of the countries.
This is a result of an increase in both the volume and the value of transactions resulted from money and foreign
exchange markets and from financial markets in general.
A payment system usually comprises the following components:
a). RTGS system settles the large-value payments on one to one basis. The acronym “RTGS” stands for
Real Time Gross Settlement. RTGS system is a funds transfer mechanism where transfer of money takes place
from one bank to another on a “real time” and “gross” basis. This is the fastest possible money transfer system
through the banking channel. Settlement in “real time” means payment transaction is not subjected to any
waiting period. The transactions are settled as soon as they are processed.
Under normal circumstances the beneficiary branches are expected to receive the funds in real time as soon as
funds are transferred by the remitting bank. “Gross settlement” means the transaction is settled on one to one
basis without bunching with any other transaction. The RTGS system is primarily for large-value transactions
and minimum amount stipulation varies from country to country.
b). Clearing House settles low-value payments through clearing system on a net basis. Netting
represents setting mutual obligations at the net value of the contract. Netting avoids the gross settlement and,
thus, allows reducing of the transfer of funds between subsidiaries to a net amount.
In essence, only an automated netting system can work without placing undue stress on the human factor.
Individual clearing systems may be owned and operated by a consortium of local banks or they may be operated
and controlled by a country’s central bank.
In essence, the function of the clearing house, from where the clearing system operates, is to allow each
member bank to settle daily all monies payable to and receivable from all other members of that payment
clearing system. Rather than physically make hundreds of payments to each other every day, the net position

(funds receivable against funds payable) is calculated for each bank with each other member and each bank
would then either receive or make only payment to every other member of the clearing.
Each country has its own local payment clearing system and its own rules and regulations devised to ensure fair
and efficient running.
c). Securities settlement system settles transactions with securities. Securities settlement system is a
system which allows the holding and transfer of securities, either free of payment or against payment (delivery
versus payment) or against another asset (delivery versus delivery). It comprises all the institutional and
technical arrangements required for the settlement of securities trades and the safekeeping of securities.
The system can operate on a real-time gross settlement, gross settlement or net settlement basis. A settlement
system allows for the calculation (clearing) of the obligations of participants.
The Central Bank also uses the settlement system in its own transactions with securities, which makes it an
important tool in monetary policy implementation. The securities settlement system plays a key role for the
domestic securities market, financial system and financial stability.
B3. Payment cards
A payment card is backed by an account holding funds belonging to the cardholder, or offering credit to the
cardholder. A card is defined as a bank-issued plastic card with a magnetic stripe that holds machine readable
identification code. Bank cards are used for electronic commerce (with magnetic stripe readers or via Internet)
and for banking transactions through automatic teller machines (ATMs).
An ATM is a computer terminal activated by a magnetically encoded bank card, allowing consumers to make
deposits, obtain cash from checking or savings accounts, pay bills, transfer money between accounts, and do
other routine transactions as they would at a bank teller window.
Some ATM machines cash checks to the penny, accept deposits, and print monthly statements for mortgage,
brokerage, or regular banking accounts. Some banks have programmed their machines to offer ATM customers
access to all of the banking services available on the bank’s Internet Web site, effectively duplicating the bank’s
Web site on the ATM display screen.
B3.1 Debit cards
Debit cards are also called asset card (in the US), or payment card (in the UK). A debit card is a card issued by a
bank to allow customers access to their funds electronically.
Debit cards can replace checks as a method of payment for goods and services, and are more convenient
because they are more widely accepted than checks.
A credit card allows drawing of funds up to the available balance in cardholder’s account. If the available funds
are insufficient, the transaction is not completed. Many debit cards combine the features of credit cards. They
can allow an overdraft.
A type of a debit card is the cash card, which allows the customer to draw money from Automated Teller
Machines (ATMs or cash machines). Many banks set a daily limit as to how much you can take out, even if
your account contains funds.
A cash card is often issued as part of a basic account package.
B3.2 Credit cards
A credit card allows drawing of funds up to an approved credit limit.
There are two main types: charge card (though this name is sometimes used by the public to describe credit
cards) and credit card proper. Many people are not aware of this distinction, and often the two terms are used
interchangeably to describe any card which can be used as payment.
A charge card is a means of obtaining a very short term (usually around 1 month) loan for a purchase. It is
similar to a credit card, except that the contract with the card issuer requires that the cardholder must each
month pay charges made to it in full - there is no “minimum payment” other than the full balance. Since there is
no loan, there is no official interest. A partial payment (or no payment) results in a severe late fee (up to a
certain rate of the balance) and the possible restriction of future transactions and risk of potential cancellation of
the card.
A credit card is a revolving credit instrument which does not need to be paid off in full. No late fee is charged
as long as the minimum payment is made, which carries a balance forward as a loan charging interest. Credit
card can have a grace period, when the customer has to pay only the interest.
B3.3 Cards for check guarantees
A card for check guarantee is used to back up any check written by the customer, usually up to a specified
value. The arrangement works only for checks drawn on an account provided by the bank that issued the card.
The most popular cards for check guarantee are those issued in the EUROCHEQUE system.
B3.4 Store cards

Store cards can be a tempting way to secure a discount on shopping but shoppers often end up paying extra
through high interest charges. The merchant offers a discount on everything - if only you’ll sign up to use the
shop’s handy store card. Despite the discounts and convenience they offer, store cards usually have a higher
interest rate than the credit cards.
As the use of cards rather than cash becomes increasingly widespread, shoppers are comfortable with the idea of
using credit to boost their buying power. Buying things on credit used to be looked down upon - but nowadays
the “buy now, pay later” mentality is widespread and considered acceptable. If the customer is disciplined
enough to pay off the balance within the interest-free period (typically between 35 and 55 days) store cards
don’t pose a problem. Instead, if they can’t pay the outstanding balance each month, the interest due on the
unpaid debt can soon mount up. Charges vary between retailers.
B3.5 Smart cards
A smart card is a plastic card with embedded microprocessor chip that can be loaded with data, used for
telephone calling, electronic cash payments, and other applications, and then periodically refreshed for
additional use. It can be used to:
- Dial a connection on a mobile telephone and be charged on a per-call basis;
- Establish your identity when logging on to an Internet access provider or to an online bank;
- Pay for parking at parking meters or to get on subways, trains, or buses;
- Give hospitals or doctors personal data without filling out a form;
- Make small purchases at electronic stores on the Web (a kind of cyber cash).
- Buy gasoline at a gasoline station.
It looks like, works like, and is of the same size as a bank or credit card but may not have a magnetic stripe on
its back.
A smart card contains more information than a magnetic stripe card and it can be programmed for different
applications. Some cards can contain programming and data to support multiple applications and some can be
updated to add new applications after they are issued.
The microprocessor on the smart card is there for security. The host computer and card reader actually “talk” to
the microprocessor. The microprocessor enforces access to the data on the card.

III. PRINCIPLES OF LENDING ACTIVITY
The main activity of banks is to grant credits to costumers. The major risk which can occur in lending activity
of a bank is credit risk.
Credit risk represents the risk of loss due to a debtor’s non-payment of a loan or other line of credit (either the
principal or interest or both). To reduce credit risk banks apply some general lending principles, which concern
the reimbursement of credit granted to costumers.
These principles refer to:
1. Solicitant of credit
Banks are interested to find out as much information as possible regarding the solicitant of credit (physical or
legal person), the potential future client:
Character of the solicitant: is evaluated by the bank taking into account his/her personality features (honesty,
moral integrity, reputation, prudence, etc.).
Domain of activity: banks are interested if the domain is growing or not, if the competition in the respective
domain is high or small, if the company has a seasonal activity, or if the company depends on a single purveyor
or a single beneficiary, etc.).
Financial situation: is determined by the bank taking in consideration some essential aspects: financial
indicators (liquidity, solvency, profitability, evolution of the turnover), credit experience like bill-paying
history, the number and types of accounts held by the customer, whether the customer pays the bills by the date
they’re due, outstanding debt, and the age of your accounts.
Quality of management: banks are interested in the managers’ experience in business, in general, and in the
respective domain in particular, if the management is realized by a single or by many persons, if managers can
evaluate the real capacity of the company, etc.
Future: banks are interested if the business will be profitable in future in order to generate sufficient profit to
cover the credit.
2. Documentation of credit
The documentation of credit must contain the following information:
- Legal competence of the solicitant: in the case of a company, a bank is interested if this is legally established
and if it develops a legal activity and if the person who applies for the credit is authorized by the company’s

leadership to do this; in the case of a physical person, a bank verifies if she/he has the legal age in order to be
allowed to apply for the credit.
- Destination of the credit: should be clearly specified and in accordance with the current activity of the
company; knowing the purpose of the credit, a bank can evaluate the risks and, thus, assess the results of the
business.
- Duration of credit: depends on the destination of credit and the customer’s cash-flow.
- Credit reimbursement graph: the reimbursement of the credit can be realized in increasing, decreasing and
equal installments.
- Value of credit: It must to be realistically established depending on the credit destination. Banks require that
customers should determine the amount of credit they need on the basis of economic calculation.
To be sure that the amount credit required is correct, banks ask that the customer should present a forecast of
the company’s cash-flow which will indicate the current liquidities, the future incomes and the future expenses.
In order to reduce the credit risk and stimulate the prudence of the clients, banks require that the beneficiaries of
the credits should participate with their own capital in financing the project for which the credit is required.
3. Reimbursement of credit
The realistic duration of the reimbursement of the credit is indicated by the forecast of the cash-flow. It is
preferable that the reimbursement be realized in smaller installments during a longer period, so that the client
will be able to pay them without problems from the income generated by the business, rather than in larger
installments within a shorter period of time.
The duration of the reimbursement is tied to the duration of functioning (length life) of the object of the credit.
For example, if the credit is used for the acquisition of equipment whose duration of functioning (length life) is
7 years, then the duration of the reimbursement could not exceed 7 years.
It is also necessary that the type of the financing (on the short term or on the medium or long term) should
correspond to the destination of the credit (credits granted on short term aim to satisfy current production needs
of the company and credits on medium or long term aim the acquisition of the assets with a longer period of
functioning or realization of the productive investments).
4. Cost of credit
Cost of the credit is represented by the interest and the commissions. The interest and the commissions must be
set in such a manner that they ensure the profitability of each credit and of the entire portfolio of credits as well.
The interest and the commissions applied by the bank must be competitive in comparison with those practiced
by the other banks; otherwise, the costumers will apply for credits to other banks.
The interest charged for the credit includes the following elements: the interest paid for the deposits, the bank’s
running expenses, the risk premium, and the profit of the bank. The commissions are charged by the bank in
order to cover some additional expenditures of lending activity. The main commissions used by the banks are
the following: commission for the credit analysis, commission for opening the accounts (in the case of credits
granted in accounts), commission for granting the credit, commission for withdrawal the cash (in the case of
credits granted in cash), commission for the administration of credit, commission for reimbursement in advance.
5. The collateral (the guarantee)
Banks have to base the decision of granting the credit before taking into account the collateral brought by the
clients on the basis of their capacity to reimburse the credit from their own financial sources.
The collateral does not represent the main source of credit reimbursement; banks will resort to the execution of
guarantee only in those situations where the costumer cannot return the borrowed funds.
It is preferable that the bank should not be forced to execute the guarantee because there exits the risk that the
market value of the guarantee will depreciate under the initially evaluated level and the bank will incur
substantial losses.
This is the reason why banks must first analyze the customer’s capacity of returning the borrowed funds and,
second, realistically evaluate the value of each guarantee offered by the customer and the easiness of the
execution of the guarantee.
Credit collaterals
In lending agreements, collateral, also called security, is a borrower’s asset that is forfeited to the lender if the
borrower is insolvent, that is, unable to pay back the principal and interest on the loan. The assets are pledged
by a borrower to secure a loan, and subject to seizure in the event of default.
When insolvent, the borrower is said to default on the loan, in which case the lender becomes the owner of the
collateral.
The legal right of a bank to sell the collateral of those who fail to meet the obligations of their loan contract is
called a lien.
Liens can be structured in many different ways. In some cases, the creditor will have legal claim against an
asset, but not actually hold it in possession. In other cases, the creditor will actually hold on to the asset until the
debt is paid off.
There are two main types of collateral:
A. Real collateral: mortgage, pledge, cash collateral, etc.
B. Personal collateral: guaranty, insurance policy, bank letter guarantee.
A1. Mortgage
A mortgage is the pledging of a property to a lender as a security for a loan. While a mortgage in itself is not a
debt, it is evidence of a debt. It is a transfer of an interest in land, from the owner to the lender, on the condition
that this interest will be returned to the owner of the real estate when the terms of the loan have been satisfied or
performed.
The mortgage is a security for the loan that the lender makes to the borower. The main function of the mortgage
is to provide security to the lender. Should the buyer fail to pay the debt, the ownership of the real estate is
transferred to the bank in the process known as foreclosure.
Lender usually wants security for the loan that will provide a claim upon that security and will take precedence
over other creditors.
The parties involved in a mortgage are:
a. Mortgagor is the legal term for the borrower, who owes the obligation secured by the mortgage.
b. Mortgagee is the legal term for the lender.
The lender registers the mortgage against the title to the property.
The same real estate asset can serve as collateral for more loans. If the bank is the first in whose favor the
mortgage is offered, it has the first rank mortgage, which gives it preference over further creditors. The next
creditor will have second rank mortgage. The degree of priority of the mortgage is set on the basis of the date of
its registration in the Real Estate Registry.
The borrower gives the lender the mortgage as security for the loan, receives the funds, makes the required
payments and maintains possession of the property.
The borrower has the right to have the mortgage discharged from the title once the debt is paid. The mortgage
shall secure the entire claim, interest and other auxiliary claims and enforced collection costs. The debtor must

meet the conditions of the underlying loan or other obligation and the conditions of the mortgage. If the debtor
fails to repay the loan according to the conditions set forth by the lender, then the lender reserves the right to
foreclose on the property.
Foreclosure is the legal process in which a bank or other secured creditor sells the real property after the owner
has failed to comply with an agreement between the lender and borrower called a “mortgage“.
Foreclosure allows the lender to declare that the entire debt is due and must be paid immediately. The lender
seizures the property, sells it and keeps the proceeds to pay off the remaining debt and any legal costs.
The most common processes are court proceedings (judicial foreclosure) or grants of power to the lender to sell
the property (power of sale foreclosure).
If immovable property is under joint ownership, the entire immovable property can be mortgaged only with the
consent of all joint owners.
If the immovable property is improved during the effectiveness of the mortgage, the mortgage shall also relate
to the improvements (updating the mortgage).
A mortgage agreement may be secured by a future property, but the mortgage can be registered in the real estate
registry only when the property comes into existence.
A.2. Pledge
Pledge is a security of movable property or movables – any property that can be moved from one location to
another, which generally include items such as inventory, furniture, jewelry, art, writings, or goods.
In some cases, there can be formal title documents that show the ownership and transfer rights of that property.
Any tangible or intangible asset or a body of assets may be pledged, xcept for inalienable assets or assets on
which execution may not be levied. Any property right or money claim, including the pledger’s right of claim to
the pledgee, may be pledged.
There are many type of pledge:
a. Pledge on credit instruments: prommisory note and bill of exchange.
b. Pledge on claims
c. Pledge on securities
d. Pledge on movable assets (inventory, equipment, installations etc.)

The pledger is a natural person or legal entity that has right of ownership to the pledged asset. Both the obligor
of a secured obligation and a third party may be a pledger.
Assets in common ownership may only be pledged by consent of all co-owners.
Pledgee is an entity for the benefit of which a pledge is established. Pledge is established with regard to a
movable or real asset or a body of movable or real assets. Pledge of real assets is called mortgage.
Movable assets are encumbered with pledge with or without their disposition. Pledge of a movable asset with its
disposition is called pawn.
The right of pledge also extends to the accessories of the pledged asset, provided the agreement does not say
otherwise. The publicity of the pledge is realized through its registered in the “Movable Assets Registry”.
A.3 Cash collateral
The borrower guarantees the loan with a deposit held with a different bank.
B.1 Guaranty
A surety is a person who agrees to be responsible for the debt or obligation of another.
Additionally, the situation in which a surety is most typically required is when the ability of the primary obligor
or principal to perform its obligations under a contract is in question, or when there is some public or private
interest which requires protection from the consequences of the principal’s default or delinquency.
If the surety is required to pay or perform due to the principal’s failure to do so, the law will usually give the
surety a right of subrogation, allowing the surety to “step into the shoes of” the principal and use his contractual
rights to recover the cost of making payment or performing on the principal’s behalf, even in the absence of an
express agreement to that effect between the surety and the principal.
The act of becoming a surety is also called a guaranty.
Traditionally a guaranty was distinguished from a surety in that the surety’s liability was joint and primary with
the principal, whereas the guaranty’s liability was ancillary and derivative, but many jurisdictions have
abolished this distinction.
B.2 Insurance policy
An insurance company guarantees the reimbursement of credit and the payment of the interest.
B.3 Bank letter guarantee

The bank guarantees that it would pay its client debt in the case in which the client would be unable to pay; the
bank will reimburse the credit received by its client if he/she won’t be able to pay his/her debt.
IV. OVERVIEW ON BANK RISKS
A bank has many risks that must be managed carefully, especially since a bank uses a large amount of
leverage. Without effective management of its risks, it could very easily become insolvent. If a bank is
perceived to be in a financially weak position, depositors will withdraw their funds, other banks won't lend to
it nor will the bank be able to sell debt securities in the financial markets, which will exacerbate the bank's
financial condition even more. The fear of bank failure was one of the major causes of the 2007 – 2009 credit
crisis and of other financial panics in the past.
Although banks share many of the same risks as other businesses, the major risks that especially affect banks
are liquidity risk, interest rate risks, credit default risks, and trading risks.
Liquidity Risk
Liquidity is the ability to pay, whether it is to pay a bill, to give a depositor their money, or to lend money as
part of a credit line. A basic expectation of any bank is to provide funds on demand, such as when a depositor
withdraws money from a savings account, or a business presents a check for payment, or borrowers may
want to draw on their credit lines. Another need for liquidity is simply to pay bills as they come due.
The main problem in liquidity management for a bank is that, while bills are mostly predictable, both in
timing and amount, customer demands for funds are highly unpredictable, especially demand deposits
(checking accounts).
Another major liquidity risk is off-balance sheet risks, such as loan commitments, letters of credit, and
derivatives. A loan commitment is a line of credit that a bank provides on demand. Letters of credit include
commercial letters of credit, where the bank guarantees that an importer will pay the exporter for imports
and a standby letter of credit which guarantees that an issuer of commercial paper or bonds will pay back
the principal.
Derivatives are a significant off-balance sheet risk, as evidenced by the collapse of American International
Group (AIG) in 2008. Banks participate in 2 major types of derivatives: interest rate swaps and credit default
swaps. Interest rate swaps are agreements where one party exchanges fixed interest rate payments for
floating rates. Credit default swaps (CDSs) are agreements where one party guarantees the principal
payment of a bond to the bondholder.
Liquidity management is achieved by asset and liability management. Asset management requires keeping
cash and keeping liquid assets that can be sold quickly at little cost. Liability management is borrowing.

Asset Management
The primary key to using asset management to provide liquidity is to keep both cash and liquid
assets. Liquid assets can be sold quickly for what they are worth minus a transaction cost or bid/ask spread.
Hence, liquid assets can be converted into a means of payment for little cost.
The primary liquidity solution for banks is to have reserves, which are also required by law. Reserves are the
amount of money held either as vault cash or as cash held in the bank's account at the Federal Reserve, often
referred to as federal funds. It can also include cash that a bank has in an account at a correspondent bank. In
the United States, the Federal Reserve determines the amount of required reserves (aka legal
reserves, primary reserves), which is expressed as a required reserve ratio, which is the amount of
reserves as a percentage of the bank's demand deposits. A bank may even keep excess reserves in its Federal
Reserve account for greater liquidity, especially since the Federal Reserve has started paying interest on these
accounts since October, 2008.
Although reserves provide liquidity, they earn little or no money. Vault cash pays no interest at all and
Federal Reserve accounts have paid 1% or less. By buying liquid assets, a bank can earn money while
maintaining liquidity. The most liquid—and safest—asset is United States Treasuries, of which banks are
major buyers.
Banks can also sell loans, especially those that are regularly securitized, such as mortgages, credit card and
auto loan receivables.
A bank can also increase liquidity by not renewing loans. Many loans are short-term loans that are constantly
renewed, such as when a bank buys commercial paper from a business. By not renewing the loan, the bank
receives the principal. However, most banks do not want to use this method because most short-term
borrowers are business customers, and not renewing a loan could alienate the customer, prompting them to
take their business elsewhere.
Liability Management
A bank can increase liquidity by borrowing, either by taking out a loan or by issuing securities. Banks
predominantly borrow from each other in an interbank market known as the federal funds market where
banks with excess reserves loan to banks with insufficient reserves. Banks can also borrow directly from the
Federal Reserve, but they only do so as a last resort.
Banks are big users of a debt instrument known as a repurchase agreement (aka repo), which is a short-
term collateralized loan where the borrower exchanges collateral for the loan with the intent of reversing the
transaction at a specified time, along with the payment of interest. Most repos are overnight loans, and the

most common collateral is Treasury bills. Repos are usually made with institutional investors, such as
investment and pension funds, who often have cash to invest.
The major security that banks sell is the large certificate of deposit (CD), which is highly negotiable, and
can be easily sold in the money markets. A large CD is a time deposit of $100,000 or more. (Banks also sell
small CDs to retail customers, but these can't be sold in the financial markets.) Other major securities sold by
banks include commercial paper and bonds.
Credit Risks
Credit default risk occurs when a borrower cannot repay the loan. Eventually, usually after a period of 90
days of nonpayment, the loan is written off. Banks are required by law to maintain an account for loan loss
reserves to cover these losses.
Banks reduce credit risk by screening loan applicants, requiring collateral for a loan, credit risk analysis, and
by diversification.
Banks can substantially reduce their credit risk by lending to their customers, since they have much more
information on them than on others, which helps to reduce adverse selection. Checking and savings accounts
can reveal how well the customer handles money, their minimum income and monthly expenses, and the
amount of their reserves to hold them over financially stressful times. Banks will also verify incomes and
employment history, and get credit reports and credit scores from credit reporting agencies.
Collateral for a loan greatly reduces credit risk not only because the borrower has greater motivation to repay
the loan, but also because the collateral can be sold to repay the debt in case of default.
When banks make loans to others who are not customers, then the bank has to rely more on credit risk
analysis to determine the credit risk of the loan applicant. Credit risk analysis is the determination of how
much risk a potential borrower poses and what interest rate should be charged. The potential risk of a
borrower is quantified into a credit rating that depends on information about the borrower and well as
statistical models of the business or individual applicant. There are credit rating agencies for businesses, such
as Moody's or Standard Poor for larger entities and Dun & Bradstreet for smaller businesses and Experian,
TransUnion, and Equifax for individuals. Most of these credit reporting agencies assign a number or other
code that signifies the potential risk of the borrower. A bank will also look at other information, such as the
borrower's income and history.
A bank can also reduce credit risk by diversifying—making loans to businesses in different industries or to
borrowers in different locations.

Interest Rate Risk
A bank's main source of profit is converting the liabilities of deposits and borrowings into assets of loans and
securities. It profits by paying a lower interest on its liabilities than it earns on its assets—the difference in
these rates is the net interest margin.
However, the terms of its liabilities are usually shorter than the terms of its assets. In other words, the interest
rate paid on deposits and short-term borrowings are sensitive to short-term rates, while the interest rate
earned on long-term liabilities is fixed. This creates interest rate risk, which, in the case of banks, is the risk
that interest rates will rise, causing the bank to pay more for its liabilities, and, thus, reducing its profits.
For instance, if a bank has a loan for $100 for which it receives $7 annually in interest, and a deposit of $100
for which it pays $3 per year in interest, that is a net interest margin of $4. But if current market interest rates
for deposits rises to 4%, then the bank will have to start paying $4 for the $100 deposit while still receiving
7% on the long-term loan, decreasing its profit in this scenario by $1.
All short-term and floating-rate assets and liabilities are interest-rate sensitive—the interest received on
assets and paid on liabilities changes with market rates. Long-term and fixed-rate assets and liabilities are not
interest-rate sensitive. Interest-rate sensitive assets include savings deposits and interest-paying checking
accounts. Long-term CDs are not interest-rate sensitive.
So for a bank to determine its overall risk to changing interest rates, it must determine how its income will
change when interest rates change. Gap analysis and duration analysis are 2 common tools for measuring the
interest rate risk of bank portfolios. Since interest rates affect the prices of bank assets and liabilities in the
same way that they affect bonds, bankers also use a tool commonly used in bond portfolio analysis—
duration analysis.
Duration measures the change in the price of a bond when the interest rate changes by 1%. A bank calculates
its duration gap by subtracting the weighted average duration of its assets minus the weighted average
duration of its liabilities.
Reducing Interest Rate Risk
Banks could reduce interest rate risk by matching the terms of its interest rate sensitive assets to it liabilities,
but this would reduce profits. It could also make long-term loans based on a floating rate, but many
borrowers demand a fixed rate to lower their own risks. In addition, floating-rate loans increase credit risk
when rates rise because the borrowers have to pay more each month on their loans, and, thus, may not be able
to afford it. This is best exemplified by the many homeowners who defaulted because of rising interest rates
on their adjustable rate mortgages (ARMs) during the 2007 – 2009 credit crisis.

Increasingly, banks are using interest rate swaps to reduce their credit risk, where banks pay the fixed interest
rate they receive on their assets to a counterparty in exchange for a floating rate payment.
Trading Risk
Generally, greater profits can be made by taking greater risks. A bank's leverage ratio is limited by law, but it
can try to earn greater profits by trading securities. Although United States banks cannot, by law, own stocks,
they can buy debt securities and derivatives. For this, banks hire traders for a separate department that
specializes in trading securities.
The risk of trades is measured by standard statistical tools for measuring investment risk: standard deviations
and value at risk (VaR). However, many banks use more sophisticated financial models to gauge risk and to
increase their profits, but the 2007 – 2009 credit crisis showed that many of these models were faulty.
Also, rogue traders can cause stupendous losses for banks, even causing their bankruptcy. Consider Barings
Bank that started in 1762, and was considered to be the most stable and safest bank for centuries. In 1995,
Nick Leeson lost more than 860 million pounds trading Japanese equities in Singapore. Barings was unable
to provide the cash to cover the losses, so it collapsed.
The 2007 - 2009 credit crisis has also shown the tremendous risks presented by derivatives, which are
securities whose value depends on an underlying asset or index. The most common derivatives bought and
sold by banks are mortgage-backed securities (MBS), interest-rate swaps, and credit default
swaps (aka credit derivatives).
Foreign Exchange Risk
International banks trade large amounts of currencies, which introduces foreign exchange risk, when the
value of a currency falls with respect to another. A bank may hold assets denominated in a foreign currency
while holding liabilities in their own currency. If the exchange rate of the foreign currency falls, then both the
interest payments and the principal repayment will be worth less than when the loan was given, which
reduces a bank's profits.
Banks can hedge this risk with forward contracts, futures, or currency derivatives which will guarantee an
exchange rate at some future date or provide a payment to compensate for losses arising from an adverse
move in currency exchange rates. A bank, with a foreign branch or subsidiary in the country, can also take
deposits in the foreign currency, which will match their assets with their liabilities.
Sovereign Risk
Many foreign loans are paid in U.S. dollars and repaid with dollars. Some of these foreign loans are to
countries with unstable governments. If political problems arise in the country that threatens investments,

investors will pull their money out to prevent losses arising from sovereign risk. In this scenario, the native
currency declines rapidly compared to other currencies, and governments will often impose capital controls
to prevent more capital from leaving the country. It also make foreign currency held in the country more
valuable; hence, foreign borrowers are often prohibited from using foreign currency, such as U.S. dollars, in
repaying loans in an attempt to conserve the more valuable currency when the native currency is declining in
value.
Operational Risk
Operational risk arises from faulty business practices or when buildings, equipment, and other property
required to run the business are damaged or destroyed. For instance, banks in the vicinity of the World Trade
Center suffered considerable losses as a result of the terrorist attacks on September, 11, 2001, which knocked
out power and communications in the surrounding area. Barings Bank collapsed because its audit controls did
not detect the calamitous losses suffered by its rogue trader, Nick Leeson, early enough to prevent its
collapse.
Many types of operational risk, such as the destruction of property, are covered by insurance. However, good
management is required to prevent losses due to faulty business practices, since such losses are not insurable
V. CREDIT RISK MANAGEMENT
1. Managing credit risk
Credit risk arises from the potential that an obligor is either unwilling to perform on an obligation or its ability
to perform such obligation is impaired resulting in economic loss to the bank.
1.1 In a bank’s portfolio, losses stem from outright default due to inability or unwillingness of a customer or
counter party to meet commitments in relation to lending, trading, settlement and other financial transactions.
Alternatively losses may result from reduction in portfolio value due to actual or perceived deterioration in
credit quality. Credit risk emanates from a bank’s dealing with individuals, corporate, financial institutions or a
sovereign. For most banks, loans are the largest and most obvious source of credit risk; however, credit risk
could stem from activities both on and off balance sheet.
1.2 In addition to direct accounting loss, credit risk should be viewed in the context of economic exposures.
This encompasses opportunity costs, transaction costs and expenses associated with a non-performing asset over
and above the accounting loss.
1.3 Credit risk can be further sub-categorized on the basis of reasons of default. For instance the default could
be due to country in which there is exposure or problems in settlement of a transaction.

1.4 Credit risk not necessarily occurs in isolation. The same source that endangers credit risk for the institution
may also expose it to other risk. For instance a bad portfolio may attract liquidity problem.
2. Components of credit risk management
2.1 A typical Credit risk management framework in a financial institution may be broadly categorized into
following main components.
a) Board and senior Management’s Oversight
b) Organizational structure
c) Systems and procedures for identification, acceptance, measurement, monitoring and control risks.
Board and Senior Management’s Oversight
2.2 It is the overall responsibility of bank’s Board to approve bank’s credit risk strategy and significant policies
relating to credit risk and its management which should be based on the bank’s overall business strategy. To
keep it current, the overall strategy has to be reviewed by the board, preferably annually. The responsibilities of
the Board with regard to credit risk management shall include:
a) Delineate bank’s overall risk tolerance in relation to credit risk
b) Ensure that bank’s overall credit risk exposure is maintained at prudent levels and consistent with the
available capital
c) Ensure that top management as well as individuals responsible for credit risk management possess sound
expertise and knowledge to accomplish the risk management function
d) Ensure that the bank implements sound fundamental principles that facilitate the identification, measurement,
monitoring and control of credit risk.
e) Ensure that appropriate plans and procedures for credit risk management are in place.
2.3 The very first purpose of bank’s credit strategy is to determine the risk appetite of the bank. Once it is
determined the bank could develop a plan to optimize return while keeping credit risk within predetermined
limits. The bank’s credit risk strategy thus should spell out:
a) The institution’s plan to grant credit based on various client segments and products, economic sectors,
geographical location, currency and maturity
b) Target market within each lending segment, preferred level of diversification/concentration.
c) Pricing strategy.

2.4 It is essential that banks give due consideration to their target market while devising credit risk strategy. The
credit procedures should aim to obtain an in-depth understanding of the bank’s clients, their credentials & their
businesses in order to fully know their customers.
2.5 The strategy should provide continuity in approach and take into account cyclic aspect of country’s
economy and the resulting shifts in composition and quality of overall credit portfolio. While the strategy would
be reviewed periodically and amended, as deemed necessary, it should be viable in long term and through
various economic cycles.
2.6 The senior management of the bank should develop and establish credit policies and credit administration
procedures as a part of overall credit risk management framework and get those approved from board. Such
policies and procedures shall provide guidance to the staff on various types of lending including corporate,
SME, consumer, agriculture, etc. At minimum the policy should include:
a) Detailed and formalized credit evaluation/ appraisal process.
b) Credit approval authority at various hierarchy levels including authority for approving exceptions
c) Risk identification, measurement, monitoring and control
d) Risk acceptance criteria
e) Credit origination and credit administration and loan documentation procedures
f) Roles and responsibilities of units/staff involved in origination and management of credit.
g) Guidelines on management of problem loans.
2.7 In order to be effective these policies must be clear and communicated down the line. Further any
significant deviation/exception to these policies must be communicated to the top management/board and
corrective measures should be taken. It is the responsibility of senior management to ensure effective
implementation of these policies.
3. Organizational Structure
3.1 To maintain bank’s overall credit risk exposure within the parameters set by the board of directors, the
importance of a sound risk management structure is second to none. While the banks may choose different
structures, it is important that such structure should be commensurate with institution’s size, complexity and
diversification of its activities. It must facilitate effective management oversight and proper execution of credit
risk management and control processes.
3.2 Each bank, depending upon its size, should constitute a Credit Risk Management Committee (CRMC),
ideally comprising of head of credit risk management Department, credit department and treasury. This

committee reporting to bank’s risk management committee should be empowered to oversee credit risk taking
activities and overall credit risk management function. The CRMC should be mainly responsible for:
a) The implementation of the credit risk policy / strategy approved by the Board.
b) Monitor credit risk on a bank-wide basis and ensure compliance with limits approved by the Board.
c) Recommend to the Board, for its approval, clear policies on standards for presentation of credit proposals,
financial covenants, rating standards and benchmarks.
d) Decide delegation of credit approving powers, prudential limits on large credit exposures, standards for loan
collateral, portfolio management, loan review mechanism, risk concentrations, risk monitoring and evaluation,
pricing of loans, provisioning, regulatory/legal compliance, etc.
3.3 Further, to maintain credit discipline and to enunciate credit risk management and control process there
should be a separate function independent of loan origination function. Credit policy formulation, credit limit
setting, monitoring of credit exceptions / exposures and review /monitoring of documentation are functions that
should be performed independently of the loan origination function. For small banks where it might not be
feasible to establish such structural hierarchy, there should be adequate compensating measures to maintain
credit discipline introduce adequate checks and balances and standards to address potential conflicts of interest.
Ideally, the banks should institute a Credit Risk Management Department (CRMD). Typical functions of
CRMD include:
a) To follow a holistic approach in management of risks inherent in banks portfolio and ensure the risks remain
within the boundaries established by the Board or Credit Risk Management Committee.
b) The department also ensures that business lines comply with risk parameters and prudential limits established
by the Board or CRMC.
c) Establish systems and procedures relating to risk identification, Management Information System, monitoring
of loan / investment portfolio quality and early warning. The department would work out remedial measure
when deficiencies/problems are identified.
d) The Department should undertake portfolio evaluations and conduct comprehensive studies on the
environment to test the resilience of the loan portfolio.
3.4 Notwithstanding the need for a separate or independent oversight, the front office or loan origination
function should be cognizant of credit risk, and maintain high level of credit discipline and standards in pursuit
of business opportunities.
4. Systems and Procedures
Credit Origination

4.1 Banks must operate within a sound and well-defined criteria for new credits as well as the expansion of
existing credits. Credits should be extended within the target markets and lending strategy of the institution.
Before allowing a credit facility, the bank must make an assessment of risk profile of the customer/transaction.
This may include:
a) Credit assessment of the borrower’s industry, and macro economic factors.
b) The purpose of credit and source of repayment.
c) The track record / repayment history of borrower.
d) Assess/evaluate the repayment capacity of the borrower.
e) The Proposed terms and conditions and covenants.
f) Adequacy and enforceability of collaterals.
g) Approval from appropriate authority
4.2 In case of new relationships consideration should be given to the integrity and repute of the borrowers or
counter party as well as its legal capacity to assume the liability. Prior to entering into any new credit
relationship the banks must become familiar with the borrower or counter party and be confident that they are
dealing with individual or organization of sound repute and credit worthiness. However, a bank must not grant
credit simply on the basis of the fact that the borrower is perceived to be highly reputable i.e. name lending
should be discouraged.
4.3 While structuring credit facilities institutions should appraise the amount and timing of the cash flows as
well as the financial position of the borrower and intended purpose of the funds. It is utmost important that due
consideration should be given to the risk reward trade –off in granting a credit facility and credit should be
priced to cover all embedded costs. Relevant terms and conditions should be laid down to protect the
institution’s interest.
4.4 Institutions have to make sure that the credit is used for the purpose it was borrowed. Where the obligor has
utilized funds for purposes not shown in the original proposal, institutions should take steps to determine the
implications on creditworthiness. In case of corporate loans where borrower own group of companies such
diligence becomes more important. Institutions should classify such connected companies and conduct credit
assessment on consolidated/group basis.
4.5 In loan syndication, generally most of the credit assessment and analysis is done by the lead institution.
While such information is important, institutions should not over rely on that. All syndicate participants should
perform their own independent analysis and review of syndicate terms.

4.6 Institution should not over rely on collaterals/covenant. Although the importance of collaterals held against
loan is beyond any doubt, yet these should be considered as a buffer providing protection in case of default,
primary focus should be on obligor’s debt servicing ability and reputation in the market.
Limit setting
4.7 An important element of credit risk management is to establish exposure limits for single obligors and group
of connected obligors. Institutions are expected to develop their own limit structure while remaining within the
exposure limits set by Central Banks. The size of the limits should be based on the credit strength of the obligor,
genuine requirement of credit, economic conditions and the institution’s risk tolerance. Appropriate limits
should be set for respective products and activities. Institutions may establish limits for a specific industry,
economic sector or geographic regions to avoid concentration risk.
4.8 Some times, the obligor may want to share its facility limits with its related companies. Institutions should
review such arrangements and impose necessary limits if the transactions are frequent and significant.
4.9 Credit limits should be reviewed regularly at least annually or more frequently if obligor’s credit quality
deteriorates. All requests of increase in credit limits should be substantiated.
5. Credit Administration.
5.1 Ongoing administration of the credit portfolio is an essential part of the credit process. Credit administration
function is basically a back office activity that support and control extension and maintenance of credit. A
typical credit administration unit performs following functions:
a. Documentation. It is the responsibility of credit administration to ensure completeness of documentation
(loan agreements, guarantees, transfer of title of collaterals etc) in accordance with approved terms and
conditions. Outstanding documents should be tracked and followed up to ensure execution and receipt.
b. Credit Disbursement. The credit administration function should ensure that the loan application has proper
approval before entering facility limits into computer systems. Disbursement should be effected only after
completion of covenants, and receipt of collateral holdings. In case of exceptions necessary approval should be
obtained from competent authorities.
c. Credit monitoring. After the loan is approved and draw down allowed, the loan should be continuously
watched over. These include keeping track of borrowers’ compliance with credit terms, identifying early signs
of irregularity, conducting periodic valuation of collateral and monitoring timely repayments.

d. Loan Repayment. The obligors should be communicated ahead of time as and when the principal/markup
installment becomes due. Any exceptions such as non-payment or late payment should be tagged and
communicated to the management. Proper records and updates should also be made after receipt.
e. Maintenance of Credit Files. Institutions should devise procedural guidelines and standards for maintenance
of credit files. The credit files not only include all correspondence with the borrower but should also contain
sufficient information necessary to assess financial health of the borrower and its repayment performance. It
need not mention that information should be filed in organized way so that external/internal auditors or Central
Bank inspector could review it easily.
f. Collateral and Security Documents. Institutions should ensure that all security documents are kept in a
fireproof safe under dual control. Registers for documents should be maintained to keep track of their
movement. Procedures should also be established to track and review relevant insurance coverage for certain
facilities/collateral. Physical checks on security documents should be conducted on a regular basis.
5.2 While in small institutions it may not be cost effective to institute a separate credit administrative set-up, it
is important that in such institutions individuals performing sensitive functions such as custody of key
documents, wiring out funds, entering limits into system, etc., should report to managers who are independent
of business origination and credit approval process.
6. Measuring credit risk
6.1 The measurement of credit risk is of vital importance in credit risk management. A number of qualitative
and quantitative techniques to measure risk inherent in credit portfolio are evolving. To start with, banks should
establish a credit risk rating framework across all type of credit activities. Among other things, the rating
framework may, incorporate:
Business Risk
- Industry Characteristics
- Competitive Position (e.g. marketing/technological edge)
- Management
Financial Risk
- Financial condition
- Profitability
- Capital Structure
- Present and future Cash flows

Internal Risk Rating
6.2 Credit risk rating is summary indicator of a bank’s individual credit exposure. An internal rating system
categorizes all credits into various classes on the basis of underlying credit quality. A well-structured credit
rating framework is an important tool for monitoring and controlling risk inherent in individual credits as well
as in credit portfolios of a bank or a business line. The importance of internal credit rating framework becomes
more eminent due to the fact that historically major losses to banks stemmed from default in loan portfolios.
While a number of banks already have a system for rating individual credits in addition to the risk categories
prescribed by Central Bank, all banks are encouraged to devise an internal rating framework. An internal rating
framework would facilitate banks in a number of ways such as:
a) Credit selection
b) Amount of exposure
c) Tenure and price of facility
d) Frequency or intensity of monitoring
e) Analysis of migration of deteriorating credits and more accurate computation of future loan loss provision
f) Deciding the level of approving authority of loan.
The architecture of internal rating system
6.3 The decision to deploy any risk rating architecture for credits depends upon two basic aspects:
a) The Loss Concept and the number and meaning of grades on the rating continuum corresponding to each loss
concept1.
b) Whether to rate a borrower on the basis of ‘point in time philosophy’ or ‘through the cycle approach.
Besides there are other issues such as whether to include statutory grades in the scale, the type of rating scale
i.e. alphabetical numerical or alpha-numeric etc. Usually, the Central Bank does not advocate any particular
credit risk rating system; it should be banks own choice. However the system should commensurate with the
size, nature and complexity of their business as well as possess flexibility to accommodate present and future
risk profile of the bank, the anticipated level of diversification and sophistication in lending activities.
6.4 A rating system with large number of grades on rating scale becomes more expensive due to the fact that the
cost of obtaining and analyzing additional information for fine gradation increase sharply. However, it is
1 The credit risk exposure involves both the probability of Default (PD) and loss in the event of default or loss given default (LGD). The former is specific to borrower while the later corresponds to the facility. The product of PD and LGD is the expected loss.

important that there should be sufficient gradations to permit accurate characterization of the under lying risk
profile of a loan or a portfolio of loans
The operating Design of Rating System.
6.5 As with the decision to grant credit, the assignment of ratings always involve element of human judgment.
Even sophisticated rating models do not replicate experience and judgment rather these techniques help and
reinforce subjective judgment. Banks thus design the operating flow of the rating process in a way that is aimed
promoting the accuracy and consistency of the rating system while not unduly restricting the exercise of
judgment. Key issues relating to the operating design of a rating system include what exposures to rate; the
organization’s division of responsibility for grading; the nature of ratings review; the formality of the process
and specificity of formal rating definitions.
What Exposures are rated?
6.6 Ideally all the credit exposures of the bank should be assigned a risk rating. However given the element of
cost, it might not be feasible for all banks to follow. The banks may decide on their own which exposure needs
to be rated. The decision to rate a particular loan could be based on factors such as exposure amount, business
line or both. Generally corporate and commercial exposures are subject to internal ratings and banks use scoring
models for consumer /retail loans.
The rating process in relation to credit approval and review
6.7 Ratings are generally assigned /reaffirmed at the time of origination of a loan or its renewal /enhancement.
The analysis supporting the ratings is inseparable from that required for credit appraisal. In addition the rating
and loan analysis process while being separate are intertwined. The process of assigning a rating and its
approval / confirmation goes along with the initiation of a credit proposal and its approval.
How to arrive at ratings
6.8 The assignment of a particular rating to an exposure is basically an abbreviation of its overall risk profile.
Theoretically ratings are based upon the major risk factors and their intensity inherent in the business of the
borrower as well as key parameters and their intensity to those risk factors. Major risk factors include borrowers
financial condition, size, industry and position in the industry; the reliability of financial statements of the
borrower; quality of management; elements of transaction structure such as covenants etc. A more detail on the
subject would be beyond the scope of these guidelines, however a few important aspects are:
a) Banks may vary somewhat in the particular factors they consider and the weight they give to each factor.

b) Since the rater and reviewer of rating should be following the same basic thought, to ensure uniformity in the
assignment and review of risk grades, the credit policy should explicitly define each risk grade; lay down
criteria to be fulfilled while assigning a particular grade, as well as the circumstances under which deviations
from criteria can take place.
c) The credit policy should also explicitly narrate the roles of different parties involved in the rating process.
d) The institution must ensure that adequate training is imparted to staff to ensure uniform ratings.
e) Assigning a rating is basically a judgmental exercise and the models, external ratings and written
guidelines/benchmarks serve as input.
f) Institutions should take adequate measures to test and develop a risk rating system prior to adopting one.
Adequate validation testing should be conducted during the design phase as well as over the life of the system
to ascertain the applicability of the system to the institution’s portfolio.
6.9 Institutions that use sophisticated statistical models to assign ratings or to calculate probabilities of default,
must ascertain the applicability of these models to their portfolios. Even when such statistical models are found
to be satisfactory, institutions should not use the output of such models as the sole criteria for assigning ratings
or determining the probabilities of default. It would be advisable to consider other relevant inputs as well.
Ratings review
6.10 The rating review can be two-fold:
a) Continuous monitoring by those who assigned the rating. The Relationship Managers (RMs) generally have a
close contact with the borrower and are expected to keep an eye on the financial stability of the borrower. In the
event of any deterioration the ratings are immediately revised /reviewed.
b) Secondly the risk review functions of the bank or business lines also conduct periodical review of ratings at
the time of risk review of credit portfolio.
6.11 Risk ratings should be assigned at the inception of lending, and updated at least annually. Institutions
should, however, review ratings as and when adverse events occur. A separate function independent of loan
origination should review risk ratings. As part of portfolio monitoring, institutions should generate reports on
credit exposure by risk grade. Adequate trend and migration analysis should also be conducted to identify any
deterioration in credit quality. Institutions may establish limits for risk grades to highlight concentration in
particular rating bands. It is important that the consistency and accuracy of ratings is examined periodically by a
function such as an independent credit review group.
6.12 For consumer lending, institutions may adopt credit-scoring models for processing loan applications and
monitoring credit quality. Institutions should apply the above principles in the management of scoring models.

Where the model is relatively new, institutions should continue to subject credit applications to rigorous review
until the model has stabilized.
7. Credit Risk Monitoring & Control
7.1 Credit risk monitoring refers to incessant monitoring of individual credits inclusive of Off-Balance sheet
exposures to obligors as well as overall credit portfolio of the bank. Banks need to enunciate a system that
enables them to monitor quality of the credit portfolio on day-to-day basis and take remedial measures as and
when any deterioration occurs. Such a system would enable a bank to ascertain whether loans are being serviced
as per facility terms, the adequacy of provisions, the overall risk profile is within limits established by
management and compliance of regulatory limits. Establishing an efficient and effective credit monitoring
system would help senior management to monitor the overall quality of the total credit portfolio and its trends.
Consequently the management could fine tune or reassess its credit strategy /policy accordingly before
encountering any major setback. The banks credit policy should explicitly provide procedural guideline relating
to credit risk monitoring. At the minimum it should lay down procedure relating to
a) The roles and responsibilities of individuals responsible for credit risk monitoring
b) The assessment procedures and analysis techniques (for individual loans & overall portfolio)
c) The frequency of monitoring
d) The periodic examination of collaterals and loan covenants
e) The frequency of site visits
f) The identification of any deterioration in any loan
Given below are some key indicators that depict the credit quality of a loan:
a. Financial Position and Business Conditions. The most important aspect about an obligor is its financial
health, as it would determine its repayment capacity. Consequently institutions need carefully watch financial
standing of obligor. The Key financial performance indicators on profitability, equity, leverage and liquidity
should be analyzed. While making such analysis due consideration should be given to business/industry risk,
borrowers position within the industry and external factors such as economic condition, government policies,
regulations. For companies whose financial position is dependent on key management personnel and/or
shareholders, for example, in small and medium enterprises, institutions would need to pay particular attention
to the assessment of the capability and capacity of the management/shareholder(s).
b. Conduct of Accounts. In case of existing obligor the operation in the account would give a fair idea about
the quality of credit facility. Institutions should monitor the obligor’s account activity, repayment history and

instances of excesses over credit limits. For trade financing, institutions should monitor cases of repeat
extensions of due dates for trust receipts and bills.
c. Loan Covenants. The obligor’s ability to adhere to negative pledges and financial covenants stated in the
loan agreement should be assessed, and any breach detected should be addressed promptly.
d. Collateral valuation. Since the value of collateral could deteriorate resulting in unsecured lending, banks
need to reassess value of collaterals on periodic basis. The frequency of such valuation is very subjective and
depends upon nature of collaterals. For instance loan granted against shares need revaluation on almost daily
basis whereas if there is mortgage of a residential property the revaluation may not be necessary as frequently.
In case of credit facilities secured against inventory or goods at the obligor’s premises, appropriate inspection
should be conducted to verify the existence and valuation of the collateral. If such goods are perishable or such
that their value diminish rapidly (e.g. electronic parts/equipments), additional precautionary measures should be
taken.
7.2 External Rating and Market Price of securities purchased as a form of lending or long-term investment
should be monitored for any deterioration in credit rating of the issuer, as well as large decline in market price.
Adverse changes should trigger additional effort to review the creditworthiness of the issuer.
8. Risk review
8.1 The institutions must establish a mechanism of independent, ongoing assessment of credit risk management
process. All facilities except those managed on a portfolio basis should be subjected to individual risk review at
least once in a year. The results of such review should be properly documented and reported directly to board,
or its sub committee or senior management without lending authority. The purpose of such reviews is to assess
the credit administration process, the accuracy of credit rating and overall quality of loan portfolio independent
of relationship with the obligor.
8.2 Institutions should conduct credit review with updated information on the obligor’s financial and business
conditions, as well as conduct of account. Exceptions noted in the credit monitoring process should also be
evaluated for impact on the obligor’s creditworthiness. Credit review should also be conducted on a
consolidated group basis to factor in the business connections among entities in a borrowing group.
8.3 As stated earlier, credit review should be performed on an annual basis, however more frequent review
should be conducted for new accounts where institutions may not be familiar with the obligor, and for classified
or adverse rated accounts that have higher probability of default.

8.4 For consumer loans, institutions may dispense with the need to perform credit review for certain products.
However, they should monitor and report credit exceptions and deterioration.
9. Delegation of Authority.
9.1 Banks are required to establish responsibility for credit sanctions and delegate authority to approve credits
or changes in credit terms. It is the responsibility of banks board to approve the overall lending authority
structure, and explicitly delegate credit sanctioning authority to senior management and the credit committee.
Lending authority assigned to officers should be commensurate with the experience, ability and personal
character. It would be better if institutions develop risk-based authority structure where lending power is tied to
the risk ratings of the obligor. Large banks may adopt multiple credit approvers for sanctioning such as credit
ratings, risk approvals etc to institute a more effective system of check and balance. The credit policy should
spell out the escalation process to ensure appropriate reporting and approval of credit extension beyond
prescribed limits. The policy should also spell out authorities for unsecured credit (while remaining within
Central Bank limits), approvals of disbursements excess over limits and other exceptions to credit policy.
9.2 In cases where lending authority is assigned to the loan originating function, there should be compensating
processes and measures to ensure adherence to lending standards. There should also be periodic review of
lending authority assigned to officers.
10. Managing problem credits
10.1 The institution should establish a system that helps identify problem loan ahead of time when there may be
more options available for remedial measures. Once the loan is identified as problem, it should be managed
under a dedicated remedial process.
10.2 A bank’s credit risk policies should clearly set out how the bank will manage problem credits. Banks differ
on the methods and organization they use to manage problem credits. Responsibility for such credits may be
assigned to the originating business function, a specialized workout section, or a combination of the two,
depending upon the size and nature of the credit and the reason for its problems. When a bank has significant
credit-related problems, it is important to segregate the workout function from the credit origination function.
The additional resources, expertise and more concentrated focus of a specialized workout section normally
improve collection results.
10.3 A problem loan management process encompass following basic elements.

a. Negotiation and follow-up. Proactive effort should be taken in dealing with obligors to implement remedial
plans, by maintaining frequent contact and internal records of follow-up actions. Often rigorous efforts made at
an early stage prevent institutions from litigations and loan losses
b. Workout remedial strategies. Some times appropriate remedial strategies such as restructuring of loan
facility, enhancement in credit limits or reduction in interest rates help improve obligor’s repayment capacity.
However it depends upon business condition, the nature of problems being faced and most importantly obligor’s
commitment and willingness to repay the loan. While such remedial strategies often bring up positive results,
institutions need to exercise great caution in adopting such measures and ensure that such a policy must not
encourage obligors to default intentionally. The institution’s interest should be the primary consideration in case
of such workout plans. It needs not mention here that competent authority, before their implementation, should
approve such workout plan.
c. Review of collateral and security document. Institutions have to ascertain the loan recoverable amount by
updating the values of available collateral with formal valuation. Security documents should also be reviewed to
ensure the completeness and enforceability of contracts and collateral/guarantee.
d. Status Report and Review Problem credits should be subject to more frequent review and monitoring. The
review should update the status and development of the loan accounts and progress of the remedial plans.
Progress made on problem loan should be reported to the senior management.

MODULE V: FINANCIAL MARKETS
I. THE INVESTMENT ENVIRONMENT2
Real assets versus financial assets
The material wealth of a society is determined ultimately by the productive capacity of its economy—the goods and services that can be provided to its members. This productive capacity is a function of the real assets of the economy: the land, buildings, knowledge, and machines that are used to produce goods and the workers whose skills are necessary to use those resources. Together, physical and “human” assets generate the entire spectrum of output produced and consumed by the society.
In contrast to such real assets are financial assets such as stocks or bonds. These assets, per se, do not represent a society’s wealth. Shares of stock are no more than sheets of paper or more likely, computer entries, and do not directly contribute to the productive capacity of the economy. Instead, financial assets contribute to the productive capacity of the economy indirectly, because they allow for separation of the ownership and management of the firm and facilitate the transfer of funds to enterprises with attractive investment opportunities.
Financial assets certainly contribute to the wealth of the individuals or firms holding them. This is because financial assets are claims to the income generated by real assets or claims on income from the government. When the real assets used by a firm ultimately generate income, the income is allocated to investors according to their ownership of the financial assets, or securities, issued by the firm. Bondholders, for example, are entitled to a flow of income based on the interest rate and par value of the bond. Equity holders or stockholders are entitled to any residual income after bondholders and other creditors are paid. In this way the values of financial assets are derived from and depend on the values of the underlying real assets of the firm.
Real assets produce goods and services, whereas financial assets define the allocation of income or wealth among investors. Individuals can choose between consuming their current endowments of wealth today and investing for the future. When they invest for the future, they may choose to hold financial assets. The money a firm receives when it issues securities (sells them to investors) is used to purchase real assets. Ultimately, then, the returns on a financial asset come from the income produced by the real assets that are financed by the issuance of the security. In this way, it is useful to view financial assets as the means by which individuals hold their claims on real assets in well-developed economies.
Most of us cannot personally own auto plants (a real asset), but we can hold shares of General Motors or Ford (a financial asset), which provide us with income derived from the production of automobiles. Real and
2 Text adapted from Z. Bodie, A. Kane, A.J. Marcus, “Investments – volume I”, 5th edition, McGraw-Hill, 2003. Educational purpose only.

financial assets are distinguished operationally by the balance sheets of individuals and firms in the economy. Whereas real assets appear only on the asset side of the balance sheet, financial assets always appear on both sides of balance sheets. Your financial claim on a firm is an asset, but the firm’s issuance of that claim is the firm’s liability. When we aggregate over all balance sheets, financial assets will cancel out, leaving only the sum of real assets as the net wealth of the aggregate economy.
Another way of distinguishing between financial and real assets is to note that financial assets are created and destroyed in the ordinary course of doing business. For example, when a loan is paid off, both the creditor’s claim (a financial asset) and the debtor’s obligation (a financial liability) cease to exist. In contrast, real assets are destroyed only by accident or by wearing out over time.
Financial markets and the economy
We stated earlier that real assets determine the wealth of an economy, whereas financial assets merely represent claims on real assets. Nevertheless, financial assets and the markets in which they are traded play several crucial roles in developed economies. Financial assets allow us to make the most of the economy’s real assets.
Consumption Timing
Some individuals in an economy are earning more than they currently wish to spend. Others—for example, retirees—spend more than they currently earn. How can you shift your purchasing power from high-earnings periods to low-earnings periods of life? One way is to “store” your wealth in financial assets. In high-earnings periods, you can invest your savings in financial assets such as stocks and bonds. In low-earnings periods, you can sell these assets to provide funds for your consumption needs. By so doing, you can shift your consumption over the course of your lifetime, thereby allocating your consumption to periods that provide the greatest satisfaction. Thus financial markets allow individuals to separate decisions concerning current consumption from constraints that otherwise would be imposed by current earnings.
Allocation of Risk
Virtually all real assets involve some risk. When GM builds its auto plants, for example, its management cannot know for sure what cash flows those plants will generate. Financial markets and the diverse financial instruments traded in those markets allow investors with the greatest taste for risk to bear that risk while other less-risk-tolerant individuals can, to a greater extent, stay on the sidelines. For example, if GM raises the funds to build its auto plant by selling both stocks and bonds to the public, the more optimistic, or risk-tolerant, investors buy shares of stock in GM. The more conservative individuals can buy GM bonds, which promise to provide a fixed payment. The stockholders bear most of the business risk along with potentially higher rewards. Thus capital markets allow the risk that is inherent to all investments to be borne by the investors most willing to bear that risk.
This allocation of risk also benefits the firms that need to raise capital to finance their investments. When investors can self-select into security types with risk–return characteristics that best suit their preferences, each

security can be sold for the best possible price. This facilitates the process of building the economy’s stock of real assets.
Separation of Ownership and Management
Many businesses are owned and managed by the same individual. This simple organization, well-suited to small businesses, in fact was the most common form of business organization before the Industrial Revolution. Today, however, with global markets and large-scale production, the size and capital requirements of firms have skyrocketed. For example, General Electric has property, plant, and equipment worth about $35 billion. Corporations of such size simply could not exist as owner-operated firms. General Electric actually has about one-half million stockholders, whose ownership stake in the firm is proportional to their holdings of shares.
Such a large group of individuals obviously cannot actively participate in the day-to-day management of the firm. Instead, they elect a board of directors, which in turn hires and supervises the management of the firm. This structure means that the owners and managers of the firm are different. This gives the firm a stability that the owner-managed firm cannot achieve. For example, if some stockholders decide they no longer wish to hold shares in the firm, they can sell their shares to other investors, with no impact on the management of the firm. Thus financial assets and the ability to buy and sell those assets in financial markets allow for easy separation of ownership and management.
How can all of the disparate owners of the firm, ranging from large pension funds holding thousands of shares to small investors who may hold only a single share, agree on the objectives of the firm? Again, the financial markets provide some guidance. All may agree that the firm’s management should pursue strategies that enhance the value of their shares. Such policies will make all shareholders wealthier and allow them all to better pursue their personal goals, whatever those goals might be.
Do managers really attempt to maximize firm value? It is easy to see how they might be tempted to engage in activities not in the best interest of the shareholders. For example, they might engage in empire building, or avoid risky projects to protect their own jobs, or over consume luxuries such as corporate jets, reasoning that the cost of such perquisites is largely borne by the shareholders. These potential conflicts of interest are called agency problems because managers, who are hired as agents of the shareholders, may pursue their own interests instead.
Several mechanisms have evolved to mitigate potential agency problems. First, compensation plans tie the income of managers to the success of the firm. A major part of the total compensation of top executives is typically in the form of stock options, which means that the managers will not do well unless the shareholders also do well. Second, while boards of directors are sometimes portrayed as defenders of top management, they can, and in recent years increasingly do, force out management teams that are underperforming. Third, outsiders such as security analysts and large institutional investors such as pension funds monitor firms closely and make the life of poor performers at the least uncomfortable.
Finally, bad performers are subject to the threat of takeover. If the board of directors is lax in monitoring management, unhappy shareholders in principle can elect a different board. They do this by launching a proxy

contest in which they seek to obtain enough proxies (i.e., rights to vote the shares of other shareholders) to take control of the firm and vote in another board. However, this threat is usually minimal. Shareholders who attempt such a fight have to use their own funds, while management can defend itself using corporate coffers. Most proxy fights fail. The real takeover threat is from other firms. If one firm observes another underperforming, it can acquire the underperforming business and replace management with its own team. The stock price should rise to reflect the prospects of improved performance, which provides incentive for firms to engage in such takeover activity.
Clients of the financial system
The Household Sector
Households constantly make economic decisions concerning such activities as work, job training, retirement planning, and savings versus consumption. We will take most of these decisions as being already made and focus on financial decisions specifically. Essentially, we concern ourselves only with what financial assets households desire to hold. Even this limited focus, however, leaves a broad range of issues to consider. Most households are potentially interested in a wide array of assets, and the assets that are attractive can vary considerably depending on the household’s economic situation. Even a limited consideration of taxes and risk preferences can lead to widely varying asset demands, and this demand for variety is, as we shall see, a driving force behind financial innovation.
Taxes lead to varying asset demands because people in different tax brackets “transform” before-tax income to after-tax income at different rates. For example, high-tax bracket investors naturally will seek tax-free securities, compared with low-tax-bracket investors who want primarily higher-yielding taxable securities. A desire to minimize taxes also leads to demand for securities that are exempt from state and local taxes. This, in turn, causes demand for portfolios that specialize in tax-exempt bonds of one particular state. In other words, differential tax status creates “tax clienteles” that in turn give rise to demand for a range of assets with a variety of tax implications. The demand of investors encourages entrepreneurs to offer such portfolios (for a fee, of course!).
Risk considerations also create demand for a diverse set of investment alternatives. At an obvious level, differences in risk tolerance create demand for assets with a variety of risk–return combinations. Individuals also have particular hedging requirements that contribute to diverse investment demands.
Consider, for example, a resident of New York City who plans to sell her house and retire to Miami, Florida, in 15 years. Such a plan seems feasible if real estate prices in the two cities do not diverge before her retirement. How can one hedge Miami real estate prices now, short of purchasing a home there immediately rather than at retirement? One way to hedge the risk is to purchase securities that will increase in value if Florida real estate becomes more expensive. This creates a hedging demand for an asset with a particular risk characteristic. Such demands lead profit-seeking financial corporations to supply the desired goods: observe Florida real estate investment trusts (REITs) that allow individuals to invest in securities whose performance is tied to Florida real

estate prices. If Florida real estate becomes more expensive, the REIT will increase in value. The individual’s loss as a potential purchaser of Florida real estate is offset by her gain as an investor in that real estate.
This is only one example of how a myriad of risk-specific assets are demanded and created by agents in the financial environment. Risk motives also lead to demand for ways that investors can easily diversify their portfolios and even out their risk exposure. We will see that these diversification motives inevitably give rise to mutual funds that offer small individual investors the ability to invest in a wide range of stocks, bonds, precious metals, and virtually all other financial instruments.
The Business Sector
Whereas household financial decisions are concerned with how to invest money, businesses typically need to raise money to finance their investments in real assets: plant, equipment, technological know-how, and so forth. Table 1.5 presents balance sheets of U.S. corporations as a whole. The heavy concentration on tangible assets is obvious. Broadly speaking, there are two ways for businesses to raise money—they can borrow it, either from banks or directly from households by issuing bonds, or they can “take in new partners” by issuing stocks, which are ownership shares in the firm.
Businesses issuing securities to the public have several objectives. First, they want to get the best price possible for their securities. Second, they want to market the issues to the public at the lowest possible cost. This has two implications. First, businesses might want to farm out the marketing of their securities to firms that specialize in such security issuance, because it is unlikely that any single firm is in the market often enough to justify a full-time security issuance division. Issue of securities requires immense effort.
The security issue must be brought to the attention of the public. Buyers then must subscribe to the issue, and records of subscriptions and deposits must be kept. The allocation of the security to each buyer must be determined, and subscribers finally must exchange money for securities. These activities clearly call for specialists. The complexities of security issuance have been the catalyst for creation of an investment banking industry to cater to business demands.
The second implication of the desire for low-cost security issuance is that most businesses will prefer to issue fairly simple securities that require the least extensive incremental analysis and, correspondingly, are the least expensive to arrange. Such a demand for simplicity or uniformity by business-sector security issuers is likely to be at odds with the household sector’s demand for a wide variety of risk-specific securities. This mismatch of objectives gives rise to an industry of middlemen who act as intermediaries between the two sectors, specializing in transforming simple securities into complex issues that suit particular market niches.
The Government Sector
Like businesses, governments often need to finance their expenditures by borrowing. Unlike businesses, governments cannot sell equity shares; they are restricted to borrowing to raise funds when tax revenues are not sufficient to cover expenditures. They also can print money, of course, but this source of funds is limited by its inflationary implications, and so most governments usually try to avoid excessive use of the printing press.

Governments have a special advantage in borrowing money because their taxing power makes them very creditworthy and, therefore, able to borrow at the lowest rates.
A second, special role of the government is in regulating the financial environment. Some government regulations are relatively innocuous. For example, the Securities and Exchange Commission is responsible for disclosure laws that are designed to enforce truthfulness in various financial transactions. Other regulations have been much more controversial.
One example is Regulation Q, which for decades put a ceiling on the interest rates that banks were allowed to pay to depositors, until it was repealed by the Depository Institutions Deregulation and Monetary Control Act of 1980. These ceilings were supposedly a response to widespread bank failures during the Great Depression. By curbing interest rates, the government hoped to limit further failures. The idea was that if banks could not pay high interest rates to compete for depositors, their profits and safety margins presumably would improve.
The result was predictable: Instead of competing through interest rates, banks competed by offering “free” gifts for initiating deposits and by opening more numerous and convenient branch locations. Another result also was predictable: Bank competitors stepped in to fill the void created by Regulation Q. The great success of money market funds in the 1970s came in large part from depositors leaving banks that were prohibited from paying competitive rates. Indeed, much financial innovation may be viewed as responses to government tax and regulatory rules.
The environment responds to clientele demands
When enough clients demand and are willing to pay for a service, it is likely in a capitalistic economy that a profit-seeking supplier will find a way to provide and charge for that service. This is the mechanism that leads to the diversity of financial markets. Let us consider the market responses to the disparate demands of the three sectors.
Financial Intermediation
Recall that the financial problem facing households is how best to invest their funds. The relative smallness of most households makes direct investment intrinsically difficult. A small investor obviously cannot advertise in the local newspaper his or her willingness to lend money to businesses that need to finance investments. Instead, financial intermediaries such as banks, investment companies, insurance companies, or credit unions naturally evolve to bring the two sectors together. Financial intermediaries sell their own liabilities to raise funds that are used to purchase liabilities of other corporations.
For example, a bank raises funds by borrowing (taking in deposits) and lending that money to (purchasing the loans of) other borrowers. The spread between the rates paid to depositors and the rates charged to borrowers is the source of the bank’s profit. In this way, lenders and borrowers do not need to contact each other directly. Instead, each goes to the bank, which acts as an intermediary between the two. The problem of matching lenders with borrowers is solved when each comes independently to the common intermediary. The convenience and cost savings the bank offers the borrowers and lenders allow it to profit from the spread between the rates on its loans and the rates on its deposits. In other words, the problem of coordination creates a

market niche for the bank as intermediary. Profit opportunities alone dictate that banks will emerge in a trading economy.
Financial intermediaries are distinguished from other businesses in that both their assets and their liabilities are overwhelmingly financial. The contrast arises precisely because intermediaries are middlemen, simply moving funds from one sector to another. In fact, from a bird’s-eye view, this is the primary social function of such intermediaries, to channel household savings to the business sector.
Other examples of financial intermediaries are investment companies, insurance companies, and credit unions. All these firms offer similar advantages, in addition to playing a middleman role. First, by pooling the resources of many small investors, they are able to lend considerable sums to large borrowers. Second, by lending to many borrowers, intermediaries achieve significant diversification, meaning they can accept loans that individually might be risky. Third, intermediaries build expertise through the volume of business they do. One individual trying to borrow or lend directly would have much less specialized knowledge of how to structure and execute the transaction with another party.
Investment companies, which pool together and manage the money of many investors, also arise out of the “smallness problem.” Here, the problem is that most household portfolios are not large enough to be spread across a wide variety of securities. It is very expensive in terms of brokerage and trading costs to purchase one or two shares of many different firms, and it clearly is more economical for stocks and bonds to be purchased and sold in large blocks. This observation reveals a profit opportunity that has been filled by mutual funds offered by many investment companies.
Mutual funds pool the limited funds of small investors into large amounts, thereby gaining the advantages of large-scale trading; investors are assigned a prorated share of the total funds according to the size of their investment. This system gives small investors advantages that they are willing to pay for in the form of a management fee to the mutual fund operator. Mutual funds are logical extensions of an investment club or cooperative, in which individuals themselves team up and pool funds. The fund sets up shop as a firm that accepts the assets of many investors, acting as an investment agent on their behalf. Again, the advantages of specialization are sufficiently large that the fund can provide a valuable service and still charge enough for it to clear a handsome profit.
Investment companies also can design portfolios specifically for large investors with particular goals. In contrast, mutual funds are sold in the retail market, and their investment philosophies are differentiated mainly by strategies that are likely to attract a large number of clients. Some investment companies manage “commingled funds,” in which the monies of different clients with similar goals are merged into a “mini–mutual fund,” which is run according to the common preferences of those clients.
Economies of scale also explain the proliferation of analytic services available to investors. Newsletters, databases, and brokerage house research services all exploit the fact that the expense of collecting information is best borne by having a few agents engage in research to be sold to a large client base. This setup arises naturally. Investors clearly want information, but, with only small portfolios to manage, they do not find it

economical to incur the expense of collecting it. Hence a profit opportunity emerges: A firm can perform this service for many clients and charge for it.
Investment Banking
Just as economies of scale and specialization create profit opportunities for financial intermediaries, so too do these economies create niches for firms that perform specialized services for businesses. We said before that firms raise much of their capital by selling securities such as stocks and bonds to the public. Because these firms do not do so frequently, however, investment banking firms that specialize in such activities are able to offer their services at a cost below that of running an in-house security issuance division.
Investment bankers such as Merrill Lynch, Salomon Smith Barney, or Goldman, Sachs advise the issuing firm on the prices it can charge for the securities issued, market conditions, appropriate interest rates, and so forth. Ultimately, the investment banking firm handles the marketing of the security issue to the public. Investment bankers can provide more than just expertise to security issuers. Because investment bankers are constantly in the market, assisting one firm or another to issue securities, the public knows that it is in the banker’s interest to protect and maintain its reputation for honesty.
The investment banker will suffer along with investors if it turns out that securities it has underwritten have been marketed to the public with overly optimistic or exaggerated claims, for the public will not be so trusting the next time that investment banker participates in a security sale. The investment banker’s effectiveness and ability to command future business thus depends on the reputation it has established over time. Obviously, the economic incentives to maintain a trustworthy reputation are not nearly as strong for firms that plan to go to the securities markets only once or very infrequently. Therefore, investment bankers can provide a certification role—a “seal of approval”—to security issuers. Their investment in reputation is another type of scale economy that arises from frequent participation in the capital markets.
Financial Innovation and Derivatives
The investment diversity desired by households is far greater than most businesses have a desire to satisfy. Most firms find it simpler to issue “plain vanilla” securities, leaving exotic variants to others who specialize in financial markets. This, of course, creates a profit opportunity for innovative security design and repackaging that investment bankers are only too happy to fill. Consider the astonishing changes in the mortgage markets since 1970, when mortgage pass-through securities were first introduced by the Government National Mortgage Association (GNMA, or Ginnie Mae). These pass-throughs aggregate individual home mortgages into relatively homogenous pools. Each pool acts as backing for a GNMA pass-through security. GNMA security holders receive the principal and interest payments made on the underlying mortgage pool.
Pass-through securities were a tremendous innovation in mortgage markets. The securitization of mortgages meant that mortgages could be traded just like other securities in national financial markets. Availability of funds no longer depended on local credit conditions; with mortgage pass-throughs trading in national markets, mortgage funds could flow from any region to wherever demand was greatest.

The next round of innovation came when it became apparent that investors might be interested in mortgage-backed securities with different effective times to maturity. Thus was born the collateralized mortgage obligation, or CMO. The CMO meets the demand for mortgage-backed securities with a range of maturities by dividing the overall pool into a series of classes called tranches. The so-called fast-pay tranche receives all the principal payments made on the entire mortgage pool until the total investment of the investors in the tranche is repaid. In the meantime, investors in the other tranches receive only interest on their investment. In this way, the fast-pay tranche is retired first and is the shortest-term mortgage-backed security. The next tranche then receives all of the principal payments until it is retired, and so on, until the slow-pay tranche, the longest-term class, finally receives payback of principal after all other tranches have been retired.
Although these securities are relatively complex, the message here is that security demand elicited a market response. The waves of product development in the last two decades are responses to perceived profit opportunities created by as-yet unsatisfied demands for securities with particular risk, return, tax, and timing attributes. As the investment banking industry becomes ever more sophisticated, security creation and customization become more routine. Most new securities are created by dismantling and rebundling more basic securities. For example, the CMO is a dismantling of a simpler mortgage-backed security into component tranches.
This discussion leads to the notion of primitive versus derivative securities. A primitive security offers returns based only on the status of the issuer. For example, bonds make stipulated interest payments depending only on the solvency of the issuing firm. Dividends paid to stockholders depend as well on the board of directors’ assessment of the firm’s financial position. In contrast, derivative securities yield returns that depend on additional factors pertaining to the prices of other assets. For example, the payoff to stock options depends on the price of the underlying stock. In our mortgage examples, the derivative mortgage-backed securities offer payouts that depend on the original mortgages, which are the primitive securities. Much of the innovation in security design may be viewed as the continual creation of new types of derivative securities from the available set of primitive securities.
Derivatives have become an integral part of the investment environment. One use of derivatives, perhaps the primary use, is to hedge risks. However, derivatives also can be used to take highly speculative positions. Moreover, when complex derivatives are misunderstood, firms that believe they are hedging might in fact be increasing their exposure to various sources of risk. While occasional large losses attract considerable attention, they are in fact the exception to the more common use of derivatives as risk-management tools. Derivatives will continue to play an important role in portfolio management and the financial system. We will return to this topic later in the text. For the time being, however, we direct you to the primer on derivatives in the nearby box.
Markets and market structure
Just as securities and financial institutions come into existence as natural responses to investor demands, so too do markets evolve to meet needs. Consider what would happen if organized markets did not exist. Households that wanted to borrow would need to find others that wanted to lend. Inevitably, a meeting place for borrowers and lenders would be settled on, and that meeting place would evolve into a financial market. In old London a

pub called Lloyd’s launched the maritime insurance industry. A Manhattan curb on Wall Street became synonymous with the financial world.
We can differentiate four types of markets: direct search markets, brokered markets, dealer markets, and auction markets.
A direct search market is the least organized market. Here, buyers and sellers must seek each other out directly. One example of a transaction taking place in such a market would be the sale of a used refrigerator in which the seller advertises for buyers in a local newspaper. Such markets are characterized by sporadic participation and low-priced and nonstandard goods. It does not pay most people or firms to seek profits by specializing in such an environment.
The next level of organization is a brokered market. In markets where trading in a good is sufficiently active, brokers can find it profitable to offer search services to buyers and sellers. A good example is the real estate market, where economies of scale in searches for available homes and for prospective buyers make it worthwhile for participants to pay brokers to conduct the searches for them. Brokers in given markets develop specialized knowledge on valuing assets traded in that given market.
An important brokered investment market is the so-called primary market, where new issues of securities are offered to the public. In the primary market investment bankers act as brokers; they seek out investors to purchase securities directly from the issuing corporation. Another brokered market is that for large block transactions, in which very large blocks of stock are bought or sold. These blocks are so large (technically more than 10,000 shares but usually much larger) that brokers or “block houses” often are engaged to search directly for other large traders, rather than bringing the trade directly to the stock exchange where relatively smaller investors trade.
When trading activity in a particular type of asset increases, dealer markets arise. Here, dealers specialize in various assets, purchasing them for their own inventory and selling them for a profit from their inventory. Dealers, unlike brokers, trade assets for their own accounts. The dealer’s profit margin is the “bid–asked” spread—the difference between the price at which the dealer buys for and sells from inventory. Dealer markets save traders on search costs because market participants can easily look up prices at which they can buy from or sell to dealers. Obviously, a fair amount of market activity is required before dealing in a market is an attractive source of income. The over-the-counter securities market is one example of a dealer market.
Trading among investors of already issued securities is said to take place in secondary markets. Therefore, the over-the-counter market is one example of a secondary market. Trading in secondary markets does not affect the outstanding amount of securities; ownership is simply transferred from one investor to another. The most integrated market is an auction market, in which all transactors in a good converge at one place to bid on or offer a good. The New York Stock Exchange (NYSE) is an example of an auction market. An advantage of auction markets over dealer markets is that one need not search to find the best price for a good. If all participants converge, they can arrive at mutually agreeable prices and thus save the bid–asked spread.
Continuous auction markets (as opposed to periodic auctions such as in the art world) require very heavy and frequent trading to cover the expense of maintaining the market. For this reason, the NYSE and other exchanges

set up listing requirements, which limit the shares traded on the exchange to those of firms in which sufficient trading interest is likely to exist. The organized stock exchanges are also secondary markets. They are organized for investors to trade existing securities among themselves.
II. MARKETS AND INSTRUMENTS3
THE MONEY MARKET
The money market is a subsector of the fixed-income market. It consists of very short-term debt securities that usually are highly marketable. Many of these securities trade in large denominations, and so are out of the reach of individual investors. Money market funds, however, are easily accessible to small investors. These mutual funds pool the resources of many investors and purchase a wide variety of money market securities on their behalf.
Treasury Bills
U.S. Treasury bills (T-bills, or just bills, for short) are the most marketable of all money market instruments. T-bills represent the simplest form of borrowing: The government raises money by selling bills to the public. Investors buy the bills at a discount from the stated maturity value. At the bill’s maturity, the holder receives from the government a payment equal to the face value of the bill. The difference between the purchase price and ultimate maturity value constitutes the investor’s earnings. T-bills with initial maturities of 91 days or 182 days are issued weekly. Offerings of 52-week bills are made monthly. Sales are conducted via auction, at which investors can submit competitive or noncompetitive bids.
A competitive bid is an order for a given quantity of bills at a specific offered price. The order is filled only if the bid is high enough relative to other bids to be accepted. If the bid is high enough to be accepted, the bidder gets the order at the bid price. Thus the bidder risks paying one of the highest prices for the same bill (bidding at the top) against the hope of bidding “at the tail,” that is, making the cutoff at the lowest price.
A noncompetitive bid is an unconditional offer to purchase bills at the average price of the successful competitive bids. The Treasury ranks bids by offering price and accepts bids in order of descending price until the entire issue is absorbed by the competitive plus noncompetitive bids. Competitive bidders face two dangers: They may bid too high and overpay for the bills or bid too low and be shut out of the auction. Noncompetitive bidders, by contrast, pay the average price for the issue, and all noncompetitive bids are accepted up to a maximum of $1 million per bid.
In recent years, noncompetitive bids have absorbed between 10% and 25% of the total auction. Individuals can purchase T-bills directly at auction or on the secondary market from a government securities dealer. T-bills are highly liquid; that is, they are easily converted to cash and sold at low transaction cost and with not much price risk. Unlike most other money market instruments, which sell in minimum denominations of $100,000, T-bills
3 Text adapted from Z. Bodie, A. Kane, A.J. Marcus, “Investments – volume I”, 5th edition, McGraw-Hill, 2003. Educational purpose only.

sell in minimum denominations of only $10,000. The income earned on T-bills is exempt from all state and local taxes, another characteristic distinguishing the bills from other money market instruments.
Certificates of Deposit
A certificate of deposit, or CD, is a time deposit with a bank. Time deposits may not be withdrawn on demand. The bank pays interest and principal to the depositor only at the end of the fixed term of the CD. CDs issued in denominations greater than $100,000 are usually negotiable, however; that is, they can be sold to another investor if the owner needs to cash in the certificate before its maturity date. Short-term CDs are highly marketable, although the market significantly thins out for maturities of three months or more. CDs are treated as bank deposits by the Federal Deposit Insurance Corporation, so they are insured for up to $100,000 in the event of bank insolvency.
Commercial Paper
Large, well-known companies often issue their own short-term unsecured debt notes rather than borrow directly from banks. These notes are called commercial paper. Very often, commercial paper is backed by a bank line of credit, which gives the borrower access to cash that can be used (if needed) to pay off the paper at maturity. Commercial paper maturities range up to 270 days; longer maturities would require registration with the Securities and Exchange Commission and so are almost never issued. Most often, commercial paper is issued with maturities of less than one or two months. Usually, it is issued in multiples of $100,000. Therefore, small investors can invest in commercial paper only indirectly, via money market mutual funds.
Commercial paper is considered to be a fairly safe asset, because a firm’s condition presumably can be monitored and predicted over a term as short as one month. Many firms issue commercial paper intending to roll it over at maturity, that is, issue new paper to obtain the funds necessary to retire the old paper. If lenders become complacent about a firm’s prospects and grant rollovers heedlessly, they can suffer big losses. When Penn Central defaulted in 1970, it had $82 million of commercial paper outstanding. However, the Penn Central episode was the only major default on commercial paper in the past 40 years. Largely because of the Penn Central default, almost all commercial paper today is rated for credit quality by one or more of the following rating agencies: Moody’s Investor Services, Standard & Poor’s Corporation, Fitch Investor Service, and/or Duff and Phelps.
Bankers’ Acceptances
A banker’s acceptance starts as an order to a bank by a bank’s customer to pay a sum of money at a future date, typically within six months. At this stage, it is similar to a postdated check. When the bank endorses the order for payment as “accepted,” it assumes responsibility for ultimate payment to the holder of the acceptance. At this point, the acceptance may be traded in secondary markets like any other claim on the bank. Bankers’ acceptances are considered very safe assets because traders can substitute the bank’s credit standing for their own. They are used widely in foreign trade where the creditworthiness of one trader is unknown to the trading partner. Acceptances sell at a discount from the face value of the payment order, just as T-bills sell at a discount from par value.

Eurodollars
Eurodollars are dollar-denominated deposits at foreign banks or foreign branches of American banks. By locating outside the United States, these banks escape regulation by the Federal Reserve Board. Despite the tag “Euro,” these accounts need not be in European banks, although that is where the practice of accepting dollar-denominated deposits outside the United States began. Most Eurodollar deposits are for large sums, and most are time deposits of less than six months’ maturity. A variation on the Eurodollar time deposit is the Eurodollar certificate of deposit. A Eurodollar CD resembles a domestic bank CD except that it is the liability of a non-U.S. branch of a bank, typically a London branch. The advantage of Eurodollar CDs over Eurodollar time deposits is that the holder can sell the asset to realize its cash value before maturity. Eurodollar CDs are considered less liquid and riskier than domestic CDs, however, and thus offer higher yields. Firms also issue Eurodollar bonds, which are dollar denominated bonds outside the U.S., although bonds are not a money market investment because of their long maturities.
Repos and Reverses
Dealers in government securities use repurchase agreements, also called “repos” or “RPs,” as a form of short-term, usually overnight, borrowing. The dealer sells government securities to an investor on an overnight basis, with an agreement to buy back those securities the next day at a slightly higher price. The increase in the price is the overnight interest. The dealer thus takes out a one-day loan from the investor, and the securities serve as collateral.
A term repo is essentially an identical transaction, except that the term of the implicit loan can be 30 days or more. Repos are considered very safe in terms of credit risk because the loans are backed by the government securities. A reverse repo is the mirror image of a repo. Here, the dealer finds an investor holding government securities and buys them, agreeing to sell them back at a specified higher price on a future date.
Federal Funds
Just as most of us maintain deposits at banks, banks maintain deposits of their own at a Federal Reserve bank. Each member bank of the Federal Reserve System, or “the Fed,” is required to maintain a minimum balance in a reserve account with the Fed. The required balance depends on the total deposits of the bank’s customers. Funds in the bank’s reserve account are called federal funds, or fed funds. At any time, some banks have more funds than required at the Fed. Other banks, primarily big banks in New York and other financial centers, tend to have a shortage of federal funds. In the federal funds market, banks with excess funds lend to those with a shortage. These loans, which are usually overnight transactions, are arranged at a rate of interest called the federal funds rate.
Although the fed funds market arose primarily as a way for banks to transfer balances to meet reserve requirements, today the market has evolved to the point that many large banks use federal funds in a straightforward way as one component of their total sources of funding. Therefore, the fed funds rate is simply the rate of interest on very short-term loans among financial institutions.
Brokers’ Calls

Individuals who buy stocks on margin borrow part of the funds to pay for the stocks from their broker. The broker in turn may borrow the funds from a bank, agreeing to repay the bank immediately (on call) if the bank requests it. The rate paid on such loans is usually about 1% higher than the rate on short-term T-bills.
The LIBOR Market
The London Interbank Offered Rate (LIBOR) is the rate at which large banks in London are willing to lend money among themselves. This rate, which is quoted on dollar-denominated loans, has become the premier short-term interest rate quoted in the European money market, and it serves as a reference rate for a wide range of transactions. For example, a corporation might borrow at a floating rate equal to LIBOR plus 2%.
Yields on Money Market Instruments
Although most money market securities are of low risk, they are not risk-free. For example, as we noted earlier, the commercial paper market was rocked by the Penn Central bankruptcy, which precipitated a default on $82 million of commercial paper. Money market investors became more sensitive to creditworthiness after this episode, and the yield spread between low- and high-quality paper widened. The securities of the money market do promise yields greater than those on default-free T-bills, at least in part because of greater relative riskiness. In addition, many investors require more liquidity; thus they will accept lower yields on securities such as T-bills that can be quickly and cheaply sold for cash.
III. OVERVIEW OF THE TYPES AND FEATURES OF FIXED INCOME SECURITIES4
I. BONDS
Type of Issuer
One important characteristic of a bond is the nature of its issuer. Although foreign governments and firms raise
capital in U.S. financial markets, the three largest issuers of debt are domestic corporations, municipal
governments, and the federal government and its agencies. Each class of issuer, however, features additional
and significant differences.
Domestic corporations, for example, include regulated utilities as well as unregulated manufacturers.
Furthermore, each firm may sell different kinds of bonds: Some debt may be publicly placed, whereas other
bonds may be sold directly to one or only a few buyers (referred to as a private placement); some debt is
collateralized by specific assets of the company, whereas other debt may be unsecured. Municipal debt is also
varied: “General obligation’’ bonds (GOs) are backed by the full faith, credit, and taxing power of the 4 Internet material (authors: Frank Fabozzi, Michael Ferri, and Steven Mann): http://books.google.ro/books?id=HCMimoiNO2sC&printsec=frontcover&hl=ro&source=gbs_ge_summary_r&cad=0#v=onepage&q&f=false, (educational purpose only);

governmental unit issuing them; “revenue bonds,’’ on the other hand, have a safety, or creditworthiness, that
depends on the vitality and success of the particular entity (such as toll roads, hospitals, or water systems)
within the municipal government issuing the bond.
The U.S. Treasury has the most voracious appetite for debt, but the bond market often receives calls from its
agencies. Federal government agencies include federally related institutions and government-sponsored
enterprises (GSEs). It is important for the investor to realize that, by law or practice or both, these different
borrowers have developed different ways of raising debt capital over the years. As a result, the distinctions
among the various types of issuers correspond closely to differences among bonds in yield, denomination,
safety of principal, maturity, tax status, and such important provisions as the call privilege, put features, and
sinking fund. As we discuss the key features of fixed income securities, we will point out how the
characteristics of the bonds vary with the obligor or issuing authority.
Maturity
A key feature of any bond is its term-to-maturity, the number of years during which the borrower has promised
to meet the conditions of the debt (which are contained in the bond’s indenture). A bond’s term-to-maturity is
the date on which the debt will cease and the borrower will redeem the issue by paying the face value, or
principal. One indication of the importance of the maturity is that the code word or name for every bond
contains its maturity (and coupon). Thus the title of the Anheuser Busch Company bond due, or maturing, in
2016 is given as “Anheuser Busch 85/8s of 2016.’’ In practice, the words maturity, term, and term-to-maturity
are used interchangeably to refer to the number of years remaining in the life of a bond. Technically, however,
maturity denotes the date the bond will be redeemed, and either term or term-to-maturity denotes the number of
years until that date.
A bond’s maturity is crucial for several reasons. First, maturity indicates the expected life of the instrument, or
the number of periods during which the holder of the bond can expect to receive the coupon interest and the
number of years before the principal will be paid. Second, the yield on a bond depends substantially on its
maturity. More specifically, at any given point in time, the yield offered on a long-term bond may be greater
than, less than, or equal to the yield offered on a short-term bond. Third, the volatility of a bond’s price is
closely associated with maturity: Changes in the market level of rates will wrest much larger changes in price
from bonds of long maturity than from otherwise similar debt of shorter life.
When considering a bond’s maturity, the investor should be aware of any provisions that modify, or permit the
issuer to modify, the maturity of a bond. Although corporate bonds (referred to as “corporates’’) are typically
term bonds (issues that have a single maturity), they often contain arrangements by which the issuing firm either
can or must retire the debt early, in full or in part. Some corporates, for example, give the issuer a call privilege,

which permits the issuing firm to redeem the bond before the scheduled maturity under certain conditions (these
conditions are discussed below). Municipal bonds may have the same provision. Although the U.S. government
no longer issues bonds that have a call privilege, there are a few outstanding issues with this provision. Many
industrials and some utilities have sinking-fund provisions, which mandate that the firm retire a substantial
portion of the debt, according to a prearranged schedule, during its life and before the stated maturity.
Municipal bonds may be serial bonds or, in essence, bundles of bonds with differing maturities. (Some
corporates are of this type, too.) Usually, the maturity of a corporate bond is between 1 and 30 years. This is not
to say that there are not outliers. In fact, financially sound firms have begun to issue longer-term debt in order to
lock in long-term attractive financing. For example, in the late 1990s, there were approximately 90 corporate
bonds issued with maturities of 100 years. Although classifying bonds as “short term,’’ “intermediate term,’’
and “long term’’ is not universally accepted, the following classification is typically used. Bonds with a
maturity of 1 to 5 years are generally considered short term; bonds with a maturity between 5 and 12 years are
viewed as intermediate term (and are often called notes). Long-term bonds are those with a maturity greater
than 12 years.
Coupon and Principal
A bond’s coupon is the periodic interest payment made to owners during the life of the bond. The coupon is
always cited, along with maturity, in any quotation of a bond’s price. Thus one might hear about the “IBM 6.5
due in 2028’’ or the “Campell Soup 8.875 due in 2021” in discussions of current bond trading. In these
examples, the coupon cited is in fact the coupon rate, that is, the rate of interest that, when multiplied by the
principal, par value, or face value of the bond, provides the dollar value of the coupon payment. Typically, but
not universally, for bonds issued in the United States, the coupon payment is made in semiannual installments.
An important exception is mortgage-backed and asset-backed securities that usually deliver monthly cash flows.
In contrast, for bonds issued in some European bond markets and all bonds issued in the Eurobond market, the
coupon payment is made annually. Bonds may be bearer bonds or registered bonds. With bearer bonds,
investors clip coupons and send them to the obligor for payment. In the case of registered issues, bond owners
receive the payment automatically at the appropriate time. All new bond issues must be registered.
There are a few corporate bonds (mostly railroad issues), called income bonds, that contain a provision
permitting the firm to omit or delay the payment of interest if the firm’s earnings are too low. They have been
issued as part of bankruptcy reorganizations or to replace a preferred-stock offering of the issuer. A variant of
this bond type, deferrable bonds (also called trust preferred and debt/equity hybrids), witnessed explosive
growth in the 1990s. Deferrable bonds are deeply subordinated debt instruments that give the issuer the option
to defer coupon payment up to five years in the event of financial distress.

Zero-coupon bonds have been issued by corporations and municipalities since the early 1980s. For example,
Coca-Cola Enterprises has a zero-coupon bond outstanding due June 20, 2020 that was issued on May 9, 1995.
Although the U.S. Treasury does not issue zero-coupon debt with a maturity greater than one year, such
securities are created by government securities dealers. Merrill Lynch was the first to do this with its creation of
Treasury Investment Growth Receipts (TIGRs) in August 1982. The most popular zero-coupon Treasury
securities today are those created by government dealer firms under the Treasury’s Separate Trading of
Registered Interest and Principal Securities (STRIPS) Program. The investor in a zero-coupon security typically
receives interest by buying the security at a price below its principal, or maturity value, and holding it to the
maturity date. However, some zeros are issued at par and accrue interest during the bond’s life, with the accrued
interest and principal payable at maturity.
Governments and corporations also issue inflation-indexed bonds whose coupon payments are tied to an
inflation index. These securities are designed to protect bondholders from the erosion of purchasing power of
fixed nominal coupon payments due to inflation. For example, in January 1997, the U.S. Treasury auctioned a
10-year Treasury note whose semiannual coupon interest depends on the rate of inflation as measured by the
Consumer Price Index for All Urban Consumers (i.e., CPI-U). The coupon payments are adjusted annually.
These issues are referred to as “Treasury Inflation-Protection Securities” (TIPS). As of this writing, the
Treasury issues TIPS with 5-year, 10-year, and 20-year maturities. Some corporations followed the Treasury
and issued inflation-indexed bonds of their own.
There are securities that have a coupon rate that increases over time. These securities are called step-up notes
because the coupon rate “steps up’’ over time. For example, a six-year step-up note might have a coupon rate
that is 5% for the first two years, 5.8% for the next two years, and 6% for the last two years. Alternatively, there
are securities that have a coupon rate that can decrease over time but never increase. For example, in June 1998,
the Tennessee Valley Authority issued 30-year 6.75% putable automatic rate reset securities (PARRS), also
known as ratchet bonds. Beginning five years after issuance and annually thereafter, the bond’s coupon rate is
automatically reset to either the current 30-year constant maturity Treasury yield plus 94 basis points or to
6.75%, whichever is lower. The coupon rate may decline if Treasury yields decline, but it will never increase.
This bond also contains a contingent put option such that if the coupon rate is lowered, the bond is putable at
par. Ratchet bonds were designed as substitutes for callable bonds.
In contrast to a coupon rate that is fixed for the bond’s entire life, the term floating-rate security or floater
encompasses several different types of securities with one common feature: The coupon rate will vary over the
instrument’s life. The coupon rate is reset at designated dates based on the value of some reference rate adjusted
for a spread. For example, consider a floating-rate note issued in September 2003 by Columbus Bank & Trust

that matured on March 15, 2005. The floater delivers cash flows quarterly and has a coupon formula equal to
the three month LIBOR plus 12 points.
Typically, floaters have coupon rates that reset more than once a year (e.g., semiannually, quarterly, or
monthly). Conversely, the term adjustable-rate or variable-rate security refers to those issues whose coupon
rates reset not more frequently than annually.
There are several features about floaters that deserve mention. First, a floater may have a restriction on the
maximum (minimum) coupon rate that will be paid at any reset date called a cap (floor). Second, while the
reference rate for most floaters is a benchmark interest rate or an interest rate index, a wide variety of reference
rates appear in the coupon formulas. A floater’s coupon could be indexed to movements in foreign exchange
rates, the price of a commodity (e.g., crude oil), movements in an equity index (e.g., the S&P 500), or
movements in a bond index (e.g., the Merrill Lynch Corporate Bond Index). Third, while a floater’s coupon rate
normally moves in the same direction as the reference rate moves, there are floaters whose coupon rate moves
in the opposite direction from the reference rate. These securities are called inverse floaters or reverse floaters.
As an example, consider an inverse floater issued by the Federal Home Loan Bank in April 1999. This issue
matured in April 2002 and delivered quarterly coupon payments according to the following formula:
18% - 2.5 x (three-month LIBOR)
This inverse floater had a floor of 3% and a cap of 15.5%. Finally, range notes are floaters whose coupon rate is
equal to the reference rate (adjusted for a spread) as long as the reference rate is within a certain range on the
reset date. If the reference rate is outside the range, the coupon rate is zero for that period. Consider a range note
issued by Sallie Mae in August 1996 that matured in August 2003. This issue made coupon payments quarterly.
The investor earned three-month LIBOR 155 basis points for every day during this quarter that the three-month
LIBOR was between 3% and 9%. Interest accrued at 0% for each day that the three-month LIBOR was outside
this range. As a result, this range note had a floor of 0%.
Structures in the high-yield (junk bond sector of the corporate bond market have introduced variations in the
way coupon payments are made. For example, in a leveraged buyout or recapitalization financed with high-
yield bonds, the heavy interest payment burden the corporation must bear places severe cash-flow constraints on
the firm. To reduce this burden, firms involved in leveraged buyouts (LBOs) and recapitalizations have issued
deferred-coupon structures that permit the issuer to defer making cash interest payments for a period of three to
seven years. There are three types of deferred-coupon structures: (1) deferred interest bonds, (2) step-up bonds,
and (3) payment-in-kind bonds.
Another high-yield bond structure allows the issuer to reset the coupon rate so that the bond will trade at a
predetermined price. The coupon rate may reset annually or reset only once over the life of the bond. Generally,

the coupon rate will be the average of rates suggested by two investment banking firms. The new rate will then
reflect the level of interest rates at the reset date and the credit spread the market wants on the issue at the reset
date. This structure is called an extendible reset bond. Notice the difference between this bond structure and the
floating-rate issue described earlier. With a floating-rate issue, the coupon rate resets based on a fixed spread to
some benchmark, where the spread is specified in the indenture and the amount of the spread reflects market
conditions at the time the issue is first offered. In contrast, the coupon rate on an extendible reset bond is reset
based on market conditions suggested by several investment banking firms at the time of the reset date.
Moreover, the new coupon rate reflects the new level of interest rates and the new spread that investors seek.
One reason that debt financing is popular with corporations is that the interest payments are tax-deductible
expenses. As a result, the true after-tax cost of debt to a profitable firm is usually much less than the stated
coupon interest rate. The level of the coupon on any bond is typically close to the level of yields for issues of its
class at the time the bond is first sold to the public. Some bonds are issued initially at a price substantially below
par value (called original-issue discount bonds, or OIDs), and their coupon rate is deliberately set below the
current market rate. However, firms usually try to set the coupon at a level that will make the market price close
to par value. This goal can be accomplished by placing the coupon rate near the prevailing market rate.
To many investors, the coupon is simply the amount of interest they will receive each year. However, the
coupon has another major impact on an investor’s experience with a bond. The coupon’s size influences the
volatility of the bond’s price: The larger the coupon, the less the price will change in response to a change in
market interest rates. Thus the coupon and the maturity have opposite effects on the price volatility of a bond.
The principal, par value, or face value of a bond is the amount to be repaid to the investor either at maturity or
at those times when the bond is called or retired according to a repayment schedule or sinking-fund provisions.
But the principal plays another role, too: It is the basis on which the coupon or periodic interest rests. The
coupon is the product of the principal and the coupon rate. For most corporate issues, the face value is $1,000;
many government bonds have larger principals starting with $10,000; and most municipal bonds come in
denominations of $5,000.
Participants in the bond market use several measures to describe the potential return from investing in a bond:
current yield, yield-to-maturity, yield-to-call for a callable bond, and yield-to-put for a putable bond. A yield-to-
worst is often quoted for bonds. This is the lowest yield of the following: yield-to-maturity, yields to all possible
call dates, and yields to all put dates.
The prices of most bonds are quoted as percentages of par or face value. To convert the price quote into a dollar
figure, one simply divides the price by 100 (converting it to decimal) and then multiplies by the par value.

Call and Refunding Provisions
If a bond’s indenture contains a call feature or call provision, the issuer retains the right to retire the debt, fully
or partially, before the scheduled maturity date. The chief benefit of such a feature is that it permits the
borrower, should market rates fall, to replace the bond issue with a lower-interest-cost issue. The call feature
has added value for corporations and municipalities. It may in the future help them to escape the restrictions that
frequently characterize their bonds (about the disposition of assets or collateral). The call feature provides an
additional benefit to corporations, which might want to use unexpectedly high levels of cash to retire
outstanding bonds or might wish to restructure their balance sheets.
The call provision is detrimental to investors, who run the risk of losing a high-coupon bond when rates begin to
decline. When the borrower calls the issue, the investor must find other outlets, which presumably would have
lower yields than the bond just withdrawn through the call privilege. Another problem for the investor is that
the prospect of a call limits the appreciation in a bond’s price that could be expected when interest rates decline.
Because the call feature benefits the issuer and places the investor at a disadvantage, callable bonds carry higher
yields than bonds that cannot be retired before maturity. This difference in yields is likely to grow when
investors believe that market rates are about to fall and that the borrower may be tempted to replace a high-
coupon debt with a new low-coupon bond. (Such a transaction is called refunding.) However, the higher yield
alone is often not sufficient compensation to the investor for granting the call privilege to the issuer. Thus the
price at which the bond may be called, termed the call price, is normally higher than the principal or face value
of the issue. The difference between call price and principal is the call premium, whose value may be as much
as one year’s interest in the first few years of a bond’s life and may decline systematically thereafter.
An important limitation on the borrower’s right to call is the period of call protection, or deferment period,
which is a specified number of years in the early life of the bond during which the issuer may not call the debt.
Such protection is another concession to the investor, and it comes in two forms. Some bonds are noncallable
(often abbreviated NC) for any reason during the deferment period; other bonds are nonrefundable (NF) for that
time. The distinction lies in the fact that nonrefundable debt may be called if the funds used to retire the bond
issue are obtained from internally generated funds, such as the cash flow from operations or the sale of property
or equipment, or from nondebt funding such as the sale of common stock. Thus, although the terminology is
unfortunately confusing, a nonrefundable issue may be refunded under the circumstances just described and, as
a result, offers less call protection than a noncallable bond, which cannot be called for any reason except to
satisfy sinking-fund requirements, explained later. Beginning in early 1986, a number of corporations issued
long-term debt with extended call protection, not refunding protection. A number are noncallable for the issue’s
life, such as Dow Chemical Company’s 85/8s due in 2006. The issuer is expressly prohibited from redeeming
the issue prior to maturity. These noncallable-for-life issues are referred to as bullet bonds. If a bond does not
have any protection against an early call, then it is said to be currently callable.
Since the mid-1990s, an increasing number of public debt issues include a so-called make-whole call provision.
Make-whole call provisions have appeared routinely in privately placed issues since the late 1980s. In contrast
to the standard call feature that contains a call price fixed by a schedule, a make-whole call price varies
inversely with the level of interest rates. A make-whole call price (i.e., redemption amount) is typically the sum
of the present values of the remaining coupon payments and principal discounted at a yield on a Treasury
security that matches the bond’s remaining maturity plus a spread. For example, on January 22, 1998,
Aluminum Company of America (Alcoa) issued $300 million in bonds with a make-whole call provision that
mature on January 15, 2028. These bonds are redeemable at any time in whole or in part at the issuer’s option.
The redemption price is the greater of (1) 100% of the principal amount plus accrued interest or (2) the make-
whole redemption amount plus accrued interest. In this case, the make-whole redemption amount is equal to the
sum of the present values of the remaining coupon and principal payments discounted at the Adjusted Treasury
Rate plus 15 basis points.3 The Adjusted Treasury Rate is the bond-equivalent yield on a U.S. Treasury security
having a maturity comparable to the remaining maturity of the bonds to be redeemed. Each holder of the bonds
will be notified at least 30 days but not more than 60 days prior to the redemption date. This issue is callable at
any time, as are most issues with make-whole call provisions. Note that the make-whole call price increases as
interest rates decrease, so if the issuer exercises the make-whole call provision when interest rates have
decreased, the bondholder receives a higher call price. Make-whole call provisions thus provide investors with
some protection against reinvestment rate risk.
A key question is, When will the firm find it profitable to refund an issue? It is important for investors to
understand the process by which a firm decides whether to retire an old bond and issue a new one. A simple and
brief example will illustrate that process and introduce the reader to the kinds of calculations a bondholder will
make when trying to predict whether a bond will be refunded.
Suppose that a firm’s outstanding debt consists of $300 million par value of a bond with a coupon of 10%, a
maturity of 15 years, and a lapsed deferment period. The firm can now issue a bond with a similar maturity for
an interest rate of 7.8%. Assume that the issuing expenses and legal fees amount to $2 million. The call price on
the existing bond issue is $105 per $100 par value. The firm must pay, adjusted for taxes, the sum of call
premium and expenses. To simplify the calculations, assume a 30% tax rate. This sum is then $11,190,000.4
Such a transaction would save the firm a yearly sum of $4,620,000 in interest (which equals the interest of $30
million on the existing bond less the $23.4 million on the new, adjusted for taxes) for the next 15 years.5 The
rate of return on a payment of $11,900,000 now in exchange for a savings of $4,620,000 per year for 15 years is

about 38%. This rate far exceeds the firm’s after-tax cost of debt (now at 7.8% times 0.7, or 5.46%) and makes
the refunding a profitable economic transaction.
In municipal securities, refunding often refers to something different, although the concept is the same.
Municipal bonds can be prerefunded prior to maturity (usually on a call date). Here, instead of issuing new
bonds to retire the debt, the municipality will issue bonds and use the proceeds to purchase enough risk-free
securities to fund all the cash flows on the existing bond issue. It places these in an irrevocable trust. Thus the
municipality still has two issues outstanding, but the old bonds receive a new label—they are “prerefunded.” If
Treasury securities are used to prerefund the debt, the cash flows on the bond are guaranteed by Treasury
obligations in the trust. Thus they become AAA rated and trade at higher prices than previously. Municipalities
often find this an effective means of lowering their cost of debt.
Sinking-Fund Provision
The sinking-fund provision, which is typical for publicly and privately issued industrial bonds and not
uncommon among certain classes of utility debt, requires the obligor to retire a certain amount of the
outstanding debt each year. Generally, the retirement occurs in one of two ways. The firm may purchase the
amount of bonds to be retired in the open market if their price is below par, or the company may make
payments to the trustee who is empowered to monitor the indenture and who will call a certain number of bonds
chosen by lottery. In the latter case, the investor would receive the prearranged call price, which is usually par
value. The schedule of retirements varies considerably from issue to issue. Some issuers, particularly in the
private-placement market, retire most, if not all, of their debt before maturity. In the public market, some
companies may retire as little as 20 to 30% of the outstanding par value before maturity. Further, the indenture
of many issues includes a deferment period that permits the issuer to wait five years or more before beginning
the process of sinking-fund retirements.
There are three advantages of a sinking-fund provision from the investor’s perspective. The sinking-fund
requirement ensures an orderly retirement of the debt so that the final payment, at maturity, will not be too
large. Second, the provision enhances the liquidity of some debt, especially for smaller issues with thin
secondary markets. Third, the prices of bonds with this requirement are presumably more stable because the
issuer may become an active participant on the buy side when prices fall. For these reasons, the yields on bonds
with sinking-fund provisions tend to be less than those on bonds without them.
The sinking fund, however, can work to the disadvantage of an investor. Suppose that an investor is holding one
of the early bonds to be called for a sinking fund. All the time and effort put into analyzing the bond has now
been wasted, and the investor will have to choose new instruments for purchase. Also, an investor holding a
bond with a high coupon at the time rates begin to fall is still forced to relinquish the issue. For this reason, in

times of high interest rates, one might find investors demanding higher yields from bonds with sinking funds
than from other debt.
The sinking-fund provision also may harm the investor’s position through the optional acceleration feature, a
part of many corporate bond indentures. With this option, the corporation is free to retire more than the amount
of debt the sinking fund requires (and often a multiple thereof) and to do it at the call price set for sinking-fund
payments. Of course, the firm will exercise this option only if the price of the bond exceeds the sinking-fund
price (usually near par), and this happens when rates are relatively low. If, as is typically the case, the sinking-
fund provision becomes operative before the lapse of the call-deferment period, the firm can retire much of its
debt with the optional acceleration feature and can do so at a price far below that of the call price it would have
to pay in the event of refunding. The impact of such activity on the investor’s position is obvious: The firm can
redeem at or near par many of the bonds that appear to be protected from call and that have a market value
above the face value of the debt.
Put Provisions
A putable bond grants the investor the right to sell the issue back to the issuer at par value on designated dates.
The advantage to the investor is that if interest rates rise after the issue date, thereby reducing the value of the
bond, the investor can force the issuer to redeem the bond at par. Some issues with put provisions may restrict
the amount that the bondholder may put back to the issuer on any one put date. Put options have been included
in corporate bonds to deter unfriendly takeovers. Such put provisions are referred to as “poison puts.” Put
options can be classified as hard puts and soft puts. A hard put is one in which the security must be redeemed
by the issuer only for cash. In the case of a soft put, the issuer has the option to redeem the security for cash,
common stock, another debt instrument, or a combination of the three. Soft puts are found in convertible debt,
which we describe next.
Convertible or Exchangeable Debt
A convertible bond is one that can be exchanged for specified amounts of common stock in the issuing firm:
The conversion cannot be reversed, and the terms of the conversion are set by the company in the bond’s
indenture. The most important terms are conversion ratio and conversion price. The conversion ratio indicates
the number of shares of common stock to which the holder of the convertible has a claim. For example,
Amazon.com issued $1.25 billion in convertibles in January 1999 that mature in 2009. These convertibles carry
a 4.75% coupon with a conversion ratio of 6.408 shares for each bond. This translates to a conversion price of
$156.055 per share ($1,000 par value divided by the conversion ratio 6.408) at the time of issuance. The
conversion price at issuance is also referred to as the stated conversion price.

The conversion privilege may be permitted for all or only some portion of the bond’s life. The conversion ratio
may decline over time. It is always adjusted proportionately for stock splits and stock dividends. Convertible
bonds are typically callable by the issuer. This permits the issuer to force conversion of the issue. (Effectively,
the issuer calls the bond, and the investor is forced to convert the bond or allow it to be called.) There are some
convertible issues that have call protection. This protection can be in one of two forms: Either the issuer is not
allowed to redeem the issue before a specified date, or the issuer is not permitted to call the issue until the stock
price has increased by a predetermined percentage price above the conversion price at issuance.
An exchangeable bond is an issue that can be exchanged for the common stock of a corporation other than the
issuer of the bond. For example, Bell Atlantic Corp. issued 5.75% coupon exchangeable bonds in February
1998 that can be exchanged for shares in Telecom Corp. of New Zealand. There are a handful of issues that are
exchangeable into more than one security. One significant innovation in the convertible bond market was the
“Liquid Yield Option Note’’ (LYON) developed by Merrill Lynch Capital Markets in 1985. A LYON is a zero-
coupon, convertible, callable, and putable bond.
II. WARRANTS
A warrant is an option a firm issues that permits the owner to buy from the firm a certain number of shares of
common stock at a specified price. It is not uncommon for publicly held corporations to issue warrants with
new bonds. A valuable aspect of a warrant is its rather long life: Most warrants are in effect for at least two
years from issuance, and some are perpetual. Another key feature of the warrant is the exercise price, the price
at which the warrant holder can buy stock from the corporation. This price is normally set at about 15% above
the market price of common stock at the time the bond, and thus the warrant, is issued. Frequently, the exercise
price will rise through time, according to the schedule in the bond’s indenture. Another important characteristic
of the warrant is its detachability. Detachable warrants are often actively traded on the American Stock
Exchange. Other warrants can be exercised only by the bondholder, and these are called nondetachable
warrants. The chief benefit to the investor is the financial leverage the warrant provides.
III. PREFERRED STOCK
Preferred stock is a class of stock, not a debt instrument, but it shares characteristics of both common stock and
debt. Like the holder of common stock, the preferred stockholder is entitled to dividends. Unlike those on
common stock, however, preferred stock dividends are a specified percentage of par or face value. The
percentage is called the dividend rate; it need not be fixed but may float over the life of the issue.
Failure to make preferred stock dividend payments cannot force the issuer into bankruptcy. Should the issuer
not make the preferred stock dividend payment, usually paid quarterly, one of two things can happen,
depending on the terms of the issue. First, the dividend payment can accrue until it is fully paid. Preferred stock

with this feature is called cumulative preferred stock. Second, if a dividend payment is missed and the security
holder must forgo the payment, the preferred stock is said to be noncumulative preferred stock. Failure to make
dividend payments may result in imposition of certain restrictions on management. For example, if dividend
payments are in arrears, preferred stockholders might be granted voting rights.
Unlike debt, payments made to preferred stockholders are treated as a distribution of earnings. This means that
they are not tax deductible to the corporation under the current tax code. (Interest payments, on the other hand,
are tax deductible.) Although the after-tax cost of funds is higher if a corporation issues preferred stock rather
than borrowing, there is a factor that reduces the cost differential: A provision in the tax code exempts 70% of
qualified dividends from federal income taxation if the recipient is a qualified corporation. For example, if
Corporation A owns the preferred stock of Corporation B, for each $100 of dividends received by A, only $30
will be taxed at A’s marginal tax rate. The purpose of this provision is to mitigate the effect of double taxation
of corporate earnings. There are two implications of this tax treatment of preferred stock dividends. First, the
major buyers of preferred stock are corporations seeking tax-advantaged investments. Second, the cost of
preferred stock issuance is lower than it would be in the absence of the tax provision because the tax benefits
are passed through to the issuer by the willingness of buyers to accept a lower dividend rate.
Preferred stock has some important similarities with debt, particularly in the case of cumulative preferred stock:
(1) The payments to preferred stockholders promised by the issuer are fixed, and (2) preferred stockholders
have priority over common stockholders with respect to dividend payments and distribution of assets in the case
of bankruptcy. (The position of noncumulative preferred stock is considerably weaker than cumulative preferred
stock.) It is because of this second feature that preferred stock is called a senior security. It is senior to common
stock. On a balance sheet, preferred stock is classified as equity.
Preferred stock may be issued without a maturity date. This is called perpetual preferred stock. Almost all
preferred stock has a sinking-fund provision, and some preferred stock is convertible into common stock. A
trademark product of Morgan Stanley is the Preferred Equity Redemption Cumulative Stock (PERCS). This is a
preferred stock with a mandatory conversion at maturity. Historically, utilities have been the major issuers of
preferred stock, making up more than half of each year’s issuance. Since 1985, major issuers have been in the
financial industry—finance companies, banks, thrifts, and insurance companies.
There are three types of preferred stock: (1) fixed-rate preferred stock, (2) adjustable-rate preferred stock, and
(3) auction and remarketed preferred stock. The dividend rate on an adjustable-rate preferred stock (ARPS) is
reset quarterly and based on a predetermined spread from the highest of three points on the Treasury yield
curve. Most ARPS are perpetual, with a floor and ceiling imposed on the dividend rate of most issues. For
auction preferred stock (APS), the dividend rate is reset periodically, as with ARPS, but the dividend rate is
established through an auction process. In the case of remarketed preferred stock (RP), the dividend rate is

determined periodically by a remarketing agent who resets the dividend rate so that any preferred stock can be
tendered at par and be resold (remarketed) at the original offering price. An investor has the choice of dividend
resets every 7 days or every 49 days.
IV. RESIDENTIAL MORTGAGE-BACKED SECURITIES
A residential mortgage-backed security (MBS) is an instrument whose cash flow depends on the cash flows of
an underlying pool of mortgages. There are three types of mortgage-backed securities: (1) mortgage pass-
through securities, (2) collateralized mortgage obligations, and (3) stripped mortgage-backed securities.
Mortgage Cash Flows
Because the cash flow for these securities depends on the cash flow from the underlying pool of mortgages, the
first thing to define is a mortgage. A mortgage is a pledge of real estate to secure the loan originated for the
purchase of that real estate. The mortgage gives the lender (mortgagee) the right to foreclose on the loan and
seize the property in order to ensure that the loan is paid off if the borrower (mortgagor) fails to make the
contracted payments. The types of real estate properties that can be mortgaged are divided into two broad
categories: residential and nonresidential (i.e., commercial and farm properties). The mortgage loan specifies
the interest rate of the loan, the frequency of payment, and the number of years to maturity. Each monthly
mortgage payment consists of the monthly interest, a scheduled amount in excess of the monthly interest that is
applied to reduce the outstanding loan balance (this is called the scheduled repayment of principal), and any
payments in excess of the mortgage payment. The latter payments are called prepayments.
In effect, the lender has granted the homeowner the right to prepay (or “call’’) all or part of the mortgage
balance at any time. Homeowners prepay their mortgages for one of several reasons. First, they prepay the
entire mortgage when they sell their home. Homes are sold for many reasons, among them a change of
employment that requires moving or the purchase of a more expensive home. Second, if mortgage rates drop
substantially after the mortgage loan was obtained, it may be beneficial for the homeowner to refinance the loan
(even after paying all refinancing costs) at the lower interest rate. Third, if homeowners cannot meet their
mortgage obligations, their property is repossessed and sold. The proceeds from the sale are used to pay off the
mortgage loan. Finally, if the property is destroyed by fire or another insured catastrophe occurs, the insurance
proceeds are used to pay off the mortgage.
Mortgage Pass-Through Securities
A mortgage pass-through security (or simply pass-through) is created when one or more holders of mortgages
form a collection (pool) of mortgages and sell shares or participation certificates in the pool. A pool may consist
of several thousand mortgages or only a few mortgages. The cash flow of a pass-through depends on the cash
flow of the underlying mortgages, which, as just explained, consists of monthly mortgage payments

representing interest, the scheduled repayment of principal, and any prepayments. Payments are made to
security holders each month.
There are three major types of pass-through securities, guaranteed by the following organizations: Government
National Mortgage Association (“Ginnie Mae’’), Federal Home Loan Mortgage Corporation (“Freddie Mac’’),
and Federal National Mortgage Association (“Fannie Mae’’). The last two are government sponsored entities.
The Government National Mortgage Association is a federal government agency within the Department of
Housing and Urban Development. The securities associated with these three entities are known as agency pass-
through securities. There are also nonagency pass-through securities, issued by thrifts, commercial banks, and
private conduits that are not backed by any agency.
Collateralized Mortgage Obligations
The collateralized mortgage obligation (CMO) structure was developed to broaden the appeal of mortgage-
backed products to traditional fixed income investors. A CMO is a security backed by a pool of pass-throughs
or a pool of mortgage loans. CMOs are structured so that there are several classes of bondholders with varying
maturities. The different bond classes are called tranches. The rules for the distribution of the principal
payments and the interest from the underlying collateral among the tranches are specified in the prospectus. By
redirecting the cash flow (i.e., principal payments and interest) from the underlying collateral, issuers have
created classes of bonds that have different degrees of prepayment and interest rate risk and are thereby more
attractive to institutional investors to satisfy asset/liability objectives than a pass-through.
Numerous innovations in structuring CMOs have created classes of bonds with one or more of the following
characteristics: (1) greater stability of cash flow over a wide range of prepayment speeds, (2) better matching of
floating-rate liabilities, (3) substantial upside potential in a declining interest-rate environment but less
downside risk in a rising interest-rate environment, or (4) properties that allow them to be used for hedging
mortgage-related products. The various types of bonds include sequential-pay bonds, planned amortization class
(PAC) bonds, accrual (or Z) bonds, floating-rate bonds, inverse floating rate bonds, targeted amortization class
(TAC) bonds, support bonds, and very accurately determined maturity (VADM) bonds.
Stripped Mortgage-Backed Securities
A pass-through divides the cash flow from the underlying collateral on a pro rata basis to the security holders.
Stripped mortgage-backed securities, introduced by Fannie Mae in 1986, are created by altering the distribution
of principal and interest from a pro rata distribution to an unequal distribution.
Why are stripped mortgage-backed securities created? It is sufficient to say at this juncture that the risk/return
characteristics of these instruments make them attractive for the purpose of hedging a portfolio of pass-throughs
and mortgage loans.

There are two types of stripped MBSs: synthetic-coupon pass-throughs and interest-only/principal-only
securities. The first generation of stripped mortgage backed securities consisted of the synthetic-coupon pass-
throughs because the unequal distribution of coupon and principal resulted in a synthetic coupon rate that was
different from the underlying collateral. In early 1987, stripped MBSs began to be issued in which all the
interest is allocated to one class (the interest-only, or IO, class) and the entire principal to the other class (the
principal-only, or PO, class). The IO class receives no principal payments, and the PO class receives no interest.
V. COMMERCIAL MORTGAGE-BACKED SECURITIES
Commercial mortgage-backed securities (CMBSs) are backed by a pool of commercial mortgage loans on
income-producing property––multifamily properties (i.e., apartment buildings), office buildings, industrial
properties (including warehouses), shopping centers, hotels, and health care facilities (i.e., senior housing care
facilities). The basic building block of the CMBS transaction is a commercial loan that was originated either to
finance a commercial purchase or to refinance a prior mortgage obligation. There are two major types of CMBS
deal structures that have been of interest to bond investors, multi-property single borrowers and multi-property
conduits. The fastest-growing segment of the CMBS is conduit-originated transactions. Conduits are
commercial-lending entities that are established for the sole purpose of generating collateral to securitize.
Unlike residential mortgage loans, where the lender relies on the ability of the borrower to repay and has
recourse to the borrower if the payment terms are not satisfied, commercial mortgage loans are nonrecourse
loans. This means that the lender can only look to the income-producing property backing the loan for interest
and principal repayment. If there is a default, the lender looks to the proceeds from the sale of the property for
repayment and has no recourse to the borrower for any unpaid balance. Basically, this means that the lender
must view each property as a stand-alone business and evaluate each property using measures that have been
found useful in assessing credit risk.
VI. ASSET-BACKED SECURITIES
Asset-backed securities are securities collateralized by assets that are not mortgage loans. In structuring an
asset-backed security, issuers have drawn from the structures used in the mortgage-backed securities market.
Asset-backed securities have been structured as pass-throughs and as structures with multiple bond classes
called pay-throughs, which are similar to CMOs. Credit enhancement is provided by letters of credit,
overcollateralization, or senior/subordination.
Three common types of asset-backed securities are those backed by credit card receivables, home equity loans,
and automobile loans. There are also asset-backed securities supported by a pool of manufactured homes, Small
Business Administration (SBA) loans, student loans, boat loans, equipment leases, recreational vehicle loans,
senior bank loans, and possibly, the future royalties of your favorite entertainer.
A collateralized debt obligation (CDO) is an asset-backed security backed by a diversified pool of one or more
of the following types of debt obligations: U.S. domestic investment-grade and high-yield corporate bonds,
emerging market bonds, residential mortgage-backed securities, commercial mortgage-backed securities, asset-
backed securities, real estate investment trusts debt, U.S. domestic bank loans, special situation loans and
distressed debt, foreign bank loans, or other CDOs. CDOs are classified as either cash CDOs or synthetic
CDOs. A cash CDO is backed by a pool of cash market debt instruments. A synthetic CDO is a CDO where the
investor has economic exposure to a pool of debt instrument, but this exposure is realized via credit derivative
instruments rather than the purchase of the cash market instruments.
IV. EQUITY SECURITIES
1. Common Stocks, Preferred Stocks—Basic Concepts
Stocks, which represent ownership in a corporation are, and have been, one of the best investments one can
make. The potential for profit is much greater than with guaranteed investments or interest-paying
investments. The main benefits of corporations over sole proprietorships and partnerships are that:
its owners—stockholders—are liable only for the amount invested;
the corporation can raise large amounts of money through the sale of stocks and bonds;
complete control is vested in a board of directors, which the stockholders choose through voting.
The main disadvantage is that a corporation is carefully regulated by law, and must publish and distribute
numerous reports to stockholders and various government agencies.
Legal Rights Of Common Stockholders Common stockholders have the following legal rights:
The right to receive stock certificates as evidence of ownership.
The right to vote at stockholders’ meetings.
The right to receive any declared dividends, and to sell the stock.
The right to information and to receive financial reports about the company.
Sometimes they may have the right to buy newly issued shares of stock by the company before the shares
are sold to the public, so that current owners can maintain their proportionate interest in the company, if
they so choose. Whether they have this privilege is determined by law or by the company's charter.
Par Value, Stated Value, Legal Capital
Par value is the value assigned to a share of stock when it is authorized, and is much less than its expected
market value. Sometimes a stock will not have a par value, but will have a stated value in the corporation's
financial records. Par and stated values set the minimum requirement for legal capital, which is the number of
shares of outstanding stock multiplied by the par or stated value of each share. A corporation cannot pay

dividends or buy back its stock, if doing so reduces the amount of legal capital below the minimum required
by state law. Par value is more relevant, however, for preferred stock, because they pay a fixed dividend that
is a set percentage of the par value.
Residual Claim If a company liquidates, common stockholders have a claim to the residue—what is left after all creditors and
all preferred stockholders have been paid. In most cases of liquidation, the common shareholder gets nothing.
Rights and Warrants Rights and warrants are much like options. They give the owner the right, but not the obligation to buy new
shares of stock at a specified price, and they expire at a specified date. Unlike options, the company issues
rights and warrants to raise more money for the company.
Rights (Synonyms: Pre‐Emptive Rights, Subscription Rights, Oversubscription Privilege)
If a corporation wants to raise more money, it will frequently do so by issuing more shares from the
authorized, but unissued shares. However, as discussed above, existing shareholders may have the right to
maintain their proportionate ownership of the company, so the company provides existing stockholders
with subscription rights (aka rights certificates), giving stockholders the right, but not the obligation, to
buy the new shares at a specified price—the subscription price—which is usually lower than the market
price. A benefit for the company of selling to existing shareholders is that marketing costs will be less than
selling to the general public. The rights offering is generally handled by investment bankers in a standby
commitment, where the investment bank agrees to buy any shares not subscribed to by the holders of rights.
Warrants
A warrant is a security that gives its owner the right, but not the obligation, to purchase a stipulated number
of shares at a stipulated price anytime before the warrant expires. When the warrant is first issued, the
stipulated price is always above the current market price, usually well above, because warrants have a much
longer lifetime than rights.
Warrants are frequently sold attached to bonds, to lower the interest that the corporation has to pay, since the
bondholder has the additional option of exercising the warrant for profit if the company does well. They may
be attached to preferred stock as well. Sometimes the warrant is detachable—that is sold separately from the
stock or bond—after a certain time; otherwise the warrant is nondetachable.
Stock Splits When a stock appreciates considerably, the corporation will sometimes declare a stock split, which will lower
the market price of the stock, and therefore, hopefully entice more investors to buy the stock. The split ratio is
usually 2:1, that is, 2 shares of stock now replace every share of stock, but the ratio can be 3:1, 4:1, 5:3 or
anything else. If an investor had 100 shares of stock selling at $80 per share, he will have 200 shares selling
at $40 per share after a 2:1 split. All financial ratios with the share price as one of the terms and the par value

of the stock will be adjusted accordingly. The number of outstanding stocks will also increase. Whether the
stock split entices more people to buy it is questionable, and necessarily limited. If this were not true, a
corporation could continually split its stock to increase its value, even without increasing profits.
Reverse Stock Splits
When a company has financial difficulties, sometimes its stock falls to a low value. Often, this is seen as a
sign of risk and bad performance, so the company will do a reverse split, where 2 or more shares of stock are
exchanged for 1, thereby increasing the value of each share. The company itself is not worth more, but it may
appear more valuable to inexperienced investors.
Stock Dividend Large companies that are profitable, but have little potential for growth, will start paying dividends, usually
quarterly. Usually the dividend is paid in cash, but sometimes, to conserve cash, a company will declare a
stock dividend instead of a cash dividend. The stock dividend is stated as a percentage of stock owned. Thus,
with a 10% dividend, each stockholder will get 1 more share of stock for every 10 that he owns. There is no
change to the par value and the shareholders’ proportionate interest in the company is unchanged. Each share
will be worth less, however.
Types of Stocks
Investors have different objectives, such as growth or income, and different investment horizons. Hence, they
seek out stocks that have the qualities that they look for. To satisfy this need, stocks have been categorized
according to their investment characteristics. The most common categories are listed below.
Blue-chip stocks are stocks of large, stable companies that have a long history of stable earnings and
dividends, and are typified by the stocks composing the Dow Jones Industrial Average, including General
Electric, IBM, Microsoft, and Pfizer. Because of their large size, there is virtually no potential for a high
growth rate, so most of the return of these stocks is in the form of dividends. However, capital gains can be
earned from these stocks if they are bought in a bear market, when stock prices are depressed overall.
Income stocks generate most of their returns in dividends, and the dividends—unlike the dividends of
preferred stock or the interest payments of bonds—will, in many cases, grow continuously year after year as
the companies' earnings grow. These companies have a high dividend payout ratio because there are few
opportunities to invest the money in the business that would yield a higher return on stockholders' equity.
Hence, many of these companies are already very large, and are also considered to be blue-chip companies,
such as General Electric.
Cyclical stocks cycle with the economic cycles, going up strongly when the economy is growing and
declining as the economy declines. Most of these companies supply capital equipment for businesses or big

ticket items, such as cars and houses, for consumers. Some examples include Alcoa, Caterpillar, and
Brunswick. The best time to buy these stocks is at the bottom of a business cycle, then sell when the cycle
peeks.
Defensive stocks are issued by companies that are resistant to the economic cycles, and may even profit from
them. When consumers and businesses cut back spending, a few other businesses profit, either because they
offer a way to cut costs, or because they have the lowest prices. For instance, during the credit crisis of late
2008 and early 2009, people tried to save by doing more for themselves. For instance, many people starting
cutting hair for their families, or coloring their own hair to save the $200 that some beauty shops charge. This
increased business for businesses that manufactured hair cutters and coloring kits. Auto repair shops tend to
do better, because people cut back on the purchase of new cars, but cars nowadays are too complex for most
people to fix on their own. And while most retailers were hurting significantly during the credit crisis, Wal-
Mart was one of the few that actually thrived, since Wal-Mart is usually recognized as providing lower prices
than other retailers.
Growth stocks are stocks of companies that reinvest most of their earnings into their businesses, because it
can yield a higher return on stockholders' equity, and ultimately, a higher return to stockholders, in the form
of capital gains, than if the money were paid out as dividends. Typically, these companies have high P/E
ratios because investors expect high growth rates for the near future. Note, however, that growth stocks are
risky. If a growth-oriented company doesn't grow as fast as anticipated, then its price will drop as investors
lower its future prospects with the result that the P/E ratio declines. So even if earnings remain stable, the
stock price will decline.
Another risk is bear markets—growth stocks will tend to decline much more than blue-chips or income
stocks in a declining market, because investors become pessimistic, and will sell their stocks, especially those
that pay no dividends. One of the main benefits of growth stocks is that capital gains, especially long-term
gains where the stock is held for at least 1 year, are generally taxed at a lower rate than dividends, which are
taxed as ordinary income.
Tech stocks are the stocks of technology companies, which make computer equipment, communication
devices, and other technological devices. Most tech stocks are listed on NASDAQ. The stocks of most tech
companies are either considered growth stock or speculative stock; some are considered blue-chip, such as
Intel or Microsoft. However, there is considerable risk in tech companies because research and development
efforts are hard to evaluate, and since technology is continually evolving, it can quickly change the fortunes
of many companies, especially when old products are displaced by new products.

Speculative stocks are the stocks of companies that have little or no earnings, or widely varying earnings, but hold great potential for appreciation because they are tapping into a new market, are operating under new management, or are developing a potentially very lucrative product that could cause the stock price to zoom upward if the company is successful. Many Internet companies were considered speculative investments. During the stock market bubble of the latter half of the 1990's, many of these stocks had ridiculous market capitalizations, and yet, many of them had virtually no earnings, and many, if not most, have since then, imploded. A few, such as Amazon, have grown to become major corporations. Many speculative stocks are traded frequently by investors—or some would say, gamblers—in the hope of making a profit by timing the market, since speculative stocks range wildly in price as their perceived prospects constantly change.
V. HOW FIRMS ISSUE SECURITIES5
When firms need to raise capital they may choose to sell (or float) new securities. These new issues of stocks, bonds, or other securities typically are marketed to the public by investment bankers in what is called the primary market. Purchase and sale of already issued securities among private investors takes place in the secondary market. There are two types of primary market issues of common stock. Initial public offerings, or IPOs, are stocks issued by a formerly privately owned company selling stock to the public for the first time. Seasoned new issues are offered by companies that already have floated equity. A sale by IBM of new shares of stock, for example, would constitute a seasoned new issue.
We also distinguish between two types of primary market issues: a public offering, which is an issue of stock or bonds sold to the general investing public that can then be traded on the secondary market; and a private placement, which is an issue that is sold to a few wealthy or institutional investors at most, and, in the case of bonds, is generally held to maturity.
Investment Bankers and Underwriting
Public offerings of both stocks and bonds typically are marketed by investment bankers, who in this role are called underwriters. More than one investment banker usually markets the securities. A lead firm forms an underwriting syndicate of other investment bankers to share the responsibility for the stock issue. The bankers advise the firm regarding the terms on which it should attempt to sell the securities. A preliminary registration statement must be filed with the Securities and Exchange Commission (SEC) describing the issue and the prospects of the company. This preliminary prospectus is known as a red herring because of a statement printed in red that the company is not attempting to sell the security before the registration is approved. When the statement is finalized and approved by the SEC, it is called the prospectus. At this time the price at which the securities will be offered to the public is announced.
In a typical underwriting arrangement the investment bankers purchase the securities from the issuing company and then resell them to the public. The issuing firm sells the securities to the underwriting syndicate for the public offering price less a spread that serves as compensation to the underwriters. This procedure is called a
5 Text adapted from Z. Bodie, A. Kane, A.J. Marcus, “Investments – volume I”, 5th edition, McGraw-Hill, 2003. Educational purpose only.
firm commitment. The underwriters receive the issue and assume the full risk that the shares cannot in fact be sold to the public at the stipulated offering price.
An alternative to firm commitment is the best-efforts agreement. In this case the investment banker agrees to help the firm sell the issue to the public but does not actually purchase the securities. The banker simply acts as an intermediary between the public and the firm and thus does not bear the risk of being unable to resell purchased securities at the offering price. The best-efforts procedure is more common for initial public offerings of common stock, for which the appropriate share price is less certain.
Corporations engage investment bankers either by negotiation or by competitive bidding. Negotiation is far more common. Besides being compensated by the spread between the purchase price and the public offering price, an investment banker may receive shares of common stock or other securities of the firm.
Shelf Registration
An important innovation in the method of issuing securities was introduced in 1982, when the SEC approved Rule 415, which allows firms to register securities and gradually sell them to the public for two years after the initial registration. Because the securities are already registered, they can be sold on short notice with little additional paperwork. In addition, they can be sold in small amounts without incurring substantial flotation costs. The securities are “on the shelf,” ready to be issued, which has given rise to the term shelf registration.
Private Placements
Primary offerings can also be sold in a private placement rather than a public offering. In this case, the firm (using an investment banker) sells shares directly to a small group of institutional or wealthy investors. Private placements can be far cheaper than public offerings. This is because Rule 144A of the SEC allows corporations to make these placements without preparing the extensive and costly registration statements required of a public offering. On the other hand, because private placements are not made available to the general public, they generally will be less suited for very large offerings. Moreover, private placements do not trade in secondary markets such as stock exchanges. This greatly reduces their liquidity and presumably reduces the prices that investors will pay for the issue.
Initial Public Offerings
Investment bankers manage the issuance of new securities to the public. Once the SEC has commented on the registration statement and a preliminary prospectus has been distributed to interested investors, the investment bankers organize road shows in which they travel around the country to publicize the imminent offering. These road shows serve two purposes. First, they attract potential investors and provide them information about the offering. Second, they collect for the issuing firm and its underwriters information about the price at which they will be able to market the securities.
Large investors communicate their interest in purchasing shares of the IPO to the underwriters; these indications of interest are called a book and the process of polling potential investors is called book building. The book provides valuable information to the issuing firm because large institutional investors often will have useful insights about the market demand for the security as well as the prospects of the firm and its competitors. It is

common for investment bankers to revise both their initial estimates of the offering price of a security and the number of shares offered based on feedback from the investing community.
Why would investors truthfully reveal their interest in an offering to the investment banker? Might they be better off expressing little interest in the hope that this will drive down the offering price? Truth is the better policy in this case because truth-telling is rewarded. Shares of IPOs are allocated to investors in part based on the strength of each investor’s expressed interest in the offering. If a firm wishes to get a large allocation when it is optimistic about the security, it needs to reveal its optimism. In turn, the underwriter needs to offer the security at a bargain price to these investors to induce them to participate in book building and share their information.
Thus IPOs commonly are underpriced compared to the price at which they could be marketed. Such under pricing is reflected in price jumps on the date when the shares are first traded in public security markets. The most dramatic case of under pricing occurred in December 1999 when shares in VA Linux were sold in an IPO at $30 a share and closed on the first day of trading at $239.25, a 698% one-day return. Similarly, in November 1998, 3.1 million shares in theglobe.com were sold in an IPO at a price of $9 a share. In the first day of trading the price reached $97 before closing at $63.50 a share.
While the explicit costs of an IPO tend to be around 7% of the funds raised, such underpricing should be viewed as another cost of the issue. For example, if theglobe.com had sold its 3.1 million shares for the $63.50 that investors obviously were willing to pay for them, its IPO would have raised $197 million instead of only $27.9 million. The money “left on the table” in this case far exceeded the explicit costs of the stock issue.
The results consistently indicate that the IPOs are marketed to the investors at attractive prices. Underpricing of IPOs makes them appealing to all investors, yet institutional investors are allocated the bulk of a typical new issue. Some view this as unfair discrimination against small investors. However, our discussion suggests that the apparent discounts on IPOs may be no more than fair payments for a valuable service, specifically, the information contributed by the institutional investors. The right to allocate shares in this way may contribute to efficiency by promoting the collection and dissemination of such information. Pricing of IPOs is not trivial, and not all IPOs turn out to be underpriced. Some stocks do poorly after the initial issue and others cannot even be fully sold to the market. Underwriters left with unmarketable securities are forced to sell them at a loss on the secondary market. Therefore, the investment banker bears the price risk of an underwritten issue.
Interestingly, despite their dramatic initial investment performance, IPOs have been poor long-term investments. The year-by-year underperformance of the IPOs is dramatic, suggesting that on average, the investing public may be too optimistic about the prospects of these firms.
WHERE SECURITIES ARE TRADED
Once securities are issued to the public, investors may trade them among themselves. Purchase and sale of already-issued securities take place in the secondary markets, which consist of (1) national and local securities exchanges, (2) the over-the-counter market, and (3) direct trading between two parties.
The Secondary Markets

There are several stock exchanges in the United States. Two of these, the New York Stock Exchange (NYSE) and the American Stock Exchange (Amex), are national in scope. The others, such as the Boston and Pacific exchanges, are regional exchanges, which primarily list firms located in a particular geographic area. There are also several exchanges for trading of options and futures contracts, which we’ll discuss in the options and futures chapters.
An exchange provides a facility for its members to trade securities, and only members of the exchange may trade there. Therefore memberships, or seats, on the exchange are valuable assets. The majority of seats are commission broker seats, most of which are owned by the large full-service brokerage firms. The seat entitles the firm to place one of its brokers on the floor of the exchange where he or she can execute trades. The exchange member charges investors for executing trades on their behalf. The commissions that members can earn through this activity determine the market value of a seat.
Regional exchanges also sponsor trading of some firms that are traded on national exchanges. This dual listing enables local brokerage firms to trade in shares of large firms without needing to purchase a membership on the NYSE. The NYSE recently has lost market share to the regional exchanges and, far more dramatically, to the over-the-counter market. Today, approximately 70% of the trades in stocks listed on the NYSE are actually executed on the NYSE. In contrast, about 80% of the trades in NYSE-listed shares were executed on the exchange in the early 1980s.
The loss is attributed to lower commissions charged on other exchanges, although the NYSE believes that a more inclusive treatment of trading costs would show that it is the most cost-effective trading arena. In any case, many of these non-NYSE trades were for relatively small transactions. The NYSE is still by far the preferred exchange for large traders, and its market share of exchange-listed companies when measured in share volume rather than number of trades has been stable in the last decade, between 82% and 84%.
The over-the-counter Nasdaq market has posed a bigger competitive challenge to the NYSE. Its share of trading volume in NYSE-listed firms increased from 2.5% in 1983 to about 8% in 1999. Moreover, many large firms that would be eligible to list their shares on the NYSE now choose to list on Nasdaq. Some of the wellknown firms currently trading on Nasdaq are Microsoft, Intel, Apple Computer, Sun Microsystems, and MCI Communications. Total trading volume in over-the-counter stocks on the computerized Nasdaq system has increased dramatically in the last decade, rising from about 50 million shares per day in 1984 to over 1 billion shares in 1999.
Other new sources of competition for the NYSE come from abroad. For example, the London Stock Exchange is preferred by some traders because it offers greater anonymity. In addition, new restrictions introduced by the NYSE to limit price volatility in the wake of the market crash of 1987 are viewed by some traders as another reason to trade abroad. These so-called circuit breakers are discussed below. While most common stocks are traded on the exchanges, most bonds and other fixed income securities are not. Corporate bonds are traded both on the exchanges and over the counter, but all federal and municipal government bonds are traded only over the counter.

TRADING ON EXCHANGES
Most of the material in this section applies to all securities traded on exchanges. Some of it, however, applies just to stocks, and in such cases we use the term stocks or shares.
The Participants
When an investor instructs a broker to buy or sell securities, a number of players must act to consummate the trade. We start our discussion of the mechanics of exchange trading with a brief description of the potential parties to a trade. The investor places an order with a broker. The brokerage firm owning a seat on the exchange contacts its commission broker, who is on the floor of the exchange, to execute the order. Floor brokers are independent members of the exchange who own their own seats and handle work for commission brokers when those brokers have too many orders to handle.
The specialist is central to the trading process. Specialists maintain a market in one or more listed securities. All trading in a given stock takes place at one location on the floor of the exchange called the specialist’s post. At the specialist’s post is a computer monitor, called the Display Book, that presents all the current offers from interested traders to buy or sell shares at various prices as well as the number of shares these quotes are good for.
The specialist manages the trading in the stock. The market-making responsibility for each stock is assigned by the NYSE to one specialist firm. There is only one specialist per stock, but most firms will have responsibility for trading in several stocks. The specialist firm also may act as a dealer in the stock, trading for its own account. We will examine the role of the specialist in more detail shortly.
Types of Orders
Market Orders Market orders are simply buy or sell orders that are to be executed immediately at current market prices. For example, an investor might call his broker and ask for the market price of Exxon. The retail broker will wire this request to the commission broker on the floor of the exchange, who will approach the specialist’s post and ask the specialist for best current quotes. Finding that the current quotes are $68 per share bid and $68.15 asked, the investor might direct the broker to buy 100 shares “at market,” meaning that he is willing to pay $68.15 per share for an immediate transaction. Similarly, an order to “sell at market” will result in stock sales at $68 per share. When a trade is executed, the specialist’s clerk will fill out an order card that reports the time, price, and quantity of shares traded, and the transaction is reported on the exchange’s ticker tape.
There are two potential complications to this simple scenario, however. First, as noted earlier, the posted quotes of $68 and $68.15 actually represent commitments to trade up to a specified number of shares. If the market order is for more than this number of shares, the order may be filled at multiple prices. For example, if the asked price is good for orders of up to 600 shares, and the investor wishes to purchase 1,000 shares, it may be necessary to pay a slightly higher price for the last 400 shares than the quoted asked price.
The second complication arises from the possibility of trading “inside the quoted spread.” If the broker who has received a market buy order for Exxon meets another broker who has received a market sell order for Exxon,

they can agree to trade with each other at a price of $68.10 per share. By meeting inside the quoted spread, both the buyer and the seller obtain “price improvement,” that is, transaction prices better than the best quoted prices. Such “meetings” of brokers are more than accidental. Because all trading takes place at the specialist’s post, floor brokers know where to look for counterparties to take the other side of a trade.
Limit Orders Investors may also place limit orders, whereby they specify prices at which they are willing to buy or sell a security. If the stock falls below the limit on a limitbuy order then the trade is to be executed. If Exxon is selling at $68 bid, $68.15 asked, for example, a limit-buy order may instruct the broker to buy the stock if and when the share price falls below $65. Correspondingly, a limit-sell order instructs the broker to sell as soon as the stock price goes above the specified limit.
What happens if a limit order is placed between the quoted bid and ask prices? For example, suppose you have instructed your broker to buy Exxon at a price of $68.10 or better. The order may not be executed immediately, since the quoted asked price for the shares is $68.15, which is more than you are willing to pay. However, your willingness to buy at $68.10 is better than the quoted bid price of $68 per share. Therefore, you may find that there are traders who were unwilling to sell their shares at the $68 bid price but are happy to sell shares to you at your higher bid price of $68.10.
Until 1997, the minimum tick size on the New York Stock Exchange was $1⁄8. In 1997 the NYSE and all other exchanges began allowing price quotes in $1⁄16 increments. In 2001, the NYSE began to price stocks in decimals (i.e., in dollars and cents) rather than dollars and sixteenths. By April 2001, the other U.S. exchanges are scheduled to adopt decimal pricing as well. In principle, this could reduce the bid–asked spread to as little as one penny, but it is possible that even with decimal pricing, some exchanges could mandate a minimum tick size, for example, of 5 cents. Moreover, even with decimal pricing, the typical bid–asked spread on smaller, less actively traded firms (which already exceeds $1⁄8 and therefore is not constrained by tick size requirements) would not be expected to fall dramatically.
Stop-loss orders are similar to limit orders in that the trade is not to be executed unless the stock hits a price limit. In this case, however, the stock is to be sold if its price falls below a stipulated level. As the name suggests, the order lets the stock be sold to stop further losses from accumulating. Symmetrically, stop-buy orders specify that the stock should be bought when its price rises above a given limit. These trades often accompany short sales, and they are used to limit potential losses from the short position.
Orders also can be limited by a time period. Day orders, for example, expire at the close of the trading day. If it is not executed on that day, the order is canceled. Open or good-till-canceled orders, in contrast, remain in force for up to six months unless canceled by the customer. At the other extreme, fill or kill orders expire if the broker cannot fill them immediately.
Specialists and the Execution of Trades
A specialist “makes a market” in the shares of one or more firms. This task may require the specialist to act as either a broker or dealer. The specialist’s role as a broker is simply to execute the orders of other brokers. Specialists may also buy or sell shares of stock for their own portfolios. When no other broker can be found to take the other side of a trade, specialists will do so even if it means they must buy for or sell from their own

accounts. The NYSE commissions these companies to perform this service and monitors their performance. In this role, specialists act as dealers in the stock. Part of the specialist’s job as a broker is simply clerical. The specialist maintains a “book” listing all outstanding unexecuted limit orders entered by brokers on behalf of clients. (Actually, the book is now a computer console.) When limit orders can be executed at market prices, the specialist executes, or “crosses,” the trade.
The specialist is required to use the highest outstanding offered purchase price and lowest outstanding offered selling price when matching trades. Therefore, the specialist system results in an auction market, meaning all buy and all sell orders come to one location, and the best orders “win” the trades. In this role, the specialist acts merely as a facilitator.
The more interesting function of the specialist is to maintain a “fair and orderly market” by acting as a dealer in the stock. In return for the exclusive right to make the market in a specific stock on the exchange, the specialist is required to maintain an orderly market by buying and selling shares from inventory. Specialists maintain their own portfolios of stock and quote bid and asked prices at which they are obligated to meet at least a limited amount of market orders. If market buy orders come in, specialists must sell shares from their own accounts at the asked price; if sell orders come in, they must stand willing to buy at the listed bid price.
Ordinarily, however, in an active market specialists can cross buy and sell orders without their own direct participation. That is, the specialist’s own inventory of securities need not be the primary means of order execution. Occasionally, however, the specialist’s bid and asked prices will be better than those offered by any other market participant. Therefore, at any point the effective asked price in the market is the lower of either the specialist’s asked price or the lowest of the unfilled limit-sell orders. Similarly, the effective bid price is the highest of unfilled limit-buy orders or the specialist’s bid. These procedures ensure that the specialist provides liquidity to the market. In practice, specialists participate in approximately one-quarter of trading volume on the NYSE.
By standing ready to trade at quoted bid and asked prices, the specialist is exposed somewhat to exploitation by other traders. Large traders with ready access to late-breaking news will trade with specialists only if the specialists’ quoted prices are temporarily out of line with assessments of value based on that information. Specialists who cannot match the information resources of large traders will be at a disadvantage when their quoted prices offer profit opportunities to more informed traders.
You might wonder why specialists do not protect their interests by setting a low bid price and a high asked price. A specialist using that strategy would not suffer losses by maintaining a too-low asked price or a too-high bid price in a period of dramatic movements in the stock price. Specialists who offer a narrow spread between the bid and the asked prices have little leeway for error and must constantly monitor market conditions to avoid offering other investors advantageous terms.
There are two reasons why large bid–asked spreads are not viable options for the specialist. First, one source of the specialist’s income is derived from frequent trading at the bid and asked prices, with the spread as the trading profit. A too-large spread would make the specialist’s quotes noncompetitive with the limit orders placed by other traders. If the specialist’s bid and asked quotes are consistently worse than those of public
traders, it will not participate in any trades and will lose the ability to profit from the bid–asked spread. Another reason specialists cannot use large bid–ask spreads to protect their interests is that they are obligated to provide price continuity to the market.
To illustrate the principle of price continuity, suppose that the highest limit-buy order for a stock is $30 while the lower limit-sell order is at $32. When a market buy order comes in, it is matched to the best limit-sell at $32. A market sell order would be matched to the best limit-buy at $30. As market buys and sells come to the floor randomly, the stock price would fluctuate between $30 and $32. The exchange would consider this excessive volatility, and the specialist would be expected to step in with bid and/or asked prices between these values to reduce the bid–asked spread to an acceptable level, typically less than $.25.
Specialists earn income both from commissions for acting as brokers for orders and from the spread between the bid and asked prices at which they buy and sell securities. Some believe that specialists’ access to their book of limit orders gives them unique knowledge about the probable direction of price movement over short periods of time. For example, suppose the specialist sees that a stock now selling for $45 has limit-buy orders for more than 100,000 shares at prices ranging from $44.50 to $44.75. This latent buying demand provides a cushion of support, because it is unlikely that enough sell pressure could come in during the next few hours to cause the price to drop below $44.50. If there are very few limit-sell orders above $45, some transient buying demand could raise the price substantially.
The specialist in such circumstances realizes that a position in the stock offers little downside risk and substantial upside potential. Such immediate access to the trading intentions of other market participants seems to allow a specialist to earn substantial profits on personal transactions. One can easily overestimate such advantages, however, because ever more of the large orders are negotiated “upstairs,” that is, as fourth-market deals.
VI. THE RISKS ASSOCIATED WITH INVESTING IN FIXED INCOME SECURITIES6
The return obtained from a fixed income security from the day it is purchased to the day it is sold can be divided into two parts: (1) the market value of the security when it is eventually sold and (2) the cash flows received from the security over the time period that it is held, plus any additional income from reinvestment of the cash flow. Several environmental factors affect one or both of these two parts. We can define the risk in any security as a measure of the impact of these market factors on the return characteristics of the security. The different types of risk that an investor in fixed income securities is exposed to are as follows:
• Market, or interest-rate, risk • Reinvestment risk • Timing, or call, risk • Credit risk • Yield-curve, or maturity, risk • Inflation, or purchasing-power, risk
6 Internet material (authors: by Ravi Dattareya, Frank Fabozzi), educational purpose only;

• Liquidity risk • Exchange-rate, or currency, risk • Volatility risk • Political or legal risk • Event risk • Sector risk
MARKET, OR INTEREST-RATE, RISK
The price of a typical fixed income security moves in the opposite direction of the change in interest rates: As interest rates rise (fall), the price of a fixed income security will fall (rise). For an investor who plans to hold a fixed income security to maturity, the change in its price before maturity is not of concern; however, for an investor who may have to sell the fixed income security before the maturity date, an increase in interest rates will mean the realization of a capital loss. This risk is referred to as market risk, or interest-rate risk, which is by far the biggest risk faced by an investor in the fixed income market.
It is customary to represent the market by the yield levels on Treasury securities. Most other yields are compared to the Treasury levels and are quoted as spreads off appropriate Treasury yields. To the extent that the yields of all fixed income securities are interrelated, their prices respond to changes in Treasury rates. The actual magnitude of the price response for any security depends on various characteristics of the security, such as coupon, maturity, and the options embedded in the security (e.g., call and put provisions).
To control interest-rate risk, it is necessary to quantify it. The most commonly used measure of interest-rate risk is duration. Duration is the approximate percentage change in the price of a bond or bond portfolio due to a 100 basis point change in yields.
REINVESTMENT RISK
The cash flows received from a security are usually (or are assumed to be) reinvested. The additional income from such reinvestment, sometimes called interest-on-interest, depends on the prevailing interest rate levels at the time of reinvestment, as well as on the reinvestment strategy. The variability in the returns from reinvestment from a given strategy due to changes in market rates is called reinvestment risk. The risk here is that the interest rate at which interim cash flows can be reinvested will fall. Reinvestment risk is greater for longer holding periods. It is also greater for securities with large, early cash flows such as high-coupon bonds.
It should be noted that interest-rate risk and reinvestment risk oppose each other. For example, interest-rate risk is the risk that interest rates will rise, thereby reducing the price of a fixed income security. In contrast, reinvestment risk is the risk that interest rates will fall. A strategy based on these two offsetting risks is called “immunization”.
TIMING, OR CALL, RISK
Bonds may contain a provision that allows the issuer to retire, or “call,’’ all or part of the issue before the maturity date. The issuer usually retains this right to refinance the bond in the future if market interest rates decline below the coupon rate.

From the investor’s perspective, there are three disadvantages of the call provision. First, the cash-flow pattern of a callable bond is not known with certainty. Second, because the issuer may call the bonds when interest rates have dropped, the investor is exposed to reinvestment risk. That is, the investor will have to reinvest the proceeds received when the bond is called at lower interest rates. Finally, the capital appreciation potential of a bond will be reduced because the price of a callable bond may not rise much above the price at which the issuer may call the bond.
Agency, corporate, and municipal bonds may have embedded in them the option on the part of the borrower to call, or terminate, the issue before the stated maturity date. All mortgage-backed securities have this option. Even though the investor is usually compensated for taking the risk of call by means of a lower price or a higher yield, it is not easy to determine if this compensation is sufficient. In any case, the returns from a bond with call risk can be dramatically different from those obtained from a noncallable bond. The magnitude of this risk depends on the various parameters of the call, as well as on market conditions. Timing risk is so pervasive in fixed income portfolio management that many market participants consider it second only to interest-rate risk in importance.
In the case of mortgage-backed securities, the cash flow depends on prepayments of principal made by the homeowners in the pool of mortgages that serves as collateral for the security. The timing risk in this case is called prepayment risk. It includes contraction risk—the risk that homeowners will prepay all or part of their mortgage when mortgage interest rates decline. If interest rates rise, however, investors would benefit from prepayments. The risk that prepayments will slow down when mortgage interest rates rise is called extension risk. Thus, timing risk in the case of mortgage-backed securities is called prepayment risk, which includes contraction risk and extension risk.
CREDIT RISK
The credit risk of a bond includes
1. The risk that the issuer will default on its obligation (default risk).
2. The risk that the bond’s value will decline and/or the bond’s price performance will be worse than that of other bonds against which the investor is compared because either (a) the market requires a higher spread due to a perceived increase in the risk that the issuer will default or (b) companies that assign ratings to bonds will lower a bond’s rating.
The first risk is referred to as default risk. The second risk is labeled based on the reason for the adverse or inferior performance. The risk attributable to an increase in the spread or, more specifically, the credit spread demanded by the market is referred to as credit spread risk; the risk attributable to a lowering of the credit rating (i.e., a downgrading) is referred to as downgrade risk.
A credit rating is a formal opinion given by a specialized company of the default risk faced by investing in a particular issue of debt securities. The specialized companies that provide credit ratings are referred to as “rating agencies.” The three nationally recognized rating agencies in the United States are Moody’s Investors Service, Standard & Poor’s Corporation, and Fitch Ratings.

Once a credit rating is assigned to a debt obligation, a rating agency monitors the credit quality of the issuer and can reassign a different credit rating to its bonds. An “upgrade” occurs when there is an improvement in the credit quality of an issue; a “downgrade” occurs when there is deterioration in the credit quality of an issue. As noted earlier, downgrade risk is the risk that an issue will be downgraded.
Typically, before an issue’s rating is changed, the rating agency will announce in advance that it is reviewing the issue with the potential for upgrade or downgrade. The issue in such cases is said to be on “rating watch” or “credit watch.” In the announcement, the rating agency will state the direction of the potential change in rating—upgrade or downgrade. Typically, a decision will be made within three months.
In addition, rating agencies will issue rating outlooks. A rating outlook is a projection of whether an issue in the long term (from six months to two years) is likely to be upgraded, downgraded, or maintains its current rating. Rating agencies designate a rating outlook as either positive (i.e., likely to be upgraded), negative (i.e., likely to be downgraded), or stable (i.e., likely to be no change in the rating).
Gauging Default Risk and Downgrade Risk
The information available to investors from rating agencies about credit risk are (1) ratings, (2) rating watches or credit watches, and (3) rating outlooks. A study by Moody’s found that for corporate bonds, its ratings combined with its rating watches and rating outlook status provides a better gauge for default risk than using the ratings alone. Moreover, periodic studies by the rating agencies provide information to investors about credit risk.
Below we describe how the information provided by rating agencies can be used to gauge two forms of credit risk: default risk and downgrade risk.
For long-term debt obligations, a credit rating is a forward-looking assessment of (1) the probability of default and (2) the relative magnitude of the loss should a default occur. For short-term debt obligations (i.e., obligations with initial maturities of one year or less), a credit rating is a forward-looking assessment of the probability of default. Consequently, credit ratings are the rating agencies’ assessments of the default risk associated with a bond issue.
Periodic studies by rating agencies provide information about two aspects of default risk—default rates and default loss rates. First, rating agencies study and make available to investors the percentage of bonds of a given rating at the beginning of a period that have defaulted at the end of the period. This percentage is referred to as the default rate. A default loss rate is a measure of the magnitude of the potential of the loss should a default occur.
Rating transition tables published periodically by rating agencies also provide information. A rating transition table shows the percentage of issues of each rating at the beginning of a period that were downgraded or upgraded by the end of the time period. Consequently, by looking at the percentage of downgrades for a given rating, an estimate can be obtained of the probability of a downgrade, and this can serve as a measure of downgrade risk.
YIELD-CURVE, OR MATURITY, RISK
In many situations, a bond of a given maturity is used as an alternative to another bond of a different maturity. An adjustment is made to account for the differential interest-rate risks in the two bonds. However, this adjustment makes an assumption about how the interest rates (i.e., yields) at different maturities will move. To the extent that the yield movements deviate from this assumption, there is yield-curve, or maturity, risk.
In general, yield-curve risk is more important in hedging situations than in pure investment decisions. For example, if a trader is hedging a position, or if a pension fund or an insurance company is acquiring assets so as to enable it to meet a given liability, then yield-curve risk should be examined carefully. However, if a pension fund has decided to invest in the intermediate-term sector, then the fine distinctions in maturity are less important.
Another situation where yield-curve risk should be considered is in the analysis of bond-swap transactions, where the potential incremental returns are dependent entirely on the parallel-shift (or other equally arbitrary) assumption for the yield curve.
INFLATION, OR PURCHASING POWER, RISK
Inflation risk, or purchasing power risk, arises because of the variation in the value of cash flows from a security due to inflation, as measured in terms of purchasing power. For example, if an investor purchases a five-year bond in which he or she can realize a coupon rate of 7%, but the rate of inflation is 8%, then the purchasing power of the cash flow has declined. For all but inflation-adjusted securities, and adjustable- or floating-rate bonds, an investor is exposed to inflation risk because the interest rate the issuer promises to make is fixed for the life of the security. To the extent that interest rates reflect the expected inflation rate, floating-rate bonds have a lower level of inflation risk.
LIQUIDITY RISK
Liquidity risk is the risk that the investor will have to sell a bond below its true value where the true value is indicated by a recent transaction. The primary measure of liquidity is the size of the spread between the bid price and the ask price quoted by a dealer. The wider the bid-ask spread, the greater is the liquidity risk.
A liquid market generally can be defined by “small bid-ask spreads which do not materially increase for large transactions.’’ How to define the bid-ask spread in a multiple-dealer market is subject to interpretation.
From the perspective of the market overall, the bid-ask spread can be computed by looking at the best bid price (high price at which one of the dealers is willing to buy the security) and the lowest ask price (lowest offer price at which one of the dealers is willing to sell the security). This liquidity measure is called the market bid-ask spread
For investors who plan to hold a bond until maturity and need not mark a position to market, liquidity risk is not a major concern. An institutional investor who plans to hold an issue to maturity but is periodically marked to market is concerned with liquidity risk. By marking a position to market, it is meant that the security is revalued in the portfolio based on its current market price. For example, mutual funds are required to mark to market at

the end of each day the holdings that are in their portfolio in order to compute the net asset value (NAV). While other institutional investors may not mark to market as frequently as mutual funds, they are marked to market when reports are periodically sent to clients or the board of directors or trustees.
Where are the prices obtained to mark a position to market? Typically, a portfolio manager will solicit indicative bids from several dealers and then use some process to determine the bid price used to mark the position. The less liquid the issue, the greater the variation there will be in the bid prices obtained from dealers. With an issue that has little liquidity, the price may have to be determined by a pricing service rather than by dealers. Moreover, lack of dealer indicative bids and concern with models used by pricing services may lead the manager to occasionally override a bid (subject to internal approval beyond the control of the manager).
EXCHANGE-RATE, OR CURRENCY, RISK
A non-dollar-denominated bond (i.e., a bond whose payments occur in a foreign currency) has unknown U.S. dollar cash flows. The dollar cash flows are dependent on the foreign-exchange rate at the time the payments are received. For example, suppose that an investor purchases a bond whose payments are in Japanese yen. If the yen depreciates relative to the U.S. dollar, then fewer dollars will be received. The risk of this occurring is referred to as exchange-rate risk, or currency risk. Of course, should the yen appreciate relative to the U.S. dollar, the investor will benefit by receiving more dollars.
In addition to the change in the exchange rate, an investor is exposed to the interest-rate, or market, risk in the local market. For example, if a U.S. investor purchases German government bonds denominated in Euros, the proceeds received from the sale of that bond prior to maturity will depend on the level of interest rates in the German bond market, in addition to the exchange rate.
VOLATILITY RISK
As will be explained in later chapters, the price of a bond with an embedded option depends on the level of interest rates and factors that influence the value of the embedded option. One of the factors is the expected volatility of interest rates. Specifically, the value of an option rises when expected interest-rate volatility increases. In the case of a callable bond or mortgage-backed security, because the investor has granted an option to the borrower, the price of the security falls because the investor has given away a more valuable option. The risk that a change in volatility will adversely affect the price of a security is called volatility risk.
POLITICAL OR LEGAL RISK
Sometimes the government can declare withholding or other additional taxes on a bond or declare a tax-exempt bond taxable. In addition, a regulatory authority can conclude that a given security is unsuitable for investment entities that it regulates. These actions can adversely affect the value of the security. Similarly, it is also possible that a legal or regulatory action affects the value of a security positively. The possibility of any political or legal actions adversely affecting the value of a security is known as political or legal risk.
To illustrate political or legal risk, consider investors who purchase tax exempt municipal securities. They are exposed to two types of political risk that can be more appropriately called tax risk. The first type of tax risk is

that the federal income tax rate will be reduced. The higher the marginal tax rate, the greater is the value of the tax-exempt nature of a municipal security. As the marginal tax rates decline, the price of a tax-exempt municipal security will decline. For example, proposals for a flat tax with a low tax rate significantly reduced the potential tax advantage of owning municipal bonds. As a result, tax-exempt municipal bonds began trading at lower prices. The second type of tax risk is that a municipal bond issued as tax exempt eventually will be declared taxable by the Internal Revenue Service (IRS). This may occur because many municipal (revenue) bonds have elaborate security structures that could be subject to future adverse congressional actions and IRS interpretations. As a result of the loss of the tax exemption, the municipal bond will decline in value in order to provide a yield comparable to similar taxable bonds. For example, in June of 1980, the Battery Park City Authority sold $97.315 million in construction loan notes. At the time of issuance, the legal counsel thought that the interest on the note would be exempt from federal income taxation. In November of 1980, however, the IRS held that interest on these notes was not exempt, resulting in a lower price for the notes. The issue was not resolved until September 1981 when the Authority and the IRS signed a formal agreement resolving the matter so as to make the interest on the notes tax exempt.
EVENT RISK
Occasionally, the ability of an issuer to make interest and principal payments is seriously and unexpectedly changed by (1) a natural or industrial accident or (2) a takeover or corporate restructuring. These risks are referred to as event risk. The cancellation of plans to build a nuclear power plant illustrates the first type of event in relation to the utility industry.
An example of the second type of event risk is the takeover in 1988 of RJR Nabisco for $25 billion via a financing technique known as a leveraged buyout (LBO). In such a transaction, the new company incurred a substantial amount of debt to finance the acquisition of the firm. Because the corporation was required to service a substantially larger amount of debt, its quality rating was reduced to non-investment-grade quality. As a result, the change in yield spread to a benchmark Treasury, demanded by investors because of the LBO announcement, increased from about 100 to 350 basis points.
There are also spillover effects of event risk on other firms. For example, if there is a nuclear accident, this will affect all utilities producing nuclear power.
SECTOR RISK
Bonds in different sectors of the market respond differently to environmental changes because of a combination of some or all of the preceding risks, as well as others. Examples include discount versus premium coupon bonds, industrial versus utility bonds, and corporate versus mortgage-backed bonds. The possibility of adverse differential movement of specific sectors of the market is called sector risk.
OTHER RISKS
The various risks of investing in the fixed income markets reviewed in this chapter do not represent the entire range of risks. In the marketplace, it is customary to combine almost all risks other than market risk (interest-rate risk) and refer to it as basis risk.

MODULE VI Public Finance
Chapter 1 INTRODUCTION TO GOVERNMENT FINANCE
Public finance is a field of economics concerned with paying for collective or governmental activities, and with
the administration and design of those activities. The field is often divided into questions of what the
government or collective organizations should do or are doing, and questions of how to pay for those activities.
The broader term (public economics) and the narrower term (government finance) are also often used.
The proper role of government provides a starting point for the analysis of public finance. Private markets, if
certain conditions are met, will allocate goods and services among individuals efficiently (in the sense that no
waste occurs and that individual tastes are matching with the economy's productive abilities).
If private markets were able to provide efficient outcomes and if the distribution of income was socially
acceptable, then there would be little or no scope for government. In many cases, however, conditions for
private market efficiency are violated.
For example, if many people can enjoy the same good at the same time (non-rival, non-excludable
consumption), then private markets may supply too little of that good. National defense is one example of non-
rival consumption, or of a public good.
The public sector is the part of economic and administrative life that deals with the delivery of goods and
services by and for the government, whether
national,
regional or
local/municipal.
Examples of public sector activity range from delivering
social security,
administering urban planning and
organizing national defenses.
Government activity requires the reallocation of resources from the private to government use. To
accomplish this, individuals must be induced to provide some parts of their resources to state disposal.

But this method of finance can affect a number of important economic and political variables like:
1. The political equilibrium: the equilibrium quantity and mix of government-provided goods and
services depend on the distribution of tax shares per unit of those goods and services, because citizens’
tax shares influence their voting choices.
2. The overall market equilibrium, and the efficiency with which resources are employed in private uses:
the particulat method of finance used can distort the prices of goods and services »this means reducing
markets competition and the efficiency
3. The distribution of income: alternative financing schemes affect the distribution of income by reducing
the income that persons can spent for the private G&S
Musgrave proposes that the main economic functions of government could be divided among three
branches, the Allocation, the Distribution, and the Stabilization Branches of government. The job of the
Allocation Branch is to “secure adjustments in the allocation of resources”. The job of the Distribution Branch
is to “secure adjustments in the distribution of income and wealth”, and the job of the Stabilization Branch is to
secure “economic stabilization”.
Musgrave suggests that we think of each branch as run by a “manager” who is instructed to “plan his job
on the assumption that the other two branches will perform their functions properly.” Thus the Allocation
Branch proceeds on the “assumption of full employment of resources and
that the proper distribution of income has been secured.” The distribution branch assumes that “a full-
employment income is available for distribution and that the satisfaction of public wants is taken care of.”
Taxation-the major financing source of public expenditures
Taxation is the most important source of revenues for the modern governments, almost of the 90% or more of
their income. The remainder of government revenue comes from borrowing and from charging fees for services.
Definition: Tax is a compulsory charge or payment levied by the government on an individual or
corporation.
Definition: Tax is a compulsory payment associated with certain incomes, properties and activities.
Therefore an element of compulsion is involved in taxation
The revenues collected through taxation are used to:
-purchase the inputs necessary to produce government supplied G&S
-to redistribute purchasing power among citizens

Taxation reallocates resources from private to government use in two distinct steps:
-the ability of individuals to command resources is reduced because taxation reduces income from the
spending on market G&S
-the revenues collected by the government than are used to bid for resources necessary to provide income
support payments to recipients of government transfers such as Social Security Pensions.
Theory about taxation
Classical taxation theory
For a long time, the classical taxation theory was of most important.
As a result, taxation was only granted the fiscal role of providing state revenues.
A. Smith is considered to be the father of the scientific taxation theory. In his monograph “An Inquiry
into the Nature and Causes of the Wealth of Nations” A. Smith gave a definition of the taxation system,
indicating the main conditions for its formation and putting forward four main taxation principles:
equity, determination, convenience and thrift of taxation administration.
Smith’s work was developed later on by D. Ricardo, J. Mills, and W. Petty. All the theoretical
deliberation and scientific debates of those years were focused on one singular aspect: that the execution
of the taxation’s function—the provision of state revenues—is achieved on basis of the principles of
equity and justice. Naturally, this theoretical approach to the nature and role of taxation changed in the
course of many decades and centuries, when economic relations became more complex and the need for
the intensification of the state’s regulatory role became more stringent.
As a result, new taxation theories emerged; among them there were two directions of economic thought,
which had the most significant influence on the taxation policy of the countries with a developed market
economy: the Keynesian and the neo-classical ones.
Keynesian taxation theory
The initiator of the Keynesian taxation theory was John Keynes, who exposed its main principles in his
book “The General Theory of Employment, Interest and Money,” in which he advocated state
interventions in the processes of market economy regulation. According to Keynes, fast economic
development must be based on a market expansion and an associated increase in consumption.

As a result, state intervention is achieved at the level of effective demand. One of the main assumptions
in Keynes’s theory is that economic growth is related to monetary savings only in conditions of full-
employment. In the contrary case, large amounts of savings hinder economic development as they
represent a passive form of income and are not invested in production; as a result the author suggested
that surplus savings must be subtracted with the help of taxation.
This is why the state must intervene with the purpose of subtracting income savings with the help of
taxation in order to finance investments and cover state expenditures. Keynes argued that high level
progressive taxation is necessary and that low tax rates lead to reduced state revenues and as a result
contribute to economic instability. That is, according to Keynes taxes must play the most important role
in the system of state regulation. High taxes stimulate economic activity; influence the stability of the
economy and in the context of the economic system act as “integrated flexibility mechanisms.”
Neo-classical theory
The neo-classical theory developed by J. Mutt, A. Laffere, and others is based on the assumption that
the state is obligated to remove obstacles to free market competition because the market can and must
regulate itself without external intervention; in addition, it can achieve economic equilibrium.
Hence, this theory differs from the Keynesian one and assigns a rather passive role to state regulation of
economic processes. According to this theory, taxation policy should be developed under the same
assumptions: taxes must be as small as possible and corporations should be granted significant tax
exemptions.
Otherwise, a high tax burden would hinder economic activity and restraint the investment policies of
corporations, which would lead to a downfall in the production funds renewal and in an economic
recession. A restricted taxation policy would allow the market to provide independently for fast
development and would lead to a significant expansion of the taxation basis.
Arthur Laffer contributed considerably to the neoclassical taxation theory. He established a quantitative
relationship between progressive taxation and budget revenues, and developed the so-called “Laffer
curve.” According to Laffer, an increase in the tax burden leads to an increase in state revenues only up
to a level, where they start to decrease. The higher the tax rate, the higher the motivation for tax evasion.
When the tax rate reaches a certain limit, entrepreneurship incentives are suppressed, the motivations for
production expansion are reduced, taxable income decreases, and as a result, a part of the taxpayers will
transfer from the legal to the shadow sector of the economy. Laffer considered that 30% of income is the
maximum taxation rate that can be deducted for state budget purposes.
Neo-Keynesian theory
Taxation problems also constitute an important element of the neo-Keynesian theory. I. Fisher and N.
Caldor considered necessary the division of taxation objects in accordance with consumption, by taxing
the final cost of the consumed product and by taxing savings only as a % of the deposit.
This led to the idea of a consumption tax, which is simultaneously a method for promoting savings and a
tool for fighting inflation. The money assigned earlier for the purchase of consumer goods could now be
used either for investments or for savings, which are transformed in capital investments with the help of
the same budget policy—“the subtraction of the surplus savings.” Long-term savings in themselves
serve as a factor for future economic growth.
Caldor considered that the consumption tax introduced through progressive rates with the use of
exemptions and tax allowances for separate types of goods (for example, for objects of everyday use), is
more just for people with low incomes than a fixed sales tax. In addition, in comparison to the income
tax, the consumption tax does not cover savings that are necessary for future investments, thus
stimulating their growth.
Chapter 2 Taxation Elements
1. The Subject and Object of Taxation
2. Taxation Allowances
3. Tax Rates and Other Tax Elements
1. The Subject and Object of Taxation
The taxation subject is the individual or company, fulfilling taxation obligations in accordance to the
ownership of the taxation object. Every citizen of a state is a taxation subject. If the state has the right to
deduct a part of the income, this relates to the obligation of each citizen to offer a part of his/her wealth to the
state. In this context, one should not forget about the distinction between the taxpayer and the tax carrier. The
former is the entity that initially pays the tax; the latter is the entity carrying the tax as a result of economic
processes and transfers. This takes place primarily at the deduction of secondary taxes. For example, taxation
subjects are responsible for paying the VAT, yet the real carriers of the tax are the consumers.

The taxation object is the object or phenomenon, which, according to the law, is being taxed. Taxation
objects can be classified in the following way: income (income tax), wealth (real estate, land), wealth
transfers (inheritance and gift tax), consumption (excises and VAT), or the import and export of goods
(customs duties). Income taxation is divided into the taxation of earned and unearned income. Earned income
tax relates to salaries, fees of people engaged in freelance occupations, the income of individual juridical
persons. Taxation of unearned but legal income refers to dividends, interest revenue, capital expansion, land
and real estate rents. The taxation object materializes as a result of legal events (actions, events, conditions),
which affect the obligation of the subject to pay the tax: the sale of goods, works and services; the transit of
goods though a customs territory, ownership of wealth, the receipt of inheritance rights, the receipt of
revenue in one or another form.
2. Tax Allowances
A tax allowance is a full or partial reduction of the taxation burden in correspondence with the
legislation in force. In the international practice, the system of allowances and reliefs has been formed a long
time ago. Individual income is taxed only after it reaches a certain level (which is the non-taxable income).
Additional sums for the maintenance of each dependant, expenditures for the support of infants and elderly,
for medical services that cost over a certain amount, for charitable donations and for education expenses are
subtracted from the taxed income.
It is possible to develop a certain systematization of tax allowances. These can be classified into
permanent and temporary allowances. Temporary allowances are granted to adolescents, refugees,
foreigners, and people without a permanent residence in the given state but who are there only temporarily.
Permanent tax allowances are granted to people, who are fulfilling other obligations or who have earned
special merits with the state.
Tax allowances provide for the financial-economic stimulation of the economic activity of the taxpayer
through the reduction of the taxation burden obligations. Tax allowances form an important element of the
taxation policy and entail social and economic goals. For example, in the sphere of international economic
relations, tax allowances are widely used as an incentive for exporters and foreign investors. Tax allowances
are usually implemented through the taxation obligation of the payer, but sometimes this is done through the
extension of the payment deadline, which is also a reduction in the taxation obligation. Tax allowances
include the following types:
1) The untaxed minimum
2) Exempting from taxation certain elements of the object
3) Exempting from the payment of taxes certain natural persons or categories of payers

4) The reduction of the tax rate
5) Full tax relief, and others.
The tax amount can be reduced either partially or entirely, for a limited or unlimited period of time. The
exemption from tax for a certain period of time is called a tax break. The process of appropriation removes
certain objects from being covered by taxation. Appropriation can be relevant permanently or temporarily,
for all taxpayers and for certain categories. Tax discounts are aimed at the reduction of the taxation basis.
Depending on the influence on the results of taxation, discounts can be divided into limited discounts (the
size of the discount is limited directly or indirectly) and unlimited discounts (the taxation basis can be
reduced up to the full amount of the payer’s expenditure).
Tax credits are allowances aimed at the reduction of the tax amount and of the taxed sum. The tax
credit takes the form of accounting for previously paid taxes and is used in order to avoid double taxation (a
credit for foreign tax). Tax amnesty is the return of the paid tax sum, a part of it, or the exemption of the
taxpayer from financial sanctions for a certain period of time.
Preferences are a special (preferential) type of allowance offered by one state to another on basis of reciprocity
or unilaterally without impact on a third party. Most often this happens in the form of discounts or relief from
customs duties. Preferential regimes are established by developed countries towards developing countries in
the framework of the Global System of Preferences.
3. Tax Rates and Other Elements of Taxation
The tax rate is the size of the tax set per unity levied. There are fixed and percentage rates.
Percentage rates are classified can be proportional, progressive or regressive. It is important to emphasize
the notion of base (main) rate, i.e. the rate that does not take into account the specific characteristics of the
subject or the type of activity levied (ex. VAT 24%). There is also the reduced rate, which takes account of
the specific traits of the payer and applies a reduced taxation burden, and the increased rate, which again
takes into consideration the specific activity type that leads to income creation and applies an increased
rate. Tax rates can also be classified as follows:
* Value added rates—expressed in percentages (income tax)
* Specific rates—expressed in a monetary form in conformity with the physical features of the objects levied
(ex. the land tax).
In terms of content, there are marginal, factual and economic rates. A marginal rate is indicated directly
in the taxation legislation (ex. income tax for a company of 28%). The factual rate is defined as the relation

between the paid tax amount and the total amount of income received. The comparison of economic rates
most adequately represents the consequences of taxation.
The taxation basis is the part of the taxation object expressed in levied units, to which a tax rate is
applied in correspondence with the law. For example, when income is taxed, not all of it will serve as the
taxation basis, but only a part of it—the taxable income. In a number of cases the taxation basis is factually a
part of the object levied, to which the tax rate is applied. But this is relevant only in the cases where the
taxation object is directly conducive to and allows for a calculation measure. Thus, the taxable profit can be
expressed directly in monetary units. In contrast, the majority of the taxation objects cannot be expressed
directly in taxation units. In order to measure the object, it is necessary to first select some physical feature,
i.e. to determine the measuring unit of taxation. For example, the taxation object for car owners is the car
itself. Different countries have various parameters of levying: in France it is the power of the engine, in
Holland—the weight of the car, in Germany—the volume of the operating cylinders of the engine. In these
cases, the taxation basis cannot be determined as the part of the taxation object.
Tax payment deadlines are dates indicated in the law, when payments have to be made to the state or
local budgets, as well as to extra-budgetary funds. Missing the deadline automatically leads to penalties,
irrespective of the identity of the taxpayer who missed the deadline.
The source of tax payment is a resource used for paying the tax. The source is different from the object
and does not always correspond to the latter. Irrespective of the taxation object, the source of the tax payment
can only be the net income (profit) or the capital of the taxpayer. Thus, the object of the land tax is land
ownership and the taxed item is the specific piece of land.
Chapter 3 Tax Rate Establishment and Tax Collection
1. Tax Rate Establishment and Tax Collection Procedures
2. Tax Collection Methods. Tax Debt Payment Methods
1. Tax Rate Establishment and Tax Collection Procedures
When introducing one or another type of tax, it is necessary to identify the taxpayer of the given tax and the
source to be levied. Then, the exact taxation object is determined (income, wealth, sale of
merchandise etc., it should be remembered that one object cannot be taxed through multiple taxes or
charges, except when indicated in the law) together with the calculation method of the tax. The tax rate

depends on the sum that needs to be collected and the number payers. Next, the tax collection
method is established.
The taxation basis and the method of its determination, as well as the tax rates and payment deadlines are
determined for each tax or charge in the law on the given tax or charge.
Tax payment is the obligation of each taxpayer. The financial relations between the state and the taxpayer are
reflected in the tax obligation. The tax obligation is the condition that obligates the taxpayer to pay the
given tax or charge and grants the taxation authorities the right to demand the fulfillment of this
obligation by the taxpayer.
The fulfillment of the tax obligation is achieved through paying the established tax or charge amount within
the stipulated deadline. The fulfillment of the tax obligation is mandatory and is executed irrespective
of other obligations that the taxpayer may be subject to. This obligation covers the entire wealth of the
taxpayer. Full or partial tax evasion constitutes sufficient grounds for applying a punishment to the
taxpayer, which usually takes the form of a fine.
The payment is executed in cash or through a bank account in the national currency. Surplus payments or
subtractions can be directed for upcoming taxes payable. It is acceptable to exchange tax and state
obligations between the state and a certain taxpayer. If the payment deadline is missed, a penalty is
applied. The methods of payment are cash, bank transfers, or duty stamps.
If the taxpayer does not comply with the request of the taxation authority to pay the tax or charge amount, the
taxation authority has the right to block the operations of the indebted person by freezing the bank
accounts or by arresting the person’s property, and to unconditionally subtract the tax amount from the
bank account funds or from the sale of the arrested property.
2. Tax Collection Methods
There are three tax collection methods: cadastral, at the source (before the receipt of the income) and
through self-assessment (at the declaration of the income).
The cadastre method implies the use of the cadastre. The cadastre is a register of all the typical objects (land,
real estate) classified according to physical features and where the average profitability of the object is
determined. Physical features include: for the land tax—the size of the land area, the distance from

transportation ways and markets; for the house tax—the number of windows, pipes, doors, the type of
the building; for industry tax—the number of employees and machines. The average profitability of the
object, which is based on physical features, may differ significantly from actual profitability; this
constitutes the main disadvantage of this method. This method is used for land tax.
Taxation at the source is calculated and deducted at the accounting unit of the company, which pays the
income of the taxation subject. In this way is deducted the tax from wages and salaries. The tax is
subtracted by an intermediary—the collector (tax agent) before the receipt of the tax by the subject,
which excludes the possibility of tax evasion. Collection at the source is done for taxing income of
employed personnel and for other relatively fixed incomes. The same method is used in other countries
for the income of joint ventures. Tax collection at the source implies collection before the receipt of the
income by its owner.
Tax collection upon self-assessment represents the deduction of a part of the income after its receipt and
implies that the taxpayer submits to the taxation authorities a self-assessment, i.e. an official statement
about the income received. Taxation authorities, taking into consideration the size of the taxation object
and the taxation rates, verify the accuracy of tax calculations. This method is usually applied for the
taxation of non-fixed revenues and for the cases when the taxpayer has multiple income sources. Self-
assessment collection is convenient for the taxpayers because it creates conditions for tax evasion due
to the weakness of the taxation apparatus and due to commercial confidentiality.
This method entails a number of variations: 1) in advance payments during the taxation period, when the
state receives an approximate amount estimated on the basis of the income earned during the previous
period or on basis of the tax paid; 2) payment by the taxpayer at the due date on basis of self-
assessment at the time or after the presentation of the income self-assessment: the tax payer
independently subtracts the tax amount and transfers it to the state; 3) additional payments determined
by the tax authority required after the examination or verification of the submitted self-assessment.
Chapter 4 Types of Taxes
1. Principles of Tax Classification
2. Characteristics of Direct Taxes
3. Characteristics of Indirect Taxes

1. Principles of Tax Classification
The existing taxation system includes various types of taxes, which defer from one another in form and
content. In practice, tax classification is done according to various criteria:
II. In accordance with the collection method:
1. Direct taxes which are determined directly for the income or wealth (income tax, land, individual tax,
real estate tax, and others)
2. Indirect taxes which are applied to goods and services in the form of an addition to the price or tariff
(VAT, excises and the customs duty).
III. In accordance with the taxation object
1. Income tax (profit tax, income tax for natural persons)
2. Taxes on wealth (individual tax, real estate tax, inheritance and gift tax)
3. Consumption tax (VAT, excises, customs duties)
IV. In accordance with the objectives set:
1. Fiscal, aimed at the formation of the state budget
2. Limiting (excises and customs duties)
V. In accordance with the taxation subject—individual and corporate taxes
VI. In accordance with the entity, which deducts the tax and disposes of it:
1. State taxes, determined by state legislation, transferred into the state budget and applied in the same
way for the entire territory: income tax, VAT, excises, customs duties, individual tax and charges for
the Road Fund.
2. Local taxes collected by the local authorities of the corresponding territory and transferred to the local
budget: real estate tax, land tax, natural resources charges and local charges.
VII. In accordance to the purpose of utilization:
1. General taxes are amalgamated and transferred to a single state account; they are directed for general
state programmes. General taxes encompass the majority of the taxes in any taxation system.
2. Special (purpose) taxes have a strictly defined purpose and are aimed for a certain type of expenditures
(land tax, road tax, natural resources charges). As a rule, special extra-budgetary funds are created for
the special purpose taxes and a special article for this type of tax is introduced in the budget law itself.
2. Direct Tax Characteristics
Chronologically, the mechanisms for direct taxation appeared earlier tat those for indirect taxation. The
criterion for dividing taxes into direct and indirect ones is the possibility to transfer them to the
consumer. This criterion is based on the assumption that the final payer of the direct tax is the owner

of the taxed property or the earner of the taxed income, while the final payer of the indirect tax is the
consumer of the good, to the price of which the tax is added. Direct taxes constitute the basis of the
taxation system. Historically, having appeared later than the direct taxes, indirect taxation mechanisms
are transformed into a more palpable channel for the provision of state budget revenues, i.e. for
covering the expenses of the state.
Direct taxes are divided into real and individual ones. Real taxes are applied to the sale, purchase or
ownership of wealth, and their deduction does not depend on the individual financial capacity of the
taxpayer (land tax, wealth tax, real estate tax). In contrast, individual taxes take into consideration the
financial status of the taxpayer and his/her capacity to pay (profit tax, individual income tax, the tax for
returns on capital).
There are two methods for distinguishing direct and indirect taxes:
1. In correspondence with the payment indices: direct taxes are paid and carried by the same entity,
while indirect taxes are carried by one person and paid by another one.
2. On economic basis: direct taxes are subtracted from the production of valuables, i.e. from income or
wealth, while indirect taxes are applied to the consumption of valuables.
Direct taxes are the most progressive form of taxation because their deduction takes into consideration the
income and family situation of the taxpayer. When paying direct taxes, the payer can determine the
exact tax amount, the tax rate, as well as the strictly applied deadlines. Yet, for indirect taxation, the
buyers of various goods usually do not know exactly when and how much they are paying to the state
through indirect taxes.
Direct taxes are divided into real and individual ones. Real taxes comprise the land, housing, and industrial
tax. Real taxes were widely used in the period when land was the main form of wealth. This is when the
land tax was introduced in Europe. Various methods were used for the calculation of this tax, including
the number of ploughs, the area of the processed lands, and others. These criteria did not allow,
however, an accurate determination of the purchase price of land.
With time, buildings became an important taxation base; this is why the house tax was introduced. The size
of this tax was determined on the basis of the following criteria: number and purpose of rooms, number
of doors, and windows. However, these criteria could not insure the fairness of taxation; this is why the
level of income and the family situation started to be taken into consideration.

In the second half of the 19th century, a transition to individual taxes started to happen. Individual taxes are
income or wealth taxes collected at the source or on basis of a self-assessment. For the collection of
individual taxes, objects are considered individually for each payer. This involves taking into
consideration the size of the income, family situation and other factors. Direct taxes include the income
tax, land tax, real estate tax, road charges and the state tax.
3. Indirect Taxes Characteristics
The formation of the budget revenues entails the collection not only of direct, but also of indirect taxes. In
developed countries the relative weight of indirect taxes is usually lower than that of direct ones, while
in developing countries—the opposite occurs. Indirect taxes are applied to goods and services and take
the form of an addition to its price or tariff. The payers of indirect taxes are the buyers or the
consumers. All the citizens, independently of their income pay indirect taxes because they consume
goods and services necessary for survival and which are chargeable to indirect taxation.
Indirect taxes are the simplest to collect and are also difficult to evade by the taxpayer. These taxes are also
attractive to the government for the reason that their receipt does not depend directly on the financial-
economic activity of the taxation subject, and the fiscal effect is achieved even in conditions of
production downfalls and unprofitable periods of enterprises.
At the same time, the state has to apply direct taxes as well such that taxation covers as many activities of the
taxpayer as possible: processes that create the material and technical basis for economic activities, the
wealth of enterprises, the work force, the resources used in production, and the income. This creates a
rather stable inflow of tax payments and also increases the causality between the amount of taxes paid
and the effectiveness of the taxpayer.
Indirect taxes are divided into excises, state fiscal monopoly, and customs duties. Excises can be either
individual or universal. A good example of a universal excise is the VAT, which is used in the world
taxation system since the end of the 60-ies. Individual excises are applied to certain types and groups of
goods. Customs duties are applied in most countries only to imported goods. Usually, exporting goods
is not taxed through a customs duty.
Fiscal monopoly taxes are applied for the state production of goods (ex. salt, matches, spirit).
Customs duties are classified into export, import and transit duties. In most countries import taxes constitute
the largest part of customs duties.

The advantages of indirect taxes include the following:
1) They increase the state revenue as a result of an increase in the population number or in its wealth. This is
most advantageous for the countries that face economic progress.
2) By influencing the consumption rate through increasing the price of one product or another, the state
limits the consumption of products that are dangerous for health.
3) Taxes are received as a payment for the good, as they are added to the price.
4) For the consumer, indirect taxes are convenient for the following reasons:
• Insignificance of the amounts paid
• Time convenience
• The lack of a constraining factor
• The lack of time requirements for making the payment
• Does not require the accumulation of a certain sum.
The evolution of indirect taxes, according to many experts, is a general tendency covering essential as well as
luxury goods, or instead of taxing a large number of items it concentrated on a selected few.
Chapter 5 Taxation Principles
1. Ethical basis of taxation
2. Adam Smith’s Canons of Taxation
3. Modern taxation principles
4. Principles of taxation in Romanian Fiscal Code
1. Ethical basis of taxation
Taxes are justified because they fund activities that are necessary and beneficial to society. Additionally,
progressive taxation can be used to reduce economic inequality in a society.
The payment of taxation is justified as part of the general obligations of citizens to obey the law and support
established institutions.

• Social democrats generally favor higher levels of taxation to fund public provision of a wide range of
services such as universal health care and education, as well as the provision of a range of welfare
benefits.
• Many libertarians recommend a minimal level of taxation in order to maximize the protection of
liberty.
• Compulsory taxation of individuals, such as income tax, is often justified on grounds including
territorial sovereignty, and the social contract.
• Social contract describes a broad class of theories that try to explain the ways in which people form
states and/or maintain social order.
• The notion of the social contract implies that the people give up some rights to a government or other
authority in order to receive or maintain social order through the rule of law. It can also be
thought of as an agreement by the governed on a set of rules by which they are governed.
• Social contract theory formed a central pillar in the historically important notion that legitimate state
authority must be derived from the consent of the governed.
• The starting point for most of these theories is a heuristic examination of the human condition absent
from any structured social order, usually termed the “state of nature”. In this condition, an individual’s
actions are bound only by his or her personal power, constrained by conscience.
• From this common starting point, the various proponents of social contract theory attempt to explain, in
different ways, why it is in an individual’s rational self-interest to voluntarily give up the freedom
one has in the state of nature in order to obtain the benefits of political order.
• Thomas Hobbes (1651), John Locke (1689) and Jean-Jacques Rousseau (1762) are the most famous
philosophers of contractarianism, which formed the theoretical groundwork of democracy and
republicanism.
• Defenders of business taxation argue that it is an efficient method of taxing income that ultimately
flows to individuals, or that separate taxation of business is justified on the grounds that commercial
activity necessarily involves use of publicly established and maintained economic infrastructure, and
that businesses are in effect charged for this use.
• Georgist economists argue that all of the economic rent collected from natural resources (land, mineral
extraction, fishing quotas, etc.) is unearned income, and belong to the community rather than any
individual. They advocate a high tax (the "Single Tax") on land and other natural resources to return this
unearned income to the state, but no other taxes.

• Georgism, named after Henry George (1839-1897), is a philosophy and economic ideology that holds
that everyone owns what they create, but that everything found in nature, most importantly land, belongs
equally to all of humanity
Opponents of taxation
• Because payment of tax is compulsory and enforced by the legal system, some political philosophies
view taxation as theft, or tyranny, accusing the government of levying taxes via force and coercive
means.
• The view that democracy legitimizes taxation is rejected by those who argue that all forms of
government, including laws chosen by democratic means, are fundamentally oppressive. According to
Ludwig von Mises, "society as a whole" should not make such decisions, due to methodological
individualism.
• Libertarian opponents of taxation claim that governmental protection, such as police and defense forces
might be replaced by market alternatives such as private defense agencies, arbitration agencies or
voluntary contributions.
• Walter E. Williams, professor of economics at George Mason University, stated "Government income
redistribution programs produce the same result as theft. In fact, that's what a thief does; he redistributes
income. The difference between government and thievery is mostly a matter of legality."
• Taxation has also been opposed by communists and socialists.
• Karl Marx assumed that taxation would be unnecessary after the advent of communism and looked
forward to the "withering away of the state".
• In socialist economies such as that of China, taxation played a minor role, since most government
income was derived from the ownership of enterprises, and it was argued by some that taxation was not
necessary.
• While the morality of taxation is sometimes questioned, most arguments about taxation revolve around
the degree and method of taxation and associated government spending, not taxation itself.
• In economics, the excess burden of taxation, also known as the distortionary cost or deadweight loss
of taxation, is the economic loss that society suffers as the result of a tax, over and above the revenue it
collects.
• It is assumed that distortions occur because people or firms change their behaviour in order to reduce the
amount of tax they must pay.
• Excess burdens were first discussed by Adam Smith.

2. Adam Smith’s Canons of Taxation
The Adam Smith's four maxims of taxation (put forward over two hundred years ago) may be considered as a
starting point for modern principles of taxation which will form the basis of a tax system which is simple, just
and lasting.
These principles are founded on a philosophy which does not accept the theory of the "social contract" as the
basis for society. Under that theory, every citizen is deemed to have contracted with the state to become a
member of society and assume the benefits and burdens of such membership. Under that theory, the taxpayer is
already deemed to have agreed to pay the taxes levied on him; and there are consequently no natural limits on
the power of the state to tax him.
Adam Smith is generally considered (certainly in the English speaking world) to be the father of modern
political economy. In "The Wealth of Nations" (1776) he set forth four maxims, or canons, of taxation, saying
that "the evident justice and utility of (these) maxims have recommended them more or less to the attention of
all nations.
The maxims were as follows:
I. The subjects of every state ought to contribute towards the support of the government, as nearly as possible,
in proportion to their respective abilities; that is, in proportion to the revenue which they respectively enjoy
under the protection of the state.
II. The tax which each individual is bound to pay ought to be certain, and not arbitrary. The time of payment,
the manner of payment, the quantity to be paid, ought all to be clear and plain to the contributor, and to every
other person.
III. Every tax ought to be levied at the time, or in the manner, in which it is most likely to be convenient for the
contributor to pay it.
IV. Every tax ought to be contrived as both to take out and to keep out of the pockets of the people as little as
possible over and above what it brings into the public treasury of the state.
Canons Explanations
I. The subjects of every state ought to
contribute towards the support of the
government, as nearly as possible, in
Maxim I, it is the most controversial. It appears to be
justifying the "ability to pay" principle; but whoever
heard of taxing people according to inability to pay? In

proportion to their respective abilities;
that is, in proportion to the revenue which
they respectively enjoy under the
protection of the state.
fact the ability to pay principle gets us no further
forward. Does it, for example, require a proportional
income tax or a progressive income tax?
II. The tax which each individual is
bound to pay ought to be certain, and not
arbitrary. The time of payment, the
manner of payment, the quantity to be
paid, ought all to be clear and plain to the
contributor, and to every other person.
Maxim II makes it clear that the requirement of
certainty means certain to the man in the street -- to all
of us, not just to the "tax profession". If any society is
to cohere, its members must know and be capable of
understanding their basic rights under the society's
constitution. Likewise, a society's tax system must be
known and understood by all its adult members;
otherwise, they cannot play their part to the full, and
we are all the worse for it.
III. Every tax ought to be levied at the
time, or in the manner, in which it is most
likely to be convenient for the contributor
to pay it.
Maxim III is self-explanatory, but universally ignored.
It is somehow presumed that inconvenience in payment
is legitimised by the fact that the government is
democratically accountable - as if this gives the
government carte blanche to do what it likes.
IV. Every tax ought to be contrived as
both to take out and to keep out of the
pockets of the people as little as possible
over and above what it brings into the
public treasury of the state.
Maxim IV provides grounds alone for condemning our
tax systems on the grounds of efficiency. Not only does
the government have to employ armies of inspectors
and assessors, investigators, prosecutors and other
officials (including judges), the poor taxpayer is forced
by economic circumstances --to stay competitive he
must take full advantage of the tax system -- to engage
teams of tax managers, advisors, accountants and
lawyers at his own expense. The costs of all these
people mean that there is a large difference between the
revenue to the government (net of administration
expenses) and the total outlay by the taxpayer.

3. Modern taxation principles
These four maxims have been summarized in four words:
• Equity,
• Certainty,
• Convenience and
• Efficiency.
If we measure our existing tax systems against these four maxims arid according to these criteria, we can see
just how far they fall short of the ideal.
• Most believe that a tax system should follow two main principles: fairness and efficiency, derived from
the ADAM SMITH'S FOUR MAXIMS.
• Economists consider two principles of fairness to determine whether the burden of a tax is distributed
fairly: the ability-to-pay principle and the benefits principle.
• In addition to being fair, a good tax system should be efficient, wasting as little money and resources as
possible. Three measures of efficiency are administration costs, compliance costs, and excess burden.
A. Fairness: 1. the ability-to-pay principle
2. the benefits principle
B. Efficiency: 1. administration costs
2. compliance costs
3. excess burden
A. Fairness
Which is fairest—a proportional, progressive, or regressive system? There is no scientific way to
resolve this question.
The answer depends on ethical and philosophical judgments, such as whether a society has the right to
take income from one group of people and give it to another.
A progressive, proportional, or even slightly regressive system all can achieve vertical equity’s
requirement that a richer person should pay more in taxes than a poorer person. Most industrialized
nations have progressive income tax systems, which impose a heavier tax burden as one’s income
increases. In the United States, the individual income tax system divides taxable income into different
tax brackets—ranges of income with different tax rates.

• Some economists consider sales taxes regressive because individuals with higher incomes spend a
smaller proportion of their incomes on sales taxes than those with lower incomes. A poor person and a
rich person who spend the same amount on groceries each year will pay the same amount in sales taxes,
even though the rich person earns more money. However, rich people consume more than poor people,
and studies of people’s spending patterns reveal that, over the course of a lifetime, the rich person will
pay roughly the same proportion of his or her income in sales taxes as the poor person.
1. Ability-to-Pay Principle
• The ability-to-pay principle holds that people’s taxes should be based upon their ability to pay, usually
as measured by income or wealth. One implication of this principle is horizontal equity, which states
that people in equal positions should pay the same amount of tax.
• If two people both have incomes of $50,000, then horizontal equity requires that they pay the same
amount of tax. Suppose, however, that two individuals both have incomes of $50,000, but one has a lot
of medical bills and the other is healthy. Are they in equal positions? If not, then perhaps the tax burden
of the person with medical bills should be reduced. But by how much? And how does a person
document to tax authorities that he or she is truly paying medical costs, and not just pretending in order
to lower the tax bill? This example illustrates a fundamental dilemma in tax design: Fairness is often the
enemy of simplicity.
• A second requirement of the ability-to-pay principle is vertical equity, the idea that a tax system should
distribute the burden fairly across people with different abilities to pay. This idea implies that a person
with higher income should pay more in taxes than one with less income. But how much more? Should
families with different incomes be taxed at the same rate or at different rates?
• Taxes may be proportional, progressive, or regressive. A proportional tax takes the same percentage of
income from all people. A progressive tax takes a higher percentage of income as income rises—rich
people not only pay a larger amount of money than poor people, but a larger fraction of their incomes. A
regressive tax takes a smaller percentage of income as income rises—poor people pay a larger fraction
of their incomes in taxes than rich people.
2. Benefits Principle
• The benefits principle of taxation states that only the beneficiaries of a particular government program
should have to pay for it. The benefits principle regards public services as similar to private goods and
regards taxes as the price people must pay for these services. The practical application of the benefits
principle is extremely limited, because most government services are consumed by the community as a

whole. For example, one cannot estimate the benefit received by a particular individual for general
public services such as national defense and local police protection.
• One can make a case that, for some taxes, there is a relationship between taxes paid and benefits
received. Gasoline taxes, for example, are used to finance highway construction. But even here, the link
between taxes and benefits is weak. Some drivers have more fuel-efficient cars than others. They may
use the roads as much as other drivers, but buy less gasoline and thus pay less tax. Merchants who
operate stores along the sides of highways benefit from the presence of the roads, but the benefit has
nothing to do with the merchants’ gasoline consumption. Despite its intuitive appeal, the benefits
principle is not important in practice, and it plays little role in the design of tax systems.
B. Efficiency
1. Administration Costs
Running a tax collection authority costs money. The government must hire tax collectors to gather revenue, data
entry clerks to process tax returns, auditors to inspect questionable returns, lawyers to handle disputes, and
accountants to track the flow of money. No tax system is perfectly efficient, but government should strive to
minimize the costs of administration.
2. Compliance Costs
Complying with the system—paying taxes—costs taxpayers money above and beyond the actual tax bill. These
costs include the money that people spend on accountants, tax lawyers, and tax preparers, as well as the value of
taxpayers’ time spent filling out tax returns and keeping records.
3. Excess Burden
A third measure of a tax system’s efficiency takes into account the fact that when the government levies a tax
on a good, it distorts consumer behavior—people buy less of the taxed good and more of other goods. Instead of
choosing what goods to buy solely on the basis of their intrinsic merits, consumers are influenced by taxes. This
tax-induced change in behavior is called an excess burden. The larger the excess burden of a tax, the worse it is
for efficiency.
Taxes on labor can also lead to excess burdens. When the government taxes people’s labor (through an income
tax), people may decide to change the number of hours that they work. The tax distorts their choice between
working and leisure Not every tax generates an excess burden. Consider a lump-sum tax—a fixed amount of
money that all taxpayers must pay regardless of their circumstances. If the government levies a tax of $1,000 on
each citizen, regardless of what he or she buys or earns, the only way to avoid paying the tax is to leave the

country or die. Citizens cannot avoid the tax by changing their behavior. Because it does not distort behavior, a
lump-sum tax has no excess burden—it is perfectly efficient. However, most people would perceive such a tax
as extremely unfair because it disregards individual circumstances such as a person’s ability to pay. Thus, the
principles of fairness and efficiency conflict: fairness comes at the cost of efficiency. Each society must find the
best tradeoff between fairness and efficiency, given the ethical beliefs of its citizens.
4. Principles of taxation in Romanian Fiscal Code
The taxes and fees governed by the Romanian Fiscal Code are based on the following principles:
a) neutrality of the fiscal measures as regards the various categories of investors and capital, forms of
ownership, by ensuring equal conditions for investors and for Romanian and foreign capital;
b) certitude of taxation, by developing clear legal norms, that do not lead to arbitrary interpretations, while the
deadlines, manner and amounts payable are clear for each payer, respectively such payers may follow and
understand their fiscal burden and may determine the impact of their financial management decisions on their
fiscal burden;
c) fiscal equity at the level of physical persons, by different taxation of incomes based on the size of the
incomes;
d) efficiency of taxation by providing long-term stability of the provisions of the fiscal code, so that such
provisions do not to lead to unfavorable retroactive effects for physical and legal persons, in comparison with
the taxation in force on the date when they adopt major investment decisions.