mohamed harraz 2, maged gaber el-ghazouly 2 from€¦ · moreover, gc assisted by pca was deployed...
TRANSCRIPT
Egypt. J. Biomed. Sci. Vol. 34, �ovember, 2010.
1
Hierarchical Clustering of Commercial Chamomile Oil, A Quality
Assessment Approach
BY
Amira Roushdy Khattab1, Mohamed Abou-shoer
2, Fathallah
Mohamed Harraz2, Maged Gaber El-Ghazouly
2
FROM 1 Department of Pharmacognosy, Faculty of Pharmacy, Pharos University,
Alexandria, Egypt and 2 Department of Pharmacognosy, Faculty of Pharmacy,
Alexandria University, Alexandria.
Chamomile oil has always been characterized and standardized in many
compendial and non-compendial monographs as configured by the specified critical
values for few particular constituents such as the bisabolol oxides, (-)-α-bisabolol and
chamazulene. However, tagging the oil quality by its content of a limited number of
components oversimplifies not only the process of estimating the oil purity but also
the process of assessing its potency, and hence; the wholeness-value of the material
would not be treasured. In this study, an evaluation of the commercially available
chamomile oil was conducted using two different chromatographic techniques (TLC
and GC) and assisted by chemometrics while not being endured or bound by the
former quality-curbing markers. An innovative tool for visualizing the oils
compositional-quality has been developed via merging the analytical concept of HCA
with DE-TLC and GC profiles which will be of value in discriminating between the
various quality grades of the analyzed oil samples in a holistic rather than a
reductionistic approach.
The past few decades have witnessed an exploding market of phyto-
pharmaceuticals where herbal preparations are booming and rapidly evolving all over
the globe. The wonder plant chamomile has been recognized and gained its popularity
and importance from traditional and folkloric practices. Unsurprisingly, the
characteristically blue chamomile essential oil is considered as one of the most
notable phytochemical component accepted as a phyto-pharmaceutical product.
Chamomile oil is produced conventionally by steam distillation as endorsed in many
pharmacopoeias. It incorporates several chemical class entities including
sesquiterpenes (α-(-)-bisabolol known as levomenol, and bisabolol oxides A & B
≤( 78%), farnesene (12-28%) and chamazulene (1-15%)); and polyacetylene
derivatives, e.g. spiroethers (cis/trans-en-yne-dicycloethers (8–20%)) (McKay and
Blumberg, 2006). Reports on chamomile oil quality assessment have cited the use of
some physical parameters such as color, solubility, relative density, viscosity and
refractive index, as valuable parameters to judge the oils quality (Mihailo et al., 2007
and Cioanca et al., 2010). The deep blue colored chamazulene was also believed to be
an indication of the high oil quality (Orav et al., 2010). Several analytical techniques
ABSTRACT
I�TRODUCTIO�

Egypt. J. Biomed. Sci. Vol. 34, �ovember, 2010.
2
were put forth in the literature for the qualitative and quantitative assessment of the
oil. These include elemental micro-analysis, liquid sampling mass spectrometry
(LS/MS), TLC, GC-MS, and profiling by UV/VIS, IR and NMR (Mihailo et al.,
2007). In addition, an enantioselective HPLC method was developed for the
separation of the four stereoisomers of α-bisabolol and a RP-HPLC method was
reported to separate the isomeric en-yne-dicycloethers and chamazulene (Franke and
Schilcher, 2005).
The qualitative and quantitative chemical characteristics of chamomile oil have
revealed the existence of four different chamomile chemotypes, in terms of their
essential oil composition (Salamon, 2009 and Rubiolo et al., 2006). Nevertheless, the
British and European pharmacopoeias have declared in their chamomile oil
monographs that only two different types of chamomile oils are characterized; which
are either rich in bisabolol oxides, or rich in (-)-α-bisabolol (European
Pharmacopoeia, 2008 and British Pharmacopoeia, 2010). Unfortunately, this
statement is not in accordance with the previous practical findings and can't be
adopted as differentiating-quality-parameter as it will not account for or preclude
other chemotypes. The British pharmacopoeial monograph on chamomile oil, for
instance, assesses the chamomile oil qualitatively by TLC and quantitatively by GC
for its content of bisabolol oxides, (-)-α-bisabolol and chamazulene. A common
misconception generally encountered in the evaluation of natural products is that the
material is usually standardized according to specified critical limits of only few
constituents. Chamomile oil quality is normally assayed by measuring only the
percentages of few components which are 29-81% of bisabolol oxides, 10-65% of (-)-
α-bisabolol and ≥1.0% of chamazulene while overlooking any contribution from the
content of other naturally occurring constituents. More significantly and in addition,
the specified values fall in wide ranges which are not, anyhow, adequately decisive to
express quality. Furthermore, when quality is labeled by specifying few limits for
small number of components, it would, certainly, be insensitive to some products that
can be artificially or deliberately "tuned" by enrichment or spiking to meet the test
values. Accordingly, not only the purity can't be assessed but also the potency or
wholeness, of the preparation can't be envisioned especially when it is flawed.
As a rule, nature does not furnish products in a consistent, standardized
composition. Accordingly, the standardization and evaluation of a particular herbal
medicine should realistically imply strict and detailed quality control checks which
can efficiently guarantee its consistency within an acceptable flexible range for
natural variation. This can be attained only through using stringent chemical profiling
procedures that appreciate the holistic nature of the botanical products. Undoubtedly,
multivariate analysis (MVA) now poses as the only sound approach to explore and
put into practice the merits of the holistic setup to compose the complete formula
towards a satisfactory analytical protocol for the natural products evaluation.
Principal component analysis (PCA) of the 1H-NMR spectroscopic data of
chamomile flower extracts was employed as a tool to express the compositional
variability arising from different geographical localities, adulteration, methods of
sample handling (extraction methods, and drying processes) and material quality in
terms of the percentage of the desired plant part (Wang et al., 2004), in addition to the
discrimination between the flower head of Matricaria recutita L. and its common
adulterants which are Anthemis cotula L. and Chamaemelum nobile L. (Daniel et al.,
2007). Moreover, GC assisted by PCA was deployed in the differentiation between

Egypt. J. Biomed. Sci. Vol. 34, �ovember, 2010.
3
the different chemotypes of chamomile (Rubiolo et al., 2006). Furthermore, a cluster
analysis on the basis of ATR-IR data of chamomile oils was reported to be also
indicative to the different chamomile chemotypes and also the manufacturing
processes (Schulz et al., 2004).
The present study is devoted to introduce the application of multivariate analysis
in the domain of analyzing the chamomile oil as a raw material in the pharmaceutical
industry in order to profile its chemical composition and meticulously reveal its
quality attributes.
Oil samples
Fifteen different chamomile oil samples were collected from eight separate local
manufacturers (A, B, C, D, E, F, G and H). Additional four chamomile oil samples
corresponding to suppliers (I and J) were consumer-packed products purchased from
the local market. Different batches of the samples obtained from the same
manufacturer have been assigned numbered letter codes.
One chamomile oil sample K was produced in our laboratory by steam-distillation
of the commercially-available raw material in herbal stores as described in the EP
(2008). Samples A and B4, discretely, were oils with old manufacturing dates.
Reagents and Apparatus
- Solvents; methanol, ethanol, dichloromethane (CH2Cl2), ethyl acetate (EtOAc), and
toluene, and other chemicals as sulfuric acid and vanillin are analytical grade, and
anisaldehyde (Loba, Chemie, PVT, LTD) reference material.
- Chamomile oil sample solutions used in TLC analysis were prepared as 4% (v/v)
solutions in MeOH while their solutions used in GC analysis were prepared as 4%
(v/v) oil methanolic solutions containing 1% anisaldehyde.
- Vanillin-sulfuric spray reagent was prepared by dissolving 1.5 gm vanillin in 2%
ethanolic sulfuric solution.
- The solvent-system employed for TLC was CH2Cl2: Toluene: EtOAc (60:38:2).
- TLC analysis Equipment: Linomat CAMAG TLC sample applicator; Syringe
(100µl, CAMAG); Twin- trough TLC chamber for 20X20 cm plates from
CAMAG; TLC atomizer; Digital camera, Canon, PowerShot SX 100 IS, 8 MEGA
PIXELS, 10X optical zoom was used for capturing images for the sprayed
chromatograms. TLC plates-20X20 cm with 0.25 mm thickness, silica gel 60 F254
with aluminum support (E. Merck, Darmstadt, Germany).
Software
- The digital images of the TLC chromatograms were appropriately processed using
the image analysis software "Sorbfil TLC videodensitometer® version 2.0".
- The appropriately processed TLC and GC output data were studied by multivariate
analysis software program, Unscrambler®
X 10 from CAMO (Computer Aided
Modeling, AS, Norway).
METHODS - EXPERIME�TAL DATA
Egypt. J. Biomed. Sci. Vol. 34, �ovember, 2010.
4
TLC analysis
TLC analysis was performed by applying accurate volumes (4 µl) of the
chamomile oil methanolic solutions on 20X10 cm TLC silica gel plate as 4 mm bands,
4 mm apart and 1cm from the edge of the plate, using the CAMAG TLC applicator.
The plates were, then, developed for a distance of 9 cm in a chromatographic jar
saturated with the mobile phase. The plates were then air-dried and visualized by
vanillin-sulfuric reagent. The plates were heated at 150 ºC for 2 min. TLC images
were captured by the camera at a fixed distance of 19 cm.
GC analysis
GC analysis was performed using gas chromatograph "Hewlett Packard" Model
5890 Series II, equipped with flame ionization detector, split/splitless injector and a
15 m HP5 column, 0.32 mm ID, 0.25 um film thickness. The carrier gas was high
purity nitrogen and its flow rate was adjusted at 10 ml/min. Samples of 0.1 µl of the
prepared chamomile oil methanolic solutions, containing anisaldehyde as an internal
standard, were manually injected using split ratio of 1:10. The injector temperature
was set at 200 ºC and the detector temperature was maintained at 260 ºC. The oven
temperature was started off at 60ºC and programmed to increase at a rate of 10 ºC
/min up to 170 ºC followed by a rate of 15 ºC /min to 200 ºC. Peak areas and retention
time was measured by electronic integration with the HP 5890 Series II integrator of
the ChemStation software.
Data handling
TLC
- Multi-spectral scans were performed over the entire digital images of the TLC
chromatograms producing a matrix consisting of the area under each peak recorded
in the densitogram of each chamomile oil sample.
GC
- Each gas chromatogram was divided into six segments, containing all the
characterizing peaks of the chamomile oil. The chromatographic relative
normalized peak areas (calculated by using the internal standard peak area as the
reference area scale) in each chromatogram were used to construct the peak area
matrix.
The applied chromatographic techniques were designed to put forward an
educated guess that can picture, judge and guarantee its compositional integrity or
profile. Multivariate analysis was employed to disclose the embedded information in
the various generated data sets in order to reveal specific quality measures of the oil.
TLC
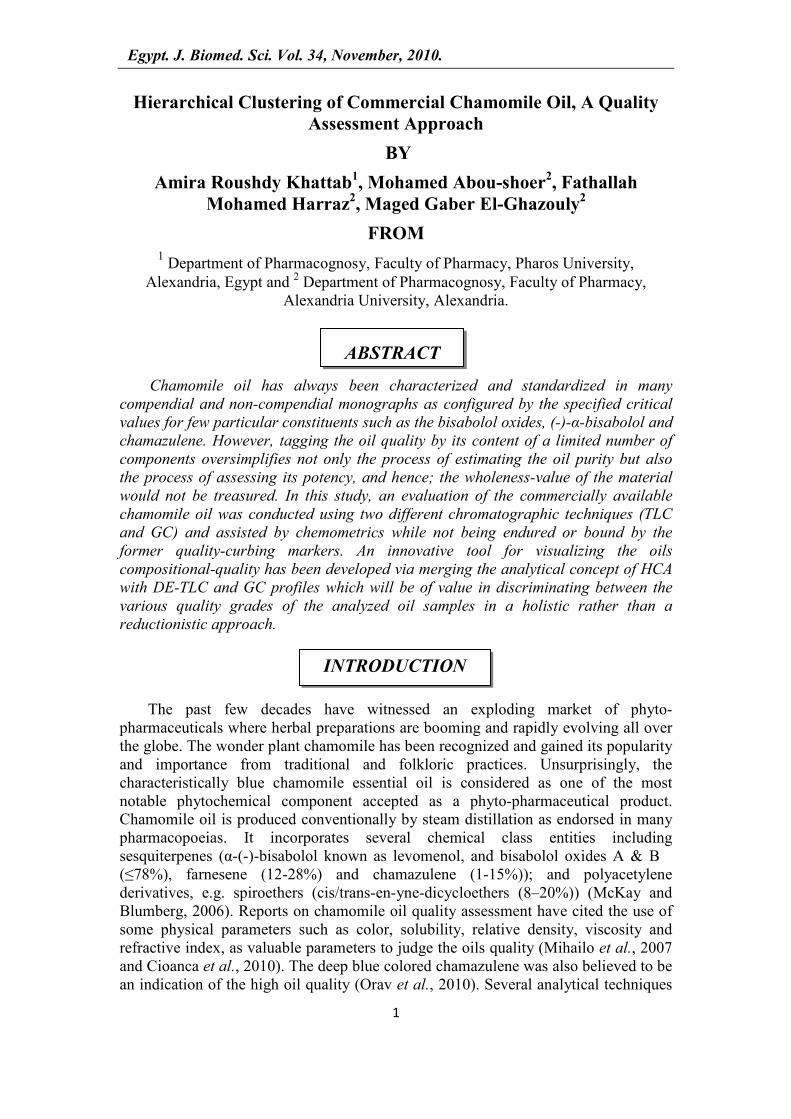
The TLC chromatogram image captured by the digital camera depicted in (Figure
1a) was appropriately processed and digitally converted into its corresponding
densitograms by Sorbfil videodensitometer®
software program. The densitometric
representations of all the oil samples, each oil in its respective track, were overlaid in
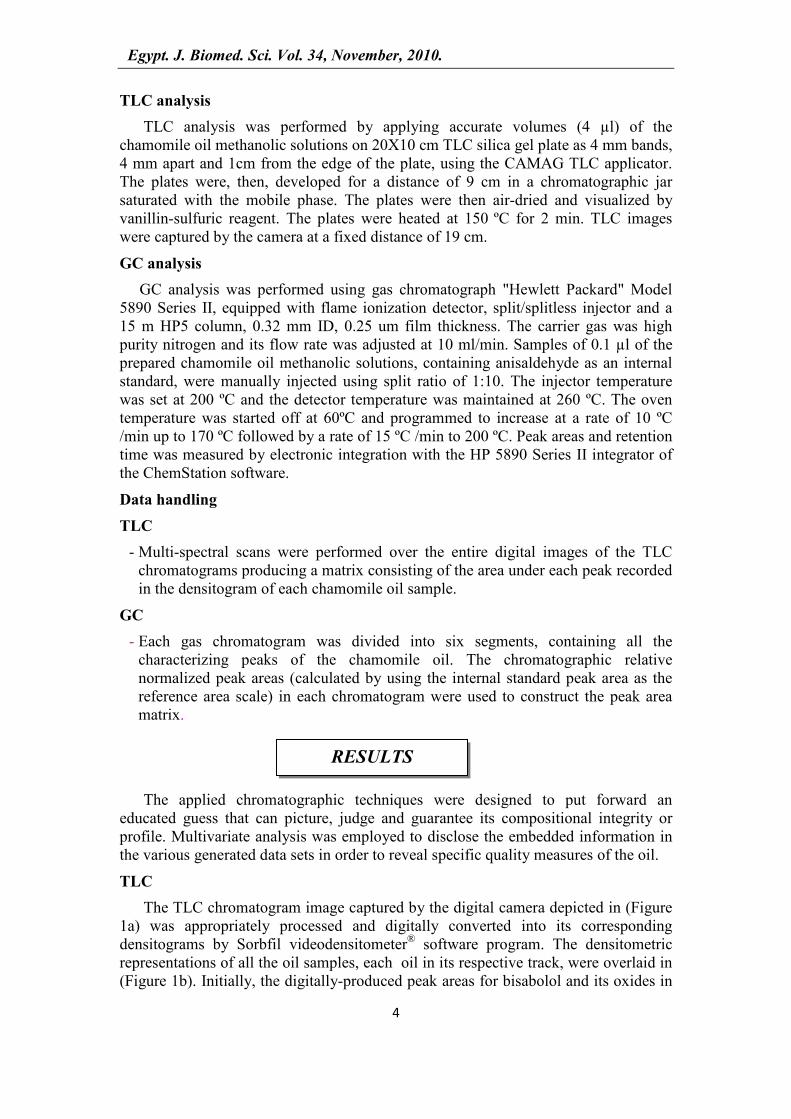
(Figure 1b). Initially, the digitally-produced peak areas for bisabolol and its oxides in
RESULTS

Egypt. J. Biomed. Sci. Vol. 34, �ovember, 2010.
5
each sample were used to comparatively rank the oils according to their content of the
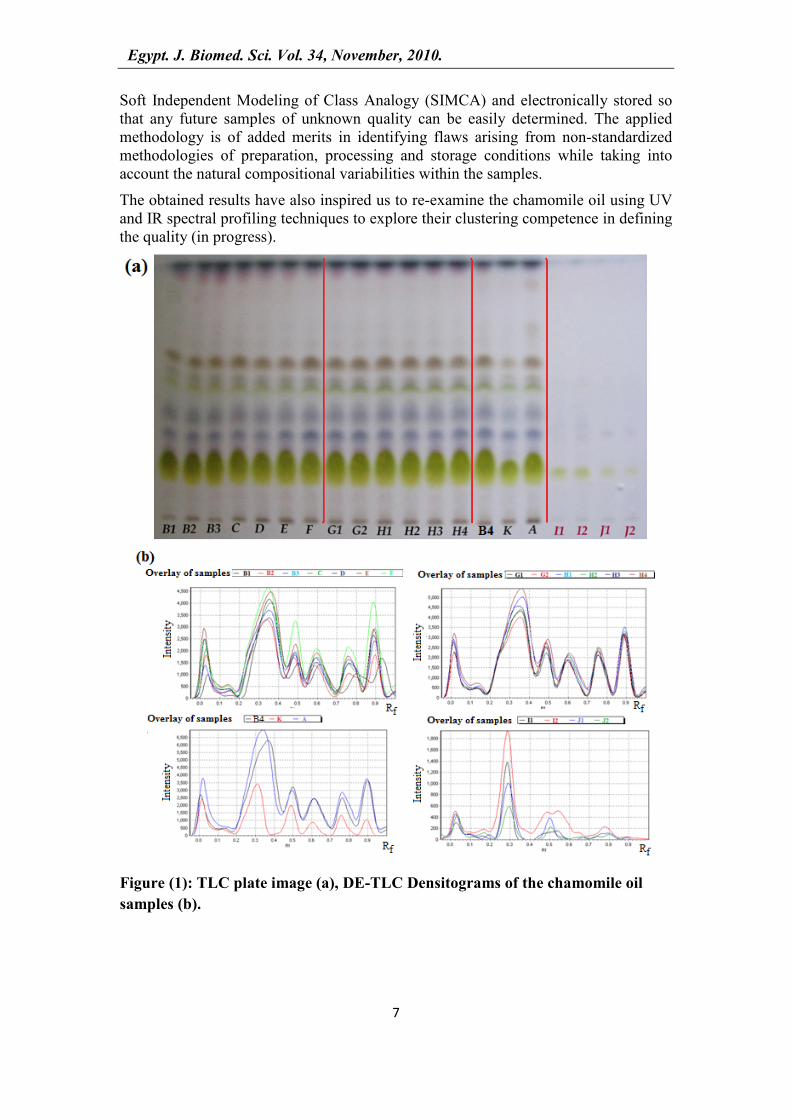
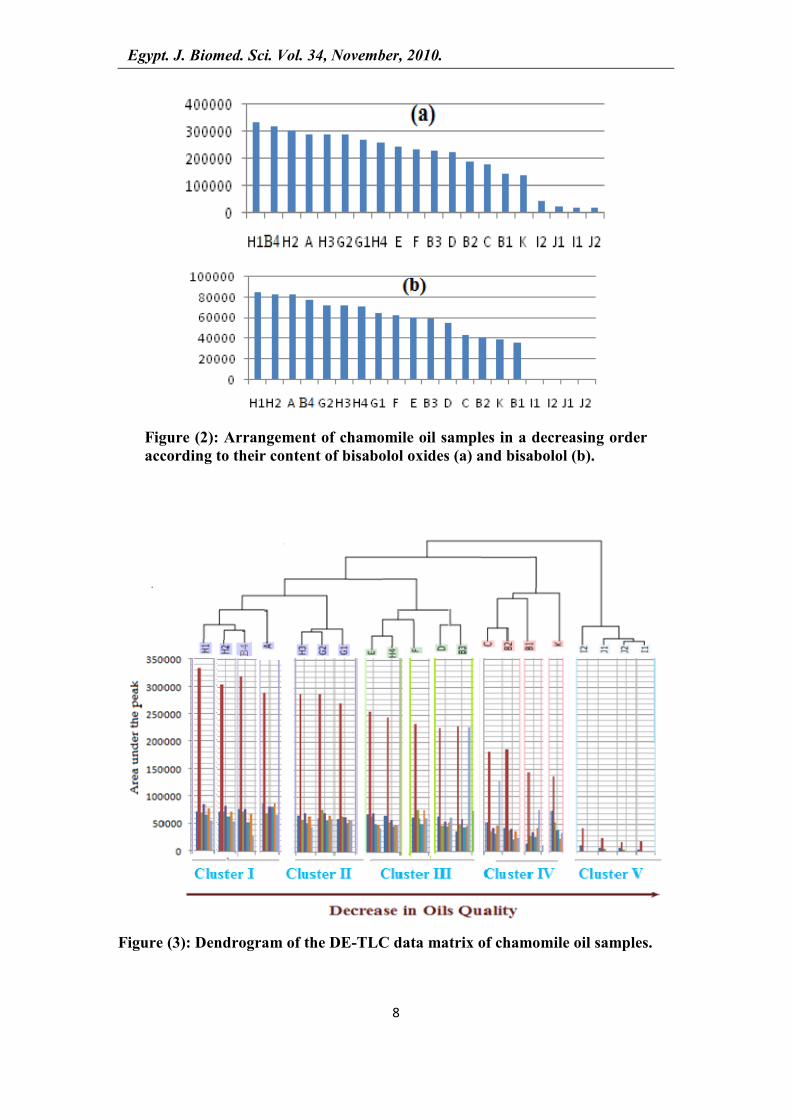
markers as depicted in (Figure 2). Subsequently, the comprehensive similarity
between the different chamomile oil samples was worked out by Hierarchical cluster
analysis (HCA) using the Ward's algorithm, and were portrayed in the dendrogram
shown in (Figure 3).
The reproducibility of the technique is secured by repeating the analysis on the same
day and on different days to ensure the consistency and precision of the applied
method and, consequently, the information abstracted from the plate. Besides, the
identity of many of the resolved spots was adequately identified by comparing their
relative Rf values and color with those mentioned in the chamomile oil monograph
(Wagner and Bladt, 2001).
GC
The generated data matrix for the normalized peak areas was used to construct a
classifying dendrogram, through HCA analysis using the same parameters used
before, and the compositional pattern of each sample for its volatile components was
used to show its profile next to its corresponding class as depicted in (Figure 5).
When the oil samples were arranged according to their content of a specific
marker, (Figure 2), different sample orders were attained in each time. Therefore, it
can be concluded that the inherent variability within the different chamomile oil
samples due to the use of one marker in each time was obviously incompetent in
defining their quality and one may wonder which one of the chamomile oil
metabolites is a reliable marker in defining the oils quality.
Evidently, comprehensive MV analysis of the oil samples would represent a
plausible approach to expand the limited aptness of the reductionistic approach. This
issue is basically tackled by unsupervised pattern recognition methods for exploratory
purposes to deal with the high dimensionality in the various datasets. A hierarchical
clustering is employed herein as a valuable statistical tool for searching objects with
similar attributes in a given data set.
The dendrogram portrayed in (Figures 3) has sorted out the oil samples into five
component-variability-dependent clusters, I-V, without any indicative measure to
categorically grade the quality of the different oil samples. Since TLC analysis of the
different chamomile oil samples can be considered as a quality- indicating-tool, it has
only pointed out that I1, I2, J1 and J2 samples are poor in quality. However, TLC
remained less efficient in differentiating between the different quality-close samples
(as a compositional trait) while taking into consideration the natural variability of the
components.
Accordingly, the newly developed approach for visualizing the oils
compositional-quality grades via merging the analytical concepts of HCA and TLC,
dendrogram in (Figure 3), have yielded a reliable and more informative outlook that
clearly relates their relative quality grades guided by their corresponding
compositional profiles.
DISCUSSIO�

Egypt. J. Biomed. Sci. Vol. 34, �ovember, 2010.
6
The figure also reveals that members of cluster I (samples A, B4, H1 and H2) are
shown to possess superior quality (highest content of all components) followed by the
members of cluster II (samples G1, G2 and H3) whereas members of cluster III
(samples B1, F, H4 and E) and cluster IV (samples C, B2, B1 and K) are considered
to be of moderate quality grade and lastly the members of cluster V (samples I1, J2,
J1 and I2) are of inferior quality grade. Moreover, A, F, G and H can now be safely
described as "quality-oil-producing manufacturers" whereas I and J could be seen as
non-trusted suppliers which are marketing inferior quality oils.
Secondly, since, clustering by TLC voids any indicator that gauges the olfactory
attributes of such samples, in essence, as essential oils. GC analysis of the samples
was conceivably exercised to reveal chemical profile of their volatile components as
shown in (Figure 4). Similarly, a dendrogram was portrayed in (Figure 5), using the
normalized-peak areas matrix, to rank the different oil samples according to their
volatile chemical content. Seven quality subgroups were discovered where the clusters
I-IV are of good quality grades; whereas the clusters V-VII are of inferior quality
grade. The GC combined with HCA, unfortunately, has indicated that sample K is of
poor compositional quality, which might be due to either the poor recovery of the oil
from small amount of the raw material under the limited laboratory assemblage or the
low quality of the herbal material. In addition, sample A was found to possess a low
compositional volatile content which came in agreement with its history (as an aged
sample).
As far as we can tell, TLC and GC outputs, analyzed by HCA, have almost displayed
a comparable samples categorization but with different classification perspective. For
example, when considering sample B1, TLC has failed to identify this oil within the
quality-ranked samples and, in contrast, gave sample A a higher quality grade (c.f.
GC) because of the TLC-illumination problem, despite of all the precautionary
measures taken. However, GC has proven to be more discriminating in this regard and
clustered sample A with inferior quality oil samples which showed lower
compositional content of volatile components whereas sample B1 has attained the
highest compositional quality (as illustrated in their respective gas chromatograms in
(Figure 4).
CO�CLUSIO�S
The literature-reported methods for the evaluation of chamomile oil quality had
mostly relied on determining the percentage of some marker compounds. Such
reductionistic approach can be, with great ease, fraudulently manipulated in
commercial samples by analyte-spiking. Besides, other common oil counterfeiting
practices by addition of lower grade oils, aged oils, vegetable, mineral oils, which
would adversely affect the oil purity, might be even harder to spot. A more
comprehensive approach in judging the oils quality which considers the whole
chemical compositional profile of chamomile oil would overcome this problem.
TLC analysis combined with HCA was proved to be considered as a quality-
indicating as well as a grading-tool in the context of the oils compositional trait whilst
the GC technique would reveal the olfactory attributes and their impact on judging the
oil quality.
Moreover, once good quality oils has been identified, their chromatographic features
could be modeled in an experimental template using Discriminant Analysis (DA) or
Egypt. J. Biomed. Sci. Vol. 34, �ovember, 2010.
7
Soft Independent Modeling of Class Analogy (SIMCA) and electronically stored so
that any future samples of unknown quality can be easily determined. The applied
methodology is of added merits in identifying flaws arising from non-standardized
methodologies of preparation, processing and storage conditions while taking into
account the natural compositional variabilities within the samples.
The obtained results have also inspired us to re-examine the chamomile oil using UV
and IR spectral profiling techniques to explore their clustering competence in defining
the quality (in progress).
Figure (1): TLC plate image (a), DE-TLC Densitograms of the chamomile oil
samples (b).
Egypt. J. Biomed. Sci. Vol. 34, �ovember, 2010.
8
Figure (2): Arrangement of chamomile oil samples in a decreasing order
according to their content of bisabolol oxides (a) and bisabolol (b).
Figure (3): Dendrogram of the DE-TLC data matrix of chamomile oil samples.

Egypt. J. Biomed. Sci. Vol. 34, �ovember, 2010.
9

Egypt. J. Biomed. Sci. Vol. 34, �ovember, 2010.
10
Acknowledgment
The authors are deeply indebted to CAMO Software, Inc. for providing the
license of Unscrambler®
X 10 and generously extending it. Also the essential oils
manufacturers, Flavogypt, Greatco, Hashem Brothers, International Aromatics, Kato
Aromatic, Pharmatech, Phatrade and Royal for Herbs, are acknowledged for
generously supplying us with the material under study.
British Pharmacopoeia (BP), (2010), Vol.2.
Cioanca, O.; Aprotosoaie, A. C.; Şpac, A.; Hancianu, M. and Stanescu, U. H.
(2010): Contribution to the study of the pharmaceutical quality of some
chamomile commercial samples, N I. the analysis of the volatile oil,
FARMACIA, 58(3), 308-314.
Daniel, C.; Kersten, T.; Kehraus, S.; König, G. M. and Knöß, W. (2007):
Metabolomic fingerprinting of medicinal plants using 1H NMR and
HPLC/ELSD in combination with PCA, Planta Medica, 73(9), 280-284.
Figure (5): Dendrogram of the GC data matrix of chamomile oil
samples.
REFERE�CES

Egypt. J. Biomed. Sci. Vol. 34, �ovember, 2010.
11
European Pharmacopoeia (EP), (2008): 6th
Edition.
Franke, R. and Schilcher, H. (2005): Chamomile: Industrial Profiles (Medicinal and
Aromatic Plants - Industrial Profiles), CRC Press, Taylor & Francis Group,
USA, 1st edition.
Günther, K.; Carle, R.; Fleischhauer, I. and Merget, S. (1993): Semi-preparative
liquid-chromatographic separation of all four stereoisomers of α-bisabolol
on trinitrobenzoylcellulose, Fresenius J. Anal Chem., 345, 787-790.
McKay, D. L. and Blumberg, J. B. (2006): A review of the bioactivity and potential
health benefits of chamomile tea (Matricaria recutita L.), Phytotherapy
Research, 20 (7), 519–53.
Mihailo, S.; Ristić, M. S.; Sofija, M.; Đorđević, S. M.; Đoković, D. D. and Tasić, S.
R. (2007): Setting a Standard for the Essential Oil of Chamomile
Originating from Banat, Acta Horticulturae, 749,127-140.
Orav, A.; Raal, A. and Arak, E. (2010): Content and composition of the essential oil
of Chamomilla recutita (L.) Rauschert from some European countries,
Natural Product Research, 24 (1), 48-55.
Rubiolo, P.; Belliardo, F.; Cordero, C.; Liberto, E.; Sgorbini, B. and Bicchi, C.
(2006): Head space-solid phase microextraction fast GC in combination
with principal component analysis as a tool to classify different chemotypes
of chamomile flower-heads (Matricaria recutita L.), Phytochemical
analysis. 17, 217-225.
Salamon, I. (2009): Chamomile biodiversity of the essential oil qualitative-
quantitative characteristics, Springer Netherlands.
Schulz, H.; Baranska, M.; Belz, H.; Rosch, P.; Strehle, M. A. and Popp, J. (2004): Chemotaxonomic characterization of essential oil plants by vibrational
spectroscopy measurements, Vibrational Spectroscopy, 35, 81-86.
Wagner, H. and Bladt, S. (2001): Plant Drug Analysis: A Thin Layer
Chromatography Atlas, 2nd edition. Springer-Verlag Berlin-Heidelberg.
Wang, Y.; Tang, H.; �icholson, J. K.; Hylands, P. J.; Sampson, J.; Whitcombe, I.;
Stewart, C. G.; Caiger, S.; Oru, I. and Holmes, E. (2004): Metabolomic
strategy for the classification and quality control of phytomedicines: A case
study of chamomile flower (Matricaria recutita L.), Planta Medica, 70,
250-255.

Egypt. J. Biomed. Sci. Vol. 34, �ovember, 2010.
12
.منھجية لتقييم الجودة ,الكاموميل زھرة عينات تجارية من زيتل الھرمي تصنيفال
للسادة الدكاترة
2 ماجد جابر الغزولي - 2حراز محمدفتح اهللا - 2بوشعيرأحمد أابراهيم محمد - 1أميرة رشدى محمد خطاب
مـــــن
فاروس باالسكندريةجامعة ,الصيدلةكلية ,قسم العقاقير 1
االسكندرية جامعة, الصيدلة كلية, العقاقيرقسم 2
ستخدام تقنية إجية جديده لتقييم عينات تجارية من زيت الكاموميل في السوق المصرى بالدراسة منهتقدم هذه
هاتينمعالجة النتائج المستخرجة من بعدكروماتوجرافيا الغاز و بالطبقة الرقيقة التحليل الكروماتوجرافي
المتبعة سابقا بمعظم الطرق المعتمده جيه عن تلككيمومتري وأهم ما يميز هذه المنهالتقنيتين بطريقة التحليل ال
المركبات الطبيعية الموجودة تحليلية شمولية لجميعنها تقدم صوره ألتحليل زيت الكاموميل هو و المنشورة
و النقاء الجودة خصفيما يمجال البحث قدرتها علي التمييز بين العينات المقدمةبالزيت والتي ثبت من النتائج
.لضمان الجودة مؤشراتك المركبات الكيميائية عدد محدود منستخدام إعلي من مجرد أبكفاءة
كما طرحت المنهجية المقدمة كيفية استنباط درجة الجودة ألي عينات مستقبلية من نفس النوع الذي تم
.دراسته وذلك عن طريق مقارنتها بنموذج معبرعن المواصفات الجيدة الواجب توافرها
ARABIC SUMMARY