moisture ingress into low voltage oil-impregnatedpaper insulated distribution cables
TRANSCRIPT
Moisture ingress into low voltage oil-impregnated-paper insulated distribution cables
M. Wang, S.M. Rowland and P.E. Clements
Abstract: Investigations into the effect of moisture on the degradation of oil-impregnated-paper(OIP) insulated low voltage cables have shown that moisture ingress plays a key role in cablefailure, and that the ionic content of the moisture is critical. Here moisture ingress into OIP insu-lated cable is studied in the laboratory. Experiments have been performed in which cable sampleshave been exposed to moisture for varying periods, allowing the progress of moisture diffusionwithin the insulation to be studied. Karl-Fischer titration and observation of dye movement havebeen used to measure moisture transport. Moisture within a ‘wet cable’ is shown to be non-uniformly distributed within a sector-shaped core, and dependent on the temperature of thecable. Measurements of insulation conductivity are presented illustrating the resulting macroscopicchanges to insulation properties for comparison. An increased rate of penetration of moisture intothe cable core results at elevated temperatures, whereas saturation levels are reduced.
1 Introduction
Cost-effective management of low-voltage (LV) distributioncables presents significant challenges because they have lowvalue per unit length, carry relatively low levels of power tofew customers and are disparate assets, spread throughout anetwork. Cables in the UK typically have a range of ages upto, and over, forty years, and have a number of designs [1].Understanding the nature of LV failure is key to improvingnetwork reliability. The many detailed studies of mediumand high-voltage (HV) cables are not readily transferable,since failure occurs in LV cable insulation at fields over anorder of magnitude lower than in HV cables [2]. Genericcharacterisation of an oil-impregnated-paper (OIP) insulatedcable is not easy, since a network may contain cablesinstalled at any time over the past hundred years andmaterials used and quality control may have varied radicallyover this period. Studying microscopic material propertiesmay therefore not be as fruitful as considering macroscopicgeneric properties such as moisture transport and conduc-tivity [3].
Work presented here is building towards the developmentof tools to more efficiently manage LV distribution cables.Moisture diffusion is studied by dissecting LV paper-insulated, lead-covered (PILC) cable insulation.Investigation into the movement of moisture in OIP insu-lated LV cable cores shows that moisture ingress is farfrom uniform. The combination of Karl-Fisher (KF) titra-tion and tracer dyes is used to fully identify the distributionof moisture in the cable.
It is generally accepted that the presence of moisturein oil-based dielectrics is harmful [4, 5] and moistureingress affects the dielectric properties of OIP cable
# The Institution of Engineering and Technology 2007
doi:10.1049/iet-smt:20060134
Paper first received 21st November 2006 and in revised form 28th February2007
The authors are with the School of Electrical and Electronic Engineering, TheUniversity of Manchester, PO Box 88, Manchester M60 1QD, UK
E-mail: [email protected]
276
insulation [6, 7]. The change in an insulation materialbecause of moisture can be quantified by dielectric responsein the time or frequency domain. For example, dielectricloss increases and dielectric breakdown strength decreasesas moisture content rises, leading to failures in OIP cablesystems [8]. In addition, other processes such as corrosionof metal elements are accelerated by the presenceof moisture. The progress of water ingress is not wellstudied and very little work has been reported on LV distri-bution cable failure. The intention of the experimental workhere is to understand the diffusion of high levels of watercontent (up to 25% by weight) and so gain an insight intoits influence on the dielectric strength of OIP insulation inLV applications.
2 Experiment
2.1 LV cable geometry
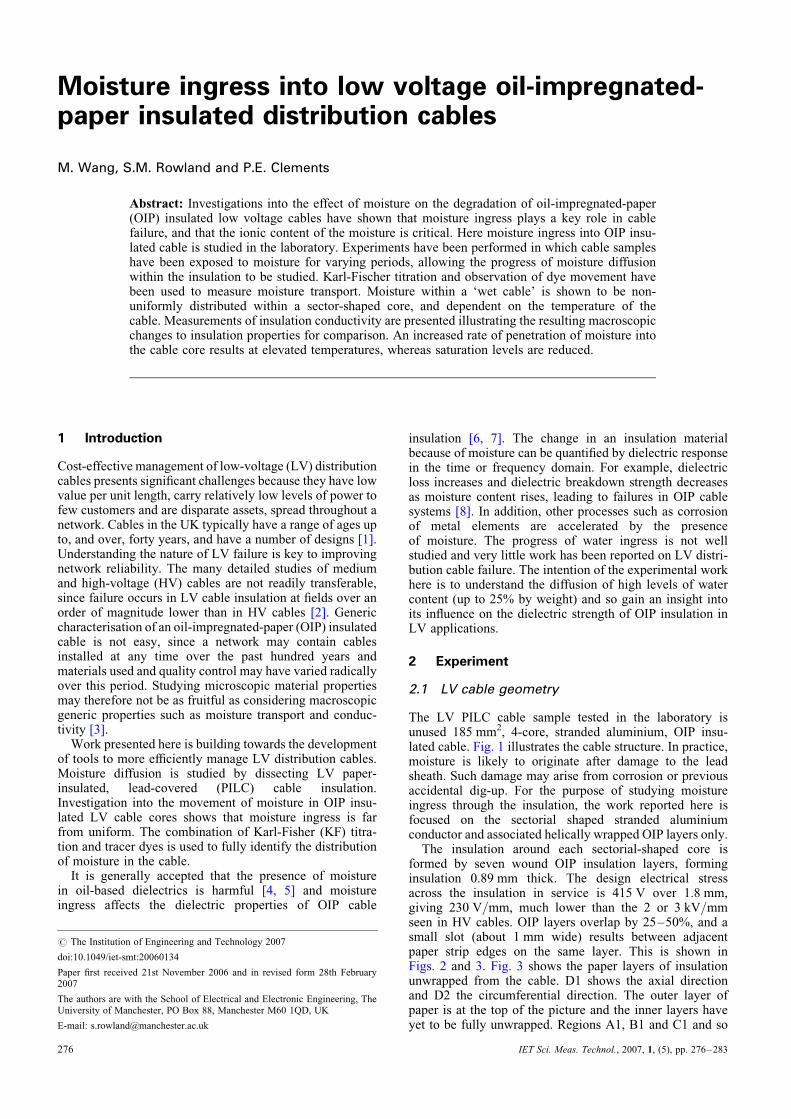
The LV PILC cable sample tested in the laboratory isunused 185 mm2, 4-core, stranded aluminium, OIP insu-lated cable. Fig. 1 illustrates the cable structure. In practice,moisture is likely to originate after damage to the leadsheath. Such damage may arise from corrosion or previousaccidental dig-up. For the purpose of studying moistureingress through the insulation, the work reported here isfocused on the sectorial shaped stranded aluminiumconductor and associated helically wrapped OIP layers only.
The insulation around each sectorial-shaped core isformed by seven wound OIP insulation layers, forminginsulation 0.89 mm thick. The design electrical stressacross the insulation in service is 415 V over 1.8 mm,giving 230 V/mm, much lower than the 2 or 3 kV/mmseen in HV cables. OIP layers overlap by 25–50%, and asmall slot (about 1 mm wide) results between adjacentpaper strip edges on the same layer. This is shown inFigs. 2 and 3. Fig. 3 shows the paper layers of insulationunwrapped from the cable. D1 shows the axial directionand D2 the circumferential direction. The outer layer ofpaper is at the top of the picture and the inner layers haveyet to be fully unwrapped. Regions A1, B1 and C1 and so
IET Sci. Meas. Technol., 2007, 1, (5), pp. 276–283
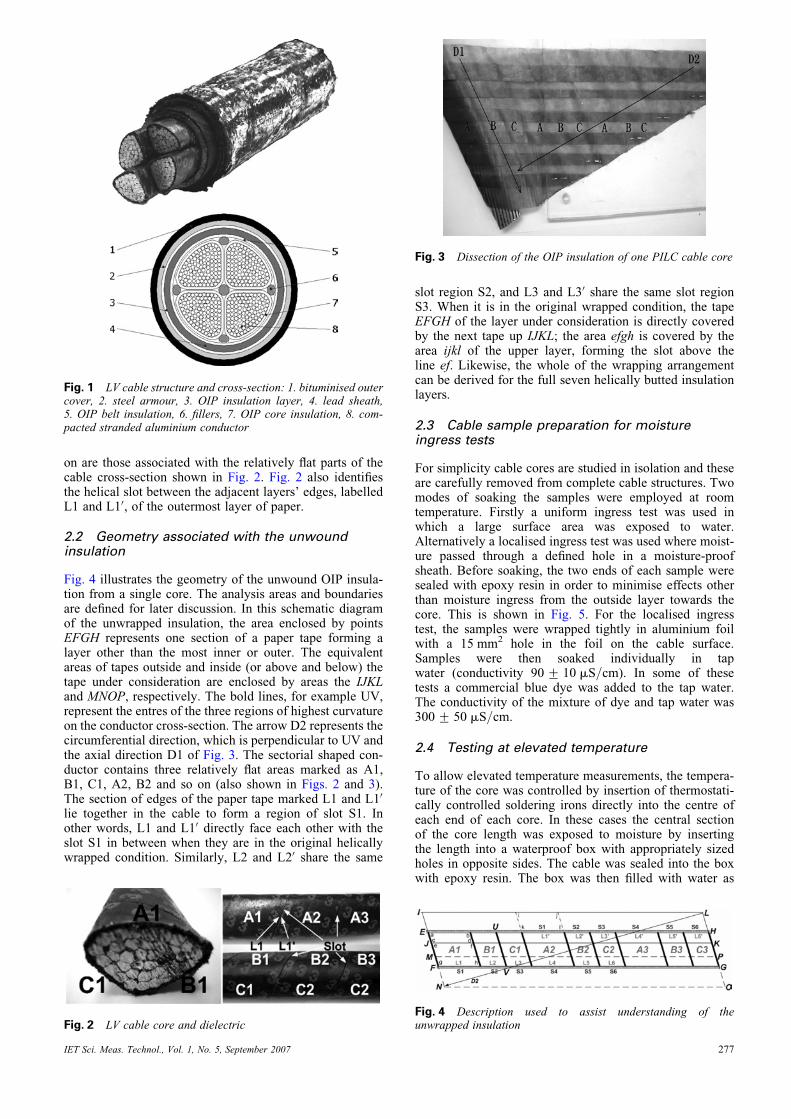
on are those associated with the relatively flat parts of thecable cross-section shown in Fig. 2. Fig. 2 also identifiesthe helical slot between the adjacent layers’ edges, labelledL1 and L10, of the outermost layer of paper.
2.2 Geometry associated with the unwoundinsulation
Fig. 4 illustrates the geometry of the unwound OIP insula-tion from a single core. The analysis areas and boundariesare defined for later discussion. In this schematic diagramof the unwrapped insulation, the area enclosed by pointsEFGH represents one section of a paper tape forming alayer other than the most inner or outer. The equivalentareas of tapes outside and inside (or above and below) thetape under consideration are enclosed by areas the IJKLand MNOP, respectively. The bold lines, for example UV,represent the entres of the three regions of highest curvatureon the conductor cross-section. The arrow D2 represents thecircumferential direction, which is perpendicular to UV andthe axial direction D1 of Fig. 3. The sectorial shaped con-ductor contains three relatively flat areas marked as A1,B1, C1, A2, B2 and so on (also shown in Figs. 2 and 3).The section of edges of the paper tape marked L1 and L10
lie together in the cable to form a region of slot S1. Inother words, L1 and L10 directly face each other with theslot S1 in between when they are in the original helicallywrapped condition. Similarly, L2 and L20 share the same
Fig. 1 LV cable structure and cross-section: 1. bituminised outercover, 2. steel armour, 3. OIP insulation layer, 4. lead sheath,5. OIP belt insulation, 6. fillers, 7. OIP core insulation, 8. com-pacted stranded aluminium conductor
Fig. 2 LV cable core and dielectric
IET Sci. Meas. Technol., Vol. 1, No. 5, September 2007
slot region S2, and L3 and L30 share the same slot regionS3. When it is in the original wrapped condition, the tapeEFGH of the layer under consideration is directly coveredby the next tape up IJKL; the area efgh is covered by thearea ijkl of the upper layer, forming the slot above theline ef. Likewise, the whole of the wrapping arrangementcan be derived for the full seven helically butted insulationlayers.
2.3 Cable sample preparation for moistureingress tests
For simplicity cable cores are studied in isolation and theseare carefully removed from complete cable structures. Twomodes of soaking the samples were employed at roomtemperature. Firstly a uniform ingress test was used inwhich a large surface area was exposed to water.Alternatively a localised ingress test was used where moist-ure passed through a defined hole in a moisture-proofsheath. Before soaking, the two ends of each sample weresealed with epoxy resin in order to minimise effects otherthan moisture ingress from the outside layer towards thecore. This is shown in Fig. 5. For the localised ingresstest, the samples were wrapped tightly in aluminium foilwith a 15 mm2 hole in the foil on the cable surface.Samples were then soaked individually in tapwater (conductivity 90 + 10 mS/cm). In some of thesetests a commercial blue dye was added to the tap water.The conductivity of the mixture of dye and tap water was300 + 50 mS/cm.
2.4 Testing at elevated temperature
To allow elevated temperature measurements, the tempera-ture of the core was controlled by insertion of thermostati-cally controlled soldering irons directly into the centre ofeach end of each core. In these cases the central sectionof the core length was exposed to moisture by insertingthe length into a waterproof box with appropriately sizedholes in opposite sides. The cable was sealed into the boxwith epoxy resin. The box was then filled with water as
Fig. 3 Dissection of the OIP insulation of one PILC cable core
Fig. 4 Description used to assist understanding of theunwrapped insulation
277
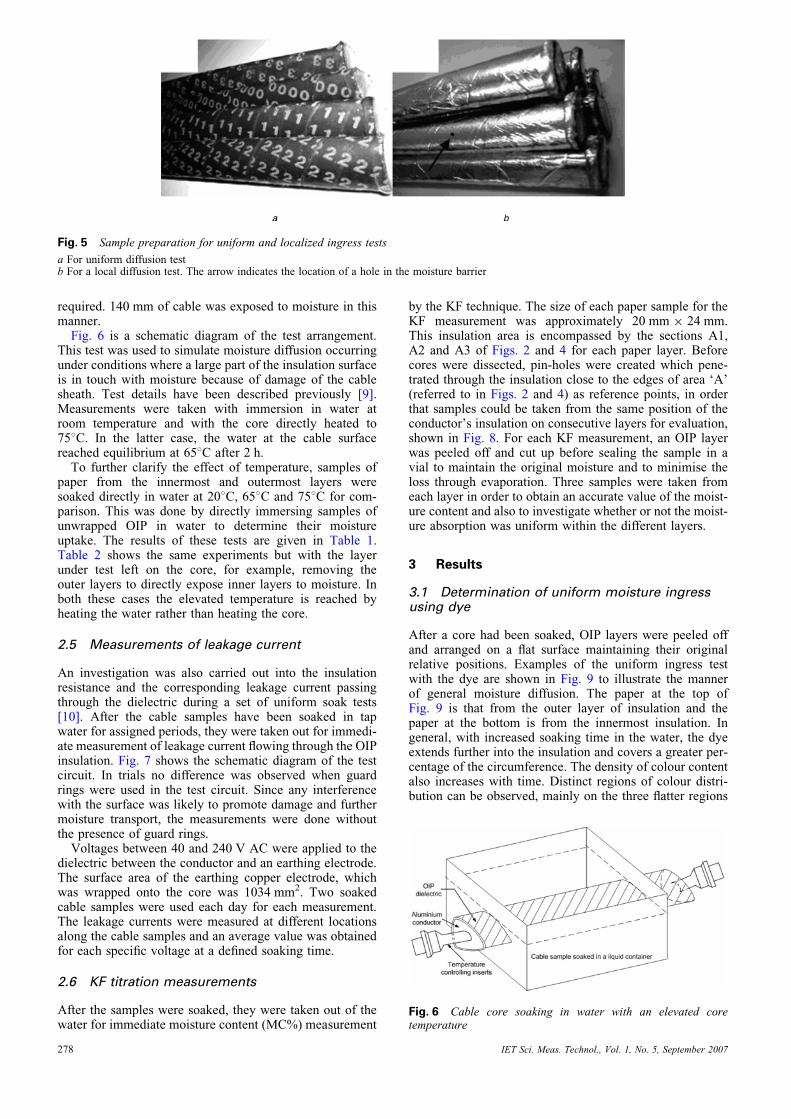
Fig. 5 Sample preparation for uniform and localized ingress tests
a For uniform diffusion testb For a local diffusion test. The arrow indicates the location of a hole in the moisture barrier
required. 140 mm of cable was exposed to moisture in thismanner.
Fig. 6 is a schematic diagram of the test arrangement.This test was used to simulate moisture diffusion occurringunder conditions where a large part of the insulation surfaceis in touch with moisture because of damage of the cablesheath. Test details have been described previously [9].Measurements were taken with immersion in water atroom temperature and with the core directly heated to758C. In the latter case, the water at the cable surfacereached equilibrium at 658C after 2 h.
To further clarify the effect of temperature, samples ofpaper from the innermost and outermost layers weresoaked directly in water at 208C, 658C and 758C for com-parison. This was done by directly immersing samples ofunwrapped OIP in water to determine their moistureuptake. The results of these tests are given in Table 1.Table 2 shows the same experiments but with the layerunder test left on the core, for example, removing theouter layers to directly expose inner layers to moisture. Inboth these cases the elevated temperature is reached byheating the water rather than heating the core.
2.5 Measurements of leakage current
An investigation was also carried out into the insulationresistance and the corresponding leakage current passingthrough the dielectric during a set of uniform soak tests[10]. After the cable samples have been soaked in tapwater for assigned periods, they were taken out for immedi-ate measurement of leakage current flowing through the OIPinsulation. Fig. 7 shows the schematic diagram of the testcircuit. In trials no difference was observed when guardrings were used in the test circuit. Since any interferencewith the surface was likely to promote damage and furthermoisture transport, the measurements were done withoutthe presence of guard rings.
Voltages between 40 and 240 V AC were applied to thedielectric between the conductor and an earthing electrode.The surface area of the earthing copper electrode, whichwas wrapped onto the core was 1034 mm2. Two soakedcable samples were used each day for each measurement.The leakage currents were measured at different locationsalong the cable samples and an average value was obtainedfor each specific voltage at a defined soaking time.
2.6 KF titration measurements
After the samples were soaked, they were taken out of thewater for immediate moisture content (MC%) measurement
278
by the KF technique. The size of each paper sample for theKF measurement was approximately 20 mm � 24 mm.This insulation area is encompassed by the sections A1,A2 and A3 of Figs. 2 and 4 for each paper layer. Beforecores were dissected, pin-holes were created which pene-trated through the insulation close to the edges of area ‘A’(referred to in Figs. 2 and 4) as reference points, in orderthat samples could be taken from the same position of theconductor’s insulation on consecutive layers for evaluation,shown in Fig. 8. For each KF measurement, an OIP layerwas peeled off and cut up before sealing the sample in avial to maintain the original moisture and to minimise theloss through evaporation. Three samples were taken fromeach layer in order to obtain an accurate value of the moist-ure content and also to investigate whether or not the moist-ure absorption was uniform within the different layers.
3 Results
3.1 Determination of uniform moisture ingressusing dye
After a core had been soaked, OIP layers were peeled offand arranged on a flat surface maintaining their originalrelative positions. Examples of the uniform ingress testwith the dye are shown in Fig. 9 to illustrate the mannerof general moisture diffusion. The paper at the top ofFig. 9 is that from the outer layer of insulation and thepaper at the bottom is from the innermost insulation. Ingeneral, with increased soaking time in the water, the dyeextends further into the insulation and covers a greater per-centage of the circumference. The density of colour contentalso increases with time. Distinct regions of colour distri-bution can be observed, mainly on the three flatter regions
Fig. 6 Cable core soaking in water with an elevated coretemperature
IET Sci. Meas. Technol., Vol. 1, No. 5, September 2007
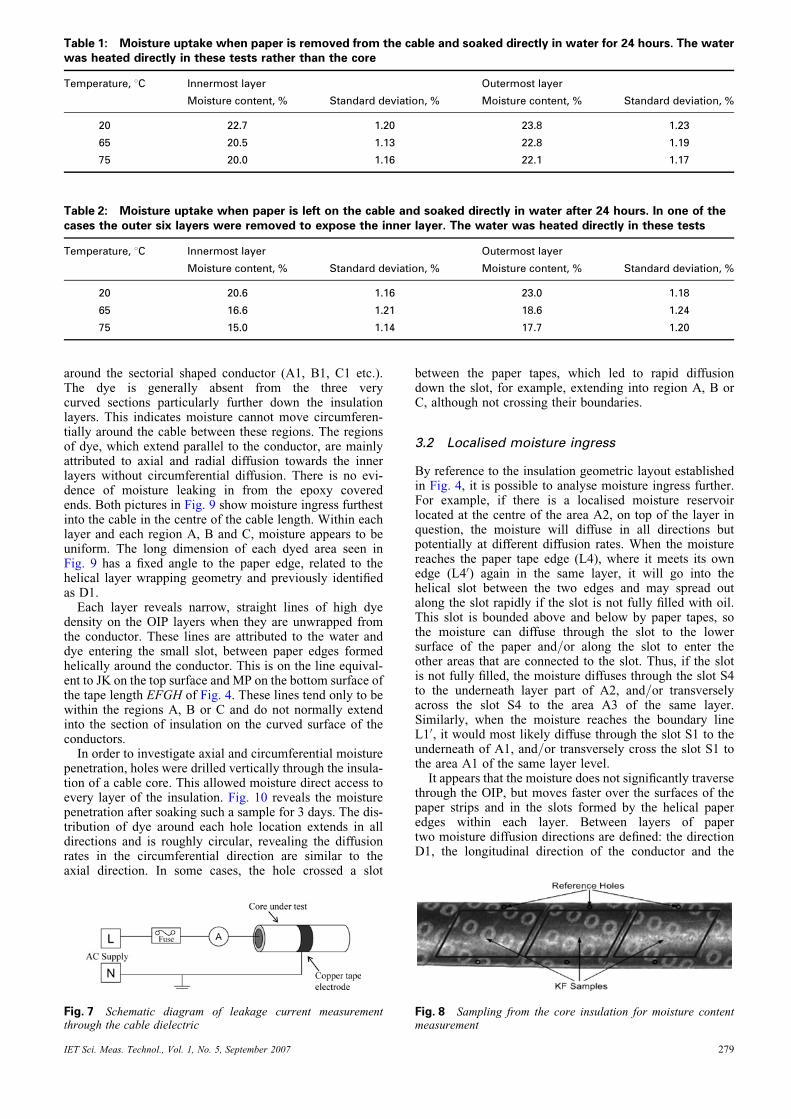
Table 1: Moisture uptake when paper is removed from the cable and soaked directly in water for 24 hours. The waterwas heated directly in these tests rather than the core
Temperature, 8C Innermost layer Outermost layer
Moisture content, % Standard deviation, % Moisture content, % Standard deviation, %
20 22.7 1.20 23.8 1.23
65 20.5 1.13 22.8 1.19
75 20.0 1.16 22.1 1.17
Table 2: Moisture uptake when paper is left on the cable and soaked directly in water after 24 hours. In one of thecases the outer six layers were removed to expose the inner layer. The water was heated directly in these tests
Temperature, 8C Innermost layer Outermost layer
Moisture content, % Standard deviation, % Moisture content, % Standard deviation, %
20 20.6 1.16 23.0 1.18
65 16.6 1.21 18.6 1.24
75 15.0 1.14 17.7 1.20
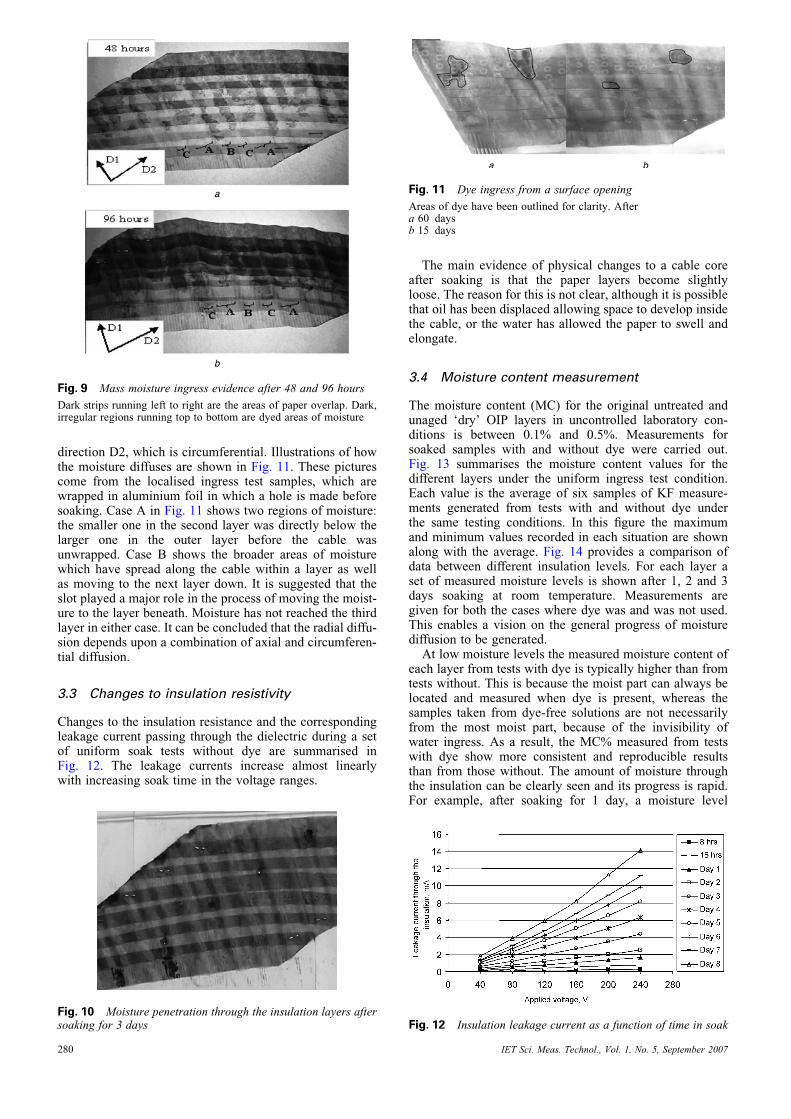
around the sectorial shaped conductor (A1, B1, C1 etc.).The dye is generally absent from the three verycurved sections particularly further down the insulationlayers. This indicates moisture cannot move circumferen-tially around the cable between these regions. The regionsof dye, which extend parallel to the conductor, are mainlyattributed to axial and radial diffusion towards the innerlayers without circumferential diffusion. There is no evi-dence of moisture leaking in from the epoxy coveredends. Both pictures in Fig. 9 show moisture ingress furthestinto the cable in the centre of the cable length. Within eachlayer and each region A, B and C, moisture appears to beuniform. The long dimension of each dyed area seen inFig. 9 has a fixed angle to the paper edge, related to thehelical layer wrapping geometry and previously identifiedas D1.
Each layer reveals narrow, straight lines of high dyedensity on the OIP layers when they are unwrapped fromthe conductor. These lines are attributed to the water anddye entering the small slot, between paper edges formedhelically around the conductor. This is on the line equival-ent to JK on the top surface and MP on the bottom surface ofthe tape length EFGH of Fig. 4. These lines tend only to bewithin the regions A, B or C and do not normally extendinto the section of insulation on the curved surface of theconductors.
In order to investigate axial and circumferential moisturepenetration, holes were drilled vertically through the insula-tion of a cable core. This allowed moisture direct access toevery layer of the insulation. Fig. 10 reveals the moisturepenetration after soaking such a sample for 3 days. The dis-tribution of dye around each hole location extends in alldirections and is roughly circular, revealing the diffusionrates in the circumferential direction are similar to theaxial direction. In some cases, the hole crossed a slot
Fig. 7 Schematic diagram of leakage current measurementthrough the cable dielectric
IET Sci. Meas. Technol., Vol. 1, No. 5, September 2007
between the paper tapes, which led to rapid diffusiondown the slot, for example, extending into region A, B orC, although not crossing their boundaries.
3.2 Localised moisture ingress
By reference to the insulation geometric layout establishedin Fig. 4, it is possible to analyse moisture ingress further.For example, if there is a localised moisture reservoirlocated at the centre of the area A2, on top of the layer inquestion, the moisture will diffuse in all directions butpotentially at different diffusion rates. When the moisturereaches the paper tape edge (L4), where it meets its ownedge (L40) again in the same layer, it will go into thehelical slot between the two edges and may spread outalong the slot rapidly if the slot is not fully filled with oil.This slot is bounded above and below by paper tapes, sothe moisture can diffuse through the slot to the lowersurface of the paper and/or along the slot to enter theother areas that are connected to the slot. Thus, if the slotis not fully filled, the moisture diffuses through the slot S4to the underneath layer part of A2, and/or transverselyacross the slot S4 to the area A3 of the same layer.Similarly, when the moisture reaches the boundary lineL10, it would most likely diffuse through the slot S1 to theunderneath of A1, and/or transversely cross the slot S1 tothe area A1 of the same layer level.
It appears that the moisture does not significantly traversethrough the OIP, but moves faster over the surfaces of thepaper strips and in the slots formed by the helical paperedges within each layer. Between layers of papertwo moisture diffusion directions are defined: the directionD1, the longitudinal direction of the conductor and the
Fig. 8 Sampling from the core insulation for moisture contentmeasurement
279
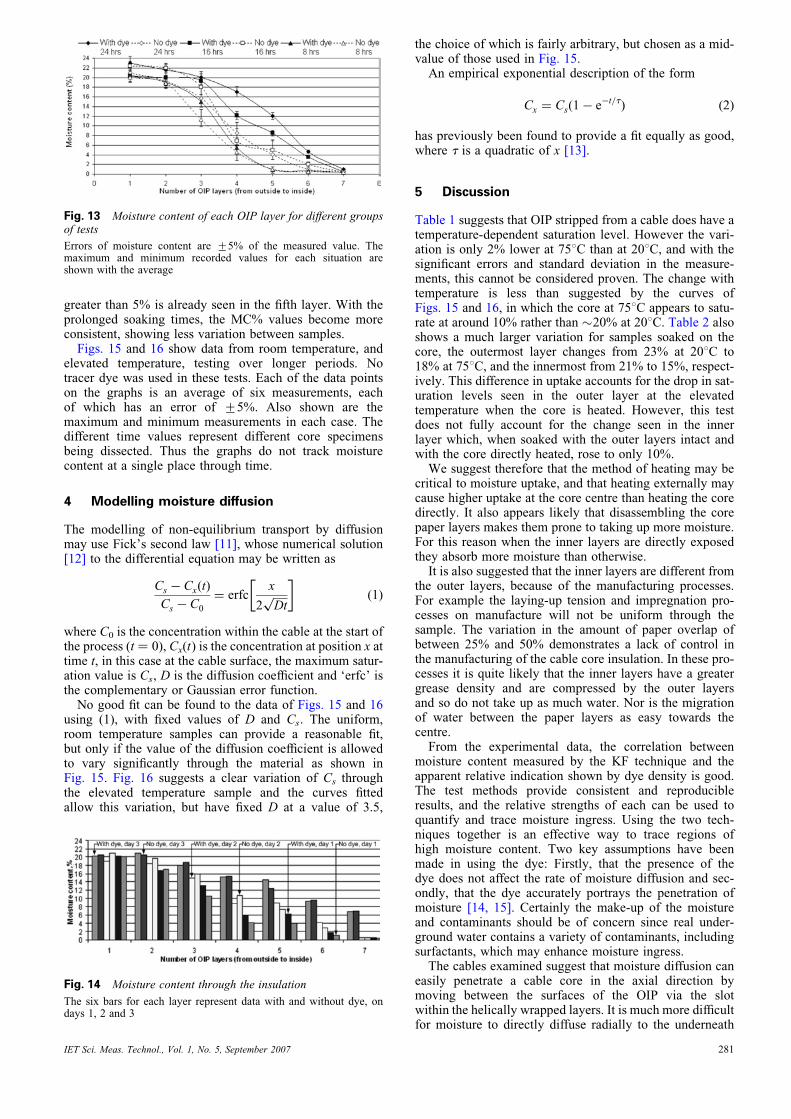
direction D2, which is circumferential. Illustrations of howthe moisture diffuses are shown in Fig. 11. These picturescome from the localised ingress test samples, which arewrapped in aluminium foil in which a hole is made beforesoaking. Case A in Fig. 11 shows two regions of moisture:the smaller one in the second layer was directly below thelarger one in the outer layer before the cable wasunwrapped. Case B shows the broader areas of moisturewhich have spread along the cable within a layer as wellas moving to the next layer down. It is suggested that theslot played a major role in the process of moving the moist-ure to the layer beneath. Moisture has not reached the thirdlayer in either case. It can be concluded that the radial diffu-sion depends upon a combination of axial and circumferen-tial diffusion.
3.3 Changes to insulation resistivity
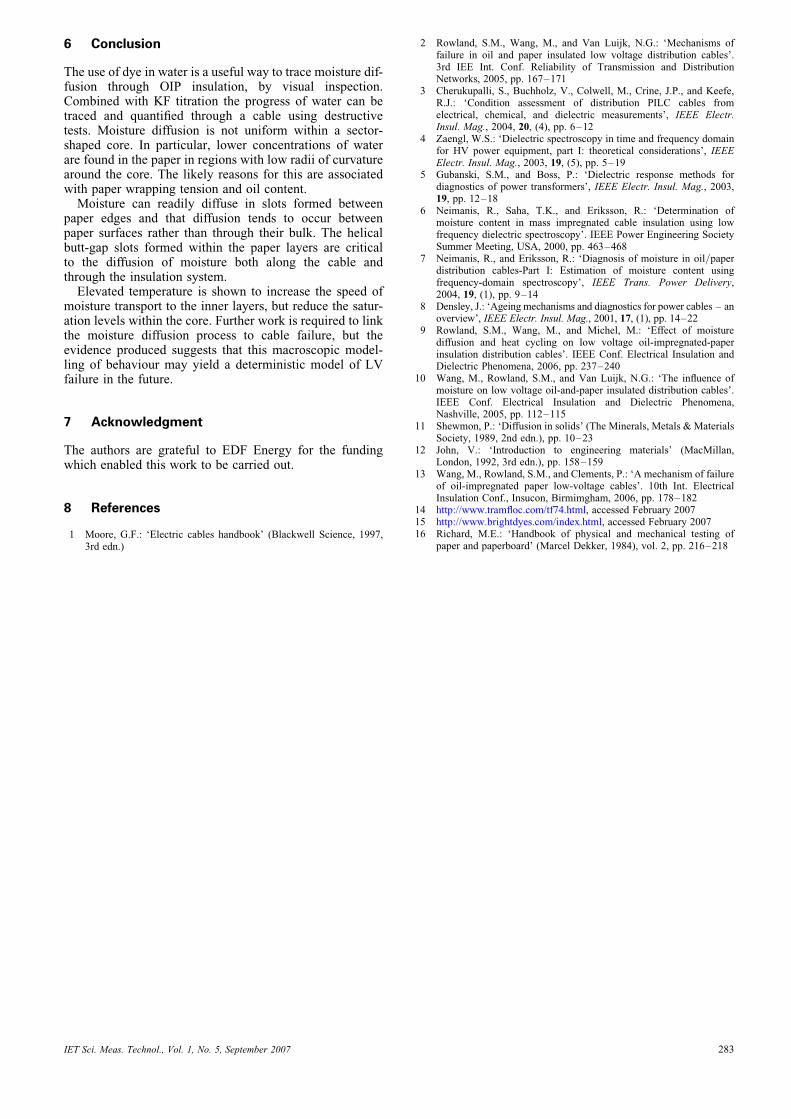
Changes to the insulation resistance and the correspondingleakage current passing through the dielectric during a setof uniform soak tests without dye are summarised inFig. 12. The leakage currents increase almost linearlywith increasing soak time in the voltage ranges.
Fig. 9 Mass moisture ingress evidence after 48 and 96 hours
Dark strips running left to right are the areas of paper overlap. Dark,irregular regions running top to bottom are dyed areas of moisture
Fig. 10 Moisture penetration through the insulation layers aftersoaking for 3 days
280
The main evidence of physical changes to a cable coreafter soaking is that the paper layers become slightlyloose. The reason for this is not clear, although it is possiblethat oil has been displaced allowing space to develop insidethe cable, or the water has allowed the paper to swell andelongate.
3.4 Moisture content measurement
The moisture content (MC) for the original untreated andunaged ‘dry’ OIP layers in uncontrolled laboratory con-ditions is between 0.1% and 0.5%. Measurements forsoaked samples with and without dye were carried out.Fig. 13 summarises the moisture content values for thedifferent layers under the uniform ingress test condition.Each value is the average of six samples of KF measure-ments generated from tests with and without dye underthe same testing conditions. In this figure the maximumand minimum values recorded in each situation are shownalong with the average. Fig. 14 provides a comparison ofdata between different insulation levels. For each layer aset of measured moisture levels is shown after 1, 2 and 3days soaking at room temperature. Measurements aregiven for both the cases where dye was and was not used.This enables a vision on the general progress of moisturediffusion to be generated.
At low moisture levels the measured moisture content ofeach layer from tests with dye is typically higher than fromtests without. This is because the moist part can always belocated and measured when dye is present, whereas thesamples taken from dye-free solutions are not necessarilyfrom the most moist part, because of the invisibility ofwater ingress. As a result, the MC% measured from testswith dye show more consistent and reproducible resultsthan from those without. The amount of moisture throughthe insulation can be clearly seen and its progress is rapid.For example, after soaking for 1 day, a moisture level
Fig. 11 Dye ingress from a surface opening
Areas of dye have been outlined for clarity. Aftera 60 daysb 15 days
Fig. 12 Insulation leakage current as a function of time in soak
IET Sci. Meas. Technol., Vol. 1, No. 5, September 2007
greater than 5% is already seen in the fifth layer. With theprolonged soaking times, the MC% values become moreconsistent, showing less variation between samples.
Figs. 15 and 16 show data from room temperature, andelevated temperature, testing over longer periods. Notracer dye was used in these tests. Each of the data pointson the graphs is an average of six measurements, eachof which has an error of +5%. Also shown are themaximum and minimum measurements in each case. Thedifferent time values represent different core specimensbeing dissected. Thus the graphs do not track moisturecontent at a single place through time.
4 Modelling moisture diffusion
The modelling of non-equilibrium transport by diffusionmay use Fick’s second law [11], whose numerical solution[12] to the differential equation may be written as
Cs � Cx(t)
Cs � C0
¼ erfcx
2ffiffiffiffiffiDt
p
� �(1)
where C0 is the concentration within the cable at the start ofthe process (t ¼ 0), Cx(t) is the concentration at position x attime t, in this case at the cable surface, the maximum satur-ation value is Cs, D is the diffusion coefficient and ‘erfc’ isthe complementary or Gaussian error function.
No good fit can be found to the data of Figs. 15 and 16using (1), with fixed values of D and Cs. The uniform,room temperature samples can provide a reasonable fit,but only if the value of the diffusion coefficient is allowedto vary significantly through the material as shown inFig. 15. Fig. 16 suggests a clear variation of Cs throughthe elevated temperature sample and the curves fittedallow this variation, but have fixed D at a value of 3.5,
Fig. 13 Moisture content of each OIP layer for different groupsof tests
Errors of moisture content are +5% of the measured value. Themaximum and minimum recorded values for each situation areshown with the average
Fig. 14 Moisture content through the insulation
The six bars for each layer represent data with and without dye, ondays 1, 2 and 3
IET Sci. Meas. Technol., Vol. 1, No. 5, September 2007
the choice of which is fairly arbitrary, but chosen as a mid-value of those used in Fig. 15.
An empirical exponential description of the form
Cx ¼ Cs(1 � e�t=t) (2)
has previously been found to provide a fit equally as good,where t is a quadratic of x [13].
5 Discussion
Table 1 suggests that OIP stripped from a cable does have atemperature-dependent saturation level. However the vari-ation is only 2% lower at 758C than at 208C, and with thesignificant errors and standard deviation in the measure-ments, this cannot be considered proven. The change withtemperature is less than suggested by the curves ofFigs. 15 and 16, in which the core at 758C appears to satu-rate at around 10% rather than �20% at 208C. Table 2 alsoshows a much larger variation for samples soaked on thecore, the outermost layer changes from 23% at 208C to18% at 758C, and the innermost from 21% to 15%, respect-ively. This difference in uptake accounts for the drop in sat-uration levels seen in the outer layer at the elevatedtemperature when the core is heated. However, this testdoes not fully account for the change seen in the innerlayer which, when soaked with the outer layers intact andwith the core directly heated, rose to only 10%.
We suggest therefore that the method of heating may becritical to moisture uptake, and that heating externally maycause higher uptake at the core centre than heating the coredirectly. It also appears likely that disassembling the corepaper layers makes them prone to taking up more moisture.For this reason when the inner layers are directly exposedthey absorb more moisture than otherwise.
It is also suggested that the inner layers are different fromthe outer layers, because of the manufacturing processes.For example the laying-up tension and impregnation pro-cesses on manufacture will not be uniform through thesample. The variation in the amount of paper overlap ofbetween 25% and 50% demonstrates a lack of control inthe manufacturing of the cable core insulation. In these pro-cesses it is quite likely that the inner layers have a greatergrease density and are compressed by the outer layersand so do not take up as much water. Nor is the migrationof water between the paper layers as easy towards thecentre.
From the experimental data, the correlation betweenmoisture content measured by the KF technique and theapparent relative indication shown by dye density is good.The test methods provide consistent and reproducibleresults, and the relative strengths of each can be used toquantify and trace moisture ingress. Using the two tech-niques together is an effective way to trace regions ofhigh moisture content. Two key assumptions have beenmade in using the dye: Firstly, that the presence of thedye does not affect the rate of moisture diffusion and sec-ondly, that the dye accurately portrays the penetration ofmoisture [14, 15]. Certainly the make-up of the moistureand contaminants should be of concern since real under-ground water contains a variety of contaminants, includingsurfactants, which may enhance moisture ingress.
The cables examined suggest that moisture diffusion caneasily penetrate a cable core in the axial direction bymoving between the surfaces of the OIP via the slotwithin the helically wrapped layers. It is much more difficultfor moisture to directly diffuse radially to the underneath
281
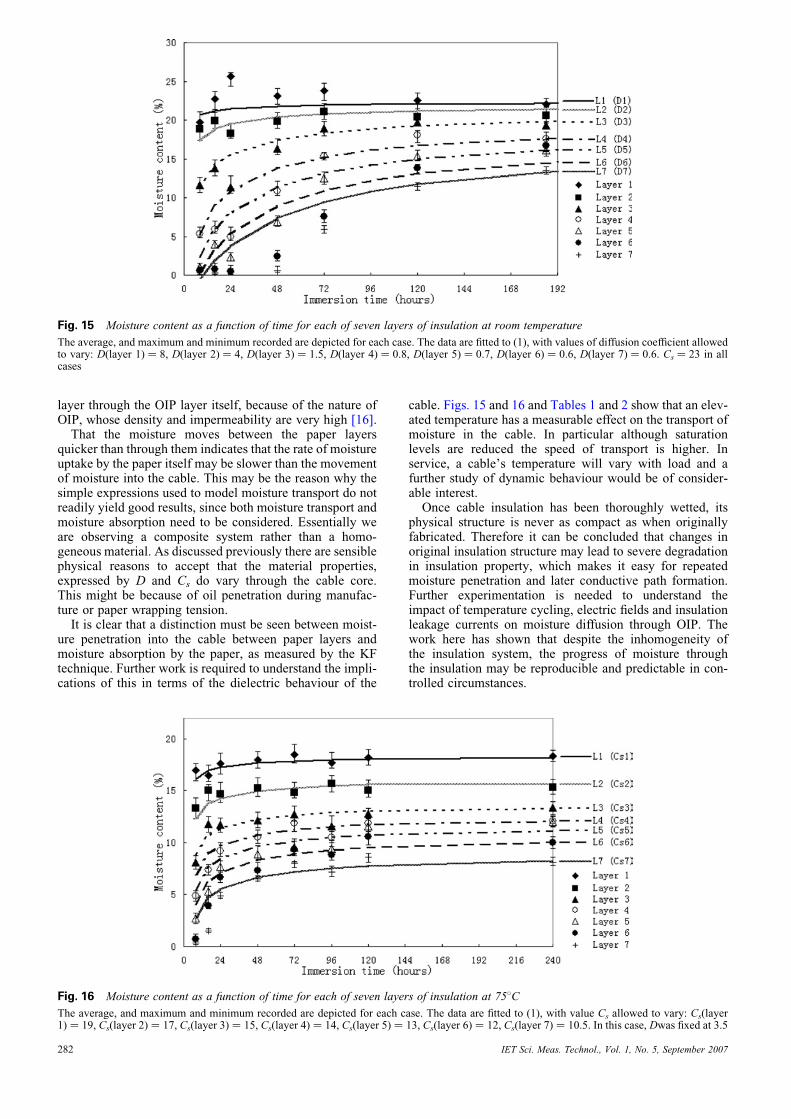
Fig. 15 Moisture content as a function of time for each of seven layers of insulation at room temperature
The average, and maximum and minimum recorded are depicted for each case. The data are fitted to (1), with values of diffusion coefficient allowedto vary: D(layer 1) ¼ 8, D(layer 2) ¼ 4, D(layer 3) ¼ 1.5, D(layer 4) ¼ 0.8, D(layer 5) ¼ 0.7, D(layer 6) ¼ 0.6, D(layer 7) ¼ 0.6. Cs ¼ 23 in allcases
layer through the OIP layer itself, because of the nature ofOIP, whose density and impermeability are very high [16].
That the moisture moves between the paper layersquicker than through them indicates that the rate of moistureuptake by the paper itself may be slower than the movementof moisture into the cable. This may be the reason why thesimple expressions used to model moisture transport do notreadily yield good results, since both moisture transport andmoisture absorption need to be considered. Essentially weare observing a composite system rather than a homo-geneous material. As discussed previously there are sensiblephysical reasons to accept that the material properties,expressed by D and Cs do vary through the cable core.This might be because of oil penetration during manufac-ture or paper wrapping tension.
It is clear that a distinction must be seen between moist-ure penetration into the cable between paper layers andmoisture absorption by the paper, as measured by the KFtechnique. Further work is required to understand the impli-cations of this in terms of the dielectric behaviour of the
282
cable. Figs. 15 and 16 and Tables 1 and 2 show that an elev-ated temperature has a measurable effect on the transport ofmoisture in the cable. In particular although saturationlevels are reduced the speed of transport is higher. Inservice, a cable’s temperature will vary with load and afurther study of dynamic behaviour would be of consider-able interest.
Once cable insulation has been thoroughly wetted, itsphysical structure is never as compact as when originallyfabricated. Therefore it can be concluded that changes inoriginal insulation structure may lead to severe degradationin insulation property, which makes it easy for repeatedmoisture penetration and later conductive path formation.Further experimentation is needed to understand theimpact of temperature cycling, electric fields and insulationleakage currents on moisture diffusion through OIP. Thework here has shown that despite the inhomogeneity ofthe insulation system, the progress of moisture throughthe insulation may be reproducible and predictable in con-trolled circumstances.
Fig. 16 Moisture content as a function of time for each of seven layers of insulation at 758CThe average, and maximum and minimum recorded are depicted for each case. The data are fitted to (1), with value Cs allowed to vary: Cs(layer1) ¼ 19, Cs(layer 2) ¼ 17, Cs(layer 3) ¼ 15, Cs(layer 4) ¼ 14, Cs(layer 5) ¼ 13, Cs(layer 6) ¼ 12, Cs(layer 7) ¼ 10.5. In this case, Dwas fixed at 3.5
IET Sci. Meas. Technol., Vol. 1, No. 5, September 2007
6 Conclusion
The use of dye in water is a useful way to trace moisture dif-fusion through OIP insulation, by visual inspection.Combined with KF titration the progress of water can betraced and quantified through a cable using destructivetests. Moisture diffusion is not uniform within a sector-shaped core. In particular, lower concentrations of waterare found in the paper in regions with low radii of curvaturearound the core. The likely reasons for this are associatedwith paper wrapping tension and oil content.
Moisture can readily diffuse in slots formed betweenpaper edges and that diffusion tends to occur betweenpaper surfaces rather than through their bulk. The helicalbutt-gap slots formed within the paper layers are criticalto the diffusion of moisture both along the cable andthrough the insulation system.
Elevated temperature is shown to increase the speed ofmoisture transport to the inner layers, but reduce the satur-ation levels within the core. Further work is required to linkthe moisture diffusion process to cable failure, but theevidence produced suggests that this macroscopic model-ling of behaviour may yield a deterministic model of LVfailure in the future.
7 Acknowledgment
The authors are grateful to EDF Energy for the fundingwhich enabled this work to be carried out.
8 References
1 Moore, G.F.: ‘Electric cables handbook’ (Blackwell Science, 1997,3rd edn.)
IET Sci. Meas. Technol., Vol. 1, No. 5, September 2007
2 Rowland, S.M., Wang, M., and Van Luijk, N.G.: ‘Mechanisms offailure in oil and paper insulated low voltage distribution cables’.3rd IEE Int. Conf. Reliability of Transmission and DistributionNetworks, 2005, pp. 167–171
3 Cherukupalli, S., Buchholz, V., Colwell, M., Crine, J.P., and Keefe,R.J.: ‘Condition assessment of distribution PILC cables fromelectrical, chemical, and dielectric measurements’, IEEE Electr.Insul. Mag., 2004, 20, (4), pp. 6–12
4 Zaengl, W.S.: ‘Dielectric spectroscopy in time and frequency domainfor HV power equipment, part I: theoretical considerations’, IEEEElectr. Insul. Mag., 2003, 19, (5), pp. 5–19
5 Gubanski, S.M., and Boss, P.: ‘Dielectric response methods fordiagnostics of power transformers’, IEEE Electr. Insul. Mag., 2003,19, pp. 12–18
6 Neimanis, R., Saha, T.K., and Eriksson, R.: ‘Determination ofmoisture content in mass impregnated cable insulation using lowfrequency dielectric spectroscopy’. IEEE Power Engineering SocietySummer Meeting, USA, 2000, pp. 463–468
7 Neimanis, R., and Eriksson, R.: ‘Diagnosis of moisture in oil/paperdistribution cables-Part I: Estimation of moisture content usingfrequency-domain spectroscopy’, IEEE Trans. Power Delivery,2004, 19, (1), pp. 9–14
8 Densley, J.: ‘Ageing mechanisms and diagnostics for power cables – anoverview’, IEEE Electr. Insul. Mag., 2001, 17, (1), pp. 14–22
9 Rowland, S.M., Wang, M., and Michel, M.: ‘Effect of moisturediffusion and heat cycling on low voltage oil-impregnated-paperinsulation distribution cables’. IEEE Conf. Electrical Insulation andDielectric Phenomena, 2006, pp. 237–240
10 Wang, M., Rowland, S.M., and Van Luijk, N.G.: ‘The influence ofmoisture on low voltage oil-and-paper insulated distribution cables’.IEEE Conf. Electrical Insulation and Dielectric Phenomena,Nashville, 2005, pp. 112–115
11 Shewmon, P.: ‘Diffusion in solids’ (The Minerals, Metals & MaterialsSociety, 1989, 2nd edn.), pp. 10–23
12 John, V.: ‘Introduction to engineering materials’ (MacMillan,London, 1992, 3rd edn.), pp. 158–159
13 Wang, M., Rowland, S.M., and Clements, P.: ‘A mechanism of failureof oil-impregnated paper low-voltage cables’. 10th Int. ElectricalInsulation Conf., Insucon, Birmimgham, 2006, pp. 178–182
14 http://www.tramfloc.com/tf74.html, accessed February 200715 http://www.brightdyes.com/index.html, accessed February 200716 Richard, M.E.: ‘Handbook of physical and mechanical testing of
paper and paperboard’ (Marcel Dekker, 1984), vol. 2, pp. 216–218
283