moisture migration through chocolate-flavored …
TRANSCRIPT

The Pennsylvania State University
The Graduate School
Department of Food Science
MOISTURE MIGRATION THROUGH CHOCOLATE-FLAVORED COATINGS
A Thesis in
Food Science
by
Vikramaditya Ghosh
Submitted in Partial Fulfillment of the Requirements
for the Degree of
Doctor of Philosophy
August 2003

The thesis of Vikramaditya has been reviewed and approved* by the following: Ramaswamy C. Anantheswaran Professor of Food Science Thesis Co-Advisor Chair of Committee Gregory R. Ziegler Associate Professor of Food Science Thesis Co-Advisor John N. Coupland Assistant Professor of Food Science John. L. Duda Professor of Chemical Engineering John. D. Floros Professor of Food Science Head of the Department of Food Science
*Signatures are on file in the Graduate School.

iii
ABSTRACT
The mechanism of moisture migration through chocolate-flavored coatings was
investigated in this study. An approach, developed by Weisz (1967) to understand
diffusion in heterogeneous materials, was used to elucidate the mechanism of moisture
migration through chocolate-flavored coatings.
In chocolate-flavored coatings, the sucrose and cocoa powder particles are
embedded in the continuous fat phase. It was hypothesized that the unsteady-state
diffusivity of moisture through the coatings could be estimated from the diffusivity of
water through the continuous fat phase and the partition coefficient of moisture between
the hydrophilic particles and the fat phase. Therefore, to predict moisture diffusivity
through a chocolate-flavored coating, the moisture sorption isotherms for all the
constituents of the coating and the diffusion coefficient through the fat phase are
required.
The moisture adsorption isotherms for sugar, cocoa powder, coconut oil, and
coconut oil + 0.5% lecithin were obtained by equilibration over saturated salt solutions.
It was found that up to an aw of 0.85, cocoa powder adsorbed more moisture than any
other component. The presence of lecithin increased the moisture adsorption capacity of
oil. The moisture adsorption isotherm for a coating made with 70% coconut oil + 0.5%
lecithin and 30% sugar was also determined. The equilibrium moisture content, for this
coating, at each water activity level was higher than the individual constituents, i.e., sugar
or coconut oil + 0.5% lecithin. One possible reason for this observation is that there is a
iv
layer of moisture present between the surface of the sugar particles and the polar regions
of lecithin.
The diffusion coefficient, of moisture diffusing through fat, was obtained by time-
lag experiments. The predicted diffusion coefficient through a coating containing fat and
varying amounts of sucrose and cocoa powder were determined. Experiments were
conducted with coatings containing different amounts of sucrose and cocoa powder to
validate the model. For coatings containing just coconut oil and cocoa powder, the
diffusion of moisture in the dispersed phase, i.e. cocoa powder, occurred through the
cocoa powder particle. When lecithin was added, the water molecules diffused through
the cocoa powder particles as well as along their surfaces. When coatings contained
sucrose and lecithin and the water activity was 0.85, the sucrose molecules dissolved in
the migrating moisture and were transported to surface, where upon evaporation of the
water sucrose crystals were deposited. With diffusion of moisture there were structural
changes that altered the diffusivity of moisture through the coating. The structural
changes occurred because the sucrose particles dissolved in the migrating moisture and
cocoa powder particles swelled in the presence of moisture.
The effect of sucrose, cocoa powder, emulsifier, fat type, and storage environment
on the water vapor permeability (WVP) of a chocolate-flavored coating was also studied.
In addition, optical microscope images of cocoa powder and SEM images of the structure
of two different coatings were obtained. A coating containing more than 20% cocoa
powder (w/w) significantly increased the WVP; a coating containing 60% sucrose
significantly decreased the WVP. There was an increase in the WVP with an increase in

v
the absolute value of the relative humidity across the film. The increase in WVP at
higher absolute humidity was caused due to structural changes in the coatings. The WVP
of fat based films decreased with an increase in the solid fat content (SFC).

TABLE OF CONTENTS
LIST OF FIGURES ..................................................................................................... ix
LIST OF TABLES....................................................................................................... xiv
ACKNOWLEDGMENTS ........................................................................................... xx
Chapter 1 INTRODUCTION....................................................................................... 1
Chapter 2 LITERATURE REVIEW............................................................................ 3
2.1 Theoretical Aspects of Diffusion.................................................................... 5 2.1.1 Mathematical Analysis ......................................................................... 6 2.1.2 Diffusion Coefficient............................................................................ 10 2.1.3 Structural Effects .................................................................................. 12 2.1.4 Thermodynamic Interactions................................................................ 17 2.1.5 Diffusion Mechanism ........................................................................... 18
2.2 Moisture Migration......................................................................................... 20 2.2.1 Moisture Sorption Isotherm.................................................................. 21 2.2.2 Measurement Methods for Moisture Migration ................................... 29
2.2.2.1 Gravimetric Technique (ASTM E96) ........................................ 29 2.2.2.2 Infrared Sensor Technique (ASTM F-372) ................................ 32
2.2.3 Factors Affecting Moisture Migration Through Chocolates ................ 33 2.2.4 Mechanism of Moisture Migration....................................................... 40 2.2.5 Methods of Control for Moisture Migration ........................................ 46
2.3 Statement of the Problem................................................................................ 47 2.4 Hypothesis ...................................................................................................... 47 2.5 Objectives ....................................................................................................... 49 2.6 References....................................................................................................... 51
Chapter 3 MECHANISM OF MOISTURE MIGRATION THROUGH CHOCOLATE-FLAVORED COATINGS .......................................................... 60
3.1 Abstract........................................................................................................... 60 3.2 Introduction..................................................................................................... 61 3.3 Mathematical Analysis of Diffusion Through Dark Chocolate...................... 62 3.4 Materials and Methods ................................................................................... 68
3.4.1 Materials ............................................................................................... 68 3.4.1.1 Sucrose ....................................................................................... 68 3.4.1.2 Cocoa Powder ............................................................................ 69 3.4.1.3 Coconut Oil ................................................................................ 69

vii
3.4.1.4 Lecithin....................................................................................... 69 3.4.2 Experimental Design ............................................................................ 70 3.4.3 Measurement of Moisture Content ....................................................... 71 3.4.4 Moisture Sorption Isotherm.................................................................. 74 3.4.5 Film Preparation ................................................................................... 76 3.4.6 Measurement of Diffusion Coefficient................................................. 79
3.4.6.1 Controlled Environment Setup................................................... 79 3.4.6.2 Experimental Procedure ............................................................. 81
3.4.7 Water Vapor Permeability.................................................................... 83 3.5 Results and Discussion ................................................................................... 84
3.5.1 Moisture Sorption Isotherm.................................................................. 84 3.5.2 Diffusion Coefficients .......................................................................... 87
3.5.2.1 Diffusion of Moisture through Coatings Containing Cocoa Powder ............................................................................................ 88
3.5.2.2 Diffusion of Moisture through Coatings Containing Sucrose.... 93 3.5.3 Water Vapor Permeability.................................................................... 100
3.6 Conclusions..................................................................................................... 102 3.7 References....................................................................................................... 104
Chapter 4 EFFECT OF INGREDIENTS ON MOISTURE MIGRATION THROUGH CHOCOLATE-FLAVORED COATINGS...................................... 107
4.1 Abstract........................................................................................................... 107 4.2 Introduction..................................................................................................... 107 4.3 Materials and Methods ................................................................................... 111
4.3.1 Ingredients ............................................................................................ 111 4.3.1.1 Sugars ......................................................................................... 111 4.3.1.2 Cocoa Powder ............................................................................ 112 4.3.1.3 Fats ............................................................................................. 113 4.3.1.4 Emulsifiers ................................................................................. 114
4.3.2 Experimental Design ............................................................................ 115 4.3.3 Measurement of Moisture Content ....................................................... 117 4.3.4 Moisture Sorption Isotherm.................................................................. 119 4.3.5 Sample Preparation............................................................................... 120 4.3.6 Method for Measurement of Water Vapor Permeability...................... 122
4.3.6.1 Controlled Environment Setup................................................... 124 4.3.6.2 Experimental Setup .................................................................... 126
4.3.7 Scanning Electron Microscopy............................................................. 127 4.3.8 Structural Changes on Swelling ........................................................... 128 4.3.9 Water Transmission Studies at sub-Zero Temperatures....................... 129
4.4 Results and Discussion ................................................................................... 132 4.4.1 Effect of Coating Thickness ................................................................. 132 4.4.2 Effect of Ingredient Proportions on WVP of Coatings ........................ 135 4.4.3 Effect of Absolute Relative Humidity on WVP of Coatings ............... 144 4.4.4 Swelling of Cocoa Powder ................................................................... 152

viii
4.4.5 Structure of Coatings............................................................................ 154 4.4.6 Effect of Solid Fat Content................................................................... 156 4.4.7 Effect of Cocoa Powder type, Sugar, and Emulsifier........................... 157
4.5 Conclusions..................................................................................................... 159 4.6 References....................................................................................................... 160
Chapter 5 CONCLUSIONS AND RECOMMENDATIONS FOR FUTURE RESEARCH ......................................................................................................... 164
Appendix A DEVELOPMENT OF A METHOD TO MEASURE THE WATER VAPOR TRANSMISSION RATE....................................................................... 167
Appendix B MOISTURE SORPTION AND DIFFUSION COEFFICIENT DATA.. 172
B.1 Moisture Sorption Isotherms.......................................................................... 172 B.1.1 Coconut Oil.......................................................................................... 172 B.1.2 Coconut Oil + 0.5% lecithin ................................................................ 172 B.1.3 Sugar .................................................................................................... 173 B.1.4 Cocoa Powder ...................................................................................... 173 B.1.5 Coconut oil + 30% Sugar + 0.5% Lecithin.......................................... 174
B.2 Diffusion Coefficients.................................................................................... 174 B.2.1 Coconut Oil and Coconut Oil + 0.5% Lecithin ................................... 174 B.2.2 Coatings Containing Sugar .................................................................. 175 B.2.3 Coatings Containing Sugar and Lecithin ............................................. 176 B.2.4 Coatings Containing Cocoa Powder .................................................... 179 B.2.5 Coatings Containing Cocoa Powder and Lecithin............................... 182
Appendix C WATER VAPOR PERMEABILITY DATA.......................................... 188
C.1 Effect of Coating Thickness........................................................................... 188 C.2 Mixture Experiment ....................................................................................... 190 C.3 Effect of Ingredients....................................................................................... 200
C.3.1 Effect of Solid Fat Content on Water Vapor Permeability .................. 204 C.4 Effect of Humidity on Water Vapor Permeability ......................................... 208 C.5 Augmented Design Data ................................................................................ 209 C.6 Qualitative Study Pictures.............................................................................. 214
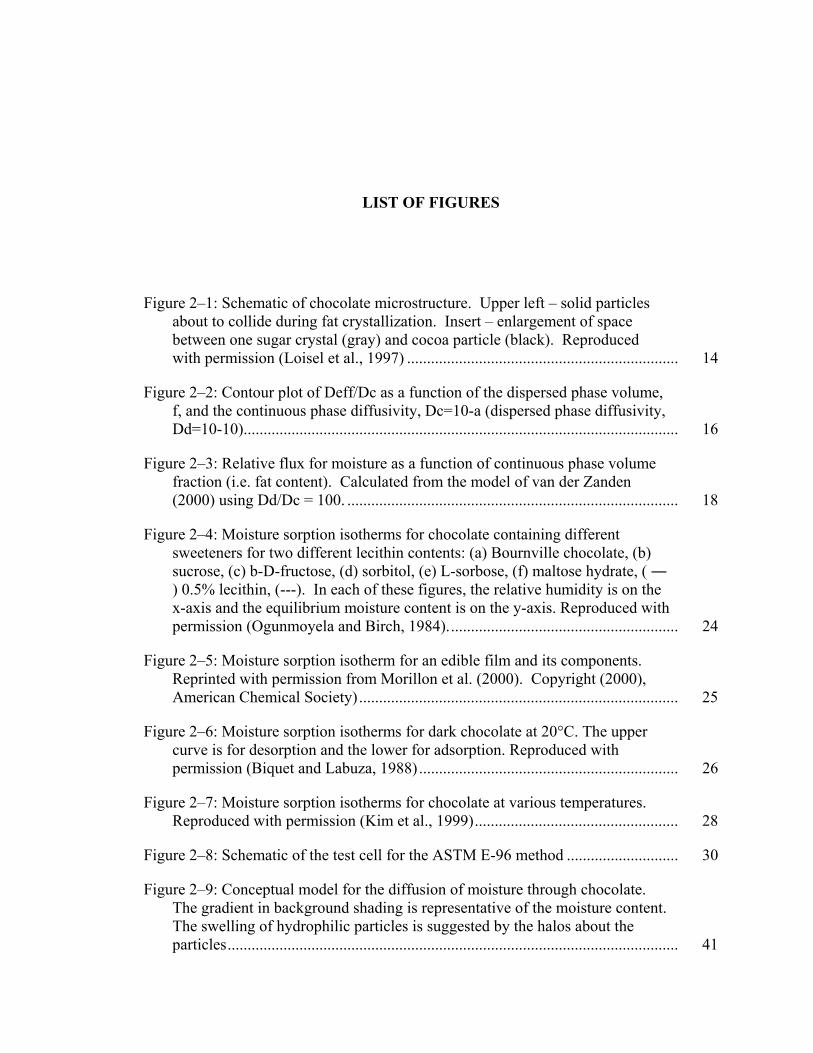
LIST OF FIGURES
Figure 2–1: Schematic of chocolate microstructure. Upper left – solid particles about to collide during fat crystallization. Insert – enlargement of space between one sugar crystal (gray) and cocoa particle (black). Reproduced with permission (Loisel et al., 1997) .................................................................... 14
Figure 2–2: Contour plot of Deff/Dc as a function of the dispersed phase volume, f, and the continuous phase diffusivity, Dc=10-a (dispersed phase diffusivity, Dd=10-10)............................................................................................................. 16
Figure 2–3: Relative flux for moisture as a function of continuous phase volume fraction (i.e. fat content). Calculated from the model of van der Zanden (2000) using Dd/Dc = 100. ................................................................................... 18
Figure 2–4: Moisture sorption isotherms for chocolate containing different sweeteners for two different lecithin contents: (a) Bournville chocolate, (b) sucrose, (c) b-D-fructose, (d) sorbitol, (e) L-sorbose, (f) maltose hydrate, ( ― ) 0.5% lecithin, (---). In each of these figures, the relative humidity is on the x-axis and the equilibrium moisture content is on the y-axis. Reproduced with permission (Ogunmoyela and Birch, 1984).......................................................... 24
Figure 2–5: Moisture sorption isotherm for an edible film and its components. Reprinted with permission from Morillon et al. (2000). Copyright (2000), American Chemical Society)................................................................................ 25
Figure 2–6: Moisture sorption isotherms for dark chocolate at 20°C. The upper curve is for desorption and the lower for adsorption. Reproduced with permission (Biquet and Labuza, 1988)................................................................. 26
Figure 2–7: Moisture sorption isotherms for chocolate at various temperatures. Reproduced with permission (Kim et al., 1999)................................................... 28
Figure 2–8: Schematic of the test cell for the ASTM E-96 method ............................ 30
Figure 2–9: Conceptual model for the diffusion of moisture through chocolate. The gradient in background shading is representative of the moisture content. The swelling of hydrophilic particles is suggested by the halos about the particles................................................................................................................. 41

x
Figure 2–10: Kinetics of moisture sorption for dark chocolates at 20°C and varying relative humidity. Reproduced with permission (Biquet and Labuza, 1988). .................................................................................................................... 43
Figure 2–11: Modeling of moisture transfer through a chocolate film. Reprinted from (Rumsey and Krochta, 1994), with permission from Technomic Publishing Co., Inc., copyright [1994]) ................................................................ 45
Figure 3–1: Schematic of a structure of dark chocolate .............................................. 64
Figure 3–2: Setup for measuring moisture sorption isotherm ..................................... 76
Figure 3–3: Picture of the mold for making the chocolate coatings (hole diameter = 9 cm).................................................................................................................. 79
Figure 3–4: Temperature and relative humidity inside the plastic chamber................ 81
Figure 3–5: Setup for measuring the diffusivity of the fat coatings ............................ 82
Figure 3–6: Approach to steady state for a coating using the time lag method........... 83
Figure 3–7: Moisture sorption isotherm of sucrose and cocoa powder at 19oC .......... 85
Figure 3–8: Moisture sorption isotherm of sugar, coconut oil, and a mixture of coconut oil + 0.5% lecithin................................................................................... 86
Figure 3–9: Weight loss data for coatings containing 20% cocoa powder. The numbers in brackets are the thickness of the coatings in mm. (cp = cocoa powder, l = lecithin).............................................................................................. 89
Figure 3–10: Weight loss data for coatings containing 30% cocoa powder. The numbers in brackets are the thickness of the coatings in mm. (cp = cocoa powder, l = lecithin).............................................................................................. 90
Figure 3–11: Weight loss data for coatings containing 40% cocoa powder. The numbers in brackets are the thickness of the coatings in mm. (cp = cocoa powder, l = lecithin).............................................................................................. 91
Figure 3–12: Predicted versus the experimental data for coatings containing cocoa powder. Lines marked equation 3.4 or 3.5 are the effective diffusivity calculated using either equation 3.4 or 3.5. .......................................................... 92
Figure 3–13: Predicted versus the experimental data for coatings containing cocoa powder plus lecithin. Lines marked equation 3.4 or 3.5 are the effective diffusivity calculated using either equation 3.4 or 3.5.......................................... 93

xi
Figure 3–14: Weight loss of coatings containing sucrose. The numbers in brackets denote the thickness in mm .................................................................... 94
Figure 3–15: Weight loss of coatings containing sucrose and lecithin. The numbers in brackets denote the thickness in mm ................................................. 95
Figure 3–16: Predicted versus the experimental data for coatings containing sucrose. Lines marked equation 3.4 or 3.5 are the effective diffusivity calculated using either equation 3.4 or 3.5. .......................................................... 96
Figure 3–17: Predicted versus the experimental data for coatings containing sucrose plus lecithin. Lines marked equation 3.4 or 3.5 are the effective diffusivity calculated using either equation 3.4 or 3.5.......................................... 98
Figure 3–18: Moisture adsorption isotherm for sugar, coconut oil + 0.5% lecithin, and 30% sugar in coconut oil + 0.5% lecithin ...................................................... 99
Figure 3–19: Effect of ingredients and volume fraction on the water vapor permeability of coatings containing sucrose or cocoa powder............................. 101
Figure 3–20: Effect of ingredients and volume fraction on the water vapor permeability of coatings containing sucrose and lecithin or cocoa powder and lecithin. ................................................................................................................. 102
Figure 4–1: Structure of Citrem (Matissek, 2002)....................................................... 115
Figure 4–2: Picture of the mold for making the chocolate coatings (hole diameter = 9 cm).................................................................................................................. 121
Figure 4–3: Schematic of the test cell for the ASTM E-96 method ............................ 123
Figure 4–4: Picture of a test cell with the coating film................................................ 123
Figure 4–5: Picture of the setup for measuring the water vapor transmission rate of the coatings....................................................................................................... 124
Figure 4–6: Temperature and relative humidity inside the plastic chamber................ 126
Figure 4–7: Schematic diagram of the modified test cell used for measuring WVP at sub-zero temperatures ....................................................................................... 131
Figure 4–8: Schematic of the setup for measuring the water transmission through the coatings at negative temperature..................................................................... 131
Figure 4–9: Picture of the actual setup for measuring the water vapor transmission rate at –5oC........................................................................................................... 132

xii
Figure 4–10: Effect of coating thickness on the water vapor transmission rate at 20oC. The coating contains 15% cocoa powder and 85% coconut oil. The thickness of the coatings are given in mm............................................................ 135
Figure 4–11: Three dimensional surface plot of the fitted model for permeability data obtained from the mixture experiments ........................................................ 139
Figure 4–12: Three dimensional surface plot of the fitted model for permeability data obtained from the mixture experiments ........................................................ 143
Figure 4–13: Picture of the generic coating kept at humidity conditions of 75% on the outside and 33% in the bottom of the cell ...................................................... 145
Figure 4–14: Picture of the generic coating kept at humidity conditions of 75% on the outside and 54.5% in the bottom of the cell. .................................................. 146
Figure 4–15: Moisture sorption isotherms of sucrose and cocoa powder ................... 147
Figure 4–16: Weight gain versus storage time for a coating sample containing 50% cocoa powder with different relative humidity at the low humidity end. The numbers 1 and 2 at the end of the humidity in the legend signifies the sample numbers. The sample that did not cracked during the experiment is shown with an arrow as intact sample. The humidity at the high end was 75%. ...................................................................................................................... 148
Figure 4–17: Picture of a coating, containing 50% cocoa powder by weight, after 12 days with a humidity gradient of 75 – 3.5%.................................................... 149
Figure 4–18: Change in the voltage with storage time for coatings stored at –5 oC.... 151
Figure 4–19: Picture of the dry cocoa powder kept in shallow pans ........................... 153
Figure 4–20: Picture of hydrated cocoa powder .......................................................... 153
Figure 4–21: Structure of a section of dry generic coating seen using cryo SEM....... 155
Figure 4–22: Structure of a dry coating with 50% cocoa powder as seen under cryo SEM.............................................................................................................. 156
Figure 4–23: Effect of SFC on the WVP of fat coatings ............................................. 157
Figure 4–24: Picture of a cup with a generic coating that has a humidity of 85% inside the cup and 13% outside ............................................................................ 159
Figure A–1: Schematic of a test cell ............................................................................ 167
Figure A–2: Setup for measuring WVTR using desiccators ....................................... 168

xiii
Figure A–3: Time to reach equilibrium humidity in a desiccator and the box fitted with a fan (convection) ......................................................................................... 169
Figure A–4: Setup for measuring the water vapor transmission rate at 20oC.............. 170
Figure B–1: Adsorption of lecithin on sugar at water activities > 0.8. Model proposed by Garbolino (2002).............................................................................. 187
Figure C–1: Coating with 50% cocoa powder after 14 weeks of storage at -5C......... 215
Figure C–2: Coating with 40% cocoa powder after 14 weeks of storage at -5C......... 216
Figure C–3: Coating with 30% cocoa powder after 14 weeks of storage at -5C......... 217
Figure C–4: Coating with 20% cocoa powder after 14 weeks of storage at -5C......... 218
Figure C–5: Coating with 20% sucrose after 14 weeks of storage at -5C ................... 219

LIST OF TABLES
Table 2–1: Common terms used to describe barrier properties of edible films Reprinted from (Donhowe and Fennema, 1994), with permission from Technomic Publishing Co., Inc., copyright [1994]) ............................................. 10
Table 2–2: GAB constants at each aw value for dark chocolates at 20 oC (Biquet and Labuza, 1988) ................................................................................................ 27
Table 2–3: Effective water vapor permeability constants (keff) and water vapor transmission rate (WVTR) for a dark chocolate film at 20oC as determined by the cup method in two different configurations: (1) Drierite in the cup and salt solution outside, (2) saturated salt solution in the cup and Drierite outside (Biquet and Labuza, 1988) ................................................................................... 31
Table 2–4: Effective water vapor permeability constant (keff) and water vapor transmission rate (WVTR) of a dark chocolate at 20oC for three different thicknesses (Biquet and Labuza, 1988) ................................................................ 34
Table 2–5: Permeability data from (Landmann et al., 1960)...................................... 35
Table 2–6: Effective water vapor permeability constant (keff) and water vapor transmission rate (WVTR) as a function of the water vapor pressure gradient (Dp) for dark chocolate at 20oC (Biquet and Labuza, 1988) ............................... 37
Table 2–7: Effective water vapor permeability constant (keff) and water vapor transmission rate (WVTR) of a dark chocolate at 20oC for three different temperatures (Biquet and Labuza, 1988).............................................................. 39
Table 2–8: Effective Diffusion Coefficient of moisture through Dark Chocolate Film at 20oC (Biquet and Labuza, 1988) .............................................................. 44
Table 3–1: Experimental design for the moisture diffusion experiments.................... 70
Table 3–2: Partition coefficient of sucrose and cocoa powder with respect to oil or oil + 0.5% lecithin at different water activities..................................................... 87
Table 4–1: Solid Fat Contents of the Moisture Barrier Fats at 20oC........................... 114
Table 4–2: Mixture experimental design for studying the effect of sucrose, cocoa powder and lecithin............................................................................................... 116
xv
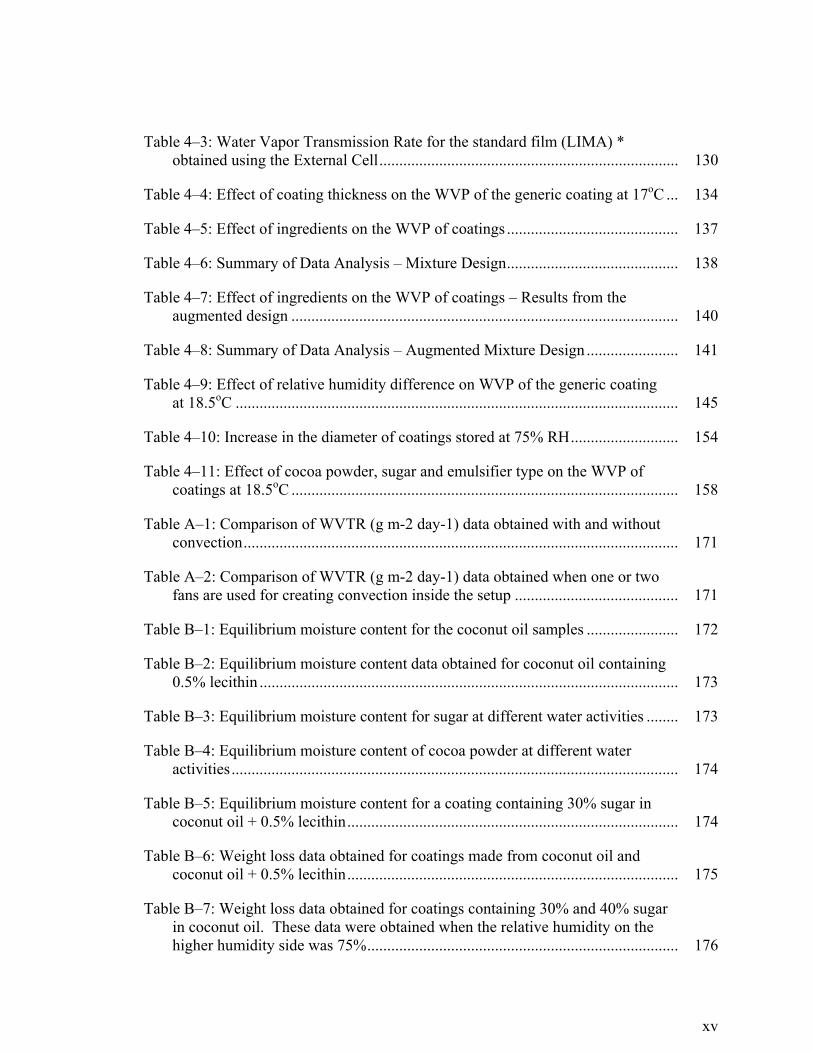
Table 4–3: Water Vapor Transmission Rate for the standard film (LIMA) * obtained using the External Cell........................................................................... 130
Table 4–4: Effect of coating thickness on the WVP of the generic coating at 17oC ... 134
Table 4–5: Effect of ingredients on the WVP of coatings ........................................... 137
Table 4–6: Summary of Data Analysis – Mixture Design........................................... 138
Table 4–7: Effect of ingredients on the WVP of coatings – Results from the augmented design ................................................................................................. 140
Table 4–8: Summary of Data Analysis – Augmented Mixture Design ....................... 141
Table 4–9: Effect of relative humidity difference on WVP of the generic coating at 18.5oC ............................................................................................................... 145
Table 4–10: Increase in the diameter of coatings stored at 75% RH........................... 154
Table 4–11: Effect of cocoa powder, sugar and emulsifier type on the WVP of coatings at 18.5oC ................................................................................................. 158
Table A–1: Comparison of WVTR (g m-2 day-1) data obtained with and without convection............................................................................................................. 171
Table A–2: Comparison of WVTR (g m-2 day-1) data obtained when one or two fans are used for creating convection inside the setup ......................................... 171
Table B–1: Equilibrium moisture content for the coconut oil samples ....................... 172
Table B–2: Equilibrium moisture content data obtained for coconut oil containing 0.5% lecithin ......................................................................................................... 173
Table B–3: Equilibrium moisture content for sugar at different water activities ........ 173
Table B–4: Equilibrium moisture content of cocoa powder at different water activities................................................................................................................ 174
Table B–5: Equilibrium moisture content for a coating containing 30% sugar in coconut oil + 0.5% lecithin................................................................................... 174
Table B–6: Weight loss data obtained for coatings made from coconut oil and coconut oil + 0.5% lecithin................................................................................... 175
Table B–7: Weight loss data obtained for coatings containing 30% and 40% sugar in coconut oil. These data were obtained when the relative humidity on the higher humidity side was 75%.............................................................................. 176
xvi
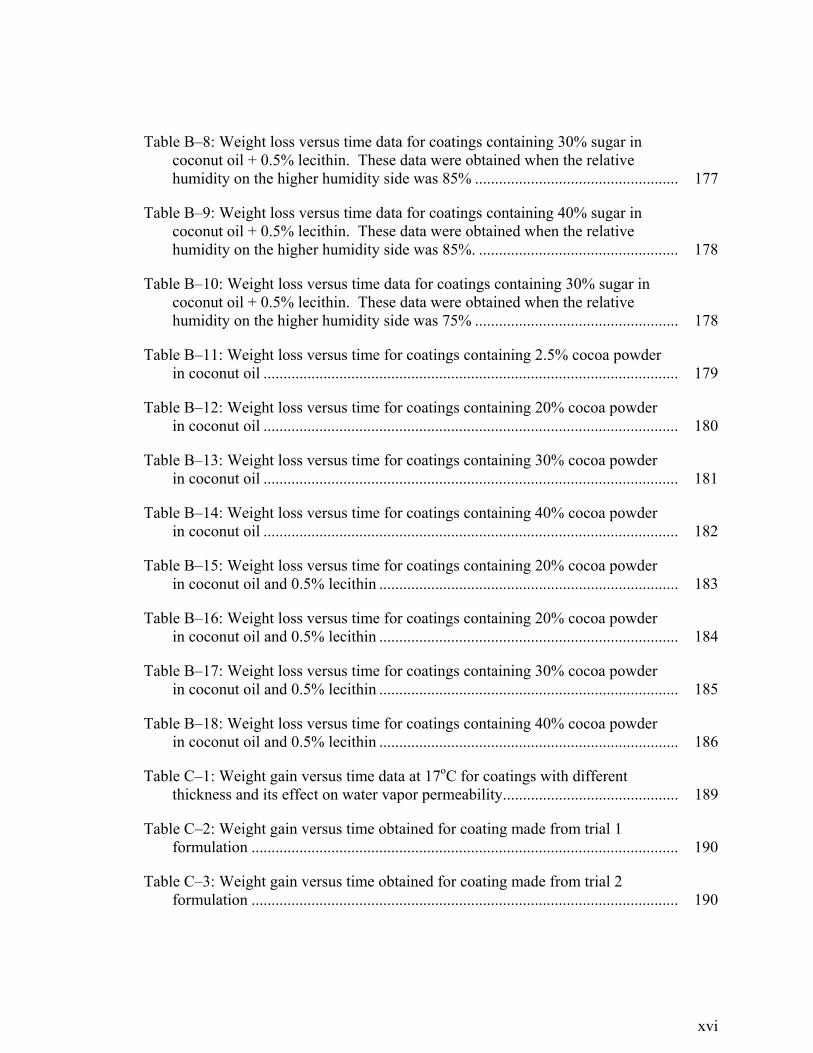
Table B–8: Weight loss versus time data for coatings containing 30% sugar in coconut oil + 0.5% lecithin. These data were obtained when the relative humidity on the higher humidity side was 85% ................................................... 177
Table B–9: Weight loss versus time data for coatings containing 40% sugar in coconut oil + 0.5% lecithin. These data were obtained when the relative humidity on the higher humidity side was 85%. .................................................. 178
Table B–10: Weight loss versus time data for coatings containing 30% sugar in coconut oil + 0.5% lecithin. These data were obtained when the relative humidity on the higher humidity side was 75% ................................................... 178
Table B–11: Weight loss versus time for coatings containing 2.5% cocoa powder in coconut oil ........................................................................................................ 179
Table B–12: Weight loss versus time for coatings containing 20% cocoa powder in coconut oil ........................................................................................................ 180
Table B–13: Weight loss versus time for coatings containing 30% cocoa powder in coconut oil ........................................................................................................ 181
Table B–14: Weight loss versus time for coatings containing 40% cocoa powder in coconut oil ........................................................................................................ 182
Table B–15: Weight loss versus time for coatings containing 20% cocoa powder in coconut oil and 0.5% lecithin ........................................................................... 183
Table B–16: Weight loss versus time for coatings containing 20% cocoa powder in coconut oil and 0.5% lecithin ........................................................................... 184
Table B–17: Weight loss versus time for coatings containing 30% cocoa powder in coconut oil and 0.5% lecithin ........................................................................... 185
Table B–18: Weight loss versus time for coatings containing 40% cocoa powder in coconut oil and 0.5% lecithin ........................................................................... 186
Table C–1: Weight gain versus time data at 17oC for coatings with different thickness and its effect on water vapor permeability............................................ 189
Table C–2: Weight gain versus time obtained for coating made from trial 1 formulation ........................................................................................................... 190
Table C–3: Weight gain versus time obtained for coating made from trial 2 formulation ........................................................................................................... 190

xvii
Table C–4: Weight gain versus time obtained for coating made from trial 3 formulation ........................................................................................................... 191
Table C–5: Weight gain versus time obtained for coating made from trial 4 formulation ........................................................................................................... 191
Table C–6: Weight gain versus time obtained for coating made from trial 5 formulation ........................................................................................................... 192
Table C–7: Weight gain versus time obtained for coating made from trial 6 formulation ........................................................................................................... 192
Table C–8: Weight gain versus time obtained for coating made from trial 7 formulation ........................................................................................................... 193
Table C–9: Weight gain versus time obtained for coating made from trial 8 formulation ........................................................................................................... 193
Table C–10: Weight gain versus time obtained for coating made from trial 9 formulation ........................................................................................................... 194
Table C–11: Weight gain versus time obtained for coating made from trial 10 formulation ........................................................................................................... 194
Table C–12: Weight gain versus time obtained for coating made from trial 11 formulation ........................................................................................................... 195
Table C–13: Weight gain versus time obtained for coating made from trial 12 formulation ........................................................................................................... 195
Table C–14: Weight gain versus time obtained for coating made from trial 13 formulation ........................................................................................................... 196
Table C–15: Weight gain versus time obtained for coating made from trial 14 formulation ........................................................................................................... 196
Table C–16: Weight gain versus time obtained for coating made from trial 15 formulation ........................................................................................................... 197
Table C–17: Weight gain versus time obtained for coating made from trial 1 formulation. Second replicate............................................................................... 197
Table C–18: Weight gain versus time obtained for coating made from trial 2 formulation. Second replicate............................................................................... 198
xviii
Table C–19: Weight gain versus time obtained for coating made from trial 3 formulation. Second replicate.............................................................................. 198
Table C–20: Weight gain versus time obtained for coating made from trial 4 formulation. Second replicate............................................................................... 199
Table C–21: Weight gain versus time obtained for coating made from trial 5 formulation. Second replicate............................................................................... 199
Table C–22: Weight gain versus time obtained for a generic coating.(Set 1) ............. 200
Table C–23: Weight gain versus time obtained for a generic coating.(Set 2) ............. 200
Table C–24: Weight gain versus time obtained for a generic coating.(Set 3) ............. 201
Table C–25: Weight gain versus time obtained for a generic coating.(Set 4) ............. 201
Table C–26: Weight gain versus time obtained for a coating made using Citrem ...... 202
Table C–27: Weight gain versus time obtained for a coating made using commercial natural cocoa powder ........................................................................ 202
Table C–28: Weight gain versus time obtained for a coating made using commercial alkalized cocoa powder..................................................................... 203
Table C–29: Weight gain versus time obtained for a coating made using lactose ...... 203
Table C–30: Weight gain versus time obtained for a coating made using dextrose.... 204
Table C–31: Weight gain versus time obtained for the AARHUSTM fat coating...... 204
Table C–32: Weight gain versus time obtained for the Victory-76 fat coating........... 205
Table C–33: Weight gain versus time obtained for the Karlshamns fat coating ......... 205
Table C–34: Weight gain versus time obtained for the DP1192 fat coating ............... 206
Table C–35: Weight gain versus time obtained for the DP1193 fat coating ............... 207
Table C–36: Weight gain versus time obtained for the DP1194 fat coating ............... 207
Table C–37: Weight gain versus time for a generic coating when the humidity at the bottom of the cell was 33%............................................................................. 208
Table C–38: Weight gain versus time for a generic coating when the humidity at the bottom of the cell was 54%............................................................................. 209
xix
Table C–39: Weight gain versus time for a coating made with 20% sugar and 80% coconut oil ............................................................................................................ 210
Table C–40: Weight gain versus time for a coating made with 30% sugar and 70% coconut oil ............................................................................................................ 210
Table C–41: Weight gain versus time for a coating made with 50% sugar, 49.5% coconut oil and 0.5% lecithin ............................................................................... 211
Table C–42: Weight gain versus time for a coating made with 60% sugar, 39.5% coconut oil and 0.5% lecithin ............................................................................... 211
Table C–43: Weight gain versus time for a coating made with 20% cocoa powder and 80% coconut oil ............................................................................................. 212
Table C–44: Weight gain versus time for a coating made with 30% cocoa powder and 70% coconut oil ............................................................................................. 212
Table C–45: Weight gain versus time for a coating made with 30% cocoa powder, 69.5% coconut oil, and 0.5% lecithin ................................................................... 213
Table C–46: Weight gain versus time for a coating made with 40% cocoa powder, 59.5% coconut oil, and 0.5% lecithin ................................................................... 213
Table C–47: Weight gain versus time for a coating made with 50% sugar, 10% cocoa powder, 39.5% coconut oil, and 0.5% lecithin........................................... 214
Table C–48: Weight gain versus time for a coating made with 30% sugar, 30% cocoa powder, 39.5% coconut oil, and 0.5% lecithin........................................... 214

ACKNOWLEDGMENTS
I would like to express my sincere thanks to Dr. Ramaswamy C. Anantheswaran
for allowing me to learn under his guidance. He has been responsible for my professional
growth. His dual role as a friend and advisor helped me immensely, and allowed me to
draw on his own experience to shape my own identity. I would like to thank Dr. Greg
Ziegler to allow me to learn under his guidance. His questions and valuable suggestions
during this study were very helpful. Words cannot describe the amount the patience both
Dr. Anantheswaran and Dr. Ziegler had shown at various stages of my study. To them I
owe a debt of gratitude that is difficult to quantify, and impossible to repay.
I am thankful to Dr. John Floros for serving on my committee and also for
allowing me the use of facilities within the department of food science and for providing
me with a research assistantship. I would also like to thank Dr. John Coupland for
serving on my committee and for his suggestions during this project.
I am very thankful to Dr. Larry Duda from the department of chemical
engineering for explaining me the diffusion models and also suggesting the possible
mechanisms of moisture diffusion through coatings.

xxi
I would like to thank Missy Hazen from the electron microscopy laboratory for
helping me out with the cryo SEM. I am also thankful to Barry Dutrow from the machine
shop (physics department) for helping out in designing the diffusion cell.
I am thankful to Lynn Dalby for help with the optical microscope and Bob
Lumley-Sapanski for helping me out with the freezer. I am really grateful to Annette
Evans for translating many of the German papers and to Laura Nattress for showing me
how to prepare the chocolate coatings. Thanks also to Dinos Matsos, for allowing me to
use space in his laboratory for doing the sub-zero temperature experiments.
Special thanks to Johnny Casasnovas, who offered help whenever I needed. His
suggestions at different times on the project were very helpful. I feel lucky to have a
“senior” like him. Thanks also to my colleagues Liping Liang, Haiqiang Chen, Qingbin
Yuan, Li Xiong, and all the graduate students in the department of Food Science for
making my work at food science department more enjoyable. Also thanks to the radio
station 95.3 3WZ whose songs gave me company in the laboratory.
I would like to thank my friends Rajesh Potineni, Surajit Ray, and Davendra
Tolani, who made my life at Penn State worthwhile. Thanks to my parents and my
family who provided constant encouragement throughout my life and I will always be

xxii
indebted to them. Finally, I would like to thank my wife Koel, who stood by me through
thick and thin. She showed tremendous patience during the thesis-writing period.

Chapter 1
INTRODUCTION
Ice-cream cones are one of the most popular desserts for people of all ages.
Initially one could purchase ice cream filled in cones at the ice-cream stores. Now a
consumer can buy readymade ice cream filled cones in the supermarket as a frozen
product. These cones can be kept in a home freezer and can be had anytime. This has
made frozen ice-cream cones one of the most popular ice-cream novelties in the
supermarket. Though it is a favorite product of many consumers, its shelf life is
restricted because the wafers turn soggy due to the migration of water from the ice cream.
To provide a moisture barrier between the ice cream and the wafer, a chocolate-flavored
coating is applied between the wafer and the ice cream. Even with the application of the
chocolate-flavored coating there are still some consumer complaints about the cone or the
wafer turning soggy due to moisture migration. Thus there is a need for obtaining a
better moisture barrier than that is currently being used. According to the FDA
compliance policy guide No. 515.800 a coating containing coconut oil, cocoa powder,
sucrose, and lecithin should be labeled as chocolate-flavored coatings. Therefore, in this
document the coatings will be referred to as chocolate-flavored coating.
There is a real lack of literature data and understanding on moisture migration
through chocolate-flavored coatings. Since chocolate-flavored is a composite product
consisting of several structural inclusions, there are several possible mechanisms for

2
moisture uptake and transfer through it. A good understanding of the mechanism(s) of
moisture migration through chocolate-flavored coatings is needed in order to design a
superior barrier for the ice cream wafer. This can be done through selecting the
appropriate formulation for the chocolate-flavored coating and by using the best suitable
process to apply the coating that will result in moisture resistant ice cream wafers.
The objective of this work is to understand the mechanism of moisture migration
through chocolate-flavored coatings.

Chapter 2
LITERATURE REVIEW1
Migration of a component from one domain to another is a common
problem with chocolates, confectionery, bakery products and other multi-domain food
materials. Moisture migration occurs in chocolate-covered confectioneries that have high
water activity centers, often called ‘soft centers,’ and coated biscuits and wafers. The
migration of moisture will cause defects in the product, such as cracking of the coating
(Barron, 1977; Minson, 1990), staling of the wafer, and drying of the center. In ice-
cream cones moisture migration from ice cream to the sugar wafer makes the wafer
soggy, which makes the product unacceptable. Moisture migration can lead to sugar
bloom (Minifie, 1989; Rosenberger, 1994) and mold growth in chocolate (Larumbe et al.,
1991).
Migration of a molecular species occurs when there is a chemical potential
difference of that particular species between two points. The species will migrate until
the two points are in thermodynamic equilibrium. The movement of these molecules can
be described by the principles of diffusion. The rate of diffusion is proportional to the
difference in chemical potential (driving force) divided by the resistance to movement
encountered by the diffusing molecules. Since it is easier to determine the concentration
1 This chapter is taken from the paper “Fat, Moisture, and Ethanol Migration through Chocolates and Confectionery Coatings”. CRC Critical Reviews in Food Science and Nutrition, 2002, 42(6): 583 - 626

4
than the chemical potential, most diffusion equations are written in terms of
concentration. The relation between the concentration and chemical potential is
discussed in the section Theoretical Aspects of Diffusion. The resistance to diffusion is
dependent on the structure of the material the molecular species is migrating through and
the thermodynamic interaction between the material and the diffusing species.
In most situations the diffusion process can be described by Fick's law (to be
discussed later in the section on theoretical aspects). However, non-Fickian behavior is
observed in many cases of diffusion in foods (Landmann et al., 1960; Biquet and Labuza,
1988; Debeaufort et al., 1994; Peppas and Brannon-Peppas, 1994; Ozdemir and Floros,
2001) because diffusion is coupled with phase or structural changes that occur due to the
presence of the migrating molecule. The change in structure and phase will affect the
diffusion rate through the food material (Aguilera and Stanley, 1999; Aguilera et al.,
2000). Hence, when studying diffusion in food materials, it is important to couple the
diffusion process with the microstructure and the phase behavior.
To understand the migration process it is first necessary to know the principles of
diffusion, which are discussed immediately after this paragraph. Given the substantial
volume of literature devoted to diffusion in polymers, the theoretical aspects have been
adapted from the field of polymer science. For greater details on diffusion in food
systems see Gekas (1992).
5
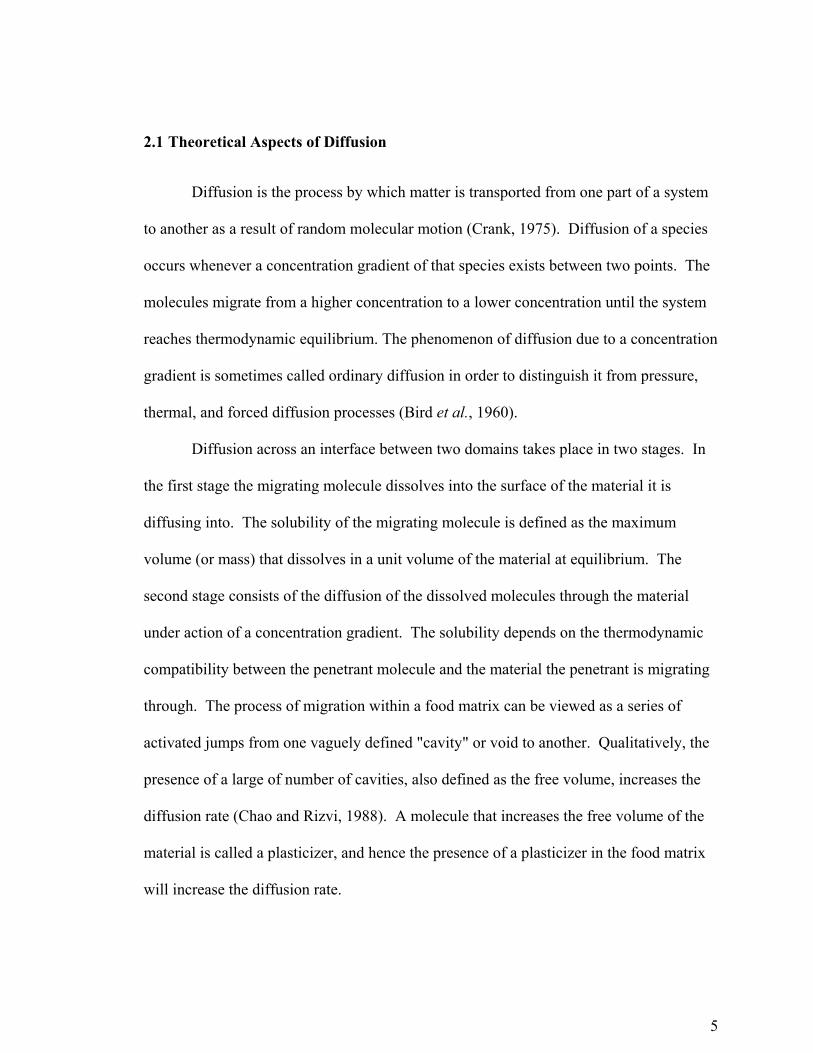
2.1 Theoretical Aspects of Diffusion
Diffusion is the process by which matter is transported from one part of a system
to another as a result of random molecular motion (Crank, 1975). Diffusion of a species
occurs whenever a concentration gradient of that species exists between two points. The
molecules migrate from a higher concentration to a lower concentration until the system
reaches thermodynamic equilibrium. The phenomenon of diffusion due to a concentration
gradient is sometimes called ordinary diffusion in order to distinguish it from pressure,
thermal, and forced diffusion processes (Bird et al., 1960).
Diffusion across an interface between two domains takes place in two stages. In
the first stage the migrating molecule dissolves into the surface of the material it is
diffusing into. The solubility of the migrating molecule is defined as the maximum
volume (or mass) that dissolves in a unit volume of the material at equilibrium. The
second stage consists of the diffusion of the dissolved molecules through the material
under action of a concentration gradient. The solubility depends on the thermodynamic
compatibility between the penetrant molecule and the material the penetrant is migrating
through. The process of migration within a food matrix can be viewed as a series of
activated jumps from one vaguely defined "cavity" or void to another. Qualitatively, the
presence of a large of number of cavities, also defined as the free volume, increases the
diffusion rate (Chao and Rizvi, 1988). A molecule that increases the free volume of the
material is called a plasticizer, and hence the presence of a plasticizer in the food matrix
will increase the diffusion rate.

6
The factors affecting the diffusion process can be grouped into two categories.
One is thermodynamic, or the sorption/desorption behavior, describing the interaction
between the penetrant and the food. The other group of factors is non-thermodynamic,
and involves the composition and structure, including defect structures, of the food.
Defect structures can be macroscopic cracks or holes in the material. If defect structures
like cracks or holes are present in the matrix, movement will take place through these
preferentially. The dominant mechanism of mass transfer through the defect structures is
by capillary flow. It is difficult to characterize such defects, so diffusion through defects
cannot be easily quantified (Rogers, 1985).
Steady-state diffusion is achieved when the concentration profile is invariant with
time, i.e. ∂c/∂t at any geometric point equals zero. If the concentration gradient at a point
varies with time, as is typical in the early stages of migration, unsteady-state diffusion is
observed. In the case where oil or fat is migrating into a coating, the study of the
unsteady-state diffusion becomes more relevant.
2.1.1 Mathematical Analysis
The flux Ji for a species i diffusing in one-dimension is given by the equation 2.1:
i
ifii x
DJ∂µ∂
= ( 2.1 )
where Ji is the molar diffusion flux of the migrating molecules (mol cm-2 s-1), i.e. the rate
of flow per unit area, Df is the fundamental diffusion coefficient (cm2s-1), x is the

7
diffusion length (cm) and µ is the chemical potential of the species. The chemical
potential is defined by equation 2.2 (Vieth, 1991):
i0i
n,P,Ti
ii alnRT)P,T(
nG
j
+µ=
∂∂
=µ ( 2.2 )
where Gi is the Gibbs free energy, T is the temperature (K), P is the pressure, ai is the
activity, 0iµ is the potential for pure vapor, n is the number of molecules, and R is the
universal gas constant (8.314 J mol-1 K-1).
From the concepts of solution chemistry, the activity of the ith species can be
represented as the product of activity coefficient, γ, and the concentration c:
ai = γici ( 2.3 )
Applying Fick’s law, one may define the gradient in chemical potential in terms
of the experimentally defined concentration gradient in the following manner:
i
imi
i
ifii x
cDx
DJ∂∂
−=∂µ∂
−= ( 2.4 )
where Dmi is the mutual binary diffusion coefficient. From equation 2.4, one gets:
i
ifimi c
DD∂µ∂
= ( 2.5 )
From equations (2.2) and (2.3), one gets:
∂
γ∂+=
∂µ∂
i
i
iP,Ti
i
clnln1
cRT
c ( 2.6 )
So the mutual binary diffusion coefficient is related to the fundamental diffusion
coefficient Dfi by the equation:

8
∂
γ∂+=
i
i
ifimi cln
ln1cRTDD ( 2.7 )
For single component diffusion, the subscript can be dropped for the sake of
convenience. For steady-state diffusion in one-dimension, Fick's first law relates the
flux to the concentration gradient by the relation:
xcDJ
∂∂
−= ( 2.8 )
where ∂c/∂x is the concentration gradient, and c is the concentration (moles cm-3) and D
is the mutual diffusion coefficient (cm2 s-1). Fick’s equation expressed in different units
can be found in Bird et al. (1960). The diffusivity, D, can be thought of as the inverse of
the resistance to mass transfer.
Fick's second law, equation 2.10, from which the unsteady-state concentration
distribution may be calculated, is obtained from equation 2.8 and the equation of
continuity (Brown, 1988).
tc
xJ
∂∂
−=∂∂ ( 2.9 )
The equation of continuity is an expression of the conservation of mass. The flux
can be eliminated between equations 2.8 and 2.9 to give:
∂∂
∂∂
=∂∂
xcD
xtc ( 2.10 )
If the diffusivity is independent of concentration, which is often assumed but
generally not the case, this equation reduces to:

9
2
2
xcD
tc
∂∂
=∂∂ ( 2.11 )
For diffusion of gases and vapors, the solubility can be described by Henry’s law
and can be given by equation 2.12:
c = Sp ( 2.12 )
where c is the concentration expressed as volume (or mass) at Standard Temperature and
Pressure per unit volume of the material, S is the solubility coefficient, and p is the
applied pressure (mm Hg).
Combining equations 2.8 and 2.12 gives:
xpPJ
∂∂
−= ( 2.13 )
where P is the permeability g·cm·(cm2·s·mmHg)-1and ∂p/∂x is the pressure gradient (mm
Hg). Permeability is the product of diffusivity and solubility. Equations 2.9 and 2.11 can
also be written in terms of pressure instead of concentration.
Assuming that P is independent of pressure and that the sample is homogeneous,
when steady-state conditions have been achieved equation 2.13 can be integrated to give:
lpPJ ∆
= ( 2.14 )
where ∆p is the pressure drop across the sample and l is the sample thickness. If P
changes with pressure equation 2.14 will give a value of the permeability at the average
pressure across the film. Many different units have been used to describe permeability
and transmission rate. Table 2–1 gives the common terms and units used to describe the
barrier properties of edible films (Donhowe and Fennema, 1994).

10
2.1.2 Diffusion Coefficient
The diffusion coefficient, D is needed to quantitatively solve the diffusion
equation. As explained in the previous section, the value of D corresponding to the rate
at which the concentration gradients are dissipated is called the mutual diffusion
Table 2–1: Common terms used to describe barrier properties of edible films Reprinted from (Donhowe and Fennema, 1994), with permission from Technomic Publishing Co., Inc., copyright [1994])
Term Equationa Common Units Accepted SI units Permeability M·∆x·(A·t·∆p)-1
or M·∆x·(A·t·∆C)-1
g·mil·(100 in2·day·cmHg)-1 g·mil·(m2·day·cmHg)-1 cc·mil·(m2·day·atm)-1 g·cm·(cm2·s·mmHg)-1 cc·cm·(cm2·s·cmHg)-1 mg·cm·[cm2·s·(mg·ml-1)]-1
g·(Pa·s·m)-1 kg·(Pa·s·m)-1 gmol·(Pa·s·m)-1 m2·s-1
Permeability coefficient M·∆x·(A·t·∆p)-1 Same units as permeability Same units as permeability
Permeance M·(A·t·∆p)-1
or M·(A·t·∆C)-1d
g·(m2·day·mmHg)-1 g·(Pa·s·m2)-1 kg·(Pa·s·m2)-1 gmol·(Pa·s·m2)-1 m·s-1
Transmission rate M·(A·t)-1 or
M·∆x·(A·t)-1e
g·(m2·day)-1 g·(m2·h)-1 g·mil·(m2·day)-1 cc·mil·(100 in2·day)-1 cc·cm·(cm2·day)-1 g·cm·(cm2·h)-1
g·(m2·s)-1 gmol·(m2·s)-1 g·mm·(m2·s)-1
Resistance A·t·∆C·M-1 s·m-2 Activation energy P0exp(-Ep·R-1·T-1) kcal·mol-1
kJ·mol-1 kJ·mol-1
aM = mass of permeate; ∆x = thickness of film; A = area; t = time; ∆P = pressure gradient; ∆C = concentration gradient; P0 = permeability constant; Ep = activation energy; R = gas constant; T = temperature (K). b Units listed are found throughout in the literature on packaging films c SI = Systéme International (SI) units. These are preffered. d This expression for permeance is commonly used in describing the properties of barrier properties of plant lipids. e Transmission rate is often reported with a thickness term in the expression.

11
coefficient, which is also referred to as the effective diffusion coefficient (Chinachoti,
1998). Another diffusion coefficient that can be found in the literature is the self-
diffusion coefficient, which is a measure of the rate of diffusion of one component in
another of uniform chemical composition (Vrentas and Duda, 1986). As a rule of thumb,
mutual diffusion coefficients in gases are around 10-1 cm2s-1, for liquids in the range of
10-5 cm2s-1, and through solids around 10-10 cm2s-1. Hence, the molecules tend to move
much faster in liquids and gases as compared to solids (Cussler, 1997). The diffusion
coefficient can be measured by a number of methods: diaphragm cell, infinite couple
method, Taylor dispersion, capillary method, Gouy interferometer, light scattering, and
NMR (Crank and Park, 1968). Dunlap et al. (1986) have given a comprehensive
description of all the methods used for measuring the diffusion coefficient.
When measuring or reporting a diffusion coefficient one should ascertain whether
the method is measuring the self or the mutual diffusion coefficient. In recent years,
pulsed field gradient (PFG) NMR has been widely used to measure a diffusion
coefficient, but this method measures the self and not the mutual-diffusion coefficient.
This is why data from NMR does not match effective diffusion coefficients (McCarthy
and McCarthy, 1994; Labuza and Hyman, 1998) obtained by other methods. Data from
magnetic resonance imaging (MRI) however can be used to measure the effective
diffusion coefficient. MRI offers great promise in studying mass transport properties and
diffusion of moisture in foods (Cornillon and Salim, 2000; McCarthy et al., 2000;
Schmidt and Lai, 1991; Schmidt et al., 1996; Troutman, 1999).
12
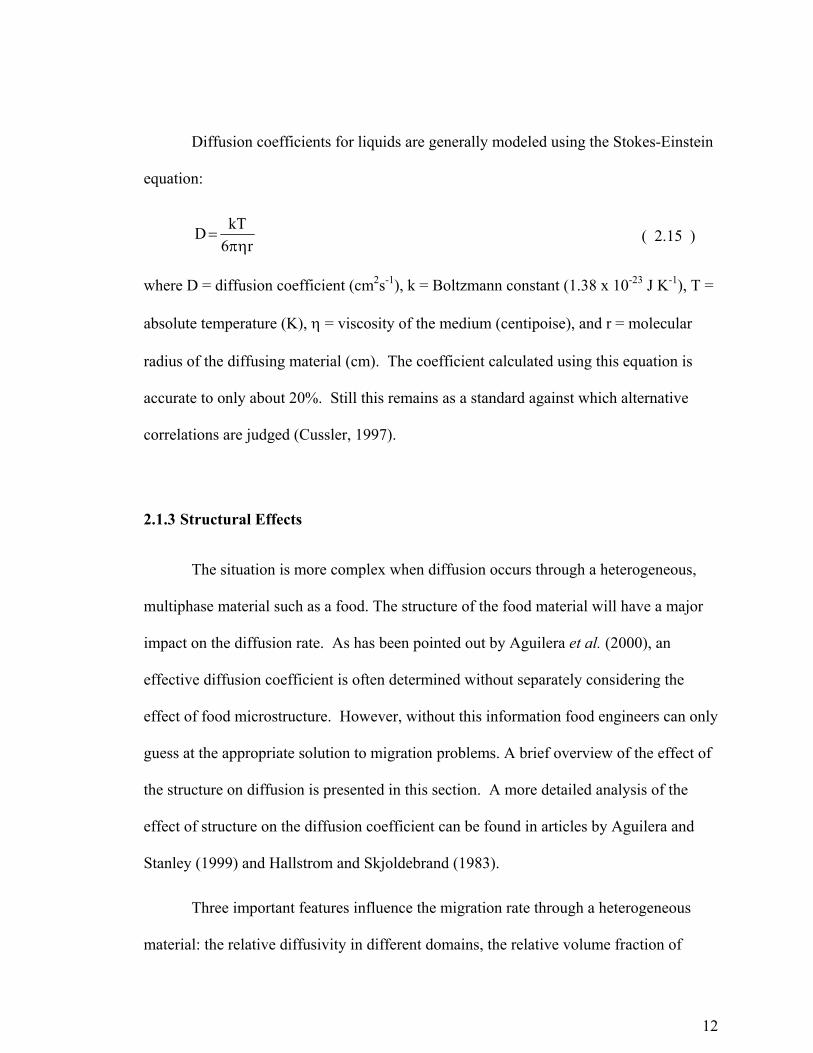
Diffusion coefficients for liquids are generally modeled using the Stokes-Einstein
equation:
r6kTDπη
= ( 2.15 )
where D = diffusion coefficient (cm2s-1), k = Boltzmann constant (1.38 x 10⁻²³ J K-1), T =
absolute temperature (K), η = viscosity of the medium (centipoise), and r = molecular
radius of the diffusing material (cm). The coefficient calculated using this equation is
accurate to only about 20%. Still this remains as a standard against which alternative
correlations are judged (Cussler, 1997).
2.1.3 Structural Effects
The situation is more complex when diffusion occurs through a heterogeneous,
multiphase material such as a food. The structure of the food material will have a major
impact on the diffusion rate. As has been pointed out by Aguilera et al. (2000), an
effective diffusion coefficient is often determined without separately considering the
effect of food microstructure. However, without this information food engineers can only
guess at the appropriate solution to migration problems. A brief overview of the effect of
the structure on diffusion is presented in this section. A more detailed analysis of the
effect of structure on the diffusion coefficient can be found in articles by Aguilera and
Stanley (1999) and Hallstrom and Skjoldebrand (1983).
Three important features influence the migration rate through a heterogeneous
material: the relative diffusivity in different domains, the relative volume fraction of

13
those domains, and the geometric distribution of the domains. The effective diffusion
coefficient, Deff, through a material consisting of impermeable porous solids with fluid
filled pores is given by Aguilera and Stanley (1999):
τε
= DDeff ( 2.16 )
where D is the diffusion coefficient within the pores, ε is the void fraction or porosity of
the solid, and τ is the tortuosity of the pores. Cussler et al. (1988) have proposed an
equation for membranes containing flakes or lamellae (Equation 2.17):
φ−φα
+=1
1DD 22
eff
0 ( 2.17 )
where α is the aspect ratio, which is defined as the ratio of half the second largest
dimension divided by the smallest dimension and φ is the volume fraction of the flakes or
the lamellae. It should be noted from equation 2.17 that the diffusion coefficient depends
only on the volume fraction and not on the size of the impermeable particles (Eitzman et
al., 1996). Equations 2.16 and 2.17 can be used to understand the migration of moisture
through chocolates.
Let us consider the structure of dark chocolate, where the sugar and cocoa solids
are embedded in a continuous fat phase (Figure 2–1). The continuous fat phase consists
of a fat crystal network. The pores between these fat crystals do not really have a
spherical shape and are either closed or completely (or partially) filled with the liquid
fraction of cocoa butter (Loisel et al., 1997). The water molecules diffuse mainly
through the oil that is present in between the fat crystals. When the moisture comes in

14
contact with a hydrophilic particle, e.g. sugar or cocoa powder, it diffuses through the
hydrophilic particle as well as along their surfaces. The combination of these two
mechanisms results in an effective diffusivity in the non-fat phase. The diffusion of
moisture in sugar will be different from the diffusion in the cocoa powder. There will be
more surface diffusion in the case of sugar as compared to that of cocoa powder. Since
the molecules will diffuse via the hydrophilic phase the diffusion coefficient in this phase
should be taken into account.
Figure 2–1: Schematic of chocolate microstructure. Upper left – solid particles about to collide during fat crystallization. Insert – enlargement of space between one sugar crystal (gray) and cocoa particle (black). Reproduced with permission (Loisel et al., 1997)
15
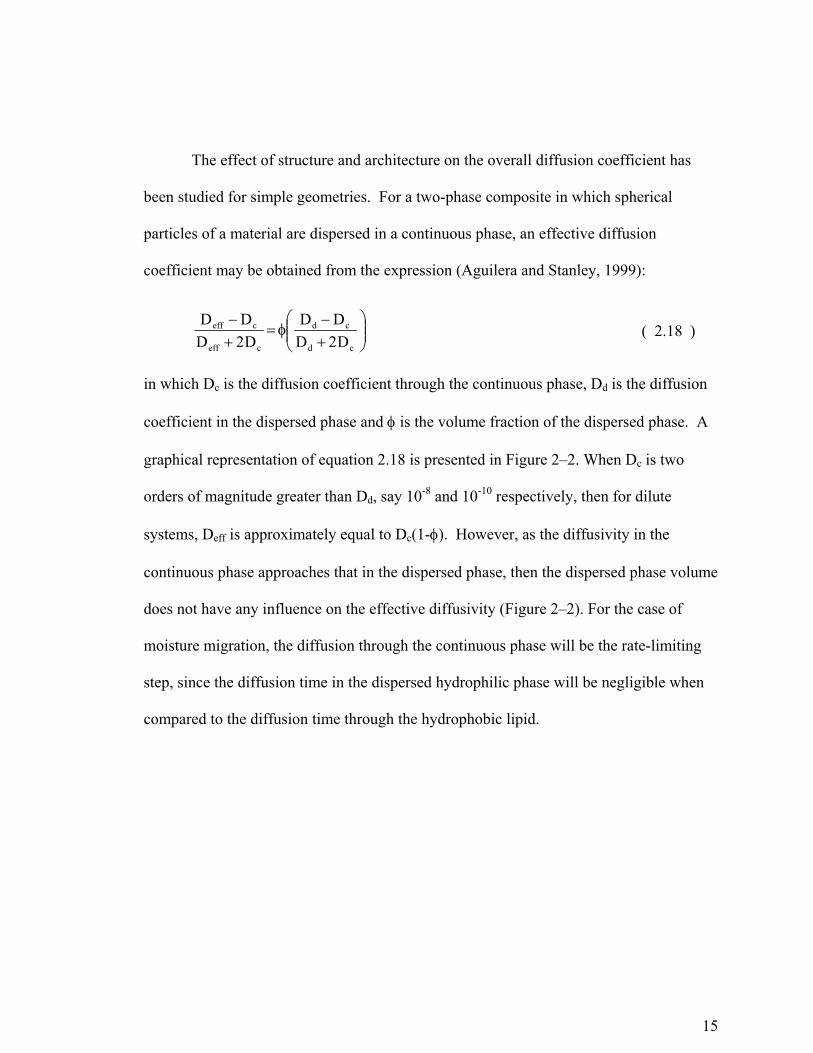
The effect of structure and architecture on the overall diffusion coefficient has
been studied for simple geometries. For a two-phase composite in which spherical
particles of a material are dispersed in a continuous phase, an effective diffusion
coefficient may be obtained from the expression (Aguilera and Stanley, 1999):
+−
φ=+−
cd
cd
ceff
ceff
D2DDD
D2DDD ( 2.18 )
in which Dc is the diffusion coefficient through the continuous phase, Dd is the diffusion
coefficient in the dispersed phase and φ is the volume fraction of the dispersed phase. A
graphical representation of equation 2.18 is presented in Figure 2–2. When Dc is two
orders of magnitude greater than Dd, say 10-8 and 10-10 respectively, then for dilute
systems, Deff is approximately equal to Dc(1-φ). However, as the diffusivity in the
continuous phase approaches that in the dispersed phase, then the dispersed phase volume
does not have any influence on the effective diffusivity (Figure 2–2). For the case of
moisture migration, the diffusion through the continuous phase will be the rate-limiting
step, since the diffusion time in the dispersed hydrophilic phase will be negligible when
compared to the diffusion time through the hydrophobic lipid.

16
J0 0.2 0.4 0.6 0.8 1
8
8.5
9
9.5
10
0.902
0.803
0.803
0.803
0.705
0.705
0.705
0.607
0.607
0.607
0.508
0.508
0.508
0.41
0.41
0.41
0.312
0.312
0.213
0.213 0.115
Figure 2–2: Contour plot of Deff/Dc as a function of the dispersed phase volume, φ, and the continuous phase diffusivity, Dc=10-α (dispersed phase diffusivity, Dd=10-10).
Deff/Dc
Dd=10-10 (cm2/s)
Dc (
cm2 /s
)
Dispersed phase volume (φ)
10-
10-
10-
10-
10-
17
2.1.4 Thermodynamic Interactions
Many processes, e.g. diffusion through porous media or fat and moisture
migration through chocolates, involve a coupling of diffusion and phase equilibrium
thermodynamics. In addition to describing equilibrium at the interface between two
phases, thermodynamic information can facilitate the description of mobility in solutions.
As described in the mathematical analysis section, the diffusive flux is conventionally
related to a gradient in the concentration, but the fundamental driving force for molecular
diffusion is a gradient in the chemical potential or free energy of a species. The
conventional mutual binary diffusion coefficient is a product of a more fundamental
mobility parameter times a thermodynamic term that indicates how the chemical potential
changes with concentration. It has been clearly shown for many polymer systems that
when a conventional mutual binary diffusion coefficient is corrected with such a
thermodynamic term, the resulting coefficient has a simpler relationship in terms of its
concentration dependency (Duda, 1999).
van der Zanden (2000) proposed a more general model of mass transfer in a
heterogeneous media that incorporated a partition coefficient, K’, equal to the ratio of the
dispersed phase concentration and the continuous phase concentration, cd/cc , in
equilibrium at the interface. For simplicity, let us consider the case when the
concentration of moisture at the interface is the same in the dispersed and the continuous
phase. In this situation, K’=1 and using their relations to calculate the relative mass flux
(J/Jmax x 100) we obtained Figure 2–3. The migration of moisture increases rapidly as the
non-fat particulate phase approaches close-packed density (φ > 0.5). The precise

18
relationship between the lipid phase volume and the flux of moisture or fat will depend
on the equilibrium relationships, here modeled with a simple partition coefficient. It
would be valuable to extend this type of modeling to include more complex equilibrium
behavior such as sorption isotherms and eutectic interactions. Furthermore, we could
reasonably expect Deff to be a function of the phase structure (e.g., aspect ratio of the
dispersed phase particles) and not simply the phase volume.
2.1.5 Diffusion Mechanism
Diffusion behavior and transport process are classified according to the relative
rates of mobility of the penetrant. There are three basic categories of behavior described
as follows (Marom, 1985):
Figure 2–3: Relative flux for moisture as a function of continuous phase volume fraction (i.e. fat content). Calculated from the model of van der Zanden (2000) using Dd/Dc = 100.

19
(i) Case I or Fickian diffusion, in which the rate of diffusion is much less than that of
the polymer segment mobility. Sorption equilibrium is rapidly established,
leading to time-independent boundary conditions that exhibit no dependence on
swelling kinetics.
(ii) Case II (or Super Case II), the other extreme in which diffusion and penetrant
mobility are much greater compared with other relaxation processes. Sorption
processes are dependent on swelling kinetics.
(iii) Non-Fickian or anomalous diffusion that occurs when the penetrant mobility and
polymer segment relaxation are comparable.
If Mt is the mass diffused at time t and M∞ is the mass diffused at infinite time,
then the type of diffusion process occurring is obtained by plotting time verses Mt/M∞,
and then fitting the equation Mt/M∞ = k’tn. If the exponent n is 0.5, the diffusion is
Fickian. Non-Fickian diffusion is observed for 0.5 < n <1.0 (Peppas and Brannon-
Peppas, 1994). Anomalous behavior is seen when phase changes occur during mass
transfer, e.g. when there are components in the system that change from an amorphous to
a crystalline state due to the presence of a plasticizer (the effect of water on amorphous
milk powder). This phenomenon, seen quite often in polymers, is called solvent-induced
crystallization (Neogi, 1996). Anomalous behavior has also been seen in systems that do
not undergo morphological changes associated with the formation of crystals. In this
case the anomalous behavior is associated with slow relaxation of the polymer chains
compared to the migration of the solvent (Duda, 1999).
20
Case I is observed when there are no changes, such as swelling or phase transition
that are associated with diffusion. Non-Fickian diffusion occurs in systems where there
are such physical changes associated with diffusion. In fat, moisture and ethanol
migration through chocolates, one expects either physical changes such as swelling or
phase transition to occur, and would expect non-Fickian diffusion behavior.
2.2 Moisture Migration
Moisture migration will occur in chocolates when regions of different moisture
content are brought in contact with each other. The direction of moisture migration is not
necessarily from higher moisture content to lower moisture content (Cakebread, 1972),
but in the direction of higher to lower water activity. Water activity difference is the
driving force for moisture migration. The water activity (aw) is related to the
thermodynamic chemical potential by equation 2.2 (van den Berg and Bruin, 1981). In
this case, µ is the chemical potential in the sample water vapor; 0iµ is the chemical
potential for pure water vapor.
Due to the strong interaction between the water and components such as sugar
and cocoa solids in chocolate, it is reasonable to assume that the moisture equilibrium
sorption will have a significant impact on the observed molecular diffusion properties.
Some of the water molecules will adsorb to the surface and a second class of water
molecules can be considered to be a mobile fraction of the species. Also, it is reasonable
to assume that there exists an equilibrium between these two species at every location in
chocolate during the diffusion process (Duda, 1999).

21
Consider a system consisting of a concentration c of the mobile species and c1 of
the adsorbed molecules. Fick’s equation for this system in one dimension can be written
as (Weisz, 1967):
2
2
xcD
t'c
∂∂
=∂∂ ( 2.19 )
where c' = c + c1. Since equation 2.19 contains one more variable than equation 2.11, a
solution is not attainable without additional information. For all processes where
equilibrium between mobile and adsorbed species is rapid compared to the overall rate of
the sorption process, an isotherm c1 = f(c) will provide the information necessary to
define the system. In the case of food systems, moisture sorption isotherms are used to
obtain an equilibrium relationship between the water activity and the moisture content.
2.2.1 Moisture Sorption Isotherm
A moisture sorption isotherm is the plot of water content (expressed as mass of
water per unit mass of dry material) of a food versus the water activity (aw) at constant
temperature (Fennema, 1996). The moisture absorption isotherms (MSI) for most foods
follow a sigmoidal curve.
The equation that had been most used to model the moisture isotherm of foods is
the Braunaur, Emmet and Taylor (BET) equation. The BET is equation is given in the
form:

22
)Caa1)(a1(Camm
www
wo
+−−= ( 2.20 )
where m is the moisture content, aw is the water activity, mo is the BET monolayer
moisture value, and C is a constant. The limitation of the BET equation is that it is
applicable only between aw values of 0 and 0.5 (Bell and Labuza, 2000). At the
International Symposium on the Properties of Water (ISOPOW) held in 1983, it was
agreed that the Guggenheim-Anderson and DeBoer (GAB) equation, is the best equation
for modeling moisture sorption isotherms (van den Berg, 1985; Wolf et al., 1985). The
GAB equation is given below:
)CKaKa1)(Ka1(CKamm
www
wo
+−−= ( 2.21 )
where K is the GAB multilayer constant. The GAB model gives a better fit than the
BET, but this is due more to the additional fitting parameter than any improved physical
understanding of sorption. The GAB reduces to the BET equation, when K=1 (Coupland
et al., 2000). The GAB equation gives a good fit from water activity values between 0
and 0.8 (Peleg, 1993). It is interesting to note that most researchers have reported the
moisture sorption isotherm only to water activity values of 0.8. The MSI for chocolates
with different sugars obtained by Ogunmoyela and Birch (1984) are given in Figure 2–4.
The amount of moisture adsorbed by fructose and L-sorbose is significantly higher than
the moisture adsorbed by other sweeteners.
The sorption isotherm for sucrose, cocoa powder and an edible film is given in
Figure 2–5. It can be seen that for water activities greater than 0.75, the amount of
moisture adsorbed by sucrose increases significantly; hence, for aw values greater than

23
0.75 the rate of migration through chocolate containing sucrose should be significantly
higher than at lower water activities.

24
Figure 2–4: Moisture sorption isotherms for chocolate containing different sweeteners for two different lecithin contents: (a) Bournville chocolate, (b) sucrose, (c) β-D-fructose, (d) sorbitol, (e) L-sorbose, (f) maltose hydrate, ( ― ) 0.5% lecithin, (---). In each of these figures, the relative humidity is on the x-axis and the equilibrium moisture content is on the y-axis. Reproduced with permission (Ogunmoyela and Birch, 1984).

25
The MSI for dark chocolate obtained by Biquet and Labuza (1988) is given in
Figure 2–6. Biquet and Labuza (1988) found that equilibrium times for moisture sorption
and desorption ranged between 40 and 60 days as opposed to Ogunmoyela and Birch
(1984) who reported that constant weights were usually observed after 14 days. Biquet
and Labuza (1988) used the GAB equation to model the sorption isotherm of dark
chocolate. The GAB constants for dark chocolate are given in Table 2–2.
Figure 2–5: Moisture sorption isotherm for an edible film and its components. Reprinted with permission from Morillon et al. (2000). Copyright (2000), American Chemical Society)

26
Figure 2–6: Moisture sorption isotherms for dark chocolate at 20°C. The upper curve is for desorption and the lower for adsorption. Reproduced with permission (Biquet and Labuza, 1988)

27
The sorption isotherm obtained for a particular food product is dependent on the
temperature at which it is measured and so the temperature must be specified. Molecular
motion increases with temperature and hence the amount of water adsorbed is less for the
same aw with increasing temperatures. The effect of temperature on the moisture sorption
isotherm seems to follow the Clausius-Clapeyron equation (Bell and Labuza, 2000):
−=
21
s
1w
2w
T1
T1
RQ
)a()a(ln
…(24)
where R is the universal gas constant (1.987 cal mol-1 K-1), Qs is the heat of sorption (cal
mol-1), (aw)1 is the water activity at temperature T1 (K) and (aw)2 is the water activity at
temperature T2 (K). The moisture sorption isotherm of chocolates at different
temperature is given in Figure 2–7 (Kim et al., 1999), and it can be seen that the
maximum amount of water adsorbed at a particular water activity is at the lowest
temperature (20oC). However, there is not a large variation in the amount of moisture
adsorbed in this temperature range because the equilibrium moisture content is very low
for chocolate.
Table 2–2: GAB constants at each aw value for dark chocolates at 20 oC (Biquet and Labuza, 1988)
Mode of soprtion
Initial aw aw range of test
Mo gH2O/100g
solids
K C
Adsorption 0.01 0.01 – 0.808 0.545 1.024 103.857
Desorption 0.81 0.754 – 0.112 1.067 0.785 34.262

28
Figure 2–7: Moisture sorption isotherms for chocolate at various temperatures. Reproduced with permission (Kim et al., 1999)

29
2.2.2 Measurement Methods for Moisture Migration
The rate of moisture migration through chocolate is very slow compared to most
food products due to the hydrophobicity of the continuous lipid phase. This is similar to
the situation for plastic films. Hence, the rate of moisture migration thorough chocolate
coatings can be measured using the methods used for plastic films. The methods
commonly used for measuring the water transmission rates through plastic and edible
films are discussed below.
2.2.2.1 Gravimetric Technique (ASTM E96)
The most commonly used method for determining the permeability or water vapor
transmission rate (WVTR) of edible films is the ‘cup’ method (ASTM, 1995). The setup
consists of a test cell covered with the test film (Figure 2–8), which is placed in a
chamber with controlled temperature and humidity. The test can be done in two ways,
the desiccant method and the water method. In the desiccant method, the desiccant is kept
in the test cell and the cell is kept in a controlled humidity chamber, while in the water
method the cell contains water or saturated salt solution and the cell is kept in a
controlled humidity chamber. In both cases, the weight of the cell is taken at definite
time intervals until steady state is reached. The cell will gain weight if desiccant is kept
inside the cell and will lose weight if water or salt solution is kept inside the cell. The
weight gain or loss is plotted verses time. After a certain time, the rate of weight gain or
loss becomes constant, meaning steady state has been reached. Once steady state is

30
reached, at least eight measurements should be taken to determine the steady-state
transmission rate (ASTM, 1995). This rate divided by the area of the film gives the
WVTR.
Major sources of error in this method are: (1) film support and sealing, and (2) the
effect of intervening air spaces in determining the exact vapor pressure differences across
the film (Stannett and Yasuda, 1965). The sealing suggested by the ASTM method is
quite cumbersome. Gennadios et al. (1994) in their work with edible films found that
using an O – ring and silicon grease gave a good seal.
The gravimetric method assumes that the time for water to diffuse through the
stagnant air is negligible compared to the time taken for it to diffuse through the film,
which should be a reasonable assumption with chocolate. One way to maintain proper
humidity is to maintain an air velocity over the specimen to be at least ten times the
permeance of the specimen expressed in perms, but not to exceed 600 ft/min (3.05 m/s)
(McHugh et al., 1993). Erroneous results may be obtained if the proper humidity
gradient is not maintained during the test. Biquet and Labuza (1988) found that keeping
the desiccant on different sides of the film changed the WVTR values (Table 2–3). When
Figure 2–8: Schematic of the test cell for the ASTM E-96 method

31
the desiccant is kept inside the cell, the air gap between the desiccant and the film is very
small, so the humidity at the interface of the film and the air in the cell side is 0%, on the
other hand when the desiccant is kept outside in the desiccator, the air gap between the
film and the desiccant is large and the humidity at the interface of the film is not 0%, as is
assumed during the test. Thus the actual vapor pressure difference in the two
configurations is different and therefore their results varied.
The test cell should be made of non-corroding material and should be
impermeable to water vapor. A large and shallow dish is normally preferred, but the size
and weight is limited when an analytical balance is chosen to detect small weight
changes. The mouth of the cell should be as large as possible and should not be less than
4.65 in2 (3000 mm2) (ASTM, 1995).
The gravimetric technique seems to be the method used in most laboratories for
testing the water vapor transmission rate for edible films. The major advantage of this
method is its simplicity, even though it takes a long time to obtain results.
Table 2–3: Effective water vapor permeability constants (keff) and water vapor transmission rate (WVTR) for a dark chocolate film at 20oC as determined by the cup method in two different configurations: (1) Drierite in the cup and salt solution outside, (2) saturated salt solution in the cup and Drierite outside (Biquet and Labuza, 1988) Configuration Thickness (mm) WVTR (g·m-2·day-1) keff (g·mil·m-2·day-1·mmHg-1)1 1.114 3.21 10.73 2 1.020 0.30 0.86

32
2.2.2.2 Infrared Sensor Technique (ASTM F-372)
This is a rapid method for determining the WVTR of materials. The cell consists
of two chambers, which are separated by the test film. On one side of the cell a pad
saturated with water or salt solution is kept and on the other side dry air is circulated.
The circulating dry air picks up the moisture permeating through the film and this air is
then passed through an infrared detector. The infrared detector gives a voltage based on
the amount of moisture present. To convert this voltage into WVTR values, the voltage
for an unknown sample is compared with the voltage of a standard reference material
(ASTM, 1995). Instruments for measuring the WVTR using this method are
manufactured by Modern Controls Inc. (MOCON, Minneapolis, MN), and are called the
Permatran – W series. The range of WVTR is from 1 g m-2 day-1 to 100 g m-2 day-1
(MOCON, 1984). Using aluminum foil to reduce the effective area of diffusion can
extend this range on the high end. Work in our laboratory with plastic films has shown
that masking is not effective and can give erroneous results, although Kester and
Fennema (1989) have found masking to be effective in their work.
The advantage of this method is that it gives results in much shorter time than the
traditional ‘cup’ method, and the results are quite repeatable. However, high cost and
possible problems with moisture condensation in the sensor present a major disadvantage.
The condensation problems occur mainly with highly permeable films, and if caution is
not observed, this will give erroneous results for films that are tested subsequently.
However, this should not be the case with chocolate. In terms of the pressure differential,
similar disadvantages as the gravimetric method exists. Other methods, such as

33
coulometric and spectrophotometric methods also exist and have been discussed by
McHugh and Krochta (1994).
2.2.3 Factors Affecting Moisture Migration Through Chocolates
The factors influencing moisture migration through chocolates are vapor pressure
differential (or water activity difference), temperature, composition, thickness, solid fat
content and structure. The work done by Biquet and Labuza (1988) and Landmann et al.
(1960) are the main works in this area, and most of the following discussion is taken from
these two studies.
Thickness: Fick’s law (equation 2.8) suggests that with increasing thickness, the water
vapor transmission rate (WVTR) should decrease. This behavior has been observed
when the thickness of a dark chocolate film was increased from 0.612 to 0.926 mm, but
not when the thickness was increased from 0.926 to 1.192 mm (Table 2–4). Increasing
the thickness of a cocoa butter film from 1.59 to 2.92 mm (Table 2–5) did not change its
WVTR (Landmann et al., 1960). One possible explanation for a deviation from Fick’s
law is that the researchers did not study the steady state diffusion and all the data they
had gathered were in the sorption regime. In the sorption regime the rate of moisture
gain will be the same initially irrespective of the thickness. Assuming a diffusion
coefficient of 1 x 10-13 m2 s-1 (Biquet and Labuza, 1988), it will take about 90 days for a
1.5 mm sample and 350 days for a 3mm sample to reach equilibrium with moisture.
Landmann et al. (1960) have taken data for only 19 days, which means that they were
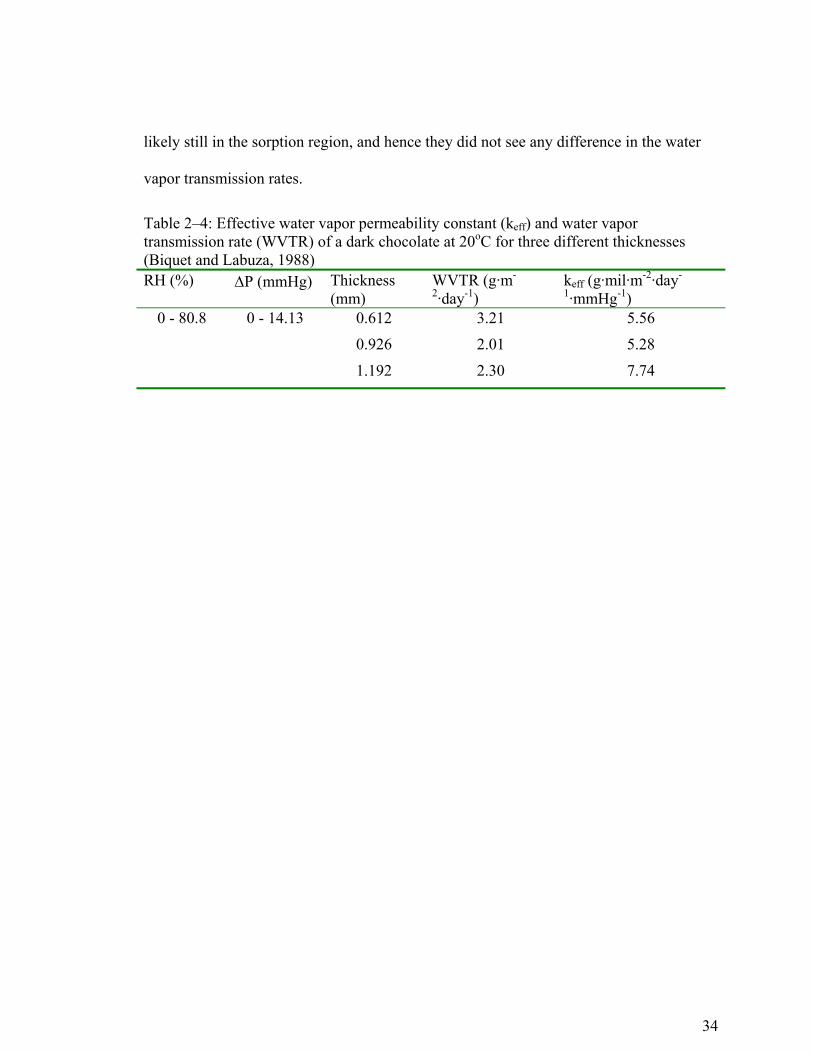
34
likely still in the sorption region, and hence they did not see any difference in the water
vapor transmission rates.
Table 2–4: Effective water vapor permeability constant (keff) and water vapor transmission rate (WVTR) of a dark chocolate at 20oC for three different thicknesses (Biquet and Labuza, 1988) RH (%) ∆P (mmHg) Thickness
(mm) WVTR (g·m-
2·day-1) keff (g·mil·m-2·day-
1·mmHg-1) 0 - 80.8 0 - 14.13 0.612 3.21 5.56
0.926 2.01 5.28
1.192 2.30 7.74

35
Table 2–5: Permeability data from (Landmann et al., 1960)
Product Temperature (oC)
Vapor pressure gradient (mmHg)
Film thickness
(mm)
Moisture transferred x
103
(mg·cm-2·h-1)
Permeability constant x 1012
(g·cm·s·cm-
2·mmHg-1)
Cocoa butter 3.0 5.7 - 0 1.57 4.37 33.3
5.7 - 0 1.58 4.86 37.2
26.7 11.5 - 0 1.58 3.84 14.8
19.8 - 0 1.60 2.61 5.8
19.8 - 0 1.60 2.95 6.6
26.3 - 0 1.59 21.6 35.7
26.3 - 0 1.63 18.0 31.0
26.3 - 0 1.96 17.7 36.7
26.3 - 0 2.14 26.9 60.5
26.3 - 0 2.16 16.3 36.7
26.3 - 0 2.91 25.7 78.7
26.3 - 0 2.92 26.3 81.6
Cocoa butter in lower melting polymorphic
form
3.0
5.7 - 0
1.54
41.6
310
4.3 - 0 1.51 41.7 410
4.3 - 0 1.52 58.8 580
Chocolate liquor
26.7 11.5 - 0 1.71 1.94 8.0
19.8 - 0 1.70 3.82 9.1
19.8 - 0 1.69 5.60 13.3
26.3 - 0 1.63 32.3 556
26.3 - 0 1.61 30.9 526
Sweet milk chocolate,
coating type
26.7
19.8 - 5.9
1.78
4.03
14.3
19.8 - 5.9 1.75 4.29 15.0
26.3 - 0 2.08 49.2 1080
26.3 - 0 1.73 64.9 1190

36
Structure: No systematic study has been made on the effect of structure on moisture
migration through chocolates. Normally it is expected that a close-packed fat crystal
network will allow less moisture to pass through the interstices (Kempf, 1967). One
might expect that the α polymorph should have the higher permeability than the β’
polymorph, which in turn will have a higher permeability than the β polymorph. In
contrast, Kester and Fennema (1989) in their studies with a mixture of hydrogenated
rapeseed oil and soybean oil found that the α-polymorph (the lowest melting polymorph)
was the most resistant to moisture transmission compared to other polymorphic forms
(β and β’). There are a couple possible reasons for this behavior. First, the shape of the
crystal may be different which might cause a change in tortuosity and thus change the
water diffusion rate. Secondly, the method used also can lead to differences in the
observed data. Kester and Fennema (1989) used a filter paper as a supporting matrix for
the fat when measuring the WVP. The interaction of the different polymorphs with the
filter paper may also lead to differences in the observed water diffusion behavior.
Preliminary experiments in our laboratory had shown that there is a difference in the
water vapor transmission rate data with and without a support. Landmann et al. (1960)
obtained a lower melting polymorph by quickly chilling melted cocoa butter from 60oC
to –18oC. The WVTR of the low melting polymorph was much greater than that
obtained by proper tempering (Table 2–5), but they did not confirm the type of
polymorph experimentally.

37
Vapor pressure: From the data in Table 2–5 and Table 2–6, it can be seen that increasing
the vapor pressure gradient increases the WVTR. With about the same vapor pressure
gradient 0 - 5.9 vs. 9.5 - 14.1 mm Hg, but the latter with higher absolute pressure, the
WVTR almost doubles. Similar results are seen when the pressure difference was 9 mm
Hg. This shows that the diffusion coefficient is dependent on the concentration of water.
Similar results have been seen with fatty acid films (Kamper and Fennema, 1984;
Fennema et al., 1994) and in hydrophilic polymers (Myers et al., 1961; Morillon et al.,
1999; Morillon et al., 2000).
When the relative humidity difference is increased to 100%, there is a large
change in the permeability constant (Table 2–5). As can be seen from the isotherms of
sucrose and cocoa powder (Figure 2–4), they tend to adsorb a significant amount of
moisture at high humidity, which will tend to swell the coating and change its structure.
Swelling and structural changes will affect the permeability behavior of the film (Rogers,
Table 2–6: Effective water vapor permeability constant (keff) and water vapor transmission rate (WVTR) as a function of the water vapor pressure gradient (∆p) for dark chocolate at 20oC (Biquet and Labuza, 1988) RH (%) ∆P (mmHg) Thickness
(mm) WVTR (g·m-
2·day-1) keff (g·mil·m-2·day-
1·mmHg-1) 0 - 33.0 0 - 5.79 0.594 1.20 4.94
0 - 54.4 0 - 9.54 0.598 1.34 3.38
0 - 64.8 0 - 11.40 0.608 2.74 5.85
0 - 80.8 0 - 14.13 0.612 3.21 5.56
33.0 - 80.8 5.79 - 14.13 0.590 2.35 6.65
54.4 - 80.8 9.54 - 14.13 0.597 2.12 11.02

38
1985), which may be the reason for the observed permeability behavior of chocolates and
coatings at high humidity.
In a coating film containing a fat, cocoa solids and sugar, Morillon et al. (2000)
found that the film permeability was much higher when liquid water was used as
compared to water vapor. This may be because the actual vapor pressure at the interface
of the coating was not 100% when water vapor was used. The existence of such
problems was pointed out in the section on the methods of measurement.
Composition: The presence of non-fat particles does not influence the WVTR or the
permeability constant at low vapor pressures, but at high relative humidity it drastically
changes the WVTR (Table 2–5). This behavior can again be explained in terms of the
moisture sorption isotherm. The data thus suggests that most of the diffusion takes place
through the hydrophilic particles.
The solid fat content is another important factor. Studies by Landmann et al.
(1960) and Talbot (1994) show that fats with high solid fat content are very good
moisture barriers. The fat present in the solid state is more tightly packed than in the
liquid state and hence will allow less amount of moisture to migrate.
Temperature: In theory, the WVTR should have an Arrhenius-type relationship with
temperature, but this is not observed (Table 2–7). For chocolates or cocoa butter, a
change in temperature is accompanied by phase and structural changes. Hence, there are
other factors, apart from the mobility of the penetrating molecule, that change with
temperature. Increasing the temperature increases the diffusivity of the penetrant
molecule and also decreases the solid fat content, both of which increase migration rate.

39
In judging the effect of temperature on WVTR, not only the temperature at which the
data is recorded will matter, but also the thermal history of the chocolate film will make a
difference, since the thermal history will determine the structure of the film.
Landmann et al. (1960) found that on reducing the temperature from 26.7 to 3oC,
there was no significant change in the permeability coefficient of hydrogenated
cottonseed oil films. Biquet and Labuza (1988) in their studies with dark chocolate found
that changing the temperature from 10 to 20oC did not change the WVTR, but increasing
it to 26oC almost tripled the rates (Table 2–7). SFC at 10 and 20°C is comparable and the
change in diffusivity through the liquid is small. Hence, the WVTRs obtained at these
two temperatures are comparable. On the other hand, changing the temperature from 20
to 26oC reduces the SFC from 90% to 80%, which may account for the large increase in
WVTR at 26oC. It can be seen here that the doubling the liquid fat content from 10 to
20%, almost doubles the peremeablity, which further suggests that the diffusion occurs
mainly through the liquid phase.
Table 2–7: Effective water vapor permeability constant (keff) and water vapor transmission rate (WVTR) of a dark chocolate at 20oC for three different temperatures (Biquet and Labuza, 1988)
RH (%)
∆P (mmHg)
Thickness (mm)
Temperature (oC)
WVTR (g·m-2·day-
1)
keff (g·mil·m-2·day-
1·mmHg-1) 0 - 82.1 0 - 7.58 0.584 10 3.34 5.56
0- 80.6 0 - 14.13 0.612 20 3.21 5.56
0 – 80.4 0 - 20.27 0.593 26 10.38 12.14

40
2.2.4 Mechanism of Moisture Migration
Chocolate contains hydrophilic particles embedded in a continuous fat phase.
Water molecules must diffuse through the fat phase (represented by the gradient in
background shading in Figure 2–9) to come in contact with the hydrophilic particles.
Hence, the rate of migration will depend on the structure of fat phase and the presence of
liquid fat. It was pointed out before that the moisture would have less resistance
migrating through the liquid lipid phase than the solid lipid phase. When the moisture
comes in contact with the hydrophilic particle, it gets adsorbed there. The amount of
moisture that will be adsorbed by the hydrophilic particle can be obtained from the
moisture sorption isotherm. Swelling of these particles may occur (shown in Figure 2–9
as a halo around the particles), which may cause cracking and accelerate moisture
migration. In addition, water adsorption may result in surface dissolution and accretion of
sugar, and crystallization of amorphous milk powder, which could lead to sugar bloom.
Once the hydrophilic particle is saturated, the moisture moves in the direction of lower
water activity.

41
Figure 2–9: Conceptual model for the diffusion of moisture through chocolate. The gradient in background shading is representative of the moisture content. The swelling of hydrophilic particles is suggested by the halos about the particles

42
The diffusion rate of moisture in the hydrophilic phase is much faster than that
through the hydrophobic phase. Evidence of this is presented in Table 2–5 where the
permeability is much greater through sweet milk chocolate containing non-fat particles as
compared to cocoa butter alone. Hence the rate-limiting step is diffusion through the
hydrophobic, lipid phase. From equation 2.8, the flux is inversely proportional to the
diffusion path length. Therefore, the interparticle distance, or packing density of the non-
fat particles will be an important factor in moisture migration rate.
The kinetics of moisture absorption for dark chocolates is shown in Figure 2–10.
From this data, it is evident that the moisture adsorption by dark chocolate demonstrates
anomalous non-Fickian behavior. Biquet and Labuza (1988) suggested that this
anomalous behavior is seen probably because of the crystallization of sugars. However,
in dark chocolate the sugar is in the crystalline form, hence the abnormal behavior would
probably be due some relaxation effects (Duda, 1999), such as swelling of the cocoa
particles as suggested in Figure 2–9.

43
Biquet and Labuza (1988) used sorption methods to determine the diffusion
coefficient of moisture through dark chocolates (Table 2–8). The data shows that the
effective diffusion coefficient is independent of the surrounding relative humidity. The
data obtained by Biquet and Labuza (1988) was used by (Rumsey and Krochta, 1994) to
numerically solve for the moisture diffusion through a model gel covered with a
chocolate film with poor results (Figure 2–11). They used a constant diffusion
coefficient for solving the equations, while from the above discussion one can conclude
that the diffusion coefficient is a function of the moisture content or water activity. Using
diffusion coefficients as a function of moisture content might have given better results.
Figure 2–10: Kinetics of moisture sorption for dark chocolates at 20°C and varying relative humidity. Reproduced with permission (Biquet and Labuza, 1988).

44
Table 2–8: Effective Diffusion Coefficient of moisture through Dark Chocolate Film at 20oC (Biquet and Labuza, 1988)
Sorption mode Initial aw RH (%) Thickness (mm) Deff·1013 (m2s-1)
Adsorption 0.01 75.4 0.607 (0.05) 1.08 (0.22)
64.8 0.594 (0.04) 0.82 (0.31)
Desorption 0.81 54.4 0.607 (0.04) 0.87 (0.09)
33.0 0.599 (0.04) 1.33 (0.13)

45
Antunes and Antunes (2000) modeled the kinetics of moisture sorption using a
non-linear diffusion equation. The diffusivity term used in their model was a linear
combination of two terms. The first term was a constant and the second term contained a
factor that was a function of moisture concentration. They fitted the kinetics of moisture
absorption data by Biquet and Labuza (1988) and found a good fit between the predicted
data and experimental values. Their attempt seemed more like a curve fitting effort
rather than modeling the diffusion behavior with an understanding of the mechanism.
Figure 2–11: Modeling of moisture transfer through a chocolate film. Reprinted from (Rumsey and Krochta, 1994), with permission from Technomic Publishing Co., Inc., copyright [1994])

46
The model however showed that using a diffusivity that is dependent on concentration
gives a better prediction of the actual data.
Moisture does not have much effect on either the cocoa solids or sugar in the
humidity range for which the diffusion coefficients have been determined by Biquet and
Labuza (1988). A more accurate determination of the diffusivity across a wider range of
relative humidity is required. Biquet and Labuza (1988) studied the migration
characteristics through dark chocolates. Studies need to be done for milk chocolates and
other coatings (coatings made with fats other than cocoa butter). The effect of different
ingredients such as emulsifiers in the coating on migration also needs to be studied to
understand the migration mechanism.
2.2.5 Methods of Control for Moisture Migration
Tempering the coating properly will reduce the moisture migration to a great
extent. Since tempering will give rise to a packed structure (i.e. less porous) (Loisel et
al., 1997), it will increase the diffusion resistance and decrease the migration rate. The
others aspects are selection of proper emulsifiers and sweeteners. Linke (1998) has
shown that using 0.3% lecithin and 0.1% PGPR tends to reduce ethanol migration. This
concept should be applicable for moisture migration as well. Non-fat particles tend to
adsorb a large quantity of moisture and swell the chocolate. This destruction of the
structure leads to a faster migration rate. Sweeteners that adsorb less moisture could be
used to delay migration. Research needs to be done on the optimal sweetener and
emulsifier to minimize migration.

47
Moisture migration is affected by the structure and the presence of hydrophilic
particles. Moisture will be adsorbed by the hydrophilic particles in the matrix and will
change the structure. The rate-limiting step for moisture migration will be the migration
through the lipid phase. The moisture migration studies should thus include the effect of
the lipid structure and the influence of moisture on the structural change of chocolate.
2.3 Statement of the Problem
Some of the specific questions that need to be answered are:
a) What are the possible mechanisms for moisture migration through chocolate
coatings?
b) How does composition affect moisture migration (What are the effects of
different types of fats, non-fat particles e.g. sugar and cocoa powder, and the
effect of emulsifiers on moisture migration?
c) How does the presence of water affect the structure of the chocolate coatings and
its functional behavior on wafers?
2.4 Hypothesis
A dark chocolate coating can be considered as a composite with the lipid being
the continuous phase, and the sugar and the cocoa particles, being the discontinuous
phase embedded in the continuous phase. Moisture migrates mainly through the lipid
phase and when comes in contact with the hydrophilic particles (sugar or cocoa powder),

48
it get adsorbed very quickly into the hydrophilic particle and it can be assumed that the
time taken for the moisture to get adsorbed into the hydrophilic particle is negligible
compared to the time taken for the moisture to diffuse through the continuous lipid phase.
The diffusion behavior of moisture in chocolate coatings in one-dimension can be given
by equation 21. If K’ is the partition coefficient between the hydrophilic particles and the
continuous lipid phase and if we assume K’ to be constant at each relative humidity, then
equation (21) can be written as:
2
2
'ss
xc
K1D
tc
∂∂
+=
∂∂
…(25)
When the hydrophilic particles are saturated with water, the diffusion of water
through the coatings can be thought of as the diffusion of gas molecules through a
membrane containing particles. If we assume that the particles are spherical in shape
then the steady-state diffusion coefficient Dss for a dilute system can be given by the
equation (26) (Cussler, 1997):
−φ++
−φ−+
=
0s0s
0s0s
0
ss
D1
D1
D1
D2
D1
D12
D1
D2
DD
…(26)
where D0 is the diffusion coefficient through the continuous media, Ds is the diffusion
coefficient through the spheres, and φ is the volume fraction of the spheres in the
composite material. If the particles does not take part in the diffusion process after
absorbing moisture i.e. Ds is zero then, we have:

49
φ+φ−
=2
)1(2DD
0
ss …(27)
If we consider the other limit in which the diffusion through the spheres is
extremely rapid i.e. Ds ∞, then we have:
φ−φ+
=1
21DD
0
ss …(28)
For this study, the diffusion coefficients obtained should be closer to the value
predicted by equation (27).
The rate of migration will be different for water vapor and liquid water. In the
presence of liquid water some sugar can solubalize with the moisture and diffuse into the
liquid water. The migration of sugar from the chocolate will change the structure of
coating and there will be higher free volume for the moisture to migrate through the
coating. The increase in the free volume will cause an increase in the rate of moisture
migration through the chocolate. Hence, the rate of moisture migration through the
coating in contact with liquid water will be higher than the migration rate when the
coating is in contact with the water vapor.
2.5 Objectives
The overall objective of this study was to understand the mechanisms of moisture
migration through a chocolate-flavored coating. The specific objectives were:

50
1. Understand the mechanism of moisture migration in chocolate coatings.
a. Measure the diffusion through coconut oil.
b. Construct the moisture sorption isotherm for each of the ingredients,
coconut oil, sugar, and cocoa powder, and also for a mixture of coconut oil
+ 0.5% lecithin.
c. Based on the diffusion model, predict the diffusion behavior through a
coating containing either sugar or cocoa powder.
d. Validate the model with data obtained using water vapor to study
diffusion.
e. Determine the effect of coating thickness on the water vapor transmission
rate
2. Study the effect of different ingredients and ingredient proportions on the rate of
moisture migration
a. Determine the effect of the proportion of coconut oil, cocoa powder, sugar
and lecithin.
b. Determine the effect of fat type (the SFC of the fat will influence the rate
of moisture migration)
c. Determine the effect of the sugar type (sucrose, glucose, lactose)
d. Effect of emulsifier type (lecithin, Citrem).

51
2.6 References
Aguilera, J. M. and Stanley, D. W. (1999). Microstructure and mass transfer: Solid liquid
extraction. Microstructural Principles of Food Processing and Engineering.
Gaithersburg, MD, Aspen Publishers: 325 - 372.
Aguilera, J. M., Stanley, D. W. and Baker, K. W. (2000). New dimensions in
microstructure of food products. Trends Food Sci. Technol. 11: 3 - 9.
Antunes, A. C. and Antunes, L. J. (2000). Non-linear effects in moisture adsorption by
chocolate. Int. J. Food Sci. Technol. 35(3): 323 - 329.
ASTM (1995). Standard test methods for water vapor transmission of flexible barrier
materials using an infrared detection technique (F-372). Annual Book of ASTM
standards. Philadelphia, PA, ASTM: 931-935.
ASTM (1995). Standard test methods for water vapor transmission of materials. Annual
Book of ASTM standards. Philadelphia, PA, ASTM: 697-704.
Barron, L. F. (1977). The expansion of wafer and its relation to the cracking of chocolate
and 'bakers' coatings. J. Food Technol. 12: 73 - 84.
Bell, L. N. and Labuza, T. P. (2000). Moisture Sorption: Practical Aspects of Isotherm
Measurement and Use. St. Paul, MN, American Association of Cereal Chemists.
Biquet, B. and Labuza, T. P. (1988). Evaluation of the moisture permeability
characteristics of chocolate films as edible moisture barrier. J. Food Sci. 53(4):
989 - 998.
Bird, R. B., Stewart, W. E. and Lightfoot, E. N. (1960). Transport Phenomena.
Singapore, John Wiley & Sons.

52
Brown, R. P. (1988). Permeability. Handbook of Plastic Test Methods. New York, NY,
John Wiley and Sons, Inc.: 387 - 402.
Cakebread, S. H. (1972). How to control moisture migration in composite products.
Candy Snack Ind.(April): 24 - 26, 70.
Chao, R. R. and Rizvi, S. S. H. (1988). Oxygen and water vapor transport through
polymeric film: A review of modeling approaches. Food and Packaging
Interactions. J. H. Hotchkiss. Washinton, D.C., ACS Symposium Series,
American Chemical Society. 365: 217 - 261.
Chinachoti, P. (1998). Water migration and food storage stability. Food Storage Stability.
B. Taub, A. Irwin and R. P. Singh. Boca Raton, FL, CRC Press: 245 - 267.
Cornillon, P. and Salim, L. C. (2000). Characterization of water mobility and distribution
in low and intermediate moisture food systems. Mag. Res. Img. 18: 335 - 341.
Coupland, J. N., Shaw, N. B., Monahan, F. J., O'Riordan, E. D. and O'Sullivan, M.
(2000). Modeling the effect of glycerol on the moisture sorption behavior of whey
protein edible films. J. Food Eng. 43: 25 - 30.
Crank, J. (1975). Mathematics of Diffusion. Oxford, England, Claredon Press.
Crank, J. and Park, G. S. (1968). Methods of measurement. Diffusion in Polymers. J.
Crank and G. S. Park. London, Great Britain, Academic Press: 1 - 39.
Cussler, E. L. (1997). Diffusion Mass Transfer in Fluid Systems. New York, NY,
Cambridge University Press.
Cussler, E. L., Hughes, S. E., Ward, W. J. and Aris, R. (1988). Barrier membranes. J.
Membr. Sci. 38: 161 - 174.

53
Debeaufort, F., Voilley, A. and Meares, P. (1994). Water vapor permeability and
diffusivity through methycellulose edible films. J. Membr. Sci. 91: 125 - 133.
Donhowe, I. G. and Fennema, O. (1994). Edible films and coatings: Characteristics,
formation, definitions, and testing methods. Edible Coatings and Films to
Improve Food Quality. J. M. Krochta, E. A. Baldwin and N. M. Corriedo.
Lancaster, PA, Technomic Publishers: 1 - 24.
Duda, J. L. (1999). Theoretical aspects of molecular mobility. Water Management in the
Design and Distribution of Quality Foods. Y. H. Roos, R. B. Leslie and P. J.
Lillford. Lancaster, PA, Technomic Publishing Company, Inc.: 237-253.
Dunlap, J. L., Harris, K. R. and Young, D. J. (1986). Experimental methods for studying
diffusion in gases, liquids and solids. Physical Methods of Chemistry. B. W.
Rossiter and R. C. Baetzold. New York, NY, John Wiley and Sons, Inc. 6: 175 -
282.
Eitzman, D. M., Melkote, R. R. and Cussler, E. L. (1996). Barrier membranes with tipped
impermeable flakes. AIChE Journal 42(1): 2 - 9.
Fennema, O., Donhowe, I. G. and Kester, J. J. (1994). Lipid type and location of the
relative humidity gradient on the barrier properties of lipids to water vapor. J.
Food Eng. 22: 225-239.
Fennema, O. R. (1996). Water and ice. Food Chemistry. O. R. Fennema. New York, NY,
Mercel Dekker: 17 - 94.
Gekas, V. (1992). Transport Phenomena in Foods and Biological Materials. Boca Raton,
FL, CRC Press.

54
Gennadios, A., Weller, C. L. and Gooding, C. H. (1994). Measurement errors in water
vapor permeability of highly permeable, hydrophilic edible films. J. Food Eng.
21: 395 - 409.
Hallstrom, B. and Skjoldebrand, C. (1983). Heat and mass transfer in solid foods.
Developments in Food Preservation. S. Thorpe. New York, NY, Applied Science
Publishers. 2: 61 - 94.
Kamper, S. L. and Fennema, O. (1984). Water vapor permeability of an edible, fatty acid,
bilayer film. J. Food Sci. 49(6): 1482 - 1485.
Kempf, N. (1967). The conging process - Tests on the moisture barrier properties of
coatings. Manuf. Conf. 47(July): 38 - 40.
Kester, J. J. and Fennema, O. (1989). The influence of polymorphic form on oxygen and
water vapor transmission through lipid films. J. Am. Oil Chem. Soc. 66(8): 1147 -
1153.
Kester, J. J. and Fennema, O. (1989). Resistance of lipid films to moisture migration. J.
Am. Oil Chem. Soc. 66(8): 1139 - 1146.
Kim, S. S., Kim, S. Y., Kim, D. W., Shin, S. G. and Chang, K. S. (1999). Moisture
sorption characteristics of composite foods filled with chocolate. J. Food Sci.
64(2): 300 - 302.
Labuza, T. P. and Hyman, C. R. (1998). Moisture migration and control in multi-domain
foods. Trends Food Sci. Technol. 9: 47 - 55.
Landmann, W., Lovegreen, N. V. and Feuge, R. O. (1960). Permeability of some fat
products to moisture. J. Am. Oil Chem. Soc. 37(1): 1 - 4.

55
Larumbe, A., Gonzalez, H. L., Resnik, S. L. and Chirife, J. (1991). Moisture migration
and mold growth in a composite chocolate product. Lebensm. Wiss. Technol. 24:
307 - 309.
Linke, L. (1998). Quality loss of chocolate due to liquid alcoholic centres.
Zentralfachschule Deutschen SusswarrenwirtSchaft symposium proceedings
"Chocolate Technology 98", Cologne, Germany.
Loisel, C., Lecq, G., Ponchel, G., Keller, G. and Ollivon, M. (1997). Fat bloom and
chocolate structure studied by mercury porosimetry. J. Food Sci. 62(4): 781 - 788.
Marom, G. (1985). The role of water transport in composite materials. Polymer
Permeability. J. Comyn. New York, NY, Elsevier Applied Science Publishers:
341 - 374.
McCarthy, M., Walton, J. and McCarthy, K. (2000). Magnetic resonance imaging:
Analysis of confectionery products and processes. Proceedings of the 54rd
Annual Production Conference, Pennsylvania Manufacturing Confectioners
Association, Hershey, PA.
McCarthy, M. J. and McCarthy, K. L. (1994). Quantifying transport phenomena in food
processing with nuclear magnetic resonance imaging. J. Sci. Food Agric. 65: 257
- 270.
McHugh, T. H., Avena-Bustillos and Krochta, J. M. (1993). Hydrophilic edible films:
Modified procedure for water vapor permeability and explanation for thickness
effects. J. Food Sci. 58(4): 899-903.
56
McHugh, T. H. and Krochta, J. M. (1994). Permeability properties of edible films. Edible
Coatings and Films to Improve Food Quality. J. M. Krochta, E. A. Baldwin and
M. N. Corriedo. Lancaster, PA, Technomic Publishing Inc: 139-187.
Minifie, B. W. (1989). Chocolate, Cocoa and Confectionery: Science and Technology.
Gaithersburg, MD, Aspen Publishers.
Minson, E. (1990). Cookie confectionery combinations. Manuf. Conf. May: 121 - 126.
MOCON (1984). Operating manual for Permatran W. Minneapolis, MN, Mordern
Controls Inc.
Morillon, V., Debeaufort, F., Blond, G. and Voilley, A. (2000). Temperature influence on
moisture transfer through synthetic films. J. Membr. Sci. 168: 223-231.
Morillon, V., Debeaufort, F., Capelle, M., Blond, G. and Voilley, A. (2000). Influence of
the physical state of water on the barrier properties of hydrophilic and
hydrophobic films. J. Agric. Food Chem. 48: 11-16.
Morillon, V., Debeaufort, F., Jose, J., Tharrault, J. F., Capelle, M., Blond, G. and Voilley,
A. (1999). Water vapor pressure above saturated salt solutions at low
temperatures. Fluid Phase Equilibria 155: 297-309.
Myers, A. W., Meyer, J. A., Rogers, C. E., Stannett, V. and Szwarc, M. (1961). Studies in
the gas and vapor permeability of plastic films and coated papers. Part VI. The
permeation of water vapor. Tappi 44(1): 58 - 64.
Neogi, P. (1996). Transport phenomena in polymer membranes. Diffusion in Polymers. P.
Neogi. New York, NY, Marcel Dekker: 143 - 171.

57
Ogunmoyela, O. A. and Birch, G. G. (1984). Effect of sweetner type and lecithin on
hygroscopicity and mold growth in dark chocolates. J. Food Sci. 49: 1088 - 1089,
1142.
Ozdemir, M. and Floros, J. D. (2001). Analysis and modeling of potassium sorbate
diffusion through edible whey protein films. J. Food Eng. 47: 149 - 155.
Peleg, M. (1993). Assessment of a semi-empirical four parameter general model for
sigmoid moisture sorption isotherm. J. Food Proc. Eng. 16: 21 - 37.
Peppas, N. A. and Brannon-Peppas, L. (1994). Water diffusion and sorption in
amorphous macromolecular systems and foods. J. Food Eng. 22: 189 - 210.
Rogers, C. E. (1985). Permeation of gases and vapors in polymers. Polymer Permeability.
J. Comyn. New York, NY, Elsevier Applied Science Publishers: 11 - 73.
Rosenberger, H. L. (1994). Benefits and risks associated with public refrigerated
warehousing of candy. Proceedings of the 48th PMCA production conference,
Hershey, PA.
Rumsey, T. and Krochta, J. M. (1994). Modeling mass transfer in foods coated with
edible films. Edible Coatings and Films to Improve Food Quality. J. M. Krochta,
E. A. Baldwin and M. N. Corriedo. Lancaster, PA, Technomic Publishing Inc:
337 - 356.
Schmidt, S. J. and Lai, H. M. (1991). Use of NMR and MRI to study water relation in
foods. Advances in Experimental Medicine and Biology. H. Levine and L. Slade.
New York, NY, Plenum press. 302: 405 - 452.

58
Schmidt, S. J., Xun, S. and Litchfield, J. B. (1996). Applications of magnetic resonance
imaging in foods. Crit. Rev. Food Sci. Nutr. 36(4): 357 - 385.
Stannett, V. and Yasuda, H. (1965). The measurement of gas and vapor permeation and
diffusion in polymers. Testing of Polymers. J. V. Schmitz, Interscience Publishers.
1: 393-418.
Talbot, G. (1994). Minimization of moisture migration in food systems. Food Ingredients
Europe, Paris.
Troutman, M. Y. (1999). Moisture migration and textural changes during manufacture of
soft-panned confections. M. S. thesis, The Pennsylvania State University.
van den Berg, C. (1985). Development of BET like models for sorption of water in foods,
theory and relevance. Properties of Water in Foods. D. Simatos and J. L. Multon.
Dordrecht, Netherlands, Martinus Nijhoff Publishers: 119 - 131.
van den Berg, C. and Bruin, S. (1981). Water activity and its estimation in food systems.
Water Activity Influences in Food Quality. L. B. Rockland and G. F. Stewart.
New York, NY, Academic Press: 1 - 61.
van der Zanden, A. J. J. (2000). Heat and mass transfer in heterogeneous media where a
phase transition takes place. Chem. Eng. Sci. 55: 6235 - 6241.
Vieth, W. R. (1991). Diffusion In And Through Polymers. New York, Hanser Publishers.
Vrentas, J. and Duda, J. L. (1986). Diffusion. Encyclopedia of Polymer Science and
Engineering. New York, NY, John Wiley and Sons Inc. 5: 36 - 68.
Weisz, P. B. (1967). Sorption - diffusion in heterogenous systems. Part 1. General
sorption behavior and criteria. Trans. Faraday Soc. 63: 1801 - 1807.
59
Wolf, W., Speiss, W. E. L. and Jung, G. (1985). Standardization of isotherm
measurements. Properties of Water in Foods. D. Simatos and J. L. Multon.
Dordrecht, Netherlands, Martinus Nijhoff Publishers: 661 - 671.

Chapter 3
MECHANISM OF MOISTURE MIGRATION THROUGH CHOCOLATE-FLAVORED COATINGS
3.1 Abstract
The mechanism of moisture migration through chocolate-flavored coatings was
investigated. Approaches used by researchers in chemical engineering to study diffusion
through heterogeneous systems were applied to study moisture diffusion in chocolate-
flavored coatings. It was found that the unsteady-state diffusivity of moisture through the
coatings could be estimated from the diffusivity of water through the continuous fat
phase and the partition coefficient of moisture between sucrose and cocoa powder and the
fat phase. The partition coefficient is the local equilibrium between the concentration in
the continuous phase, c, and the concentration in the dispersed phase, cp (K = cp/c). For
coatings containing just oil and cocoa powder, the diffusion of moisture in the dispersed
phase, i.e. cocoa powder, occurred through the cocoa powder particle. When lecithin was
added, the water molecules diffused through the cocoa powder particles as well as along
their surfaces. With the diffusion of moisture, there were structural changes that altered
the diffusivity of moisture through the coating. These structural changes occurred
because the sucrose particles dissolved in the migrating moisture and the swelling of
cocoa powder in the presence of moisture.

61
3.2 Introduction
The diffusion of moisture in food materials is of fundamental importance for
processing and storage (Saravacos and Maroulis, 2001). The transport of moisture into or
from food materials is an important factor in controlling food quality, chemical reactions
and microbial growth during storage (Labuza and Hyman, 1998; Saravacos and Maroulis,
2001). One way to slow down moisture transport is to use an edible barrier between the
two domains of a food material. Chocolate and chocolate-flavored coatings are used as
an edible film in many applications (Morillon et al., 2000; Ghosh et al., 2002). An
understanding of the diffusion mechanism through chocolate coatings can help in
formulating more moisture resistant barriers.
The transport of water, between different domains of a food material or into the
environment, occurs mainly by diffusion (Labuza and Hyman, 1998; Saravacos and
Maroulis, 2001). The diffusion process is modeled using Fick’s law and the term that is
generally used to compare diffusion rates in different systems is the diffusion coefficient,
D. Most diffusivity data available for food systems is the apparent diffusivity and there is
no understanding of the actual diffusion mechanism. “The word ‘apparent’ reaffirms that
we do not know exactly the mechanism of transport, which in most cases can be quite
complex” (Aguilera and Stanley, 1999).
Most food materials are heterogeneous in nature and the moisture sorption
process involves the adsorption of water molecules into the food material. In such
situations, the water molecule diffusing through the food material will exist as two
distinct species. Some of the water molecules will be adsorbed to the food material and
62
can be considered to be bound or immobile, while a second class of molecules can be
considered to be the mobile fraction. Similar phenomena, i.e., interaction of a mobile and
immobile species, can be found in other systems, such as diffusion of dyes in fiber,
diffusion of solvents in two-phase block copolymers, and diffusion in porous media
(Duda, 1999). Weisz (1967) had proposed a solution for the diffusion problem where
sorption and diffusion are taking place in heterogeneous systems. This solution was
verified using experimental data from the diffusion of dye molecules through a porous
substrate (Weisz, 1967; Weisz and Hicks, 1967; Weisz and Zollinger, 1967; Weisz and
Zollinger, 1968). van der Zanden (2000) used an approach similar to Weisz (1967) for
modeling heat and mass transfer in heterogeneous media with phase transition.
As with many other food systems, only the effective diffusion coefficient data for
chocolate is available in literature (Biquet and Labuza, 1988). Chocolate or chocolate-
flavored coatings are heterogeneous food systems and consist of a continuous fat phase
with the cocoa powder and sucrose as a dispersed phase. The objective of this paper is to
understand the mechanism of moisture migration through chocolate-flavored coatings
and to assess the applicability of the Weisz (1967) model to predict diffusion through a
chocolate-flavored coating.
3.3 Mathematical Analysis of Diffusion Through Dark Chocolate
Let us first consider the structure of dark chocolate (Figure 3–1). It has a
continuous fat phase with sucrose and cocoa powder particles as the dispersed phase. In

63
the following paragraphs, an approach for obtaining the diffusivity of such systems from
the diffusivity data of the continuous phase is outlined.
The diffusion through a homogeneous material, e.g. a homogeneous fat, is given
by Fick’s law (equation 3.1):
∂∂
∂∂
=∂∂
xcD
xtc ( 3.1 )
where D is the fundamental diffusion coefficient (m2 s-1), x is the diffusion length (m),
and c is the concentration (moles m-3). If the diffusivity is independent of concentration,
this equation reduces to equation 3.2:
2
2
xcD
tc
∂∂
=∂∂ ( 3.2 )
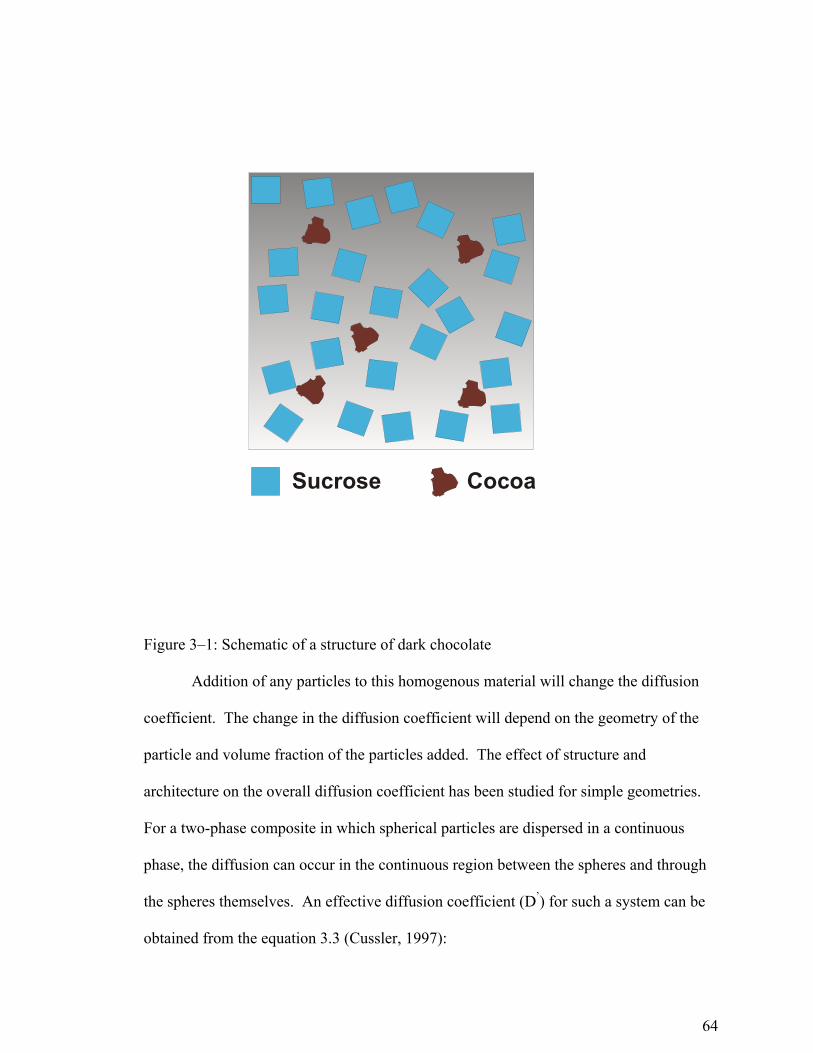
64
Addition of any particles to this homogenous material will change the diffusion
coefficient. The change in the diffusion coefficient will depend on the geometry of the
particle and volume fraction of the particles added. The effect of structure and
architecture on the overall diffusion coefficient has been studied for simple geometries.
For a two-phase composite in which spherical particles are dispersed in a continuous
phase, the diffusion can occur in the continuous region between the spheres and through
the spheres themselves. An effective diffusion coefficient (D’) for such a system can be
obtained from the equation 3.3 (Cussler, 1997):
Figure 3–1: Schematic of a structure of dark chocolate
Sucrose Cocoa
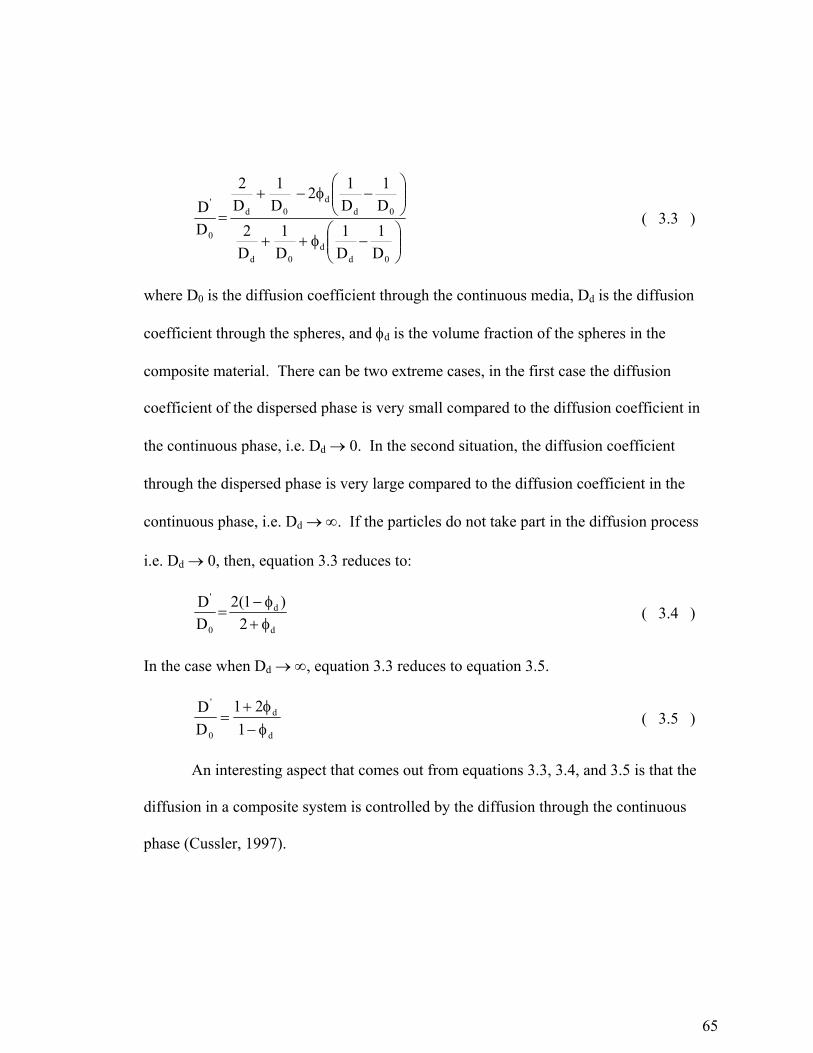
65
−φ++
−φ−+
=
0dd
0d
0dd
0d
0
'
D1
D1
D1
D2
D1
D12
D1
D2
DD ( 3.3 )
where D0 is the diffusion coefficient through the continuous media, Dd is the diffusion
coefficient through the spheres, and φd is the volume fraction of the spheres in the
composite material. There can be two extreme cases, in the first case the diffusion
coefficient of the dispersed phase is very small compared to the diffusion coefficient in
the continuous phase, i.e. Dd → 0. In the second situation, the diffusion coefficient
through the dispersed phase is very large compared to the diffusion coefficient in the
continuous phase, i.e. Dd → ∞. If the particles do not take part in the diffusion process
i.e. Dd → 0, then, equation 3.3 reduces to:
d
d
0
'
2)1(2
DD
φ+φ−
= ( 3.4 )
In the case when Dd → ∞, equation 3.3 reduces to equation 3.5.
d
d
0
'
121
DD
φ−φ+
= ( 3.5 )
An interesting aspect that comes out from equations 3.3, 3.4, and 3.5 is that the
diffusion in a composite system is controlled by the diffusion through the continuous
phase (Cussler, 1997).

66
Let us consider the case when the spherical particles in the dispersed phase adsorb
more moisture than the continuous phase. Fick’s equation for such a system in one
dimension can be written as (Weisz, 1967):
2
2'
xcD
t'c
∂∂
=∂∂ ( 3.6 )
where c is the concentration of the moisture in the continuous phase (g cm-3) and c' is the
effective moisture concentration (g cm-3) in the sample and is given by equation 3.7.
ddd' cc)1(c φ+φ−= ( 3.7 )
where cd is the concentration of moisture in the dispersed particles. Since equation 3.6
contains one more variable than equation 3.1, a solution is not attainable without
additional information. For all processes where equilibrium between the mobile and
dispersed phases is rapid compared to the overall rate of the diffusion process, an
isotherm cd = f(c) will provide the information necessary to define the system. In the case
of food systems, moisture sorption isotherms are used to obtain an equilibrium
relationship between the water activity and the moisture content. Assuming that the local
equilibrium between the concentration in the continuous phase, c, and the concentration
in the dispersed phase, cd, is described with a partition coefficient, K (van der Zanden,
2000) as:
mm
ccK ddd
ρρ
== ( 3.8 )
where ρ is the density of the continuous phase, ρd is the density of the spherical particles,
m is the moisture content in the continuous phase, and md is the moisture content in the
spherical particles. Since the equilibrium moisture content of different food constituents

67
differ with water activity, the partition coefficient, K, will vary with water activity.
However, if we assume that the partition coefficient is constant, then, from equations 3.4,
3.6, 3.7 and 3.8, we get:
2
2
dd
'
xc
K)1(D
tc
∂∂
φ+φ−=
∂∂ ( 3.9 )
Equation 3.9 can be used to describe the unsteady state diffusion and the effective
diffusion coefficient can be given by equation 3.10.
K)1('DD
ddeff φ+φ−
= ( 3.10 )
where D’ is given by equation 3.3. Equation 3.10 can also be used to understand
the mechanism of moisture diffusion through the dispersed particles. If the diffusion
coefficient, D’ in equation 3.10 follows equation 3.4, then the diffusion occurs through
the continuous phase, while if it follows equation 3.5, the diffusion occurs through the
spheres. The unsteady state diffusion can be described by equation 3.10 and the steady
state diffusion can be described using equation 3.3.
In the above derivation, it was assumed that the partition coefficient is constant
over the whole range of water activities; the extension towards a non-linear distribution
of K has been described by Smith and Keller (1985). While deriving the unsteady state
diffusivity, it was also assumed that there are no structural changes associated with the
diffusion process. In the case of chocolate-flavored coatings structural changes can occur
due to swelling of cocoa powder or the dissolution of sugar at high relative humidities.
These structural changes in the coating can change the rate of diffusion of moisture
through the coating.

68
3.4 Materials and Methods
3.4.1 Materials
The ingredients needed to perform this study were sucrose, cocoa powder,
lecithin, and coconut oil.
3.4.1.1 Sucrose
Crystalline sucrose (pure cane extra fine granulated sucrose with purity ~ 100%)
was obtained from Florida Crystals (Palm Beach, FL). The particle size of granulated
sucrose was larger than 100 µm and needed to be ground into a particle size range that is
typically present in chocolate-flavored coatings (average size 24-28 µm). The sucrose
crystals were therefore ground using a jet mill (Model 0101-C6 (S), Jet-O-Mizer, Fluid
Enery Aljet, Plumsteadville, PA) to obtain the desired particle size.
When operating the jet mill, the inlet air pressure was 120 psi, the pusher nozzle
was set at 100 psi, the first grinder nozzle was set at 100 psi, and the second grinder
nozzle was set at 90 psi. The flow rate dial was set at 25. An air compressor (Model #
C1071080VMSA, Campbell Hausfeld, Harrison, OH) supplied the high-pressure air at
the inlet of the jet mill.
To avoid clumping, the sucrose was dried immediately after grinding in a vacuum
oven (National Appliance Co., Portland, OR), maintained at 60oC and a vacuum of 20”
Hg, for 10-12 hours. The dried sucrose was transferred into airtight containers, and was
stored in a desiccator cabinet at 18oC.

69
3.4.1.2 Cocoa Powder
Defatted cocoa powder in pellet form was obtained from Comet Specialty
Ingredients Co. (Freeport, TX). The cocoa powder pellets were ground using a jet mill
(Model 0101-C6 (S), Jet-O-Mizer, Fluid Enery Aljet, Plumsteadville, PA) to obtain cocoa
powder particles with particle size less than 20 µm. The operating conditions were the
same as that for sucrose, except for the feed rate, which was set at 35. The cocoa powder
was dried in a vacuum oven (National Appliance Co., Portland, OR), maintained at 60oC
and a vacuum of 20” Hg, for 10-12 hours. The dried cocoa powder transferred into
airtight containers, and was stored in a desiccator cabinet at 18oC.
3.4.1.3 Coconut Oil
Coconut oil (Victory 76, Lot# 49815, Formula # F00880) was obtained from
ACH Humko (Cordova, TN). The melting point of the coconut oil was 24oC, and the
solid fat content at 18.5oC was 54%.
3.4.1.4 Lecithin
Granular lecithin (purity ~ 97%) was obtained from Acros Organics (Fisher
Scientific, Pittsburgh, PA). Lecithin is made of a mixture of phospholipids with
phosphatidyl-choline, phosphatidyl-ethanolamine and phosphatidyl-inositol as its main
components. The lecithin had a moisture content of less than 0.1%.

70
3.4.2 Experimental Design
To validate the model proposed is section 3.3, and to determine the mechanism of
moisture migration through chocolate-flavored coatings, two series of experiments were
performed. In the first series, coatings were prepared using three levels of cocoa powder
(20, 30 & 40% w/w) and two levels of sucrose (30 & 40% w/w) in coconut oil. In the
second series, the coconut oil from the first series was replaced by coconut oil + 0.5%
lecithin. The unsteady-state moisture diffusivity was determined for the above-
mentioned coatings and also for coconut oil and coconut oil + 0.5% lecithin. The
experimental design is shown in Table 3–1. The diffusivity at each composition was
determined in duplicates.
From equation 3.10, it can be seen that the unsteady-state diffusivity depends on
two variables, the partition coefficient K, and the volume fraction of the dispersed phase
φd. Four different values of partition coefficient were obtained, two values for sucrose
and cocoa powder with coconut oil, and another two values of K with coconut oil + 0.5%
Table 3–1: Experimental design for the moisture diffusion experiments
Coconut Oil Coconut Oil + 0.5% lecithin Sucrose (w/w) Cocoa Powder
(w/w) Sucrose (w/w) Cocoa Powder
(w/w) 0 0 0 0 0 2.5 0 2.5 30 0 30 0 40 0 40 0 0 20 0 20 0 30 0 30 0 40 0 40

71
lecithin. The difference in the two series of experiments will also provide an
understanding of the role of lecithin on moisture migration. Varying levels of φd was
obtained by varying the levels of sucrose and cocoa powder. The weight fraction was
converted into volume fraction by using equation 3.11.
c
c
d
d
d
d
d mm
m
ρ+
ρ
ρ=φ ( 3.11 )
where md is the weight fraction of the dispersed phase, mc is the weight fraction of the
continuous phase, ρd is the density of the dispersed phase, and ρc is the density of the
continuous phase. For calculations, the density values used for each component were:
sucrose 1.5 g cm-3, cocoa powder 1.3 g cm-3, and coconut oil and coconut oil +0.5%
lecithin 0.9 g cm-3.
3.4.3 Measurement of Moisture Content
The moisture analysis of sucrose and cocoa powder was performed according to
the method suggested by Troutman (1999). About 1g of the sample (i.e., sucrose or cocoa
powder) was placed in a Kimble Kimax culture tube with approximately 10 g of a 1:1
formamide (Fisher Scientific, Pittsburgh, PA): methanol (Karl Fischer grade, anhydrous,
VWR Scientific, Pittsburgh, PA) solvent. The weights of the sample and the solvent
were recorded to obtain the dilution factor. A layer of Teflon tape was put around the
threads of the culture bottle. The culture bottles were closed using the cap of the tube.
Application of Teflon tape ensures airtight seal in the culture bottles. The culture
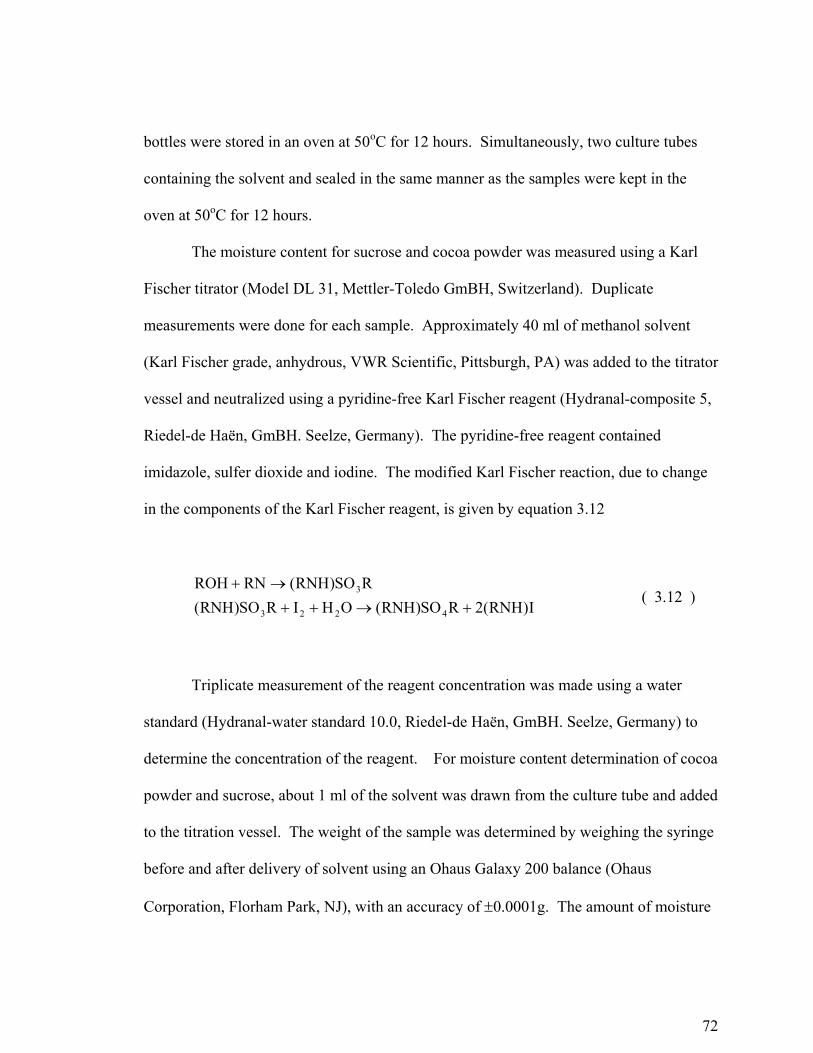
72
bottles were stored in an oven at 50oC for 12 hours. Simultaneously, two culture tubes
containing the solvent and sealed in the same manner as the samples were kept in the
oven at 50oC for 12 hours.
The moisture content for sucrose and cocoa powder was measured using a Karl
Fischer titrator (Model DL 31, Mettler-Toledo GmBH, Switzerland). Duplicate
measurements were done for each sample. Approximately 40 ml of methanol solvent
(Karl Fischer grade, anhydrous, VWR Scientific, Pittsburgh, PA) was added to the titrator
vessel and neutralized using a pyridine-free Karl Fischer reagent (Hydranal-composite 5,
Riedel-de Haën, GmBH. Seelze, Germany). The pyridine-free reagent contained
imidazole, sulfer dioxide and iodine. The modified Karl Fischer reaction, due to change
in the components of the Karl Fischer reagent, is given by equation 3.12
I)RNH(2RSO)RNH(OHIRSO)RNH(RSO)RNH(RNROH
4223
3
+→++→+
( 3.12 )
Triplicate measurement of the reagent concentration was made using a water
standard (Hydranal-water standard 10.0, Riedel-de Haën, GmBH. Seelze, Germany) to
determine the concentration of the reagent. For moisture content determination of cocoa
powder and sucrose, about 1 ml of the solvent was drawn from the culture tube and added
to the titration vessel. The weight of the sample was determined by weighing the syringe
before and after delivery of solvent using an Ohaus Galaxy 200 balance (Ohaus
Corporation, Florham Park, NJ), with an accuracy of ±0.0001g. The amount of moisture

73
in the sample was determined automatically by the Karl Fischer instrument using
equation 3.13.
% moisture = strength of the Karl Fischer reagent (mg water/ml reagent) x ml Karl Fischer reagent added/mg sample
( 3.13 )
The moisture content of the solvent was also determined. The moisture content of the
original sample was determined using equation 3.14.
2
11
2
1
ff
x100
xff
xmoisture% −
+= ( 3.14 )
where x is the moisture content of the solvent with the sample, x1 is the moisture content
of the solvent, f1 is the weight of the solvent, and f2 is the weight of the sample.
The moisture content of the fat samples was in the range of the moisture content
of the solvent being used. Due to dilution factor a small variation in the moisture content
value reported by Karl Fischer method gave a large variation in the moisture content.
Therefore, the moisture content of coconut oil and coconut oil + 0.5% lecithin was
determined using vacuum oven method. The moisture in the samples was removed by
keeping the samples in a vacuum oven (National Appliance Co., Portland, OR),
maintained at 60oC and a vacuum of 20” Hg, for 24 hours. The weight of the samples
before and after drying was taken using an Ohaus Galaxy 200 balance (Ohaus
Corporation, Florham Park, NJ), with an accuracy of ±0.0001g. The moisture content of
the samples were determined using equation 3.15.
100xm
mmmoisture%d
di −= ( 3.15 )
where mi is the initial weight, md is the weight of the dried sample.

74
3.4.4 Moisture Sorption Isotherm
The moisture sorption isotherm for ground sucrose, cocoa powder, coconut oil,
and coconut oil + 0.5% lecithin was determined at 20oC. Saturated salt solutions of
lithium chloride (LiCl), magnesium chloride (MgCl2), magnesium nitrate (Mg(NO3)2),
potassium iodide (KI), sodium chloride (NaCl), ammonium chloride (NH4Cl), and
potassium chloride (KCl) were used to obtain water activity values of 0.113 ± 0.003,
0.331 ± 0.002, 0.544 ± 0.002, 0.699 ± 0.003, 0.755 ± 0.004, 0.792 ± 0.004, and 0.851 ±
0.003, respectively (Bell and Labuza, 2000). Duplicate measurements of equilibrium
moisture content were done at each water activity. The saturated salt solutions were put
in the bottom of Mason jars (~ 473 ml), to a depth of about 1 cm. A square support of
size approximately 3 cm x 3 cm x 6 cm (high) was made from steel wire mesh and placed
in the Mason jar. For sucrose and cocoa powder, approximately 5g of sample was put in
an aluminum weighing dish and placed on the wire mesh support (Figure 3–2). The
Mason jars were kept in a temperature-controlled chamber (Model 310, Imperial III
Incubator, Labline, Inc., Melrose Park, IL) at 20±1oC. The weight of the samples was
taken every day using an Ohaus Galaxy 200 balance (Ohaus Corporation, Florham Park,
NJ), with an accuracy of ±0.0001g, until there was no change in weight (±0.001g) for 3
days. Both cocoa powder and sucrose reached equilibrium with 2-3 days of storage. The
moisture contents of the samples were determined using the Karl Fischer method as
previously described. For the desorption isotherm, the sucrose and cocoa powder
samples were allowed to equilibrate over potassium chloride solution for one week.
Desorption isotherms using these hydrated samples were obtained as explained above.

75
For the sorption isotherm of coconut oil and coconut oil + 0.5% lecithin, the fat
samples was melted at 40oC and poured into aluminum weighing dish and was allowed to
solidify in a room maintained at 18oC. A mark was made in each weighing dish at a
height of 3 mm and the melted fat was poured up to that mark. The weight of the
samples was approximately 6g. The aluminum weighing dishes were put in Mason jars
containing saturated salt solutions. The weight was taken once in every three days using
an Ohaus Galaxy 200 balance (Ohaus Corporation, Florham Park, NJ), with an accuracy
of ±0.0001g. Since the moisture content of coconut oil or coconut oil + 0.5% lecithin
was very low (<0.5%) at any water activity, no noticeable weight change was apparent
after one week. To estimate the time needed for the fat samples to reach equilibrium, the
diffusion of moisture through the fat kept in the pan was assumed to be similar to
diffusion in plane sheet. The time needed to reach equilibrium for diffusion in plane
sheet can be estimated to be l2/D, where l is the thickness of the sheet and D is the
diffusion coefficient. From preliminary experiments, the diffusion coefficient of
moisture in coconut oil was found to be of the order of 10-11 m2s-1. Assuming the
thickness of the fat to be 3 mm, the time needed to reach equilibrium is approximately 11
days. To account for any variation in the thickness of the fat samples, the samples were
allowed to equilibrate for three weeks, after which the moisture content was determined
using the vacuum oven method.

76
3.4.5 Film Preparation
For making the coating, the ingredients were mixed at the ‘blend’ setting in a
blender (Pulse Matic, Oster Corporation, Milwaukee, WI) for two minutes. The total
weight of the ingredients per batch was 250g and two batches were made. To ensure that
Figure 3–2: Setup for measuring moisture sorption isotherm
77
the fat was in the liquid phase, the blender was kept inside a chamber (Model 680A,
Labline Instruments, Inc., Melrose Park, IL) maintained at 40oC. The two batches were
mixed after blending to get the total weight of the coating to be approximately 500g.
During the mixing process, numerous air bubbles were incorporated into the coating mix.
Hence, the coating mix was kept in a vacuum oven, maintained with a vacuum of 20” Hg
and a temperature of 70oC, for 24 hours to remove the air bubbles. When the coating
samples were removed from the oven, settling of the particulate phase was observed. The
melted test samples (approximately 500g) were mixed at the lowest setting, being careful
that no air was incorporated during this process, in a mixer (Model C-100T, Hobart
Corporation, Troy, OH) at 50oC for three hours.
To prepare films for diffusion studies, parchment paper was placed on a
marble slab that had a flat surface. The purpose of the marble slab was to absorb the heat
from the coating during the solidification process. For coatings containing cocoa powder,
a stainless steel sheet (0.8 mm thick) containing four 9 cm diameter holes was placed on
top of the parchment paper (Figure 3–3). Melted coating was poured into the holes and
allowed to solidify for about 30 minutes. The temperature of the room was maintained at
around 16oC. After the coating had solidified, as observed visually, excess material was
removed using a hot spatula to obtain a film of about 1 mm thickness. After removing
the excess material, the whole system was kept in a refrigerator (Model TBX18SLB,
General Electric Co., Louisville, KY) for 10 minutes to solidify the film completely,
which eased the removal of the coating from the parchment paper. The test film was
removed from the mold by cutting the coating around the edges with a hot knife. The

78
thickness of each coating was measured at four different points using a micrometer
(Craftsman, Sears, Roebuck & Co, Chicago, IL). Preliminary experiments had shown
that the films made out of coconut oil or coconut oil + 0.5% lecithin and the films
containing just sugar particles in oil had much lower diffusivity than films containing
cocoa powder. Therefore, to obtain a measurable lag time (see section 3.4.6.2), the films
for coconut oil, coconut oil + 0.5% lecithin, and the coatings containing sugar were made
using a 1.8 mm thick mold. The process was similar to that used for the 1 mm thick film,
except that for the thick films, the time allowed for solidification was about 90 minutes.
The films were stored in a desiccator cabinet, in a room maintained at 18oC. The
coatings with sugar were stored in the desiccator cabinet for at least one week, and the
coatings with cocoa powder for at least two weeks, prior to being used for diffusion
experiments.

79
3.4.6 Measurement of Diffusion Coefficient
3.4.6.1 Controlled Environment Setup
A system was setup to provide the desired temperature and relative humidity
(Figure 3–5). A chamber made using 0.635 cm thick acrylic plastic sheets with an inside
volume of 31400 cm3 (dimension 43.18 cm x 27.94 cm x 26.04 cm) was used for this
study. The chamber had an O-ring gasket and a lid made with 1.27cm thick plastic.
Figure 3–3: Picture of the mold for making the chocolate coatings (hole diameter = 9 cm)

80
The relative humidity inside the chamber was maintained 13 ± 2 % using
saturated potassium hydroxide solution. A fan (type U920IB, Tobishi Kosan Co. Ltd.,
Japan) was used to create convection inside the chamber, which allowed the humidity
inside the chamber to reach equilibrium quickly after any disturbance. The plastic
chamber was kept inside an environmental chamber (Model 680A, Labline Instruments,
Inc., Melrose Park, IL) maintained at 16.5oC. The fan used for convection and the
absorption of moisture by KOH solution, generated heat and so the temperature inside the
plastic chamber was maintained at 18.5 ± 0.5oC.
The temperature and relative humidity within the chamber was monitored every
five minutes using a temperature and relative humidity probe (Model HMP35C,
Campbell Scientific, Inc., Logan, UT) and a data logger (21X Micrologger, Campbell
Scientific, Inc., Logan, UT). The temperature and relative humidity inside the chamber
during a typical experiment is shown in Figure 3–4. The spikes in the relative humidity
line show the times when the chamber was opened for weighing the samples. The extent
of the change in the humidity depended on the humidity of the atmosphere outside.

81
3.4.6.2 Experimental Procedure
For measuring the diffusion coefficient, saturated salt solution (NaCl or KCl) was
put at the bottom of Thwing Albert cups (Thwing Albert, Philadelphia, PA) to obtain a
relative humidity of approximately 75% (NaCl) or 85% (KCl). The test sample was then
carefully placed in the Thwing Albert cups (outer diameter 9.2 cm, inner diameter 7.65
cm, and depth 1 cm). The exposed area of the coating was 46 cm2. The edges of the
sample were sealed using an excess amount of melted sample material. The cups were
immediately put in the plastic chambers. The weight of the samples was measured at
0
5
10
15
20
25
30
0 50 100 150 200
Time (h)
Tem
pera
ture
(C) o
r Rel
ativ
e H
umid
ity(%
)
TemperatureRelative Humidity
Figure 3–4: Temperature and relative humidity inside the plastic chamber

82
regular intervals using an analytical balance (AB105, Mettler Toledo, Switzerland) with
an accuracy of 0.0001g.
The unsteady state diffusivity of moisture through the test films was
obtained using the time lag method (Vieth, 1991). The unsteady state diffusivity (Deff)
through a sample of thickness l, can be determined from the x-intercept of the straight
line portion of the weight loss versus time curve (Figure 3–6) using the following relation
(Equation 3.16):
Figure 3–5: Setup for measuring the diffusivity of the fat coatings

83
lag
2
eff t6lD = ( 3.16 )
3.4.7 Water Vapor Permeability
The water vapor permeability (WVP) was calculated using equation 3.17:
mmHgdaymmilg
pAlslopeWVP 2ƥ
•= ( 3.17 )
Time
Wei
ght l
oss
tlag
Curve from Experimental Data
Figure 3–6: Approach to steady state for a coating using the time lag method

84
where “slope” is the slope of the straight line portion of the time-weight loss curve, A is
the area of the film (m2), l is the thickness of the coating (mil) and ∆p is the vapor
pressure difference (mm Hg).
3.5 Results and Discussion
3.5.1 Moisture Sorption Isotherm
The moisture adsorption and desorption isotherm for cocoa powder and sucrose
are shown in Figure 3–7. It can be clearly seen that the cocoa powder adsorbs more
moisture than sucrose at water activity levels below 0.85. The moisture content at each
water activity represents the average value of two replications. The sorption isotherms of
cocoa powder have a sigmoidal shape, which is typical of most food materials (Iglesias
and Chirife, 1982). The sorption isotherms of cocoa powder also show that the
adsorption and desorption curves exhibited hysteresis, i.e., the moisture content at a
particular water activity was higher for the desorption curve than for the adsorption
curve. However, no hysteresis was observed in the sorption isotherm of sucrose. Cocoa
powder has a very porous structure (Garbolino, 2002) and the moisture goes into these
pores during adsorption. The moisture present in these pores can remain trapped during
the desorption process. On the other hand, crystalline sucrose has a very ordered
structure with close molecular packing, therefore, no hysteresis is observed for sucrose.

85
The moisture adsorption isotherm of coconut oil, sucrose, and a mixture of
coconut oil +0.5% lecithin is shown in Figure 3–8. Oils are hydrophobic materials and
therefore the moisture adsorbed by the oils at any water activity is very low (<0.1%).
Since lecithin is a hydrophilic substance and can adsorb large quantities of moisture
(Elworthy, 1961), the presence of lecithin increases the moisture sorption capacity of oil.
0
2
4
6
8
10
12
14
16
0 0.1 0.2 0.3 0.4 0.5 0.6 0.7 0.8 0.9
Water Activity (aw)
Moi
stur
e co
nten
t (%
d.b
.)
sucrose-adsorptioncocoa powdersucrose - desorptioncocoa powder - desorption
Figure 3–7: Moisture sorption isotherm of sucrose and cocoa powder at 19oC
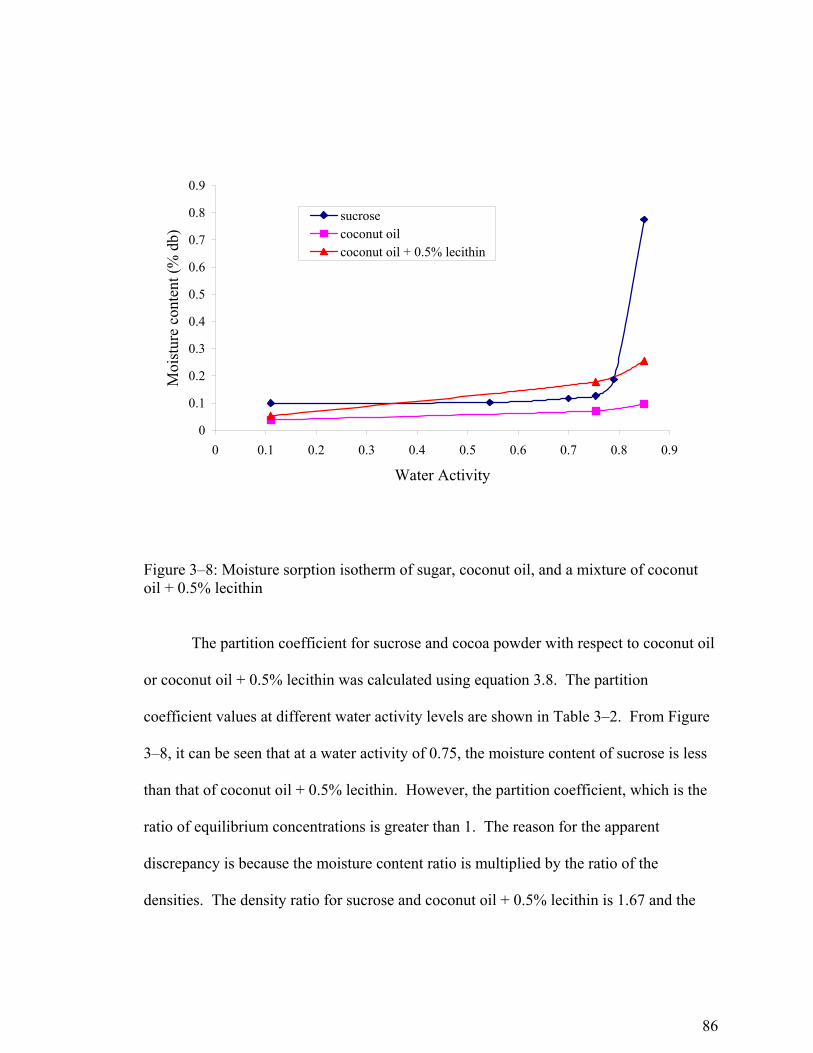
86
The partition coefficient for sucrose and cocoa powder with respect to coconut oil
or coconut oil + 0.5% lecithin was calculated using equation 3.8. The partition
coefficient values at different water activity levels are shown in Table 3–2. From Figure
3–8, it can be seen that at a water activity of 0.75, the moisture content of sucrose is less
than that of coconut oil + 0.5% lecithin. However, the partition coefficient, which is the
ratio of equilibrium concentrations is greater than 1. The reason for the apparent
discrepancy is because the moisture content ratio is multiplied by the ratio of the
densities. The density ratio for sucrose and coconut oil + 0.5% lecithin is 1.67 and the
0
0.1
0.2
0.3
0.4
0.5
0.6
0.7
0.8
0.9
0 0.1 0.2 0.3 0.4 0.5 0.6 0.7 0.8 0.9
Water Activity
Moi
stur
e co
nten
t (%
db)
sucrosecoconut oilcoconut oil + 0.5% lecithin
Figure 3–8: Moisture sorption isotherm of sugar, coconut oil, and a mixture of coconut oil + 0.5% lecithin

87
equilibrium moisture content ratio at an aw of 0.75 is 0.63, the product of these two
numbers gave a K value of 1.06.
The partition coefficient for cocoa powder is much higher than sucrose at any
given water activity. Thus there will be a larger change in the diffusivity values of a
coating when cocoa powder is added. The partition coefficient is highest for cocoa
powder at a water activity level of 0.75, and for sucrose at a water activity of 0.85. Thus
for getting a large change in the diffusivity values, the diffusion of coatings containing
sucrose were measured at a water activity of 0.85 and the coatings containing cocoa
powder were measured at 0.75.
3.5.2 Diffusion Coefficients
The diffusivity of moisture through coconut oil at 18.5oC was 3.96 x 10⁻¹¹ m2s-1
and that of coconut oil + 0.5% lecithin is 3.4 x 10⁻¹¹ m2s-1. From these diffusion
coefficients and the partition coefficient values one can calculate the diffusivity of
coatings containing sucrose or cocoa powder using equation 3.10. The partition
coefficient values for both sucrose and cocoa powder vary with water activity. Thus a
Table 3–2: Partition coefficient of sucrose and cocoa powder with respect to oil or oil + 0.5% lecithin at different water activities
Coconut oil Coconut oil + 0.5% lecithin Water Activity Sucrose Cocoa Powder Sucrose Cocoa Powder
0.11 3.87 135.68 2.83 99.280.75 2.68 202.2 1.06 80.280.85 11.98 189.3 4.45 70.26

88
constant partition coefficient cannot be assumed for a coating system containing sucrose
or cocoa powder. However, for simplicity of calculations, an average value of the
partition coefficients were assumed and substituted in equation 3.10. The D’ value in
equation 3.10 was calculated at both the extremes using equations 3.4 and 3.5.
3.5.2.1 Diffusion of Moisture through Coatings Containing Cocoa Powder
The weight loss data for the coatings made with cocoa powder are shown in
Figure 3–9, Figure 3–10, and Figure 3–11. The diffusion coefficient predicted by
equation 3.10 is compared to experimental data in Figures 3–12 and 3–13. From these
figures it can be seen that the greatest change in diffusivity occurs on addition of the first
10% of volume of cocoa powder. Since the partition coefficient K is large in this case, the
addition of cocoa powder has a large effect on the unsteady state diffusivity through it
ability to adsorb moisture. On the other hand, the diffusion coefficient of moisture
through the dispersed phase does not have a great effect on overall moisture transport
(compare the lines for equation 3.4 with that of equation 3.5 in figures 3.4 and 3.5).
For the coatings containing cocoa powder (Figure 3–12), the experimental values
were closer to the values obtained by using equation 3.5 for D’ in equation 3.10. This
suggests that diffusion of moisture occurred through the cocoa particles. When lecithin
was added to the coatings, the experimental diffusivity values fell between the values
predicted by substituting either equation 3.4 or 3.5 into equation 3.10 (Figure 3–13). This
is likely due to a decrease in K resulting from the greater affinity of the oil phase for
water in the presence of lecithin.

89
0
0.02
0.04
0.06
0.08
0.1
0.12
0 20 40 60 80 100 120 140 160
Time (h)
Wei
ght l
oss (
g)
20%cp (0.723)20%cp (0.750)20% cp + 0.5% l (0.770)20% cp + 0.5% l (0.952)
Figure 3–9: Weight loss data for coatings containing 20% cocoa powder. The numbers in brackets are the thickness of the coatings in mm. (cp = cocoa powder, l = lecithin)

90
0
0.01
0.02
0.03
0.04
0.05
0.06
0.07
0 20 40 60 80 100 120
Time (h)
Wei
ght l
oss (
g)
30%cp (0.763)30%cp (0.968)30% cp + 0.5 l (0.874)30% cp + 0.5%l (0.785)
Figure 3–10: Weight loss data for coatings containing 30% cocoa powder. The numbers in brackets are the thickness of the coatings in mm. (cp = cocoa powder, l = lecithin)

91
0
0.05
0.1
0.15
0.2
0.25
0.3
0 20 40 60 80 100 120 140 160 180
Time (h)
Wei
ght l
oss (
g
40% cp (0.775)40% cp (1.022)40% cp + l (1.005)40% cp + l (0.842)40% cp + l (1.063)
Figure 3–11: Weight loss data for coatings containing 40% cocoa powder. The numbers in brackets are the thickness of the coatings in mm. (cp = cocoa powder, l = lecithin)
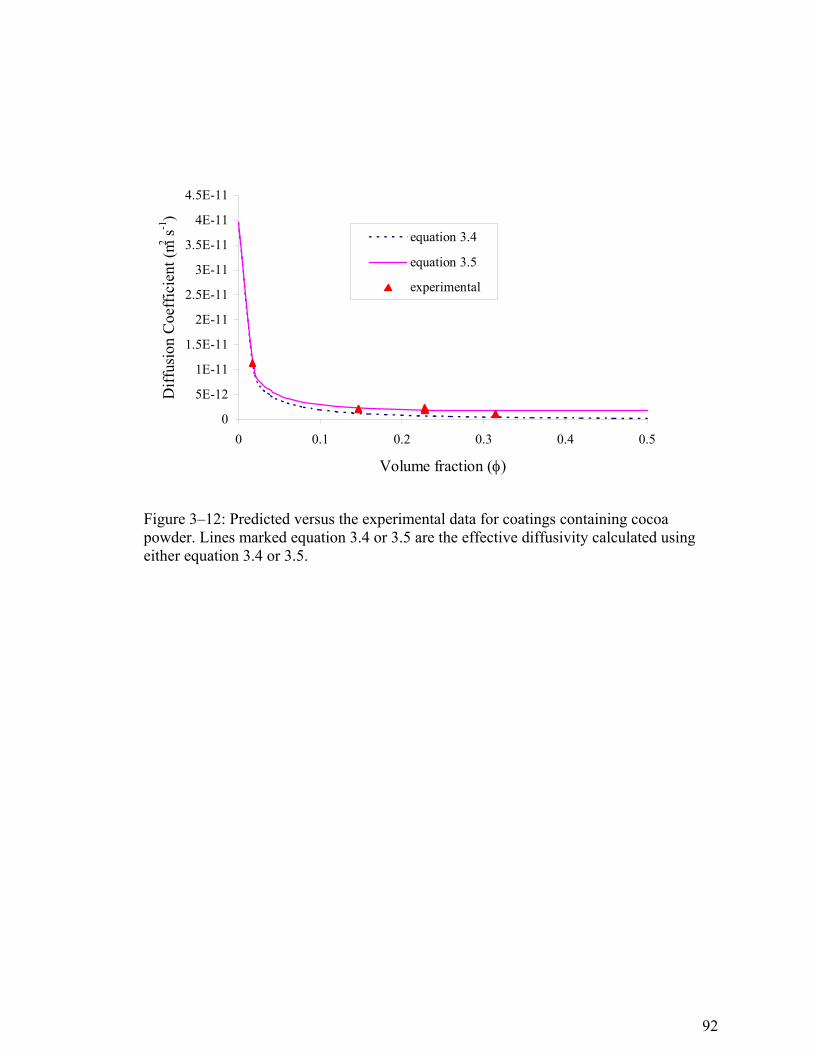
92
0
5E-12
1E-11
1.5E-11
2E-11
2.5E-11
3E-11
3.5E-11
4E-11
4.5E-11
0 0.1 0.2 0.3 0.4 0.5
Volume fraction (φ)
Diff
usio
n C
oeff
icie
nt (m
2 s-1)
equation 3.4
equation 3.5
experimental
Figure 3–12: Predicted versus the experimental data for coatings containing cocoa powder. Lines marked equation 3.4 or 3.5 are the effective diffusivity calculated using either equation 3.4 or 3.5.

93
3.5.2.2 Diffusion of Moisture through Coatings Containing Sucrose
The weight loss data for sucrose are given in Figures 3–14 and 3–15. The
partition coefficient, K, in this case is much lower than for cocoa powder, so there is
much less change to the unsteady-state diffusivity with the addition of sugar.
The moisture sorption isotherm for sucrose shows that the moisture adsorption
rate increases sharply for water activities above 0.8. Therefore, the moisture diffusivity
through coatings containing sucrose was studied at two different water activities 75% and
85%. The diffusivity data for coating containing sucrose and coconut oil, when relative
humidity is 75%, show that the experimental diffusivity follows the values predicted by
0
5E-12
1E-11
1.5E-11
2E-11
2.5E-11
3E-11
3.5E-11
4E-11
0 0.1 0.2 0.3 0.4 0.5
Volume fraction (φ)
Diff
usiv
ity (m
2 s-1)
equation 3.4equation 3.5experimental
Figure 3–13: Predicted versus the experimental data for coatings containing cocoa powder plus lecithin. Lines marked equation 3.4 or 3.5 are the effective diffusivity calculated using either equation 3.4 or 3.5.

94
equation 3.4 (Figure 3–16). This suggests that the diffusion through the sucrose particles
is much lower than that through coconut oil. This is expected because the sucrose
particles are crystalline in nature and the diffusion through the crystals is much slower
than through the semi-solid coconut oil.
0
0.005
0.01
0.015
0.02
0.025
0.03
0 20 40 60 80 100 120 140
Time (h)
Wei
ght l
oss (
g)
30% sucrose (1.803)30% sucrose (2.047)40% sucrose (1.910)40% sucrose (1.743)
Figure 3–14: Weight loss of coatings containing sucrose. The numbers in brackets denote the thickness in mm

95
0
0.05
0.1
0.15
0.2
0.25
0.3
0.35
0 50 100 150 200
Time (h)
Wei
ght l
oss (
g)
30% sucrose + lecithin (2.092)
30% sucrose + lecithin (1.977)
40% sucrose+ lecithin (2.002)
40% sucrose + lecithin (1.932)
Figure 3–15: Weight loss of coatings containing sucrose and lecithin. The numbers in brackets denote the thickness in mm

96
When lecithin was present along with sucrose, the experimental diffusivity values
were much lower than the predicted values (Figure 3–17). The diffusion data with the
coatings containing lecithin suggests that there is an increase in the partition coefficient K
in the presence of lecithin. To test the above hypothesis, an isotherm for the coating
containing 30% sugar in coconut oil + 0.5% lecithin was also determined (Figure 3–18).
The predicted equilibrium moisture content data was obtained by using the following
relation:
cocoss mymym += ( 14 )
0
1E-11
2E-11
3E-11
4E-11
5E-11
6E-11
0 0.05 0.1 0.15 0.2 0.25 0.3 0.35
Volume fraction (φ)
Diff
usio
n ce
offic
ient
(m2 s-1
)
equation 3.4equation 3.5experimental data
Figure 3–16: Predicted versus the experimental data for coatings containing sucrose. Lines marked equation 3.4 or 3.5 are the effective diffusivity calculated using either equation 3.4 or 3.5.

97
where m is the equilibrium moisture content of the coating containing 30% sugar in
coconut oil + 0.5% lecithin, ys is the weight fraction of sugar (here 0.3), yco is the weight
fraction of coconut oil + 0.5% lecithin (here 0.7), ms is the equilibrium moisture content
of sugar, and mco is the equilibrium moisture content of coconut oil + 0.5% lecithin. It
can be seen in Figure 3–18 that the actual equilibrium moisture content for a coating
containing 30% sugar in coconut oil + 0.5% lecithin is always higher than the predicted
value. Garbolino (2002) suggested that there is a multilayer of moisture present at the
interface of sugar and lecithin, and the data obtained in this study is consistent with that
model. In the coating, the polar head groups of the emulsifier are directed towards the
sucrose crystals and the hydrocarbon chains are directed towards the oil phase (Johansson
and Bergenstahl, 1992). Lecithin tends to absorb much more moisture than sucrose at
water activity levels less than 0.85 (Elworthy, 1961; Iglesias and Chirife, 1982) and when
the hydrophilic end is aligned with sucrose, the tendency to retain moisture at the
interface increases. The diffusion coefficient of a coating containing 30% sucrose in
coconut oil + 0.5% lecithin was recalculated by estimating the new K from the sorption
isotherm. The new predicted value of diffusion coefficient was 7.36 x 10⁻¹² m2 s-1. This
value is closer to the actual value of average diffusivity of 5.8 x 10⁻¹² m2 s-1 obtained
from experiments.

98
0
1E-11
2E-11
3E-11
4E-11
5E-11
6E-11
7E-11
0 0.05 0.1 0.15 0.2 0.25 0.3 0.35
Volume fraction (φ)
Diff
usio
n co
effic
ient
(m2 s-1
)
equation 3.4equation 3.5experimental
Figure 3–17: Predicted versus the experimental data for coatings containing sucrose plus lecithin. Lines marked equation 3.4 or 3.5 are the effective diffusivity calculated using either equation 3.4 or 3.5.

99
When the relative humidity inside the cup was 85%, sucrose migrated to the
surface and crystallized on the top of the coatings containing lecithin. The volume
fraction of sucrose used in this study was less than 0.3, which suggests that the fraction of
the dispersed phase is below the percolation limit. However, when observed carefully, it
was seen that the crystallization of sugar at the surface was seen only at two to three spots
of the whole coating surface. There may have been some connectivity of the dispersed
phase in these particular regions. Due to the presence of the moisture layer at the
interface of the emulsifier and sugar particles there might have been accretion of the
sugar particles. The moisture layer would dissolve some of the sugar, which can then
0
0.2
0.4
0.6
0.8
1
1.2
1.4
0 0.1 0.2 0.3 0.4 0.5 0.6 0.7 0.8 0.9
Water Activity (aw)
% m
oist
ure
(db)
sugar
oil + 0.5% lecithin
(oil + 0.5% lecithin) + 30% sugar
predicted (oil + 0.5% lecithin+ 30% sugar)
Figure 3–18: Moisture adsorption isotherm for sugar, coconut oil + 0.5% lecithin, and 30% sugar in coconut oil + 0.5% lecithin

100
percolate to the surface of the coating through these connected regions, finally
crystallizing at the surface as it dries out.
When coatings containing sucrose and lecithin were kept for more than a week,
cracks appeared in the coatings, while the coatings containing just the sucrose particles
were still intact. Comparing the data for coatings containing lecithin versus the ones
without, it can be concluded that there are structural changes occurring in the coating
containing lecithin. Robinson (1971) in his studies on ethanol migration through
chocolates had found similar results with lecithin; the swelling of chocolate in ethanol
increases with increase in the lecithin content.
3.5.3 Water Vapor Permeability
The WVP, as a function of volume fraction, for the coatings containing sugar and
cocoa powder is shown in Figure 3–19. The WVP decreased with an increase in the
volume fraction of sucrose while it increased with increase in the cocoa powder content.
In the case of sucrose, diffusion occurs along the surface of the particles, which increased
the tortuosity of the diffusion path and slowed down the diffusion rate. While, in the case
of cocoa powder, the moisture diffused through the cocoa particles. Therefore, the WVP
increased with increase in cocoa powder content.

101
The WVP, as function of volume fraction, for the coatings with sugar & lecithin
and cocoa powder & lecithin is shown in Figure 3–20. It can be seen that the WVP
increases with the addition of particles in both the cases. It has been noted above that in
the presence of lecithin structural changes occur that increased the diffusion rate.
Therefore, in the presence of lecithin the WVP increased. A detailed study on the effect
of various ingredients and storage conditions on the WVP of chocolate-flavored coatings
can be found in the second part of this study.
0
2
4
6
8
10
12
14
0 0.05 0.1 0.15 0.2 0.25 0.3 0.35
Volume fraction (φ)
Perm
eabi
lity
(g m
il m-2
day
-1 m
mH
g-1)
cpsucrose
Figure 3–19: Effect of ingredients and volume fraction on the water vapor permeability of coatings containing sucrose or cocoa powder

102
3.6 Conclusions
The observations for sucrose and cocoa powder confirm the Weisz (1967)
approach for modeling moisture diffusion through chocolate-flavored coatings. From the
results obtained, it can be seen that the unsteady-state or transient diffusivity decreased
with an increase in the partition coefficient.
There are structural changes associated with the diffusion of moisture into the
coating. These structural changes can occur due to the swelling of the cocoa particles or
dissolving of the sucrose particles in the moisture and subsequent migration to the
0
10
20
30
40
50
60
70
80
90
0 0.05 0.1 0.15 0.2 0.25 0.3 0.35
Volume fraction (φ)
Perm
eabi
lity
(g m
il m-2
day
-1 m
mH
g-1)
cp + lsucrose + l
Figure 3–20: Effect of ingredients and volume fraction on the water vapor permeability of coatings containing sucrose and lecithin or cocoa powder and lecithin.

103
surface. Robinson (1971) and Zurcher (1971) had found that the presence of lecithin
increased the swelling of chocolates. This study confirmed their findings that the
structural changes during migration are aided by the presence of lecithin, which probably
tends to increase localized moisture concentrations at the interface of the hydrophilic
particles.
The diffusion coefficient of moisture through the dispersed phase can be
estimated from equation 3. From the estimated diffusion coefficient, the mechanism of
moisture migration through the dispersed phase can be understood. In the case of
chocolate-flavored coatings, the mechanism of diffusion through the two dispersed
phases sugar and cocoa powder is completely different. The diffusion of moisture
through cocoa powder, which is porous in nature, occurs through the particles. The rate
of diffusion of moisture through the cocoa powder particles is much faster than that
through coconut oil. For sugar, which has a crystalline structure, the moisture cannot
diffuse through the sugar crystal and, therefore moisture diffuses along the surface of the
sugar particles.
The presence of lecithin has a great effect on moisture migration through
chocolate-flavored coatings. Garbolino (2002) suggested that there is a layer of water at
the interface of the sugar and emulsifier. The model proposed by Garbolino (2002) was
validated from the moisture isotherm data of a coating containing 30% sugar in coconut
oil + 0.5% lecithin. This layer moisture can dissolve the sugar and the sugar can percolate
to the surface of the coating to cause sugar bloom.

104
The mechanism of diffusion through the disperse phase of the chocolate-flavored
coating suggests that the presence of sugar will decrease the WVP. On the other hand, the
presence of cocoa powder particles and lecithin will increase the WVP. The WVP data
obtained in this study confirmed the above predictions.
3.7 References
Aguilera, J. M. and D. W. Stanley (1999). Microstructure and mass transfer: Solid liquid
extraction. Microstructural Principles of Food Processing and Engineering.
Gaithersburg, MD, Aspen Publishers: 325 - 372.
Bell, L. N. and T. P. Labuza (2000). Moisture Sorption: Practical Aspects of Isotherm
Measurement and Use. St. Paul, MN, American Association of Cereal Chemists.
Biquet, B. and T. P. Labuza (1988). Evaluation of the moisture permeability
characteristics of chocolate films as edible moisture barrier. J. Food Sci. 53(4):
989 - 998.
Cussler, E. L. (1997). Diffusion Mass Transfer in Fluid Systems. New York, NY,
Cambridge University Press.
Duda, J. L. (1999). Theoretical aspects of molecular mobility. Water Management in the
Design and Distribution of Quality Foods. Y. H. Roos, R. B. Leslie and P. J.
Lillford. Lancaster, PA, Technomic Publishing Company, Inc.: 237-253.
Elworthy, P. H. (1961). The adsorption of water vapour by lecithin and lysolecithin, and
the hydration of lysolecithin micelles. J.Chem. Soc.: 5385 - 5389.

105
Garbolino, C. (2002). The influence of surfactants and moisture on the colloidal and
rheological properties of model chocolate dispersions. Ph.D. thesis. Department
of Food Science. Pennsylvania State Univerisity, University Park, PA
Ghosh, V., Ziegler, G. R. and Anantheswaran, R. C. (2002). Fat, moisture, and ethanol
migration through chocolates and confectionery Coatings. Crit. Rev. Food Sci.
Nutr. 42(6): 583 - 626.
Iglesias, H. A. and J. Chirife (1982). Handbook of Food Isotherms: Water Sorption
Parameters for Food and Food Components. New York, NY, Academic Press.
Johansson, D. and B. Bergenstahl (1992). The influence of food emulsifiers on fat and
sugar dispersions in oils .1. Adsorption, sedimentation. J. Am. Oil Chem. Soc.
69(8): 705-717.
Labuza, T. P. and C. R. Hyman (1998). Moisture migration and control in multi-domain
foods. Trends Food Sci. Technol. 9: 47 - 55.
Morillon, V., F. Debeaufort, M. Capelle, G. Blond and A. Voilley (2000). Influence of
the physical state of water on the barrier properties of hydrophilic and
hydrophobic films. J. Agric. Food Chem. 48: 11-16.
Robinson, L. (1971). Veranderungen in krustenlosen pralinen mit alkoholhaltiger
flussiger Fullung I. Fette Seifen Anstrmittel 73(8): 521 - 526.
Saravacos, G. D. and Z. B. Maroulis (2001). Transport Properties of Foods. New York,
NY, Marcel Dekker.
Smith, D. M. and J. F. Keller (1985). Nonlinear sorption effects on the determination of
diffusion-sorption parameters. Ind. Eng. Chem. Fundamentals 24: 497 - 499.

106
Troutman, M. Y. (1999). Moisture migration and textural changes during manufacture of
soft-panned confections. M. S. thesis, The Pennsylvania State University,
University Park, PA.
van der Zanden, A. J. J. (2000). Heat and mass transfer in heterogeneous media where a
phase transition takes place. Chem. Eng. Sci. 55: 6235 - 6241.
Vieth, W. R. (1991). Diffusion In And Through Polymers. New York, Hanser Publishers.
Weisz, P. B. (1967). Sorption - diffusion in heterogenous systems. Part 1. General
sorption behavior and criteria. Trans. Faraday Soc. 63: 1801 - 1807.
Weisz, P. B. and J. S. Hicks (1967). Sorption-diffusion in heterogeneous systems. Part 2
- Quantitative solutions for uptake rates. Trans. Faraday Soc. 63: 1807 - 1814.
Weisz, P. B. and H. Zollinger (1967). Sorption-diffusion in heterogeneous systems. Part 3
- Experimental models of dye sorption. Trans. Faraday Soc. 63: 1815-1823.
Weisz, P. B. and H. Zollinger (1968). Sorption-diffusion in heterogeneous systems. Part 4
- Dyeing rates in organic fibers. Trans. Faraday Soc. 64: 1693-1700.

Chapter 4
EFFECT OF INGREDIENTS ON MOISTURE MIGRATION THROUGH CHOCOLATE-FLAVORED COATINGS
4.1 Abstract
The effect of sucrose, lactose, dextrose, cocoa powder, emulsifier, fat type, and
storage environment on the water vapor permeability (WVP) of a chocolate-flavored
coating was studied. The WVP of fat films decreased with increase in the solid fat
content (SFC). Cocoa powder and lecithin increased the WVP while sugar decreased the
WVP through the coatings. There was an increase in the WVP with an increase in the
absolute value of the relative humidity across coating containing about 12.5% cocoa
powder, 33% sucrose, 0.5% lecithin in coconut oil. This increase was due to swelling of
the cocoa powder particles that changed the structure of the coatings. Replacing sucrose
with dextrose increased the WVP of the coatings. In addition to permeability data, optical
microscope images of cocoa powder and SEM images of the structure of two different
coatings were obtained.
4.2 Introduction
Moisture migration is a common problem in multi-domain foods that have regions
of differing water activities (Labuza and Hyman, 1998). Moisture migrates from the
domain with higher water activity to the domain with lower water activity or into the

108
environment until there is thermodynamic equilibrium. Moisture migration can be
prevented either by matching the water activity of the different domains of the food or by
using an edible moisture barrier between the two domains. The former solution is not
always practical as it is not always possible to match water activities of each domain. An
edible film on the other hand is a more practical alternative to prevent moisture migration
in multi-domain foods (Biquet and Labuza, 1988).
The properties and applications of various edible films can be found in articles by
Kester and Fennema (1986), Koelsch (1994), Guilbert and Biquet (1995), Krochta and
Mulder-Johnston (1997), and Debeaufort et al. (1998). Lipid-based edible films are most
resistant to moisture migration due to their hydrophobic nature (Kester and Fennema,
1986; Callegarin et al., 1997; Morillon et al., 2002). Some of the commonly used lipid-
based edible films or coatings are chocolate or chocolate-flavored confectionary coatings
(Morillon et al., 2000; Ghosh et al., 2002).
Chocolate-flavored coatings consist of sucrose, cocoa powder, emulsifier, and
milk solids (in the case of milk chocolate) that are embedded in a continuous lipid phase.
The continuous fat phase consists of a fat crystal network. The pores between these fat
crystals do not really have a spherical shape and are either closed or completely (or
partially) filled with the liquid fraction of cocoa butter (Loisel et al., 1997). Water
molecules diffuse mainly through the oil that is present between the fat crystals. When
the moisture comes in contact with a hydrophilic particle, e.g. sucrose or cocoa powder, it
will first get adsorbed onto these particles and then diffuse through the hydrophilic
particles as well as along their surfaces. Moisture sorption behavior for each of the

109
constituent materials in the coating is different and, therefore, the moisture migration
through such coatings is complex due to their heterogeneous nature. The moisture
transfer through such coatings will be dependent on the type and the physical state of fat
used, the amount and the type of hydrophilic constituents (sugar, cocoa solids, emulsifier)
and the storage conditions (temperature and relative humidity).
The physical state (i.e., solid or liquid) of the lipid component has a strong
influence on the water vapor permeability (WVP) of the film; water is less soluble in
solid lipid than in liquid lipids (Kamper and Fennema, 1984). Landmann et al. (1960)
found a 300-fold increase in the permeability of a hydrogenated cottonseed oil when the
liquid oil content was increased from 0 to 40%. Other researchers (Kamper and
Fennema, 1984; Talbot, 1994) have shown that an increase in solid fat content from 0 to
30% decreases the WVP of the films. Such behavior is observed because the structure of
the solid fat is denser than liquid lipids and therefore solid lipids are more resistant to
moisture diffusion. Martin-Polo et al. (1992) observed that for a mixture of paraffin wax
and oil blends the WVP decreased with an increase in SFC. However, they also found
that for mixture of pure alkanes (C16H34 and C28H58) the WVP increased at solid fat
contents higher than 50% due to a very porous structure at high SFC.
The water activity or relative humidity gradient is the driving force for moisture
transfer though an edible film. In an ideal situation increasing the relative humidity
gradient should increase the water vapor transfer through a coating, but the permeability
should remain constant. However, for lipid and chocolate films it has been found that the
WVP depends on both the relative humidity (RH) gradients and the absolute humidity
110
values. In other words, for the same relative humidity gradient, the WVP is higher when
the vapor pressure values are higher. Biquet and Labuza (1988) found that the WVP
increased from 4.9 g mil m-2 day-1 mmHg-1 to 11.0 g mil m-2 day-1 mmHg-1 when the
relative humidity difference was changed from 0-33% to 54.4 – 80.4%. Similar results
were reported by Kamper and Fennema (1984) and Fennema et al. (1994). Kamper and
Fennema (1984) found that the permeability increased from 0.69 g mil m-2 day-1 mmHg-1
to 10.1 g mil m-2 day-1 mmHg-1 when the relative humidity range was changed from 65 –
33% to 97 – 65%. The increase in the WVP at higher relative humidity may be due to
structural changes resulting from the sorption of moisture by the hydrophilic support of
their film. Landmann et al. (1960) found a large increase in the WVP of milk chocolate
when the humidity gradient was varied from 22 – 75% to 0 to 100%. This behavior may
be due to presence of hydrophilic particles in the milk chocolate which behave differently
at different humidity regions.
Most of the papers dealing with chocolate-flavored coatings have studied the
effect of storage conditions on the water vapor permeability. Very little work has been
done to study the effect of hydrophilic ingredients, such as sucrose, cocoa powder, and
emulsifiers, on the water vapor permeability of lipid-based coatings. The objective of
this study was to understand the effect of sucrose, sugar type, cocoa powder, emulsifier,
fat type, and storage environment on the water vapor permeability of a chocolate-flavored
coating.
111
4.3 Materials and Methods
4.3.1 Ingredients
The ingredients needed to perform this study were different types of sugars, cocoa
powders, emulsifiers, and barrier fats. These details of these ingredients are discussed
below.
4.3.1.1 Sugars
The sugars used in this study were sucrose, lactose, and dextrose. Crystalline
sucrose (pure cane extra fine granulated sugar with purity ~ 100%) was obtained from
Florida Crystals (Palm Beach, FL). The particle size of granulated sucrose was larger
than 100 µm and needed to be ground into a particle size range that is typically present in
chocolate-flavored coatings (average size 24-28 µm). The sucrose crystals were
therefore ground using a jet mill (Model 0101-C6 (S), Jet-O-Mizer, Fluid Enery Aljet,
Plumsteadville, PA) to obtain the desired particle size.
When operating the jet mill, the inlet air pressure was 120 psi, the pusher nozzle
was set at 100 psi, the first grinder nozzle was set at 100 psi, and the second grinder
nozzle was set at 90 psi. The flow rate dial was set at 25. An air compressor (Model #
C1071080VMSA, Campbell Hausfeld, Harrison, OH) supplied the high-pressure air at
the inlet of the jet mill.
To avoid clumping, the sucrose was dried immediately after grinding in a vacuum
oven (National Appliance Co., Portland, OR), maintained at 60oC and a vacuum of 20”

112
Hg, for 10-12 hours. The dried sucrose was transferred into airtight containers, and was
stored in a desiccator cabinet at 18oC.
Granular dextrose (SD99, Lot # NAD4508) was obtained from Cargill, Inc.
(Eddyville, IA). The dextrose granules were ground using a jet mill (Model 0101-C6 (S),
Jet-O-Mizer, Fluid Enery Aljet, Plumsteadville, PA) using the same operating conditions
as that for sugar. The dextrose powder was dried in a vacuum oven (National Appliance
Co., Portland, OR), maintained at 60oC and a vacuum of 20” Hg, for 10-12 hours and was
used immediately after drying. Crystalline lactose (particle size~66 µm, Edible Grade,
Lot # 28452, plant #19-34) was dried in a vacuum oven (National Appliance Co.,
Portland, OR), maintained at 60oC and a vacuum of 20” Hg, for 10-12 hours before use.
4.3.1.2 Cocoa Powder
To avoid any confounding of the results due to the presence of the fat in the cocoa
powder, defatted cocoa powder was used in this study. A separate experiment was done
to study the effect of two different commercial cocoa powders.
Defatted cocoa powder in pellet form was obtained from Comet Specialty
Ingredients Co. (Freeport, TX). The cocoa powder pellets were ground using a jet mill
(Model 0101-C6 (S), Jet-O-Mizer, Fluid Enery Aljet, Plumsteadville, PA) to obtain cocoa
powder particles with particle size less than 20 µm. The operating conditions were the
same as that for sugar, except for the feed rate, which was set at 35. The cocoa powder
was dried in a vacuum oven (National Appliance Co., Portland, OR), maintained at 60oC

113
and a vacuum of 20” Hg, for 10-12 hours. The dried cocoa powder was transferred into
airtight containers, and was stored in a desiccator cabinet at 18oC.
Natural and alkalized cocoa powder (particle size < 20 µm, 10-12% fat), were
obtained from Hershey Foods (Hershey, PA). The cocoa powder was dried in a vacuum
oven (National Appliance Co., Portland, OR), maintained at 60oC and a vacuum of 20”
Hg, for 10-12 hours before use.
4.3.1.3 Fats
Coconut oil was obtained from Aarhus, Inc (Lot # 209, AI# 2578-1) and ACH
Humko (Victory 76, Lot# 49815, Formula # F00880). Five other moisture barrier fats
were obtained from Loders Croklaan, Aarhus, and Karlshamns (Table 4–1).
For determining the solid fat content, the fats were subjected to thermal
treatments similar to the thermal treatment received during coating preparation. The fats
were melted overnight in an oven maintained at 70oC. The melted oils were transferred
into NMR tubes and the tubes were kept in a water bath (Model 1157, VWR Scientific,
Philadelphia, PA) maintained at 20oC for 24 hours. The solid fat contents (SFC) of the
fats were determined by the direct method (Waddington 1995) using a Minispec mq20
NMR (Bruker Analytik, GmBH, Germany). The solid fat content of the fats used in this
study are shown in Table 4–1.

114
Fat Type Solid Fat Content (%)
ISAO 43-82 (Aarhus Olie, Denmark) 25.2 Coconut oil (Aarhus, Inc, Newark, NJ) 43.0 Coconut oil (Lot# 49815, Formula # F00880, Victory 76, ACH Humko, TN)
35.1
Akoice C (Karlshamns, Sweden) 44.1 DP 1192 (Loders Croklaan, IL) 55.3 DP 1193(Loders Croklaan, IL) 67.5 DP 1194 (Loders Croklaan, IL) 75.9
In the WVP experiments, the average temperature in the chamber varied during
different experiment. The SFC of the fats were also determined at the temperature of
measurement.
4.3.1.4 Emulsifiers
Granular lecithin (purity ~ 97%) was obtained from Acros Organics (Fisher
Scientific, Pittsburgh, PA). Lecithin is made of a mixture of phospholipids with
phosphatidyl-choline, phosphatidyl-ethanolamine and phosphatidyl-inositol as its main
components. The lecithin had moisture content less than 0.1%.
Another emulsifier Citrem (Batch # 11225, Material # 17636), obtained from
Danisco (Denmark) was used in this study. “Citrem stands for a group of citric acid
esters of the mono- and diglycerides of edible fatty acids containing 1-2 molecules of
edible fatty acids and 1-2 molecules of citric acid, wherein the citric acid as a tribasic
acid may also be esterified with several glycerides, and as a hydroxy acid may also be
esterified with fatty acids (Figure 4–1). Equally usual are names such as citroglyceride,
Table 4–1: Solid Fat Contents of the Moisture Barrier Fats at 20oC

115
citric acid glyceride ester, monoglyceride citrate, etc. The name Citrem derives from the
term 'citric acid ester of mono- and diglycerides” (Matissek, 2002).
4.3.2 Experimental Design
From theoretical consideration, it was hypothesized that the relative proportions
of each ingredient will have an effect on the permeability of the coatings and thus the
effect of each ingredient can be best understood by using a mixture experiment (Cornell,
2002). Hence, to understand the effect of each ingredient and their proportions in the
coating a mixture experimental design was made using the following constraints:
Sucrose ≤ 0.4, ----- (i)
Cocoa powder (defatted) ≤ 0.2 -----(ii)
0.003 ≤ Lecithin ≤ 0.01 -----(iii)
Figure 4–1: Structure of Citrem (Matissek, 2002)
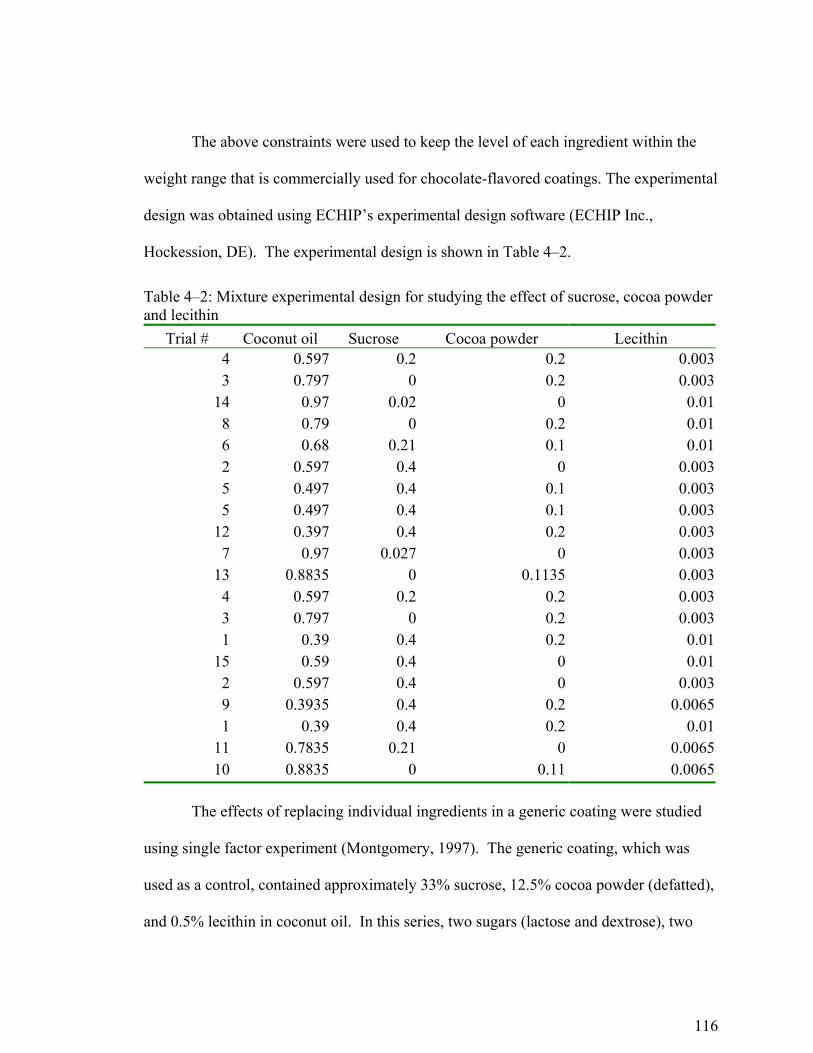
116
The above constraints were used to keep the level of each ingredient within the
weight range that is commercially used for chocolate-flavored coatings. The experimental
design was obtained using ECHIP’s experimental design software (ECHIP Inc.,
Hockession, DE). The experimental design is shown in Table 4–2.
The effects of replacing individual ingredients in a generic coating were studied
using single factor experiment (Montgomery, 1997). The generic coating, which was
used as a control, contained approximately 33% sucrose, 12.5% cocoa powder (defatted),
and 0.5% lecithin in coconut oil. In this series, two sugars (lactose and dextrose), two
Table 4–2: Mixture experimental design for studying the effect of sucrose, cocoa powder and lecithin
Trial # Coconut oil Sucrose Cocoa powder Lecithin 4 0.597 0.2 0.2 0.0033 0.797 0 0.2 0.003
14 0.97 0.02 0 0.018 0.79 0 0.2 0.016 0.68 0.21 0.1 0.012 0.597 0.4 0 0.0035 0.497 0.4 0.1 0.0035 0.497 0.4 0.1 0.003
12 0.397 0.4 0.2 0.0037 0.97 0.027 0 0.003
13 0.8835 0 0.1135 0.0034 0.597 0.2 0.2 0.0033 0.797 0 0.2 0.0031 0.39 0.4 0.2 0.01
15 0.59 0.4 0 0.012 0.597 0.4 0 0.0039 0.3935 0.4 0.2 0.00651 0.39 0.4 0.2 0.01
11 0.7835 0.21 0 0.006510 0.8835 0 0.11 0.0065
117
different types of commercial cocoa powder (natural and alkalized), six different
moisture barrier fats, and one emulsifier (Citrem) were studied.
The mixture experiments were performed using the coconut oil from Aarhus, Inc.,
while the other experiments were performed using the coconut oil from ACH Humko.
The mixture experiments were done at 20oC while the experiments on the effect of
ingredients and solid fat content were carried out at 18.5oC.
4.3.3 Measurement of Moisture Content
The moisture analysis of sucrose and cocoa powder was performed according to
the method suggested by Troutman (1999). About 1g of the sample (i.e., sucrose or cocoa
powder) was placed in a Kimble Kimax culture tube with approximately 10 g of a 1:1
formamide (Fisher Scientific, Pittsburgh, PA): methanol (Karl Fischer grade, anhydrous,
VWR Scientific, Pittsburgh, PA) solvent. The weights of the sample and the solvent
were recorded to obtain the dilution factor. A layer of Teflon tape was put around the
threads of the culture bottle. The culture bottles were closed using the cap of the tube.
Application of Teflon tape ensures airtight seal in the culture bottles. The culture
bottles were stored in an oven at 50oC for 12 hours. Simultaneously, two culture tube
containing the solvent and sealed in the same manner as the samples were kept in the
oven at 50oC for 12 hours.
The moisture content for sugar and cocoa powder was measured using a Karl
Fischer titrator (Model DL 31, Mettler-Toledo GmBH, Switzerland). Duplicate
measurements were done for each sample. Approximately 40 ml of methanol solvent

118
(Karl Fischer grade, anhydrous, VWR Scientific, Pittsburgh, PA) was added to the titrator
vessel and neutralized using a pyridine-free Karl Fischer reagent (Hydranal-composite 5,
Riedel-de Haën, GmBH. Seelze, Germany). The pyridine-free reagent contained
imidazole, sulfer dioxide and iodine. The modified Karl Fischer reaction, due to change
in the components of the Karl Fischer reagent, is given by equation 4.1
I)RNH(2RSO)RNH(OHIRSO)RNH(RSO)RNH(RNROH
4223
3
+→++→+
( 4.1 )
Triplicate measurement of the reagent concentration was made using a water
standard (Hydranal-water standard 10.0, Riedel-de Haën, GmBH. Seelze, Germany) to
determine the concentration of the reagent. For moisture content determination of cocoa
powder and sugar, about 1 ml of the solvent was drawn from the culture tube and added
to the titration vessel. The weight of the sample was determined by weighing the syringe
before and after the experiment using an Ohaus Galaxy 200 balance (Ohaus Corporation,
Florham Park, NJ), with an accuracy of ±0.0001g. The amount of moisture in the sample
was determined automatically by the Karl Fischer instrument using equation 4.2.
% moisture = strength of the Karl Fischer reagent (mg water/ml reagent) x ml Karl Fischer reagent added/mg sample
( 4.2 )
The moisture content of the solvent was also determined. The moisture content of
the original sample was determined using equation 4.3.
2
11
2
1
ffx
100x
ffxmoisture% −
+= ( 4.3 )

119
where x is the moisture content of the solvent with the sample, x1 is the moisture content
of the solvent, f1 is the weight of the solvent, and f2 is the weight of the sample.
4.3.4 Moisture Sorption Isotherm
The moisture sorption isotherm for ground sugar, cocoa powder, coconut oil, and
coconut oil + 0.5% lecithin was determined at 20oC. Saturated salt solutions of lithium
chloride (LiCl), magnesium chloride (MgCl2), magnesium nitrate (Mg(NO3)2), potassium
iodide (KI), sodium chloride (NaCl), ammonium chloride (NH4Cl), and potassium
chloride (KCl) were used to obtain water activity values of 0.113 ± 0.003, 0.331 ± 0.002,
0.544 ± 0.002, 0.699 ± 0.003, 0.755 ± 0.004, 0.792 ± 0.004, and 0.851 ± 0.003,
respectively (Bell and Labuza, 2000). Duplicate measurements of equilibrium moisture
content were done at each water activity. The saturated salt solutions were put in the
bottom of Mason jars (~ 473 ml), to a depth of about 1 cm. A square support of size
approximately 3 cm x 3 cm x 6 cm (high) was made from steel wire mesh and placed in
the Mason jar. For sucrose and cocoa powder, approximately 5g of sample was put in an
aluminum weighing dish and placed on the wire mesh support. The Mason jars were
kept in a temperature-controlled chamber (Model 310, Imperial III Incubator, Labline,
Inc., Melrose Park, IL) at 20±1oC. The weight of the samples was taken every day using
an Ohaus Galaxy 200 balance (Ohaus Corporation, Florham Park, NJ), with an accuracy
of ±0.0001g, until there was no change in weight (±0.001g) for 3 days. Both cocoa
powder and sucrose reached equilibrium with 2-3 days of storage. The moisture contents
of the samples were determined using the Karl Fischer method as previously described.

120
4.3.5 Sample Preparation
For making the coating, the ingredients were mixed at the ‘blend’ setting in a
blender (Pulse Matic, Oster Corporation, Milwaukee, WI) for two minutes. The total
weight of the ingredients per batch was 250g and two batches were made. To ensure that
the fat was in the liquid phase, the blender was kept inside a chamber (Model 680A,
Labline Instruments, Inc., Melrose Park, IL) maintained at 40oC. The two batches were
mixed after blending to get the total weight of the coating to be approximately 500g.
During the mixing process, numerous air bubbles were incorporated into the coating mix.
Hence, the coating mix was kept in a vacuum oven, maintained with a vacuum of 20” Hg
and a temperature of 70oC, for 24 hours to remove the air bubbles. When the coating
samples were removed from the oven, settling of the particulate phase was observed. The
melted test samples (approximately 500g) were mixed at the lowest setting, being careful
that no air was incorporated during this process, in a mixer (Model C-100T, Hobart
Corporation, Troy, OH) at 50oC for three hours.
To prepare films for diffusion studies, parchment paper was placed on a
marble slab that had a flat surface. The purpose of the marble slab was to absorb the heat
from the coating during the solidification process. For coatings containing cocoa powder,
a stainless steel sheet (0.8 mm thick) containing four 9 cm diameter holes was placed on
top of the parchment paper (Figure 4–2). Melted coating was poured into the holes and
allowed to solidify for about 30 minutes. The temperature of the room was maintained at

121
around 16oC. After the coating had solidified, as observed visually, excess material was
removed using a hot spatula to obtain a film of about 1 mm thickness. After removing
the excess material, the whole system was kept in a refrigerator (Model TBX18SLB,
General Electric Co., Louisville, KY) for 10 minutes to solidify the film completely,
which eased the removal of the coating from the parchment paper. The test film was
removed from the mold by cutting the coating around the edges with a hot knife. The
thickness of each coating was measured at four different points using a micrometer
(Craftsman, Sears, Roebuck & Co, Chicago, IL).
The method had to be modified for fats with solid fat contents greater than 60%.
These fats were melted by keeping them overnight in a chamber maintained at 70oC. For
Figure 4–2: Picture of the mold for making the chocolate coatings (hole diameter = 9 cm)

122
preparing the coating, the fats were poured in the mold as described above, but in this
case the excess fat was removed immediately using a spatula. Immediately after
removing the excess fat, the fat coating was cut around the edges of the mold using a
knife. The mold was removed after cutting the edges and the coatings solidified within
ten to fifteen minutes. The fat coatings cracked if they were allowed to solidify within
the mold. The thickness of the coatings was measured very carefully as these coatings
were very brittle and had a tendency to crack while taking the measurement.
4.3.6 Method for Measurement of Water Vapor Permeability
The water vapor permeability (WVP) through the coatings was measured using
the ASTM E-96 method. A schematic of the test cell is shown in Figure 4–3. The
dimensions of the cup were, outer diameter 9.2 cm, inner diameter 7.65 cm, and depth 1
cm. The exposed area of the coating was 46 cm2. Calcium chloride or saturated salt
solution was put in the bottom of the cell and then the coating was carefully placed in the
Thwing Albert cups (Thwing Albert, Philadelphia, PA). The edges of the cups were
sealed using excess amount of the melted coating material. A picture of the Thwing
Albert cup with a coating sample is shown in Figure 4–4.

123
Figure 4–3: Schematic of the test cell for the ASTM E-96 method
Figure 4–4: Picture of a test cell with the coating film

124
4.3.6.1 Controlled Environment Setup
A system was setup to provide the desired temperature and relative humidity
(Figure 4–5). A chamber made using 0.635 cm thick acrylic plastic sheets with an inside
volume of 31400 cm3 (dimension 43.18 cm x 27.94 cm x 26.04 cm) was used for this
study. The chamber had an O-ring gasket and a lid made with 1.27cm thick plastic.
The chamber was maintained at a relative humidity of 73 ± 2 % using saturated
sodium chloride solution. The relative humidity over saturated NaCl at 20oC is about
75.5%, but because of some leakage due to the presence of a one cm hole in the side of
the chamber, the actual humidity inside the chamber was slightly lower. A fan (type
Figure 4–5: Picture of the setup for measuring the water vapor transmission rate of the coatings

125
U920IB, Tobishi Kosan Co. Ltd., Japan) was used to create convection inside the
chamber, which allowed the humidity inside the chamber to reach equilibrium quickly
after any disturbance. The plastic chamber was kept inside an environmental chamber
(Model 680A, Labline Instruments, Inc., Melrose Park, IL), which was maintained at
18.5oC for the mixture experiments and at 17.5oC for the single factor experiment. The
fan used for convection, generated heat and so the temperature inside the plastic box was
maintained at 20 ± 0.5oC for the mixture experiments and at 18.5 ± 0.5oC for the single
factor experiments.
The temperature and relative humidity within the chamber was monitored every
five minutes using a temperature and relative humidity probe (Model HMP35C,
Campbell Scientific, Inc., Logan, UT) and a data logger (21X Micrologger, Campbell
Scientific, Inc., Logan, UT). The temperature and relative humidity inside the chamber
during a typical experiment is shown in Figure 4–6. The spikes in the relative humidity
line show the times when the chamber was opened, for weighing the samples.

126
4.3.6.2 Experimental Setup
The Thwing Albert cups were kept in the controlled atmosphere chamber
described above. The weight of the samples was measured at regular intervals using an
analytical balance (AB105, Mettler Toledo, Switzerland) with an accuracy of 0.0001g.
The weight gain versus time was plotted to obtain the WVTR of the coating. The ASTM
(1995) suggests that at least eight points in the straight line be taken for obtaining
WVTR. During the preliminary experiments, it was found that there was no significant
difference upon taking more than four or five points in the straight-line portion of the
0
10
20
30
40
50
60
70
80
90
0 20 40 60 80 100 120 140
Time (h)
Tem
pera
ture
(C) o
r Rel
ativ
e H
umid
ity(R
H)
Temperature (C)Relative Humidity
Figure 4–6: Temperature and relative humidity inside the plastic chamber

127
curve. Hence, the weight gain with time was monitored until at least four points in the
plot of weight gain versus time were in a straight line and the R2 was greater than 0.99.
The water vapor transmission rate (WVTR) through the coatings was calculated
using equation 4.4:
daymg
AslopeWVTR 2= ( 4.4 )
where A is the area of the coating (m2) and slope is the slope of the straight line portion
of the plot of weight gain versus time. The water vapor permeability (WVP) was
calculated using equation 4.5:
mmHgdaymmilg
pxWVTRWVP 2∆
ƥ= ( 4.5 )
where ∆x is the thickness of the coating (mil) and ∆p is the vapor pressure difference
(mm Hg). The equilibrium relative humidity above the calcium chloride particles was
found to be 3.5%. Hence, in the calculations the relative humidity at the low humidity
end was taken as 3.5%.
4.3.7 Scanning Electron Microscopy
A small piece of the coating sample was cut using a razor blade and glued to the
cryo SEM sample stub using OCT/colloidal graphite. The sample was then plunge frozen

128
in liquid nitrogen and transferred rapidly to the SEM cryo chamber (Model C1500C,
Gatan, Warrendale, PA). The coating sample was fractured inside the chamber using a
probe. After fracturing, the sample was transferred to the SEM stage under vacuum (-
196°C). The samples were then etched to sublimate the ice at the surface of the coating
using an accelerating voltage of 2.5kV and a stage temperature of -90°C. During the
etching process, the samples were viewed using the lowest magnification possible to
maximize the view area. When there were no ice crystals that could be seen in the image,
the samples were removed to the cryo stage for sputter coating (BALTEC SCD050,
Techno Trade, Manchester, NH) with 10nm Au. After coating with gold, the sample was
put back into the SEM stage maintained at -150°C. SEM images were generated at
2.5kV or 5kV on a JOEL 5400 SEM (Peabody, MA) and transferred to Princeton-Gamma
Tech’s Integrated Micro-analyzer for Imaging (IMIX v.8, Princeton, NJ). The cryo SEM
was performed at the Electron Microscopy Facility, Huck Institute of Life Sciences, The
Pennsylvania State University.
4.3.8 Structural Changes on Swelling
Cocoa powder particles were dried in a vacuum oven (National Appliance Co.,
Portland, OR), maintained at 60oC and a vacuum of 20” Hg, for 24 hours and then put on
a microscope slide. The slide was observed using an Olympus BX40 light microscope
equipped with a Sony Power HAD DXC-970MD CCD color video camera used for
image capture through Pax-It (Version 4.2) software (MIS, Franklin Park, IL). After
obtaining the image, the slide was kept in a desiccator containing saturated sodium

129
chloride solution for two days and then the particles were observed again under the
microscope using the procedure described above.
Cocoa powder was kept in tow shallow pans (diameter 6.35cm, height 0.5 cm)
and the surface of the pan was flattened. These pans were stored for one week at room
temperature (around 18oC) in a desiccator containing saturated sodium chloride solution.
Another study was done to determine the change in the diameter of films made with
coating material containing different levels of cocoa powder. The films were kept in a
desiccator cabinet for three weeks at room temperature (18o) to remove any moisture
present in the film. The diameters of dry film samples were measured using calipers.
The change in the diameter after moisture adsorption by the films was determined by
measuring the diameter of the film samples after equilibrating them in a desiccator
containing saturated sodium chloride solution for three weeks in room temperature
(18oC)
4.3.9 Water Transmission Studies at sub-Zero Temperatures
The water vapor transmission through the coatings at sub-zero temperature was
measured using a Permatran W (MOCON, Minneapolis, MN) and ASTM method F-
1249. The Permatran available in our laboratory has only a heating unit. So an external
cell was used to obtain data at temperatures below room temperature. The external cell
was kept in a temperature-controlled chamber (Model Z16, Cincinnati Sub-Zero Products
Inc., Cincinnati, OH) maintained at –5oC. The schematic of the external cell is given in
Figure 4–7. The concept of the permeability cell is similar to that used by Martin-Polo et
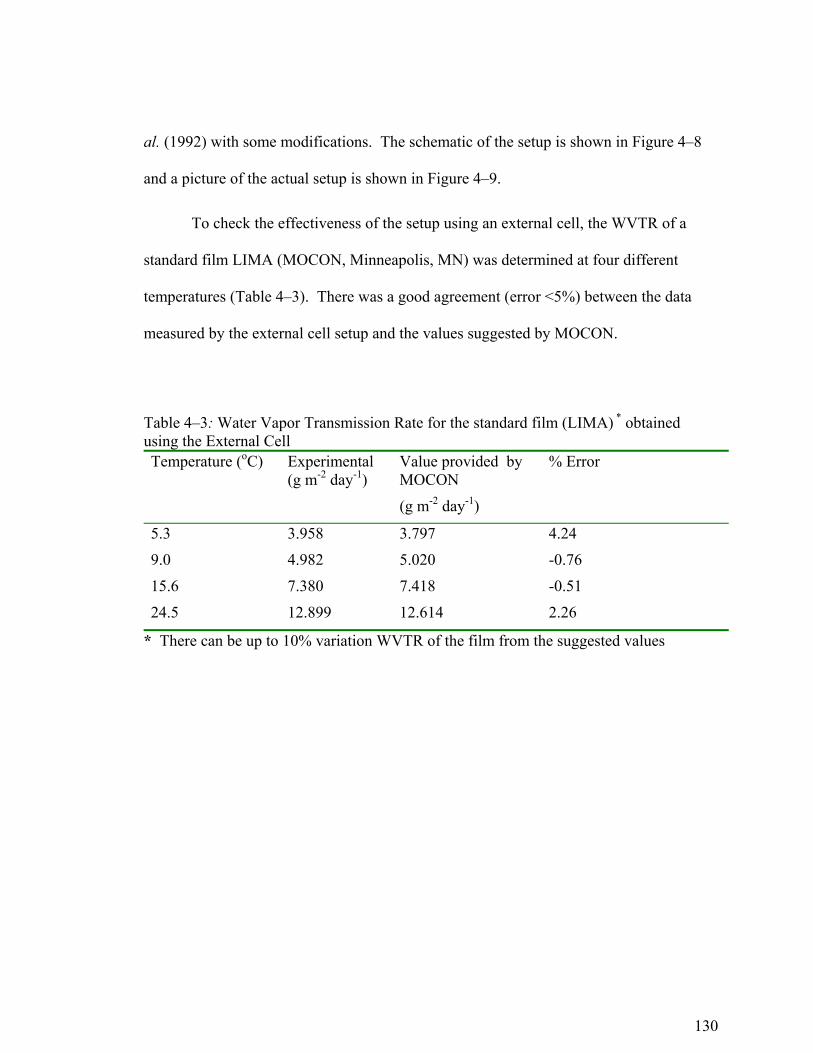
130
al. (1992) with some modifications. The schematic of the setup is shown in Figure 4–8
and a picture of the actual setup is shown in Figure 4–9.
To check the effectiveness of the setup using an external cell, the WVTR of a
standard film LIMA (MOCON, Minneapolis, MN) was determined at four different
temperatures (Table 4–3). There was a good agreement (error <5%) between the data
measured by the external cell setup and the values suggested by MOCON.
Table 4–3: Water Vapor Transmission Rate for the standard film (LIMA) * obtained using the External Cell
Temperature (oC) Experimental (g m-2 day-1)
Value provided by MOCON
(g m-2 day-1)
% Error
5.3 3.958 3.797 4.24
9.0 4.982 5.020 -0.76
15.6 7.380 7.418 -0.51
24.5 12.899 12.614 2.26 * There can be up to 10% variation WVTR of the film from the suggested values
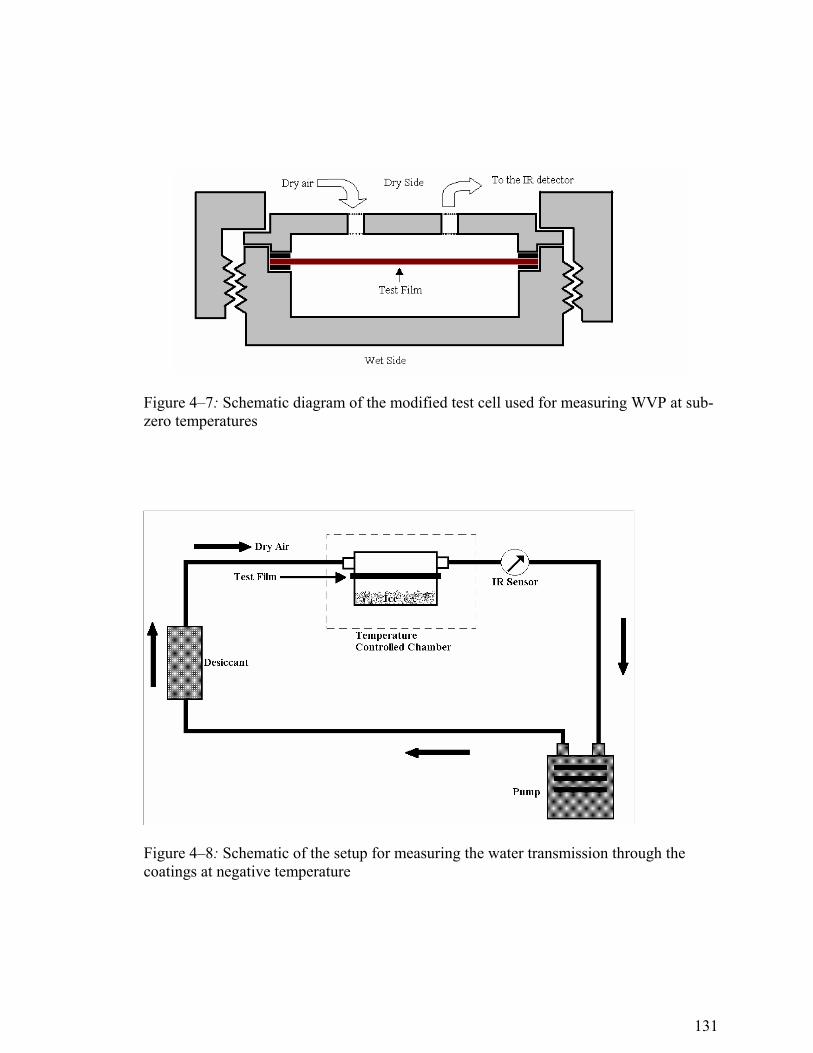
131
Figure 4–7: Schematic diagram of the modified test cell used for measuring WVP at sub-zero temperatures
Figure 4–8: Schematic of the setup for measuring the water transmission through the coatings at negative temperature
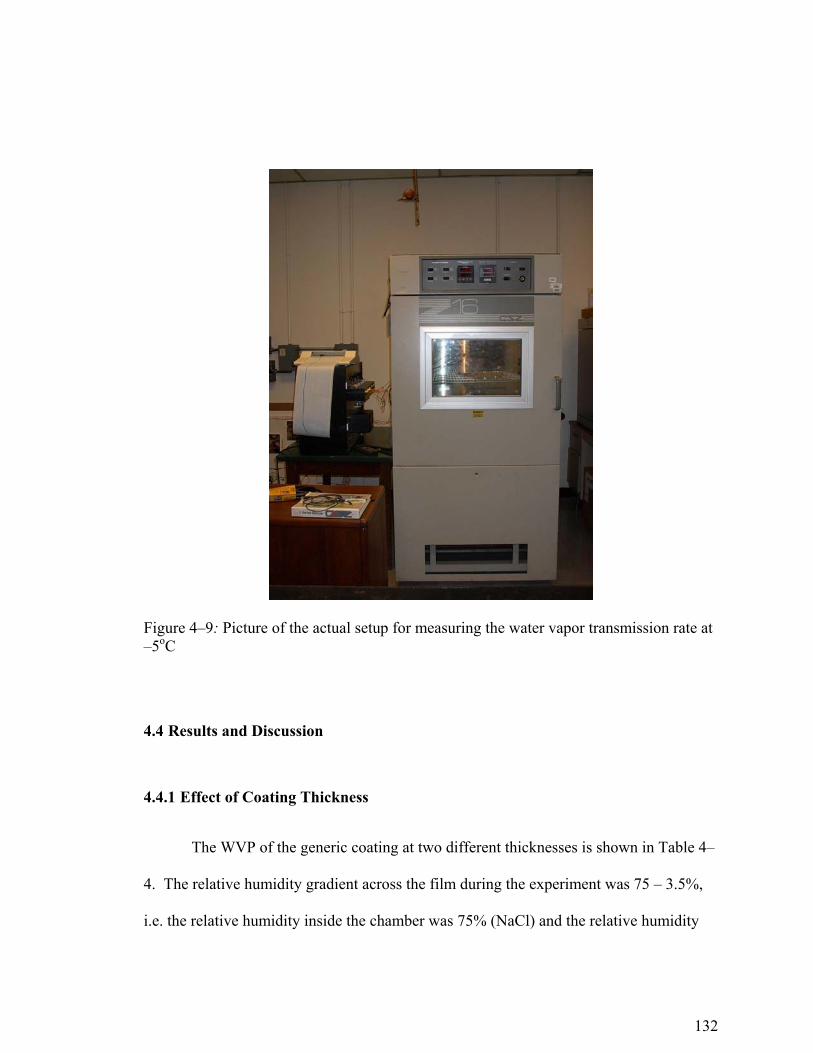
132
4.4 Results and Discussion
4.4.1 Effect of Coating Thickness
The WVP of the generic coating at two different thicknesses is shown in Table 4–
4. The relative humidity gradient across the film during the experiment was 75 – 3.5%,
i.e. the relative humidity inside the chamber was 75% (NaCl) and the relative humidity
Figure 4–9: Picture of the actual setup for measuring the water vapor transmission rate at –5oC

133
inside the cup was 3.5% (CaCl2). It can be seen from the data that there is no significant
change in WVP of the coatings (p>0.05) with thickness while the WVTR decreases with
increase in the coating thickness. These results contradict the behavior observed by
Biquet and Labuza (1988) and Landmann et al. (1960). Biquet and Labuza (1988)
observed that when the thickness of a dark chocolate film was increased from 0.612 to
0.926 mm, the WVTR decreased, but when the thickness was increased from 0.926 to
1.192 mm, there was no change in the WVTR. Landmann et al. (1960) observed that
increasing the thickness of a cocoa butter film from 1.59 to 2.92 mm did not change its
WVTR. The results obtained by Landmann et al. (1960) and Biquet and Labuza (1988)
deviate from Fick’s law, which suggests that the WVTR should decrease with an increase
in the thickness of the coating. One possible explanation for a deviation from Fick’s law
is that the researchers did not study the steady-state diffusion and all the data they had
gathered were in the sorption or the unsteady-state regime. In the sorption regime the
rate of moisture gain will be the same initially irrespective of the thickness. Hence, they
did not see any difference in the water vapor transmission rates. To illustrate this point,
another study was done with a coating containing higher amount of cocoa powder than
the generic coating.

134
Figure 4–10 shows the weight gain versus time data for coatings with different
thickness under similar storage conditions. It can be seen that during the initial stages
(time < 100 hours) there is no difference in the weight gain data for different coatings.
This is the region of unsteady-state diffusion. During the unsteady-state, the diffusion
through the coatings is analogous to diffusion in an infinite sheet; therefore, the thickness
of the coating will not have any effect on the weight gain. Thus, it can be concluded that
the values at unsteady-state have been presented in the literature, and have been mistaken
for the steady-state data. Once the diffusion process reaches the steady state, the
thickness will have an effect on the rate of weight gain as is observed in data shown in
Figure 4–10.
Table 4–4: Effect of coating thickness on the WVP of the generic coating at 17oC Sample Thickness (mm) WVTR (g m-2 day-1) Permeability [g mil m-2 day-
1 (mmHg)-1]
0.81 2.464 7.95
0.88 2.236 8.05
2.011 1.134 9.2
2.014 0.957 7.79

135
4.4.2 Effect of Ingredient Proportions on WVP of Coatings
The experimental design and results are shown in Table 4–5. The permeability
data given in the table is an average of two readings. The relative humidity gradient
across the film in all the experiments was 75 – 3.5%, i.e. the relative humidity inside the
chamber was 75% (NaCl) and the relative humidity inside the cup was 3.5% (CaCl2).
The permeability data obtained was analyzed using ECHIP software (ECHIP Inc.,
Hockession, DE) and a summary of the analysis is shown in Table 4–6. A three
dimensional surface plot of the fitted data was obtained (Figure 4–11). In the figure, the
shaded area in the axis shows the region that was used in the current experimental design.
0
0.05
0.1
0.15
0.2
0.25
0.3
0.35
0 100 200 300 400 500 600
Time (h)
Wei
ght G
ain
(g)
1.222.572.570.790.82
Figure 4–10: Effect of coating thickness on the water vapor transmission rate at 20oC. The coating contains 15% cocoa powder and 85% coconut oil. The thickness of the coatings are given in mm.

136
It is predicted that at higher amounts of cocoa powder the WVP will increase, while
increasing the amount of sugar will decrease the WVP. The trend of the plot agrees with
the theoretical prediction (Ghosh et al., 2002). The plot of mass transfer rate versus the
volume fraction, obtained from theoretical considerations (Ghosh et al., 2002) suggested
that there would be very small change in the WVP, with addition of either sucrose or
cocoa powder, at the chosen experimental region. This small change in the WVP with
the addition of sucrose or cocoa powder is masked by the experimental error and
therefore there seems to be no significant effect on changing either the fat, cocoa powder,
or sucrose (p>0.05).
Let us now consider the effect of lecithin. Table 4–6 shows that in the
experimental region, lecithin does not have a significant effect (p>0.05) on the WVP of
the coating. Studies done by Garblino (2002) showed that less than 0.05% lecithin is
needed to get a monolayer coating of lecithin around the sucrose or cocoa powder
particles. Therefore, adding lecithin beyond 0.05% will not have a great effect on the
WVP. The amount of lecithin used in this study ranged from 0.3 – 1% and therefore, no
significant difference in the WVP were observed with change in the lecithin content. The
part of this study also suggested that addition of lecithin would increase WVP and the
WVP of coatings without lecithin will be lower than the coatings with lecithin.

137
Table 4–5: Effect of ingredients on the WVP of coatings
Trial # Coconut oil Sucrose Cocoa powder LecithinPermeability [g mil m-2 day-1 (mmHg)-1]
4 0.597 0.2 0.2 0.003 13.99 ± 0.03 3 0.797 0 0.2 0.003 12.77 ± 0.19
14 0.97 0.02 0 0.01 8.81 ± 0.028 0.79 0 0.2 0.01 10.11 ± 2.256 0.68 0.21 0.1 0.01 10.60 ± 0.052 0.597 0.4 0 0.003 10.89 ± 0.745 0.497 0.4 0.1 0.003 8.91 ± 0.115 0.497 0.4 0.1 0.003 11.72 ± 0.45
12 0.397 0.4 0.2 0.003 9.36 ± 0.117 0.97 0.027 0 0.003 12.69 ± 1.51
13 0.8835 0 0.1135 0.003 11.48 ± 0.544 0.597 0.2 0.2 0.003 12.96 ± 1.793 0.797 0 0.2 0.003 12.89 ± 4.221 0.39 0.4 0.2 0.01 11.09 ± 0.20
15 0.59 0.4 0 0.01 9.19 ± 1.452 0.597 0.4 0 0.003 9.84 ± 0.489 0.3935 0.4 0.2 0.0065 14.80 ± 8.511 0.39 0.4 0.2 0.01 10.25 ± 0.01
11 0.7835 0.21 0 0.0065 9.03 ±0.7010 0.8835 0 0.11 0.0065 11.32 ± 0.42

138
Table 4–6: Summary of Data Analysis – Mixture Design
Coefficients for response 'Permeability' Coefficient scaling is in terms of the stretched experimental region. COEFFICIENTS SD P CONDITION TERM -298.343 0 CONSTANT 309.635 195.409 0.1442 0.007 1 coil 306.598 196.227 0.1492 0.008 2 sucrose 329.559 199.686 0.1299 0.016 3 cpowder -62157.5 39060.6 0.1426 0.002 4 lecithin 2.80854 11.2703 0.8083- 0.461 5 coil*sucrose -22.3102 39.9113 0.5885- 0.139 6 coil*cpowder 62896.2 39706.3 0.1443 0.004 7 coil*lecithin -17.3019 42.9715 0.6957- 0.124 8 sucrose*cpowder 63220.2 39712 0.1425 0.004 9 sucrose*lecithin 63084.1 39692.6 0.1431 0.008 10 cpowder*lecithin N trials = 20 N terms - mixture constraints = 10 Residual SD = 2.034599, Lack-Of-Fit P=0.0252 * Residual DF = 10 Residual SD used for tests Replicate SD = 1.010104 Replicate DF = 5 Cross val RMS = 3.554036 R Squared = 0.526, P=0.3718 Adj R Squared = 0.100

139
To test the hypothesis developed above that an increase in the sucrose content will
decrease the WVP, while an increase in the cocoa powder content will increase the WVP,
the mixture design was augmented, to include coatings containing up to 40% cocoa
Figure 4–11: Three dimensional surface plot of the fitted model for permeability data obtained from the mixture experiments

140
powder and 60% sucrose. The augmented design also included coatings made without
any lecithin. The augmented design and the WVP data obtained are shown in Table 4–7,
and the three dimensional surface plot is shown in Figure 4–12. A summary of data
analysis of the augmented design is shown in Table 4–8. As predicted by Figure 4–11,
there is a significant increase (p<0.05) in the WVP upon increasing the cocoa powder
content, while increasing the sucrose content significantly decreases (p<0.05) the WVP.
Also, there is a significant effect (p<0.05) on addition of lecithin on the WVP of the
coatings. These results obtained from the augmented design confirm the hypothesis that
the addition of cocoa powder or lecithin increases WVP of the coatings while addition of
sucrose decreases the WVP. In mixture design, the change in the amount of one
ingredient affects the quantity of another ingredient; therefore the effect of change in one
ingredient is relative to the change in another ingredient. In the above, all the changes
have been discussed relative to the amount of fat in the coating.
Table 4–7: Effect of ingredients on the WVP of coatings – Results from the augmented design
Trial # Coconut oil Sucrose Cocoa powder LecithinPermeability [g mil m-2 day-1 (mmHg)-1]
16 0.8 0.2 0 0 10.10 ± 0.07 17 0.7 0.3 0 0 9.73 ± 0.3118 0.8 0 0.2 0 11.64 ± 0.2119 0.7 0 0.3 0 12.44 ± 0.3220 0.695 0 0.3 0.005 22.36 ± 0.8121 0.595 0 0.4 0.005 28.79 ± 1.2022 0.495 0.5 0 0.005 7.21 ± 0.2123 0.395 0.6 0 0.005 6.06 ± 0.1524 0.395 0.5 0.1 0.005 9.86 ± 0.1725 0.395 0.3 0.3 0.005 19.44 ± 1.54

141
The analysis in Table 4–8 also shows that the model is significant (p<0.05) while
the model was not significant in the initial mixture design (Table 4–6). The first part of
this study had shown that lecithin has an interaction with hydrophilic particles, and the
results from this study also confirmed that finding. The interaction term sucrose*lecithin,
Table 4–8: Summary of Data Analysis – Augmented Mixture Design
Coefficients for response 'Permeability' Log e transformation used Coefficient scaling is in terms of the stretched experimental region. COEFFICIENTS SD P CONDITION TERM -7.48948 0 CONSTANT 9.26802 2.86309 0.0041 0.025 1 Sucrose 12.0727 2.86957 0.0004 0.043 2 Cocoa 9.95564 2.9241 0.0028 0.026 3 Fat -3377.78 959.519 0.0022 0.005 4 lecithin -1.36858 0.702493 0.0656 0.393 5 Sucrose*Cocoa 1.15739 0.395636 0.0084 0.652 6 Sucrose*Fat 3421.12 974.867 0.0022 0.009 7 Sucrose*lecithin -2.6312 0.796507 0.0035 0.308 8 Cocoa*Fat 3445.34 970.451 0.0020 0.017 9 Cocoa*lecithin 3393.65 967.89 0.0022 0.008 10 Fat*lecithin N trials = 30 N terms - mixture constraints = 10 Residual SD = 0.128416 Residual DF = 20 Residual SD used for tests Replicate SD = 0.098774 Replicate DF = 5 Cross val RMS = 0.169422 R Squared = 0.881, P=0.0000 *** Adj R Squared = 0.827

142
and cocoa*lecithin significantly affects (p<0.05) the WVP. On the other hand, it can be
expected that there is no interaction between the sucrose, cocoa powder and fat. The
results also show that the interaction terms between the sucrose, cocoa powder, and fat
does not have a significant effect on WVP.
Comparing Figure 4–11 and Figure 4–12, it can be seen that the trend is similar in
both the figures. However, the permeability values with change in cocoa powder content
is much higher in Figure 4–12. Cocoa powder tends to swell upon adsorbing moisture.
The swelling of the cocoa powder particles can change the structure of the coating.
Higher the cocoa powder content, greater will be its impact on the structural changes of
the coatings. The effect of 50% cocoa on WVP was also studied and the results have
been discussed below.

143
In all the above-mentioned studies the humidity gradient across the film was
constant (75-3.5%). Biquet and Labuza (1988) had found that the WVTR of a dark
chocolate coating is not only dependent on the humidity gradient but also on the absolute
Figure 4–12: Three dimensional surface plot of the fitted model for permeability data obtained from the mixture experiments

144
humidity at each side of the test cell. Hence, the effect of absolute humidity on WVP of
coatings was also studied and the results are discussed in the next section.
4.4.3 Effect of Absolute Relative Humidity on WVP of Coatings
The effect of absolute humidity on the WVP was measured using the generic
coating formulation. In one setup, the humidity on the high and low end was 75% and
33% (average 54%) respectively, for the other study it was 75% and 54.3% (average
64.65%). The results obtained from the study are shown in Table 4–9. It can be seen
from the data below that the samples kept at a higher average humidity gave a higher
WVP. These data are in agreement with the results obtained by Landmann et al. (1960),
who found a large increase in the WVP of milk chocolate when the humidity gradient
was varied from 22 – 75% to 0 to 100% and Biquet and Labuza (1988), who found that
the WVP increased from 4.9 g mil m-2 day-1 mmHg-1 to 11.0 g mil m-2 day-1 mmHg-1
when the relative humidity difference was changed from 0-33% to 54.4 – 80.4% even
though the relative humidity gradient was constant (33%).
Figure 4–13 shows a picture of the generic coating which was kept at humidity
conditions of 75% on the outside and 33% in the bottom of the cell. A picture of the
generic coating kept at humidity conditions of 75% on the outside and 54.5% in the
bottom of the cell (average 64.75%) is shown in Figure 4–14, and a picture of the generic
coating sample taken before the water vapor transmission studies is shown in Figure 4–4.
It can be clearly seen that the coating kept at 75 – 54.3% condition swelled more than the
sample kept at 75 – 33 % condition. This implies that with an increase in the absolute

145
humidity, the coating absorbs more moisture and changes the structure of the coating.
The change in the structure of the coating causes an increase in the WVP.
Table 4–9: Effect of relative humidity difference on WVP of the generic coating at 18.5oC Relative Humidity Range Water Vapor Permeability (g mil m-2 day-1 mmHg-1)
3.5 - 75 10.67 ± 1.06 33 - 75 12.38 ± 0.70 54.5 - 75 61.96 ± 21.07
Figure 4–13: Picture of the generic coating kept at humidity conditions of 75% on the outside and 33% in the bottom of the cell
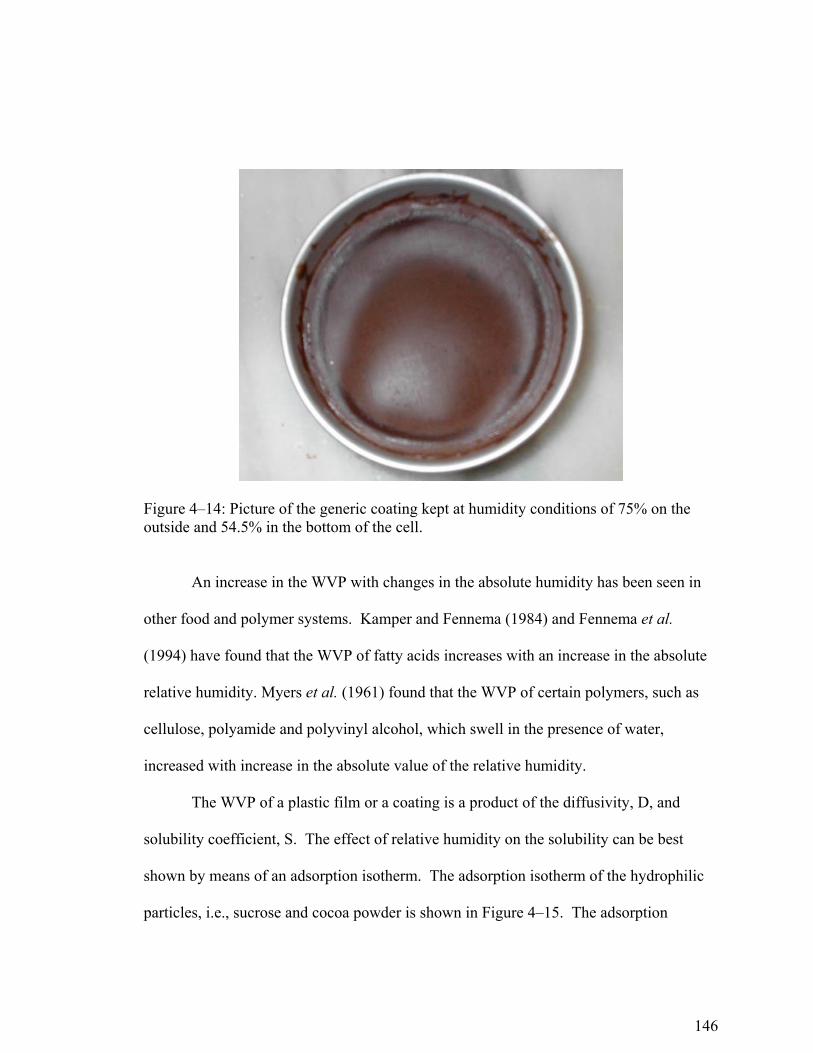
146
An increase in the WVP with changes in the absolute humidity has been seen in
other food and polymer systems. Kamper and Fennema (1984) and Fennema et al.
(1994) have found that the WVP of fatty acids increases with an increase in the absolute
relative humidity. Myers et al. (1961) found that the WVP of certain polymers, such as
cellulose, polyamide and polyvinyl alcohol, which swell in the presence of water,
increased with increase in the absolute value of the relative humidity.
The WVP of a plastic film or a coating is a product of the diffusivity, D, and
solubility coefficient, S. The effect of relative humidity on the solubility can be best
shown by means of an adsorption isotherm. The adsorption isotherm of the hydrophilic
particles, i.e., sucrose and cocoa powder is shown in Figure 4–15. The adsorption
Figure 4–14: Picture of the generic coating kept at humidity conditions of 75% on the outside and 54.5% in the bottom of the cell.
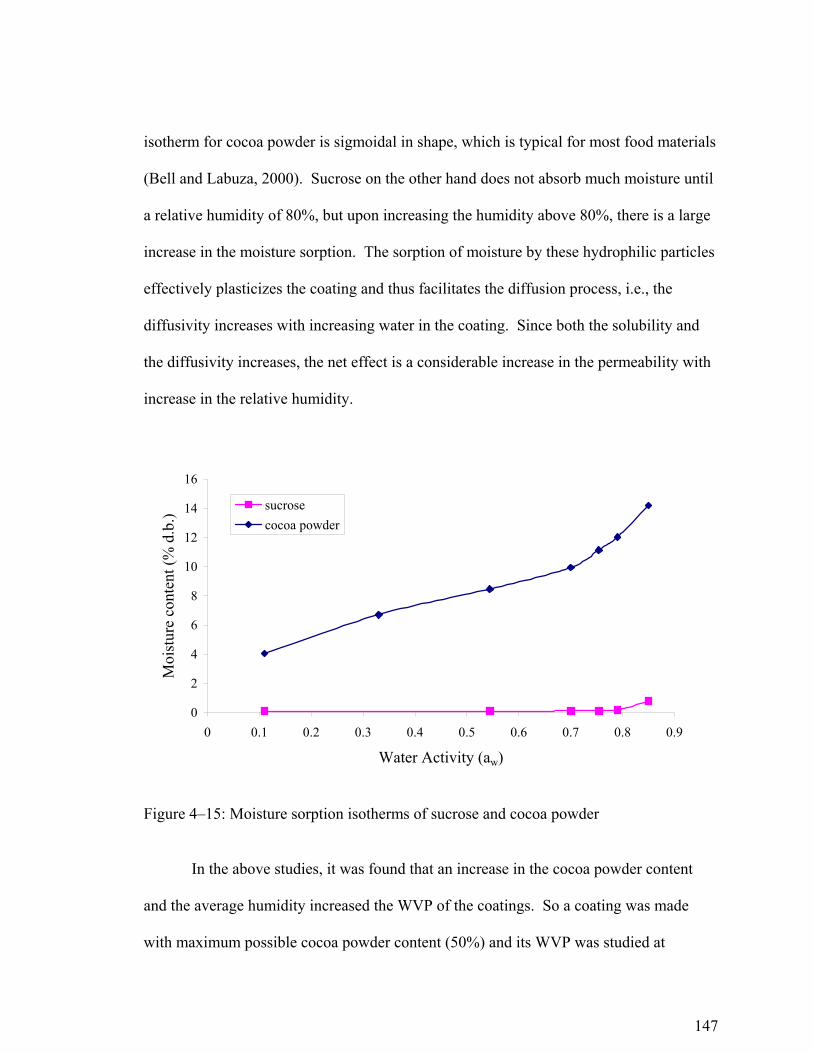
147
isotherm for cocoa powder is sigmoidal in shape, which is typical for most food materials
(Bell and Labuza, 2000). Sucrose on the other hand does not absorb much moisture until
a relative humidity of 80%, but upon increasing the humidity above 80%, there is a large
increase in the moisture sorption. The sorption of moisture by these hydrophilic particles
effectively plasticizes the coating and thus facilitates the diffusion process, i.e., the
diffusivity increases with increasing water in the coating. Since both the solubility and
the diffusivity increases, the net effect is a considerable increase in the permeability with
increase in the relative humidity.
In the above studies, it was found that an increase in the cocoa powder content
and the average humidity increased the WVP of the coatings. So a coating was made
with maximum possible cocoa powder content (50%) and its WVP was studied at
0
2
4
6
8
10
12
14
16
0 0.1 0.2 0.3 0.4 0.5 0.6 0.7 0.8 0.9
Water Activity (aw)
Moi
stur
e co
nten
t (%
d.b
.)
sucrosecocoa powder
Figure 4–15: Moisture sorption isotherms of sucrose and cocoa powder

148
different average humidities. Of the six samples tested, all but one coating cracked
during the test. Figure 4–16 shows the weight gain versus storage time of the coating.
The coating that did not have a crack during the test is marked as no cracks in the figure.
As evident from Figure 4–16, the cracking of the coating causes a large increase in the
weight gain of the samples. A picture of a coating after cracking is shown in Figure 4–
17. An attempt was also made to study the effect of storing the samples at 100%
humidity, but the samples cracked within two to three days of storage.
0
0.1
0.2
0.3
0.4
0.5
0.6
0.7
0.8
0 50 100 150 200 250 300
Time (h)
Wei
ght g
ain
(g)
33% - 133% - 260%-160%-23.5%-13.5% - 2
No Cracks
Figure 4–16: Weight gain versus storage time for a coating sample containing 50% cocoa powder with different relative humidity at the low humidity end. The numbers 1 and 2 at the end of the humidity in the legend signifies the sample numbers. The sample that did not cracked during the experiment is shown with an arrow as intact sample. The humidity at the high end was 75%.
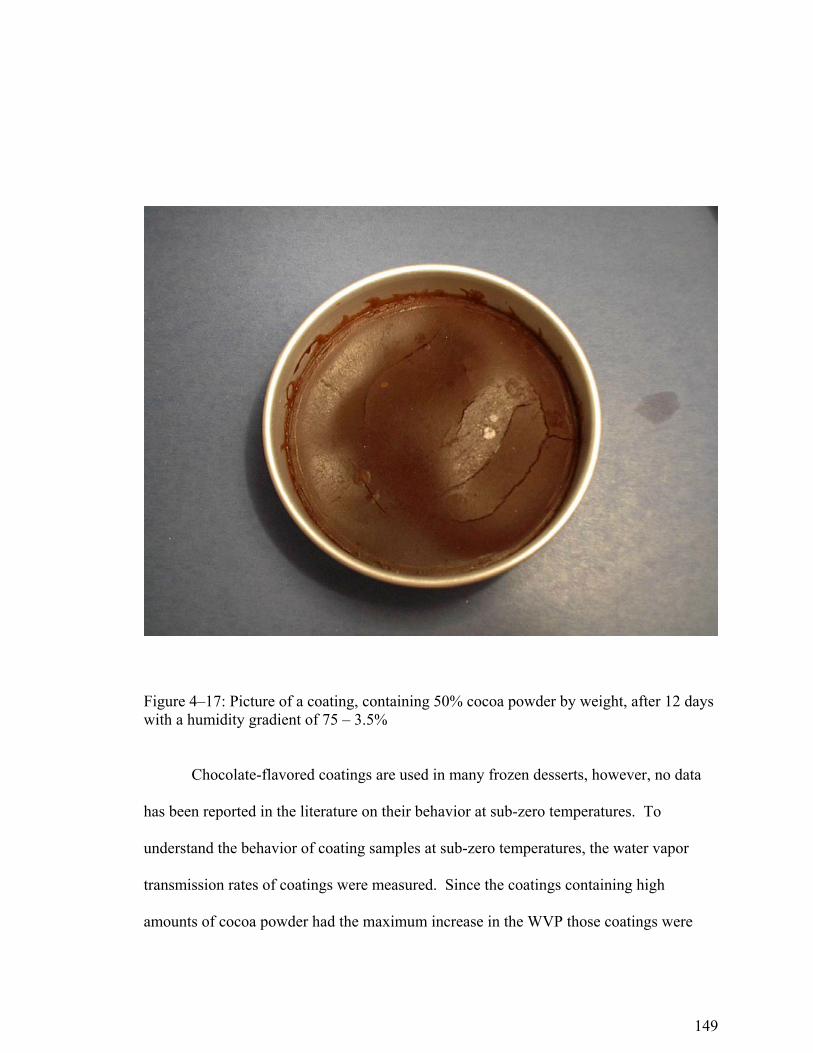
149
Chocolate-flavored coatings are used in many frozen desserts, however, no data
has been reported in the literature on their behavior at sub-zero temperatures. To
understand the behavior of coating samples at sub-zero temperatures, the water vapor
transmission rates of coatings were measured. Since the coatings containing high
amounts of cocoa powder had the maximum increase in the WVP those coatings were
Figure 4–17: Picture of a coating, containing 50% cocoa powder by weight, after 12 days with a humidity gradient of 75 – 3.5%

150
tested for the sub-zero temperatures. The water vapor transmission rate for the coatings,
obtained as a function of time, at –5oC is shown in Figure 4–18. The voltage is directly
proportional to the water transfer rate. The thickness of the coating containing 40%
cocoa powder was 0.8mm, while the thickness of the coating containing 50% cocoa
powder was 1.2mm. The time required to reach steady state is l2/2D (Saravacos and
Maroulis, 2001), where l is the thickness of the coating and D is the unsteady-state
diffusion coefficient. Previous studies have shown that the unsteady-state diffusion
coefficient of a coating containing 50% cocoa powder should be lower than that of a
coating containing 40% cocoa powder. So, with a thicker film and lower diffusivity, the
time needed for the coating with 50% cocoa powder to crack should be more than the
time required for the coating with 40% cocoa powder to crack.
As expected, time required at -5oC was longer than the time needed for the
samples to crack at 18.5oC. There are two changes that are occurring with decrease in
temperature that reduces the diffusion rate. First, the mobility of moisture decreases with
a decrease in the temperature. Second, with a decrease in the temperature, there is an
increase in the SFC of the coating, which increases the resistance to moisture diffusion.
The two effects combine to give a large decrease in the moisture transfer rates.

151
Another qualitative study was done at –5oC to look the time taken for coatings to
crack during storage. In this study, the coating samples were cut into the size of a regular
Mason jar lid. The Mason jars were filled with water and were closed on top by using the
coatings as lids. The Mason jars were then put in a large desiccator containing saturated
sodium chloride solution. Thus there was a humidity gradient across the coatings. The
desiccators were put in a chamber maintained at –5oC. In this study, five coating samples
containing cocoa powder levels of 10, 20, 30, 40, 50% (w/w) and one coating with 40%
sucrose were used. The lecithin content in each of the samples was 0.5%. Each sample
was prepared in duplicate. The thickness of each of the sample was 0.9 ± 0.1 mm. The
samples were stored for 14 weeks (98 days). Both samples containing 50% cocoa
powder cracked after 42 days, one of the samples containing 40% sugar cracked after 77
0
0.5
1
1.5
2
2.5
3
3.5
0 100 200 300 400 500 600 700 800 900
Time (h)
Vol
tage
(V)
40% cp50%cp20% sugar
Figure 4–18: Change in the voltage with storage time for coatings stored at –5 oC

152
days, the second sample containing 40% cocoa powder cracked after 81 days, and one of
the samples containing 20% sucrose cracked after 98 days. The pictures of the coatings
after 98 days of storage are shown in Appendix B. This study further suggests that high
amounts of cocoa powder in the coating leads to a change in the structure in the presence
of moisture.
4.4.4 Swelling of Cocoa Powder
From the sorption isotherm of sucrose and cocoa powder (Figure 4–15), it can be
seen that cocoa powder absorbs more moisture than sucrose at water activities lower than
0.85. Combining the moisture absorption data with the results obtained from the studies
on the effect of humidity, one can infer that the swelling in the coating may be due to the
cocoa powder particles.
Two studies were done to test this hypothesis. First was a qualitative study where
the dried cocoa powder was and put on two shallow pans and the surfaces were flattened
(Figure 4–19). These pans were then kept in a desiccator containing saturated NaCl
solution (75% RH). The desiccator was kept in a room maintained at 18oC. It was found
that within two days of storage, the surface had changed showing cracks in the surface
and the height had also increased above the level of the pan (Figure 4–20). This study
suggested that the change in the surface is due to the swelling of the cocoa powder. No
visual changes were observed from the data obtained using light microscopy.

153
Coatings containing varying amounts of cocoa powder were kept for a week at
75%RH in a room maintained at about 18oC. The percent increase in diameter of the
coatings increased with an increase in the cocoa powder content in the coating (Table 4–
10). These studies supported our hypothesis that the cocoa powder swells in the presence
Figure 4–19: Picture of the dry cocoa powder kept in shallow pans
Figure 4–20: Picture of hydrated cocoa powder

154
of moisture. Cocoa powder contains about 15.5 – 16 % starch (Schmieder and Keeney,
1980; Zaan, 1993) and about 32-34% fibers (Zaan, 1993). Starch molecules can swell up
to 30% in the presence of moisture (Full, 2003). Fibers are hygroscopic (Cadden, 1988)
and tend to swell on moisture absorption (Larrea et al., 1997). These two ingredients i.e.
starch and fibers are probably the reason for the swelling of the cocoa powder particles.
4.4.5 Structure of Coatings
A large number of SEM images of dry and hydrated coatings were obtained to
determine the structure of generic coating and a coating with 50% cocoa powder. The
structure of a generic coating as seen under the SEM is shown in Figure 4–21 and that of
a coating with 50% cocoa powder is shown in Figure 4–22. The images show that there
is a network of crystal spherulites in both types of the coatings. There seem to be small
cracks in certain parts of the crystals. These cracks could have occurred due to quick
cooling of the coatings with liquid nitrogen.
Loisel et al. (1997) suggested that most of pores in chocolates are less than 0.4
µm and cannot be observed under SEM. But after looking at the swelling of the coatings
in the WVP experiments, it was hypothesized that the change in the pore size will be
Table 4–10: Increase in the diameter of coatings stored at 75% RH Coating Sample Initial Diameter
(mm) Final Diameter (mm)
% Increase in the Diameter
Generic (12.5% cocoa powder)
91.025 91.237 0.47
20% cocoa powder 91.00 91.358 0.79 40% cocoa powder 91.05 91.95 1.99

155
large enough to be seen under the SEM. However, on comparing the images of dry and
hydrated coatings, no visual differences were observed. From the increase in the
diameter of the coatings (Table 4–10), it can be seen that the swelling of the coatings is
very small (<2%) and hence no change was seen in the SEM images. There was also no
observed differences in the coating thickness because the maximum variation in thickness
due to swelling (<2%) (Table 4–10) is less than the variation inherent variation in the
thickness of the coating.
Figure 4–21: Structure of a section of dry generic coating seen using cryo SEM

156
4.4.6 Effect of Solid Fat Content
The effect of solid fat content (SFC) on the WVP is shown in Figure 4–23. The
data shows that the WVP of the coating decreases with increase in the SFC. Martin-Polo
et al. (1992) observed that for a mixture of paraffin wax and oil blends the WVP
decreased with an increase in SFC and the results observed here are similar to their
results. The trend line shows that there is a large decrease in the WVP with small
Figure 4–22: Structure of a dry coating with 50% cocoa powder as seen under cryo SEM

157
increase in SFC when the SFC is less than 50%. Upon increasing the SFC beyond 50%,
the decrease in the WVP with increase in SFC is smaller. It was also very difficult to
make coatings with the fats having high SFC values (>60%). These fats had a tendency
to crack and several coatings had to be made to obtain one intact (without cracks)
coatings.
4.4.7 Effect of Cocoa Powder type, Sugar, and Emulsifier
The effect of natural and alkalized cocoa powder, sugars, and Citrem is shown in
Table 4–11. There is a significant increase in WVP when dextrose was used. Dextrose
adsorbs more moisture than sucrose (Iglesias and Chirife, 1982) at the same aw and this
can cause some structural changes which might have increased the WVP of the coating.
0
2
4
6
8
10
12
14
16
0 10 20 30 40 50 60 70 80 90
Solid Fat Content (%)
Perm
eabi
lity
(g m
il/[m
2 da
y m
mH
g])
Figure 4–23: Effect of SFC on the WVP of fat coatings

158
There was a significant increase in the WVP with lactose and Citrem. Ctirem is polar
than lecithin and therefore more moisture will adsorb to its surface and therefore there is
an increase in the WVP.
There is no significant change (p>0.05) in the WVP of coatings with change in
any of the other ingredients. The generic coating was made using defatted cocoa powder.
The normal and alkalized cocoa powder contains 10-12% cocoa butter, but there is no
change in the SFC on the coatings. The average SFC of the generic coating was 54.2%,
while the average SFC of the coatings containing either alkalized or natural cocoa
powder was 53.5%. Since the SFC remains essentially constant, there is no change in the
WVP of the coatings with change in the cocoa powder type.
Previous studies had shown that lecithin had a significant effect on the diffusion
behavior when the relative humidity on one side of the coating is 85%. So, an attempt
was made to measure the WVP when the humidity on one side of the coating was 85%
and on the other side it was 13%. Duplicate samples of generic coating and coating made
with Citrem were studied in this setup. All the samples cracked within three days.
Before the samples had cracked sucrose crystals were seen in the surface of the coatings
Table 4–11: Effect of cocoa powder, sugar and emulsifier type on the WVP of coatings at 18.5oC Sample WVP (g mil m-2 day-1 mmHg-1) Generic 10.67 ± 1.06A
Lactose 12.62 ± 1.13B
Dextrose 14.88 ± 1.47B
Natural 10.57 ± 1.63A
Alkalized 10.52 ± 0.21A
Citrem 12.66 ± 0.67B Note: Samples with different letters are significantly different. The significance was determined using a 2-sample t-test and assuming equal variances.

159
(Figure 4–24). This suggested that the moisture diffusing through the coating had
dissolved the sucrose particles and the sucrose migrated to the surface of the coating
along with the moisture and crystallized at the surface.
4.5 Conclusions
The ingredients and the storage environment affect the WVP of the coatings.
Among the ingredients studied sucrose and fat decreased the WVP while cocoa powder
Figure 4–24: Picture of a cup with a generic coating that has a humidity of 85% inside the cup and 13% outside

160
and lecithin increased the WVP of the coatings. Lecithin has a bigger impact on the
WVP when the water activity on one side of the coating is higher than 0.85. The WVP of
fat films decreased with increase in the solid fat content (SFC). The type of cocoa
powder (natural and alkalized) did not have a significant effect on the WVP, while
lactose, dextrose and Citrem, significantly increased the WVP. The WVP of the coatings
also depended on the absolute relative humidity and the temperature of storage.
4.6 References
Bell, L. N. and Labuza, T. P. (2000). Moisture Sorption: Practical Aspects of Isotherm
Measurement and Use. St. Paul, MN, American Association of Cereal Chemists.
Biquet, B. and Labuza, T. P. (1988). Evaluation of the moisture permeability
characteristics of chocolate films as edible moisture barrier. J. Food Sci. 53(4):
989 - 998.
Cadden, A. M. (1988). Moisture sorption characteristics of several food fibers. J. Food
Sci. 53(4): 1150-1155.
Callegarin, F., Gallo, J. Q., Debeaufort, F. and Voilley, A. (1997). Lipids and
biopackaging. J. Am. Oil Chem. Soc. 74(10): 1183 - 1192.
Cornell, J. A. (2002). Experiments with Mixtures: Designs, Models, and the Analysis of
Mixture Data. New York, NY, Wiley-Interscience.
Debeaufort, F., Quezada-Gallo, J. A. and Voilley, A. (1998). Edible films and coatings:
Tomorrow's packagings: A review. CRC Critical Reviews in Food Science 38(4):
299 - 313.
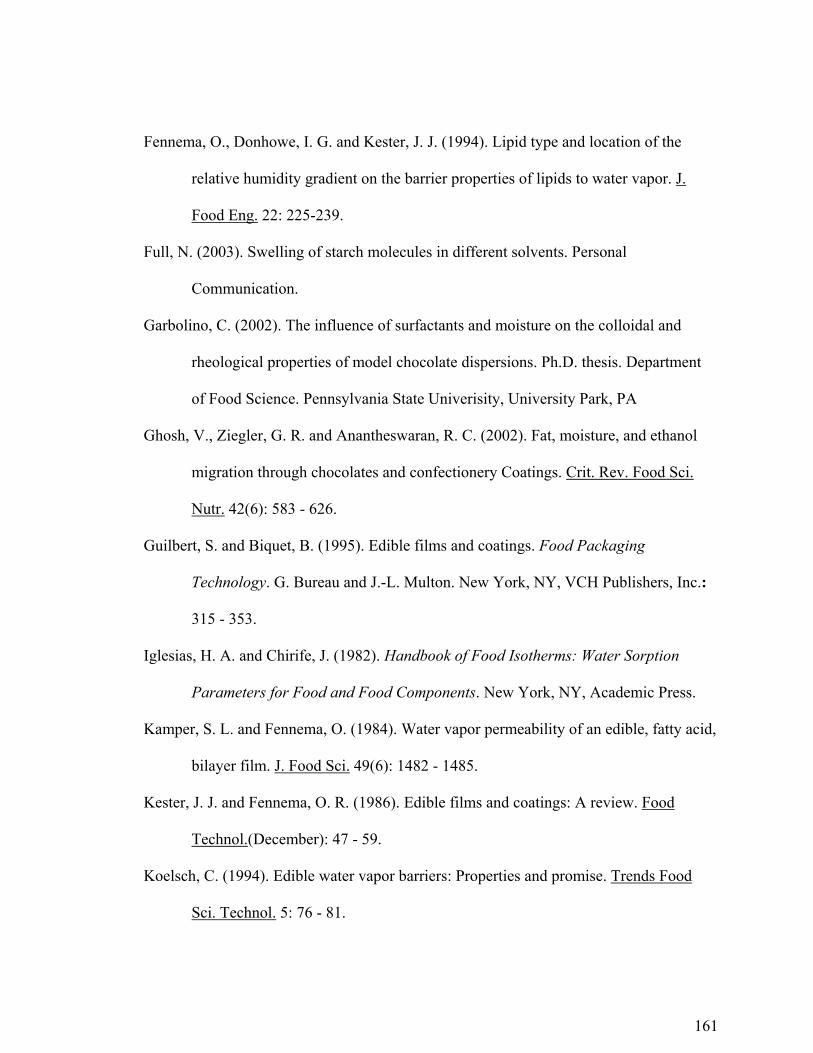
161
Fennema, O., Donhowe, I. G. and Kester, J. J. (1994). Lipid type and location of the
relative humidity gradient on the barrier properties of lipids to water vapor. J.
Food Eng. 22: 225-239.
Full, N. (2003). Swelling of starch molecules in different solvents. Personal
Communication.
Garbolino, C. (2002). The influence of surfactants and moisture on the colloidal and
rheological properties of model chocolate dispersions. Ph.D. thesis. Department
of Food Science. Pennsylvania State Univerisity, University Park, PA
Ghosh, V., Ziegler, G. R. and Anantheswaran, R. C. (2002). Fat, moisture, and ethanol
migration through chocolates and confectionery Coatings. Crit. Rev. Food Sci.
Nutr. 42(6): 583 - 626.
Guilbert, S. and Biquet, B. (1995). Edible films and coatings. Food Packaging
Technology. G. Bureau and J.-L. Multon. New York, NY, VCH Publishers, Inc.:
315 - 353.
Iglesias, H. A. and Chirife, J. (1982). Handbook of Food Isotherms: Water Sorption
Parameters for Food and Food Components. New York, NY, Academic Press.
Kamper, S. L. and Fennema, O. (1984). Water vapor permeability of an edible, fatty acid,
bilayer film. J. Food Sci. 49(6): 1482 - 1485.
Kester, J. J. and Fennema, O. R. (1986). Edible films and coatings: A review. Food
Technol.(December): 47 - 59.
Koelsch, C. (1994). Edible water vapor barriers: Properties and promise. Trends Food
Sci. Technol. 5: 76 - 81.

162
Krochta, J. M. and Mulder-Johnston, C. D. (1997). Edible and biodegradable polymer
films: Challenges and opportunities. Food Technol. 51(2): 61 - 74.
Labuza, T. P. and Hyman, C. R. (1998). Moisture migration and control in multi-domain
foods. Trends Food Sci. Technol. 9: 47 - 55.
Landmann, W., Lovegreen, N. V. and Feuge, R. O. (1960). Permeability of some fat
products to moisture. J. Am. Oil Chem. Soc. 37(1): 1 - 4.
Larrea, M. A., Grossmann, M. V. E., Beleia, A. P. and Tavares, D. Q. (1997). Changes in
water absorption and swollen volume in extruded alkaline peroxide pretreated rice
hulls. Cereal Chemistry 74(2): 98-101.
Loisel, C., Lecq, G., Ponchel, G., Keller, G. and Ollivon, M. (1997). Fat bloom and
chocolate structure studied by mercury porosimetry. J. Food Sci. 62(4): 781 - 788.
Martin-Polo, M., Voilley, A., Blond, G., Colas, B., Mesnier, M. and Floquet, N. (1992).
Hydrophobic films and their efficiency against moisture transfer. 2. Influence of
the physical state. J. Agric. Food Chem. 40: 413 - 418.
Matissek, R. 2002. Zwischen zwei Phasen – Citrem. SÜSSWAREN (2002) Heft 5: 6
Montgomery, D. C. (1997). Design And Analysis Of Experiments. New York, NY, Wiley
Interscience, Inc.
Morillon, V., Debeaufort, F., Blond, G., Capelle, M. and Voilley, A. (2002). Factors
affecting the moisture permeability of lipid-based edible films: A review. Crit.
Rev. Food Sci. Nutr. 42(1): 67 - 89.

163
Morillon, V., Debeaufort, F., Capelle, M., Blond, G. and Voilley, A. (2000). Influence of
the physical state of water on the barrier properties of hydrophilic and
hydrophobic films. J. Agric. Food Chem. 48: 11-16.
Myers, A. W., Meyer, J. A., Rogers, C. E., Stannett, V. and Szwarc, M. (1961). Studies in
the gas and vapor permeability of plastic films and coated papers. Part VI. The
permeation of water vapor. Tappi 44(1): 58 - 64.
Saravacos, G. D. and Maroulis, Z. B. (2001). Transport Properties of Foods. New York,
NY, Marcel Dekker.
Schmieder, R. L. and Keeney, P. G. (1980). Characterization and quantification of starch
in cocoa beans and chocolate products. J. Food Sci. 45(3): 555-557, 563.
Talbot, G. (1994). Minimization of moisture migration in food systems. Food Ingredients
Europe, Paris.
Waddington, D. (1995). Determination of solid phase content in fats using the BRUKER
minispec p20i. Minispec pc100: Typical Applications, Food Industry.
Rheinstetten, Germany, Bruker Analytik GnBH.
Zaan, D. (1993). The Cocoa Manual: A Guide to De Zaan's Cocoa Products. Holland,
Cacao De Zaan.
Chapter 5
CONCLUSIONS AND RECOMMENDATIONS FOR FUTURE RESEARCH
The mechanism of moisture migration through chocolate-flavored coatings was
investigated in this study. An approach, developed by Weisz (1967) to understand
diffusion in heterogeneous materials, was used to elucidate the mechanism of moisture
migration through chocolate-flavored coatings. It was found that Weisz (1967) approach
could be used to model the diffusion through heterogeneous food materials. The
diffusion of moisture through the dispersed phase occurred through the cocoa powder
particles and along the surface of the sucrose particles. The approach outlined in this
work can be extended to understand the mechanism of moisture migration in other food
systems.
The time lag experiments used to measure the diffusion coefficients took a long
time to complete because of the accuracy of the balance. Another problem that occurred
was that the salt would diffuse through the coating material, thus altering the structure of
the coating. During the experiment, the Thwing Albert cups were removed from the
environmentally controlled chamber for weighing. The salt solution at the bottom of the
cups were disturbed when the cups were removed for weighing and the salt particle might
have gotten attached to the surface of the coating and then diffused into the coating
material. Therefore, it is recommended to develop a faster and flow-through method for
measuring the diffusivity of the coating materials.

165
The presence of lecithin increased the moisture adsorption capacity of sugar. The
moisture adsorption isotherm for a coating made with 70% coconut oil + 0.5% lecithin
and 30% sugar was determined. The equilibrium moisture content, for this coating, at
each water activity level was higher than the individual constituents, i.e., sugar or
coconut oil + 0.5% lecithin. On of the possible reasons for the observed data is that there
is a layer of moisture that is present in between the surface of the sugar particles and the
polar regions of lecithin.
The effect of sucrose, cocoa powder, emulsifier, fat type, and storage environment
on the water vapor permeability (WVP) of a chocolate-flavored coating was also studied.
It was determined that the presence of lecithin and cocoa powder increases the water
vapor permeability. The effect of lecithin becomes prominent only when the water
activity on one side of the coating is higher than 0.85. The WVP of fat films decreased
with increase in the solid fat content (SFC) and reached a minimum at 80% SFC.
Therefore, a coating that is very resistant to moisture diffusion should have a high SFC
fat in the continuous phase and large quantity of sugar (>60%) , while it should not have
any lecithin or cocoa powder.
One of the advantages of lecithin is that it changes favorably the rheological
properties of the chocolate-flavored coatings during processing. During processing,
moisture at the surface of the sugar increases the viscosity. This is because the moisture
at the surface of the sugar particles increases friction between them. This results in a
greater resistance when the particles move among themselves and produces the effect of
increased viscosity. The viscosity is decreased by addition of lecithin, since the

166
hydrophilic groups of the molecules attach themselves firmly with water molecules.
Further research needs to be done using alternative emulsifiers that produces affects
favorably the rheological properties, but does not affect the moisture migration rates. It
has been found that PGPR adsorb less moisture than lecithin and therefore has a good
potential for being used as an alternative emulsifier. Research also needs to be done on
coatings with any cocoa powder and their rheological properties.
The WVP of fat based films decreased with an increase in the solid fat content
(SFC) to 80%. The WVP of fat films reached a minimum at 80% SFC. Studies need to
be done to find out the reason for a decrease in the WVP of coatings above the 80% SFC.
Information that will help in answering the behavior observed in this study is the
correlation between structure and moisture migration rate. Therefore, a studies need to
be done to understand the relationship between the structure of the coating and diffusion
behavior. Porosity of the fats can be determined using mercury porosimetry.
The data at sub-zero temperatures show that the presence of cocoa powder (>40%
w/w) causes cracks in the coating during storage. Research needs to be done to
determine the moisture sorption behavior of sugar and cocoa powder at sub-zero
temperatures.

Appendix A
DEVELOPMENT OF A METHOD TO MEASURE THE WATER VAPOR TRANSMISSION RATE
In order to study the effect of the ingredients on the WVP through the
coatings studies were conducted using the ASTM E-96 method. A schematic of the test
cell is shown in Figure A–1. During the initial studies the cups were put in desiccators
containing saturated salt solutions (Figure A–2). The weight gain with time was
monitored till the rate of change of weight became constant with time.
Figure A–1: Schematic of a test cell

168
The assumption in using the desiccator for WVP studies was that the humidity
inside the desiccator reached the desired humidity very quickly. A study done using a
handheld hygrometer showed that it took about 90 to 120 minutes before the humidity
inside the desiccator reached the desired value (Figure A–3). On the other hand when a
fan was put inside the setup (Figure A–4), it took only 5 to 10 minutes to reach the
desired value.
Figure A–2: Setup for measuring WVTR using desiccators

169
0102030405060708090
0 50 100 150 200
time (minutes)
Rel
ativ
e H
umid
ity (%
)
desiccatorconvection
Figure A–3: Time to reach equilibrium humidity in a desiccator and the box fitted with a fan (convection)

170
The following studies were performed to check the setup for measuring the WVP:
(i) compare the water vapor transmission rate (WVTR) values with and without
convection and (ii) compare the WVTR of the coatings in the presence of one and two
fans. The result of the first study is shown in Table A–1and the result of the second study
is shown in Table A–2. The data shown that there are considerable errors when using the
desiccator method. The error for the sample having a lower WVTR value is less than that
with higher WVTR value. This behavior is expected because the lower the WVTR value,
the closer it is to the assumption that the time taken by the moisture to get saturated
Figure A–4: Setup for measuring the water vapor transmission rate at 20oC

171
inside the chamber is negligible compared to the time taken to diffuse through the
coating.
The data in Table A–2 shows that the addition of an extra fan does not change the
experimental WVTR. Addition of an extra fan increases the convection and if the
WVTR has not reached its limiting value then the WVTR value should increase with
increasing level of convection as seen in Table A–1. This does not happen in the second
experiment (Table A–2), hence, the WVTR data obtained using one fan is the limiting
WVTR value of the coatings. Hence, a setup with one fan is suitable for studying the ater
vapor transmission rates of the coatings under consideration.
Table A–1: Comparison of WVTR (g m-2 day-1) data obtained with and without convection
Sample # Desiccator (No Convection) Convection % Error
1 3.713 4.739 21.65
2 3.106 3.559 12.73
Table A–2: Comparison of WVTR (g m-2 day-1) data obtained when one or two fans are used for creating convection inside the setup
Sample # One fan Two fans
1 3.542 3.431
2 4.062 4.238

Appendix B
MOISTURE SORPTION AND DIFFUSION COEFFICIENT DATA
The moisture content data obtained from the sorption experiments and weight loss
data obtained from the time-lag experiments are given in this Appendix.
B.1 Moisture Sorption Isotherms
B.1.1 Coconut Oil
The moisture content data obtained for coconut oil is shown in Table B–1.
B.1.2 Coconut Oil + 0.5% lecithin
The moisture content data obtained for coconut oil + 0.5% lecithin is shown in
Table B–2.
Table B–1: Equilibrium moisture content for the coconut oil samples Water Activity Moisture Content (%db)
Set 1 Set 2 Average Moisture Content
0.11 0.0415 0.0447 0.0431 0.75 0.0778 0.0810 0.0794 0.85 0.0975 0.1185 0.1080

173
B.1.3 Sugar
The moisture content data obtained for sugar is shown in Table B–3
B.1.4 Cocoa Powder
The moisture content data obtained for cocoa powder is shown in Table B–4
Table B–2: Equilibrium moisture content data obtained for coconut oil containing 0.5% lecithin Water Activity Moisture Content (%db)
Set 1 Set 2 Average Moisture Content
0.11 0.0603 0.0575 0.0589 0.75 0.210 0.190 0.2000 0.85 0.315 0.267 0.2910
Table B–3: Equilibrium moisture content for sugar at different water activities Water Activity
Sorption Moisture Content (%db)
Set 1 Set 2 Average
Desorption Moisture Content (%db)
0.11 0.09 0.10 0.0905 0.100 0.54 0.10 0.11 0.105 0.105 0.70 0.12 0.12 0.120 0.120 0.75 0.14 0.13 0.135 0.135 0.79 0.18 0.20 0.190 0.190 0.85 0.73 0.82 0.775 0.775

174
B.1.5 Coconut oil + 30% Sugar + 0.5% Lecithin
The moisture content data obtained for coconut oil containing 30% sugar in
coconut oil +0.5% lecithin is shown in Table B–5.
B.2 Diffusion Coefficients
B.2.1 Coconut Oil and Coconut Oil + 0.5% Lecithin
The weight loss data and diffusivity through coconut oil and coconut oil + 0.5%
lecithin is shown in Table B–6.
Table B–4: Equilibrium moisture content of cocoa powder at different water activities Water Activity
Sorption Set 1 Set 2 Average
Desorption Set 1 Set 2 Average
0.11 4.40 3.86 4.13 6.30 5.21 5.750.33 6.68 6.76 6.72 7.94 8.65 8.290.54 8.53 8.39 8.46 9.45 10.74 10.100.70 9.72 10.19 9.95 11.21 11.46 11.330.75 11.41 10.89 11.15 12.34 12.20 12.270.79 11.64 12.44 12.04 12.90 13.23 13.060.85 13.43 14.96 14.20 13.43 14.96 14.20
Table B–5: Equilibrium moisture content for a coating containing 30% sugar in coconut oil + 0.5% lecithin Water Activity Moisture Content (%db)
Set 1 Set 2 Average Moisture Content
0.11 0.180 0.205 0.193 0.33 0.236 0.170 0.203 0.75 0.272 0.251 0.262 0.85 1.033 1.521 1.277
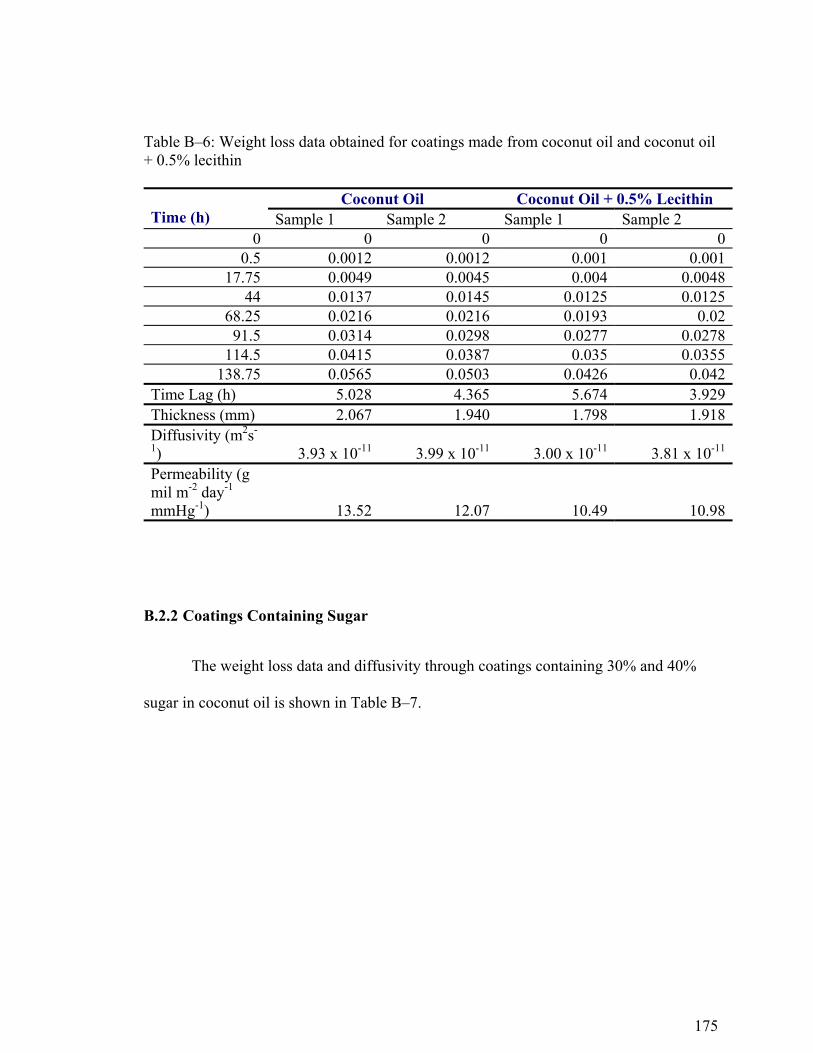
175
B.2.2 Coatings Containing Sugar
The weight loss data and diffusivity through coatings containing 30% and 40%
sugar in coconut oil is shown in Table B–7.
Table B–6: Weight loss data obtained for coatings made from coconut oil and coconut oil + 0.5% lecithin
Coconut Oil Coconut Oil + 0.5% Lecithin Time (h) Sample 1 Sample 2 Sample 1 Sample 2
0 0 0 0 00.5 0.0012 0.0012 0.001 0.001
17.75 0.0049 0.0045 0.004 0.004844 0.0137 0.0145 0.0125 0.0125
68.25 0.0216 0.0216 0.0193 0.0291.5 0.0314 0.0298 0.0277 0.0278
114.5 0.0415 0.0387 0.035 0.0355138.75 0.0565 0.0503 0.0426 0.042
Time Lag (h) 5.028 4.365 5.674 3.929Thickness (mm) 2.067 1.940 1.798 1.918Diffusivity (m2s-
1) 3.93 x 10⁻¹¹ 3.99 x 10⁻¹¹ 3.00 x 10⁻¹¹ 3.81 x 10⁻¹¹
Permeability (g mil m-2 day-1 mmHg-1) 13.52 12.07 10.49 10.98

176
B.2.3 Coatings Containing Sugar and Lecithin
The weight loss data and diffusivity through coatings containing 30% and 40%
sugar in coconut oil + 0.5% lecithin is shown in Table B–8 - B–10.
Table B–7: Weight loss data obtained for coatings containing 30% and 40% sugar in coconut oil. These data were obtained when the relative humidity on the higher humidity side was 75%
30% sugar 40% sugar Time (h) Sample 1 Sample 2 Sample 1 Sample 2
0 0 0 0 023.67 0.0037 0.0047 0.0031 0.004444.17 0.008 0.0089 0.0071 0.009472.42 0.0138 0.0158 0.0125 0.015893.67 0.018 0.0219 0.0174 0.0225
114.67 0.0232 0.0273 0.0216 0.0276Time Lag (h) 7.453 10.957 10.645 9.521
Thickness (mm) 1.803 2.047 1.910 1.743Diffusivity (m2s-1) 2.02 x 10⁻¹¹ 1.77x 10⁻¹¹ 1.59x 10⁻¹¹ 1.48 x 10⁻¹¹
Permeability (g mil m-2 day-1
mmHg-1) 7.99 11.18 10.41 7.51

177
Table B–8: Weight loss versus time data for coatings containing 30% sugar in coconut oil + 0.5% lecithin. These data were obtained when the relative humidity on the higher humidity side was 85%
Sample 1 Sample 2 Time (h) Weight loss (g) Time (h) Weight loss (g)
0 0 0 0 2 0.0005 0.5 0.0003 4 0.001 3.67 0.0016
6.08 0.0013 12.92 0.0054 9 0.002 19.42 0.0079
12.5 0.0046 26.58 0.013 16 0.0051 36.82 0.0192
23.75 0.009 46.82 0.0242 33 0.0163 61.82 0.0379
39.58 0.0205 75.58 0.0505 51.5 0.0332 86.15 0.067
59.83 0.0436 95.42 0.0816 71.5 0.0602 112.17 0.1246
129.83 0.1754 157.67 0.2668
Time Lag (h) 17.968 11.907 Thickness (mm) 1.790 1.942
Diffusivity (m2s-1) 8.26 x 10⁻¹² 1.47 x 10⁻¹¹ Permeability (g
mil m-2 day-1 mmHg-1) 37.27 29.10

178
Table B–9: Weight loss versus time data for coatings containing 40% sugar in coconut oil + 0.5% lecithin. These data were obtained when the relative humidity on the higher humidity side was 85%. Time (h) Sample 1 Sample 2
0 0 020 0.0056 0.0052
42.25 0.0137 0.012468 0.0271 0.0238
93.17 0.046 0.0404117.82 0.0678 0.057
Time Lag (h) 26.524 24.326Thickness (mm) 2.045 2.048
Diffusivity (m2s-1) 7.3 x 10⁻¹² 7.98 x 10⁻¹²
Permeability (g mil m-2 day-1
mmHg-1) 26.65 22.16
Table B–10: Weight loss versus time data for coatings containing 30% sugar in coconut oil + 0.5% lecithin. These data were obtained when the relative humidity on the higher humidity side was 75%
30% sugar 40% sugar Time (h) Sample 1 Sample 2 Sample 1 Sample 2
0 0 0 0 022.67 0.0079 0.0077 0.01 0.005944.17 0.0337 0.0233 0.0205 0.019666.66 0.0814 0.0466 0.0403 0.042993.5 0.1495 0.0782 0.069 0.0753115 0.1882 0.1075 0.0962 0.105162 0.3098 0.1739 0.1704 0.1901
Time Lag (h) 32.492 33.770 41.116 42.994Thickness (mm) 2.0925 1.9775 2.0025 1.9325
Diffusivity (m2s-1) 6.24 x 10⁻¹² 5.36 x 10⁻¹² 4.52 x 10⁻¹² 4.02 x 10⁻¹²
Permeability (g mil m-2 day-1
mmHg-1) 103.13 55.23 57.34 62.56

179
B.2.4 Coatings Containing Cocoa Powder
The weight loss data and diffusivity through coatings containing cocoa powder in
coconut oil is shown in Tables B–11 - B–14.
Table B–11: Weight loss versus time for coatings containing 2.5% cocoa powder in coconut oil
Time (h) Sample 1 0 0
15.17 0.008625.5 0.0135
39 0.022951.25 0.031
Time Lag (h) 2.638Thickness (mm) 0.805
Diffusivity (m2s-1) 1.14 x 10⁻¹¹
Permeability (g mil m-2 day-1 mmHg-1) 10.91

180
Table B–12: Weight loss versus time for coatings containing 20% cocoa powder in coconut oil
Sample 1 Sample 2 Time (h) Weight loss (g) Time (h) Weight loss (g)
0 0 0 0 2.17 0 7 0.0052 7.58 0.0013 13.5 0.0067 22.5 0.008 27 0.0125
33 0.0149 35 0.015 45.58 0.0246 50 0.0239
57 0.0327 57.5 0.0268 70.42 0.0425 72 0.0361
83 0.0422 97.75 0.0517 105 0.0556 122.83 0.0668 147.5 0.0805
Time Lag (h) 17.968 11.907 Thickness (mm) 0.723 0.750
Diffusivity (m2s-1) 2.09 x 10⁻¹² 2.17 x 10⁻¹¹ Permeability (g
mil m-2 day-1 mmHg-1) 11.038 9.16
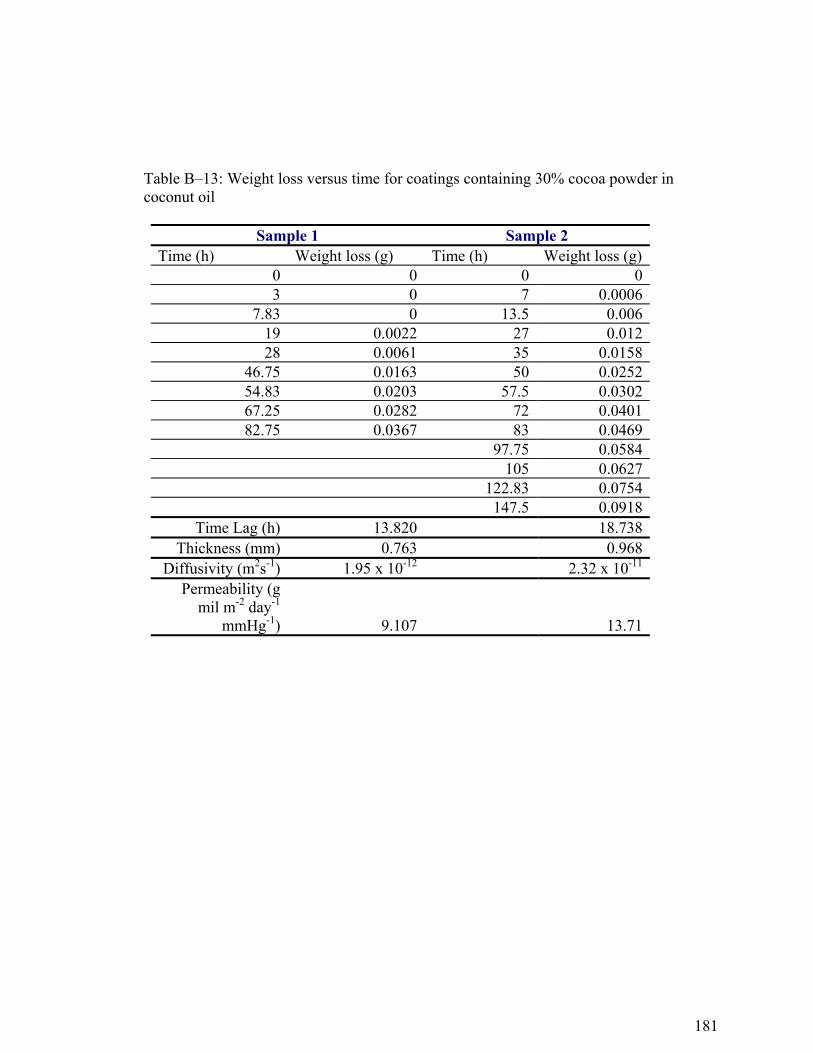
181
Sample 1 Sample 2 Time (h) Weight loss (g) Time (h) Weight loss (g)
0 0 0 0 3 0 7 0.0006
7.83 0 13.5 0.006 19 0.0022 27 0.012 28 0.0061 35 0.0158
46.75 0.0163 50 0.0252 54.83 0.0203 57.5 0.0302 67.25 0.0282 72 0.0401 82.75 0.0367 83 0.0469
97.75 0.0584 105 0.0627 122.83 0.0754 147.5 0.0918
Time Lag (h) 13.820 18.738 Thickness (mm) 0.763 0.968
Diffusivity (m2s-1) 1.95 x 10⁻¹² 2.32 x 10⁻¹¹ Permeability (g
mil m-2 day-1 mmHg-1) 9.107 13.71
Table B–13: Weight loss versus time for coatings containing 30% cocoa powder in coconut oil
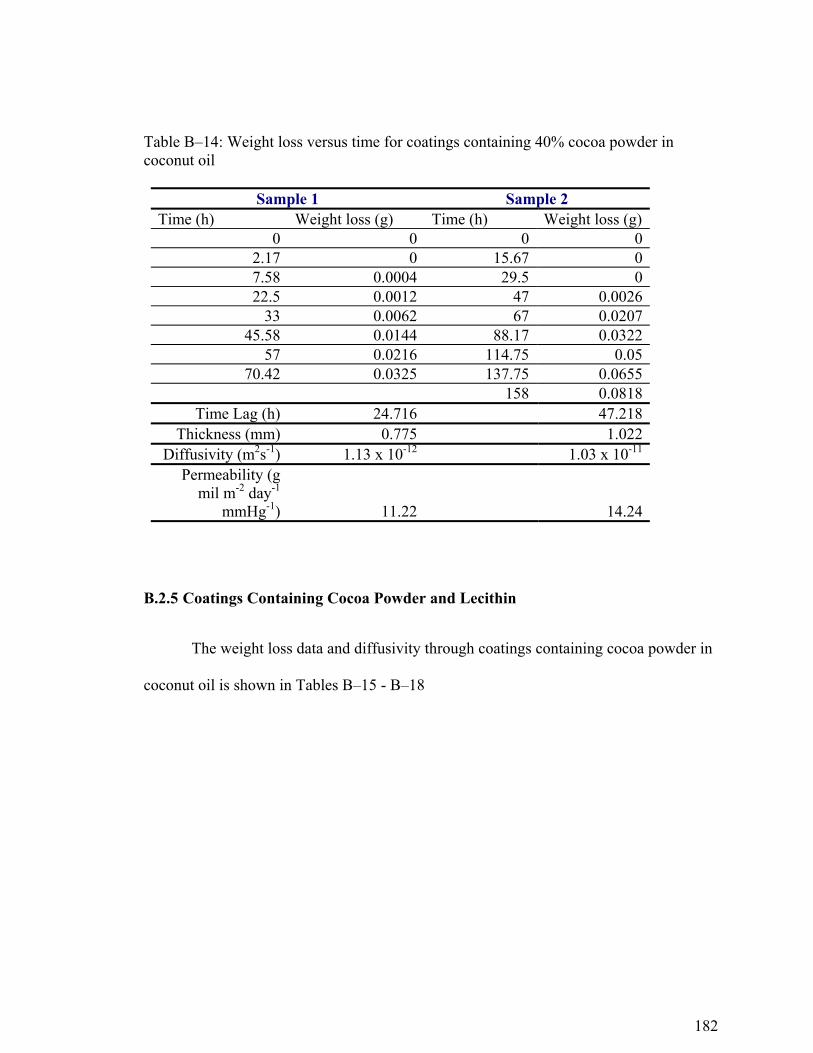
182
B.2.5 Coatings Containing Cocoa Powder and Lecithin
The weight loss data and diffusivity through coatings containing cocoa powder in
coconut oil is shown in Tables B–15 - B–18
Table B–14: Weight loss versus time for coatings containing 40% cocoa powder in coconut oil
Sample 1 Sample 2 Time (h) Weight loss (g) Time (h) Weight loss (g)
0 0 0 0 2.17 0 15.67 0 7.58 0.0004 29.5 0 22.5 0.0012 47 0.0026
33 0.0062 67 0.0207 45.58 0.0144 88.17 0.0322
57 0.0216 114.75 0.05 70.42 0.0325 137.75 0.0655
158 0.0818 Time Lag (h) 24.716 47.218
Thickness (mm) 0.775 1.022 Diffusivity (m2s-1) 1.13 x 10⁻¹² 1.03 x 10⁻¹¹
Permeability (g mil m-2 day-1
mmHg-1) 11.22 14.24

183
Table B–15: Weight loss versus time for coatings containing 20% cocoa powder in coconut oil and 0.5% lecithin
Time (h) Sample 1 Sample 2 0 0 0
15.17 0.0049 0.005625.5 0.0086 0.0088
39 0.0142 0.014651.25 0.0185 0.0194
Time Lag (h) 2.455 1.61Thickness (mm) 0.817 0.742
Diffusivity (m2s-1) 1.26 x 10⁻¹¹ 1.59 x 10⁻¹¹
Permeability (g mil m-2 day-1
mmHg-1) 6.69 6.20

184
Table B–16: Weight loss versus time for coatings containing 20% cocoa powder in coconut oil and 0.5% lecithin
Sample 1 Sample 2 Time (h) Weight loss (g) Time (h) Weight loss (g)
0 0 0 0 14.92 0.0062 7 0.0068 25.42 0.0131 13.5 0.0096
38 0.023 27 0.017 49.42 0.0321 35 0.0214 62.84 0.0441 50 0.0322
57.5 0.0375 72 0.0484 83 0.0564 97.75 0.0689 105 0.0742 122.83 0.0895 147.5 0.1103
Time Lag (h) 9.936 14.126 Thickness (mm) 0.770 0.952
Diffusivity (m2s-1) 2.76 x 10⁻¹² 2.97 x 10⁻¹¹ Permeability (g
mil m-2 day-1 mmHg-1) 13.13 15.85

185
Table B–17: Weight loss versus time for coatings containing 30% cocoa powder in coconut oil and 0.5% lecithin
Sample 1 Sample 2 Time (h) Weight loss (g) Time (h) Weight loss (g)
0 0 0 0 2.17 0 3 0 7.58 0 7.83 0.0003 22.5 0.0115 19 0.0055
33 0.0219 28 0.013 45.58 0.0356 46.75 0.0271
57 0.0471 54.83 0.0337 70.42 0.0617 67.25 0.0426
82.75 0.0541 Time Lag (h) 12.233 10.031
Thickness (mm) 0.874 0.785 Diffusivity (m2s-1) 2.89 x 10⁻¹² 2.84 x 10⁻¹¹
Permeability (g mil m-2 day-1
mmHg-1) 19.22 12.14

186
Table B–18: Weight loss versus time for coatings containing 40% cocoa powder in coconut oil and 0.5% lecithin Time (h) Sample 1 Sample 2 Time (h) Sample 3
0 0 0 0 015.67 0 0.0002 3 029.5 0.0028 0.0002 7.83 0.0002
47 0.0136 0.0124 19 0.000267 0.0667 0.0678 28 0.0046
88.17 0.1011 0.1023 46.75 0.0193114.75 0.1532 0.1582 54.83 0.0269137.75 0.2009 0.2128 67.25 0.0401
158 0.2528 0.2672 82.75 0.0584Time Lag (h) 42.529 46.052 29.716
Thickness (mm) 0.842 1.063 1.005Diffusivity (m2s-1) 7.72 x 10⁻¹³ 1.14x 10⁻¹² 1.57 x 10⁻¹²
Permeability (g mil m-2 day-1
mmHg-1) 35.59 48.49 22.76

187
Figure B–1: Adsorption of lecithin on sugar at water activities > 0.8. Model proposed by Garbolino (2002)

Appendix C
WATER VAPOR PERMEABILITY DATA
The raw data on weight gain obtained for the WVTR experiments and SEM
pictures are given in this appendix. The WVTR is calculated using the equation C.1
daymg
AslopeWVTR 2= ( C.1 )
where A is the area of the coating (m2) and slope is the slope of the straight line portion
of the plot of weight gain versus time. The water vapor permeability (WVP) was
calculated using equation C.2.
mmHgdaymmilg
pxWVTRWVP 2∆
ƥ= ( C.2 )
where ∆x is the thickness of the coating (mil) and ∆p is the vapor pressure difference
(mm Hg). The equilibrium relative humidity above the calcium chloride particles was
found to be 3.5%. Hence, in the calculations the relative humidity at the low humidity
end was taken as 3.5%. The vapor pressure at the high humidity end was obtained using
the average temperature and humidity during the experiment. The temperature and
humidity information was obtained from the data logger. The exposed area of the coating
was 46 cm2.

189
C.1 Effect of Coating Thickness
The WVTR and permeability data for a generic coating at 17oC are shown in
Table C–1.
Table C–1: Weight gain versus time data at 17oC for coatings with different thickness and its effect on water vapor permeability.
Time (h) Sample 1 Sample 2 Sample 3 Sample 4 0 0 0 0 0
26.33 0.0545 0.0592 0.0545 0.059247.3 0.0724 0.0783 0.0724 0.0783
73 0.0873 0.0936 0.0873 0.093697.25 0.098 0.1047 0.098 0.1047
124 0.1079 0.1147 0.1079 0.1147144 0.1186 0.1256 0.1186 0.1256169 0.127 0.1327 0.127 0.1327
192.33 0.1374 0.1422 0.1374 0.1422222.42 0.1427 0.1496 0.1427 0.1496239.58 0.1463 0.156 0.1463 0.156
263 0.1536 0.1627 0.1536 0.1627294.42 0.1587 0.1669 0.1587 0.1669
313 0.1649 0.1731 0.1649 0.1731Thickness (mm) 2.014 2.012 0.880 0.808WVTR (g m-2 day-1) 0.96 1.34 2.24 2.46Permeability (g mil m-2 day-1 mmHg-1) 7.44 8.80 7.60 7.68

190
C.2 Mixture Experiment
The WVTR and permeability data for the mixture experiments are shown in
Tables C–2- C–21. The permeability data for the mixture experiments were obtained at
20oC.
Table C–2: Weight gain versus time obtained for coating made from trial 1 formulation Time (h) Sample 1 Sample 2
0 0 028 0.0469 0.0408
52.33 0.0666 0.06174.75 0.0793 0.077599.33 0.0915 0.0905
120 0.1043 0.0998145.25 0.115 0.112
Thickness (mm) 1.30 1.41WVTR (g m-2 day-1) 2.688 2.536Permeability (g mil m-2 day-
1 mmHg-1) 10.95 11.23
Table C–3: Weight gain versus time obtained for coating made from trial 2 formulation Time (h) Sample 1 Sample 2
0 0 012 0.0056 0.009824 0.0124 0.011336 0.017 0.018148 0.0282 0.026260 0.0329 0.030472 0.0406 0.038384 0.0474 0.046996 0.0538 0.052
Thickness (mm) 0.985 1.017WVTR (g m-2 day-1) 2.856 2.961Permeability (g mil m-2 day-
1 mmHg-1) 9.50 10.17
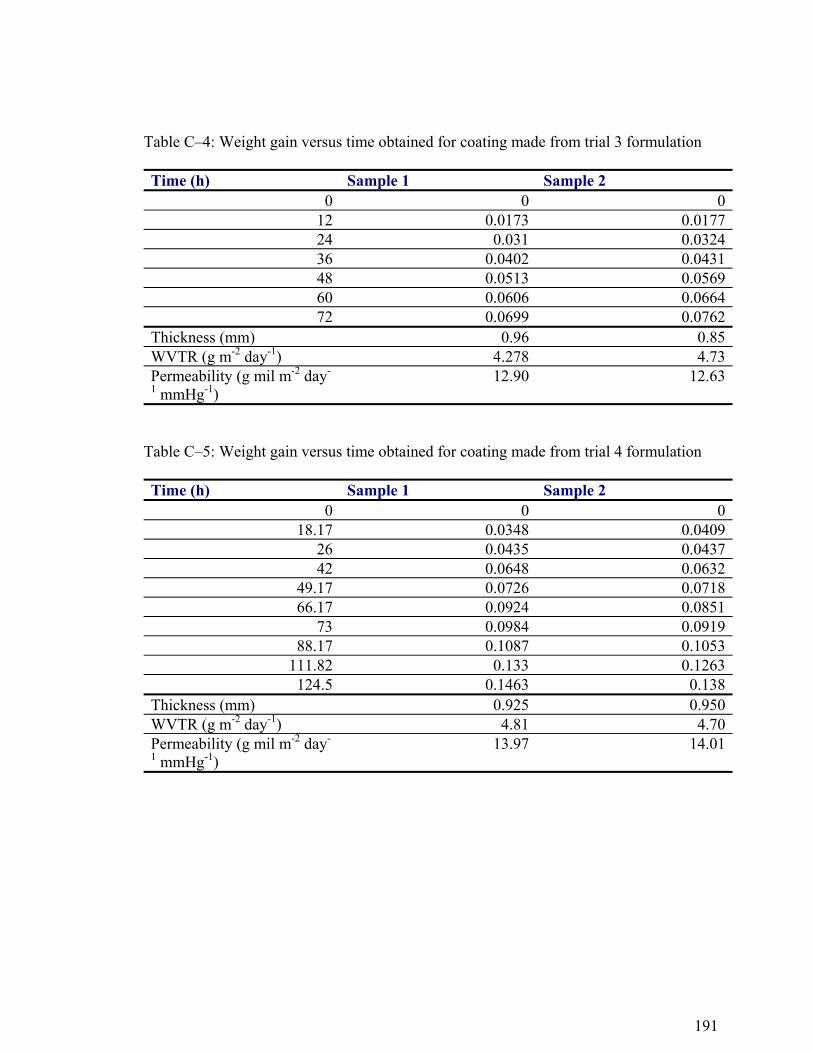
191
Table C–4: Weight gain versus time obtained for coating made from trial 3 formulation Time (h) Sample 1 Sample 2
0 0 012 0.0173 0.017724 0.031 0.032436 0.0402 0.043148 0.0513 0.056960 0.0606 0.066472 0.0699 0.0762
Thickness (mm) 0.96 0.85WVTR (g m-2 day-1) 4.278 4.73Permeability (g mil m-2 day-
1 mmHg-1) 12.90 12.63
Table C–5: Weight gain versus time obtained for coating made from trial 4 formulation Time (h) Sample 1 Sample 2
0 0 018.17 0.0348 0.0409
26 0.0435 0.043742 0.0648 0.0632
49.17 0.0726 0.071866.17 0.0924 0.0851
73 0.0984 0.091988.17 0.1087 0.1053
111.82 0.133 0.1263124.5 0.1463 0.138
Thickness (mm) 0.925 0.950WVTR (g m-2 day-1) 4.81 4.70Permeability (g mil m-2 day-
1 mmHg-1) 13.97 14.01

192
Table C–6: Weight gain versus time obtained for coating made from trial 5 formulation Time (h) Sample 1 Sample 2
0 0 012 0.0118 0.012824 0.0217 0.024636 0.0304 0.03148 0.0398 0.0460 0.0424 0.045372 0.0498 0.054584 0.0548 0.060496 0.0624 0.0668
108 0.0657 0.0727Thickness (mm) 1.19 1.06WVTR (g m-2 day-1) 2.404 2.652Permeability (g mil m-2 day-
1 mmHg-1) 8.99 8.83
Table C–7: Weight gain versus time obtained for coating made from trial 6 formulation Time (h) Sample 1 Sample 2
0 0 012 0.0207 0.020824 0.0316 0.031936 0.0386 0.040948 0.0498 0.05160 0.0581 0.057372 0.0671 0.067684 0.0784 0.077796 0.0824 0.0836
108 0.0943 0.0906120 0.1006 0.1016132 0.1068 0.1093
Thickness (mm) 0.962 0.977WVTR (g m2 day-1) 3.49 3.46WVTR (g m-2 day-1) 10.57 10.64Permeability (g mil m-2 day-
1 mmHg-1)

193
Table C–8: Weight gain versus time obtained for coating made from trial 7 formulation Time (h) Sample 1 Sample 2
0 0 018.42 0.0209 0.01847.17 0.048 0.039362.83 0.0621 0.051273.5 0.0724 0.0585
87 0.0729 0.0655Thickness (mm) 0.90 0.96WVTR (g m2 day-1) 4.86 3.84WVTR (g m-2 day-1) 13.75 11.62Permeability (g mil m-2 day-
1 mmHg-1)
Table C–9: Weight gain versus time obtained for coating made from trial 8 formulation Time (h) Sample 1 Sample 2
0 0 012 0.0207 0.020824 0.0316 0.031936 0.0386 0.040948 0.0498 0.05160 0.0581 0.057372 0.0671 0.067684 0.0784 0.077796 0.0824 0.0836
108 0.0943 0.0906120 0.1006 0.1016132 0.1068 0.1093
Thickness (mm) 0.785 0.972WVTR (g m-2 day-1) 3.46 3.83Permeability (g mil m-2 day-
1 mmHg-1) 8.52 11.70
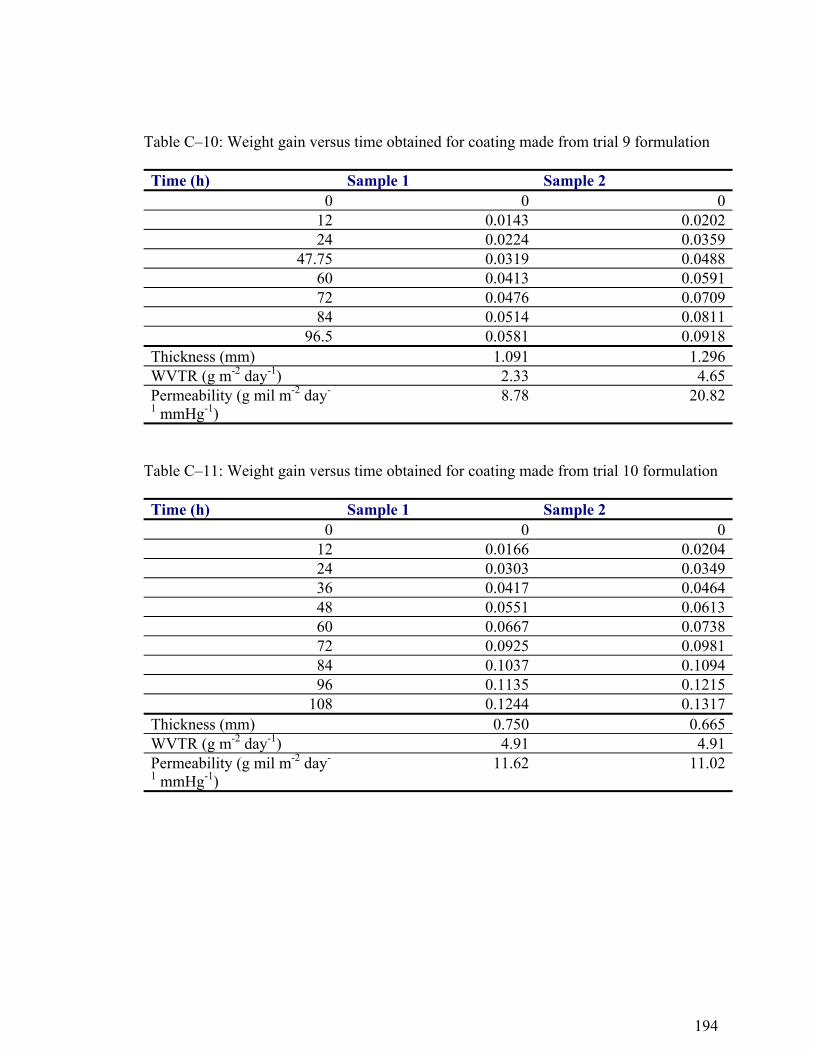
194
Table C–10: Weight gain versus time obtained for coating made from trial 9 formulation Time (h) Sample 1 Sample 2
0 0 012 0.0143 0.020224 0.0224 0.0359
47.75 0.0319 0.048860 0.0413 0.059172 0.0476 0.070984 0.0514 0.0811
96.5 0.0581 0.0918Thickness (mm) 1.091 1.296WVTR (g m-2 day-1) 2.33 4.65Permeability (g mil m-2 day-
1 mmHg-1) 8.78 20.82
Table C–11: Weight gain versus time obtained for coating made from trial 10 formulation Time (h) Sample 1 Sample 2
0 0 012 0.0166 0.020424 0.0303 0.034936 0.0417 0.046448 0.0551 0.061360 0.0667 0.073872 0.0925 0.098184 0.1037 0.109496 0.1135 0.1215
108 0.1244 0.1317Thickness (mm) 0.750 0.665WVTR (g m-2 day-1) 4.91 4.91Permeability (g mil m-2 day-
1 mmHg-1) 11.62 11.02
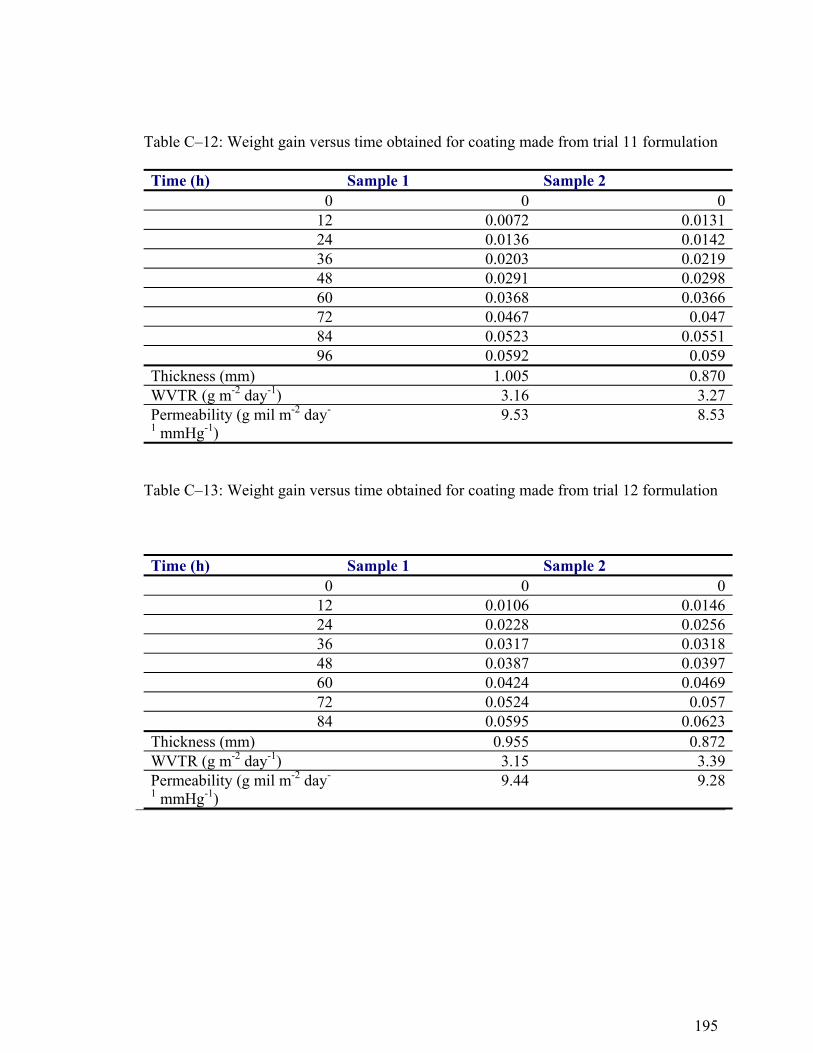
195
Table C–12: Weight gain versus time obtained for coating made from trial 11 formulation Time (h) Sample 1 Sample 2
0 0 012 0.0072 0.013124 0.0136 0.014236 0.0203 0.021948 0.0291 0.029860 0.0368 0.036672 0.0467 0.04784 0.0523 0.055196 0.0592 0.059
Thickness (mm) 1.005 0.870WVTR (g m-2 day-1) 3.16 3.27Permeability (g mil m-2 day-
1 mmHg-1) 9.53 8.53
Table C–13: Weight gain versus time obtained for coating made from trial 12 formulation
Time (h) Sample 1 Sample 2 0 0 0
12 0.0106 0.014624 0.0228 0.025636 0.0317 0.031848 0.0387 0.039760 0.0424 0.046972 0.0524 0.05784 0.0595 0.0623
Thickness (mm) 0.955 0.872WVTR (g m-2 day-1) 3.15 3.39Permeability (g mil m-2 day-
1 mmHg-1) 9.44 9.28

196
Table C–14: Weight gain versus time obtained for coating made from trial 13 formulation Time (h) Sample 1 Sample 2
0 0 012 0.0147 0.016224 0.0264 0.028236 0.0373 0.038548 0.0491 0.050760 0.0568 0.06172 0.0687 0.071784 0.0789 0.0811
Thickness (mm) 0.802 0.852WVTR (g m-2 day-1) 4.40 4.43Permeability (g mil m-2 day-
1 mmHg-1) 11.10 11.83
Table C–15: Weight gain versus time obtained for coating made from trial 14 formulation Time (h) Sample 1 Sample 2
0 0 012 0.0094 0.008524 0.0182 0.015536 0.0243 0.023648 0.0322 0.029860 0.0407 0.035872 0.0465 0.043
Thickness (mm) 0.86 0.96WVTR (g m-2 day-1) 3.26 2.92Permeability (g mil m-2 day-
1 mmHg-1) 8.82 8.80

197
Table C–16: Weight gain versus time obtained for coating made from trial 15 formulation
Sample 1 Sample 2 Time (h) Weight loss (g) Time (h) Weight loss (g)
0 0 0 028 0.0117 24.33 0.0341
52.33 0.0221 46.75 0.046274.75 0.0315 71.33 0.059599.33 0.0399 92 0.07
120 0.0479 117.25 0.0815145.25 0.0561
Thickness (mm) 1.417 1.244WVTR (g m-2 day-1) 1.84 2.61Permeability (g mil m-2 day-1 mmHg-1) 8.17 10.22
Table C–17: Weight gain versus time obtained for coating made from trial 1 formulation. Second replicate Time (h) Sample 1 Sample 2
0 0 012 0.0153 0.017424 0.026 0.0257
47.75 0.0363 0.032660 0.0432 0.0472 0.0512 0.049184 0.0568 0.0522
96.5 0.0646 0.0575Thickness (mm) 0.988 1.117WVTR (g m-2 day-1) 3.00 2.65Permeability (g mil m-2 day-
1 mmHg-1) 10.25 10.24

198
Table C–18: Weight gain versus time obtained for coating made from trial 2 formulation. Second replicate Time (h) Sample 1 Sample 2
0 0 012 0.0054 0.006824 0.0134 0.014236 0.0215 0.020648 0.0305 0.029
Thickness (mm) 0.932 0.967WVTR (g m-2 day-1) 3.63 3.17Permeability (g mil m-2 day-
1 mmHg-1) 11.41 10.37
Table C–19: Weight gain versus time obtained for coating made from trial 3 formulation. Second replicate Time (h) Sample 1 Sample 2
0 0 012 0.0189 0.015224 0.0325 0.0336 0.0437 0.036748 0.0569 0.045860 0.0676 0.054972 0.0827 0.070584 0.0975 0.0783
Thickness (mm) 0.912 0.805WVTR (g m-2 day-1) 5.15 3.64Permeability (g mil m-2 day-
1 mmHg-1) 15.88 9.91

199
Table C–20: Weight gain versus time obtained for coating made from trial 4 formulation. Second replicate
Sample 1 Sample 2 Time (h) Weight loss (g) Time (h) Weight loss (g)
0 0 0 018.17 0.0337 12 0.0156
26 0.0417 24 0.027942 0.058 36 0.0356
49.17 0.0665 48 0.047266.17 0.0798 60 0.0575
73 0.085 72 0.069988.17 0.0948 84 0.0803
111.82 0.1128 124.5 0.1244
Thickness (mm) 0.947 0.965WVTR (g m-2 day-1) 3.93 4.36Permeability (g mil m-2 day-1 mmHg-1) 11.69 14.23
Table C–21: Weight gain versus time obtained for coating made from trial 5 formulation. Second replicate Time (h) Sample 1 Sample 2
0 0 012 0.0167 0.018724 0.0298 0.034136 0.0392 0.044548 0.0505 0.05960 0.0598 0.067972 0.0714 0.078684 0.0768 0.086696 0.0866 0.0992
108 0.0957 0.1078Thickness (mm) 1.01 0.88WVTR (g m-2 day-1) 3.60 4.36Permeability (g mil m-2 day-
1 mmHg-1) 11.41 12.04

200
C.3 Effect of Ingredients
The effect of ingredients on the WVP was obtained at temperature of 18.5oC. The
data is shown in Tables C–22 - C–30.
Table C–22: Weight gain versus time obtained for a generic coating.(Set 1) Time (h) Sample 1 Sample 2
0 0 023 0.0153 0.0144
45.75 0.0286 0.02679.5 0.0531 0.0486
102.66 0.0667 0.0627123.67 0.0792 0.0777
Thickness (mm) 0.87 0.92WVTR (g m-2 day-1) 3.43 3.21Permeability (g mil m-2 day-
1 mmHg-1) 10.83 10.73
Table C–23: Weight gain versus time obtained for a generic coating.(Set 2) Time (h) Sample 3 Sample 4
0 0 023 0.0158 0.0104
45.75 0.0287 0.020279.5 0.0548 0.0374
102.66 0.0696 0.0511123.67 0.085 0.0652
Thickness (mm) 0.745 0.957WVTR (g m-2 day-1) 3.60 2.66Permeability (g mil m-2 day-
1 mmHg-1) 9.74 9.25

201
Table C–24: Weight gain versus time obtained for a generic coating.(Set 3) Time (h) Sample 5 Sample 6
0 0 019.83 0.026 0.026543.17 0.045 0.04765.75 0.0651 0.065288.58 0.0823 0.0812
115.43 0.1022 0.1024138.83 0.1216 0.1209162.25 0.1385 0.1353
Thickness (mm) 0.928 0.928WVTR (g m-2 day-1) 4.01 3.86Permeability (g mil m-2 day-
1 mmHg-1) 12.21 11.76
Table C–25: Weight gain versus time obtained for a generic coating.(Set 4) Time (h) Sample 7
0 026.33 0.053347.33 0.075372.83 0.0979
97 0.116123.83 0.1321143.67 0.1395
169 0.1538193 0.1679
222.83 0.1841246.17 0.1965263.58 0.2037
294 0.2221315.33 0.2313
Thickness (mm) 1.085WVTR (g m-2 day-1) 2.72Permeability (g mil m-2 day-
1 mmHg-1) 10.19
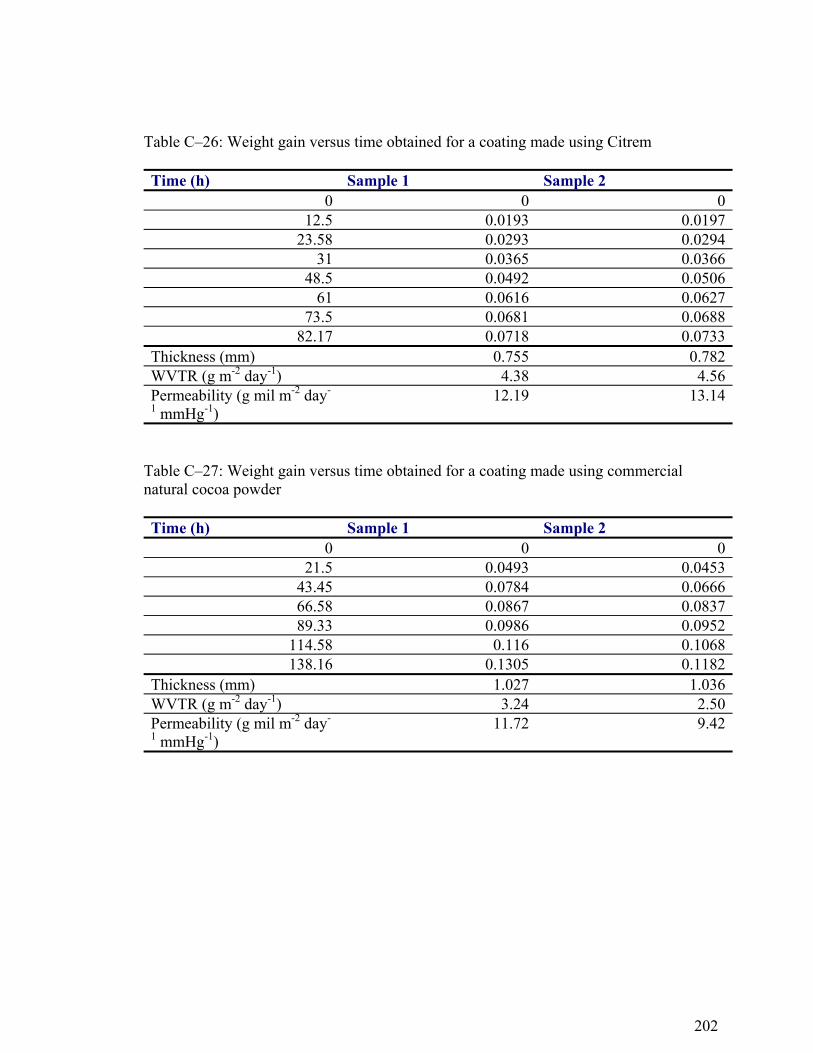
202
Table C–26: Weight gain versus time obtained for a coating made using Citrem Time (h) Sample 1 Sample 2
0 0 012.5 0.0193 0.0197
23.58 0.0293 0.029431 0.0365 0.0366
48.5 0.0492 0.050661 0.0616 0.0627
73.5 0.0681 0.068882.17 0.0718 0.0733
Thickness (mm) 0.755 0.782WVTR (g m-2 day-1) 4.38 4.56Permeability (g mil m-2 day-
1 mmHg-1) 12.19 13.14
Table C–27: Weight gain versus time obtained for a coating made using commercial natural cocoa powder Time (h) Sample 1 Sample 2
0 0 021.5 0.0493 0.0453
43.45 0.0784 0.066666.58 0.0867 0.083789.33 0.0986 0.0952
114.58 0.116 0.1068138.16 0.1305 0.1182
Thickness (mm) 1.027 1.036WVTR (g m-2 day-1) 3.24 2.50Permeability (g mil m-2 day-
1 mmHg-1) 11.72 9.42

203
Table C–28: Weight gain versus time obtained for a coating made using commercial alkalized cocoa powder Time (h) Sample 1 Sample 2
0 0 021.5 0.0918 0.0612
43.45 0.1139 0.102566.58 0.1222 0.123689.33 0.1357 0.1327
114.58 0.1584 0.1523138.16 0.1715 0.1743
Thickness (mm) 0.815 0.787WVTR (g m-2 day-1) 3.71 3.74Permeability (g mil m-2 day-
1 mmHg-1) 10.67 10.37
Table C–29: Weight gain versus time obtained for a coating made using lactose Time (h) Sample 1 Sample 2
0 0 07.5 0.0174 0.0156
21.5 0.0301 0.02931.67 0.0385 0.037245.83 0.049 0.048355.67 0.0563 0.0547
70 0.0648 0.0645Thickness (mm) 0.842 0.963WVTR (g m-2 day-1) 3.98 3.95Permeability (g mil m-2 day-
1 mmHg-1) 11.82 13.41

204
C.3.1 Effect of Solid Fat Content on Water Vapor Permeability
The weight gain versus time data for different fats are shown in Tables C–31- C–
36. The SFC of each fat was also determined at the temperature at which the experiment
was conducted.
Table C–30: Weight gain versus time obtained for a coating made using dextrose Time (h) Sample 1 Sample 2
0 0 07.5 0.0193 0.0165
21.5 0.0338 0.030731.67 0.0429 0.041545.83 0.0541 0.05355.67 0.0617 0.0606
70 0.072 0.0709Thickness (mm) 0.925 1.000WVTR (g m-2 day-1) 4.24 4.52Permeability (g mil m-2 day-
1 mmHg-1) 13.83 15.93
Table C–31: Weight gain versus time obtained for the AARHUSTM fat coating Time (h) Sample 1 Sample 2
0 0 015.58 0.013 0.011726.58 0.0231 0.0204
38 0.0329 0.029950.5 0.045 0.0397
63.25 0.0582 0.0495Thickness (mm) 0.887 1.013WVTR (g m-2 day-1) 4.92 4.15Permeability (g mil m-2 day-
1 mmHg-1) 15.06 14.53
Note: Average temperature during the experiment was 19.6 oC. The SFC of the coating at 20oC was 25.2

205
Table C–32: Weight gain versus time obtained for the Victory-76 fat coating Time (h) Sample 1 Sample 2
0 0 015.58 0.0119 0.012926.58 0.0207 0.021
38 0.0274 0.027850.5 0.036 0.0371
63.25 0.0471 0.0482Thickness (mm) 0.813 0.834WVTR (g m-2 day-1) 3.75 3.80Permeability (g mil m-2 day-
1 mmHg-1) 10.54 10.91
Note: Average temperature during the experiment was 19.6 oC. The SFC of the coating at 20oC was 35.1
Table C–33: Weight gain versus time obtained for the Karlshamns fat coating Time (h) Sample 1 Sample 2
0 0 030.35 0.0072 0.010852.75 0.0118 0.017276.33 0.0172 0.0233122.5 0.0263 0.0336
171 0.0373 0.0484236.25 0.0525 0.0653306.42 0.0653 0.0823
Thickness (mm) 0.852 0.893WVTR (g m-2 day-1) 1.08 1.30Permeability (g mil m-2 day-
1 mmHg-1) 3.36 4.27
Note: Average temperature during the experiment was 18.9 oC. The SFC of the coating at 18.5oC was 46.3

206
Table C–34: Weight gain versus time obtained for the DP1192 fat coating Time (h) Sample 1 Sample 2
0 0 025.5 0.0001 0.0002
55 0.0028 0.001884.33 0.0032 0.0027
126 0.0065 0.0046144.17 0.0074 0.0056171.5 0.0105 0.0086
196.25 0.0125 0.0088288.67 0.0139 0.0226415.17 0.0278 0.0415504.75 0.0384 0.0551633.17 0.0521 0.0741718.25 0.0689 0.0868
Thickness (mm) 0.983 0.982WVTR (g m-2 day-1) 0.68 0.78Permeability (g mil m-2 day-
1 mmHg-1) 2.69 3.06
Note: The average temperature during the experiment was 16.5 oC. The SFC of the fat at 16.5oC was 68%.

207
Table C–35: Weight gain versus time obtained for the DP1193 fat coating Time (h) Sample 1 Sample 2
0 0 025.5 0.0001 0.0002
55 0.0028 0.001884.33 0.0032 0.0027
126 0.0065 0.0046144.17 0.0074 0.0056171.5 0.0105 0.0086
196.25 0.0125 0.0088288.67 0.0139 0.0226415.17 0.0278 0.0415504.75 0.0384 0.0551633.17 0.0521 0.0741718.25 0.0689 0.0868
Thickness (mm) 0.983 0.982WVTR (g m-2 day-1) 0.68 0.78Permeability (g mil m-2 day-
1 mmHg-1) 2.69 3.06
Note: The average temperature during the experiment was 16.5 oC. The SFC of the fat at 16.5oC was 79.2%.
Table C–36: Weight gain versus time obtained for the DP1194 fat coating
Sample 1 Sample 2 Time (h) Weight loss (g) Time (h) Weight loss (g)
0 0 0 030.35 0.0037 46.17 0.010752.75 0.0061 94.25 0.023476.33 0.0097 160 0.0387122.5 0.0144 230.25 0.0528
171 0.0209 236.25 0.0291 306.42 0.0356
Thickness (mm) 1.038 0.643WVTR (g m-2 day-1) 0.60 1.19Permeability (g mil m-2 day-1 mmHg-1) 2.29 2.80
Note: The average temperature during the experiment was 18.9 oC. The SFC of the fat at 16.5oC was 68%.

208
C.4 Effect of Humidity on Water Vapor Permeability
The weight gain data for a generic coating subjected to different relative humidity
at the bottom of the cell is shown in Table C–37 and Table C–38.
Table C–37: Weight gain versus time for a generic coating when the humidity at the bottom of the cell was 33% Time (h) Sample 1 Sample 2
0 0 012 0.0409 0.037424 0.0572 0.052736 0.0634 0.06148 0.0693 0.068960 0.0772 0.07672 0.0834 0.079384 0.0891 0.0871
Thickness (mm) 0.945 0.988WVTR (g m-2 day-1) 2.85 2.52Permeability (g mil m-2 day-
1 mmHg-1) 12.88 11.88
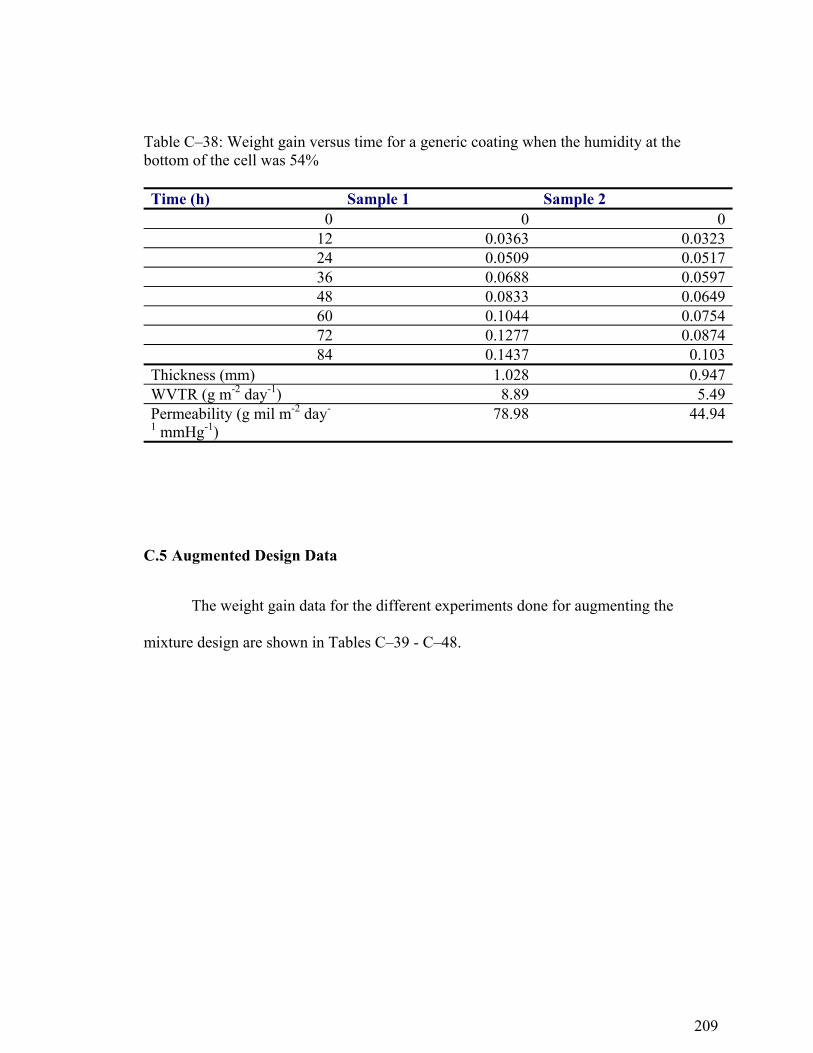
209
C.5 Augmented Design Data
The weight gain data for the different experiments done for augmenting the
mixture design are shown in Tables C–39 - C–48.
Table C–38: Weight gain versus time for a generic coating when the humidity at the bottom of the cell was 54% Time (h) Sample 1 Sample 2
0 0 012 0.0363 0.032324 0.0509 0.051736 0.0688 0.059748 0.0833 0.064960 0.1044 0.075472 0.1277 0.087484 0.1437 0.103
Thickness (mm) 1.028 0.947WVTR (g m-2 day-1) 8.89 5.49Permeability (g mil m-2 day-
1 mmHg-1) 78.98 44.94

210
Table C–39: Weight gain versus time for a coating made with 20% sugar and 80% coconut oil Time (h) Sample 1 Sample 2
0 0 023.33 0.0193 0.020236.17 0.029 0.031848.33 0.039 0.042263.58 0.0517 0.053774.82 0.0602 0.062587.33 0.0705 0.072899.67 0.0816 0.0829
110.33 0.0889 0.0908Thickness (mm) 0.755 0.772WVTR (g m-2 day-1) 4.23 4.17Permeability (g mil m-2 day-
1 mmHg-1) 10.05 10.15
Table C–40: Weight gain versus time for a coating made with 30% sugar and 70% coconut oil Time (h) Sample 1 Sample 2
0 0 023.33 0.0182 0.018536.17 0.0259 0.031548.33 0.0333 0.040463.58 0.0447 0.053274.82 0.0518 0.063187.33 0.0596 0.071899.67 0.0675 0.0808
110.33 0.0737 0.0853Thickness (mm) 0.972 0.835WVTR (g m-2 day-1) 3.25 3.61Permeability (g mil m-2 day-
1 mmHg-1) 9.95 9.50

211
Table C–41: Weight gain versus time for a coating made with 50% sugar, 49.5% coconut oil and 0.5% lecithin Time (h) Sample 1 Sample 2
0 0 014.25 0 0.0037
24 0.0035 0.004148 0.0124 0.013672 0.0206 0.020796 0.0287 0.0278
119.25 0.037 0.035141.58 0.0436 0.0414
Thickness (mm) 1.225 1.440WVTR (g m-2 day-1) 1.75 1.55Permeability (g mil m-2 day-
1 mmHg-1) 7.06 7.36
Table C–42: Weight gain versus time for a coating made with 60% sugar, 39.5% coconut oil and 0.5% lecithin Time (h) Sample 1 Sample 2
0 0 014.25 0.0061 0.0109
24 0.0125 0.017948 0.0184 0.024972 0.0246 0.031896 0.0308 0.0388
119.25 0.0367 0.0456141.58 0.0425 0.052
Thickness (mm) 1.35 1.24WVTR (g m-2 day-1) 1.342 1.513Permeability (g mil m-2 day-
1 mmHg-1) 5.95 6.16

212
Table C–43: Weight gain versus time for a coating made with 20% cocoa powder and 80% coconut oil Time (h) Sample 1 Sample 2
0 0 023.42 0.0693 0.068635.67 0.0789 0.0774
48 0.0909 0.08962.92 0.1042 0.103473.25 0.1143 0.110386.75 0.1292 0.124199.5 0.1401 0.1363
110.25 0.1499 0.1439Thickness (mm) 0.765 0.815WVTR (g m-2 day-1) 5.06 4.63Permeability (g mil m-2 day-
1 mmHg-1) 11.79 11.49
Table C–44: Weight gain versus time for a coating made with 30% cocoa powder and 70% coconut oil Time (h) Sample 1 Sample 2
0 0 023.42 0.0727 0.069235.67 0.0872 0.0855
48 0.0985 0.099962.92 0.1144 0.119673.25 0.1263 0.131286.75 0.1401 0.144499.5 0.1532 0.1606
110.25 0.1655 0.1723Thickness (mm) 0.747 0.69WVTR (g m-2 day-1) 5.56 5.82Permeability (g mil m-2 day-
1 mmHg-1) 12.67 12.22

213
Table C–45: Weight gain versus time for a coating made with 30% cocoa powder, 69.5% coconut oil, and 0.5% lecithin
Sample 1 Sample 2 Time (h) Weight loss (g) Time (h) Weight loss (g)
0 0 0 09.5 0.0142 7.42 0.0067
24.47 0.0337 21.83 0.027133.42 0.051 31.33 0.039945.75 0.0713 46.3 0.0605
55.25 0.0827 67.58 0.0976
Thickness (mm) 0.852 0.900WVTR (g m-2 day-1) 8.30 8.27Permeability (g mil m-2 day-1 mmHg-1) 21.79 22.94
Table C–46: Weight gain versus time for a coating made with 40% cocoa powder, 59.5% coconut oil, and 0.5% lecithin Time (h) Sample 1 Sample 2
0 0 07.42 0.0383 0.037
21.83 0.0737 0.075431.33 0.0906 0.087546.3 0.1192 0.1119
55.25 0.1377 0.135967.58 0.1577 0.1624
Thickness (mm) 0.990 0.905WVTR (g m-2 day-1) 9.72 10.02Permeability (g mil m-2 day-
1 mmHg-1) 29.64 27.04

214
C.6 Qualitative Study Pictures
The pictures of the coating after 14 weeks of storage are shown in Figures C–1 to C–5.
Table C–47: Weight gain versus time for a coating made with 50% sugar, 10% cocoa powder, 39.5% coconut oil, and 0.5% lecithin Time (h) Sample 1 Sample 2
0 0 012.25 0.0192 0.000324.5 0.0287 0.0096
32.33 0.0329 0.015246.75 0.0399 0.024361.67 0.0496 0.031269.17 0.053 0.0338
Thickness (mm) 1.097 1.142WVTR (g m-2 day-1) 2.88 2.83Permeability (g mil m-2 day-
1 mmHg-1) 9.74 9.98
Table C–48: Weight gain versus time for a coating made with 30% sugar, 30% cocoa powder, 39.5% coconut oil, and 0.5% lecithin Time (h) Sample 1 Sample 2
0 0 012.25 0.0287 0.041824.5 0.0491 0.0528
32.33 0.0626 0.063546.75 0.0762 0.081661.67 0.0908 0.099869.17 0.0997 0.1028
Thickness (mm) 1.055 1.012WVTR (g m-2 day-1) 5.64 6.57Permeability (g mil m-2 day-
1 mmHg-1) 18.35 20.53

215
Figure C–1: Coating with 50% cocoa powder after 14 weeks of storage at -5C

216
Figure C–2: Coating with 40% cocoa powder after 14 weeks of storage at -5C

217
Figure C–3: Coating with 30% cocoa powder after 14 weeks of storage at -5C

218
Figure C–4: Coating with 20% cocoa powder after 14 weeks of storage at -5C

219
Figure C–5: Coating with 20% sucrose after 14 weeks of storage at -5C

VITA
EDUCATION M. S. Food Science (December 1998), Pennsylvania State University B. Tech. (Honors) (July 1995), Agricultural Engineering, Indian Institute of Technology, Kharagpur, India EXPERIENCE Jul. 1999 – May 2003: Research Assistant, Department of Food Science, Pennsylvania
State University Sep. 1998 - May 1999: Stagaire, R&D, Nestle, Beauvais, France Aug. 1995 - Aug 1998: Research Assistant, Department of Food Science, Pennsylvania
State University PUBLICATIONS Ghosh, V. and Anantheswaran, R. C. 2001. Experimental setup for measuring the oxygen transmission rate of micro-perforated films. Journal of Food Process Engineering. 24: 113 – 133 Ghosh, V., Ziegler, G. R. and Anantheswaran, R. C. 2002. A review of fat, moisture and ethanol migration through chocolates. CRC reviews in Food Science and Nutrition. 42(6): 583 - 626 Ghosh, V., Floros, J. and Anantheswaran, R. C. 2003. Refrigerants. In Encyclopedia of Agricultural and Food Engineering Ghosh, V. and Anantheswaran, R. C. 2003. Unsteady State Heat Transfer. In Encyclopedia of Agricultural and Food Engineering PATENT Anantheswaran, R. C. and Ghosh, V. 2002. Rapid method to experimentally measure the gas permeability of micro-perforated films. US Patent No. 6, 422, 063 AWARDS
1. Graduate Fellowship, Food Packaging Division, IFT (2002). 2. Institute Silver Medal, Indian Institute of Technology (1995). 3. Part of the product development team that won the “Most Creative Product”
award in DMI.