moisture sorption isotherms of two herbs and
TRANSCRIPT

foods
Article
Validation of the Component Model for Prediction ofMoisture Sorption Isotherms of Two Herbs andother Products
Chiachung Chen
Department of Bio-industrial Mechatronics Engineering, National Chung Hsing University, 250 Kuokuang Road,Taichung 4022, Taiwan; [email protected]; Tel.: +886-4-22857562; Fax: +886-4-22857135
Received: 26 April 2019; Accepted: 30 May 2019; Published: 1 June 2019�����������������
Abstract: Sorption isotherm is an essential property for the processing of biological materials. Inthis study, a component model for the prediction of the sorption isotherm was evaluated. In orderto validate this component model, the moisture sorption isotherms for Chrysanthemum morifoliumflowers and the orchid Anoectochilus formosanus Hayata were determined. The sorption isothermwas measured by using the equilibrium relative humidity technique for five temperatures. Sevensorption isotherm models were selected with four quantitative criteria and residual plots to evaluatefitting ability and prediction performance for these products. The results indicated that the sorptiontemperature did not significantly affect the adsorption isotherm. The Caurie and Henderson equationscould be used for C. morifolium flowers and A. formosanus Hayata. The isotherm data of raw bamboo,elecampe and three varieties of corn kernels from the literature were adopted to validate the componentmodel. Comparing with the predicted values of component values and actual isotherm moisture,the component model has good predictive ability at the aw range smaller than 0.7. Considering thepractical application, the aw range below 0.7 is the main range for the processing of agriculturalproducts, and the predictive values of this component model could be helpful for food engineeringand for the food industry.
Keywords: sorption isotherms; component model; chrysanthemum morifolium; Anoectochilusformosanus hayata
1. Introduction
Living plants need to be processed after harvesting. Processing operations include drying,packaging, handling, and storing. The physical, chemical and biological conditions such as microbialgrowth of plant materials are affected by moisture content, temperature and relative humidity (RH) ofthe ambient environment and treatment methods [1,2].
At fixed temperatures and pressures, the relationship between the relative humidity (RH) ofambient air and moisture content is called sorption isotherm. The definition of the water activity (aw)is the ratio between the partial vapor pressure of water in the biological materials and the partial vaporpressure of pure water at the same temperature. The equilibrium relative humidity is called wateractivity in food science field. The sorption isotherm dictates the corresponding water content at thesame temperature for each humidity. Sorption isotherm properties include desorption and adsorptionaccording to the adsorption or dehydration of moisture content. The sorption isotherm is essentialinformation for the predicting drying and storage of materials. The design of packaging materials andthe method are also related to these properties.
There are several methods to determine the sorption isotherms of biological materials [1]. For thegravimetric method, the RH is maintained with different saturated salt solutions or sulphuric acid
Foods 2019, 8, 191; doi:10.3390/foods8060191 www.mdpi.com/journal/foods

Foods 2019, 8, 191 2 of 18
dilutions at different concentrations. The samples are enclosed in this RH environment at contenttemperature until its weight is balanced with ambient RH [3–5]. This equilibrium moisture content(EMC) method is simple, inexpensive and can be performed in most laboratories. However, theequilibrium time is longer, especially at higher RH. These samples could be contaminated if the ambientRH value is higher than 75 %. The other method is called the hygrometric or equilibrium relativehumidity method. The samples at a given moisture content and fixed temperature are placed in anenclosed container. The RH in the container is measured as the humidity environment reaches theequilibrate state [6–8]. The key points for this technique are the uniform moisture distribution ofsamples and the accuracy of the hygrometer.
Crapiste and Rotstein [9] predicted the sorption isotherms of potatoes based on the magnitudeand sorption properties of individual constituents. By equating the chemical potential of water in eachcomponent and that of water in the surrounding air, equations were derived to calculate the moisturecontent occupied by each component. In this study, their model was modified to calculate the sorptionisotherms of herbs.
Empirical models are useful to quantify the relationship between equilibrium moisture contentand equilibrium relative humidity of biological materials. Basu et al. [1] and Al-Muhtaseb et al. [10]provided a detail review of widely used sorption models.
Literature on moisture sorption isotherm for agricultural and food products is abundant. Bonnerand Kenney [11] reported the moisture sorption characteristics of energy sorghum, and Oyelade et al. [5]investigated maize flour. The EMC/aw properties of various plants with medical functions or industrialcrops were reported. Argyropoulos et al. [12] introduced the sorption isotherms of leaves andstems of lemon balm (Melissa officinalis. L), Bahloul et al. [13] examined Tunisian olive leaves(Oleu europaea L.), Choudbury et al. [14] investigated raw bamboo (Dendrocalamus longispathus) shootsand Ait Mohamed et al. [3] determined sorption properties of Gelidium sesquipedale. The EMC/aw dataof conidia of Beauveria bassiana (Balsam) Vuillemin was studied by Hong et al. [15].
The flower of C. morifolium, one of varieties for making chrysanthemum flower tea, is popularlyused as a medicine and is a healthy beverage. The anti-oxidation and anti-ischemia-reperfusion injuryaction have been shown proved with animal tests and clinic studies [16]. A. formosanus Hayata is a folkmedicine in Taiwan. According to studies by Shih et al. [17], this herb has anti-inflammation and liverprotection effects and could be used to treat hypertension, diabetes mellitus and tuberculosis.
The objectives of this study were to (1) determine the moisture adsorption behavior for threebiological products at five temperature by using the equilibrium relative humidity technique, and,(2) evaluate the fitting ability of six sorption isotherm models to describe the experimental data, (3)evaluate the predictive ability of the component model for two herbs and other agricultural products.
2. The Component Model
2.1. Development of the Component Model
There are six components are considered: protein, starch, fiber, oil, sugar, and ash. Sugars and ashwere combined as the vacuole component. The effect of oil component on the sorption isotherms isomitted due to its insignificance.
The total moisture content is:
Ht = Hv + Xf × Xf + Xs × Hs + Xp × Hp (1)
where Hi = the water content (g of water)Xi = the weight content (decimal)t, v, f, s and p denote the total materials, vacuole, fiber, starch, and protein.

Foods 2019, 8, 191 3 of 18
2.2. The Isotherm Equation of Each Component
2.2.1. The Vacuolar Component
The aw (water activity) values of the vacuolar component was calculated by the Ross equation [18],
aw v = aw g × aw s × aw a (2)
where aw g = the aw of glucoseaw s = the aw of sucroseaw a = the aw of ashesFrom the study of Crapiste and Rotstein [9],
aw g = Xg × 10ˆ(−0.858*(1 − Xg)ˆ2.0 (3)
aw s = Xs × 10ˆ(−2.772*(1 − Xs))ˆ2.0 (4)
aw a = Xa × 10ˆ(−0.716*(1 − Xa)ˆ2.0 (5)
where Xg, Xs and Xa are the water mole fractions of glucose, sucrose, and ashes.The water mole fraction can be calculated by:
Xwi =Xv
Xv + Wi·Ai(6)
Ai = Mw/Mi (7)
where Mw = The molecular mass (g/mol) of waterMi = The molecular mass (g/mol) of componentWi = The weight fraction of componentTherefore, Xg, Xs and Xa are calculated as follows:
Xg =Xv
Xv + 0.08326×Wglucose(8)
Xs =Xv
Xs + 0.08764×Wsucrose(9)
Xa =Xv
Xv + 0.16981×Washes(10)
aw and Xv can then be evaluated with Equations (2)–(10).
2.2.2. Fiber Component
The Kelsey correction equation [19] was used to express the relationship in the water-cellulose-moistair system.
aw fber = (X f − y
X f) × Exp(
0.16137X f + 0.43684
) (11)
y = (0.076 + X f − [(
(0.076 + X f
)2− 0.28546× x f )]
0.05
1.878(12)
The relationship for Xf and aw fber was computed by Equations (11) and (12).

Foods 2019, 8, 191 4 of 18
2.2.3. Starch Component
Original isotherm data for starch have been presented by Chung and Pfost [20]. The Hendersonequation was used to describe the relation of Xs and aw.
Xs = 18.19182 × (−ln(1 − aw)ˆ0.41181 (13)
2.2.4. Protein Component
Two sets of protein isotherm data were calculated and proposed [21].
Xp = 0.090614 × (−1n(aw)ˆ−0.62) (14)
For a given aw value, the moisture content of each component can be obtained. The relationshipbetween aw and moisture content of different herbs could be calculated.
3. Materials and Methods
3.1. Materials
The biological materials, used for this study was purchased at a local herb market, in Taichung,Taiwan. The initial moistures of C. Morifolium flower and A. formosanus Hayata were 2.05 % and 1.98 %(on dry basis), respectively.
The desired determination moisture content ranged from 2 % to 20 %, the moisture content forpackaging, storing, handling and processing. The samples were rewetted by adding predeterminingamount of the water to obtain the desire moisture content. The preparation followed the procedure ofShen and Chen [22]. Samples were mixed with water and stored in plastic containers. After mixing,samples were stored at 5 ◦C for two weeks to ensure uniform distribution of moisture content. Becauseof the lower storage temperature, no microbial growth was found during the two weeks’ storage.
3.2. Temperature and RH Sensors
The temperature and RH probes of the Shinyei THT-V2-112-73-A2 transmitter (Shinyei Technology,Kobe, Japan) was used. The specifications of this sensor are in Table 1.
Table 1. Specifications of the Shinyei THT-V2-112-73-A2 transmitter.
Specification Temperature Sensor RH Meter
Sensing element RTD Pt 100 Ohm Micro-molecule HP-MQOperating range 0–50 ◦C 10–100 % RH
Accuracy before calibrating ±0.5 ◦C ±2 % RHPrecision 0.1 ◦C 0.1 % RH
Accuracy after calibrating ±0.15 ◦C ±0.7 % RH
RH: relative humidity.
3.3. Calibration of Sensors
The temperature and RH transmitter was calibrated. The temperature sensing element wascalibrated by the TC-2000 temperature calibrator (Instutek AS, Scan-Sense AS, Bekkeveien 163, N-3173Vear, Norway) and the humidity sensing element was calibrated by several saturated salt solutions.The detail method included the saturated salts that were used, solution volume to air volume ratio andthe stable of the temperature were according to the requirement of Organization Internationale DeMetrologie Legale (OMIL) [23].

Foods 2019, 8, 191 5 of 18
3.4. The Equilibrium Relative Humidity Method
The moisture sorption isotherms of C. Morifolium C. flower, and A. formosanus Hayata atfive temperatures (i.e., 5 ◦C, 15 ◦C, 25 ◦C, 35 ◦C, and 45 ◦C) was determined by the equilibriumrelative humidity method. Samples of known moisture content were placed in a 350 mL container.RH/temperature probes were inserted into the containers and surrounded with samples. These sensorsand containers were placed in a temperature-controlled chamber. When the RH and temperaturewithin the sample containers reached the equilibrate state, RH and temperature were recorded. Thesamples were taken out and the moisture content was determined again. Then new samples andcontainers were placed into a temperature-controlled chamber for the next temperature level. Thereading of RH and temperature of these probes was transformed into actual values with pre-establishedequations to ensure measured accuracy. The set-up for the measurement is presented in Figure 1. Thistechnique has been used to determinate sorption isotherm for peanuts [6], sweet potato slices [24], peaseeds [25], Oolong tea [7] and autoclaved aerated concrete [8].Foods 2019, 8, x FOR PEER REVIEW 5 of 18
Transmitter
Container
Temp./RH probe
Samples
TemperatureController
Figure 1. Sketch of experimental set-up.
The moisture content of the samples was determined by using a drying oven at 105 °C for 24 h.
3.5. Moisture Sorption Isotherm Models
Seven sorption isotherm equations were used to evaluate the fitting ability and prediction
performance of sorption isotherms of C. Morifolium flower and A. formosanus Hayata at five
temperatures. These models are in Table 2. The statistical analysis involved linear and nonlinear
regression. The parameters were estimated with use of SigmaPlot v12.2 (SPSS Inc., Chicago, IL, USA).
Table 2. Moisture sorption isotherms models fitted to the sorption data.
Model Equations References
Henderson M = ��(− ln( 1 − aw)�� Henderson [26]
Chung-Pfost M = �� + �� ln(− ln aw ) Chung and Pfost [20]
Halsey M = �� �− 1
ln aw �
��
Halsey [27]
Oswin M = �� �a�
1 − aw �
��
Oswin [28]
White & Eirig M =1
�� + �� ∗ aw
Castillo et al. [29]
Caurie M = �����(�� ∗ aw ) Castillo et al. [29]
GAB
M =
� ∗ � ∗ � ∗ aw
(1 − � ∗ aw)(1 − � ∗ aw + � ∗ � ∗ aw) (Van der Berg, [30]
where a0, …, f0, a1, …, f1, A, B, and C are parameters of the equation, M is equilibrium moisture content
(%, dry basis), and aw is the water activity in decimal.
3.6. Comparison Criteria for Sorption Models
Four quantitative criteria were used.
a. The coefficient of determination (R2)
b. The standard error of the model (s)
Figure 1. Sketch of experimental set-up.
The moisture content of the samples was determined by using a drying oven at 105 ◦C for 24 h.
3.5. Moisture Sorption Isotherm Models
Seven sorption isotherm equations were used to evaluate the fitting ability and predictionperformance of sorption isotherms of C. Morifolium flower and A. formosanus Hayata at five temperatures.These models are in Table 2. The statistical analysis involved linear and nonlinear regression. Theparameters were estimated with use of SigmaPlot v12.2 (SPSS Inc., Chicago, IL, USA).
Table 2. Moisture sorption isotherms models fitted to the sorption data.
Model Equations References
Henderson M = a0(− ln(1− aw)a1 Henderson [26]Chung-Pfost M = b0 + b1 ln(− ln aw) Chung and Pfost [20]
Halsey M = c0(−1
ln aw
)c1 Halsey [27]
Oswin M = d0(
aw1−aw
)d1 Oswin [28]
White & Eirig M = 1e0+e1∗aw Castillo et al. [29]
Caurie M = f0Exp( f1 ∗ aw) Castillo et al. [29]GAB M = A∗B∗C∗aw
(1−b∗aw)(1−B∗aw+B∗C∗aw) Van der Berg, [30]
Where a0, . . . , f0, a1, . . . , f1, A, B, and C are parameters of the equation, M is equilibrium moisture content (%, drybasis), and aw is the water activity in decimal.
3.6. Comparison Criteria for Sorption Models
Four quantitative criteria were used.
Foods 2019, 8, 191 6 of 18
a. The coefficient of determination (R2)b. The standard error of the model (s)
s = (Σ(yi− yi)
n− 2)0.5 (15)
where yi is the measured value, yi is the predicted value from model, and n is the number of data.c. The mean relative error (MRE)
MRE =100%
nΣ∣∣∣∣∣ yi− yi
yi
∣∣∣∣∣ (16)
d. Predicted errors sum of square (PRESS)The PRESS was used to evaluate the predictive performance of sorption models [31]. The criterion
was derived from the predictive error, e-i. When a dataset was used to compare the predictive abilityof a model, the i observation was withdrawn, and the remaining n-1 data were used to estimate theparameters of the model. The i data was substituted into this regression model to calculated thepredicted value y-i. The difference between the original yi value and y-i value was called the predictiveerror, e-i. The sum of the square e-i, Σ(e-i)
2 is called the PRESS.Residual plots were used as the criterion to evaluate the adequacy of the models. If the residual
plots presented a clean pattern, the model was considered inadequate. If the residual plots exhibited auniform distribution, the model was considered adequate for these sorption data.
4. Results and Discussion
4.1. Sorption Isotherm of C. Morifolium Flowers
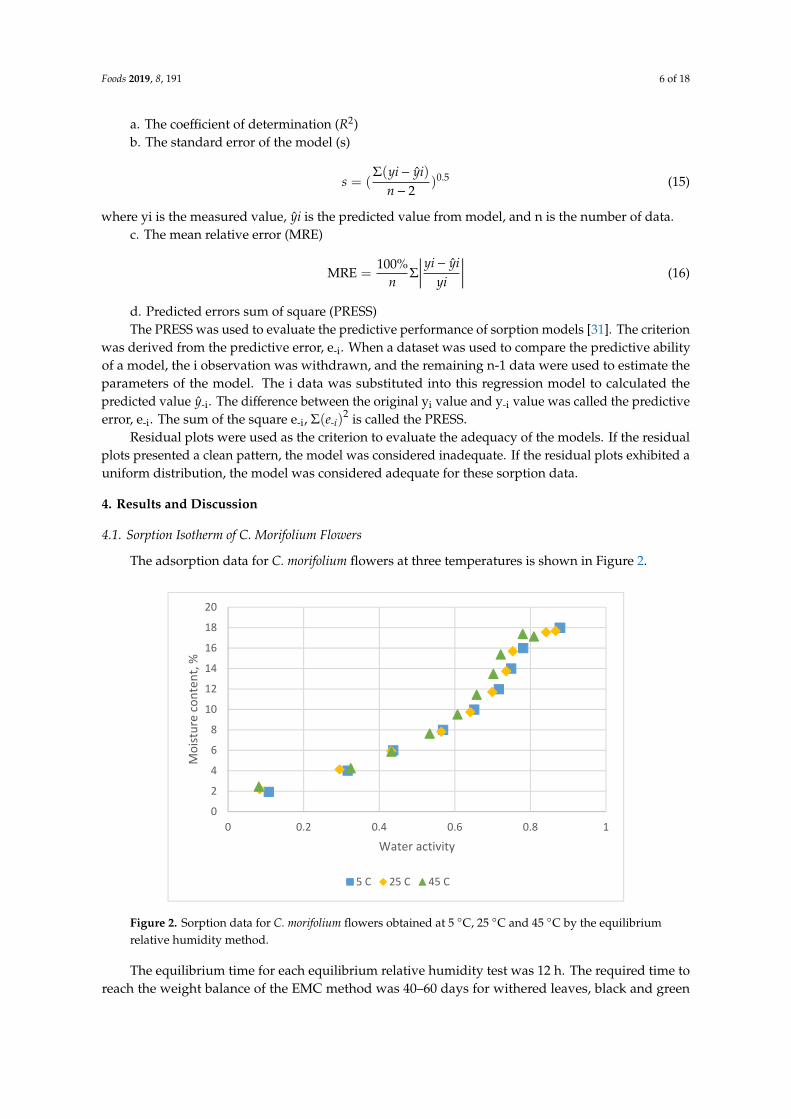
The adsorption data for C. morifolium flowers at three temperatures is shown in Figure 2.
Foods 2019, 8, x FOR PEER REVIEW 6 of 18
s = (�(���� ��)
���)0.5 (15)
where yi is the measured value, ��� is the predicted value from model, and n is the number of
data.
c. The mean relative error (MRE)
MRE =100%
� � �
�� − ���
��� (16)
d. Predicted errors sum of square (PRESS)
The PRESS was used to evaluate the predictive performance of sorption models [31]. The
criterion was derived from the predictive error, e-i. When a dataset was used to compare the
predictive ability of a model, the i observation was withdrawn, and the remaining n-1 data were used
to estimate the parameters of the model. The i data was substituted into this regression model to
calculated the predicted value ��-i. The difference between the original yi value and y-i value was called
the predictive error, e-i. The sum of the square e-i, Σ(�-�)� is called the PRESS.
Residual plots were used as the criterion to evaluate the adequacy of the models. If the residual
plots presented a clean pattern, the model was considered inadequate. If the residual plots exhibited
a uniform distribution, the model was considered adequate for these sorption data.
4. Results and Discussion
4.1. Sorption Isotherm of C. Morifolium Flowers
The adsorption data for C. morifolium flowers at three temperatures is shown in Figure 2.
Figure 2. Sorption data for C. morifolium flowers obtained at 5 °C, 25 °C and 45 °C by the equilibrium
relative humidity method.
The equilibrium time for each equilibrium relative humidity test was 12 h. The required time to
reach the weight balance of the EMC method was 40–60 days for withered leaves, black and green
tea [32] and 60–80 days for persimmon leaves [33]. The equilibrium relative humidity method could
save the required experimental time.
The sorption isotherms of C. morifolium flower was a sigmoid form and reflected a type II BET
classification [1,10]
The sorption temperature had a marginal effect on the adsorption isotherm (Figure 2). The
reason may be explained by its rewetting history from fried samples [1].
0
2
4
6
8
10
12
14
16
18
20
0 0.2 0.4 0.6 0.8 1
Mo
istu
re c
on
ten
t, %
Water activity
5 C 25 C 45 C
Figure 2. Sorption data for C. morifolium flowers obtained at 5 ◦C, 25 ◦C and 45 ◦C by the equilibriumrelative humidity method.
The equilibrium time for each equilibrium relative humidity test was 12 h. The required time toreach the weight balance of the EMC method was 40–60 days for withered leaves, black and green

Foods 2019, 8, 191 7 of 18
tea [32] and 60–80 days for persimmon leaves [33]. The equilibrium relative humidity method couldsave the required experimental time.
The sorption isotherms of C. morifolium flower was a sigmoid form and reflected a type II BETclassification [1,10].
The sorption temperature had a marginal effect on the adsorption isotherm (Figure 2). The reasonmay be explained by its rewetting history from fried samples [1].
Table 3 lists the estimated parameters and comparison statistics for seven models. The residualplots are shown in Figure 3. The Caurie equation had higher value for R2 and lower value for s,MRE and PRESS. The residual plots at five temperatures all showed a uniform distribution withthe Henderson and Caurie equations. The Chung-Pfost, Halsey, Oswin, White & Eirig and GABequations gave lower R2 and higher value for s, MRE and PRESS. The residual plots all showed asystematic pattern. These five equations could not be served as adequate equations for adsorptiondata of C. morifolium flowers.
Foods 2019, 8, x FOR PEER REVIEW 7 of 18
Table 3 lists the estimated parameters and comparison statistics for seven models. The residual
plots are shown in Figure 3. The Caurie equation had higher value for R2 and lower value for s, MRE
and PRESS. The residual plots at five temperatures all showed a uniform distribution with the
Henderson and Caurie equations. The Chung-Pfost, Halsey, Oswin, White & Eirig and GAB
equations gave lower R2 and higher value for s, MRE and PRESS. The residual plots all showed
a
a. Henderson equation.
b. Chung-Pfost equation.
-3
-2
-1
0
1
2
3
0 5 10 15 20
Res
idu
al v
alu
e, %
Predicted values, %
5 C 25 C 45 C
-3
-2
-1
0
1
2
3
-5 0 5 10 15 20
Res
idu
al v
alu
e, %
Predicted values, %
5 C 25 C 45 C
Figure 3. Cont.

Foods 2019, 8, 191 8 of 18Foods 2019, 8, x FOR PEER REVIEW 8 of 18
c. Halsey equation.
d. Oswin equation.
e. White & Eirig equation.
-3
-2
-1
0
1
2
3
0 5 10 15 20 25
Res
idu
al v
alu
e, %
Predicted values, %
5 C 25 C 45 C
-3
-2
-1
0
1
2
3
0 5 10 15 20 25
Res
idu
al v
alu
e, %
Predicted values, %
5 C 25 C 45 C
-3
-2
-1
0
1
2
3
0 5 10 15 20 25
Res
idu
al v
alu
e, %
Predicted values, %
5 C 25 C 45 C
Figure 3. Cont.

Foods 2019, 8, 191 9 of 18
Foods 2019, 8, x FOR PEER REVIEW 9 of 18
f. Caurie equation.
g. GAB equation.
Figure 3. Residual plots for the sorption isotherm equations for sorption data of C. morifolium flowers
obtained at three temperatures. a. Henderson eq., b. Chung-Pfost eq., c. Halsey eq., d. Oswin eq., e.
White & Eirig eq., f. Caurie eq., G. GAB eq.
Table 3. Estimated parameters and evaluating criteria of six models used for adsorption data at five
temperatures for C. morifolium flowers.
Temp. 5 °C 15 °C 25 °C 35 °C 45 °C
Henderson a0 9.8934 10.1609 10.1559 10.4075 10.8141
a1 0.8358 0.9196 0.8595 0.9956 1.0105
R2 0.9386 0.9788 0.9821 0.9806 0.9789
s 0.6393 0.8606 0.7764 0.7938 0.8120
MRE 6.0383 8.5932 8.7059 10.2933 10.0554
PRESS 4.9916 12.1870 8.1442 8.2361 8.9443
Residual
plot Uniform Uniform Uniform Uniform Uniform
Chung-Pfost b0 5.5080 5.7531 5.8960 5.9260 6.1290
b1 −6.1120 -6.4110 −6.0820 -6.6020 -6.7451
R2 0.9790 0.9531 0.9661 0.9361 0.9250
-3
-2
-1
0
1
2
3
0 5 10 15 20
Res
idu
al v
alu
e, %
Predicted values, %
5 C 25 C 45 C
-2
-1
0
1
2
0 5 10 15 20
Res
idu
al v
alu
es,
%
Predicted values, %
5℃ 25℃ 45℃
Figure 3. Residual plots for the sorption isotherm equations for sorption data of C. morifolium flowersobtained at three temperatures. (a) Henderson eq., (b) Chung-Pfost eq., (c) Halsey eq., (d) Oswin eq.,(e) White & Eirig eq., (f) Caurie eq., (g) GAB eq.
Table 3. Estimated parameters and evaluating criteria of six models used for adsorption data at fivetemperatures for C. morifolium flowers.
Temp. 5 ◦C 15 ◦C 25 ◦C 35 ◦C 45 ◦C
Hendersona0 9.8934 10.1609 10.1559 10.4075 10.8141a1 0.8358 0.9196 0.8595 0.9956 1.0105R2 0.9386 0.9788 0.9821 0.9806 0.9789s 0.6393 0.8606 0.7764 0.7938 0.8120
MRE 6.0383 8.5932 8.7059 10.2933 10.0554PRESS 4.9916 12.1870 8.1442 8.2361 8.9443
Residualplot Uniform Uniform Uniform Uniform Uniform

Foods 2019, 8, 191 10 of 18
Table 3. Cont.
Temp. 5 ◦C 15 ◦C 25 ◦C 35 ◦C 45 ◦C
Chung-Pfost b0 5.5080 5.7531 5.8960 5.9260 6.1290b1 −6.1120 −6.4110 −6.0820 −6.6020 −6.7451R2 0.9790 0.9531 0.9661 0.9361 0.9250s 0.8660 1.2861 1.1630 1.4422 1.5306
MRE 13.0605 17.5566 16.5122 19.6941 21.4310PRESS 11.7280 28.5011 23.4440 41.1900 52.1751
Residualplot Pattern Pattern Pattern Pattern Pattern
Halsey c0 5.9427 5.7082 5.9209 5.4476 5.5654c1 1.5704 0.6639 0.6126 0.7576 0.7842R2 0.9438 0.9536 0.9526 0.9764 0.9737s 1.4243 1.2710 1.2632 0.8753 0.9080
MRE 19.2776 13.2668 13.9556 7.6251 7.5905PRESS 25.6329 42.4362 27.9405 16.7586 17.7869
Residualplot Pattern Pattern Pattern Pattern Pattern
Oswind0 7.3971 7.3641 7.5094 7.2905 7.5193d1 0.4731 0.5396 0.4994 0.6045 0.6214R2 0.9687 0.9702 0.9715 0.9826 0.9794s 1.0622 1.0188 0.9788 0.7514 0.8034
MRE 11.8940 6.7995 7.5281 7.0538 8.7580PRESS 14.4665 24.8822 16.3209 10.6988 11.9955
Residualplot Pattern Pattern Pattern Pattern Pattern
White &Eirig
e0 0.2472 0.2560 0.2483 0.2698 0.2648e1 −0.2208 −0.2389 −0.2263 −0.2632 −0.2116R2 0.9399 0.9397 0.9420 0.9576 0.9516s 1.4737 1.4493 1.3964 1.1739 1.2312
MRE 22.6821 19.4736 18.9198 14.9920 15.3631PRESS 24.9283 63.0580 31.8313 31.8209 34.7616
Residualplot Pattern Pattern Pattern Pattern Pattern
Caurief0 1.8739 1.6968 1.8784 1.5901 1.6464f1 2.6012 2.7997 2.6398 2.9493 2.9602R2 0.9926 0.9862 0.9904 0.9908 0.9908s 0.5195 0.6927 0.5697 0.5455 0.5370
MRE 8.8299 4.6566 3.8838 4.8482 4.2159PRESS 3.3214 8.4673 4.8398 4.7978 5.1792
Residualplot Uniform Uniform Uniform Uniform Uniform
GABA 6.1289 2.8515 2.8434 1.4477 3.1852B 1.3142 2.0917 2.1447 3.3973 1.9537C 0.6442 0.7811 0.7457 0.8807 0.8257R2 0.9923 0.9805 0.9835 0.9833 0.9803s 0.5634 0.8815 0.7959 0.786 0.839
MRE 6.7162 8.7490 9.3550 8.2197 9.4683PRESS 3.7444 28.4023 10.4076 16.6284 16.3538
Residualplot Pattern Pattern Pattern Pattern Pattern
MRE, mean relative error; PRESS, predicted errors sum of square.

Foods 2019, 8, 191 11 of 18
4.2. Sorption Isotherm of A. Formosanus HAYATA
Figure 4 displays the adsorption EMC data for A. formosanus Hayata at three temperatures. Thesorption isotherms of this product have a sigmoid form and display the type II on BET classification [1,10].Foods 2019, 8, x FOR PEER REVIEW 11 of 18
Figure 4. Sorption data for A. formosanus Hayata obtained at 5 °C, 25 °C and 45 °C by the equilibrium
relative humidity method.
The sorption temperature only had a little effect on the adsorption data. Table 4 indicates the
estimated parameters and comparison statistics for seven models. The results are similar to those of
C. morifolium flowers. The Chung-Pfost, Halsey, Oswin, White & Eirig and GAB equations had lower
R2 and higher value for s, MRE and PRESS. The residual plots all presented a systematic pattern.
Table 4. Estimated parameters and evaluating criteria of six models used for adsorption data at five
temperatures for A. formosanus Hayata.
Temp. 5 °C 15 °C 25 °C 35 °C 45 °C
Henderson a0 11.1085 11.2013 11.7819 11.9449 12.1878
a1 1.0682 1.1939 1.0687 1.1718 1.1162
R2 0.9771 0.9915 0.9841 0.9930 0.9876
s 1.0785 0.6406 0.8610 0.5601 0.7261
MRE 4.1659 4.3288 5.0736 6.4703 7.3331
PRESS 36.7479 8.3019 19.5555 4.7611 10.3204
Residual
plot Uniform Uniform Uniform Uniform Uniform
Chung-
Pfost
b0 4.1801 4.1701 5.1377 5.422 5.813
b1 −9.5630 −10.0561 -9.328 −9.368 -8.993
R2 0.9766 0.9711 0.9710 0.9540 0.9501
s 1.1071 1.1751 1.1800 1.4240 1.4502
MRE 10.3642 12.8435 13.0605 17.7778 19.8735
PRESS 17.5531 22.1391 21.831 37.8920 40.4921
Residual
plot Pattern Pattern Pattern Pattern Pattern
Halsey c0 6.3600 5.6542 6.2743 5.7114 5.9771
c1 0.6749 0.8224 0.7433 0.8781 0.8446
R2 0.9200 0.9647 0.9411 0.9779 0.9638
s 2.0171 1.3065 1.6567 0.9920 1.2398
MRE 20.8838 14.0305 18.1594 10.9186 13.6242
PRESS 189.6994 54.1043 11.6067 28.4231 54.7304
Residual
plot Pattern Pattern Pattern Pattern Pattern
Oswin d0 7.9799 7.5396 8.1977 7.8989 8.1917
d1 0.5792 0.6871 0.6177 0.7013 0.6802 R2 0.9045 0.9795 0.9634 0.9890 0.9791
0
5
10
15
20
25
30
0 0.2 0.4 0.6 0.8 1
Mo
istu
re c
on
ten
t, %
Water activity
5 C 25 C 45 C
Figure 4. Sorption data for A. formosanus Hayata obtained at 5 ◦C, 25 ◦C and 45 ◦C by the equilibriumrelative humidity method.
The sorption temperature only had a little effect on the adsorption data. Table 4 indicates theestimated parameters and comparison statistics for seven models. The results are similar to those ofC. morifolium flowers. The Chung-Pfost, Halsey, Oswin, White & Eirig and GAB equations had lowerR2 and higher value for s, MRE and PRESS. The residual plots all presented a systematic pattern.
Table 4. Estimated parameters and evaluating criteria of six models used for adsorption data at fivetemperatures for A. formosanus Hayata.
Temp. 5 ◦C 15 ◦C 25 ◦C 35 ◦C 45 ◦C
Hendersona0 11.1085 11.2013 11.7819 11.9449 12.1878a1 1.0682 1.1939 1.0687 1.1718 1.1162R2 0.9771 0.9915 0.9841 0.9930 0.9876s 1.0785 0.6406 0.8610 0.5601 0.7261
MRE 4.1659 4.3288 5.0736 6.4703 7.3331PRESS 36.7479 8.3019 19.5555 4.7611 10.3204
Residualplot Uniform Uniform Uniform Uniform Uniform
Chung-Pfost b0 4.1801 4.1701 5.1377 5.422 5.813b1 −9.5630 −10.0561 −9.328 −9.368 −8.993R2 0.9766 0.9711 0.9710 0.9540 0.9501s 1.1071 1.1751 1.1800 1.4240 1.4502
MRE 10.3642 12.8435 13.0605 17.7778 19.8735PRESS 17.5531 22.1391 21.831 37.8920 40.4921
Residualplot Pattern Pattern Pattern Pattern Pattern
Foods 2019, 8, 191 12 of 18
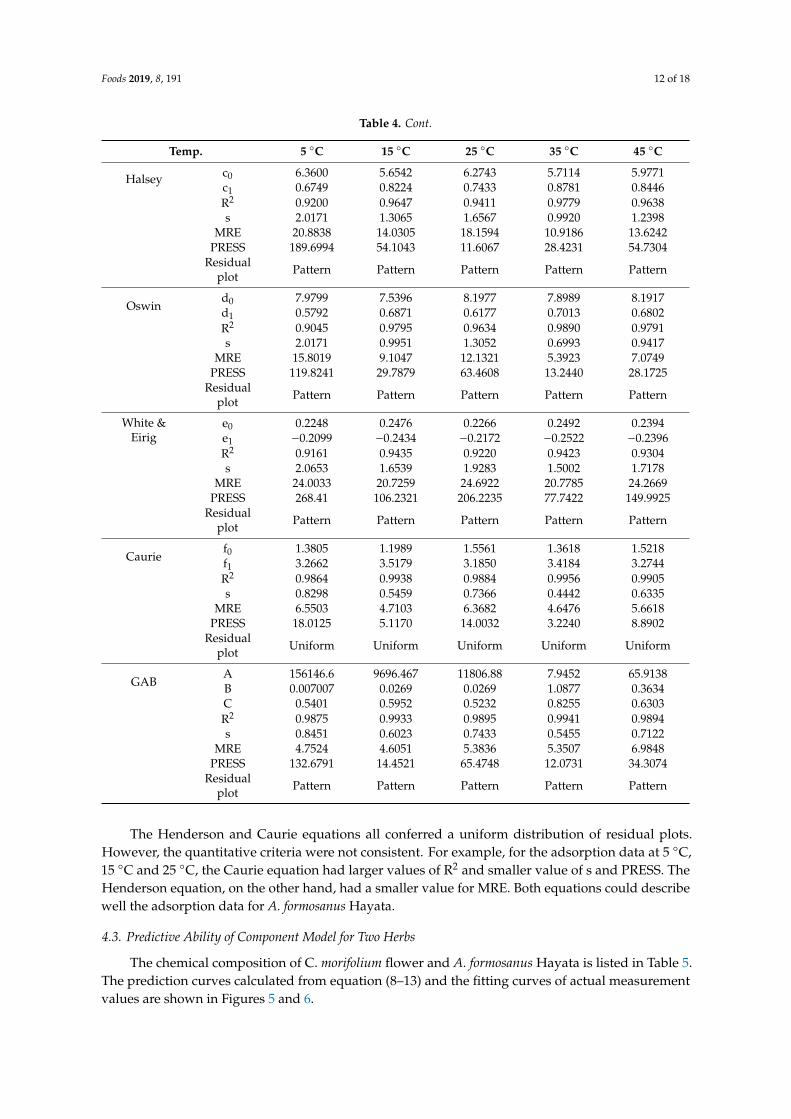
Table 4. Cont.
Temp. 5 ◦C 15 ◦C 25 ◦C 35 ◦C 45 ◦C
Halsey c0 6.3600 5.6542 6.2743 5.7114 5.9771c1 0.6749 0.8224 0.7433 0.8781 0.8446R2 0.9200 0.9647 0.9411 0.9779 0.9638s 2.0171 1.3065 1.6567 0.9920 1.2398
MRE 20.8838 14.0305 18.1594 10.9186 13.6242PRESS 189.6994 54.1043 11.6067 28.4231 54.7304
Residualplot Pattern Pattern Pattern Pattern Pattern
Oswind0 7.9799 7.5396 8.1977 7.8989 8.1917d1 0.5792 0.6871 0.6177 0.7013 0.6802R2 0.9045 0.9795 0.9634 0.9890 0.9791s 2.0171 0.9951 1.3052 0.6993 0.9417
MRE 15.8019 9.1047 12.1321 5.3923 7.0749PRESS 119.8241 29.7879 63.4608 13.2440 28.1725
Residualplot Pattern Pattern Pattern Pattern Pattern
White &Eirig
e0 0.2248 0.2476 0.2266 0.2492 0.2394e1 −0.2099 −0.2434 −0.2172 −0.2522 −0.2396R2 0.9161 0.9435 0.9220 0.9423 0.9304s 2.0653 1.6539 1.9283 1.5002 1.7178
MRE 24.0033 20.7259 24.6922 20.7785 24.2669PRESS 268.41 106.2321 206.2235 77.7422 149.9925
Residualplot Pattern Pattern Pattern Pattern Pattern
Caurief0 1.3805 1.1989 1.5561 1.3618 1.5218f1 3.2662 3.5179 3.1850 3.4184 3.2744R2 0.9864 0.9938 0.9884 0.9956 0.9905s 0.8298 0.5459 0.7366 0.4442 0.6335
MRE 6.5503 4.7103 6.3682 4.6476 5.6618PRESS 18.0125 5.1170 14.0032 3.2240 8.8902
Residualplot Uniform Uniform Uniform Uniform Uniform
GABA 156146.6 9696.467 11806.88 7.9452 65.9138B 0.007007 0.0269 0.0269 1.0877 0.3634C 0.5401 0.5952 0.5232 0.8255 0.6303R2 0.9875 0.9933 0.9895 0.9941 0.9894s 0.8451 0.6023 0.7433 0.5455 0.7122
MRE 4.7524 4.6051 5.3836 5.3507 6.9848PRESS 132.6791 14.4521 65.4748 12.0731 34.3074
Residualplot Pattern Pattern Pattern Pattern Pattern
The Henderson and Caurie equations all conferred a uniform distribution of residual plots.However, the quantitative criteria were not consistent. For example, for the adsorption data at 5 ◦C,15 ◦C and 25 ◦C, the Caurie equation had larger values of R2 and smaller value of s and PRESS. TheHenderson equation, on the other hand, had a smaller value for MRE. Both equations could describewell the adsorption data for A. formosanus Hayata.
4.3. Predictive Ability of Component Model for Two Herbs
The chemical composition of C. morifolium flower and A. formosanus Hayata is listed in Table 5.The prediction curves calculated from equation (8–13) and the fitting curves of actual measurementvalues are shown in Figures 5 and 6.

Foods 2019, 8, 191 13 of 18
Table 5. Chemical composition of C. morifolium flower and A. formosamus Hayata.
Component C. Morifolium Flower (16) A. formosamus Hayata (17)
Sugar 0.4923 0.098Ash 0.077 0.02Fiber 0.13384 0.23Starch 0.07692 0.0Protein 0.1892 0.07
Oil 0.0311 0.01
Note: The unit of components is decimal.Foods 2019, 8, x FOR PEER REVIEW 13 of 18
Figure 5. Comparing of the predictive values from the component model and the actual isotherm
moisture of A. formosanus Hayata.
Figure 6. Comparing of the predictive values from the component model and the actual isotherm
moisture of C. Morifolium flower.
Figure 5 shows that component model exhibits a good agreement with the sorption isotherms of
A. formusanus Hayata below 0.7 aw. Above 0.7 aw, the predicted values by component model was
lower than that of measurement values.
A comparison of predictive values of component model and actual sorption isotherm of C.
morifolium flower is shown in Figure 6. Below 0.65 aw, both values were close. However, the predictive
values of component model increase rapidly due to the high moisture value of the vacuolar
component.
4.4. Predictive Ability of Component Model for Other Products
The chemical composition of five agricultural products is listed in Table 6. These ratios of
chemical compositions were taken from the literature, as was the sorption isotherm of these products.
0
5
10
15
20
25
30
35
40
45
0 0.1 0.2 0.3 0.4 0.5 0.6 0.7 0.8 0.9 1
Mo
istu
re c
on
ten
t, %
aw
Actual value
Predicted value
0
10
20
30
40
50
60
0 0.2 0.4 0.6 0.8 1
Mo
istu
re c
on
ten
t, %
aw
Actualvalue
Figure 5. Comparing of the predictive values from the component model and the actual isothermmoisture of A. formosanus Hayata.
Foods 2019, 8, x FOR PEER REVIEW 13 of 18
Figure 5. Comparing of the predictive values from the component model and the actual isotherm
moisture of A. formosanus Hayata.
Figure 6. Comparing of the predictive values from the component model and the actual isotherm
moisture of C. Morifolium flower.
Figure 5 shows that component model exhibits a good agreement with the sorption isotherms of
A. formusanus Hayata below 0.7 aw. Above 0.7 aw, the predicted values by component model was
lower than that of measurement values.
A comparison of predictive values of component model and actual sorption isotherm of C.
morifolium flower is shown in Figure 6. Below 0.65 aw, both values were close. However, the predictive
values of component model increase rapidly due to the high moisture value of the vacuolar
component.
4.4. Predictive Ability of Component Model for Other Products
The chemical composition of five agricultural products is listed in Table 6. These ratios of
chemical compositions were taken from the literature, as was the sorption isotherm of these products.
0
5
10
15
20
25
30
35
40
45
0 0.1 0.2 0.3 0.4 0.5 0.6 0.7 0.8 0.9 1
Mo
istu
re c
on
ten
t, %
aw
Actual value
Predicted value
0
10
20
30
40
50
60
0 0.2 0.4 0.6 0.8 1
Mo
istu
re c
on
ten
t, %
aw
Actualvalue
Figure 6. Comparing of the predictive values from the component model and the actual isothermmoisture of C. Morifolium flower.

Foods 2019, 8, 191 14 of 18
Figure 5 shows that component model exhibits a good agreement with the sorption isothermsof A. formusanus Hayata below 0.7 aw. Above 0.7 aw, the predicted values by component model waslower than that of measurement values.
A comparison of predictive values of component model and actual sorption isotherm ofC. morifolium flower is shown in Figure 6. Below 0.65 aw, both values were close. However,the predictive values of component model increase rapidly due to the high moisture value of thevacuolar component.
4.4. Predictive Ability of Component Model for Other Products
The chemical composition of five agricultural products is listed in Table 6. These ratios of chemicalcompositions were taken from the literature, as was the sorption isotherm of these products.
Table 6. Chemical composition of several agricultural products.
Component Raw Bamboo[14]
Elecampe[34]
Corm VR[35]
Corm Vn[35]
Corm VA[35]
Sugar 0.1964 0.0 0.03965 0.01508 0.02674Ash 0.1265 0.053 0.01925 0.01607 0.015394Fiber 0.1429 0.01 0.03579 0.03946 0.036445Starch 0.4688 0.874 0.75185 0.77221 0.73766Protein 0.0045 0.0775 0.11147 0.10573 0.12969
Oil 0.0 0.0 0.04199 0.05144 0.05408
Note: The unit of components is decimal.
The predictive values and actual isotherm of raw bamboo are shown in Figure 7. Below 60 %RH, the predictive value and sorption isotherm is closed. As the RH increases, the discrepancy of themoisture content between the predictive values increased.
Foods 2019, 8, x FOR PEER REVIEW 14 of 18
Table 6. Chemical composition of several agricultural products.
Component Raw Bamboo
[14]
Elecampe
[34]
Corm VR
[35]
Corm Vn
[35]
Corm VA
[35]
Sugar 0.1964 0.0 0.03965 0.01508 0.02674
Ash 0.1265 0.053 0.01925 0.01607 0.015394
Fiber 0.1429 0.01 0.03579 0.03946 0.036445
Starch 0.4688 0.874 0.75185 0.77221 0.73766
Protein 0.0045 0.0775 0.11147 0.10573 0.12969
Oil 0.0 0.0 0.04199 0.05144 0.05408
Note: The unit of components is decimal.
The predictive values and actual isotherm of raw bamboo are shown in Figure 7. Below 60 %
Figure 7. Comparing of the predictive values from the component model and the actual isotherm
moisture of raw bamboo.
The comparison results of the predictive values and actual isotherm of elecampe (Inula helenium
L.) [34] are given in Figure 8. Below 0.65 aw, the predictive value and actual values of sorption
isotherm are closed. In the higher aw range, the discrepancy of the moisture content between
predictive values increased.
0
10
20
30
40
50
60
70
80
0 0.2 0.4 0.6 0.8 1
Mo
istu
re c
on
ten
t, %
Aw
Actualvalue
Figure 7. Comparing of the predictive values from the component model and the actual isothermmoisture of raw bamboo.

Foods 2019, 8, 191 15 of 18
The comparison results of the predictive values and actual isotherm of elecampe (Inula helenium L.) [34]are given in Figure 8. Below 0.65 aw, the predictive value and actual values of sorption isothermare closed. In the higher aw range, the discrepancy of the moisture content between predictivevalues increased.Foods 2019, 8, x FOR PEER REVIEW 15 of 18
Figure 8. Comparing of the predictive values from the component model and the actual isotherm moisture of elecampe (Inula helenium L.).
The results of comparison for three corn varieties is presented in Figure 9. Below 0.7 aw, predictive values of component model were close to the sorption isotherms [34]. The moisture of predictive value increased rapidly for three corn varieties.
a. VR corn kernels.
0
10
20
30
40
50
60
0 0.2 0.4 0.6 0.8 1
Moi
stur
e co
nten
t , %
aw
Actualvalue
0
5
10
15
20
25
30
0 0.2 0.4 0.6 0.8 1
Moi
stur
e co
nten
t, %
aw
Predicted value Actual value
Figure 8. Comparing of the predictive values from the component model and the actual isothermmoisture of elecampe (Inula helenium L.).
The results of comparison for three corn varieties is presented in Figure 9. Below 0.7 aw, predictivevalues of component model were close to the sorption isotherms [34]. The moisture of predictive valueincreased rapidly for three corn varieties.
Foods 2019, 8, x FOR PEER REVIEW 15 of 18
Figure 8. Comparing of the predictive values from the component model and the actual isotherm
moisture of elecampe (Inula helenium L.).
The results of comparison for three corn varieties is presented in Figure 9. Below 0.7
aw,
a. VR corn kernels.
0
10
20
30
40
50
60
0 0.2 0.4 0.6 0.8 1
Mo
istu
re c
on
ten
t , %
aw
A…
0
5
10
15
20
25
30
0 0.2 0.4 0.6 0.8 1
Mo
istu
re c
on
ten
t, %
aw
Predicted value Actual value
Figure 9. Cont.

Foods 2019, 8, 191 16 of 18
Foods 2019, 8, x FOR PEER REVIEW 16 of 18
b. VN corn kernels.
c. VA corn kernels.
Figure 9. Comparing of the predictive values from the component model and the actual isotherm
moisture of three varieties of corn kernel.
The results of the comparison between predictive values of component model and sorption
isotherm of two herbs and five products were similar. As aw higher than 0.7, the component model
showed a good predictive ability. When aw was higher than 0.7, the predictive moisture content
increased rapidly with an increase of aw.
Crapiste and Rotstein [9] proposed a starchy-component model to predict isotherms from
components. They suggested that their model could be applied over the entire range of moisture
content. However, the results of this study indicated that this component model was valid in the aw
range below 0.7. The failure is the higher aw range of this component model might be due to the
interaction of these components is the higher aw range.
From the viewpoint of practical application, the aw range below 0.7 is the main range for the
processing of agricultural products and food stuffs. Pathogenic microorganisms cannot develop at aw
0
5
10
15
20
25
30
0 0.2 0.4 0.6 0.8 1
Mo
istu
re c
on
ten
t , %
aw
Predicted value Actual value
0
5
10
15
20
25
30
0 0.2 0.4 0.6 0.8 1 1.2
Mo
istu
re c
on
ten
t, %
aw
Predicted value Actual value
Figure 9. Comparing of the predictive values from the component model and the actual isothermmoisture of three varieties of corn kernel. (a. VR corn kernels; b. VN corn kernels; c. VA corn kernels).
The results of the comparison between predictive values of component model and sorptionisotherm of two herbs and five products were similar. As aw higher than 0.7, the component modelshowed a good predictive ability. When aw was higher than 0.7, the predictive moisture contentincreased rapidly with an increase of aw.
Crapiste and Rotstein [9] proposed a starchy-component model to predict isotherms fromcomponents. They suggested that their model could be applied over the entire range of moisturecontent. However, the results of this study indicated that this component model was valid in the aw
range below 0.7. The failure is the higher aw range of this component model might be due to theinteraction of these components is the higher aw range.

Foods 2019, 8, 191 17 of 18
From the viewpoint of practical application, the aw range below 0.7 is the main range for theprocessing of agricultural products and food stuffs. Pathogenic microorganisms cannot develop at aw
smaller than 0.6. With aw at 0.3, the products is in stable with respect to non-enzymatic browning,lipid oxidation, enzyme activity and other microbial parameters [10], so the good predictive ability ofcomponent model at the aw range smaller than 0.7 could be helpful for food engineering and for thefood industry.
5. Conclusions
A component model was proposed to predict the moisture sorption isotherm data. The moisturesorption isotherm of C. morifolium flowers and A. formosanus Hayata was determined using anequilibrium relative humidity method at five temperatures. Seven sorption isotherm models wereselected to evaluate the fitting ability and prediction performance for these products. Sorptiontemperature did not have a significant effect on the adsorption isotherms for the three samples. TheCaurie and Henderson equations could be used for C. morifolium flowers. Considering the quantitativecriteria, the Caurie equation is the best. The Henderson and Caurie equations were adequate forsorption isotherms of A. formosanus Hayata, but the quantitative criteria were not consistent. Theisotherm data of raw bamboo, elecampe and three varieties of corn kernels from the literature wereadopted to validate the component model. The component model showed a good predictive abilitywithin an aw range smaller than 0.7. Considering the practical application, the aw range below 0.7 isthe main range for the processing of agricultural products, so the predictive values of this componentmodel could be helpful for food engineering and for the food industry.
Author Contributions: C.C. drafted the proposal, executed some experiments, interpreted some results and writethe manuscript critically and interpreted the results.
Funding: This research received no external funding.
Acknowledgments: The authors would like to thank the Ministry of Science and Technology of the Republic ofChina for financially supporting this research under Contract No. MOST-104-2313-B-005-031.
Conflicts of Interest: The authors declare no conflict of interest.
References
1. Basu, S.; Shivhare, U.S.; Mujumdar, A.S. Models for sorption isotherms for foods: A review. Dry. Technol.2006, 24, 917–930. [CrossRef]
2. Fleurat-Lessard, F. Integrated management of the risks of stored grain spoilage by seed borne fungi andcontamination by storage mould mycotoxins—An update. J. Stored Prod. Res. 2017, 71, 22–40. [CrossRef]
3. Mohamed, L.A.; Kouhila, M.; Lahsasni, S.; Jamali, A.; Idlimam, A.; Rhazi, M.; Aghfir, M.; Mahrouz, M.Equilibrium moisture content and heat of sorption of Gelidium sesquipedale. J. Stored Prod. Res. 2005, 41,199–209. [CrossRef]
4. Barrozo, M.A.S.; Silva, A.A.M.; Oliveira, D.T. The use of curvature and bias measures to discriminate amongequilibrium moisture equations for mustard seed. J. Stored Prod. Res. 2008, 44, 65–70. [CrossRef]
5. Oyelade, O.J.; Tunde-Akintunde, T.Y.; Igbeka, J.C.; Oke, M.O.; Raji, O.Y. Modelling moisture sorptionisotherms for maize flour. J. Stored Prod. Res. 2008, 44, 179–185. [CrossRef]
6. Chen, C. A rapid method to determine the sorption isotherms of peanuts. J. Agric. Eng. Res. 2000, 75,401–408. [CrossRef]
7. Chen, C.; Weng, Y. Moisture Sorption isotherms of Oolong tea. Food Bioprocess Technol. 2010, 3, 226–233.[CrossRef]
8. Chen, H.; Chen, C. Equilibrium relative humidity method used to determine the sorption isotherm ofautoclaved aerated concrete. Build. Environ. 2014, 81, 427–435. [CrossRef]
9. Crapiste, G.H.; Rostein, E. Predicting of sorptional equilibrium data for starch containing foodstuffs. J. FoodSci. 1982, 47, 1501–1507. [CrossRef]
10. Al-Muhtaseb, A.H.; McMinn, W.A.M.; Magee, T.R.A. Moisture sorption isotherm characteristics of foodproducts: A review. Food Bioprod. Process. 2002, 80, 118–128.

Foods 2019, 8, 191 18 of 18
11. Bonner, I.J.; Kenney, K.L. Moisture sorption characteristics and modeling of energy sorghum (Sorghum bicolor(L.) Moench). J. Stored Prod. Res. 2013, 52, 128–136. [CrossRef]
12. Argyropoulos, D.; Alex, R.; Kohler, R.; Müller, J. Moisture sorption isotherms and isosteric heat of sorption ofleaves and stems of lemon balm (Melissa officinalis L.) established by dynamic vapor sorption. LWT-Food Sci.Technol. 2012, 47, 324–331. [CrossRef]
13. Bahloul, N.; Boudhrioua, N.; Kechaou, N. Moisture desorption–adsorption isotherms and isostericheats ofsorption of Tunisian olive leaves (Olea europaea L.). Ind. Crops Prod. 2008, 28, 162–176. [CrossRef]
14. Choudhury, D.; Sahu, J.K.; Sharma, G.D. Moisture sorption isotherms, heat of sorption and propertiesof sorbed water of raw bamboo (Dendrocalamus longispathus) shoots. Ind. Crops Prod. 2011, 33, 211–216.[CrossRef]
15. Hong, T.D.; Ellis, R.H.; Gunn, J.; Moore, D. Relative humidity, temperature, and the equilibrium moisturecontent of conidia of Beauveria bassiana (Balsamo) Vuillemin: A quantitative approach. J. Stored Prod. Res.2002, 38, 33–41. [CrossRef]
16. Lee, J.S.; Kim, H.J.; Lee, Y.S. A new anti-HIV flavonoid glucuronide from Chrysanthemum morifolium. PlantaMed. 2003, 69, 859–861. [PubMed]
17. Shih, C.C.; Wu, Y.W.; Lin, W.C. Ameliorative effects of Anoectochilus formosanus extract on osteopenia inovariectomized rats. J. Ethnopharmacol. 2001, 77, 233–238. [CrossRef]
18. Ross, K.D. Estimation of water activity in intermediate moisture foods. Food Technol. 1975, 29, 26–34.19. Kelsey, K.E. The sorption of water vapour by wood. Aust. J. Appl. Sci. 1957, 8, 42–45.20. Chung, D.S.; Pfost, H.B. Adsorption and desorption of water vapour by cereal grains and their products.
Part II. Hypothesis for explaining the hysteresis effect. Trans. ASAE 1967, 10, 552–555.21. Hermansson, A.M. Functional properties of proteins for foods—Water vapor sorption. J. Food Technol. 1977,
12, 177–187. [CrossRef]22. Shen, Y.; Chen, C. Preparation of reference materials for rice kernels. Biosyst. Eng. 2007, 97, 41–49. [CrossRef]23. Organization Internationale De Metrologie Legale (OMIL). The Scale of Relative Humidity of Air Certified
Against Saturated Salt Solutions; OMIL R 121; OMIL: Paris, France, 1996.24. Chen, C. Sorption isotherms of sweet potato slices. Biosyst. Eng. 2002, 83, 85–95. [CrossRef]25. Chen, C. Moisture sorption isotherms of pea seeds. J. Food Eng. 2002, 58, 45–51. [CrossRef]26. Henderson, S.M. A basic concept of equilibrium moisture. Agri. Eng. 1952, 33, 29–32.27. Halsey, G. Physical adsorbtion in non-uniform surfaces. J. Chem. Phys. 1948, 16, 931–937. [CrossRef]28. Oswin, C.R. The kinetics of package life. III. The isotherm. J. Chem. Soc. 1946, 65, 419–421. [CrossRef]29. Castillo, M.D.; Martinez, E.J.; Gonzalez, H.H.L.; Pacin, A.M.; Resnik, S.L. Study of mathematical models
applied to sorption isotherms of Argentinean black bean varieties. J. Food Eng. 2003, 60, 343–348. [CrossRef]30. Berg, C.; Bruin, S. Water activity and its estimation in food systems: Theoretical aspects. In Water Activity:
Influences on Food Quality; Rockland, L.B., Stewart, G.F., Eds.; Academic Press: New York, NY, USA, 1981;pp. 1–61.
31. Myers, R.H. Classical and Modern Regression with Applications, 2nd ed.; Duxbury Press: Pacific Grove, CA,USA, 2000.
32. Ghodake, H.M.; Goswami, T.K.; Chakraverty, A. Moisture sorption isotherms, heat of sorption andvaporization of withered leaves, black and green tea. J. Food Eng. 2007, 78, 827–835. [CrossRef]
33. Heras, R.M.-L.; Heredia, A.; Castelló, M.L.; Andrés, A. Moisture sorption isotherms and isosteric heat ofsorption of dry persimmon leaves. Food Biosci. 2014, 7, 88–94. [CrossRef]
34. Cervenka, L.; Kubinova, J.; Juszczak, L.; Witczak, M. Moisture sorption isotherms and glass transitiontemperature of elecampe (Inula helenium L.) and burdock (Arctium lappa L.) roots at 25 ◦C. Food Sci. Technol.Int. 2012, 18, 81–91. [CrossRef]
35. Chen, C. A Study of Equilibrium Relative Humidity for Yellow-Dent Corn Kernels. Ph.D. Thesis, Universityof Minnesota, Minneapolis, MN, USA, 1988.
© 2019 by the author. Licensee MDPI, Basel, Switzerland. This article is an open accessarticle distributed under the terms and conditions of the Creative Commons Attribution(CC BY) license (http://creativecommons.org/licenses/by/4.0/).