moldova trade study - world bankdocuments.worldbank.org/curated/en/281771467991921364/...1 the...
TRANSCRIPT
1 | P a g e
MOLDOVA TRADE STUDY Note 2
Is the DCFTA Good for Moldova? Analysis of Moldova’s Trade Options
Using a Dynamic Computable General Equilibrium
Model
The World Bank
Pub
lic D
iscl
osur
e A
utho
rized
Pub
lic D
iscl
osur
e A
utho
rized
Pub
lic D
iscl
osur
e A
utho
rized
Pub
lic D
iscl
osur
e A
utho
rized
Pub
lic D
iscl
osur
e A
utho
rized
Pub
lic D
iscl
osur
e A
utho
rized
Pub
lic D
iscl
osur
e A
utho
rized
Pub
lic D
iscl
osur
e A
utho
rized
Pub
lic D
iscl
osur
e A
utho
rized
Pub
lic D
iscl
osur
e A
utho
rized
Pub
lic D
iscl
osur
e A
utho
rized
Pub
lic D
iscl
osur
e A
utho
rized
Pub
lic D
iscl
osur
e A
utho
rized
Pub
lic D
iscl
osur
e A
utho
rized
Pub
lic D
iscl
osur
e A
utho
rized
Pub
lic D
iscl
osur
e A
utho
rized
2 | P a g e
Table of Contents
1. Executive Summary .......................................................................................................................... 7
2. Introduction ...................................................................................................................................... 9
3. Brief Overview of Moldova–EU Economic Relations ................................................................... 11
3.1 Trade in Goods .......................................................................................................................... 11
3.2 Trade in Services....................................................................................................................... 15
3.3 FDI Flows ................................................................................................................................. 18
4. DCFTA Between Moldova and the EU .......................................................................................... 20
4.1 Summary of Main Elements ..................................................................................................... 20
4.2 EU Schedule of Concessions on Imports of Goods from Moldova .......................................... 21
4.3 Moldova’s Schedule of Concessions on Imports from the EU ................................................. 22
4.4 Customs and Trade Facilitation ................................................................................................ 23
4.5 Provisions of the DCFTA Concerning Trade in Services ......................................................... 24
4.6 Review of Existing Literature on Results of Previous DCFTAs Signed Between the EU and
Third Countries ............................................................................................................................... 24
5. Quantitative Estimation of the DCFTA’s Impact ........................................................................... 27
5.1 DCGE Model Description......................................................................................................... 27
5.2 Data Discussion ........................................................................................................................ 30
5.3 Presentation of Key Parameters of Scenarios ........................................................................... 34
5.3.1 Baseline growth path .......................................................................................................... 34
5.3.2 Moldova implements customs tariffs reductions on imports of goods from EU according to
AA provisions (MD_GDS) ........................................................................................................... 34
5.3.3 EU removes customs duties on imports of goods from RM (EU_GDS) ............................. 35
5.3.4 Moldova removes AVE tariffs on imports of services from the EU (MD_SERV) .............. 35
5.3.5 EU reduces barriers on imports of services from Moldova (EU_SERV) ........................... 38
5.3.6 Moldovan food producers adopt and implement SPS standards (SPS) ............................. 38
5.3.7 Facilitation of exports (EXP_FACIL) ................................................................................ 39
5.3.8 Facilitation of import (IMP_FACIL) ................................................................................. 39
5.3.9 Moldova cuts tariffs on import of goods from Turkey (MD_GDS) .................................... 39
5.3.10 Turkey cuts tariffs on imports of goods from Moldova (TRK_GDS) ............................... 39
5.3.11 Russian restrictions (EMB) .............................................................................................. 39
5.3.12 DCFTA ............................................................................................................................. 40
5.3.13 DCFTA plus FDI .............................................................................................................. 40
5.3.14 Moldova joins Customs Union of Russia, Belarus, and Kazakhstan (CU) ...................... 41
5.3.15 Abolishing FTAs and imposing MFN rate to all trading partners (MFN)....................... 41
3 | P a g e
5.4 Discussion of Results ................................................................................................................ 41
5.4.1 Impact on key aggregates across scenarios ....................................................................... 41
5.4.2 Impact on key macroeconomic indicators .......................................................................... 46
5.4.3 Impact of the main scenarios on the foreign trade ............................................................. 47
5.4.4 Impact of the main scenarios on economic activities and production factors ................... 48
5.4.5 Distributional impact of the main scenarios on households, poverty and shared prosperity
..................................................................................................................................................... 50
6. Conclusions and Recommendations ............................................................................................... 53
7. Annexes .......................................................................................................................................... 55
8. List of References ........................................................................................................................... 74
List of Tables:
Table 1. Top 10 Exported Products to the EU .................................................................................... 14 Table 2. Top-10 Imported Products from the EU ............................................................................... 15 Table 3. List of Accounts in the SAM and in the Moldova DCGE Model ........................................ 28 Table 4. Alternative Closure Rules for Macroeconomic System Constraints .................................... 29 Table 5. Armington Elasticity of Substitution for Some Sectors of Moldovan Economy ................. 33 Table 6. Constant Elasticity of Technological Transformation for Some Sectors of Moldovan
Economy ............................................................................................................................................. 33 Table 7. Definition of Scenarios and Changes in Parameters ............................................................ 37 Table 8. Impact of Simulated Scenarios on Key Aggregate Indicators .............................................. 44 Table 9. Impact of Simulated Scenarios on Key Macroeconomic Indicators .................................... 44 Table 10. MFN Effective and Bound Rates ....................................................................................... 45 Table 11. Impact of Changes in Trade Parameters Related to Customs Union Scenario .................. 46 Table 12. Impact of Main Scenarios on Moldovan Regional Trade .................................................. 48 Table 13. Impact of Main Scenarios on Economic Activities Revenues, Intermediary Input Price,
and Value-Added Price ....................................................................................................................... 49 Table 14. Impact of Main Scenarios on Total Factor Productivity .................................................... 49 Table 15. Impact of Main Scenarios on Activity Level and Value-Added Level .............................. 50 Table 16. Impact of Main Scenarios on Labor, Capital Demand and Self-Employment ................... 50 Table 17. Impact of Main Scenarios Factors Income ......................................................................... 51 Table 18. Impact of Main Scenarios on Enterprises and Households Income ................................... 51 Table 19. Evolution of Income Inequality in Urban Areas Under All Scenarios ............................... 51 Table 20. Impact of Main Scenarios on Bottom 40 and on average income ...................................... 51
4 | P a g e
List of Boxes:
Box 1. Armington Elasticity Coefficients of Substitution .................................................................. 31 Box 2. Constant Elasticity of Transformation (CET) for Several Moldovan Sectors ........................ 31 Box 3. Estimating Constant Elasticity of Substitution (CES) ............................................................ 32
List of Figures:
Figure 1. Trade Balance with the Most Important Trading Partners of Moldova, million USD ....... 11 Figure 2. Top EU Destinations for Moldovan Exports in 2005 and 2014, percent of total exports to
EU ....................................................................................................................................................... 12 Figure 3. Top EU Origins of Moldovan Imports, 2005 and 2014, percent of total imports-value of
Moldova .............................................................................................................................................. 13 Figure 4. Moldova’s Exports of Services to the EU, million USD .................................................... 16 Figure 5. Geographical Distribution of Moldova’s Exports to EU, average for 2010-2011, % of total
............................................................................................................................................................ 16 Figure 6. Moldova’s Imports of Services from the EU, million USD................................................ 17 Figure 7. Geographical Distribution of Moldova’s Imports from the EU, average for 2010-2011, %
of total ................................................................................................................................................. 17 Figure 8. Moldova-EU Trade Balance with Services, million USD .................................................. 18 Figure 9. Stock of FDI from EU Countries, 2012, million USD ........................................................ 18 Figure 10. FDI Inflows from EU in Moldova, million USD .............................................................. 19 Figure 11. FDI Inflows from Romania and Germany in Moldova, million USD .............................. 19 Figure 12. Projected Evolution of GDP Under Simulated Scenarios, 2004=100% ........................... 43 Figure 13. Impact of Implemented Scenarios on Exports and imports of Services and Goods ......... 47

5 | P a g e
List of Annexes:
Annex 1. Moldova’s Exported Products Subject to Annual Duty-Free Quotas of EU ...................... 55 Annex 2. Product Categories Subject to Anti-Circumvention Mechanisms of the AA ..................... 56 Annex 3. Moldova’s Tariff Concession Schedule by Main Sectors and Types of Concessions
(number of distinct 6-digit positions) ................................................................................................. 57 Annex 4. Schedule of Implementation of Tariff Reductions by Moldova on Imports from EU, by
groups of commodities included in the Model, year-on-year percentage change .............................. 58 Annex 5. Growth Rates in Moldovan Exporters’ Prices Following EU Reductions in Import Tariffs
by groups of commodities included in the Model, percentage change .............................................. 59 Annex 6. Schedule of Implementation of Tariff Reductions by Moldova on Imports from Turkey, by
groups of commodities included in the Model, year-on-year percentage change .............................. 60 Annex 7. Impact of Turkey’s Reductions in Tariffs on Moldovan Imports, by groups of commodities
included in the Model, percentage change ......................................................................................... 61 Annex 8. Impact of All Scenarios on Moldova’s Regional Trade ..................................................... 61 Annex 9. Impact of All Scenarios on Exports of Goods and Services ............................................... 62 Annex 10. Impact of All Scenarios on Imports of Goods and Services ............................................. 63 Annex 11. Impact of All Scenarios on Activity Prices ....................................................................... 64 Annex 12. Impact of All Scenarios on Price of Intermediary Inputs ................................................. 65 Annex 13. Impact of All Scenarios on Price of Value Added ............................................................ 66 Annex 14. Impact of All Scenarios on Activity Levels ...................................................................... 67 Annex 15. Impact of All Scenarios on Value Added ......................................................................... 68 Annex 16. Impact of All Scenarios on Labor Demand ...................................................................... 69 Annex 17. Impact of All Scenarios on Capital Demand .................................................................... 70 Annex 18. Impact of All Scenarios on Self-Employment .................................................................. 71 Annex 19. Impact of All Scenarios on Total Factor Productivity ...................................................... 71 Annex 20. Impact of all scenarios on factors income ......................................................................... 71 Annex 21. Impact of All Scenarios on Enterprises and Household Income ...................................... 72 Annex 22. Evolution of Income Inequality in Urban Areas Under All Scenarios, from 2014 to 2024
............................................................................................................................................................ 73 Annex 23. Evolution of Income Inequality in Rural Areas Under All Scenarios, from 2014 to 2024
............................................................................................................................................................ 73
6 | P a g e
Acronyms
AA Association Agreement
ATP Autonomous Trade Preferences
CEECs Central and Eastern European countries
CIS Commonwealth of Independent States
CU Customs Union
DCFTA Deep and Comprehensive Free Trade Agreement
DCGE Dynamic Computable General Equilibrium
EU European Union
EPS Entry Price System
FDI Foreign direct investment
FTA Free trade agreement
GDP Gross domestic product
GSP Generalized System of Preferences
HACCP Hazard Analysis & Critical Control Points
IMF International Monetary Fund
MFN Most Favored Nation
SAM Social Accounting Matrix
SPS Sanitary and phytosanitary standards
WTO World Trade Organization
7 | P a g e
1. Executive Summary
The importance of the European Union as a destination market for Moldovan exports has grown
remarkably between 2005 and 2014, partly at the expense of exports to the Commonwealth of
Independent States (CIS). The reorientation of Moldovan exports from the CIS to the EU market
was mainly due to increasing exports to the same trading partners in the EU rather than to new
destinations. While some new products exported to the EU replaced traditional ones, the overall
level of product concentration has not changed dramatically.
The Deep and Comprehensive Free Trade Agreement (DCFTA) that Moldova and the EU signed
and started implementing in 2014 offers Moldova a unique opportunity to reach a more sustainable
economic growth path. The trade restrictions that Russia imposed on Moldovan imports, however,
have undermined the development potential of the DCFTA.
The research conducted for this paper suggests that the impact of the Russian trade restrictions is
likely to dissipate though over a couple of years. However, even if Russian trade restrictions are
maintained permanently throughout the next decade, the DCFTA still provides a significantly
positive economic impact, as suggested by the simulations described in this paper using a Dynamic
Computable General Equilibrium (DCGE) model for Moldova. The DCFTA’s key components—
liberalization of trade in goods and services, introduction of sanitary and phytosanitary standards
(SPS), trade facilitation measures removing behind-the-border barriers—plus the free trade
agreement (FTA) with Turkey will add, if fully implemented, over the next 10 years, about 7.6
percentage points to its gross domestic product (GDP) compared to the baseline development path.
Of course, if reforms are only partially implemented, the effect on GDP growth will be lower.
If Moldova was able to attract more foreign direct investment (FDI) under the DCFTA then the
impact on the country’s GDP would be even bigger, about 9.8 percent compared to the baseline
growth (under an assumed steady growth of the FDI of about 5 percent per year). The surge in
Moldovan exports that originated in Free Economic Zones (FEZ) since 2012 shows that such
magnitude of inflows are plausible if Moldova processes the necessary reforms to secure, across the
country, a business climate as conducive to investment as that enjoyed by firms that operate from
FEZs. However, the simulated growth figures should not be taken for granted nor seen as a forecast.
They only serve as projections of the potential economic growth that Moldova could reach if the
critical constraints to economic growth were eliminated.
While attracting FDI into tradable sectors is a high priority, the growth of FDI in the sectors
providing services used as inputs into the downstream industries is also important. As shown in the
modeled scenarios, the FDI in non-tradable sectors improves manufacturing productivity through
forward linkages, which will likely impact export competitiveness. Liberalization of trade in
services also increases efficiency in the services sector.
Our model results reveal that the Customs Union (CU) of Russia, Belarus, and Kazakhstan1 is
significantly inferior to the DCFTA. If Moldova joins the CU, the impact on its GDP would be
strongly negative—minus 2.0 percent. This would be true even with the reduction in gas prices and
total liberalization of trade between members of the CU. A growth of FDI similar to the DCFTA
1 The Customs Union of Russia, Belarus, and Kazakhstan was a basis for establishment of the Eurasian Economic Union (EEU) that came into force
on January 1, 2015. During 2015, Armenia and Kyrgyzstan also joined the EEU.
8 | P a g e
scenarios would compensate only to some extent the negative effects to Moldovan trade with the
rest of the world. These negative effects would come from the abolition of the DCFTA, abolition of
the EU’s unilateral trade preferences offered to Moldova, non-implementation of the Moldova-
Turkey FTA, and retaliatory actions taken by other countries against Moldova (the CU applied MFN
rate for most of the products is higher than Moldova’s World Trade Organization –WTO- final
bound rate).
Finally, a scenario has been simulated in which Moldova abolishes the DCFTA and the multilateral
FTA in the CIS, does not implement the FTA with Turkey, and instead implements the MFN rate for
all its trading partners. This “protectionist” scenario is the most damaging of all possible ones, with
GDP lagging almost 3.7 percentage points behind the baseline scenario. These results show that
there is not a single economic benefit for Moldova from isolating itself from international trade.

9 | P a g e
2. Introduction
Moldova’s recent Association Agreement with the EU, which includes a DCFTA, represents an
important opportunity, as well as challenges.
This analytical document has been commissioned by the World Bank Group to provide insights into
potential outcomes of the DCFTA and of other trade options that Moldova has, using a DCGE
model calibrated to its economy.
There are some other studies assessing the impact of the EU-Moldova DCFTA using a Computable
General Equilibrium model. Prohnitchi et al. (2009) made one of the first CGE-based assessments of
the liberalization of trade in goods between Moldova and the EU. The study concluded that
liberalization of bilateral trade in goods alone would bring few benefits. Prohnitchi (2012) used a
static CGE model to compare Moldova-EU economic integration with alternative economic
strategies. The study recommends that Moldova count more on the “deep” aspects of its European
integration vector rather than on the simple abolishment of import tariffs.
ECORYS-CASE (2012) is a study commissioned by the European Commission to evaluate the
impact of the DCFTA on the Moldovan economy and, by using a DCGE, it is the closest in
approach to our study. At the data level, though, there are three key differences in this study
compared to the ECORYS-CASE:
First, our study uses a set of elasticity coefficients that have been estimated using statistical
data of Moldova.
Second, the Social Accounting Matrix has been built using very recent data that have been
“cleaned” to remove distortions caused by Transnistria’s foreign trade flows.
Finally, for modeling the transition periods, the effective DCFTA provisions (as well as the
Turkey-Moldova FTA) have been used rather than general assumptions available when the
ECORYS-CASE was done.
There are also differences in model structure. The study uses a one-country model, with a more
detailed structure of the households. The model used also includes explicitly the domestic and
foreign trade transaction costs, allowing for an easy modeling of trade facilitation measures. The
study also evaluates the impact of an increased inflow of capital inflows following the DCFTA-
related improvements in the Moldovan business climate. Finally, the DCFTA is compared with
other trade options Moldova may have, such as joining the Eurasian Economic Union or switching
to a protectionist trade policy by adopting the MFN tariff against imports or of all origins.
This paper begins by describing the general trends in economic relations between Moldova and the
EU over the past 10 years, with an emphasis on trade, as well as FDI and labor migration. This
section includes some additional facts and details that complement the Trade Competitiveness
Diagnostic (of Note 1.)
In the second section, the paper presents the main elements of the DCFTA and highlights the trade
commitments and concessions that the EU and Moldova undertook. It also includes a short review
of available literature on the ex-ante or ex post impact assessments of other Association Agreements
between the EU and third countries that have been done using CGE models.
The third section presents key features of the DCGE and discusses the data used for assembling the
Social Accounting Matrix (SAM). Then, the main features of the simulated trade scenarios are
presented. Finally, this paper discusses the DCGE simulation results, including the effects of the

10 | P a g e
various scenarios on welfare, trade, and economic activity level. Some distributional impacts are
also brought into discussion. The final section concludes and makes several recommendations.
11 | P a g e
3. Brief Overview of Moldova–EU Economic Relations
3.1 Trade in Goods
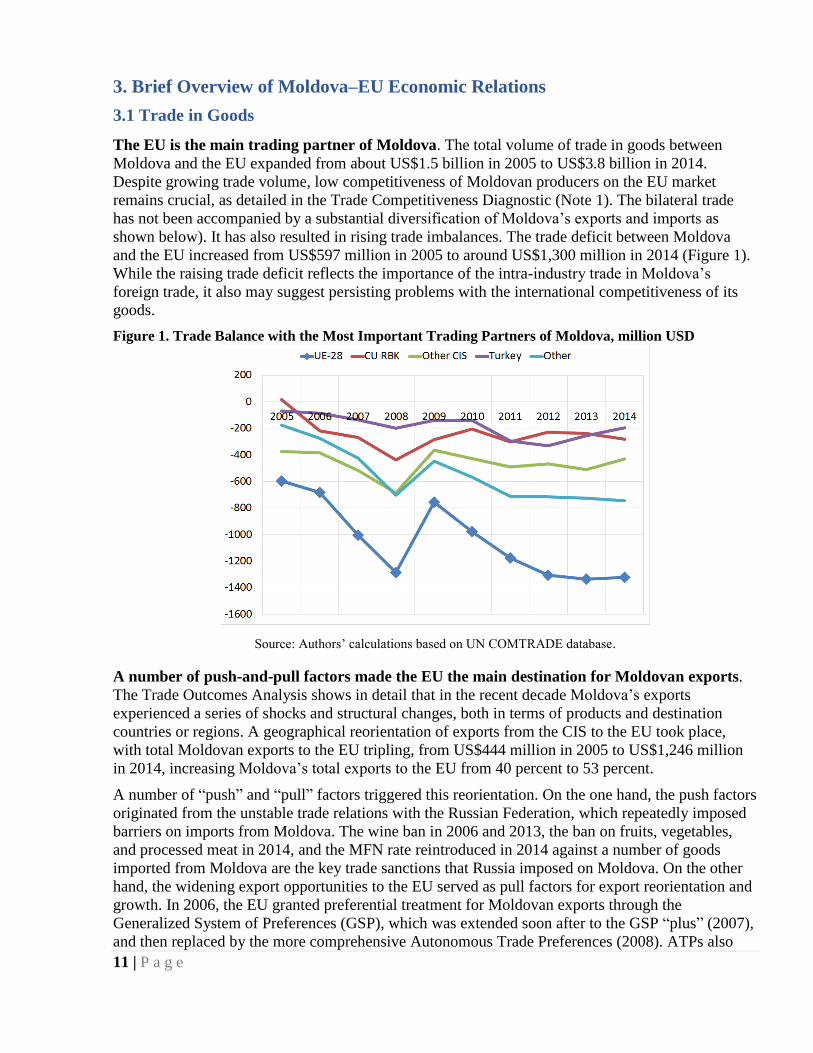
The EU is the main trading partner of Moldova. The total volume of trade in goods between
Moldova and the EU expanded from about US$1.5 billion in 2005 to US$3.8 billion in 2014.
Despite growing trade volume, low competitiveness of Moldovan producers on the EU market
remains crucial, as detailed in the Trade Competitiveness Diagnostic (Note 1). The bilateral trade
has not been accompanied by a substantial diversification of Moldova’s exports and imports as
shown below). It has also resulted in rising trade imbalances. The trade deficit between Moldova
and the EU increased from US$597 million in 2005 to around US$1,300 million in 2014 (Figure 1).
While the raising trade deficit reflects the importance of the intra-industry trade in Moldova’s
foreign trade, it also may suggest persisting problems with the international competitiveness of its
goods.
Figure 1. Trade Balance with the Most Important Trading Partners of Moldova, million USD
Source: Authors’ calculations based on UN COMTRADE database.
A number of push-and-pull factors made the EU the main destination for Moldovan exports.
The Trade Outcomes Analysis shows in detail that in the recent decade Moldova’s exports
experienced a series of shocks and structural changes, both in terms of products and destination
countries or regions. A geographical reorientation of exports from the CIS to the EU took place,
with total Moldovan exports to the EU tripling, from US$444 million in 2005 to US$1,246 million
in 2014, increasing Moldova’s total exports to the EU from 40 percent to 53 percent.
A number of “push” and “pull” factors triggered this reorientation. On the one hand, the push factors
originated from the unstable trade relations with the Russian Federation, which repeatedly imposed
barriers on imports from Moldova. The wine ban in 2006 and 2013, the ban on fruits, vegetables,
and processed meat in 2014, and the MFN rate reintroduced in 2014 against a number of goods
imported from Moldova are the key trade sanctions that Russia imposed on Moldova. On the other
hand, the widening export opportunities to the EU served as pull factors for export reorientation and
growth. In 2006, the EU granted preferential treatment for Moldovan exports through the
Generalized System of Preferences (GSP), which was extended soon after to the GSP “plus” (2007),
and then replaced by the more comprehensive Autonomous Trade Preferences (2008). ATPs also
12 | P a g e
covered the Transnistrian region, for which they remain in place until end of 2015. The DCFTA
enacted in 2014 will provide additional opportunities to Moldovan exporters. However, the
leadership of the Transnistrian region does not accept implementation of the DCFTA.
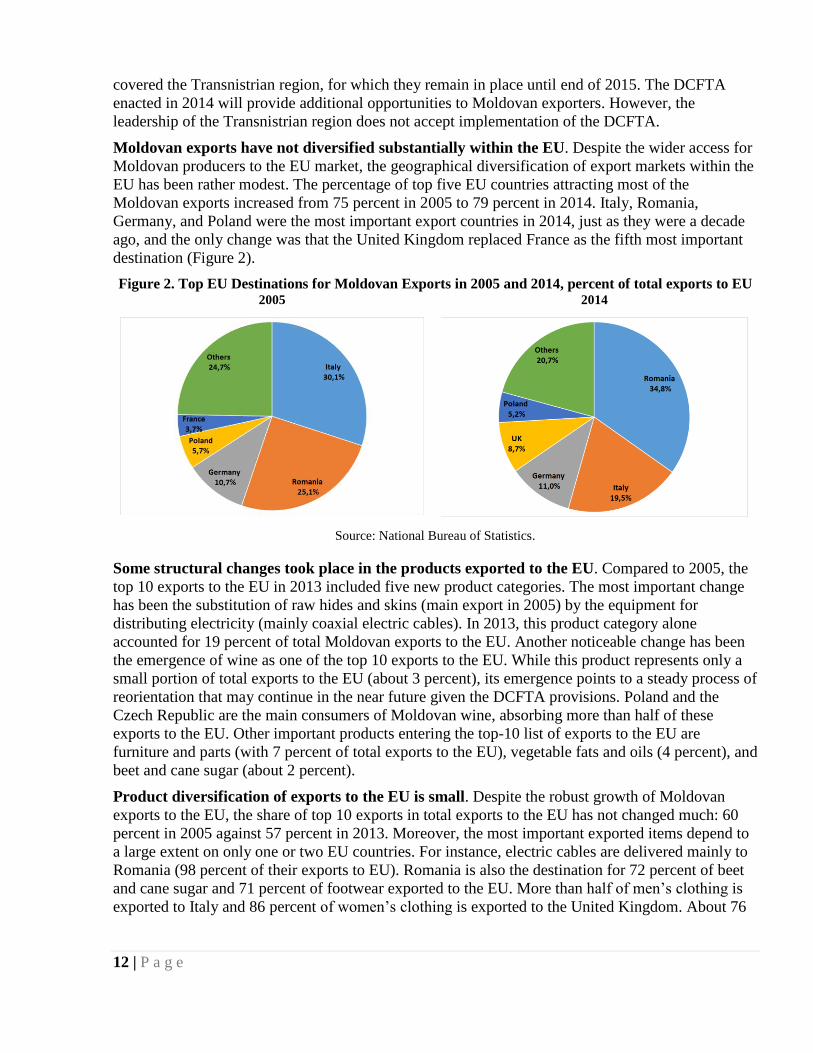
Moldovan exports have not diversified substantially within the EU. Despite the wider access for
Moldovan producers to the EU market, the geographical diversification of export markets within the
EU has been rather modest. The percentage of top five EU countries attracting most of the
Moldovan exports increased from 75 percent in 2005 to 79 percent in 2014. Italy, Romania,
Germany, and Poland were the most important export countries in 2014, just as they were a decade
ago, and the only change was that the United Kingdom replaced France as the fifth most important
destination (Figure 2).
Figure 2. Top EU Destinations for Moldovan Exports in 2005 and 2014, percent of total exports to EU 2005 2014
Source: National Bureau of Statistics.
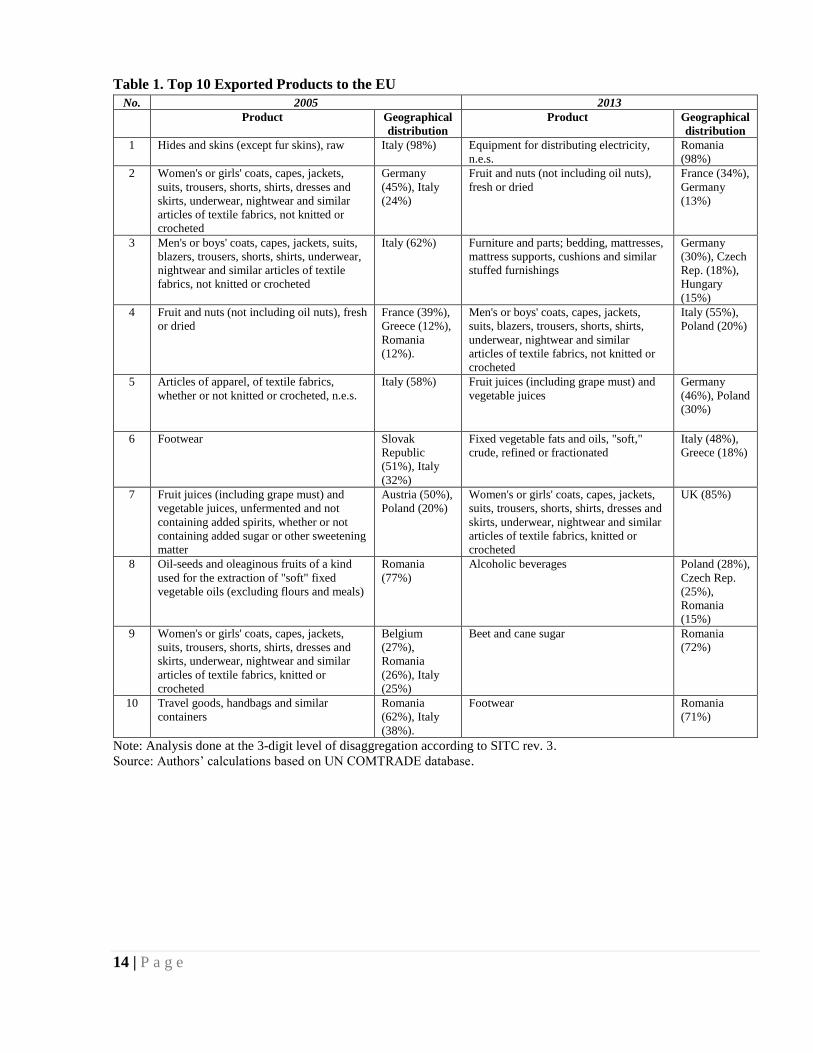
Some structural changes took place in the products exported to the EU. Compared to 2005, the
top 10 exports to the EU in 2013 included five new product categories. The most important change
has been the substitution of raw hides and skins (main export in 2005) by the equipment for
distributing electricity (mainly coaxial electric cables). In 2013, this product category alone
accounted for 19 percent of total Moldovan exports to the EU. Another noticeable change has been
the emergence of wine as one of the top 10 exports to the EU. While this product represents only a
small portion of total exports to the EU (about 3 percent), its emergence points to a steady process of
reorientation that may continue in the near future given the DCFTA provisions. Poland and the
Czech Republic are the main consumers of Moldovan wine, absorbing more than half of these
exports to the EU. Other important products entering the top-10 list of exports to the EU are
furniture and parts (with 7 percent of total exports to the EU), vegetable fats and oils (4 percent), and
beet and cane sugar (about 2 percent).
Product diversification of exports to the EU is small. Despite the robust growth of Moldovan
exports to the EU, the share of top 10 exports in total exports to the EU has not changed much: 60
percent in 2005 against 57 percent in 2013. Moreover, the most important exported items depend to
a large extent on only one or two EU countries. For instance, electric cables are delivered mainly to
Romania (98 percent of their exports to EU). Romania is also the destination for 72 percent of beet
and cane sugar and 71 percent of footwear exported to the EU. More than half of men’s clothing is
exported to Italy and 86 percent of women’s clothing is exported to the United Kingdom. About 76

13 | P a g e
percent of all exports of juices to EU are delivered to Germany and Poland (see additional details in
Table 1).
The EU is also the most important trading partner of Moldova in terms of imports of goods. In
2014, around 48 percent of total Moldovan imports came from EU-28, a very large share compared
to imports from the CU of Russia, Belarus, and Kazakhstan (17 percent) and other CIS countries (11
percent). Moldova’s imports from the EU remained highly concentrated throughout the 2005-14
(Figure 3). In 2014, around 72 percent of total imports from the EU came from only five countries
(Romania, Germany, Italy, Poland, and Austria), with little changes over the recent decade.
Figure 3. Top EU Origins of Moldovan Imports, 2005 and 2014,
percent of total imports-value of Moldova 2005 2014
Source: National Bureau of Statistics.
Structural changes in imports reflect to some extent the changes taking place in exports and
the growing role of intra-industrial trade. Petroleum oils have been the key imported item from
the EU, accounting for 18 percent of total Moldovan imports from the EU in 2013, mostly from
Romania (about 85 percent). Medicaments are the second-most important product category,
accounting for 6 percent of total imports from the EU and originating primarily from Italy,
Germany, Hungary, and France. The growing export of electric cables fueled imports of necessary
inputs (mainly from Austria, Romania, Italy, and Germany), since all companies in this sector are
operating as part of outsourcing agreements within regional value chains. The apparel industry
offers a similar business model, which explains the high share of fabrics, woven and other textile
materials in imports from the EU (mainly from Italy and Germany). Apart from being a source for
inputs for Moldova companies performing operations outsourced by EU companies, the EU is also
an important source for agricultural machinery and equipment, imported mainly from Germany and
Italy (Table 2).
14 | P a g e
Table 1. Top 10 Exported Products to the EU
No. 2005 2013
Product Geographical
distribution
Product Geographical
distribution
1 Hides and skins (except fur skins), raw Italy (98%) Equipment for distributing electricity,
n.e.s.
Romania
(98%)
2 Women's or girls' coats, capes, jackets,
suits, trousers, shorts, shirts, dresses and
skirts, underwear, nightwear and similar
articles of textile fabrics, not knitted or
crocheted
Germany
(45%), Italy
(24%)
Fruit and nuts (not including oil nuts),
fresh or dried
France (34%),
Germany
(13%)
3 Men's or boys' coats, capes, jackets, suits,
blazers, trousers, shorts, shirts, underwear,
nightwear and similar articles of textile
fabrics, not knitted or crocheted
Italy (62%) Furniture and parts; bedding, mattresses,
mattress supports, cushions and similar
stuffed furnishings
Germany
(30%), Czech
Rep. (18%),
Hungary
(15%)
4 Fruit and nuts (not including oil nuts), fresh
or dried
France (39%),
Greece (12%),
Romania
(12%).
Men's or boys' coats, capes, jackets,
suits, blazers, trousers, shorts, shirts,
underwear, nightwear and similar
articles of textile fabrics, not knitted or
crocheted
Italy (55%),
Poland (20%)
5 Articles of apparel, of textile fabrics,
whether or not knitted or crocheted, n.e.s.
Italy (58%) Fruit juices (including grape must) and
vegetable juices
Germany
(46%), Poland
(30%)
6 Footwear Slovak
Republic
(51%), Italy
(32%)
Fixed vegetable fats and oils, "soft,"
crude, refined or fractionated
Italy (48%),
Greece (18%)
7 Fruit juices (including grape must) and
vegetable juices, unfermented and not
containing added spirits, whether or not
containing added sugar or other sweetening
matter
Austria (50%),
Poland (20%)
Women's or girls' coats, capes, jackets,
suits, trousers, shorts, shirts, dresses and
skirts, underwear, nightwear and similar
articles of textile fabrics, knitted or
crocheted
UK (85%)
8 Oil-seeds and oleaginous fruits of a kind
used for the extraction of "soft" fixed
vegetable oils (excluding flours and meals)
Romania
(77%)
Alcoholic beverages Poland (28%),
Czech Rep.
(25%),
Romania
(15%)
9 Women's or girls' coats, capes, jackets,
suits, trousers, shorts, shirts, dresses and
skirts, underwear, nightwear and similar
articles of textile fabrics, knitted or
crocheted
Belgium
(27%),
Romania
(26%), Italy
(25%)
Beet and cane sugar Romania
(72%)
10 Travel goods, handbags and similar
containers
Romania
(62%), Italy
(38%).
Footwear Romania
(71%)
Note: Analysis done at the 3-digit level of disaggregation according to SITC rev. 3.
Source: Authors’ calculations based on UN COMTRADE database.

15 | P a g e
Table 2. Top 10 Imported Products from the EU
No. 2005 2013
Product Geographical
distribution
Product Geographical
distribution
1 Petroleum oils and oils obtained
from bituminous minerals (other
than crude); preparations, n.e.s.
Romania (93%) Petroleum oils and oils obtained from
bituminous minerals (other than crude)
Romania (85%)
2 Medicaments (including veterinary
medicaments)
Germany (21%),
Hungary (16%),
Slovenia (11%)
Medicaments (including veterinary
medicaments)
Italy (34%),
Germany (15%),
Hungary (11%),
France (10%)
3 Telecommunications equipment,
n.e.s., and parts, n.e.s., and
accessories of apparatus
France (35%),
Sweden (27%)
Equipment for distributing electricity,
n.e.s.
Austria (40%),
Romania (18%),
Italy (14%),
Germany (12%)
4 Insecticides, rodenticides,
fungicides, herbicides, anti-
sprouting products and plant-growth
regulators, disinfectants and similar
products
Germany (46%),
France (23%)
Heating and cooling equipment, and
parts thereof, n.e.s.
Romania (27%),
Italy (22%), Czech
Rep. (15%)
5 Motor cars and other motor vehicles
principally designed for the
transport of persons
Germany (55%) Insecticides, rodenticides, fungicides,
herbicides, anti-sprouting products and
plant-growth regulators, disinfectants
and similar products
France (33%),
Germany (29%).
6 Road motor vehicles, n.e.s. Germany (53%),
Sweden (22%)
Furniture and parts thereof; bedding,
mattresses, mattress supports, cushions
and similar stuffed furnishings
Romania (55%),
Italy (27%)
7 Fabrics, woven, of man-made
textile materials (not including
narrow or special fabrics)
Germany (33%),
Italy (27%)
Agricultural machinery (excluding
tractors), and parts
Germany (36%),
Italy (23%).
8 Perfumery, cosmetic or toilet
preparations (excluding soaps)
France (30%),
Germany (23%)
Fabrics, woven, of man-made textile
materials (not including narrow or
special fabrics)
Italy (38%),
Germany (21%)
9 Articles, n.e.s., of plastics Germany (22%),
Poland (18%),
Italy (16%)
Paper and paperboard, cut to size or
shape, and articles of paper or
paperboard
Poland (33%),
Romania (19%)
10 Alcoholic beverages France (41%),
Romania (28%),
Spain (27%)
Perfumery, cosmetic or toilet
preparations (excluding soaps)
Germany (33%),
France (27%).
Note: Analysis done at the 3-digit level of disaggregation according to SITC rev. 3.
Source: Authors’ calculations based on UN COMTRADE database.
3.2 Trade in Services
The EU is the main partner for trade in services for Moldova. Exports of services to the EU
account for 37 percent of Moldova’s total exports of services; that of imports is 45 percent (more
details on trade in services are available in the Trade Outcomes Analysis). In 2014, transportation
and communication services represented more than half of total exports of services to the EU
(Figure 4), accounting for 35 percent and 24 percent of total Moldova’s exports of services to the
EU, respectively. Compared to 2010, these shares slightly declined due to the expansion of exports
of information technology and informational services (from 9 percent of total services exports to the
EU in 2010 to 15 percent in 2014).

16 | P a g e
Figure 4. Moldova’s Exports of Services to the EU, million USD
Source: NBM.
Moldova’s services exports to the EU are only slightly more diversified than exports of goods.
The main trading partners for Moldova’s exports of services to the EU are Romania, Italy, and
Belgium, accounting for about half of exports (Figure 5). Moldova directs 40 percent of its exports
of transportation services to Romania and Belgium, and 60 percent of exports of communication
services to Romania and Italy. The markets for the IT and informational services, which are the best
performing sector of all exports of services to EU, are slightly more diversified: the main
destinations are the United Kingdom, Italy, Romania, Belgium, and Cyprus, accounting for more
than 80 percent of total exports of services to the EU.
Figure 5. Geographical Distribution of Moldova’s Exports to EU, average for 2010-2011, % of total
Source: Authors’ calculations based on NBM.
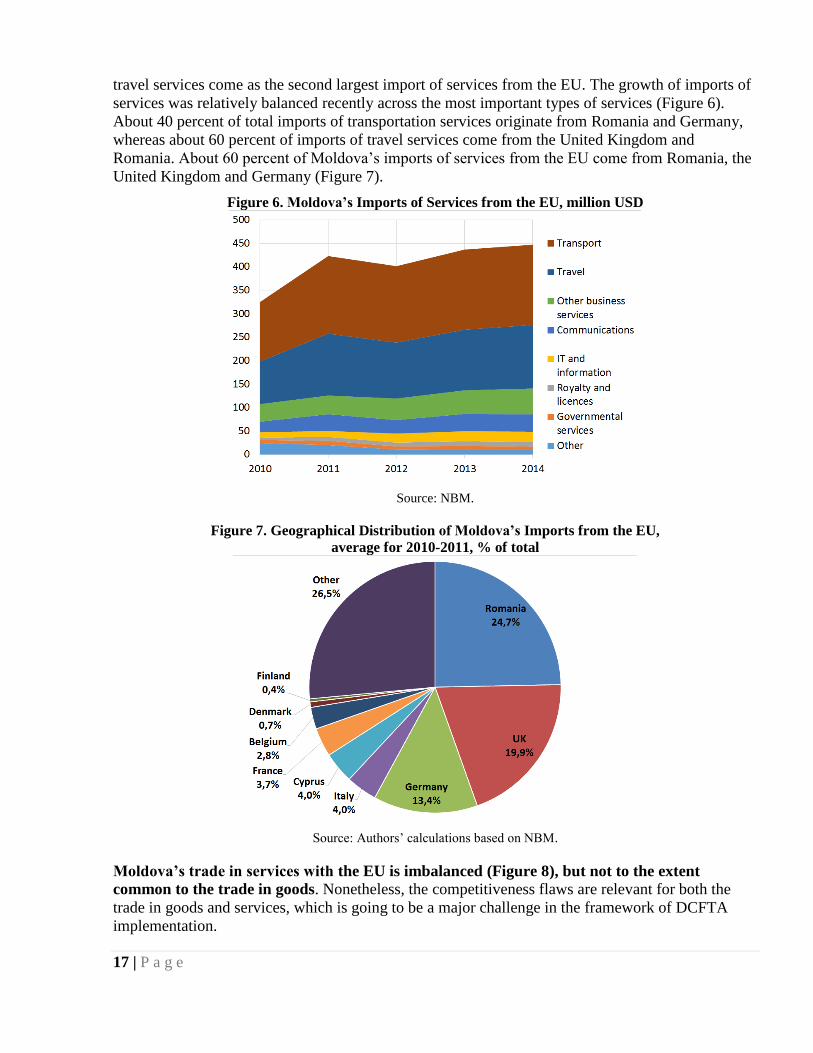
Transportation services are the most prominent among services imported from the EU. They
account for about 38 percent of total imports of services from the EU. With a share of 30 percent,
17 | P a g e
travel services come as the second largest import of services from the EU. The growth of imports of
services was relatively balanced recently across the most important types of services (Figure 6).
About 40 percent of total imports of transportation services originate from Romania and Germany,
whereas about 60 percent of imports of travel services come from the United Kingdom and
Romania. About 60 percent of Moldova’s imports of services from the EU come from Romania, the
United Kingdom and Germany (Figure 7).
Figure 6. Moldova’s Imports of Services from the EU, million USD
Source: NBM.
Figure 7. Geographical Distribution of Moldova’s Imports from the EU,
average for 2010-2011, % of total
Source: Authors’ calculations based on NBM.
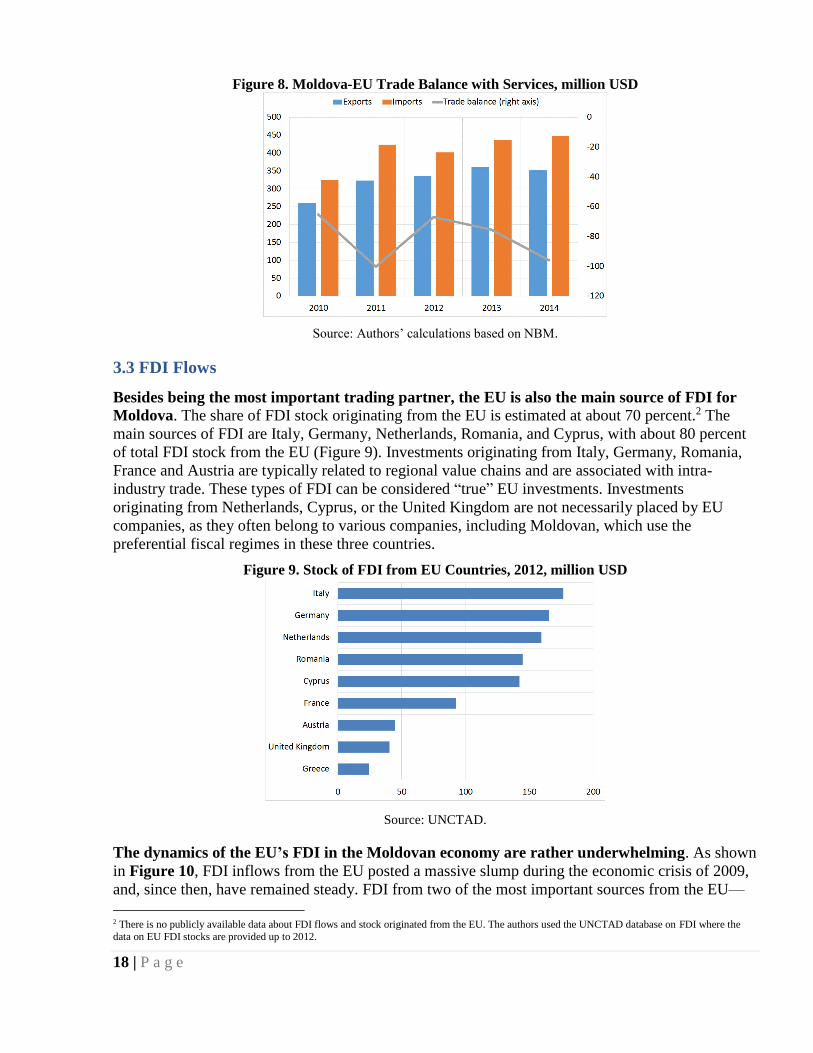
Moldova’s trade in services with the EU is imbalanced (Figure 8), but not to the extent
common to the trade in goods. Nonetheless, the competitiveness flaws are relevant for both the
trade in goods and services, which is going to be a major challenge in the framework of DCFTA
implementation.
18 | P a g e
Figure 8. Moldova-EU Trade Balance with Services, million USD
Source: Authors’ calculations based on NBM.
3.3 FDI Flows
Besides being the most important trading partner, the EU is also the main source of FDI for
Moldova. The share of FDI stock originating from the EU is estimated at about 70 percent.2 The
main sources of FDI are Italy, Germany, Netherlands, Romania, and Cyprus, with about 80 percent
of total FDI stock from the EU (Figure 9). Investments originating from Italy, Germany, Romania,
France and Austria are typically related to regional value chains and are associated with intra-
industry trade. These types of FDI can be considered “true” EU investments. Investments
originating from Netherlands, Cyprus, or the United Kingdom are not necessarily placed by EU
companies, as they often belong to various companies, including Moldovan, which use the
preferential fiscal regimes in these three countries.
Figure 9. Stock of FDI from EU Countries, 2012, million USD
Source: UNCTAD.
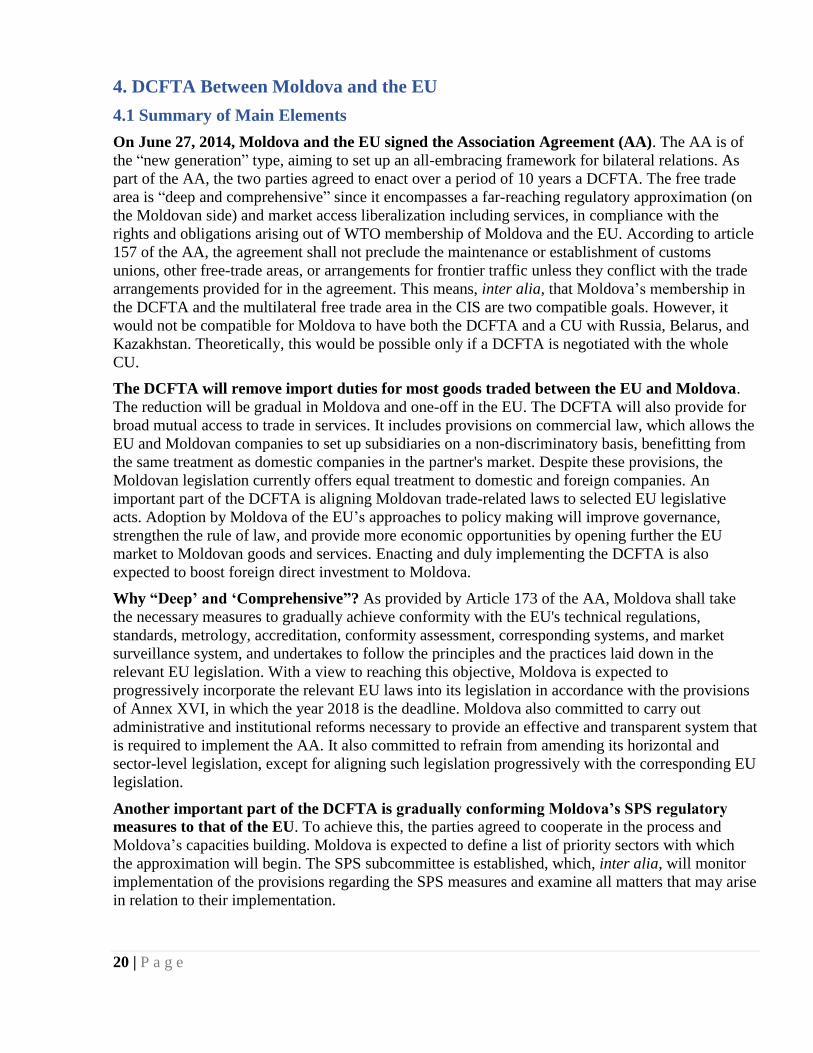
The dynamics of the EU’s FDI in the Moldovan economy are rather underwhelming. As shown
in Figure 10, FDI inflows from the EU posted a massive slump during the economic crisis of 2009,
and, since then, have remained steady. FDI from two of the most important sources from the EU—
2 There is no publicly available data about FDI flows and stock originated from the EU. The authors used the UNCTAD database on FDI where the
data on EU FDI stocks are provided up to 2012.
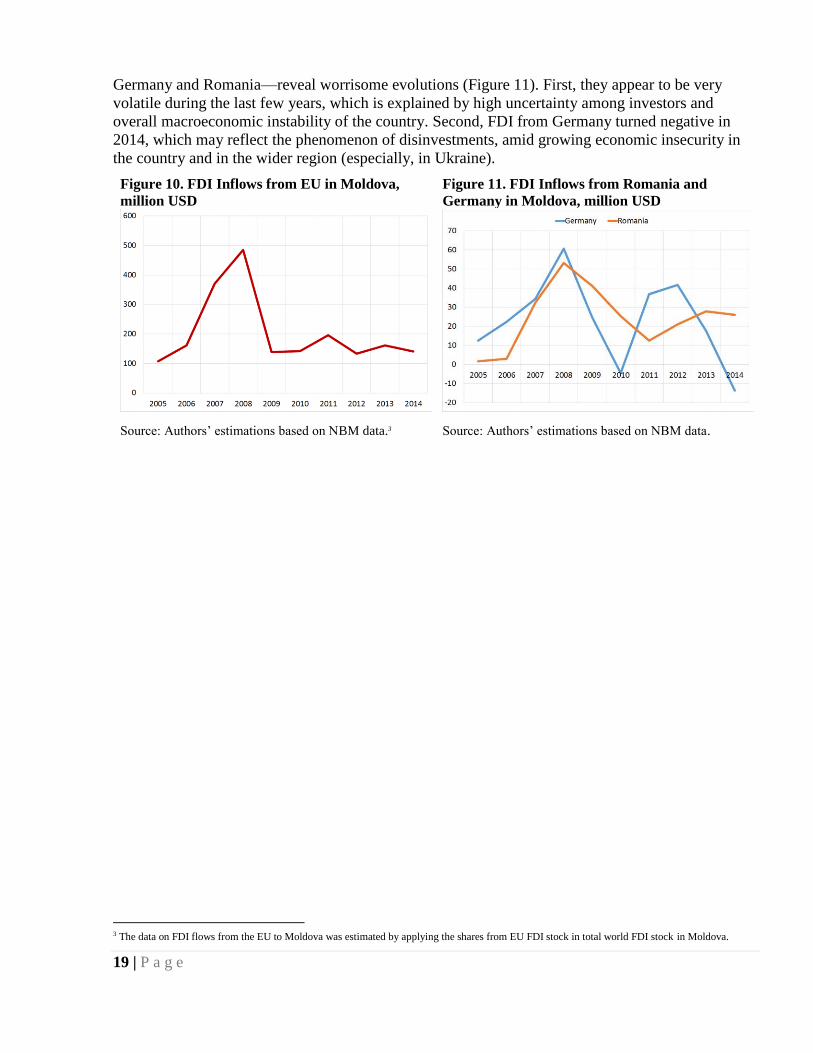
19 | P a g e
Germany and Romania—reveal worrisome evolutions (Figure 11). First, they appear to be very
volatile during the last few years, which is explained by high uncertainty among investors and
overall macroeconomic instability of the country. Second, FDI from Germany turned negative in
2014, which may reflect the phenomenon of disinvestments, amid growing economic insecurity in
the country and in the wider region (especially, in Ukraine).
Figure 10. FDI Inflows from EU in Moldova,
million USD
Figure 11. FDI Inflows from Romania and
Germany in Moldova, million USD
Source: Authors’ estimations based on NBM data.3 Source: Authors’ estimations based on NBM data.
3 The data on FDI flows from the EU to Moldova was estimated by applying the shares from EU FDI stock in total world FDI stock in Moldova.
20 | P a g e
4. DCFTA Between Moldova and the EU
4.1 Summary of Main Elements
On June 27, 2014, Moldova and the EU signed the Association Agreement (AA). The AA is of
the “new generation” type, aiming to set up an all-embracing framework for bilateral relations. As
part of the AA, the two parties agreed to enact over a period of 10 years a DCFTA. The free trade
area is “deep and comprehensive” since it encompasses a far-reaching regulatory approximation (on
the Moldovan side) and market access liberalization including services, in compliance with the
rights and obligations arising out of WTO membership of Moldova and the EU. According to article
157 of the AA, the agreement shall not preclude the maintenance or establishment of customs
unions, other free-trade areas, or arrangements for frontier traffic unless they conflict with the trade
arrangements provided for in the agreement. This means, inter alia, that Moldova’s membership in
the DCFTA and the multilateral free trade area in the CIS are two compatible goals. However, it
would not be compatible for Moldova to have both the DCFTA and a CU with Russia, Belarus, and
Kazakhstan. Theoretically, this would be possible only if a DCFTA is negotiated with the whole
CU.
The DCFTA will remove import duties for most goods traded between the EU and Moldova.
The reduction will be gradual in Moldova and one-off in the EU. The DCFTA will also provide for
broad mutual access to trade in services. It includes provisions on commercial law, which allows the
EU and Moldovan companies to set up subsidiaries on a non-discriminatory basis, benefitting from
the same treatment as domestic companies in the partner's market. Despite these provisions, the
Moldovan legislation currently offers equal treatment to domestic and foreign companies. An
important part of the DCFTA is aligning Moldovan trade-related laws to selected EU legislative
acts. Adoption by Moldova of the EU’s approaches to policy making will improve governance,
strengthen the rule of law, and provide more economic opportunities by opening further the EU
market to Moldovan goods and services. Enacting and duly implementing the DCFTA is also
expected to boost foreign direct investment to Moldova.
Why “Deep’ and ‘Comprehensive”? As provided by Article 173 of the AA, Moldova shall take
the necessary measures to gradually achieve conformity with the EU's technical regulations,
standards, metrology, accreditation, conformity assessment, corresponding systems, and market
surveillance system, and undertakes to follow the principles and the practices laid down in the
relevant EU legislation. With a view to reaching this objective, Moldova is expected to
progressively incorporate the relevant EU laws into its legislation in accordance with the provisions
of Annex XVI, in which the year 2018 is the deadline. Moldova also committed to carry out
administrative and institutional reforms necessary to provide an effective and transparent system that
is required to implement the AA. It also committed to refrain from amending its horizontal and
sector-level legislation, except for aligning such legislation progressively with the corresponding EU
legislation.
Another important part of the DCFTA is gradually conforming Moldova’s SPS regulatory
measures to that of the EU. To achieve this, the parties agreed to cooperate in the process and
Moldova’s capacities building. Moldova is expected to define a list of priority sectors with which
the approximation will begin. The SPS subcommittee is established, which, inter alia, will monitor
implementation of the provisions regarding the SPS measures and examine all matters that may arise
in relation to their implementation.

21 | P a g e
The DCFTA aims for an overhaul of Moldova’s customs administration practices. In trade
facilitation, Moldova agreed to abolish its system of customs-procedure duties that currently are
calculated on the ad valorem basis and to implement a system of duties that will be set at levels
sufficient to cover the real administrative costs. According to the AA, by Sep. 1, 2017, Moldova
committed to conform the provisions of its Customs Code to the Community Customs Code. By
Sept. 1, 2015, the key provisions of the EU legislation regarding customs enforcement of intellectual
property rights need to be included in the national legislation of Moldova.
The DCFTA goes beyond trade in goods, covering trade with services and also public
procurements. The parties reached an understanding on liberalization of a number of service
sectors and mutual application of national treatment. These agreements will not cover, though, a
number of sectors, such as public utilities, real estate, education, and some financial services. The
EU has maintained by far a greater number of reservations than Moldova. The former offers
unbound access to almost all sectors except some legal representation and legal translation services,
and public notaries. The AA recognizes that agricultural land in Moldova will not be sold to
foreigners, and allows the monopoly of the postal services (“Posta Moldovei” state company).
The AA envisages mutual access to public procurement markets on the basis of the principle of
national treatment at national, regional, and local levels for public contracts and concessions in the
public sector as well as in the utilities sector. It provides for a gradual approximation of the public
procurement legislation in Moldova with the EU rules on public procurement, accompanied with an
institutional reform and creation of an efficient public procurement system based on the principles
governing public procurement in the EU. The effective and reciprocal opening of public
procurements markets shall be attained gradually and simultaneously. During the process of
approximation, the extent of market access mutually granted shall be linked to the progress made by
Moldova in approximation of its regulatory framework as assessed by the Association Committee in
Trade configuration.
4.2 EU Schedule of Concessions on Imports of Goods from Moldova
According to the AA, the EU will eliminate all customs duties starting on the date of entry into
force of the AA (provisionally entered into force on Sept. 1, 2014). However, a number of
exceptions apply to this general rule, as explained below.
Duty-free quotas apply to a number of product positions. Nine product positions listed in the
Annex XV-A to the AA that Moldova exports to the EU are subject to annual duty-free quotas
applied by the EU (see more details in Annex 1). These products will be exported duty-free within
the quotas and will be subject to the MFN tariff in the volumes exceeding the quotas. The duty-free
quotas offered by the EU are quite high above the current level of Moldovan exports to the EU, but
as a rule are below the overall export potential for the given goods.
This means that trade with the EU may offer some cushions against future trade shocks
coming from other markets, but will not allow for a total market substitution. This may affect
apples and grapes, in particular. However, according to the provisions of the AA, the parties shall
examine, in the Association Committee in Trade configuration, on an appropriate reciprocal basis,
the opportunities for granting each other further concessions with a view to improving liberalization
of trade in agricultural products subject to tariff-rate quotas.
Anti-circumvention mechanisms are introduced as a precautionary measure. Annex XV-C of
the AA lists 14 categories of agricultural and processed goods exported from Moldova to the EU
that will be subject to anti-circumvention mechanisms applied by the EU. For each product, an

22 | P a g e
export volume is specified that will trigger the anti-circumvention mechanism (see details in Annex
2). Currently, Moldova’s export volume to the EU falls much below the trigger volumes, except for
processed dairy products. According to the AA, if the export volumes reach the trigger volumes and
in the absence of a sound justification by Moldova, the EU may temporarily suspend the preferential
treatment for the products concerned. The suspension may be lifted if Moldova offers evidence that
the volume of the relevant category of products imported in excess of the volume referred to in
Annex XV-C results from a change in its level of production and export capacity. The Annex XV-C
may be amended and the volume modified by mutual consent of the EU and Moldova at the request
of the latter, in order to reflect changes in the level of production and its export capacity.
Fixed-rate import duties will remain in place on products subject to the EU’s Entry Price
System (EPS). The EU’s EPS is designed to restrict imports below the product-specific, politically
designated entry price plus ad valorem tariff. In addition to the ad valorem tariff, the importers have
to pay fixed tariffs. While, according to the AA, the ad valorem tariff for 20 positions will be cut,
the fixed component of the import duty will remain in place, effectively raising the cost of the
Moldovan exports up to the level of the minimal entry price that is established for the products
falling under the EPS. As existing research suggests, even after abolishing the ad valorem
component of the import duty, the EPS will continue to hurt some of the Moldovan products.4
4.3 Moldova’s Schedule of Concessions on Imports from the EU
As part of the AA, Moldova agreed to eliminate all its customs duties. However, a number of
transition periods and protectionist measures apply in this case. Elimination of some duties will
take place gradually, while others are subject to duty-free quotas. In total, there are 617 distinct
products envisioned by the AA (at the level of disaggregation of eight digits) that will be subject to
these arrangements. The goods for which elimination of duties takes place gradually can be included
in six “staging” categories:
1. Category ‘5’ includes 168 goods (8-digit disaggregation according to the HS 2012), such as
plastic products, carpets, footwear, clothes, glass bottles, and furniture. The customs duties
shall be eliminated in 6 equal stages, starting on the date of entry into force of this
agreement, with the following reductions taking place on January 1 of each of the next 5
years following the date of entry into force of the AA ( i.e, full liberalization has to be
achieved by Jan 1, 2019).
2. Category ‘3’ includes 99 distinct goods, mainly plastic articles and clothes. The customs
duties shall be eliminated in four equal stages, starting on the date of entry into force of this
agreement, with the following reductions taking place on January 1 of each of the next three
years following the date of the entry into force of the AA (full liberalization by Jan 1, 2017.
3. Category ‘10-A’ includes 41 goods’ positions, meat, meat preparations, and dairy products.
The customs duties shall be eliminated over 10 years starting on January 1 of each year
following the date of entry into force of the AA (full liberalization by Jan 1, 2024).
4. Category ‘5-A’ is a large group consisting of 180 positions, of which wine and other
alcoholic beverages are the key components. The customs duties shall be eliminated over
five years starting on January 1 of each year following the date of entry into force of the AA
(full liberalization by Jan 1, 2019).
5. Category ‘3-A’ encompasses 21 positions, including cheese, various food preparations,
tomatoes, and other vegetables and legumes. The customs duties shall be eliminated over
4 Radeke, 2014.
23 | P a g e
three years starting on January 1 of each year following the date of entry into force of this
Agreement (full liberalization by Jan 1, 2017.
6. Category ‘10-S’ includes only 10 goods, including fresh fruits, fresh meat, and preparations
of meat. The elimination of customs duties shall start on January 1 of the fifth year following
the entry into force of the AA (i.e., from Jan 1, 2019. However from the AA it is not clear
what the final time horizon is. In our interpretation, full liberalization needs to be achieved
by Jan 1, 2023).
Moldova will offer six tariff-free quotas for duty-free imports of the following goods:
1. TQ1 of 4,000 tons for 16 positions of fresh, chilled, or frozen swine. For imports above the
quota, the combined import tariff of 20 percent + 200 EUR/t will be applied.
2. TQ2 of 4,000 tons for 20 positions of fresh, chilled, or frozen poultry. For imports above the
quota the combined import tariffs of 15 or 20 percent + 100 EUR/t applies.
3. TQ3 of 1,000 tons for 22 positions of dairy products. The MFN rate applied is 15 percent; in
case of butter and spreads a fixed component of 500 EUR/t is added.
4. TQ4 of 1,700 tons for 16 positions of meat preserves. The MFN rate applied is 15 and 20
percent.
5. TQ5 of 5,400 tons for seven positions of sugar. The MFN rate applied to imports in excess
will be 75 percent.
6. TQ6 of 640 tons for 17 positions of processed sugar products, such as molasses, maltose,
and glucose. The same 75 percent MFN rate applies to everything in excess of the quota.
As of the effective date of the AA, most of Moldova’s imports from the EU are already duty-
free. Annex 3 summarizes Moldova’s tariff concessions at the level of 6-digits disaggregation of
goods and by types of concessions. For presentation purposes, the disaggregation used in Annex 3 is
different from the one used in the AA. As shown in Annex 3, almost 46 percent of goods imported
from EU are already covered by zero percent MFN import duty. For another 47 percent of the traded
goods, there was an immediate reduction of very small tariffs as of the effective date of the AA.
Aside from the goods covered by tariff-free quotas, the Jan. 1, 2024, is the latest date by which full
liberalization of imports by Moldova needs to be achieved.
4.4 Customs and Trade Facilitation
DCFTA includes ambitious provisions regarding trade facilitation. Moldova has a rather poor
performance in trade facilitation, as shown by the World Bank Logistics Performance Index for
2014. It ranks 94th in the world out of the 160 countries evaluated. While Moldova has moved up
from the 106th place in 2007, there have been only minor improvements in its absolute performance,
as Moldova’s overall score increased from 2.31 in 2007 to 2.65 in 2014. The DCFTA includes a
number of provisions meant to improve Moldova’s performance in trade facilitation. Among the
trade facilitation measures envisaged to be adopted by Moldova under the DCFTA, some stand out:
Apply a single administrative document for customs declarations.
Take measures that lead to greater efficiency, transparency, and simplification of customs
procedures and practices at the border.
Apply modern customs techniques, including risk assessment, post clearance controls and
company audit methods, to simplify and facilitate the entry and release of goods.
Introduce and apply simplified procedures for authorized traders according to objective and
non-discriminatory criteria.
24 | P a g e
Simplify requirements and formalities, wherever possible, with respect to the rapid release
and clearance of goods.
Parties also agreed to prohibit as of Jan.1, 2015, all administrative fees having an equivalent
effect to import or export duties and charges (this was the case in Moldova, where customs
procedures fees were imposed on ad-valorem basis). By reducing the related transaction costs, all
these measures are expected to have an important impact on the trade flows of Moldova, not only
with EU, but also with other trading partners. The economic simulations we ran confirm this
expectation.
4.5 Provisions of the DCFTA Concerning Trade in Services
The DCFTA foresees a progressive reciprocal liberalization of establishment of companies and
commercial entities and trade in services. According to the provisions of Article 205, once the
agreement is in force, the two parties shall grant treatment not less favorable than MFN or national
treatment to subsidiaries, branches, and representative offices of the other party.
The EU has many reservations, which in some cases may represent critical constraints to
market access for Moldovan service providers. For instance, according to derogations in the
DCFTA, in Estonia, at least half of the members of a company’s management board shall have their
residence in the Union. Hungary does not offer national treatment and most favored nation treatment
obligations for the acquisition of state-owned properties. In France, purchases by natural or juridical
persons of Moldova exceeding one-third of the shares of capital or voting rights in existing French
enterprises are subject to prior notification, verification and, in some cases, government approval.
At the EU level, full admission to the Bar is required for the practice of domestic (EU and
member state) law, which is subject to a nationality condition and/or residency requirement. For road transport services, full incorporation is required (no branching) for cabotage operations and
the residency requirement for the transport manager also applies. In case of professional services,
EU directives on mutual recognition of diplomas only apply to nationals of member states. The right
to practice a regulated professional service in one member state does not grant the right to practice
in another member state, and many of the services provided are subject to economic needs tests in
the given country.
In case of Moldova, there are fewer and less binding reservations regarding import of services
from the EU. Some rather mild limits apply to establishments and modes of provisions. Foreign
residents are entitled to purchase land except for agriculture land and forestry land. Legal services
related to representation in courts and other public authorities under Moldovan law can be provided
by a legal professional from the EU upon association with a local lawyer or following a one-year
internship to get a license in Moldova. The practice of medicine by EU nationals requires permission
from local health authorities, based on an economic needs test. The ‘Posta Moldova’ State Company
will retain its monopoly for international postal services, as well as internal postal services related to
letters up to 350 grams. Moldova has no significant reservations related to contractual service
providers, independent professionals, key personnel, and cross-border provision of services.
4.6 Review of Existing Literature on Results of Previous DCFTAs Signed Between the
EU and Third Countries
The DCFTA is a new concept. The EU has signed with a number of countries quite ambitious
Association Agreements comparable to the EU-Moldova AA by depth and breadth of envisaged

25 | P a g e
trade liberalization. Despite the importance of the topic and the existence of factual data, there is
surprisingly little ex post analytical evidence of the impact of the existing FTAs.
Chile-EU FTA. Chile and the EU enacted an FTA in 2002. A research paper undertaken in 2012
using a CGE model assessed that at the aggregate level, comparing the situation under the agreement
with a counterfactual state of the economy without the Agreement, Chilean exports of goods were
higher by around 20 percent, and the EU’s exports to Chile by more than 60 percent.5 However, the
impact of the FTA on output and income has been found to be relatively modest.
Morocco-EU Association Agreement. The Morocco and EU agreement became effective in
March 2000 and was aimed at establishing a free trade regime by 2012. The association agreement
calls for free trade in industrial goods to be phased in over 12 years, but excludes selected
agricultural goods. The FTA effectively translated into a unilateral liberalization of domestic
industries by Morocco as the latter already benefited from duty–free access for its exports to the EU
due to previous preferential agreements.
Results of an ex ante study comparing the EU-Morocco FTA with the potential outcomes of a
multilateral liberalization show that the FTA with the EU generates a welfare loss for
Morocco in two of the three scenarios examined as part of a multi-country CGE model.6 Much
of the loss arises from substantial terms-of-trade losses that outweigh the modest gains in resource
allocation efficiency. The latter is dampened due to the discriminatory nature of tariff removal under
the FTA, as well as the added distortions from the consumption tax for revenue replacement.
Most of the manufacturing sectors contract under the FTA and only few export-oriented
sectors, such as clothing, expand production. Hence it appears that the main effect of the FTA
with the EU is to lock the Moroccan manufacturing sector even more firmly into its current pattern
of specialization, favoring a few labor-intensive sectors such as wearing and apparel, for which
preferential access to the EU market is significant. The latter conclusion is supported by other
research, suggesting that the implementation of an FTA may lead to a reallocation of industrial
production toward even more specialization in labor-intensive products.7
Tunisia-EU Association Agreement. One study, using a dynamic trade gravity model, has found
that the FTA enacted between the two parties in 1995 has led to significant trade between the two
parties.8 As for trade diversion vis-à-vis the rest of the world, the report shows no significant
diversion of trade to the detriment of the EU countries. However, while the agreement did not
generate a negative effect in the sense of import diversion, there was a diversion effect in case of
exports.
Armenia-EU DCFTA. There is an excellent ex ante assessment of the impact of the DCFTA
between Armenia and EU,9 even though in 2013 Armenia canceled the negotiations after deciding to
join the Russia-Belarus-Kazakhstan CU. In this paper, the authors use a 21-sector CGE model of
Armenia to assess the impact on Armenia of a DCFTA with the EU, as well as further regional or
multilateral trade policy commitments. They find that a DCFTA with the EU will likely result in
substantial gains to Armenia, and show that the gains derive from the deep aspects of the agreement.
In order of importance, the sources of the gains are:
5 Jean, Mulder and Ramos, April 2012. 6 Elbehri, 2004. 7 Achy and Milgram, 2005. 8 Zidi and Dhifallah, 2013. 9 Jensen and Tarr, 2012.
26 | P a g e
trade facilitation and reduction in border costs;
services liberalization; and
standards harmonization.
A shallow agreement with the EU that focuses only on preferential tariff liberalization in goods will
likely lead to small losses to Armenia primarily due to a loss of productivity from lost varieties of
technologies from the Rest of the World region in manufactured products. Authors show that
additional gains can be expected in the long run from an improvement in the investment climate.
An ex ante assessment of the impact of the DCFTA between Moldova and the EU was done in
2012 by ECORYS and CASE.10 Using a CGE model, the study found that in the long run, the
change in national income for Moldova is significant, while the estimated GDP will increase by 5.4
percent. Moldovan exports are estimated to increase by 16 percent, while imports increase by 8
percent. The relative increase in Moldovan exports as a result of this DCFTA is thus larger than the
increase in imports. However, given that exports grow from a lower baseline than imports, the trade
deficit may remain little affected in absolute terms.
Wages in Moldova are projected to increase on average by 4.8 percent over the long run. Meanwhile, the overall consumer price index is expected to decrease by about 1.3 percent over the
long run. This implies that, on average, purchasing power of Moldovan citizens increases because of
the DCFTA. The ex ante evaluations suggested differentiated impacts on the economic sectors
arising as a result of the DCFTA. Sectors with expected output increases of more than 10 percent
include air transport, other machinery and equipment, textiles and clothing and primary metals.
Livestock and meat products, beverages and tobacco, other manufacturing, motor vehicles, and
electronics and computers were expected to contract between 5 and 24 percent. The study
recommended DCFTA negotiators to allow for phasing in of tariff reductions and regulatory
approximation for sectors where the negative impacts will be high. As shown above, Moldova
negotiated transition periods for most of the important sectors.
10 ECORYS and CASE, 2012.
27 | P a g e
5. Quantitative Estimation of the DCFTA’s Impact
5.1 DCGE Model Description
The DCGE model used for the purposes of this paper represents an extended and adjusted
version of the standard model fully documented in Lofgren et al (2002). A CGE static model of
the Moldovan economy exists and has been used in the past to estimate the potential impact of
various policy shocks.11 The model has been transformed from static into a recursive-dynamic one,
using a similar approach to that of Thurlow (2004) for South Africa. A similar model has been used
in Breisinger et al. (2009) to analyze the optimal allocations of future revenues from the recently
discovered offshore oil in Ghana.
Models in this class assume that economic agents have only adaptive expectations, i.e., no
inter-temporal optimization decisions are made, which allows the model to be solved as a
sequence of equilibriums in time. Changes in the factors endowment (capital as endogenous
variable, labor as exogenous one), in total population and in a number of trade- and activity-related
parameters (customs duties, regional export and import prices, import- and export-related
transaction costs, AVE tariff on import of services, production costs and FDI) are determining the
model’s dynamics.
Capital endowment updates are based on a function that considers the sector-specific returns
on capital investments and the previous shares of the sector in the total distributed investment
capital. An equation similar to that used in Robinson et al. (2002) has been included in the model to
update the changes in the total factor productivity of the downstream industries following the
liberalization of the import of services.
This model is calibrated on the basis of a Moldova’s SAM for 2011. The SAM has been
developed by the authors using statistical data provided by the National Bureau of Statistics,
National Bank of Moldova, the Ministry of Finance, and the Customs Services of Moldova.
Moldova’s SAM has a high level of disaggregation, including:
Fifteen types of economic activities,
Fifty-four goods and services,
Three types of transaction costs,
Four types of factors of production,
Households disaggregated by quintiles and areas of residence, government,
Five types of taxes,
Two types of the custom duties disaggregated by geographical region and by goods, and
Six geographical regions with which Moldova conducts its international trade.
To reflect the high rate of informal activity in the Moldovan economy, besides labor, self-
employment in the agricultural and other sectors have been introduced in the model as distinct
factors of production. Table 3 provides a full list of accounts included in the Moldovan DCGE.
To allow for the simulation of all scenarios of interest, the model includes six trading regions.
The trading regions are: 1) Russia; 2) Belarus and Kazakhstan; 3) Other CIS countries; 4) EU28; 5)
Turkey and 6) Rest of the World. The need to treat Russia separately from the other two members of
the CU—Belarus and Kazakhstan—-has been determined by the fact that the two countries did not
11 Prohnițchi, 2012.

28 | P a g e
accept Russia’s trade trade restrictions on imports from Moldova. The inclusion of Turkey as a
distinct trade region has been determined by the fact that Moldova and Turkey negotiated and signed
a free trade agreement, which was the EU’s precondition for the DCFTA with Moldova (Turkey is
in CU with the EU).
Table 3. List of Accounts in the SAM and in the Moldova DCGE Model Activities:
1. Corporate agriculture and fishery
2. Small agriculture
3. SPS-sensitive food industries
4. Non SPS-sensitive food industries
5. Non-food manufacturing industries
6. Electricity, gas and water
production and distribution
7. Construction
8. Trade, hotels, restaurants, repair
services
9. Transport services
10. Communication services
11. Financial services
12. Real-estate services
13. Computer services and R&D
14. Other commercial services
rendered mainly to companies
15. Public services
16. Other private services
Factors of production:
1. Labor
2. Capital
3. Self-employment in agriculture
4. Self-employment in other sectors
Domestic institutions:
1. Enterprises
2. Government
3. First quintile rural households
4. Second quintile rural households
5. Third quintile rural households
6. Fourth quintile rural households
7. Fifth quintile rural households
8. First quintile urban households
9. Second quintile urban households
10. Third quintile urban households
11. Fourth quintile urban households
12. Fifth quintile urban households
Commodities:
17. Cereals and other crops
18. Vegetables, horticultural specialties
and nursery products
19. Fruit, nuts, beverage and spice
crops (includes grapes)
20. Products of cattle, sheep, goats,
horses, asses, mules and hinnies;
dairy farming
21. Other animals products (including
swine, poultry, eggs)
22. Agricultural and animal husbandry
service activities
23. Forestry and fisheries
24. Extraction of raw materials
25. Meat and meat products and fish
and fish products
26. Fruits and vegetables
27. Oils and fats
28. Dairy products
29. Cereal products
30. Animal feed and other food
products
31. Beverages
32. Tobacco products
33. Textile products
34. Clothing
35. Leather and leather products
36. Wood products
37. Paper and paper products
38. Printing and publishing
39. Coke, oil refinery, chemical
40. Rubber and plastics
41. Other non-metallic minerals
42. ‘Heavy industry’ goods
(metallurgy, finished metal
products, machinery and
equipment
43. Furniture and other products
44. Waste recovery and recycling
45. Electricity, gas, water distribution
Commodities (continued):
46. Construction
47. Trade, hotels and restaurants, repair
services Transport and
warehousing
48. Communication
49. Financial activities
50. Real estate transactions
51. Computers and related activities
and R&D services
52. Other commercial activities
53. Public services
54. Other private services
Trading regions:
1. Russia
2. Belarus and Kazakhstan
3. Other CIS countries
4. EU27
5. Turkey
6. Other countries – rest of the world
Taxes:
1. Payroll tax
2. Other taxes on production (net of
other subsidies on production)
3. Direct taxes
4. VAT
5. Other indirect taxes on products
(net of subsidies on products)
Customs duties:
1. Import tariff every region and
imported good
2. Customs procedures fee for every
region and imported good
Capital accounts:
1. Savings-Investments
2. Stock changes
Transaction costs:
1. Domestic
2. Export-related
3. Import-related
Source: the Moldova DCGE model.
All CGE models involve the so-called factor markets and macroeconomic closure rules. The
Moldovan DCGE model includes three macroeconomic balances: the current government balance,
the external balance (the current account of the balance of payments, which includes the trade
balance), and the saving-investment balance. It also includes labor factor and self-employment
factor market balance. Each macroeconomic account and the labor factor market can balance in
alternative ways (Table 4) and have been sequentially tested in the model. It is important to mention
that the choices made for the macroeconomic balances and for the factors markets balance has no
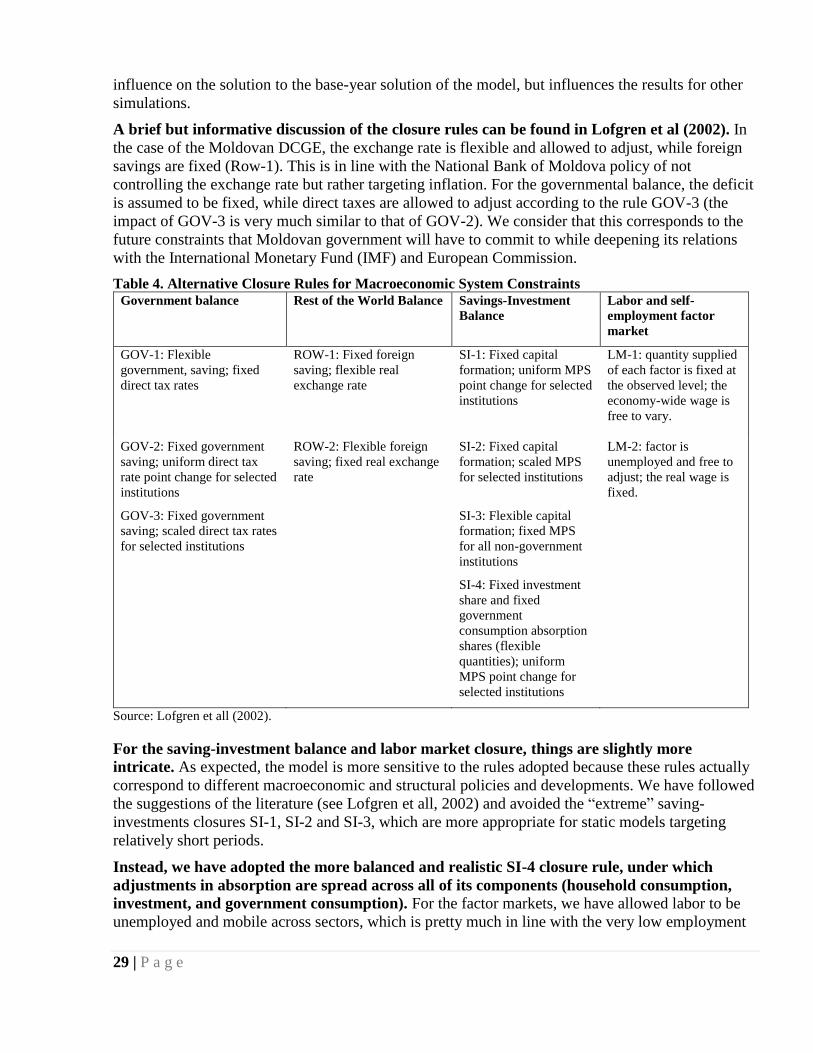
29 | P a g e
influence on the solution to the base-year solution of the model, but influences the results for other
simulations.
A brief but informative discussion of the closure rules can be found in Lofgren et al (2002). In
the case of the Moldovan DCGE, the exchange rate is flexible and allowed to adjust, while foreign
savings are fixed (Row-1). This is in line with the National Bank of Moldova policy of not
controlling the exchange rate but rather targeting inflation. For the governmental balance, the deficit
is assumed to be fixed, while direct taxes are allowed to adjust according to the rule GOV-3 (the
impact of GOV-3 is very much similar to that of GOV-2). We consider that this corresponds to the
future constraints that Moldovan government will have to commit to while deepening its relations
with the International Monetary Fund (IMF) and European Commission.
Table 4. Alternative Closure Rules for Macroeconomic System Constraints Government balance Rest of the World Balance Savings-Investment
Balance
Labor and self-
employment factor
market
GOV-1: Flexible
government, saving; fixed
direct tax rates
ROW-1: Fixed foreign
saving; flexible real
exchange rate
SI-1: Fixed capital
formation; uniform MPS
point change for selected
institutions
LM-1: quantity supplied
of each factor is fixed at
the observed level; the
economy-wide wage is
free to vary.
GOV-2: Fixed government
saving; uniform direct tax
rate point change for selected
institutions
ROW-2: Flexible foreign
saving; fixed real exchange
rate
SI-2: Fixed capital
formation; scaled MPS
for selected institutions
LM-2: factor is
unemployed and free to
adjust; the real wage is
fixed.
GOV-3: Fixed government
saving; scaled direct tax rates
for selected institutions
SI-3: Flexible capital
formation; fixed MPS
for all non-government
institutions
SI-4: Fixed investment
share and fixed
government
consumption absorption
shares (flexible
quantities); uniform
MPS point change for
selected institutions
Source: Lofgren et all (2002).
For the saving-investment balance and labor market closure, things are slightly more
intricate. As expected, the model is more sensitive to the rules adopted because these rules actually
correspond to different macroeconomic and structural policies and developments. We have followed
the suggestions of the literature (see Lofgren et all, 2002) and avoided the “extreme” saving-
investments closures SI-1, SI-2 and SI-3, which are more appropriate for static models targeting
relatively short periods.
Instead, we have adopted the more balanced and realistic SI-4 closure rule, under which
adjustments in absorption are spread across all of its components (household consumption,
investment, and government consumption). For the factor markets, we have allowed labor to be
unemployed and mobile across sectors, which is pretty much in line with the very low employment
30 | P a g e
rates in the country. For self-employment, we admit that it is fixed (everyone willing to employ her-
or himself has already done this).
5.2 Data Discussion
In general, Moldovan data available for the calibration of a DCGE model are of high quality
and reliable, except for some distortions caused by Transnistrian foreign trade. Companies
residing in the Transnistrian breakaway region do not report to national statistical and fiscal
authorities. Neither do the surveys implemented by National Bureau of Statistics of Moldova cover
the Transnistrian region. This is why the data in the Moldovan System of National Accounts (SNA)
do not cover production and consumption in the Transnistrian region. However, they do partially
cover the Transnistrian trade, even though this is not officially recognized by Moldovan statistical
authorities.
Formally the authorities are right, because most of the companies operating in Transnistrian region
undertake their international trade operations through subsidiaries registered in Chisinau, and their
(often only documentary rather than physical) shipments to trade operators in Chisinau are
obviously not recorded as imports to Moldova. However, afterwards the shipped goods become part
of Moldovan exports when they are sent abroad as goods with Moldovan origin. Because of this
phenomenon, in the national input-output tables we can note some sectors, such as metallurgy,
footwear, and others, for which the reported domestic production is smaller than the reported
volume of exports.
For another category of goods—road and other transport equipment—there is a similar domestic
production-export inconsistency, which does not alleviate even when considering the imports. As
production of roads and other transport equipment is not present in Transnistria, we believe that in
this case the distortion is caused by some unregistered (yet permanent in the recent decade or so)
cross-border flows.
In choosing among possible solutions for removal of statistical inconsistencies, we have decided
to adjust the foreign trade figures rather than to artificially increase the level of domestic
output. This decision has been made considering the fact that Transnistria does not yet recognize
the DCFTA and because this solution involves smaller adjustments to the SAM. Therefore, a
number of adjustments have been made by reducing the exports and imports in the SAM so that
domestic exports do not exceed domestic production when controlling for the level of imports. The
same treatment has been applied to the road and other transport equipment category.
Using available statistical data, we have estimated some of the most important elasticity
coefficients that are necessary for a DCGE model. In particular, we have used econometric
techniques to estimate the Armington elasticity coefficients of substitution between domestic and
imported goods (see technical details in Box 1). The results are shown in Table 5. In addition, a
number of coefficients for elasticity of transformation between goods for domestic markets and
those for exports have been estimated (Box 2 for technical details). Existing data also allowed the
authors to estimate the elasticity of factor-substitution between labor and capital as part of a CES
production function for the value-added (Table 6). Unfortunately, statistical data has been sufficient
only to estimate the elasticity of factor substitution for agriculture (0.30) and for the manufacturing
sector (1.39).

31 | P a g e
Box 1: Armington Elasticity Coefficients of Substitution The elasticity of substitution in demand between imported and domestically produced goods is measured by the so-
called Armington elasticity (Armington, 1969). The importance of calculating this indicator is revealed by the
differentiation of products with respect to their origin, as well as by the imperfect substitution between imported and
domestically produced goods. Particularly, the elasticities reflect the degree to which changes in the prices of
imported commodities influence the prices of domestic commodities. Thus, a higher value of this parameter reflects a
closer degree of substitution (if products are identical, the elasticity will be infinite), while a lower value reveals that
the domestic and imported products are very different and cannot be substitutes.
The Armington elasticities are calculated for the main sectors of the Moldovan economy, using the following
formula:
ln (𝑋𝑗𝑡
𝑖
𝑋𝑗𝑡𝑑) = 𝛽0 + 𝛽1 ln (
𝑃𝑗𝑡𝑑
𝑃𝑗𝑡𝑖
) + 𝑢𝑡
Where:
𝑋𝑗𝑡𝑖 is the quantity of imported commodity by sector j at time t;
𝑋𝑗𝑡𝑑 is the quantity of domestically produced commodity by sector j at time t;
𝑃𝑗𝑡𝑖 – is the price of imported commodity j at time t;
𝑃𝑗𝑡𝑑 - is the price of domestically produced commodity j at time t;
The Armington elasticity is given by the coefficient 𝛽1.
The model is estimated using Ordinary Least Squares, with stationary time series and statistically significant
coefficients.
The main data source is the national accounts, provided by the National Bureau of Statistics. The values of imports
and domestic production are presented in comparable prices. Domestic production has been estimated by subtracting
the value of own exports (without re-exports), in order to operate only with goods produced and sold domestically.
The share of re-exports has been computed using the UN COMTRADE data.
The price indexes for imported (𝑃𝑗𝑡𝑖 ) and domestically produced commodities (𝑃𝑗𝑡
𝑑) has been estimated based on the
following principle:
𝑃𝑗𝑡𝑖 =
𝑖𝑚𝑝𝑜𝑟𝑡𝑠𝑡𝑐𝑢𝑟𝑟𝑒𝑛𝑡 𝑝𝑟𝑖𝑐𝑒𝑠
𝑖𝑚𝑝𝑜𝑟𝑡𝑠𝑡𝑐𝑜𝑚𝑝𝑎𝑟𝑎𝑏𝑙𝑒 𝑝𝑟𝑖𝑐𝑒𝑠 ∗ 100% and 𝑃𝑗𝑡
𝑑 =𝑝𝑟𝑜𝑑𝑢𝑐𝑡𝑖𝑜𝑛𝑡
𝑐𝑢𝑟𝑟𝑒𝑛𝑡 𝑝𝑟𝑖𝑐𝑒𝑠
𝑝𝑟𝑜𝑑𝑢𝑐𝑡𝑖𝑜𝑛𝑡𝑐𝑜𝑚𝑝𝑎𝑟𝑎𝑏𝑙𝑒 𝑝𝑟𝑖𝑐𝑒𝑠 ∗ 100%
The model has been estimated for the time span 2002-2013, using annual data series. The results are presented in the
Table 5.
Source: authors.
Box 2: Constant Elasticity of Transformation (CET) for Several Moldovan Sectors It is necessary to make a reasonable assumption that the goods produced for export may be different (in terms of
prices, quality and other features) from those sold domestically. CET measures the elasticity of transformation of
production between domestically produced commodities that are sold inside the country and the exported ones. The
expected value of this parameter is negative, as higher export prices will orient the producer to the export market and
diminish the volume of domestic sales (and vice versa). The constant elasticities of transformation are calculated for
the main sectors of the Moldovan economy, using the following formula:
ln (𝑥𝑗𝑡
𝑒
𝑥𝑗𝑡𝑑) = 𝛽0 + 𝛽1 ln (
𝑝𝑗𝑡𝑑
𝑝𝑗𝑡𝑒 ) + 𝑢𝑡
Where:
𝑥𝑗𝑡𝑑 is the quantity of domestic supply of sector j at time t;
𝑥𝑗𝑡𝑒 is the quantity of exports of sector j at time t;
𝑝𝑗𝑡𝑑 is the price of domestic good of sector j at time t;
𝑝𝑗𝑡𝑒 is the price of exported good of sector j at time t;
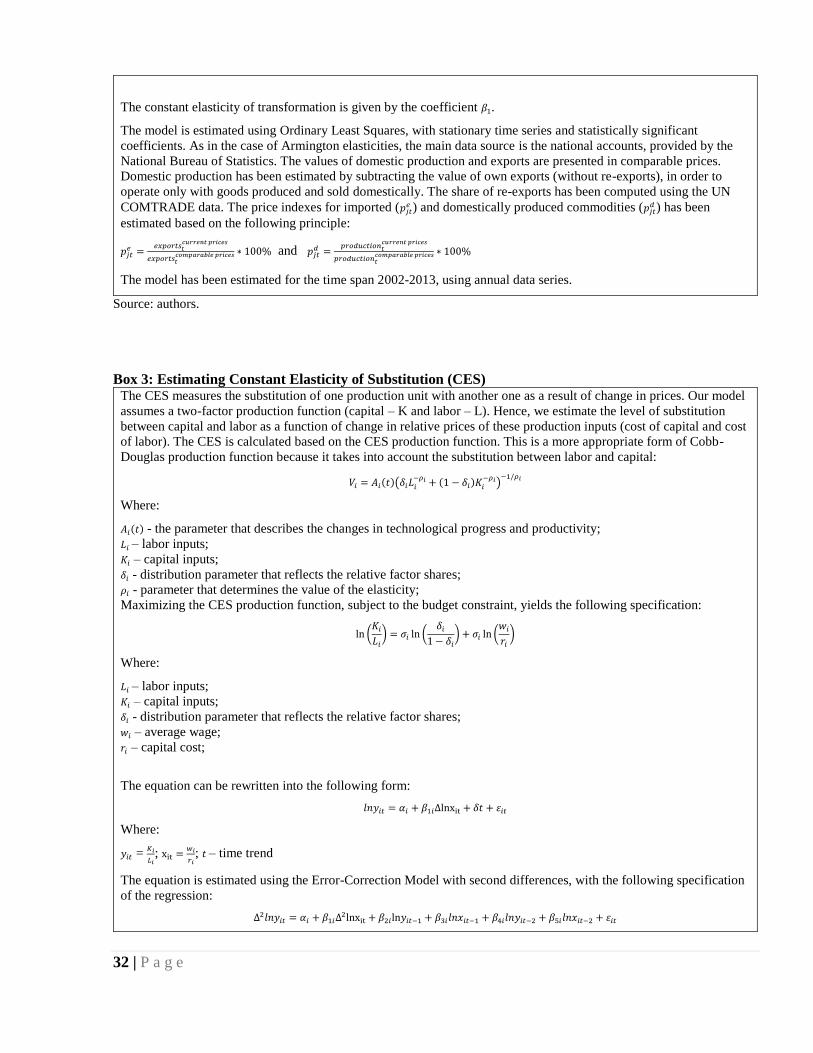
32 | P a g e
The constant elasticity of transformation is given by the coefficient 𝛽1.
The model is estimated using Ordinary Least Squares, with stationary time series and statistically significant
coefficients. As in the case of Armington elasticities, the main data source is the national accounts, provided by the
National Bureau of Statistics. The values of domestic production and exports are presented in comparable prices.
Domestic production has been estimated by subtracting the value of own exports (without re-exports), in order to
operate only with goods produced and sold domestically. The share of re-exports has been computed using the UN
COMTRADE data. The price indexes for imported (𝑝𝑗𝑡𝑒 ) and domestically produced commodities (𝑝𝑗𝑡
𝑑 ) has been
estimated based on the following principle:
𝑝𝑗𝑡𝑒 =
𝑒𝑥𝑝𝑜𝑟𝑡𝑠𝑡𝑐𝑢𝑟𝑟𝑒𝑛𝑡 𝑝𝑟𝑖𝑐𝑒𝑠
𝑒𝑥𝑝𝑜𝑟𝑡𝑠𝑡𝑐𝑜𝑚𝑝𝑎𝑟𝑎𝑏𝑙𝑒 𝑝𝑟𝑖𝑐𝑒𝑠 ∗ 100% and 𝑝𝑗𝑡
𝑑 =𝑝𝑟𝑜𝑑𝑢𝑐𝑡𝑖𝑜𝑛𝑡
𝑐𝑢𝑟𝑟𝑒𝑛𝑡 𝑝𝑟𝑖𝑐𝑒𝑠
𝑝𝑟𝑜𝑑𝑢𝑐𝑡𝑖𝑜𝑛𝑡𝑐𝑜𝑚𝑝𝑎𝑟𝑎𝑏𝑙𝑒 𝑝𝑟𝑖𝑐𝑒𝑠 ∗ 100%
The model has been estimated for the time span 2002-2013, using annual data series.
Source: authors.
Box 3: Estimating Constant Elasticity of Substitution (CES) The CES measures the substitution of one production unit with another one as a result of change in prices. Our model
assumes a two-factor production function (capital – K and labor – L). Hence, we estimate the level of substitution
between capital and labor as a function of change in relative prices of these production inputs (cost of capital and cost
of labor). The CES is calculated based on the CES production function. This is a more appropriate form of Cobb-
Douglas production function because it takes into account the substitution between labor and capital:
𝑉𝑖 = 𝐴𝑖(𝑡)(𝛿𝑖𝐿𝑖−𝜌𝑖 + (1 − 𝛿𝑖)𝐾𝑖
−𝜌𝑖)−1/𝜌𝑖
Where:
𝐴𝑖(𝑡) - the parameter that describes the changes in technological progress and productivity;
𝐿𝑖 – labor inputs;
𝐾𝑖 – capital inputs;
𝛿𝑖 - distribution parameter that reflects the relative factor shares;
𝜌𝑖 - parameter that determines the value of the elasticity;
Maximizing the CES production function, subject to the budget constraint, yields the following specification:
ln (𝐾𝑖
𝐿𝑖
) = 𝜎𝑖 ln (𝛿𝑖
1 − 𝛿𝑖
) + 𝜎𝑖 ln (𝑤𝑖
𝑟𝑖
)
Where:
𝐿𝑖 – labor inputs;
𝐾𝑖 – capital inputs;
𝛿𝑖 - distribution parameter that reflects the relative factor shares;
𝑤𝑖 – average wage;
𝑟𝑖 – capital cost;
The equation can be rewritten into the following form:
𝑙𝑛𝑦𝑖𝑡 = 𝛼𝑖 + 𝛽1𝑖Δlnxit + 𝛿𝑡 + 휀𝑖𝑡
Where:
𝑦𝑖𝑡 = 𝐾𝑖
𝐿𝑖; xit =
𝑤𝑖
𝑟𝑖; 𝑡 – time trend
The equation is estimated using the Error-Correction Model with second differences, with the following specification
of the regression:
Δ2𝑙𝑛𝑦𝑖𝑡 = 𝛼𝑖 + 𝛽1𝑖Δ2lnxit + 𝛽2𝑖ln𝑦𝑖𝑡−1 + 𝛽3𝑖𝑙𝑛𝑥𝑖𝑡−1 + 𝛽4𝑖𝑙𝑛𝑦𝑖𝑡−2 + 𝛽5𝑖𝑙𝑛𝑥𝑖𝑡−2 + 휀𝑖𝑡
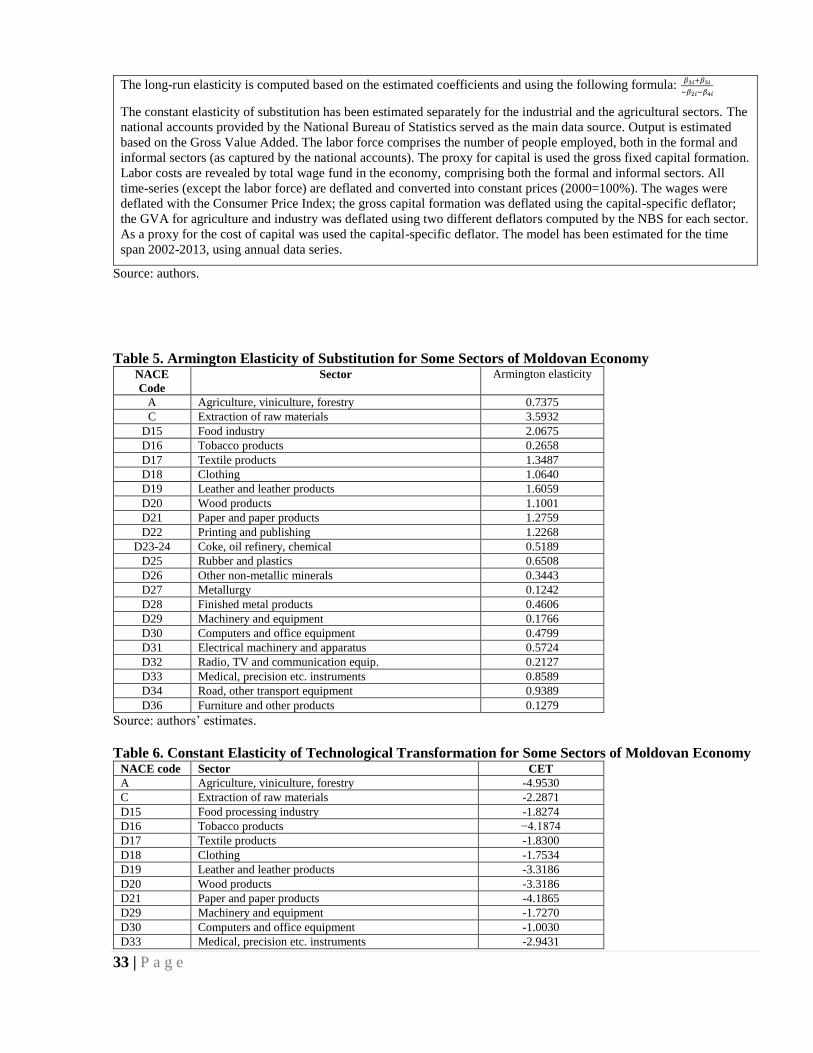
33 | P a g e
The long-run elasticity is computed based on the estimated coefficients and using the following formula: 𝛽3𝑖+𝛽5𝑖
−𝛽2𝑖−𝛽4𝑖
The constant elasticity of substitution has been estimated separately for the industrial and the agricultural sectors. The
national accounts provided by the National Bureau of Statistics served as the main data source. Output is estimated
based on the Gross Value Added. The labor force comprises the number of people employed, both in the formal and
informal sectors (as captured by the national accounts). The proxy for capital is used the gross fixed capital formation.
Labor costs are revealed by total wage fund in the economy, comprising both the formal and informal sectors. All
time-series (except the labor force) are deflated and converted into constant prices (2000=100%). The wages were
deflated with the Consumer Price Index; the gross capital formation was deflated using the capital-specific deflator;
the GVA for agriculture and industry was deflated using two different deflators computed by the NBS for each sector.
As a proxy for the cost of capital was used the capital-specific deflator. The model has been estimated for the time
span 2002-2013, using annual data series.
Source: authors.
Table 5. Armington Elasticity of Substitution for Some Sectors of Moldovan Economy NACE
Code
Sector Armington elasticity
A Agriculture, viniculture, forestry 0.7375
C Extraction of raw materials 3.5932
D15 Food industry 2.0675
D16 Tobacco products 0.2658
D17 Textile products 1.3487
D18 Clothing 1.0640
D19 Leather and leather products 1.6059
D20 Wood products 1.1001
D21 Paper and paper products 1.2759
D22 Printing and publishing 1.2268
D23-24 Coke, oil refinery, chemical 0.5189
D25 Rubber and plastics 0.6508
D26 Other non-metallic minerals 0.3443
D27 Metallurgy 0.1242
D28 Finished metal products 0.4606
D29 Machinery and equipment 0.1766
D30 Computers and office equipment 0.4799
D31 Electrical machinery and apparatus 0.5724
D32 Radio, TV and communication equip. 0.2127
D33 Medical, precision etc. instruments 0.8589
D34 Road, other transport equipment 0.9389
D36 Furniture and other products 0.1279
Source: authors’ estimates.
Table 6. Constant Elasticity of Technological Transformation for Some Sectors of Moldovan Economy NACE code Sector CET
A Agriculture, viniculture, forestry -4.9530
C Extraction of raw materials -2.2871
D15 Food processing industry -1.8274
D16 Tobacco products −4.1874
D17 Textile products -1.8300
D18 Clothing -1.7534
D19 Leather and leather products -3.3186
D20 Wood products -3.3186
D21 Paper and paper products -4.1865
D29 Machinery and equipment -1.7270
D30 Computers and office equipment -1.0030
D33 Medical, precision etc. instruments -2.9431

34 | P a g e
D36 Furniture and other products -6.0542
Source: authors’ estimates.
5.3 Presentation of Key Parameters of Scenarios
DCFTA involves many elements, including, as discussed above, Russian trade restrictions and
a FTA between Turkey and Moldova. In order to reflect this complexity, besides the baseline
scenario, we implemented 13 other DCFTA-related scenarios (Table 7). Initially we evaluate the
impact of each DCFTA-related shock separately: reduction of import tariffs by Moldova, reduction
of import tariff by EU, reduction of services trade barriers by Moldova, reduction of services trade
barriers by EU, trade facilitation on exports, then on imports, and so on. We then combine all
elements into the full DCFTA scenario. As transition periods for Moldova extend over one decade,
and the effects of the DCFTA-related reforms are likely to appear in the long term, we have modeled
the economic dynamics for the period up to 2023.
For the sake of comparing the DCFTA with other trade strategies, we also have run two
additional experiments. One of these experiments simulates Moldova’s decision of joining the
Russia-Belarus-Kazakhstan CU. The other one simulates the situation when Moldova denounces all
its free trade agreements and adopts the MFN tariffs on imports of all origins.
While trade-related parameters vary across all these scenarios, a number of core parameters
remain constant. The same changes in labor and in population have been imposed exogenously in
all scenarios, based on the observed dynamics over the recent decade in Moldova. Due to migration
and declines in fertility rates, the labor force is assumed to continue its decade-long trend and will be
declining in the next decade by 0.5 percent annually, while self-employment will decline by 1.8
percent annually both in agriculture and in other sectors. The rural population will decline by 0.2
percent, and the urban population by 0.1 percent on an annual basis. Productive capital depreciates
at a rate of 6.0 percent, which corresponds to the reported statistical data in the past 5 years. No
changes are imposed exogenously on the total factor productivity because a TFP-adjusting factor has
been included as endogenous variable into the model.
5.3.1 Baseline growth path
For the baseline the economic dynamics are governed only by the exogenous and endogenous
changes in the factor endowment and demographics described above. This baseline assumes no
changes in trade policy parameters with any trading partner. It is assumed only that the EU
maintains its unilateral trade preferences it offered to Moldova a long time ago (Autonomous Trade
Preferences). When we discuss the simulations results, in most of the cases all other scenarios are
compared against the baseline. Some exceptions are specifically mentioned.
Under the baseline growth path, the real GDP registers a cumulative growth of 60 percent
over the period 2014-23. This corresponds to an average annual GDP growth rate of 4.7 percent,
which largely reflects the average growth rate of the Moldovan GDP from 2004-13. The fact that the
GDP registers growth while labor shrinks should be of no surprise because this has been the pattern
of growth in Moldova since 2002. In the baseline, the (rather small) reductions in labor are more
than compensated by growth in the stock of productive capital.
5.3.2 Moldova implements customs tariffs reductions on imports of goods from EU according to AA
provisions (MD_GDS)
This scenario assumes Moldova implements the tariff concession according to its commitments
and transition phases. Reductions in Moldovan duties on imports from the EU take place

35 | P a g e
according to the timelines envisaged by the DCFTA. We have used the published DCFTA to collect
data on concessions offered by Moldova to the EU, as well as data on Moldovan imports from the
EU to conduct necessary aggregations corresponding to the commodities groups that are present in
the Moldovan DCGE model. Imports from the EU for almost all products falling under the tariff-rate
quotas are currently significantly below the quotas, so, for simplicity, a one-time 50 percent
reduction in import tariff has been assumed in the first year of DCFTA implementation. The results
are presented in

36 | P a g e
Annex 4. Moldovan import tariffs are explicitly included in the model equations, and are separated
from customs procedures fees applied to all trading partners because these fees are not covered by
existing free trade agreements Moldova is part of. Reductions in these fees are part of the import
facilitation scenario presented below (IMP_FACIL).
5.3.3 EU removes customs duties on imports of goods from RM (EU_GDS)
In line with the DCFTA provisions, in this scenario the EU tariffs on imports from Moldova
are set at zero in the first year. This refers only to SPS non-sensitive goods, i.e. other than meat
and meat products, dairy, preserved vegetable and fruits, vegetal and animal oils, and fats. As EU
import tariffs are not explicitly included in the Moldovan one-country DCGE model, they have been
modeled through corresponding higher export price margins received by Moldovan exporters after
EU removes import tariffs (the price-wedge approach is widely used in the literature).
The margins have been calculated corroborating data on EU duties on imports from Moldovawith
unitary prices of Moldova exports to EU that we calculated using COMTRADE.12 Whenever
possible, the non ad-valorem components of the EU tariff have been converted in ad-valorem
equivalents (AVE). The results are presented in Annex 5. As the EU already offers Moldova
Autonomous Trade Preferences, the expected increases in export prices are relatively small for most
of the goods, but these reductions are sizeable for vegetables (60 percent increase in the price
margin after abolishment of EU tariffs), other food products and animal fodder category (around 37
percent) and for beverages (around 13-14 percent).
5.3.4 Moldova removes AVE tariffs on imports of services from the EU (MD_SERV)
In the Moldovan DCGE model, the initial barriers on imports of services are imposed
explicitly as AVE tariffs impacting the price of the import. A problem is that there are no
quantitative assessments of the current level of openness of Moldova towards import of services
from EU. However, according to our own estimates and interviews with business experts, the
existing level of barriers against services imports in Moldova is quite low. In Moldova foreign
investors benefit of national treatment in all sectors, therefore there are no obstacles to trade in
services under the WTO GATS Mode 3 of service supply through the commercial presence of the
supplier.
In fact, FDI is present or even dominant in all service sectors, including construction,
telecommunications, professional services, financial services, and transport. There are also no
barriers to Mode 2 service delivery (consumption abroad). The barriers to the cross-border supply of
services (Mode 1 under GATS) are the most relevant. For lack of any data, we have modeled these
barriers by assuming initial level of 10 percent AVE import tariff on all services imported from the
EU, except transport (30 percent) and business services (20 percent). In their paper on Armenia,
Jensen and Tarr (2012) have used much higher rates.
In the Moldova DCGE model, the abolishment of the barriers in this scenario has been modeled by
setting at zero the AVE service import tariff. A key assumption is that there is no rent accruing to
existing services providers. The efficiency impact of service import liberalization has been modeled
following Robinson et al. (2002), through an equation linking growth of the in-service imports with
total factor productivity in the downstream manufacturing industries. Again, for lack of any other
evidence, a unitary elasticity coefficient has been applied, according to which 1 percent growth in
12 Available in the WTO tariff database at http://tariffdata.wto.org/ReportersAndProducts.aspx.

37 | P a g e
import of services results in 1 percent increase in the TFP of the sectors using it as inputs to
production.
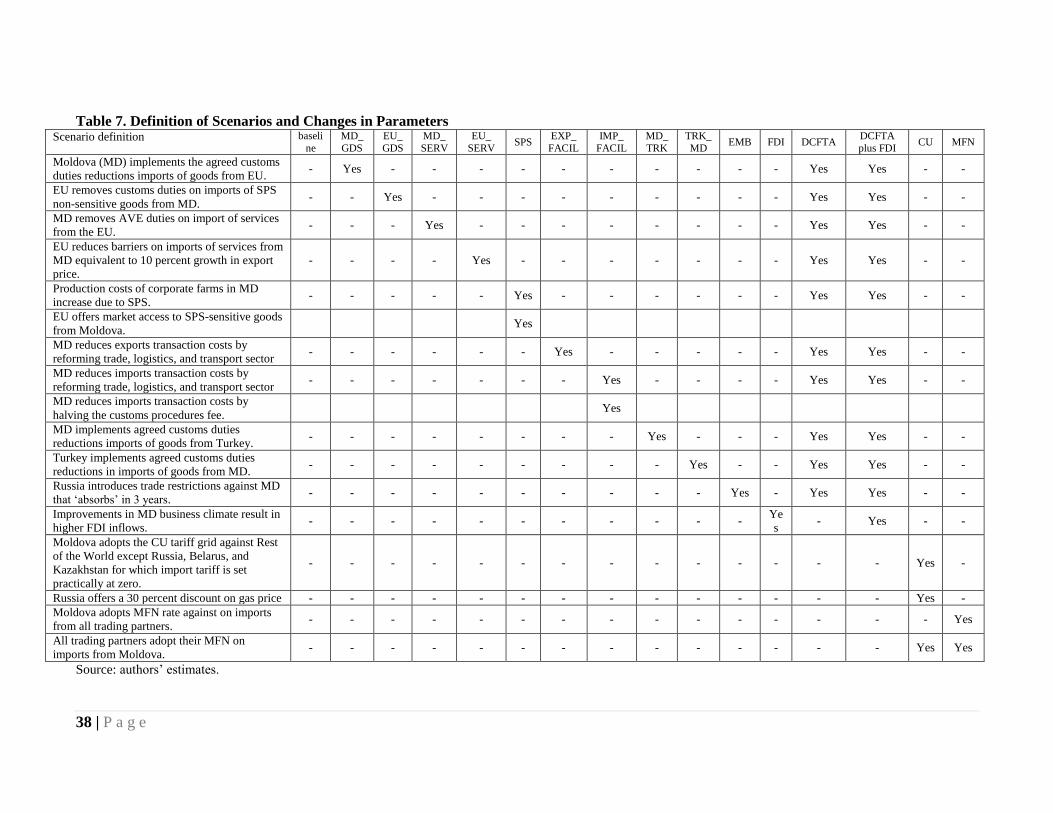
38 | P a g e
Table 7. Definition of Scenarios and Changes in Parameters Scenario definition baseli
ne
MD_
GDS
EU_
GDS
MD_
SERV
EU_
SERV SPS
EXP_
FACIL
IMP_
FACIL
MD_
TRK
TRK_
MD EMB FDI DCFTA
DCFTA
plus FDI CU MFN
Moldova (MD) implements the agreed customs
duties reductions imports of goods from EU. - Yes - - - - - - - - - - Yes Yes - -
EU removes customs duties on imports of SPS
non-sensitive goods from MD. - - Yes - - - - - - - - - Yes Yes - -
MD removes AVE duties on import of services
from the EU. - - - Yes - - - - - - - - Yes Yes - -
EU reduces barriers on imports of services from
MD equivalent to 10 percent growth in export
price.
- - - - Yes - - - - - - - Yes Yes - -
Production costs of corporate farms in MD
increase due to SPS. - - - - - Yes - - - - - - Yes Yes - -
EU offers market access to SPS-sensitive goods
from Moldova. Yes
MD reduces exports transaction costs by
reforming trade, logistics, and transport sector - - - - - - Yes - - - - - Yes Yes - -
MD reduces imports transaction costs by
reforming trade, logistics, and transport sector - - - - - - - Yes - - - - Yes Yes - -
MD reduces imports transaction costs by
halving the customs procedures fee. Yes
MD implements agreed customs duties
reductions imports of goods from Turkey. - - - - - - - - Yes - - - Yes Yes - -
Turkey implements agreed customs duties
reductions in imports of goods from MD. - - - - - - - - - Yes - - Yes Yes - -
Russia introduces trade restrictions against MD
that ‘absorbs’ in 3 years. - - - - - - - - - - Yes - Yes Yes - -
Improvements in MD business climate result in
higher FDI inflows. - - - - - - - - - - - Ye
s - Yes - -
Moldova adopts the CU tariff grid against Rest
of the World except Russia, Belarus, and
Kazakhstan for which import tariff is set
practically at zero.
- - - - - - - - - - - - - - Yes -
Russia offers a 30 percent discount on gas price - - - - - - - - - - - - - - Yes -
Moldova adopts MFN rate against on imports
from all trading partners. - - - - - - - - - - - - - - - Yes
All trading partners adopt their MFN on
imports from Moldova. - - - - - - - - - - - - - - Yes Yes
Source: authors’ estimates.

39 | P a g e
5.3.5 EU reduces barriers on imports of services from Moldova (EU_SERV)
As in the case of the EU_GDS scenario, this one has been modeled through higher export price
margins received by Moldovan exporters of services after EU reduces barriers against service
imports from Moldova. However, the EU’s current level of protection against services imports
from Moldova, and changes expected in the level of protection following the DCFTA are unclear.
As shown above in the section 4.5 above, the DCFTA includes so many reserves on the side of the
EU, that the impact on market access for Moldovan service providers would be probably quite
small. Significant barriers remain against commercial presence and cross-border trade. Imports of
software and computer-related services, in which Moldova is quite competitive, are not particularly
hindered by any barriers imposed by the EU. Considering all unknowns, an arbitrary 10 percent
increase in exporters’ prices has been considered in this scenario.
5.3.6 Moldovan food producers adopt and implement SPS standards (SPS)
This scenario compares the costs and benefits arising from implementation of the SPS
standards by Moldovan corporate farms and the food industry. Adopting international food
safety management systems (such as those based on Hazard Analysis & Critical Control Points -
HACCP) may result in many benefits for Moldovan producers, including higher foreign and
domestic market shares, reduced losses in the production process, decrease in overall costs in the
long-run, and increased personnel motivation.
In this scenario we model only benefits accruing through higher price margins received by
Moldovan exporters of SPS-sensitive goods—meat and meat products, fish and fish products, dairy
products, vegetables and fruits preserves, vegetable and animal oils and fats—to all trading regions
(except Russia, considering the restrictions) The benefits include higher quality and access to upper-
end retail chains and supermarkets. In the simulations, we have assumed that exporters of the SPS-
sensitive goods that comply with international standards will benefit from a 10 percent markup on
the external markets due to improvements in the quality and safety of the product. Implementation
of modern food safety management systems requires that the Moldovan food manufacturers comply
with basic sanitary and hygiene practices (the so-called “prerequisite programs”). Costs arise mainly
in form of one-time and recurring costs for new equipment, building, renovation, hygienic measures,
then development of the HACCP plan and its implementation and periodic corrective actions.
There is no detailed evidence of the costs to be borne by Moldovan firms, so we had to rely on using
Ukraine’s experience for an estimate.13 The expected cost of HACCP implementation in an average
milk processing enterprise in Ukraine is around US$43,750 during the first year, which is close to
the lower part of the range typically spent elsewhere in the world. As Moldovan producers are
reportedly less advanced than producers in Ukraine, in terms of transposing the HACCP prerequisite
measures, we estimate that costs for a typical Moldovan enterprise will be double the amount of
money spent by a Ukrainian enterprise. Corroborating this with structural survey data offered by the
National Bureau of Statistics of Moldova,14 we estimate that the average production costs in the
SPS-sensitive food industry will rise about 4 percent. Disaggregated, the costs of new laboratory
equipment will rise by 5.2 percent; the cost of energy and water by 1.3 percent; the costs for
construction and refurbishment works, by 33 percent, while the costs for business consulting
services will increase 2.4 times. Implementation of the SPS also involves growth in labor costs by
13 IFC, 2010. 14 NBS, 2012.
40 | P a g e
an estimated 18 percent. All these changes are modeled as one-time increases in the demand of the
food manufacturing firms for intermediary inputs and labor.
5.3.7 Facilitation of exports (EXP_FACIL)
Export transaction costs in Moldova are quite high. They represent about 15 percent of the total
freight on board value of goods shipped to export. Under this scenario, we assume that Moldova
implements reforms from 2015-23, reducing transaction costs on exports of goods down to 10
percent of exports. This is modeled through a corresponding reduction in the cost of trade and
transport inputs to exports that are explicitly included in the model. These inputs include only the
officially reported costs for logistics, transport, trade, storage, brokerage and others related to trade.
Unofficial payments, which are reportedly large, are not included for lack of trustable evidence.
5.3.8 Facilitation of import (IMP_FACIL)
Transaction costs of imports are even higher than in the case of exports. According to our
calculations based on SAM, they account for more than 22 percent of the cost of the imported goods
reaching the Moldovan market. Such a high level of transaction costs has a negative impact on intra-
industry trade. In this scenario, Moldova implements reforms resulting in a reduction in import
transaction costs to 15 percent. As above, this is modeled through transaction costs, inputs, and
include the same items. This scenario also includes a 50 percent reduction in the customs procedures
fee. According to the DCFTA, Moldova committed to abolish its system of ad-valorem customs
procedures fees and adopt a direct costs covering system. As estimated by customs experts we
interviewed, this would result in halving the present rate of fees.
5.3.9 Moldova cuts tariffs on import of goods from Turkey (MD_GDS)
In our simulations, it is assumed that in 2016 Turkey and Moldova will start implementing the
bilateral FTA they already signed. This scenario models the cuts in Moldovan tariffs on imports
from Turkey. We have used the published Moldova-Turkey FTA to collect data on concessions
offered by Moldova, as well as data on Moldovan imports Turkey for 2011 to conduct necessary
aggregations matching the commodities groups that are present in the model. More details are
presented in

41 | P a g e
Annex 6.
5.3.10 Turkey cuts tariffs on imports of goods from Moldova (TRK_GDS)
According to the Moldova-Turkey FTA, Turkey agreed to reduce import tariffs on all
industrial goods, and to offer Moldova a number of concessions for agricultural products
without any transition periods. This scenario simulates the impact of these cuts in tariff. It should
be noted that Moldova is a beneficiary of Turkey’s Special Incentives Arrangement, a scheme of
unilateral trade preferences that Turkey offered to a small number of countries. Even under these
trade preferences, Turkey’s tariffs on imports from Moldova are very high. For instance, import
tariffs on some types of meat are as high as 225 percent. This is why Turkey’s reductions in tariffs
have a big impact on the margins of Moldovan exporters, as shown in
42 | P a g e
Annex 7, and this is why liberalization of Moldovan exports to Turkey have a significant impact.
This scenario did not consider the non-AV components in Turkey’s import tariffs because their
marginal impact is small considering the very high levels of the AV components.
5.3.11 Russian restrictions (EMB)
This scenario models the impact of Russia imposing restrictions on some products (i.e.
completely forbidding market access) and imposing MFN tariff against other products
imported from Moldova. Russian trade measures against Moldova may be viewed as “part” of
DCFTA. However, it is assumed that the effects of the restrictions will dissipate over a period of
three years. Russia itself may lift them and or Moldovan producers may find indirect ways into
Russia. These alternative entries into the Russian market may include exports through Belarus and
Kazakhstan, or exports of products as originating from Gagauzia and Transnistrian region (for
which Russia repealed the restrictions).
As it has done in the past, Russia is expected to gradually increase the number of Moldovan
companies allowed to export products to the country. Under our model, it is assumed that in the
second year after introducing the sanctions, Moldovan exporters recover 50 percent of the export
price level they lost, 75 percent in the third year and a full recovery of trade opportunities by the
third year.
5.3.12 DCFTA
This scenario models the combined effect of all shocks and changes in trade and production
parameters that have been evidenced in scenarios from 2 to 11. Moldova reduces tariffs on
goods imported from EU and Turkey, removes barriers on services imports from the EU, and
implements trade facilitation reforms. Moldovan food manufacturing companies adopt SPS
standards and benefit from higher price margins by moving up along the value chain in international
markets. The EU removes import tariffs on goods and reduces barriers on service imports from
Moldova. Turkey implements its part of the free trade agreement with Moldova. Russia introduces
trade restrictions on Moldovan imports that dissipate in three years.
5.3.13 DCFTA plus FDI
This scenario is the same as the previous one but includes an additional feature of FDI growth
following improvements in the domestic business climate. The growth of FDI has been modeled
through corresponding changes in the volume of capital transfers of the rest of the world to
Moldovan enterprises, which are included as separate institutions in the Moldovan DCGE model.15
The “EU-factor” played the key role in this growth of FDI, as suggested by existing literature.16 In
this scenario we have assumed that after three years of deep reforms, Moldova will have the
capacity to absorb an inflow of FDI growing at a permanent rate of 10 percent per year. This figure
is a rather conventional and conservative one, as the historical evidence from the EU association of
the Central European countries shows much bigger rates of FDI growth following association to the
EU. The simple annual average growth rate of FDI in the Central and Eastern European countries in
the period between 1991 (when the first Association Agreements between the EU and CEECs were
signed) and 2004 exceeded 50 percent.
15 We acknowledge the shortages of simulating FDI through growth of capital flows in general, however this was the only possible way of simulating
the impact using a model that does not treat separately the companies with FDI. 16 Bartlomiej Kaminski, “How Accession to the European Union Has Affected External Trade and Foreign Direct Investment in Central European Economies”, revised version of a background paper prepared for the “Prague 2000 Accession” session at the IMF/World Bank annual meeting held in
Prague, September 2000. Available at http://elibrary.worldbank.org/doi/pdf/10.1596/1813-9450-2578.

43 | P a g e
The literature shows that the accession process had first the largest impact on capital flows
and subsequently on goods flows. The biggest beneficiaries were those CEECs countries that
implemented more radical liberal reforms. Combined with preferential access to EU markets, these
reforms have attracted FDI. EU provided an outlet first for CEECs’ unskilled labor-intensive
products and then for skilled labor intensive and technology-based products. The EU has also been
the source of knowledge of intensive imports contributing to industrial realignment in CEECs. The
prospect of accession and since 1998 an unfettered access to the EU markets has provided boost to
relocation of production by MNCs to CEECs.
5.3.14 Moldova joins CU of Russia, Belarus, and Kazakhstan
In this scenario, Moldova joins the CU of Russia, Belarus, and Kazakhstan (CU RBK). On the
Moldovan side, this obviously implies denouncing the DCFTA, raising its customs duties for the
non-CU countries to the MFN level of the CU countries and reducing them almost to zero for the
CU members (“almost” reflects the fact that some goods traded among the current CU members are
nonetheless subject to duties). Under this scenario, Russia does not impose trade restrictions and
offers Moldova a 30 percent reduction in natural gas prices. This scenario also assumes that the EU
would abolish its unilateral trade preferences offered to Moldova and raise duties on imports from
Moldova up to the EU MFN rate, since all members of a customs union must receive identical tariff
treatment from third parties. The impact is modeled through changes in exporters’ prices.17 The
scenario assumes no changes in the trade policy of other CIS members as long as Moldova respects
the multilateral FTA in the CIS area. However, because the CU’s applied MFN rate is higher than
the bound rate Moldova committed to as a member of the WTO, Turkey and the rest of the world
would be entitled to increase their tariffs on imports from Moldova by a rate equal to the difference
between Moldova’s final bound rate and the CU RBK applied MFN rate.
5.3.15 Abolishing FTAs and imposing MFN rate to all trading partners (MFN)
In the final scenario Moldova takes no sides, abolishes all its FTAs and imposes MFN duty
rates against all trading partners. As an important note, the MFN duty rate has been calculated
within the model, as maximal regional rate imposed for the given aggregated group of products. It is
assumed that while imposing the MFN for all partners, Moldova respects its WTO commitments
regarding the final bound rates; therefore, neither Turkey nor the rest of the world have grounds for
retaliation. Russia does not restrict any Moldovan goods (because Moldova does not integrate with
the EU), but it imposes the MFN rate and so do Belarus, Kazakhstan, and all other members of the
CIS because Moldova effectively denounces the multilateral free trade agreement in the CIS area.
Under this scenario, the EU would withdraw the Autonomous Trade Preferences it offers to
Moldova.
5.4 Discussion of Results
5.4.1 Impact on key aggregates across scenarios
Small gains from liberalization of imports from the EU. The simulations suggest relatively small
(yet positive) gains from Moldova liberalizing imports of goods and services from the EU (see Table
8). This is due to the fact that the current level of import tariffs is already quite small, and there are
some transition periods that dampen the potentially negative effects of liberalizing imports of
sensitive goods. Nonetheless, the reduction of the tariff contributes to an increase in foreign trade by
about 0.1 percentage points for both imports and exports.
17 The formula applied to estimate the change in exporters price following change of the import tariff from t1 to t2 is (t1-t2)/(1-t1).

44 | P a g e
Relatively high impact of the EU’s liberalization of imports from Moldova. Further reduction of
the trade barriers in the EU will add 1.0 percent to the GDP by boosting exports to the EU market
(+1.2 percentage points). This result differs from the findings of previous studies (Prohnitchi et al.
(2009) and ECORYS-CASE (2012)), which found relatively small gains from reduction of the EU
trade barriers. This is explained by the fact that in the present study we make better account of the
initial high level of EU protection through non ad-valorem import tariffs. This is particularly the
case for some goods that are very important for Moldovan exports, including vegetables, crops, and
beverages. According to our estimates, export prices for Moldovan producers grow by more than 60
percentage points after abolishment of the non ad-valorem components of the import tariff on
vegetables, by 38—in case of other food products, by 14 percentage points—in case of beverages
and by 6 points for cereal crops.
Important gains from liberalization of import of services from the EU. Our results also reveal
significant benefits for the Moldovan economy arising from liberalizing the import of services from
the EU. The GDP is expected to gain 0.5 additional percentage points, which is explained by the
gains in total factor productivity in the manufacturing and agricultural sectors (on average, by 0.09
percentage points), but even more in the services sector (0.23 points). However, it should be
mentioned that the impact of the previous scenario (EU_GDS) on total factor productivity is even
higher. We admit that under different assumptions (economies of scale, imperfect competition, and
rents accruing to domestic and foreign incumbent service providers) the impact of services
liberalization on the aggregate indicators would be higher.
Smaller gains from liberalization of access of Moldovan service providers to the EU market.
The GDP gains 0.3 percentage points due to higher price margins of the Moldova providers of
services. As discussed above, the DCFTA includes a number of derogations from free trade in
services on behalf of most of the EU countries.
Marginally positive net effects from implementation of the SPS standards. Implementation of
the SPS standards comes with costs and benefits for the Moldovan food makers. The main costs
come from a one-off increase in labor costs (estimated to increase around 18 percent), while main
benefits come from the higher price that Moldovan exporters get in result of moving higher up on
the quality chain. Under this set of assumptions, the GDP growth is positive but relatively small
(+0.1 percent). However, if one assumes that the increase in costs is permanent rather than one-time,
the net effect on GDP turns negative (-0.1 percentage points). Because of uncertainty related to our
estimates, the impact of the SPS requires further in-depth analysis and micro-level research.
Compared to all other factors under the DCFTA, facilitation of trade is the most promising
venue for the economic development of the country. The simulated one-third reduction in trade-
related transaction costs alone would provide 2.7 percentage point gains to the GDP in the case of
export facilitation and 2.2 percentage points in case of imports facilitation. Growth in exports is the
main channel of growth, 3.7 percentage points in case of exports facilitation and 3.0 percentage
points in case of imports facilitation. In fact, under these scenarios all aggregate components of the
GDP are expected to register remarkably high growth rates. Absorption will grow 2.7 percentage
points compared to the baseline in case of exports facilitation, 1.7 percentage points in the case of
imports facilitation, fixed investment by 2.0 and 1.9 percentage points respectively, and government
consumption by 2.3 and 1.8 percentage points, respectively. Of course, if the country’s trade
facilitation efforts fell short of modelled ambitious reduction in trading cost, only a fraction of this
potential would materialize. Also, trade facilitation efforts will improve the country’s
45 | P a g e
competitiveness and export prospects even if these are carried out without an agreement with the
EU.
The FTA with Turkey will bring quite limited results. Gains are almost nonexistent from
liberalization of imports from Turkey. Liberalization of Moldovan exports to Turkey will result in
GDP gains of 0.2 percentage points). These gains stem from reductions of very high import duties
that Turkey currently imposes on Moldovan goods, resulting in a significant improvement in
competitiveness of goods and higher price markups for Moldovan exporters.
Overall, the impact of the Russian restrictions would be almost negligible over the next
decade. This assumption is based on expectations that its effects dissipate as Moldovan producers
find their direct or indirect ways back to the Russian market. The GDP deviates significantly from
the baseline only in the first year after introducing the sanctions (-2 percentage points) but then it
converges to the baseline. In fact, in 2015 we have seen a number of developments suggesting that
Russia is willing to alleviate the restrictions, including the increased number of companies allowed
to enter the Russian market. If we assume that Russia maintains its sanctions throughout the
simulation period, the GDP would permanently diverge from the baseline and lose 0.4 percentage
points per year.
DCFTA and DCFTA plus FDI are by far the best development scenarios for Moldova. Our
overall assessment is that a fully implemented DCFTA coupled with improvements in Moldova’s
attractiveness for foreign capital (including FDI, ODA and remittances), will result in a total GDP
gain amounting to 9.1 percentage points annually compared to the baseline in the period 2014-23.
The DCFTA alone would bring 7.6 percentage points to the GDP, while the capital inflows
component would add another 2.1 points. Exports gain 11.4 percentage points, while imports gain
9.8 percentage points. Fixed capital investment will be 8.7 percentage points above the baseline,
while domestic absorption would be 9.1 percentage points above. Figure 12 shows the projected
GDP growth under the main scenarios against the initial situation in 2014. However, following the
established tradition in the CGE literature, throughout the text we compare the impact against the
baseline.
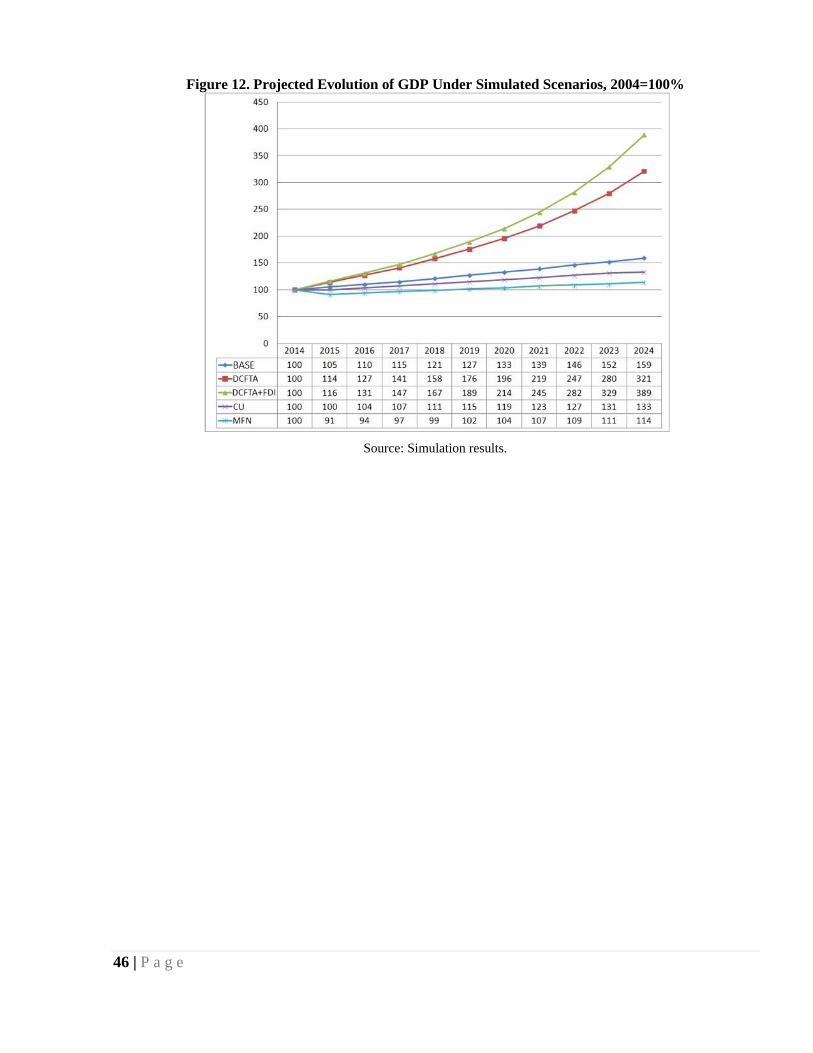
46 | P a g e
Figure 12. Projected Evolution of GDP Under Simulated Scenarios, 2004=100%
Source: Simulation results.
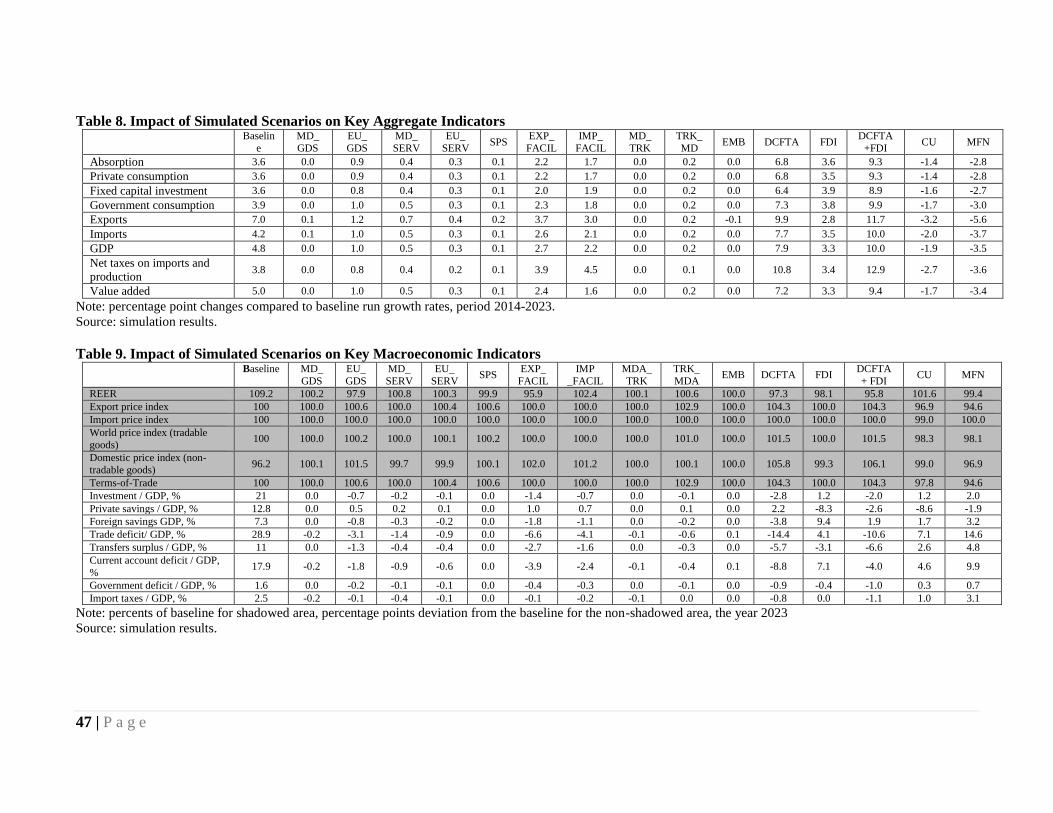
47 | P a g e
Table 8. Impact of Simulated Scenarios on Key Aggregate Indicators
Baselin
e
MD_
GDS
EU_
GDS
MD_
SERV
EU_
SERV SPS
EXP_
FACIL
IMP_
FACIL
MD_
TRK
TRK_
MD EMB DCFTA FDI
DCFTA
+FDI CU MFN
Absorption 3.6 0.0 0.9 0.4 0.3 0.1 2.2 1.7 0.0 0.2 0.0 6.8 3.6 9.3 -1.4 -2.8
Private consumption 3.6 0.0 0.9 0.4 0.3 0.1 2.2 1.7 0.0 0.2 0.0 6.8 3.5 9.3 -1.4 -2.8
Fixed capital investment 3.6 0.0 0.8 0.4 0.3 0.1 2.0 1.9 0.0 0.2 0.0 6.4 3.9 8.9 -1.6 -2.7
Government consumption 3.9 0.0 1.0 0.5 0.3 0.1 2.3 1.8 0.0 0.2 0.0 7.3 3.8 9.9 -1.7 -3.0
Exports 7.0 0.1 1.2 0.7 0.4 0.2 3.7 3.0 0.0 0.2 -0.1 9.9 2.8 11.7 -3.2 -5.6
Imports 4.2 0.1 1.0 0.5 0.3 0.1 2.6 2.1 0.0 0.2 0.0 7.7 3.5 10.0 -2.0 -3.7
GDP 4.8 0.0 1.0 0.5 0.3 0.1 2.7 2.2 0.0 0.2 0.0 7.9 3.3 10.0 -1.9 -3.5
Net taxes on imports and
production 3.8 0.0 0.8 0.4 0.2 0.1 3.9 4.5 0.0 0.1 0.0 10.8 3.4 12.9 -2.7 -3.6
Value added 5.0 0.0 1.0 0.5 0.3 0.1 2.4 1.6 0.0 0.2 0.0 7.2 3.3 9.4 -1.7 -3.4
Note: percentage point changes compared to baseline run growth rates, period 2014-2023.
Source: simulation results.
Table 9. Impact of Simulated Scenarios on Key Macroeconomic Indicators
Baseline MD_
GDS
EU_
GDS
MD_
SERV
EU_
SERV SPS
EXP_
FACIL
IMP
_FACIL
MDA_
TRK
TRK_
MDA EMB DCFTA FDI
DCFTA
+ FDI CU MFN
REER 109.2 100.2 97.9 100.8 100.3 99.9 95.9 102.4 100.1 100.6 100.0 97.3 98.1 95.8 101.6 99.4
Export price index 100 100.0 100.6 100.0 100.4 100.6 100.0 100.0 100.0 102.9 100.0 104.3 100.0 104.3 96.9 94.6
Import price index 100 100.0 100.0 100.0 100.0 100.0 100.0 100.0 100.0 100.0 100.0 100.0 100.0 100.0 99.0 100.0
World price index (tradable
goods) 100 100.0 100.2 100.0 100.1 100.2 100.0 100.0 100.0 101.0 100.0 101.5 100.0 101.5 98.3 98.1
Domestic price index (non-
tradable goods) 96.2 100.1 101.5 99.7 99.9 100.1 102.0 101.2 100.0 100.1 100.0 105.8 99.3 106.1 99.0 96.9
Terms-of-Trade 100 100.0 100.6 100.0 100.4 100.6 100.0 100.0 100.0 102.9 100.0 104.3 100.0 104.3 97.8 94.6
Investment / GDP, % 21 0.0 -0.7 -0.2 -0.1 0.0 -1.4 -0.7 0.0 -0.1 0.0 -2.8 1.2 -2.0 1.2 2.0
Private savings / GDP, % 12.8 0.0 0.5 0.2 0.1 0.0 1.0 0.7 0.0 0.1 0.0 2.2 -8.3 -2.6 -8.6 -1.9
Foreign savings GDP, % 7.3 0.0 -0.8 -0.3 -0.2 0.0 -1.8 -1.1 0.0 -0.2 0.0 -3.8 9.4 1.9 1.7 3.2
Trade deficit/ GDP, % 28.9 -0.2 -3.1 -1.4 -0.9 0.0 -6.6 -4.1 -0.1 -0.6 0.1 -14.4 4.1 -10.6 7.1 14.6
Transfers surplus / GDP, % 11 0.0 -1.3 -0.4 -0.4 0.0 -2.7 -1.6 0.0 -0.3 0.0 -5.7 -3.1 -6.6 2.6 4.8
Current account deficit / GDP,
% 17.9 -0.2 -1.8 -0.9 -0.6 0.0 -3.9 -2.4 -0.1 -0.4 0.1 -8.8 7.1 -4.0 4.6 9.9
Government deficit / GDP, % 1.6 0.0 -0.2 -0.1 -0.1 0.0 -0.4 -0.3 0.0 -0.1 0.0 -0.9 -0.4 -1.0 0.3 0.7
Import taxes / GDP, % 2.5 -0.2 -0.1 -0.4 -0.1 0.0 -0.1 -0.2 -0.1 0.0 0.0 -0.8 0.0 -1.1 1.0 3.1
Note: percents of baseline for shadowed area, percentage points deviation from the baseline for the non-shadowed area, the year 2023
Source: simulation results.
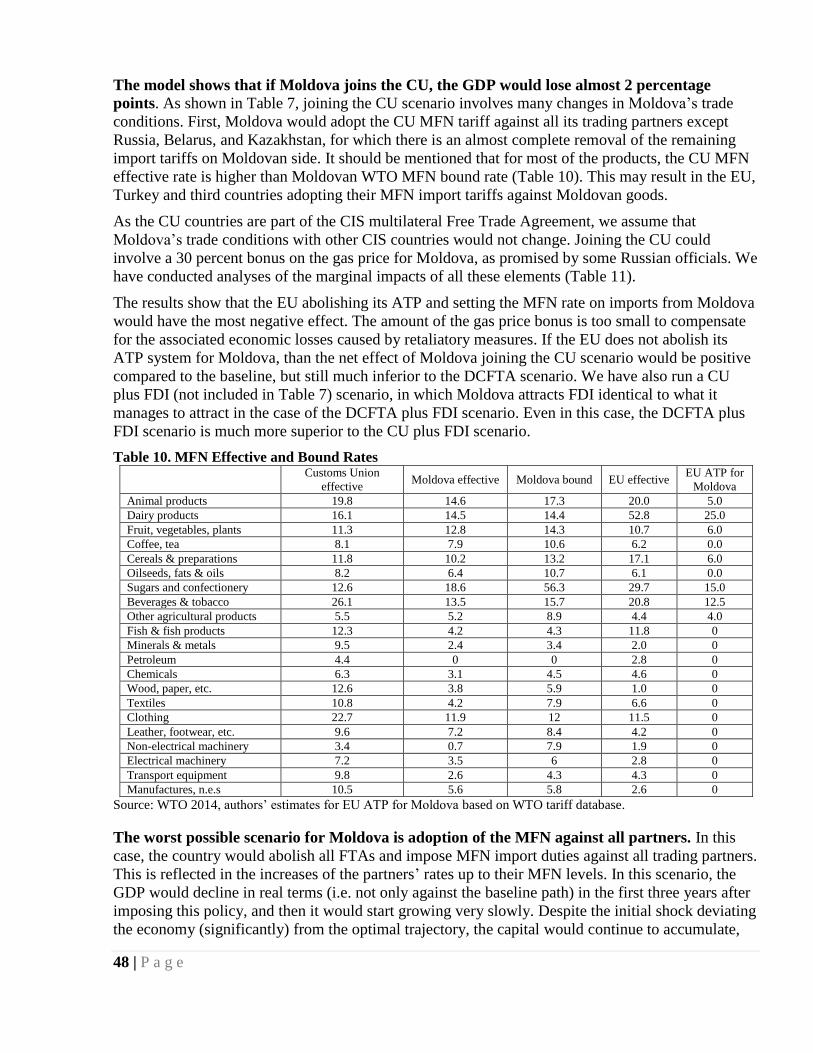
48 | P a g e
The model shows that if Moldova joins the CU, the GDP would lose almost 2 percentage
points. As shown in Table 7, joining the CU scenario involves many changes in Moldova’s trade
conditions. First, Moldova would adopt the CU MFN tariff against all its trading partners except
Russia, Belarus, and Kazakhstan, for which there is an almost complete removal of the remaining
import tariffs on Moldovan side. It should be mentioned that for most of the products, the CU MFN
effective rate is higher than Moldovan WTO MFN bound rate (Table 10). This may result in the EU,
Turkey and third countries adopting their MFN import tariffs against Moldovan goods.
As the CU countries are part of the CIS multilateral Free Trade Agreement, we assume that
Moldova’s trade conditions with other CIS countries would not change. Joining the CU could
involve a 30 percent bonus on the gas price for Moldova, as promised by some Russian officials. We
have conducted analyses of the marginal impacts of all these elements (Table 11).
The results show that the EU abolishing its ATP and setting the MFN rate on imports from Moldova
would have the most negative effect. The amount of the gas price bonus is too small to compensate
for the associated economic losses caused by retaliatory measures. If the EU does not abolish its
ATP system for Moldova, than the net effect of Moldova joining the CU scenario would be positive
compared to the baseline, but still much inferior to the DCFTA scenario. We have also run a CU
plus FDI (not included in Table 7) scenario, in which Moldova attracts FDI identical to what it
manages to attract in the case of the DCFTA plus FDI scenario. Even in this case, the DCFTA plus
FDI scenario is much more superior to the CU plus FDI scenario.
Table 10. MFN Effective and Bound Rates
Customs Union
effective Moldova effective Moldova bound EU effective
EU ATP for
Moldova
Animal products 19.8 14.6 17.3 20.0 5.0
Dairy products 16.1 14.5 14.4 52.8 25.0
Fruit, vegetables, plants 11.3 12.8 14.3 10.7 6.0
Coffee, tea 8.1 7.9 10.6 6.2 0.0
Cereals & preparations 11.8 10.2 13.2 17.1 6.0
Oilseeds, fats & oils 8.2 6.4 10.7 6.1 0.0
Sugars and confectionery 12.6 18.6 56.3 29.7 15.0
Beverages & tobacco 26.1 13.5 15.7 20.8 12.5
Other agricultural products 5.5 5.2 8.9 4.4 4.0
Fish & fish products 12.3 4.2 4.3 11.8 0
Minerals & metals 9.5 2.4 3.4 2.0 0
Petroleum 4.4 0 0 2.8 0
Chemicals 6.3 3.1 4.5 4.6 0
Wood, paper, etc. 12.6 3.8 5.9 1.0 0
Textiles 10.8 4.2 7.9 6.6 0
Clothing 22.7 11.9 12 11.5 0
Leather, footwear, etc. 9.6 7.2 8.4 4.2 0
Non-electrical machinery 3.4 0.7 7.9 1.9 0
Electrical machinery 7.2 3.5 6 2.8 0
Transport equipment 9.8 2.6 4.3 4.3 0
Manufactures, n.e.s 10.5 5.6 5.8 2.6 0
Source: WTO 2014, authors’ estimates for EU ATP for Moldova based on WTO tariff database.
The worst possible scenario for Moldova is adoption of the MFN against all partners. In this
case, the country would abolish all FTAs and impose MFN import duties against all trading partners.
This is reflected in the increases of the partners’ rates up to their MFN levels. In this scenario, the
GDP would decline in real terms (i.e. not only against the baseline path) in the first three years after
imposing this policy, and then it would start growing very slowly. Despite the initial shock deviating
the economy (significantly) from the optimal trajectory, the capital would continue to accumulate,
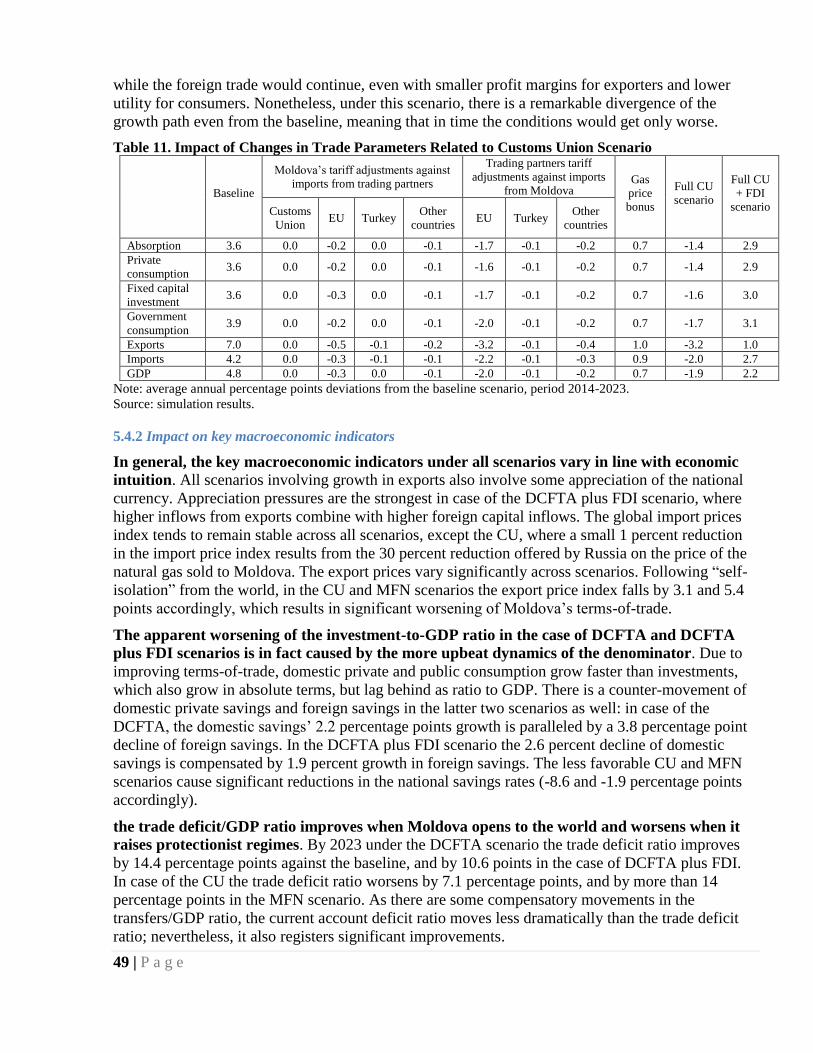
49 | P a g e
while the foreign trade would continue, even with smaller profit margins for exporters and lower
utility for consumers. Nonetheless, under this scenario, there is a remarkable divergence of the
growth path even from the baseline, meaning that in time the conditions would get only worse.
Table 11. Impact of Changes in Trade Parameters Related to Customs Union Scenario
Baseline
Moldova’s tariff adjustments against
imports from trading partners
Trading partners tariff
adjustments against imports
from Moldova Gas
price
bonus
Full CU
scenario
Full CU
+ FDI
scenario Customs
Union EU Turkey
Other
countries EU Turkey
Other
countries
Absorption 3.6 0.0 -0.2 0.0 -0.1 -1.7 -0.1 -0.2 0.7 -1.4 2.9
Private
consumption 3.6 0.0 -0.2 0.0 -0.1 -1.6 -0.1 -0.2 0.7 -1.4 2.9
Fixed capital
investment 3.6 0.0 -0.3 0.0 -0.1 -1.7 -0.1 -0.2 0.7 -1.6 3.0
Government
consumption 3.9 0.0 -0.2 0.0 -0.1 -2.0 -0.1 -0.2 0.7 -1.7 3.1
Exports 7.0 0.0 -0.5 -0.1 -0.2 -3.2 -0.1 -0.4 1.0 -3.2 1.0
Imports 4.2 0.0 -0.3 -0.1 -0.1 -2.2 -0.1 -0.3 0.9 -2.0 2.7
GDP 4.8 0.0 -0.3 0.0 -0.1 -2.0 -0.1 -0.2 0.7 -1.9 2.2
Note: average annual percentage points deviations from the baseline scenario, period 2014-2023.
Source: simulation results.
5.4.2 Impact on key macroeconomic indicators
In general, the key macroeconomic indicators under all scenarios vary in line with economic
intuition. All scenarios involving growth in exports also involve some appreciation of the national
currency. Appreciation pressures are the strongest in case of the DCFTA plus FDI scenario, where
higher inflows from exports combine with higher foreign capital inflows. The global import prices
index tends to remain stable across all scenarios, except the CU, where a small 1 percent reduction
in the import price index results from the 30 percent reduction offered by Russia on the price of the
natural gas sold to Moldova. The export prices vary significantly across scenarios. Following “self-
isolation” from the world, in the CU and MFN scenarios the export price index falls by 3.1 and 5.4
points accordingly, which results in significant worsening of Moldova’s terms-of-trade.
The apparent worsening of the investment-to-GDP ratio in the case of DCFTA and DCFTA
plus FDI scenarios is in fact caused by the more upbeat dynamics of the denominator. Due to
improving terms-of-trade, domestic private and public consumption grow faster than investments,
which also grow in absolute terms, but lag behind as ratio to GDP. There is a counter-movement of
domestic private savings and foreign savings in the latter two scenarios as well: in case of the
DCFTA, the domestic savings’ 2.2 percentage points growth is paralleled by a 3.8 percentage point
decline of foreign savings. In the DCFTA plus FDI scenario the 2.6 percent decline of domestic
savings is compensated by 1.9 percent growth in foreign savings. The less favorable CU and MFN
scenarios cause significant reductions in the national savings rates (-8.6 and -1.9 percentage points
accordingly).
the trade deficit/GDP ratio improves when Moldova opens to the world and worsens when it
raises protectionist regimes. By 2023 under the DCFTA scenario the trade deficit ratio improves
by 14.4 percentage points against the baseline, and by 10.6 points in the case of DCFTA plus FDI.
In case of the CU the trade deficit ratio worsens by 7.1 percentage points, and by more than 14
percentage points in the MFN scenario. As there are some compensatory movements in the
transfers/GDP ratio, the current account deficit ratio moves less dramatically than the trade deficit
ratio; nevertheless, it also registers significant improvements.
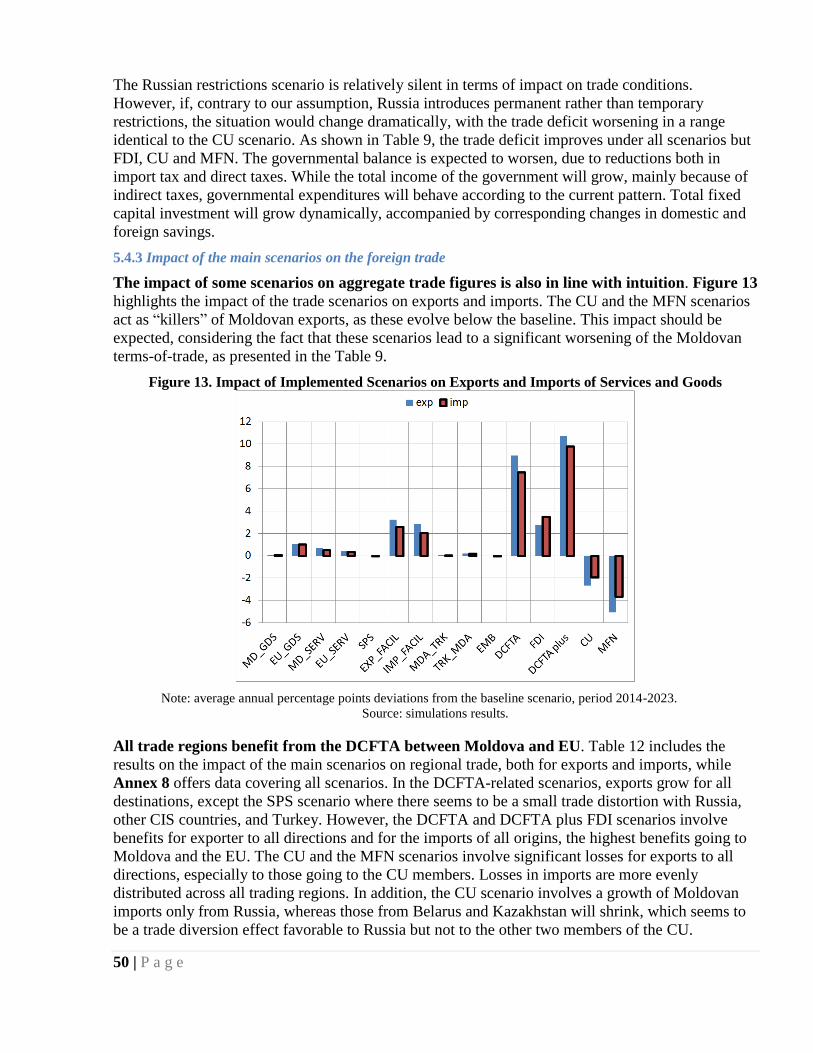
50 | P a g e
The Russian restrictions scenario is relatively silent in terms of impact on trade conditions.
However, if, contrary to our assumption, Russia introduces permanent rather than temporary
restrictions, the situation would change dramatically, with the trade deficit worsening in a range
identical to the CU scenario. As shown in Table 9, the trade deficit improves under all scenarios but
FDI, CU and MFN. The governmental balance is expected to worsen, due to reductions both in
import tax and direct taxes. While the total income of the government will grow, mainly because of
indirect taxes, governmental expenditures will behave according to the current pattern. Total fixed
capital investment will grow dynamically, accompanied by corresponding changes in domestic and
foreign savings.
5.4.3 Impact of the main scenarios on the foreign trade
The impact of some scenarios on aggregate trade figures is also in line with intuition. Figure 13
highlights the impact of the trade scenarios on exports and imports. The CU and the MFN scenarios
act as “killers” of Moldovan exports, as these evolve below the baseline. This impact should be
expected, considering the fact that these scenarios lead to a significant worsening of the Moldovan
terms-of-trade, as presented in the Table 9.
Figure 13. Impact of Implemented Scenarios on Exports and Imports of Services and Goods
Note: average annual percentage points deviations from the baseline scenario, period 2014-2023.
Source: simulations results.
All trade regions benefit from the DCFTA between Moldova and EU. Table 12 includes the
results on the impact of the main scenarios on regional trade, both for exports and imports, while
Annex 8 offers data covering all scenarios. In the DCFTA-related scenarios, exports grow for all
destinations, except the SPS scenario where there seems to be a small trade distortion with Russia,
other CIS countries, and Turkey. However, the DCFTA and DCFTA plus FDI scenarios involve
benefits for exporter to all directions and for the imports of all origins, the highest benefits going to
Moldova and the EU. The CU and the MFN scenarios involve significant losses for exports to all
directions, especially to those going to the CU members. Losses in imports are more evenly
distributed across all trading regions. In addition, the CU scenario involves a growth of Moldovan
imports only from Russia, whereas those from Belarus and Kazakhstan will shrink, which seems to
be a trade diversion effect favorable to Russia but not to the other two members of the CU.
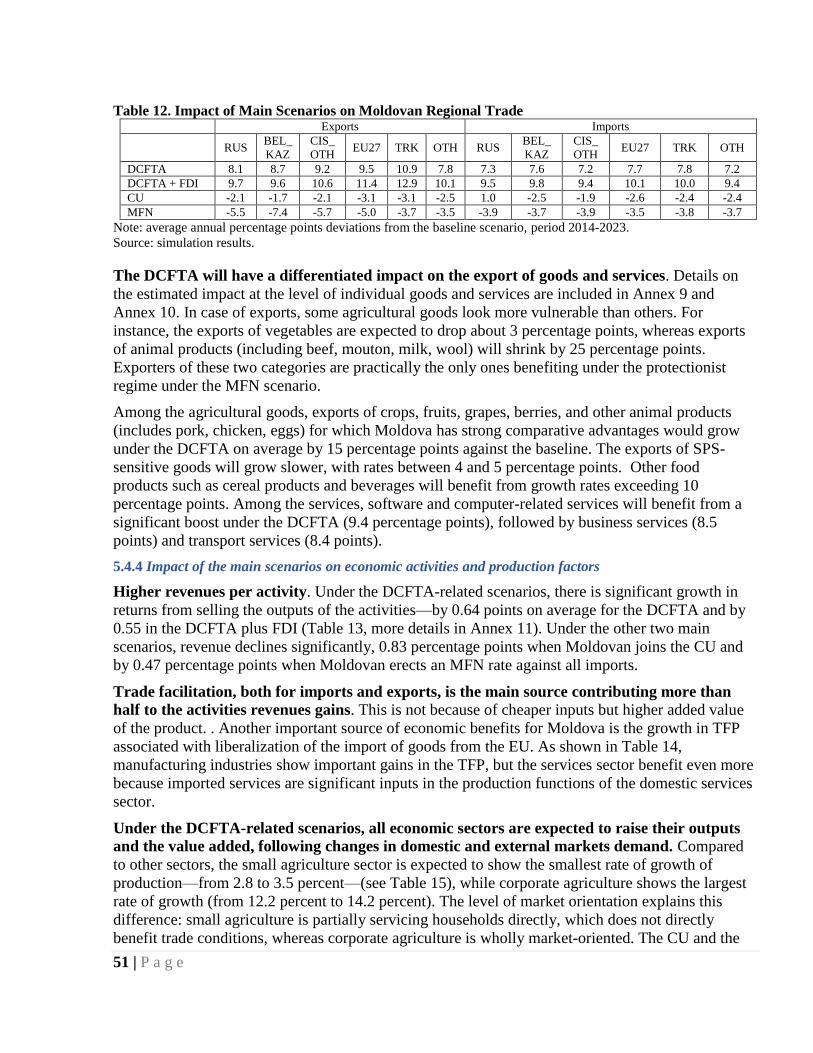
51 | P a g e
Table 12. Impact of Main Scenarios on Moldovan Regional Trade Exports Imports
RUS
BEL_
KAZ
CIS_
OTH EU27 TRK OTH RUS
BEL_
KAZ
CIS_
OTH EU27 TRK OTH
DCFTA 8.1 8.7 9.2 9.5 10.9 7.8 7.3 7.6 7.2 7.7 7.8 7.2
DCFTA + FDI 9.7 9.6 10.6 11.4 12.9 10.1 9.5 9.8 9.4 10.1 10.0 9.4
CU -2.1 -1.7 -2.1 -3.1 -3.1 -2.5 1.0 -2.5 -1.9 -2.6 -2.4 -2.4
MFN -5.5 -7.4 -5.7 -5.0 -3.7 -3.5 -3.9 -3.7 -3.9 -3.5 -3.8 -3.7
Note: average annual percentage points deviations from the baseline scenario, period 2014-2023.
Source: simulation results.
The DCFTA will have a differentiated impact on the export of goods and services. Details on
the estimated impact at the level of individual goods and services are included in Annex 9 and
Annex 10. In case of exports, some agricultural goods look more vulnerable than others. For
instance, the exports of vegetables are expected to drop about 3 percentage points, whereas exports
of animal products (including beef, mouton, milk, wool) will shrink by 25 percentage points.
Exporters of these two categories are practically the only ones benefiting under the protectionist
regime under the MFN scenario.
Among the agricultural goods, exports of crops, fruits, grapes, berries, and other animal products
(includes pork, chicken, eggs) for which Moldova has strong comparative advantages would grow
under the DCFTA on average by 15 percentage points against the baseline. The exports of SPS-
sensitive goods will grow slower, with rates between 4 and 5 percentage points. Other food
products such as cereal products and beverages will benefit from growth rates exceeding 10
percentage points. Among the services, software and computer-related services will benefit from a
significant boost under the DCFTA (9.4 percentage points), followed by business services (8.5
points) and transport services (8.4 points).
5.4.4 Impact of the main scenarios on economic activities and production factors
Higher revenues per activity. Under the DCFTA-related scenarios, there is significant growth in
returns from selling the outputs of the activities—by 0.64 points on average for the DCFTA and by
0.55 in the DCFTA plus FDI (Table 13, more details in Annex 11). Under the other two main
scenarios, revenue declines significantly, 0.83 percentage points when Moldovan joins the CU and
by 0.47 percentage points when Moldovan erects an MFN rate against all imports.
Trade facilitation, both for imports and exports, is the main source contributing more than
half to the activities revenues gains. This is not because of cheaper inputs but higher added value
of the product. . Another important source of economic benefits for Moldova is the growth in TFP
associated with liberalization of the import of goods from the EU. As shown in Table 14,
manufacturing industries show important gains in the TFP, but the services sector benefit even more
because imported services are significant inputs in the production functions of the domestic services
sector.
Under the DCFTA-related scenarios, all economic sectors are expected to raise their outputs
and the value added, following changes in domestic and external markets demand. Compared
to other sectors, the small agriculture sector is expected to show the smallest rate of growth of
production—from 2.8 to 3.5 percent—(see Table 15), while corporate agriculture shows the largest
rate of growth (from 12.2 percent to 14.2 percent). The level of market orientation explains this
difference: small agriculture is partially servicing households directly, which does not directly
benefit trade conditions, whereas corporate agriculture is wholly market-oriented. The CU and the
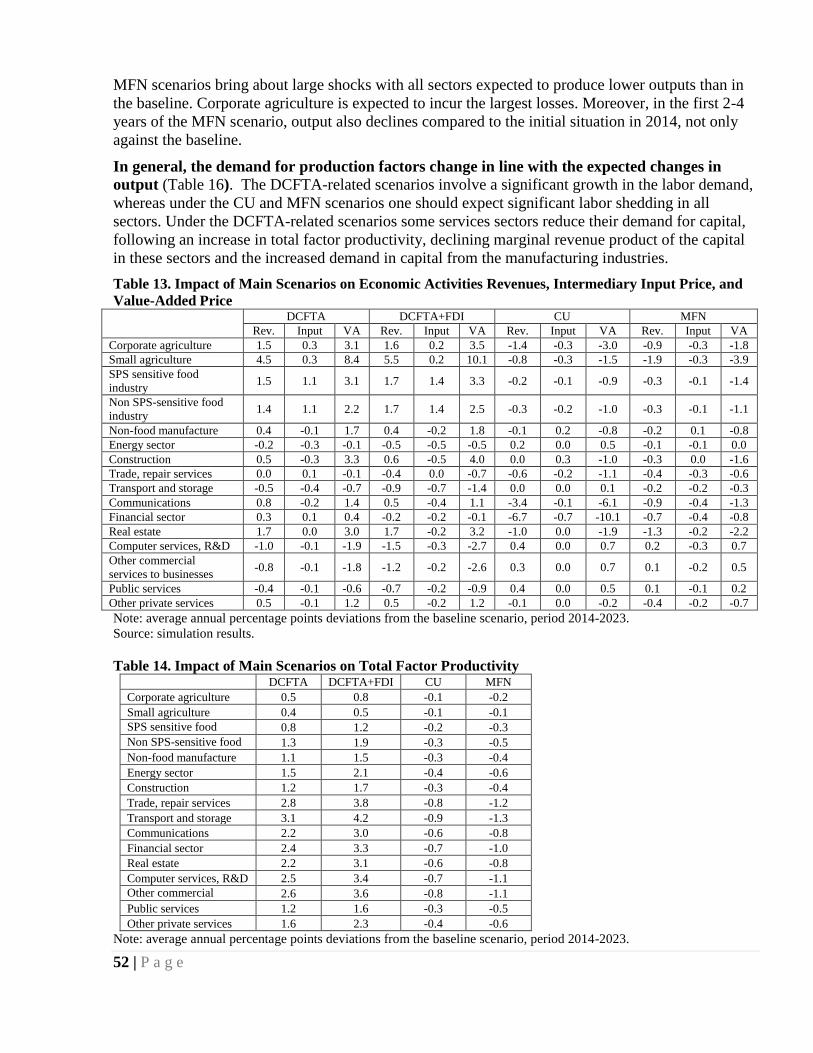
52 | P a g e
MFN scenarios bring about large shocks with all sectors expected to produce lower outputs than in
the baseline. Corporate agriculture is expected to incur the largest losses. Moreover, in the first 2-4
years of the MFN scenario, output also declines compared to the initial situation in 2014, not only
against the baseline.
In general, the demand for production factors change in line with the expected changes in
output (Table 16). The DCFTA-related scenarios involve a significant growth in the labor demand,
whereas under the CU and MFN scenarios one should expect significant labor shedding in all
sectors. Under the DCFTA-related scenarios some services sectors reduce their demand for capital,
following an increase in total factor productivity, declining marginal revenue product of the capital
in these sectors and the increased demand in capital from the manufacturing industries.
Table 13. Impact of Main Scenarios on Economic Activities Revenues, Intermediary Input Price, and
Value-Added Price
DCFTA DCFTA+FDI CU MFN
Rev. Input VA Rev. Input VA Rev. Input VA Rev. Input VA
Corporate agriculture 1.5 0.3 3.1 1.6 0.2 3.5 -1.4 -0.3 -3.0 -0.9 -0.3 -1.8
Small agriculture 4.5 0.3 8.4 5.5 0.2 10.1 -0.8 -0.3 -1.5 -1.9 -0.3 -3.9
SPS sensitive food
industry 1.5 1.1 3.1 1.7 1.4 3.3 -0.2 -0.1 -0.9 -0.3 -0.1 -1.4
Non SPS-sensitive food
industry 1.4 1.1 2.2 1.7 1.4 2.5 -0.3 -0.2 -1.0 -0.3 -0.1 -1.1
Non-food manufacture 0.4 -0.1 1.7 0.4 -0.2 1.8 -0.1 0.2 -0.8 -0.2 0.1 -0.8
Energy sector -0.2 -0.3 -0.1 -0.5 -0.5 -0.5 0.2 0.0 0.5 -0.1 -0.1 0.0
Construction 0.5 -0.3 3.3 0.6 -0.5 4.0 0.0 0.3 -1.0 -0.3 0.0 -1.6
Trade, repair services 0.0 0.1 -0.1 -0.4 0.0 -0.7 -0.6 -0.2 -1.1 -0.4 -0.3 -0.6
Transport and storage -0.5 -0.4 -0.7 -0.9 -0.7 -1.4 0.0 0.0 0.1 -0.2 -0.2 -0.3
Communications 0.8 -0.2 1.4 0.5 -0.4 1.1 -3.4 -0.1 -6.1 -0.9 -0.4 -1.3
Financial sector 0.3 0.1 0.4 -0.2 -0.2 -0.1 -6.7 -0.7 -10.1 -0.7 -0.4 -0.8
Real estate 1.7 0.0 3.0 1.7 -0.2 3.2 -1.0 0.0 -1.9 -1.3 -0.2 -2.2
Computer services, R&D -1.0 -0.1 -1.9 -1.5 -0.3 -2.7 0.4 0.0 0.7 0.2 -0.3 0.7
Other commercial
services to businesses -0.8 -0.1 -1.8 -1.2 -0.2 -2.6 0.3 0.0 0.7 0.1 -0.2 0.5
Public services -0.4 -0.1 -0.6 -0.7 -0.2 -0.9 0.4 0.0 0.5 0.1 -0.1 0.2
Other private services 0.5 -0.1 1.2 0.5 -0.2 1.2 -0.1 0.0 -0.2 -0.4 -0.2 -0.7
Note: average annual percentage points deviations from the baseline scenario, period 2014-2023.
Source: simulation results.
Table 14. Impact of Main Scenarios on Total Factor Productivity
DCFTA DCFTA+FDI CU MFN
Corporate agriculture 0.5 0.8 -0.1 -0.2
Small agriculture 0.4 0.5 -0.1 -0.1
SPS sensitive food
industry 0.8 1.2 -0.2 -0.3
Non SPS-sensitive food
industry 1.3 1.9 -0.3 -0.5
Non-food manufacture 1.1 1.5 -0.3 -0.4
Energy sector 1.5 2.1 -0.4 -0.6
Construction 1.2 1.7 -0.3 -0.4
Trade, repair services 2.8 3.8 -0.8 -1.2
Transport and storage 3.1 4.2 -0.9 -1.3
Communications 2.2 3.0 -0.6 -0.8
Financial sector 2.4 3.3 -0.7 -1.0
Real estate 2.2 3.1 -0.6 -0.8
Computer services, R&D 2.5 3.4 -0.7 -1.1
Other commercial
services to businesses 2.6 3.6 -0.8 -1.1
Public services 1.2 1.6 -0.3 -0.5
Other private services 1.6 2.3 -0.4 -0.6
Note: average annual percentage points deviations from the baseline scenario, period 2014-2023.
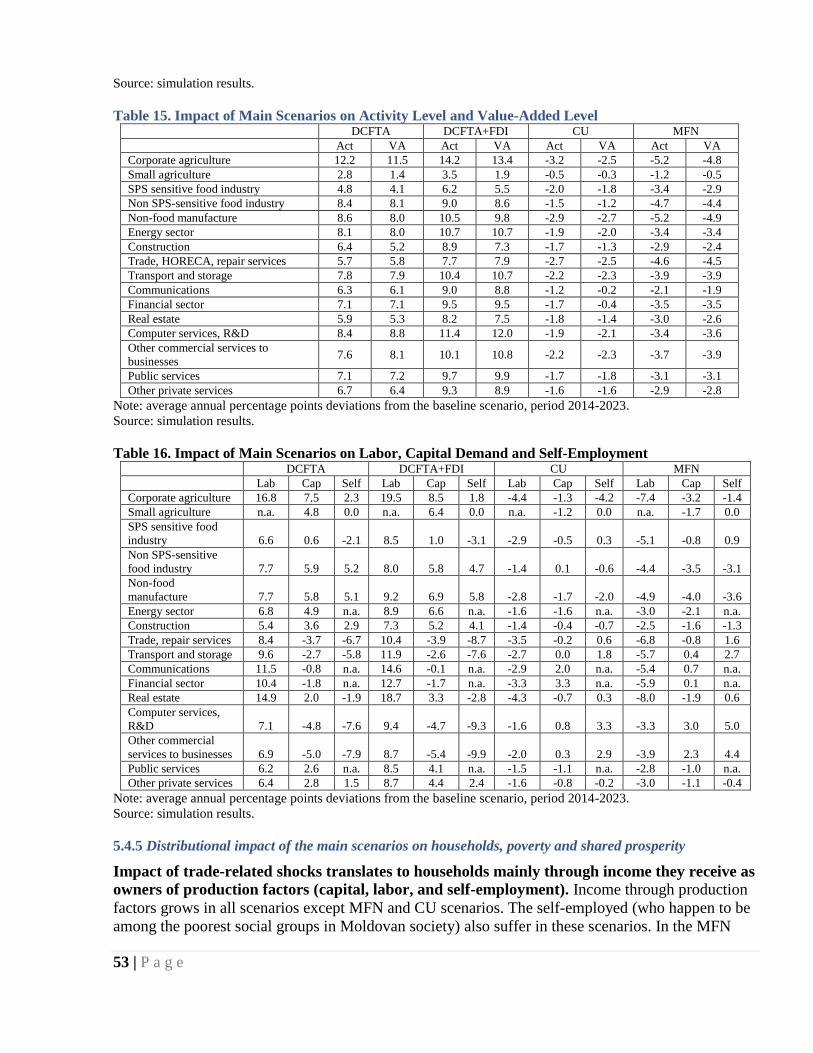
53 | P a g e
Source: simulation results.
Table 15. Impact of Main Scenarios on Activity Level and Value-Added Level DCFTA DCFTA+FDI CU MFN
Act VA Act VA Act VA Act VA
Corporate agriculture 12.2 11.5 14.2 13.4 -3.2 -2.5 -5.2 -4.8
Small agriculture 2.8 1.4 3.5 1.9 -0.5 -0.3 -1.2 -0.5
SPS sensitive food industry 4.8 4.1 6.2 5.5 -2.0 -1.8 -3.4 -2.9
Non SPS-sensitive food industry 8.4 8.1 9.0 8.6 -1.5 -1.2 -4.7 -4.4
Non-food manufacture 8.6 8.0 10.5 9.8 -2.9 -2.7 -5.2 -4.9
Energy sector 8.1 8.0 10.7 10.7 -1.9 -2.0 -3.4 -3.4
Construction 6.4 5.2 8.9 7.3 -1.7 -1.3 -2.9 -2.4
Trade, HORECA, repair services 5.7 5.8 7.7 7.9 -2.7 -2.5 -4.6 -4.5
Transport and storage 7.8 7.9 10.4 10.7 -2.2 -2.3 -3.9 -3.9
Communications 6.3 6.1 9.0 8.8 -1.2 -0.2 -2.1 -1.9
Financial sector 7.1 7.1 9.5 9.5 -1.7 -0.4 -3.5 -3.5
Real estate 5.9 5.3 8.2 7.5 -1.8 -1.4 -3.0 -2.6
Computer services, R&D 8.4 8.8 11.4 12.0 -1.9 -2.1 -3.4 -3.6
Other commercial services to
businesses 7.6 8.1 10.1 10.8 -2.2 -2.3 -3.7 -3.9
Public services 7.1 7.2 9.7 9.9 -1.7 -1.8 -3.1 -3.1
Other private services 6.7 6.4 9.3 8.9 -1.6 -1.6 -2.9 -2.8
Note: average annual percentage points deviations from the baseline scenario, period 2014-2023.
Source: simulation results.
Table 16. Impact of Main Scenarios on Labor, Capital Demand and Self-Employment DCFTA DCFTA+FDI CU MFN
Lab Cap Self Lab Cap Self Lab Cap Self Lab Cap Self
Corporate agriculture 16.8 7.5 2.3 19.5 8.5 1.8 -4.4 -1.3 -4.2 -7.4 -3.2 -1.4
Small agriculture n.a. 4.8 0.0 n.a. 6.4 0.0 n.a. -1.2 0.0 n.a. -1.7 0.0
SPS sensitive food
industry 6.6 0.6 -2.1 8.5 1.0 -3.1 -2.9 -0.5 0.3 -5.1 -0.8 0.9
Non SPS-sensitive
food industry 7.7 5.9 5.2 8.0 5.8 4.7 -1.4 0.1 -0.6 -4.4 -3.5 -3.1
Non-food
manufacture 7.7 5.8 5.1 9.2 6.9 5.8 -2.8 -1.7 -2.0 -4.9 -4.0 -3.6
Energy sector 6.8 4.9 n.a. 8.9 6.6 n.a. -1.6 -1.6 n.a. -3.0 -2.1 n.a.
Construction 5.4 3.6 2.9 7.3 5.2 4.1 -1.4 -0.4 -0.7 -2.5 -1.6 -1.3
Trade, repair services 8.4 -3.7 -6.7 10.4 -3.9 -8.7 -3.5 -0.2 0.6 -6.8 -0.8 1.6
Transport and storage 9.6 -2.7 -5.8 11.9 -2.6 -7.6 -2.7 0.0 1.8 -5.7 0.4 2.7
Communications 11.5 -0.8 n.a. 14.6 -0.1 n.a. -2.9 2.0 n.a. -5.4 0.7 n.a.
Financial sector 10.4 -1.8 n.a. 12.7 -1.7 n.a. -3.3 3.3 n.a. -5.9 0.1 n.a.
Real estate 14.9 2.0 -1.9 18.7 3.3 -2.8 -4.3 -0.7 0.3 -8.0 -1.9 0.6
Computer services,
R&D 7.1 -4.8 -7.6 9.4 -4.7 -9.3 -1.6 0.8 3.3 -3.3 3.0 5.0
Other commercial
services to businesses 6.9 -5.0 -7.9 8.7 -5.4 -9.9 -2.0 0.3 2.9 -3.9 2.3 4.4
Public services 6.2 2.6 n.a. 8.5 4.1 n.a. -1.5 -1.1 n.a. -2.8 -1.0 n.a.
Other private services 6.4 2.8 1.5 8.7 4.4 2.4 -1.6 -0.8 -0.2 -3.0 -1.1 -0.4
Note: average annual percentage points deviations from the baseline scenario, period 2014-2023.
Source: simulation results.
5.4.5 Distributional impact of the main scenarios on households, poverty and shared prosperity
Impact of trade-related shocks translates to households mainly through income they receive as
owners of production factors (capital, labor, and self-employment). Income through production
factors grows in all scenarios except MFN and CU scenarios. The self-employed (who happen to be
among the poorest social groups in Moldovan society) also suffer in these scenarios. In the MFN
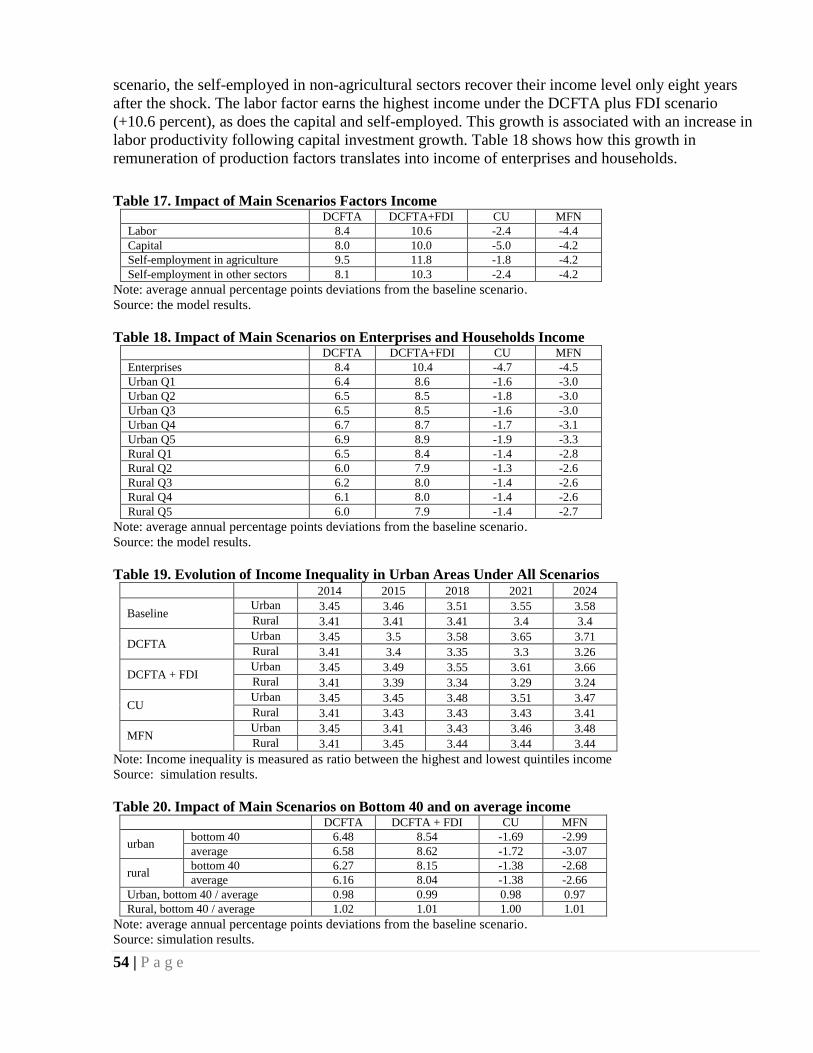
54 | P a g e
scenario, the self-employed in non-agricultural sectors recover their income level only eight years
after the shock. The labor factor earns the highest income under the DCFTA plus FDI scenario
(+10.6 percent), as does the capital and self-employed. This growth is associated with an increase in
labor productivity following capital investment growth. Table 18 shows how this growth in
remuneration of production factors translates into income of enterprises and households.
Table 17. Impact of Main Scenarios Factors Income DCFTA DCFTA+FDI CU MFN
Labor 8.4 10.6 -2.4 -4.4
Capital 8.0 10.0 -5.0 -4.2
Self-employment in agriculture 9.5 11.8 -1.8 -4.2
Self-employment in other sectors 8.1 10.3 -2.4 -4.2
Note: average annual percentage points deviations from the baseline scenario.
Source: the model results.
Table 18. Impact of Main Scenarios on Enterprises and Households Income DCFTA DCFTA+FDI CU MFN
Enterprises 8.4 10.4 -4.7 -4.5
Urban Q1 6.4 8.6 -1.6 -3.0
Urban Q2 6.5 8.5 -1.8 -3.0
Urban Q3 6.5 8.5 -1.6 -3.0
Urban Q4 6.7 8.7 -1.7 -3.1
Urban Q5 6.9 8.9 -1.9 -3.3
Rural Q1 6.5 8.4 -1.4 -2.8
Rural Q2 6.0 7.9 -1.3 -2.6
Rural Q3 6.2 8.0 -1.4 -2.6
Rural Q4 6.1 8.0 -1.4 -2.6
Rural Q5 6.0 7.9 -1.4 -2.7
Note: average annual percentage points deviations from the baseline scenario.
Source: the model results.
Table 19. Evolution of Income Inequality in Urban Areas Under All Scenarios 2014 2015 2018 2021 2024
Baseline Urban 3.45 3.46 3.51 3.55 3.58
Rural 3.41 3.41 3.41 3.4 3.4
DCFTA Urban 3.45 3.5 3.58 3.65 3.71
Rural 3.41 3.4 3.35 3.3 3.26
DCFTA + FDI Urban 3.45 3.49 3.55 3.61 3.66
Rural 3.41 3.39 3.34 3.29 3.24
CU Urban 3.45 3.45 3.48 3.51 3.47
Rural 3.41 3.43 3.43 3.43 3.41
MFN Urban 3.45 3.41 3.43 3.46 3.48
Rural 3.41 3.45 3.44 3.44 3.44
Note: Income inequality is measured as ratio between the highest and lowest quintiles income
Source: simulation results.
Table 20. Impact of Main Scenarios on Bottom 40 and on average income DCFTA DCFTA + FDI CU MFN
urban bottom 40 6.48 8.54 -1.69 -2.99
average 6.58 8.62 -1.72 -3.07
rural bottom 40 6.27 8.15 -1.38 -2.68
average 6.16 8.04 -1.38 -2.66
Urban, bottom 40 / average 0.98 0.99 0.98 0.97
Rural, bottom 40 / average 1.02 1.01 1.00 1.01
Note: average annual percentage points deviations from the baseline scenario.
Source: simulation results.
55 | P a g e
The impact of the simulated scenarios on income inequality and shared prosperity indicator is
rather limited in all scenarios. The standard indicator of income inequality, defined as the ratio
between income of the top quintile to the bottom quintile, has opposite signs in urban and rural
areas. It improves a little in the urban areas under the scenarios associated with DCFTA, but
worsens quite significantly under the CU and MFN scenarios (Table 19). The rural areas offer an
opposite dynamic, with the inequality level increasing under the DCFTA-related scenarios and
improving under the other two. This is explained by the fact that under the DCFTA small agriculture
(which offers the main subsistence opportunities for the poorest quintiles in Moldovan villages)
registers the smallest growth of production and value-added, with subsequent impact on monetary
and in-kind income of the poorest quintiles. However, using the shared prosperity indicator, the
changes in income look more evenly distributed across populations in all scenarios (Table 20).
56 | P a g e
6. Conclusions and Recommendations
Moldova should concentrate on implementing the DCFTA as this is the most credible trade
and economic development strategy. Simulations conducted using the Dynamic CGE model have
clearly shown that the best trade strategy for Moldova is to pursue its economic integration and trade
liberalization with the EU, while at the same time continuing its dialogue with Russia to speed up
the lifting of Russian trade sanctions against Moldova. By the end of the transition phase (2023), the
Moldovan GDP is likely to gain around 7.6 percentage points under the “simple” DCFTA scenario
compared to the baseline. If Moldova improves its domestic business climate, increased inflows of
foreign capital will significantly improve this outcome (up to 10 percentage points under the
assumption of a steady increase in capital inflows of 5 percent per year).
In order to derive the highest possible benefits from the DCFTA, however, Moldova has to
invest its efforts and resources in alleviating the behind-the-border trade barriers. As clearly
shown by the modeling results, more than half of the gains arising under the “simple” DCFTA
scenario would accrue due to a reduction in export- and import-related transaction costs by one-third
over the next decade. In this regard, reduction of transport, logistics and other trade-support services
should be seen as an absolute priority. Moldova needs to streamline its import and export cargo
clearance procedures, eliminate redundant trade documentation, and design and adopt standard
operating procedures.
Trade automation and risk management has to be strengthened through improving the risk
management regulatory and operational frameworks. To improve the private sector’s overall
competitiveness, transaction costs need to be reduced through introduction of simplified declaration,
facilitation of advanced processing through introduction of the pre-arrival entry summary
declaration for import and export regimes according to EU requirements, and enable the issuance of
advanced rulings. To increase awareness and ensure transparency of policies and legislative
requirements to maximize the effectiveness of private sector’s efforts in taking full advantage of
DCFTA – the public-private dialogue needs to be adequately addressed through establishing
sustainable platform for such a dialogue.
Liberalization of the services trade is another important source of economic gains.
Liberalization of the services trade alone would boost the country’s GDP by around 0.8-0.9 percent.
Most of the benefits come from efficiency improvements in the downstream manufacturing
industries using import services as inputs. Efficiency gains are even higher in the domestic services
sector. In order to reap these benefits, Moldova has to improve a number of market- and regulation-
related deficiencies—constrained market competition and monopoly—that are hampering both
domestic and international services providers.
Elimination by the EU of the remaining barriers against trade in goods is also another
important source of economic gains for Moldova. In this paper we have simulated complete
removal of both ad-valorem and non ad-valorem tariff components, which result in another 1
percent gain in GDP. Significantly higher price margins will go to the exporters of product
categories that are particularly affected by non ad-valorem tariff components, including vegetables,
wines, some crops and other food products category. It is important for the Moldovan authorities to
ensure that Moldovan goods fully respect the rules of origin, as some of these products are subject to
anti-circumvention mechanisms foreseen by the Association Agreement. The SAM-based analysis
shows that there are a number of products for which reported Moldovan exports by far exceed the
reported domestic production. It is also important that at the first round of DCFTA review (2017),

57 | P a g e
the Moldovan authorities get higher duty-free quotas for the Moldovan products, especially for
fruits, and ensure complete removal of the tariff non ad-valorem components.
Adopting the SPS standards should be seen as priority in long-term. The analysis suggests
marginal positive gains from adoption of the SPS, because implementing the standards comes with
significant immediate costs while the benefits come only in the long run and are uncertain.
However, this does not mean that the country should neglect the SPS. Moldova needs to identify
priority sectors (or even priority goods) and ensure that there are sources of funding available in the
private and public sectors to meet the additional capital and current expenditures required to
implement the SPS.
DCFTA with the EU is fully compatible with the multilateral FTA with the CIS countries. It is
compatible with the FTA between Turkey and Moldova and with the CEFTA multilateral
agreement. The simulations have shown that DCFTA involves no trade diversion against Russia.
(Moreover, one multi-country study conducted on the topic has actually proven that Russia is likely
to benefit directly and indirectly from the DCFTA between Moldova and the EU).
Joining the CU is very much suboptimal for Moldova, because of the trade diversion effects
generated and because higher duties on imports reduce substantially the welfare. Joining the
CU would also abolish the DCFTA, and prompt the EU to withdraw its unilateral trade preferences
that it offered in the past to Moldova. These measures would be the main contributors to the total
damage caused by this scenario. Because the CU’s effective MFN rate for most of the products is
higher than Moldova’s WTO bound rate, joining the CU will force other countries to increase
proportionally their duties on imports from Moldova. As simulations have shown, a 30 percent
reduction in gas imported from Russia would not be enough to compensate the other negative effects
on Moldova’s foreign trade and domestic production. Under the CU scenario, the GDP drops 1.9
percent compared to the baseline scenario.
Liberalization of trade between Moldova and the EU is important not only to ensure higher
consumers surplus and higher margins for the Moldovan exporters. Liberalization of imports
from the EU is also very important for intra-industry trade, considering that a number of firms are
operating as part of outsourcing agreements with some European counterparts. As the simulations
suggest, the transition periods Moldova ensured for its producers provide the cushion necessary to
avoid negative effects on domestic production.
Implementing the “deep” and “comprehensive” parts of the DCFTA is even more important
for Moldova’s long-term economic development and trade expansion than just liberalizing its
trade with the EU. The increased inflow of FDI that has been simulated to accompany the
liberalization of trade gives a significant boost to economic growth, to exports, and to household
income. However, some of the model simulations that have been run under alternative
macroeconomic scenarios suggest the policy makers to be aware of the currency appreciation risks
associated with a sudden growth of FDI. A balanced growth of domestic investments (including in
imported capital goods), government consumption, and private consumption would help mitigate
these risks.
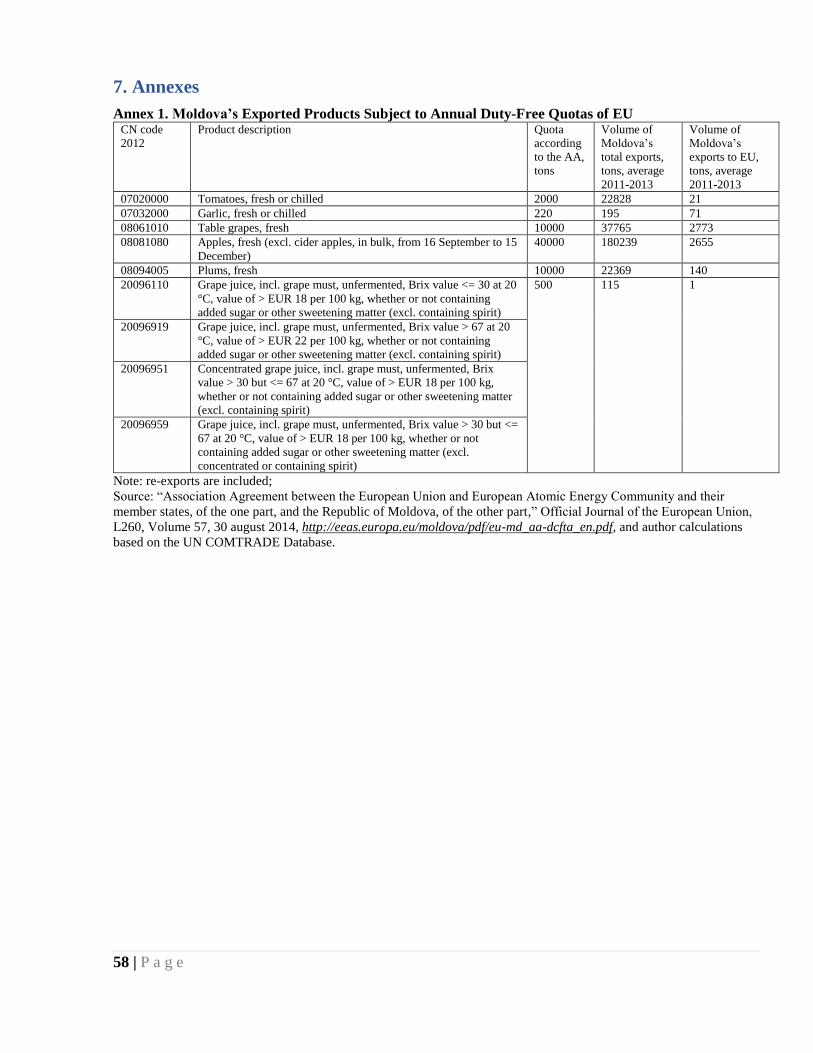
58 | P a g e
7. Annexes
Annex 1. Moldova’s Exported Products Subject to Annual Duty-Free Quotas of EU CN code
2012
Product description Quota
according
to the AA,
tons
Volume of
Moldova’s
total exports,
tons, average
2011-2013
Volume of
Moldova’s
exports to EU,
tons, average
2011-2013
07020000 Tomatoes, fresh or chilled 2000 22828 21
07032000 Garlic, fresh or chilled 220 195 71
08061010 Table grapes, fresh 10000 37765 2773
08081080 Apples, fresh (excl. cider apples, in bulk, from 16 September to 15
December)
40000 180239 2655
08094005 Plums, fresh 10000 22369 140
20096110 Grape juice, incl. grape must, unfermented, Brix value <= 30 at 20
°C, value of > EUR 18 per 100 kg, whether or not containing
added sugar or other sweetening matter (excl. containing spirit)
500 115 1
20096919 Grape juice, incl. grape must, unfermented, Brix value > 67 at 20
°C, value of > EUR 22 per 100 kg, whether or not containing
added sugar or other sweetening matter (excl. containing spirit)
20096951 Concentrated grape juice, incl. grape must, unfermented, Brix
value > 30 but <= 67 at 20 °C, value of > EUR 18 per 100 kg,
whether or not containing added sugar or other sweetening matter
(excl. containing spirit)
20096959 Grape juice, incl. grape must, unfermented, Brix value > 30 but <=
67 at 20 °C, value of > EUR 18 per 100 kg, whether or not
containing added sugar or other sweetening matter (excl.
concentrated or containing spirit)
Note: re-exports are included;
Source: “Association Agreement between the European Union and European Atomic Energy Community and their
member states, of the one part, and the Republic of Moldova, of the other part,” Official Journal of the European Union,
L260, Volume 57, 30 august 2014, http://eeas.europa.eu/moldova/pdf/eu-md_aa-dcfta_en.pdf, and author calculations
based on the UN COMTRADE Database.

59 | P a g e
Annex 2. Product Categories Subject to Anti-Circumvention Mechanisms of the AA Product category Number of 8-digit
positions subject to
AC mechanism
Annual trigger
volume, tons
Volume of Moldova’s
total exports, tons,
average 2011-2013
Volume of Moldova’s
exports to EU, tons,
average 2011-2013
1. Pig meat 16 4500 2 2
2. Poultry meat 87 600 7 0
3. Dairy products 9 1700 329 0
4. Eggs in shell 4 7000 (or 140 million
pieces)
312 0
5. Eggs and albumins 2 400 0 0
6. Wheat, flour and
pellets
2 75000 141915 38789
7. Barley, flour and
pellets
1 70000 71125 17243
8. Maize, flour and
pellets
1 130000 97277 46830
9. Sugars 1 37400 24372 21258
10. Cereals processed 23 2500 588 437
11. Cigarettes 2 1000 (or 1 billion
pieces
1012 29
12. Dairy processed 5 500 6707 2488
13. Sugar processed 13 4200 3143 1681
14. Sweet corn 5 1500 3533 0
Source: “Association Agreement between the European Union and European Atomic Energy Community and their
member states, of the one part, and the Republic of Moldova, of the other part,” Official Journal of the European Union,
L260, Volume 57, 30 august 2014, http://eeas.europa.eu/moldova/pdf/eu-md_aa-dcfta_en.pdf.
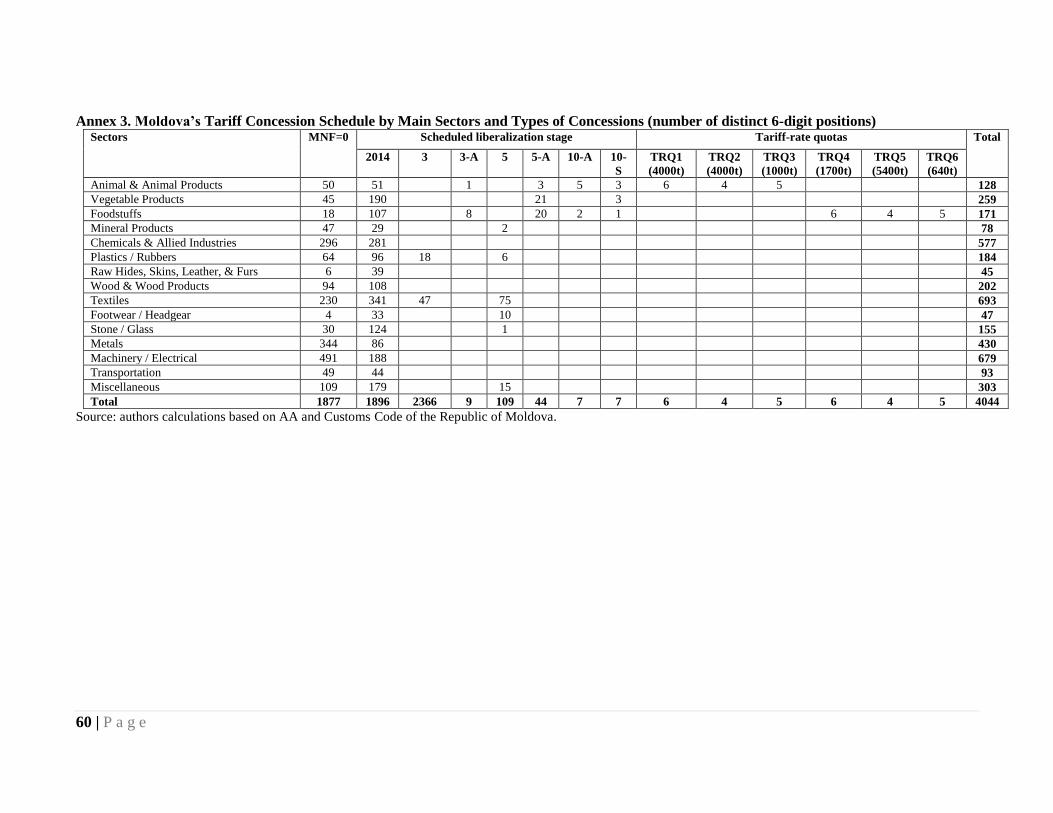
60 | P a g e
Annex 3. Moldova’s Tariff Concession Schedule by Main Sectors and Types of Concessions (number of distinct 6-digit positions) Sectors MNF=0 Scheduled liberalization stage Tariff-rate quotas Total
2014 3 3-A 5 5-A 10-A 10-
S
TRQ1
(4000t)
TRQ2
(4000t)
TRQ3
(1000t)
TRQ4
(1700t)
TRQ5
(5400t)
TRQ6
(640t)
Animal & Animal Products 50 51 1 3 5 3 6 4 5 128
Vegetable Products 45 190 21 3 259
Foodstuffs 18 107 8 20 2 1 6 4 5 171
Mineral Products 47 29 2 78
Chemicals & Allied Industries 296 281 577
Plastics / Rubbers 64 96 18 6 184
Raw Hides, Skins, Leather, & Furs 6 39 45
Wood & Wood Products 94 108 202
Textiles 230 341 47 75 693
Footwear / Headgear 4 33 10 47
Stone / Glass 30 124 1 155
Metals 344 86 430
Machinery / Electrical 491 188 679
Transportation 49 44 93
Miscellaneous 109 179 15 303
Total 1877 1896 2366 9 109 44 7 7 6 4 5 6 4 5 4044
Source: authors calculations based on AA and Customs Code of the Republic of Moldova.
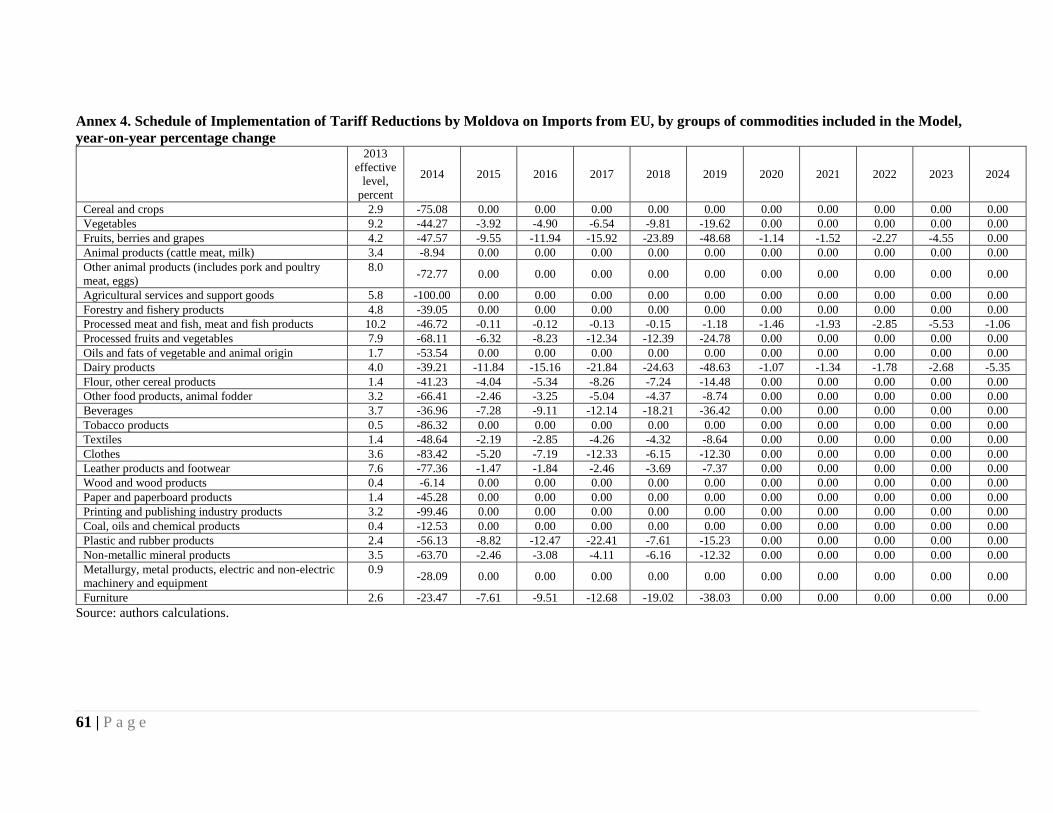
61 | P a g e
Annex 4. Schedule of Implementation of Tariff Reductions by Moldova on Imports from EU, by groups of commodities included in the Model,
year-on-year percentage change 2013
effective
level,
percent
2014 2015 2016 2017 2018 2019 2020 2021 2022 2023 2024
Cereal and crops 2.9 -75.08 0.00 0.00 0.00 0.00 0.00 0.00 0.00 0.00 0.00 0.00
Vegetables 9.2 -44.27 -3.92 -4.90 -6.54 -9.81 -19.62 0.00 0.00 0.00 0.00 0.00
Fruits, berries and grapes 4.2 -47.57 -9.55 -11.94 -15.92 -23.89 -48.68 -1.14 -1.52 -2.27 -4.55 0.00
Animal products (cattle meat, milk) 3.4 -8.94 0.00 0.00 0.00 0.00 0.00 0.00 0.00 0.00 0.00 0.00
Other animal products (includes pork and poultry
meat, eggs)
8.0 -72.77 0.00 0.00 0.00 0.00 0.00 0.00 0.00 0.00 0.00 0.00
Agricultural services and support goods 5.8 -100.00 0.00 0.00 0.00 0.00 0.00 0.00 0.00 0.00 0.00 0.00
Forestry and fishery products 4.8 -39.05 0.00 0.00 0.00 0.00 0.00 0.00 0.00 0.00 0.00 0.00
Processed meat and fish, meat and fish products 10.2 -46.72 -0.11 -0.12 -0.13 -0.15 -1.18 -1.46 -1.93 -2.85 -5.53 -1.06
Processed fruits and vegetables 7.9 -68.11 -6.32 -8.23 -12.34 -12.39 -24.78 0.00 0.00 0.00 0.00 0.00
Oils and fats of vegetable and animal origin 1.7 -53.54 0.00 0.00 0.00 0.00 0.00 0.00 0.00 0.00 0.00 0.00
Dairy products 4.0 -39.21 -11.84 -15.16 -21.84 -24.63 -48.63 -1.07 -1.34 -1.78 -2.68 -5.35
Flour, other cereal products 1.4 -41.23 -4.04 -5.34 -8.26 -7.24 -14.48 0.00 0.00 0.00 0.00 0.00
Other food products, animal fodder 3.2 -66.41 -2.46 -3.25 -5.04 -4.37 -8.74 0.00 0.00 0.00 0.00 0.00
Beverages 3.7 -36.96 -7.28 -9.11 -12.14 -18.21 -36.42 0.00 0.00 0.00 0.00 0.00
Tobacco products 0.5 -86.32 0.00 0.00 0.00 0.00 0.00 0.00 0.00 0.00 0.00 0.00
Textiles 1.4 -48.64 -2.19 -2.85 -4.26 -4.32 -8.64 0.00 0.00 0.00 0.00 0.00
Clothes 3.6 -83.42 -5.20 -7.19 -12.33 -6.15 -12.30 0.00 0.00 0.00 0.00 0.00
Leather products and footwear 7.6 -77.36 -1.47 -1.84 -2.46 -3.69 -7.37 0.00 0.00 0.00 0.00 0.00
Wood and wood products 0.4 -6.14 0.00 0.00 0.00 0.00 0.00 0.00 0.00 0.00 0.00 0.00
Paper and paperboard products 1.4 -45.28 0.00 0.00 0.00 0.00 0.00 0.00 0.00 0.00 0.00 0.00
Printing and publishing industry products 3.2 -99.46 0.00 0.00 0.00 0.00 0.00 0.00 0.00 0.00 0.00 0.00
Coal, oils and chemical products 0.4 -12.53 0.00 0.00 0.00 0.00 0.00 0.00 0.00 0.00 0.00 0.00
Plastic and rubber products 2.4 -56.13 -8.82 -12.47 -22.41 -7.61 -15.23 0.00 0.00 0.00 0.00 0.00
Non-metallic mineral products 3.5 -63.70 -2.46 -3.08 -4.11 -6.16 -12.32 0.00 0.00 0.00 0.00 0.00
Metallurgy, metal products, electric and non-electric
machinery and equipment
0.9 -28.09 0.00 0.00 0.00 0.00 0.00 0.00 0.00 0.00 0.00 0.00
Furniture 2.6 -23.47 -7.61 -9.51 -12.68 -19.02 -38.03 0.00 0.00 0.00 0.00 0.00
Source: authors calculations.

62 | P a g e
Annex 5. Growth Rates in Moldovan Exporters’ Prices Following EU Reductions in Import Tariffs by
groups of commodities included in the Model, percentage change Products groups Growth rate
Cereal and crops 6.42
Vegetables 64.08
Fruits, berries and grapes 0.23
Animal products (cattle meat, milk) 0.02
Other animal products (includes pork and poultry meat, eggs) 0.01
Agricultural services and support goods 0.00
Forestry and fishery products 1.54
Processed meat and fish, meat and fish products 0.01
Processed fruits and vegetables 0.00
Oils and fats of vegetable and animal origin 0.00
Dairy products 0.12
Flour, other cereal products 0.00
Other food products and animal fodder 37.76
Beverages 13.63
Tobacco products 0.00
Textiles 0.00
Clothes 0.00
Leather products and footwear 0.00
Wood and wood products 0.00
Paper and paperboard products 0.00
Printing and publishing industry products 0.00
Coal, oils and chemical products 0.00
Plastic and rubber products 0.00
Non-metallic mineral products 0.00
Metallurgy, metal products, electric and non-electric machinery and equipment 0.00
Furniture 0.00
Source: authors calculations.
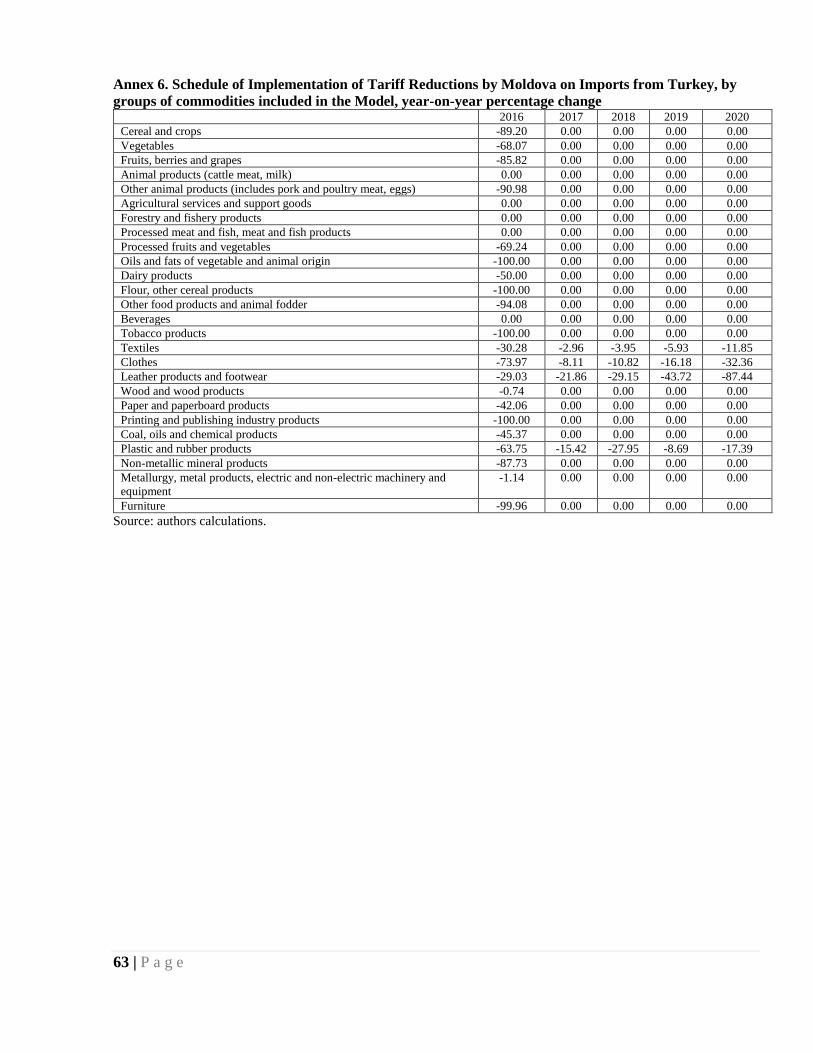
63 | P a g e
Annex 6. Schedule of Implementation of Tariff Reductions by Moldova on Imports from Turkey, by
groups of commodities included in the Model, year-on-year percentage change 2016 2017 2018 2019 2020
Cereal and crops -89.20 0.00 0.00 0.00 0.00
Vegetables -68.07 0.00 0.00 0.00 0.00
Fruits, berries and grapes -85.82 0.00 0.00 0.00 0.00
Animal products (cattle meat, milk) 0.00 0.00 0.00 0.00 0.00
Other animal products (includes pork and poultry meat, eggs) -90.98 0.00 0.00 0.00 0.00
Agricultural services and support goods 0.00 0.00 0.00 0.00 0.00
Forestry and fishery products 0.00 0.00 0.00 0.00 0.00
Processed meat and fish, meat and fish products 0.00 0.00 0.00 0.00 0.00
Processed fruits and vegetables -69.24 0.00 0.00 0.00 0.00
Oils and fats of vegetable and animal origin -100.00 0.00 0.00 0.00 0.00
Dairy products -50.00 0.00 0.00 0.00 0.00
Flour, other cereal products -100.00 0.00 0.00 0.00 0.00
Other food products and animal fodder -94.08 0.00 0.00 0.00 0.00
Beverages 0.00 0.00 0.00 0.00 0.00
Tobacco products -100.00 0.00 0.00 0.00 0.00
Textiles -30.28 -2.96 -3.95 -5.93 -11.85
Clothes -73.97 -8.11 -10.82 -16.18 -32.36
Leather products and footwear -29.03 -21.86 -29.15 -43.72 -87.44
Wood and wood products -0.74 0.00 0.00 0.00 0.00
Paper and paperboard products -42.06 0.00 0.00 0.00 0.00
Printing and publishing industry products -100.00 0.00 0.00 0.00 0.00
Coal, oils and chemical products -45.37 0.00 0.00 0.00 0.00
Plastic and rubber products -63.75 -15.42 -27.95 -8.69 -17.39
Non-metallic mineral products -87.73 0.00 0.00 0.00 0.00
Metallurgy, metal products, electric and non-electric machinery and
equipment
-1.14 0.00 0.00 0.00 0.00
Furniture -99.96 0.00 0.00 0.00 0.00
Source: authors calculations.
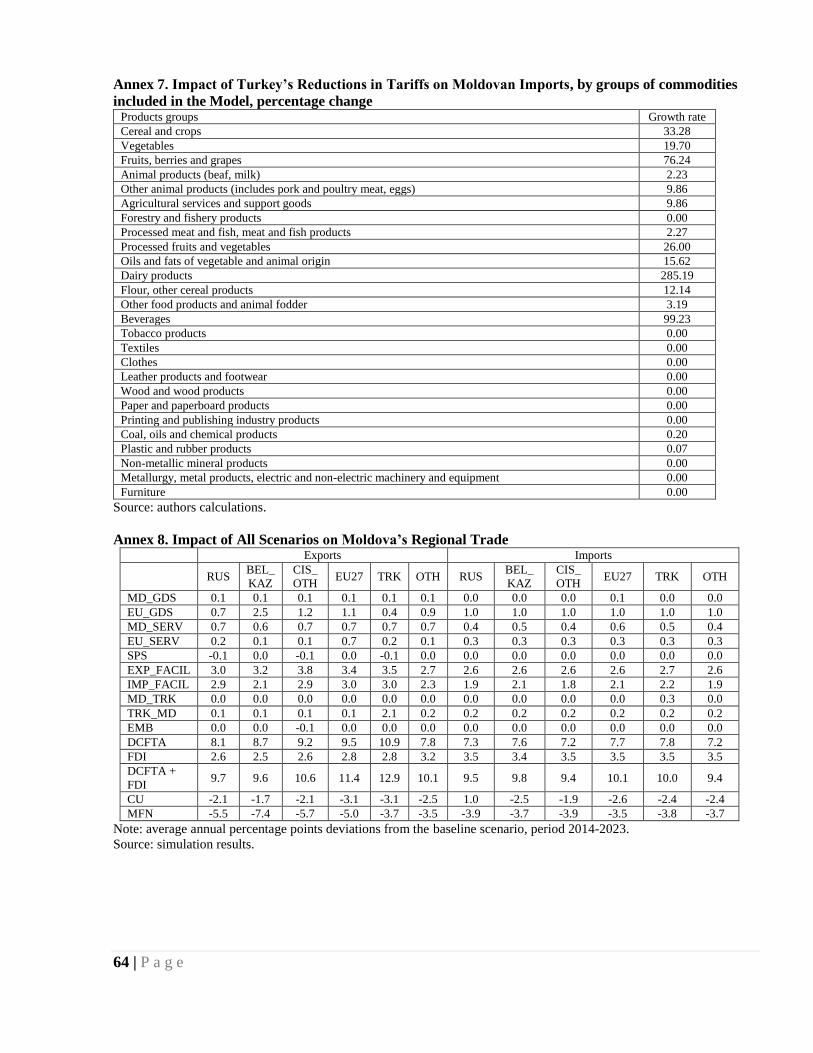
64 | P a g e
Annex 7. Impact of Turkey’s Reductions in Tariffs on Moldovan Imports, by groups of commodities
included in the Model, percentage change Products groups Growth rate
Cereal and crops 33.28
Vegetables 19.70
Fruits, berries and grapes 76.24
Animal products (beaf, milk) 2.23
Other animal products (includes pork and poultry meat, eggs) 9.86
Agricultural services and support goods 9.86
Forestry and fishery products 0.00
Processed meat and fish, meat and fish products 2.27
Processed fruits and vegetables 26.00
Oils and fats of vegetable and animal origin 15.62
Dairy products 285.19
Flour, other cereal products 12.14
Other food products and animal fodder 3.19
Beverages 99.23
Tobacco products 0.00
Textiles 0.00
Clothes 0.00
Leather products and footwear 0.00
Wood and wood products 0.00
Paper and paperboard products 0.00
Printing and publishing industry products 0.00
Coal, oils and chemical products 0.20
Plastic and rubber products 0.07
Non-metallic mineral products 0.00
Metallurgy, metal products, electric and non-electric machinery and equipment 0.00
Furniture 0.00
Source: authors calculations.
Annex 8. Impact of All Scenarios on Moldova’s Regional Trade Exports Imports
RUS
BEL_
KAZ
CIS_
OTH EU27 TRK OTH RUS
BEL_
KAZ
CIS_
OTH EU27 TRK OTH
MD_GDS 0.1 0.1 0.1 0.1 0.1 0.1 0.0 0.0 0.0 0.1 0.0 0.0
EU_GDS 0.7 2.5 1.2 1.1 0.4 0.9 1.0 1.0 1.0 1.0 1.0 1.0
MD_SERV 0.7 0.6 0.7 0.7 0.7 0.7 0.4 0.5 0.4 0.6 0.5 0.4
EU_SERV 0.2 0.1 0.1 0.7 0.2 0.1 0.3 0.3 0.3 0.3 0.3 0.3
SPS -0.1 0.0 -0.1 0.0 -0.1 0.0 0.0 0.0 0.0 0.0 0.0 0.0
EXP_FACIL 3.0 3.2 3.8 3.4 3.5 2.7 2.6 2.6 2.6 2.6 2.7 2.6
IMP_FACIL 2.9 2.1 2.9 3.0 3.0 2.3 1.9 2.1 1.8 2.1 2.2 1.9
MD_TRK 0.0 0.0 0.0 0.0 0.0 0.0 0.0 0.0 0.0 0.0 0.3 0.0
TRK_MD 0.1 0.1 0.1 0.1 2.1 0.2 0.2 0.2 0.2 0.2 0.2 0.2
EMB 0.0 0.0 -0.1 0.0 0.0 0.0 0.0 0.0 0.0 0.0 0.0 0.0
DCFTA 8.1 8.7 9.2 9.5 10.9 7.8 7.3 7.6 7.2 7.7 7.8 7.2
FDI 2.6 2.5 2.6 2.8 2.8 3.2 3.5 3.4 3.5 3.5 3.5 3.5
DCFTA +
FDI 9.7 9.6 10.6 11.4 12.9 10.1 9.5 9.8 9.4 10.1 10.0 9.4
CU -2.1 -1.7 -2.1 -3.1 -3.1 -2.5 1.0 -2.5 -1.9 -2.6 -2.4 -2.4
MFN -5.5 -7.4 -5.7 -5.0 -3.7 -3.5 -3.9 -3.7 -3.9 -3.5 -3.8 -3.7
Note: average annual percentage points deviations from the baseline scenario, period 2014-2023.
Source: simulation results.
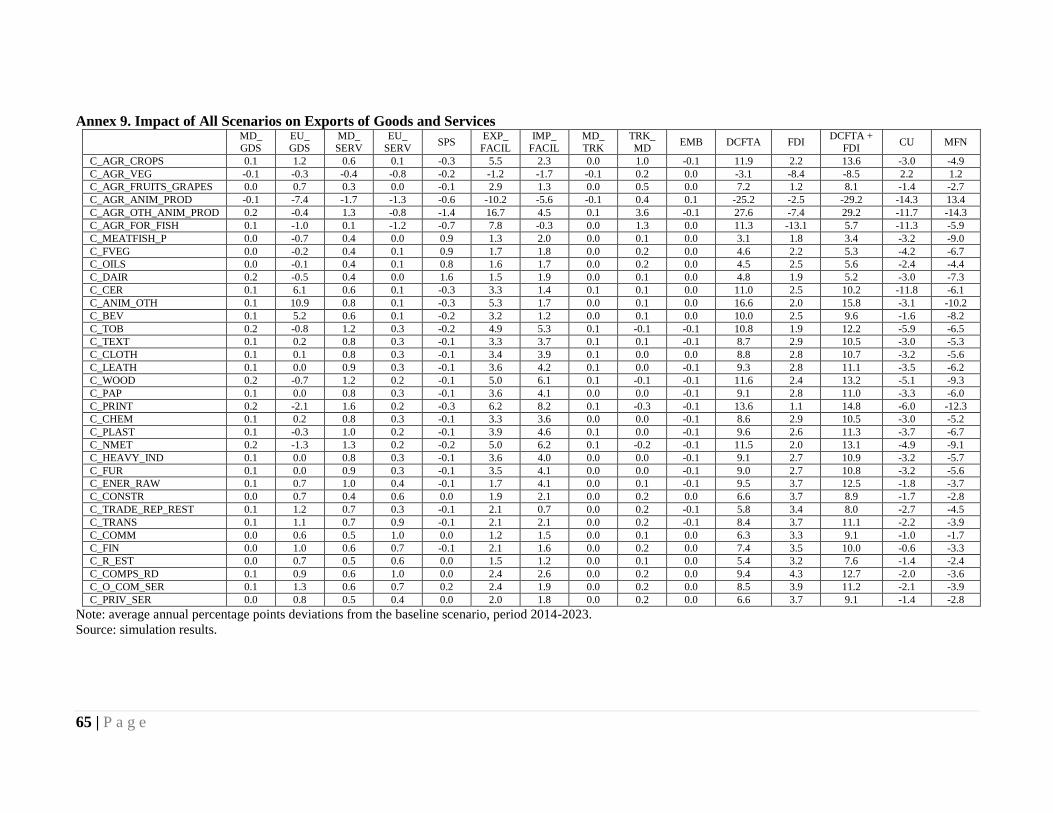
65 | P a g e
Annex 9. Impact of All Scenarios on Exports of Goods and Services
MD_
GDS
EU_
GDS
MD_
SERV
EU_
SERV SPS
EXP_
FACIL
IMP_
FACIL
MD_
TRK
TRK_
MD EMB DCFTA FDI
DCFTA +
FDI CU MFN
C_AGR_CROPS 0.1 1.2 0.6 0.1 -0.3 5.5 2.3 0.0 1.0 -0.1 11.9 2.2 13.6 -3.0 -4.9
C_AGR_VEG -0.1 -0.3 -0.4 -0.8 -0.2 -1.2 -1.7 -0.1 0.2 0.0 -3.1 -8.4 -8.5 2.2 1.2
C_AGR_FRUITS_GRAPES 0.0 0.7 0.3 0.0 -0.1 2.9 1.3 0.0 0.5 0.0 7.2 1.2 8.1 -1.4 -2.7
C_AGR_ANIM_PROD -0.1 -7.4 -1.7 -1.3 -0.6 -10.2 -5.6 -0.1 0.4 0.1 -25.2 -2.5 -29.2 -14.3 13.4
C_AGR_OTH_ANIM_PROD 0.2 -0.4 1.3 -0.8 -1.4 16.7 4.5 0.1 3.6 -0.1 27.6 -7.4 29.2 -11.7 -14.3
C_AGR_FOR_FISH 0.1 -1.0 0.1 -1.2 -0.7 7.8 -0.3 0.0 1.3 0.0 11.3 -13.1 5.7 -11.3 -5.9
C_MEATFISH_P 0.0 -0.7 0.4 0.0 0.9 1.3 2.0 0.0 0.1 0.0 3.1 1.8 3.4 -3.2 -9.0
C_FVEG 0.0 -0.2 0.4 0.1 0.9 1.7 1.8 0.0 0.2 0.0 4.6 2.2 5.3 -4.2 -6.7
C_OILS 0.0 -0.1 0.4 0.1 0.8 1.6 1.7 0.0 0.2 0.0 4.5 2.5 5.6 -2.4 -4.4
C_DAIR 0.2 -0.5 0.4 0.0 1.6 1.5 1.9 0.0 0.1 0.0 4.8 1.9 5.2 -3.0 -7.3
C_CER 0.1 6.1 0.6 0.1 -0.3 3.3 1.4 0.1 0.1 0.0 11.0 2.5 10.2 -11.8 -6.1
C_ANIM_OTH 0.1 10.9 0.8 0.1 -0.3 5.3 1.7 0.0 0.1 0.0 16.6 2.0 15.8 -3.1 -10.2
C_BEV 0.1 5.2 0.6 0.1 -0.2 3.2 1.2 0.0 0.1 0.0 10.0 2.5 9.6 -1.6 -8.2
C_TOB 0.2 -0.8 1.2 0.3 -0.2 4.9 5.3 0.1 -0.1 -0.1 10.8 1.9 12.2 -5.9 -6.5
C_TEXT 0.1 0.2 0.8 0.3 -0.1 3.3 3.7 0.1 0.1 -0.1 8.7 2.9 10.5 -3.0 -5.3
C_CLOTH 0.1 0.1 0.8 0.3 -0.1 3.4 3.9 0.1 0.0 0.0 8.8 2.8 10.7 -3.2 -5.6
C_LEATH 0.1 0.0 0.9 0.3 -0.1 3.6 4.2 0.1 0.0 -0.1 9.3 2.8 11.1 -3.5 -6.2
C_WOOD 0.2 -0.7 1.2 0.2 -0.1 5.0 6.1 0.1 -0.1 -0.1 11.6 2.4 13.2 -5.1 -9.3
C_PAP 0.1 0.0 0.8 0.3 -0.1 3.6 4.1 0.0 0.0 -0.1 9.1 2.8 11.0 -3.3 -6.0
C_PRINT 0.2 -2.1 1.6 0.2 -0.3 6.2 8.2 0.1 -0.3 -0.1 13.6 1.1 14.8 -6.0 -12.3
C_CHEM 0.1 0.2 0.8 0.3 -0.1 3.3 3.6 0.0 0.0 -0.1 8.6 2.9 10.5 -3.0 -5.2
C_PLAST 0.1 -0.3 1.0 0.2 -0.1 3.9 4.6 0.1 0.0 -0.1 9.6 2.6 11.3 -3.7 -6.7
C_NMET 0.2 -1.3 1.3 0.2 -0.2 5.0 6.2 0.1 -0.2 -0.1 11.5 2.0 13.1 -4.9 -9.1
C_HEAVY_IND 0.1 0.0 0.8 0.3 -0.1 3.6 4.0 0.0 0.0 -0.1 9.1 2.7 10.9 -3.2 -5.7
C_FUR 0.1 0.0 0.9 0.3 -0.1 3.5 4.1 0.0 0.0 -0.1 9.0 2.7 10.8 -3.2 -5.6
C_ENER_RAW 0.1 0.7 1.0 0.4 -0.1 1.7 4.1 0.0 0.1 -0.1 9.5 3.7 12.5 -1.8 -3.7
C_CONSTR 0.0 0.7 0.4 0.6 0.0 1.9 2.1 0.0 0.2 0.0 6.6 3.7 8.9 -1.7 -2.8
C_TRADE_REP_REST 0.1 1.2 0.7 0.3 -0.1 2.1 0.7 0.0 0.2 -0.1 5.8 3.4 8.0 -2.7 -4.5
C_TRANS 0.1 1.1 0.7 0.9 -0.1 2.1 2.1 0.0 0.2 -0.1 8.4 3.7 11.1 -2.2 -3.9
C_COMM 0.0 0.6 0.5 1.0 0.0 1.2 1.5 0.0 0.1 0.0 6.3 3.3 9.1 -1.0 -1.7
C_FIN 0.0 1.0 0.6 0.7 -0.1 2.1 1.6 0.0 0.2 0.0 7.4 3.5 10.0 -0.6 -3.3
C_R_EST 0.0 0.7 0.5 0.6 0.0 1.5 1.2 0.0 0.1 0.0 5.4 3.2 7.6 -1.4 -2.4
C_COMPS_RD 0.1 0.9 0.6 1.0 0.0 2.4 2.6 0.0 0.2 0.0 9.4 4.3 12.7 -2.0 -3.6
C_O_COM_SER 0.1 1.3 0.6 0.7 0.2 2.4 1.9 0.0 0.2 0.0 8.5 3.9 11.2 -2.1 -3.9
C_PRIV_SER 0.0 0.8 0.5 0.4 0.0 2.0 1.8 0.0 0.2 0.0 6.6 3.7 9.1 -1.4 -2.8
Note: average annual percentage points deviations from the baseline scenario, period 2014-2023.
Source: simulation results.
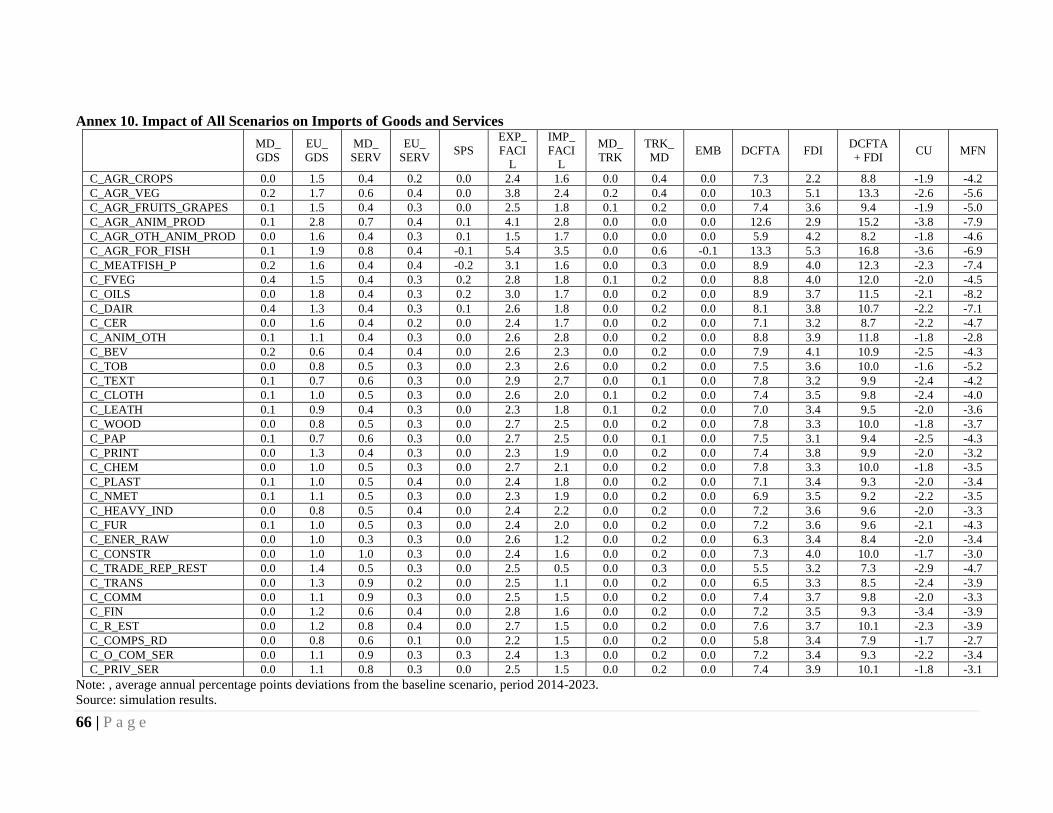
66 | P a g e
Annex 10. Impact of All Scenarios on Imports of Goods and Services
MD_
GDS
EU_
GDS
MD_
SERV
EU_
SERV SPS
EXP_
FACI
L
IMP_
FACI
L
MD_
TRK
TRK_
MD EMB DCFTA FDI
DCFTA
+ FDI CU MFN
C_AGR_CROPS 0.0 1.5 0.4 0.2 0.0 2.4 1.6 0.0 0.4 0.0 7.3 2.2 8.8 -1.9 -4.2
C_AGR_VEG 0.2 1.7 0.6 0.4 0.0 3.8 2.4 0.2 0.4 0.0 10.3 5.1 13.3 -2.6 -5.6
C_AGR_FRUITS_GRAPES 0.1 1.5 0.4 0.3 0.0 2.5 1.8 0.1 0.2 0.0 7.4 3.6 9.4 -1.9 -5.0
C_AGR_ANIM_PROD 0.1 2.8 0.7 0.4 0.1 4.1 2.8 0.0 0.0 0.0 12.6 2.9 15.2 -3.8 -7.9
C_AGR_OTH_ANIM_PROD 0.0 1.6 0.4 0.3 0.1 1.5 1.7 0.0 0.0 0.0 5.9 4.2 8.2 -1.8 -4.6
C_AGR_FOR_FISH 0.1 1.9 0.8 0.4 -0.1 5.4 3.5 0.0 0.6 -0.1 13.3 5.3 16.8 -3.6 -6.9
C_MEATFISH_P 0.2 1.6 0.4 0.4 -0.2 3.1 1.6 0.0 0.3 0.0 8.9 4.0 12.3 -2.3 -7.4
C_FVEG 0.4 1.5 0.4 0.3 0.2 2.8 1.8 0.1 0.2 0.0 8.8 4.0 12.0 -2.0 -4.5
C_OILS 0.0 1.8 0.4 0.3 0.2 3.0 1.7 0.0 0.2 0.0 8.9 3.7 11.5 -2.1 -8.2
C_DAIR 0.4 1.3 0.4 0.3 0.1 2.6 1.8 0.0 0.2 0.0 8.1 3.8 10.7 -2.2 -7.1
C_CER 0.0 1.6 0.4 0.2 0.0 2.4 1.7 0.0 0.2 0.0 7.1 3.2 8.7 -2.2 -4.7
C_ANIM_OTH 0.1 1.1 0.4 0.3 0.0 2.6 2.8 0.0 0.2 0.0 8.8 3.9 11.8 -1.8 -2.8
C_BEV 0.2 0.6 0.4 0.4 0.0 2.6 2.3 0.0 0.2 0.0 7.9 4.1 10.9 -2.5 -4.3
C_TOB 0.0 0.8 0.5 0.3 0.0 2.3 2.6 0.0 0.2 0.0 7.5 3.6 10.0 -1.6 -5.2
C_TEXT 0.1 0.7 0.6 0.3 0.0 2.9 2.7 0.0 0.1 0.0 7.8 3.2 9.9 -2.4 -4.2
C_CLOTH 0.1 1.0 0.5 0.3 0.0 2.6 2.0 0.1 0.2 0.0 7.4 3.5 9.8 -2.4 -4.0
C_LEATH 0.1 0.9 0.4 0.3 0.0 2.3 1.8 0.1 0.2 0.0 7.0 3.4 9.5 -2.0 -3.6
C_WOOD 0.0 0.8 0.5 0.3 0.0 2.7 2.5 0.0 0.2 0.0 7.8 3.3 10.0 -1.8 -3.7
C_PAP 0.1 0.7 0.6 0.3 0.0 2.7 2.5 0.0 0.1 0.0 7.5 3.1 9.4 -2.5 -4.3
C_PRINT 0.0 1.3 0.4 0.3 0.0 2.3 1.9 0.0 0.2 0.0 7.4 3.8 9.9 -2.0 -3.2
C_CHEM 0.0 1.0 0.5 0.3 0.0 2.7 2.1 0.0 0.2 0.0 7.8 3.3 10.0 -1.8 -3.5
C_PLAST 0.1 1.0 0.5 0.4 0.0 2.4 1.8 0.0 0.2 0.0 7.1 3.4 9.3 -2.0 -3.4
C_NMET 0.1 1.1 0.5 0.3 0.0 2.3 1.9 0.0 0.2 0.0 6.9 3.5 9.2 -2.2 -3.5
C_HEAVY_IND 0.0 0.8 0.5 0.4 0.0 2.4 2.2 0.0 0.2 0.0 7.2 3.6 9.6 -2.0 -3.3
C_FUR 0.1 1.0 0.5 0.3 0.0 2.4 2.0 0.0 0.2 0.0 7.2 3.6 9.6 -2.1 -4.3
C_ENER_RAW 0.0 1.0 0.3 0.3 0.0 2.6 1.2 0.0 0.2 0.0 6.3 3.4 8.4 -2.0 -3.4
C_CONSTR 0.0 1.0 1.0 0.3 0.0 2.4 1.6 0.0 0.2 0.0 7.3 4.0 10.0 -1.7 -3.0
C_TRADE_REP_REST 0.0 1.4 0.5 0.3 0.0 2.5 0.5 0.0 0.3 0.0 5.5 3.2 7.3 -2.9 -4.7
C_TRANS 0.0 1.3 0.9 0.2 0.0 2.5 1.1 0.0 0.2 0.0 6.5 3.3 8.5 -2.4 -3.9
C_COMM 0.0 1.1 0.9 0.3 0.0 2.5 1.5 0.0 0.2 0.0 7.4 3.7 9.8 -2.0 -3.3
C_FIN 0.0 1.2 0.6 0.4 0.0 2.8 1.6 0.0 0.2 0.0 7.2 3.5 9.3 -3.4 -3.9
C_R_EST 0.0 1.2 0.8 0.4 0.0 2.7 1.5 0.0 0.2 0.0 7.6 3.7 10.1 -2.3 -3.9
C_COMPS_RD 0.0 0.8 0.6 0.1 0.0 2.2 1.5 0.0 0.2 0.0 5.8 3.4 7.9 -1.7 -2.7
C_O_COM_SER 0.0 1.1 0.9 0.3 0.3 2.4 1.3 0.0 0.2 0.0 7.2 3.4 9.3 -2.2 -3.4
C_PRIV_SER 0.0 1.1 0.8 0.3 0.0 2.5 1.5 0.0 0.2 0.0 7.4 3.9 10.1 -1.8 -3.1
Note: , average annual percentage points deviations from the baseline scenario, period 2014-2023.
Source: simulation results.
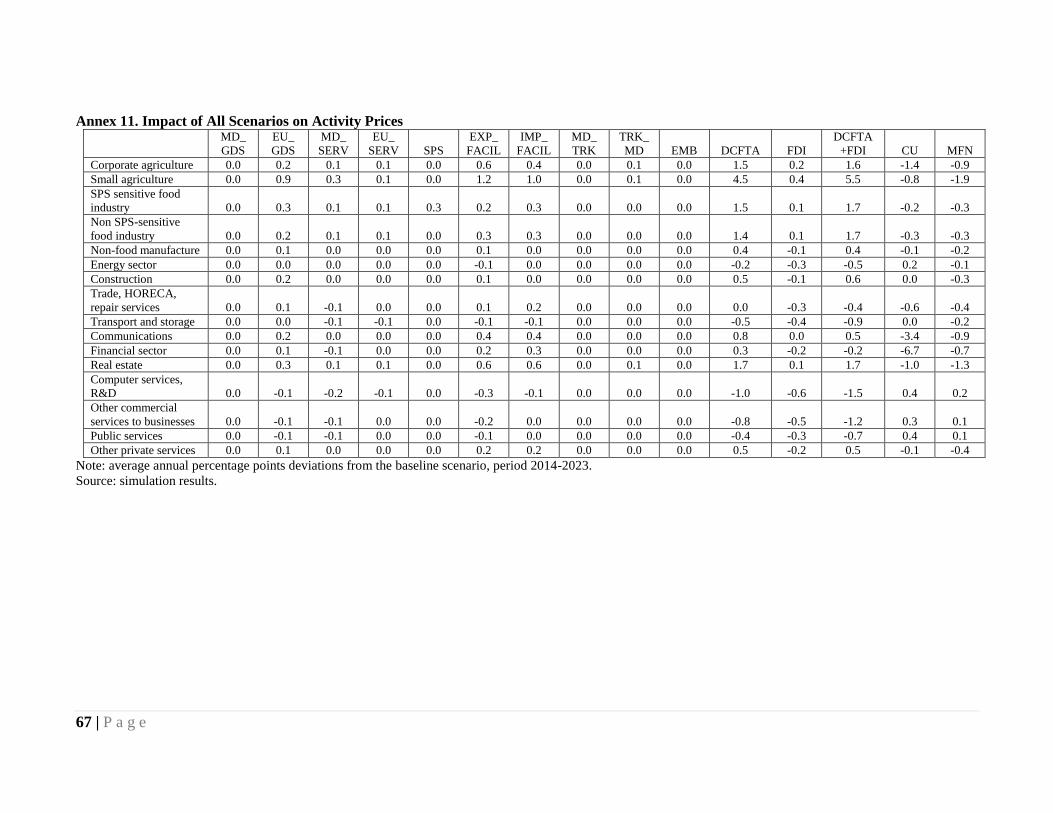
67 | P a g e
Annex 11. Impact of All Scenarios on Activity Prices
MD_
GDS
EU_
GDS
MD_
SERV
EU_
SERV SPS
EXP_
FACIL
IMP_
FACIL
MD_
TRK
TRK_
MD EMB DCFTA FDI
DCFTA
+FDI CU MFN
Corporate agriculture 0.0 0.2 0.1 0.1 0.0 0.6 0.4 0.0 0.1 0.0 1.5 0.2 1.6 -1.4 -0.9
Small agriculture 0.0 0.9 0.3 0.1 0.0 1.2 1.0 0.0 0.1 0.0 4.5 0.4 5.5 -0.8 -1.9
SPS sensitive food
industry 0.0 0.3 0.1 0.1 0.3 0.2 0.3 0.0 0.0 0.0 1.5 0.1 1.7 -0.2 -0.3
Non SPS-sensitive
food industry 0.0 0.2 0.1 0.1 0.0 0.3 0.3 0.0 0.0 0.0 1.4 0.1 1.7 -0.3 -0.3
Non-food manufacture 0.0 0.1 0.0 0.0 0.0 0.1 0.0 0.0 0.0 0.0 0.4 -0.1 0.4 -0.1 -0.2
Energy sector 0.0 0.0 0.0 0.0 0.0 -0.1 0.0 0.0 0.0 0.0 -0.2 -0.3 -0.5 0.2 -0.1
Construction 0.0 0.2 0.0 0.0 0.0 0.1 0.0 0.0 0.0 0.0 0.5 -0.1 0.6 0.0 -0.3
Trade, HORECA,
repair services 0.0 0.1 -0.1 0.0 0.0 0.1 0.2 0.0 0.0 0.0 0.0 -0.3 -0.4 -0.6 -0.4
Transport and storage 0.0 0.0 -0.1 -0.1 0.0 -0.1 -0.1 0.0 0.0 0.0 -0.5 -0.4 -0.9 0.0 -0.2
Communications 0.0 0.2 0.0 0.0 0.0 0.4 0.4 0.0 0.0 0.0 0.8 0.0 0.5 -3.4 -0.9
Financial sector 0.0 0.1 -0.1 0.0 0.0 0.2 0.3 0.0 0.0 0.0 0.3 -0.2 -0.2 -6.7 -0.7
Real estate 0.0 0.3 0.1 0.1 0.0 0.6 0.6 0.0 0.1 0.0 1.7 0.1 1.7 -1.0 -1.3
Computer services,
R&D 0.0 -0.1 -0.2 -0.1 0.0 -0.3 -0.1 0.0 0.0 0.0 -1.0 -0.6 -1.5 0.4 0.2
Other commercial
services to businesses 0.0 -0.1 -0.1 0.0 0.0 -0.2 0.0 0.0 0.0 0.0 -0.8 -0.5 -1.2 0.3 0.1
Public services 0.0 -0.1 -0.1 0.0 0.0 -0.1 0.0 0.0 0.0 0.0 -0.4 -0.3 -0.7 0.4 0.1
Other private services 0.0 0.1 0.0 0.0 0.0 0.2 0.2 0.0 0.0 0.0 0.5 -0.2 0.5 -0.1 -0.4
Note: average annual percentage points deviations from the baseline scenario, period 2014-2023.
Source: simulation results.

68 | P a g e
Annex 12. Impact of All Scenarios on Price of Intermediary Inputs
MD_
GDS
EU_
GDS
MD_
SERV
EU_
SERV SPS
EXP_
FACIL
IMP_
FACIL
MD_
TRK
TRK_
MD EMB DCFTA FDI
DCFTA
+FDI CU
MF
N
Corporate agriculture 0.0 0.1 0.0 0.0 0.1 0.2 0.0 0.0 0.0 0.0 0.3 -0.2 0.2 -0.3 -0.3
Small agriculture 0.0 0.1 0.0 0.0 0.1 0.2 -0.1 0.0 0.0 0.0 0.3 -0.2 0.2 -0.3 -0.3
SPS sensitive food industry 0.0 0.2 0.1 0.0 0.2 0.1 0.2 0.0 0.0 0.0 1.1 0.0 1.4 -0.1 -0.1
Non SPS-sensitive food
industry 0.0 0.2 0.1 0.0 0.0 0.2 0.2 0.0 0.0 0.0 1.1 0.0 1.4 -0.2 -0.1
Non-food manufacture 0.0 0.1 0.0 0.0 0.0 -0.1 -0.2 0.0 0.0 0.0 -0.1 -0.2 -0.2 0.2 0.1
Energy sector 0.0 0.0 0.0 0.0 0.0 -0.1 -0.1 0.0 0.0 0.0 -0.3 -0.3 -0.5 0.0 -0.1
Construction 0.0 0.1 0.0 0.0 0.0 -0.1 -0.3 0.0 0.0 0.0 -0.3 -0.2 -0.5 0.3 0.0
Trade, restaurants, repair
services 0.0 0.1 0.0 0.0 0.0 0.1 0.1 0.0 0.0 0.0 0.1 -0.2 0.0 -0.2 -0.3
Transport and storage 0.0 0.0 -0.1 -0.1 0.0 0.0 -0.2 0.0 0.0 0.0 -0.4 -0.3 -0.7 0.0 -0.2
Communications 0.0 0.0 0.0 -0.1 0.0 0.1 0.0 0.0 0.0 0.0 -0.2 -0.2 -0.4 -0.1 -0.4
Financial sector 0.0 0.1 -0.1 0.0 0.0 0.1 0.1 0.0 0.0 0.0 0.1 -0.2 -0.2 -0.7 -0.4
Real estate 0.0 0.1 0.0 0.0 0.0 0.0 0.0 0.0 0.0 0.0 0.0 -0.2 -0.2 0.0 -0.2
Computer services, R&D 0.0 0.0 -0.1 -0.1 0.0 0.0 0.0 0.0 0.0 0.0 -0.1 -0.2 -0.3 0.0 -0.3
Other commercial services to
businesses 0.0 -0.1 0.0 0.0 0.0 0.0 0.0 0.0 0.0 0.0 -0.1 -0.2 -0.2 0.0 -0.2
Public services 0.0 0.0 0.0 0.0 0.0 0.0 -0.1 0.0 0.0 0.0 -0.1 -0.2 -0.2 0.0 -0.1
Other private services 0.0 0.0 0.0 0.0 0.0 -0.1 -0.1 0.0 0.0 0.0 -0.1 -0.2 -0.2 0.0 -0.2
Note: average annual percentage points deviations from the baseline scenario, period 2014-2023.
Source: simulation results.
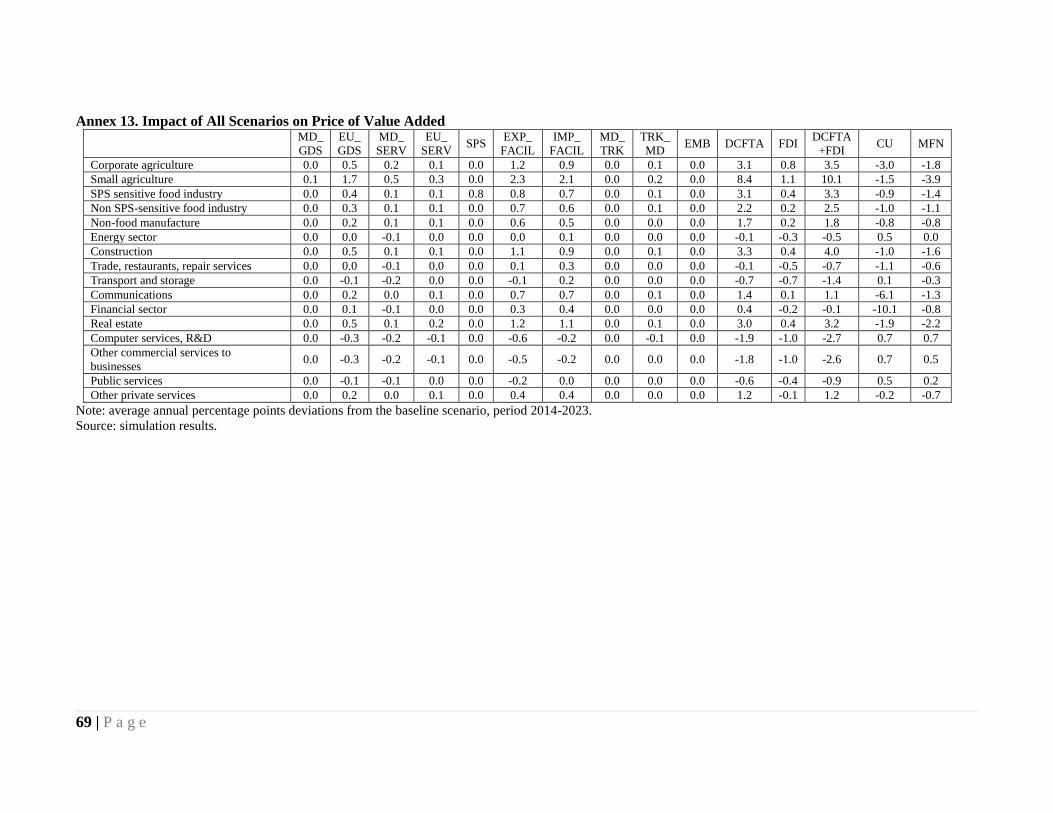
69 | P a g e
Annex 13. Impact of All Scenarios on Price of Value Added
MD_
GDS
EU_
GDS
MD_
SERV
EU_
SERV SPS
EXP_
FACIL
IMP_
FACIL
MD_
TRK
TRK_
MD EMB DCFTA FDI
DCFTA
+FDI CU MFN
Corporate agriculture 0.0 0.5 0.2 0.1 0.0 1.2 0.9 0.0 0.1 0.0 3.1 0.8 3.5 -3.0 -1.8
Small agriculture 0.1 1.7 0.5 0.3 0.0 2.3 2.1 0.0 0.2 0.0 8.4 1.1 10.1 -1.5 -3.9
SPS sensitive food industry 0.0 0.4 0.1 0.1 0.8 0.8 0.7 0.0 0.1 0.0 3.1 0.4 3.3 -0.9 -1.4
Non SPS-sensitive food industry 0.0 0.3 0.1 0.1 0.0 0.7 0.6 0.0 0.1 0.0 2.2 0.2 2.5 -1.0 -1.1
Non-food manufacture 0.0 0.2 0.1 0.1 0.0 0.6 0.5 0.0 0.0 0.0 1.7 0.2 1.8 -0.8 -0.8
Energy sector 0.0 0.0 -0.1 0.0 0.0 0.0 0.1 0.0 0.0 0.0 -0.1 -0.3 -0.5 0.5 0.0
Construction 0.0 0.5 0.1 0.1 0.0 1.1 0.9 0.0 0.1 0.0 3.3 0.4 4.0 -1.0 -1.6
Trade, restaurants, repair services 0.0 0.0 -0.1 0.0 0.0 0.1 0.3 0.0 0.0 0.0 -0.1 -0.5 -0.7 -1.1 -0.6
Transport and storage 0.0 -0.1 -0.2 0.0 0.0 -0.1 0.2 0.0 0.0 0.0 -0.7 -0.7 -1.4 0.1 -0.3
Communications 0.0 0.2 0.0 0.1 0.0 0.7 0.7 0.0 0.1 0.0 1.4 0.1 1.1 -6.1 -1.3
Financial sector 0.0 0.1 -0.1 0.0 0.0 0.3 0.4 0.0 0.0 0.0 0.4 -0.2 -0.1 -10.1 -0.8
Real estate 0.0 0.5 0.1 0.2 0.0 1.2 1.1 0.0 0.1 0.0 3.0 0.4 3.2 -1.9 -2.2
Computer services, R&D 0.0 -0.3 -0.2 -0.1 0.0 -0.6 -0.2 0.0 -0.1 0.0 -1.9 -1.0 -2.7 0.7 0.7
Other commercial services to
businesses 0.0 -0.3 -0.2 -0.1 0.0 -0.5 -0.2 0.0 0.0 0.0 -1.8 -1.0 -2.6 0.7 0.5
Public services 0.0 -0.1 -0.1 0.0 0.0 -0.2 0.0 0.0 0.0 0.0 -0.6 -0.4 -0.9 0.5 0.2
Other private services 0.0 0.2 0.0 0.1 0.0 0.4 0.4 0.0 0.0 0.0 1.2 -0.1 1.2 -0.2 -0.7
Note: average annual percentage points deviations from the baseline scenario, period 2014-2023.
Source: simulation results.
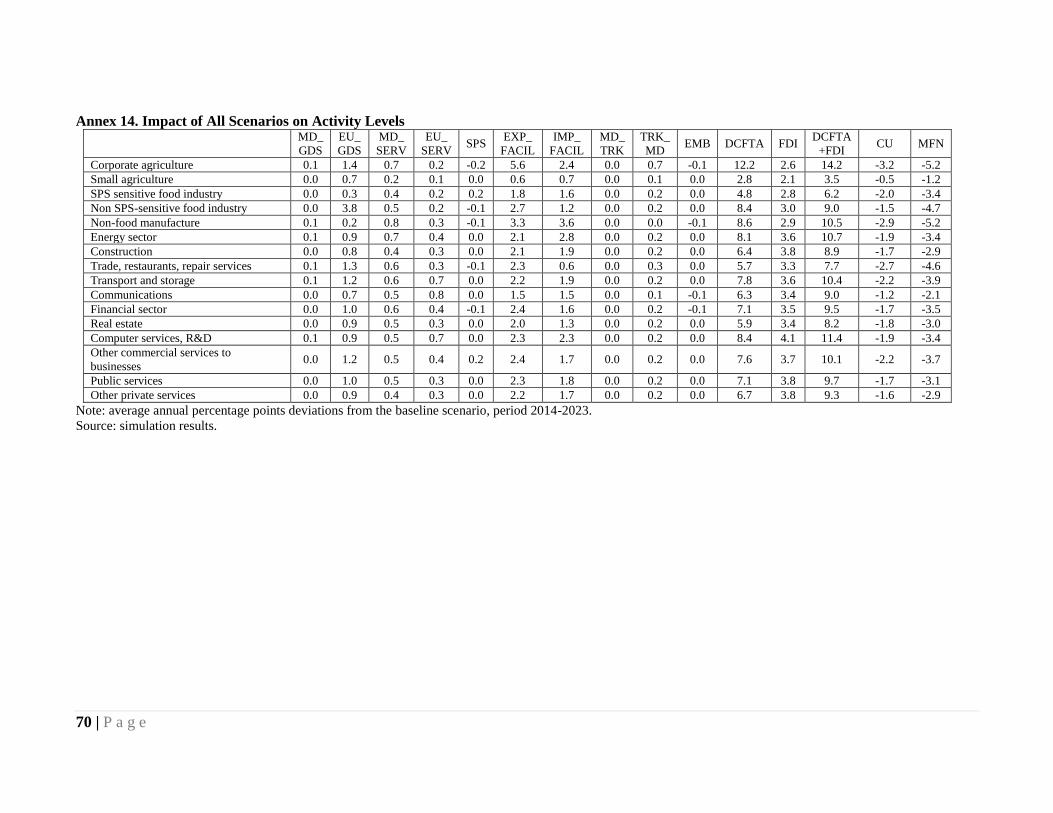
70 | P a g e
Annex 14. Impact of All Scenarios on Activity Levels
MD_
GDS
EU_
GDS
MD_
SERV
EU_
SERV SPS
EXP_
FACIL
IMP_
FACIL
MD_
TRK
TRK_
MD EMB DCFTA FDI
DCFTA
+FDI CU MFN
Corporate agriculture 0.1 1.4 0.7 0.2 -0.2 5.6 2.4 0.0 0.7 -0.1 12.2 2.6 14.2 -3.2 -5.2
Small agriculture 0.0 0.7 0.2 0.1 0.0 0.6 0.7 0.0 0.1 0.0 2.8 2.1 3.5 -0.5 -1.2
SPS sensitive food industry 0.0 0.3 0.4 0.2 0.2 1.8 1.6 0.0 0.2 0.0 4.8 2.8 6.2 -2.0 -3.4
Non SPS-sensitive food industry 0.0 3.8 0.5 0.2 -0.1 2.7 1.2 0.0 0.2 0.0 8.4 3.0 9.0 -1.5 -4.7
Non-food manufacture 0.1 0.2 0.8 0.3 -0.1 3.3 3.6 0.0 0.0 -0.1 8.6 2.9 10.5 -2.9 -5.2
Energy sector 0.1 0.9 0.7 0.4 0.0 2.1 2.8 0.0 0.2 0.0 8.1 3.6 10.7 -1.9 -3.4
Construction 0.0 0.8 0.4 0.3 0.0 2.1 1.9 0.0 0.2 0.0 6.4 3.8 8.9 -1.7 -2.9
Trade, restaurants, repair services 0.1 1.3 0.6 0.3 -0.1 2.3 0.6 0.0 0.3 0.0 5.7 3.3 7.7 -2.7 -4.6
Transport and storage 0.1 1.2 0.6 0.7 0.0 2.2 1.9 0.0 0.2 0.0 7.8 3.6 10.4 -2.2 -3.9
Communications 0.0 0.7 0.5 0.8 0.0 1.5 1.5 0.0 0.1 -0.1 6.3 3.4 9.0 -1.2 -2.1
Financial sector 0.0 1.0 0.6 0.4 -0.1 2.4 1.6 0.0 0.2 -0.1 7.1 3.5 9.5 -1.7 -3.5
Real estate 0.0 0.9 0.5 0.3 0.0 2.0 1.3 0.0 0.2 0.0 5.9 3.4 8.2 -1.8 -3.0
Computer services, R&D 0.1 0.9 0.5 0.7 0.0 2.3 2.3 0.0 0.2 0.0 8.4 4.1 11.4 -1.9 -3.4
Other commercial services to
businesses 0.0 1.2 0.5 0.4 0.2 2.4 1.7 0.0 0.2 0.0 7.6 3.7 10.1 -2.2 -3.7
Public services 0.0 1.0 0.5 0.3 0.0 2.3 1.8 0.0 0.2 0.0 7.1 3.8 9.7 -1.7 -3.1
Other private services 0.0 0.9 0.4 0.3 0.0 2.2 1.7 0.0 0.2 0.0 6.7 3.8 9.3 -1.6 -2.9
Note: average annual percentage points deviations from the baseline scenario, period 2014-2023.
Source: simulation results.
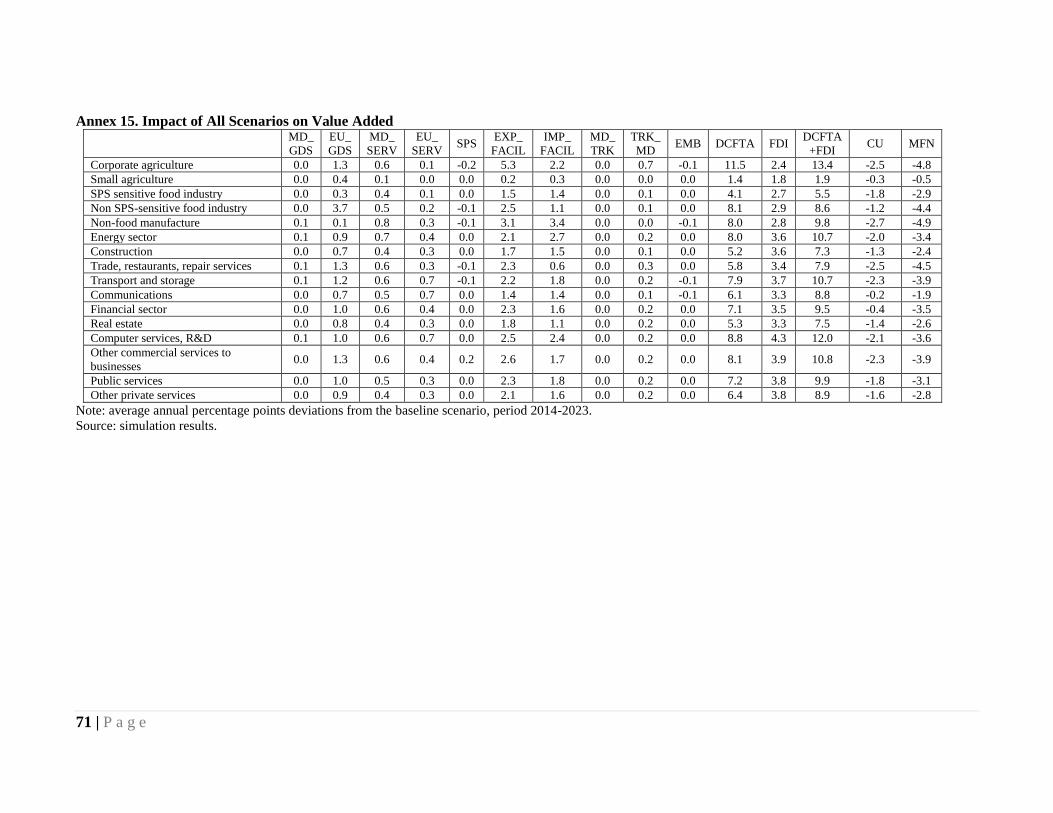
71 | P a g e
Annex 15. Impact of All Scenarios on Value Added
MD_
GDS
EU_
GDS
MD_
SERV
EU_
SERV SPS
EXP_
FACIL
IMP_
FACIL
MD_
TRK
TRK_
MD EMB DCFTA FDI
DCFTA
+FDI CU MFN
Corporate agriculture 0.0 1.3 0.6 0.1 -0.2 5.3 2.2 0.0 0.7 -0.1 11.5 2.4 13.4 -2.5 -4.8
Small agriculture 0.0 0.4 0.1 0.0 0.0 0.2 0.3 0.0 0.0 0.0 1.4 1.8 1.9 -0.3 -0.5
SPS sensitive food industry 0.0 0.3 0.4 0.1 0.0 1.5 1.4 0.0 0.1 0.0 4.1 2.7 5.5 -1.8 -2.9
Non SPS-sensitive food industry 0.0 3.7 0.5 0.2 -0.1 2.5 1.1 0.0 0.1 0.0 8.1 2.9 8.6 -1.2 -4.4
Non-food manufacture 0.1 0.1 0.8 0.3 -0.1 3.1 3.4 0.0 0.0 -0.1 8.0 2.8 9.8 -2.7 -4.9
Energy sector 0.1 0.9 0.7 0.4 0.0 2.1 2.7 0.0 0.2 0.0 8.0 3.6 10.7 -2.0 -3.4
Construction 0.0 0.7 0.4 0.3 0.0 1.7 1.5 0.0 0.1 0.0 5.2 3.6 7.3 -1.3 -2.4
Trade, restaurants, repair services 0.1 1.3 0.6 0.3 -0.1 2.3 0.6 0.0 0.3 0.0 5.8 3.4 7.9 -2.5 -4.5
Transport and storage 0.1 1.2 0.6 0.7 -0.1 2.2 1.8 0.0 0.2 -0.1 7.9 3.7 10.7 -2.3 -3.9
Communications 0.0 0.7 0.5 0.7 0.0 1.4 1.4 0.0 0.1 -0.1 6.1 3.3 8.8 -0.2 -1.9
Financial sector 0.0 1.0 0.6 0.4 0.0 2.3 1.6 0.0 0.2 0.0 7.1 3.5 9.5 -0.4 -3.5
Real estate 0.0 0.8 0.4 0.3 0.0 1.8 1.1 0.0 0.2 0.0 5.3 3.3 7.5 -1.4 -2.6
Computer services, R&D 0.1 1.0 0.6 0.7 0.0 2.5 2.4 0.0 0.2 0.0 8.8 4.3 12.0 -2.1 -3.6
Other commercial services to
businesses 0.0 1.3 0.6 0.4 0.2 2.6 1.7 0.0 0.2 0.0 8.1 3.9 10.8 -2.3 -3.9
Public services 0.0 1.0 0.5 0.3 0.0 2.3 1.8 0.0 0.2 0.0 7.2 3.8 9.9 -1.8 -3.1
Other private services 0.0 0.9 0.4 0.3 0.0 2.1 1.6 0.0 0.2 0.0 6.4 3.8 8.9 -1.6 -2.8
Note: average annual percentage points deviations from the baseline scenario, period 2014-2023.
Source: simulation results.

72 | P a g e
Annex 16. Impact of All Scenarios on Labor Demand
MD_
GDS
EU_
GDS
MD_
SERV
EU_
SERV SPS
EXP_
FACIL
IMP_
FACIL
MD_
TRK
TRK_
MD EMB DCFTA FDI
DCFTA
+FDI CU MFN
Corporate agriculture 0.1 2.0 0.9 0.3 -0.2 7.2 3.6 0.0 0.9 -0.1 16.8 3.7 19.5 -4.4 -7.4
SPS sensitive food industry 0.0 0.9 0.6 0.3 -1.3 2.9 2.5 0.0 0.3 0.0 6.6 3.5 8.5 -2.9 -5.1
Non SPS-sensitive food industry 0.0 3.7 0.4 0.2 -0.1 2.4 1.1 0.0 0.1 0.0 7.7 2.5 8.0 -1.4 -4.4
Non-food manufacture 0.1 0.1 0.7 0.3 -0.1 3.0 3.5 0.0 0.0 0.0 7.7 2.5 9.2 -2.8 -4.9
Energy sector 0.1 0.7 0.6 0.3 0.0 1.7 2.6 0.0 0.1 0.0 6.8 3.0 8.9 -1.6 -3.0
Construction 0.0 0.7 0.3 0.3 0.0 1.7 1.7 0.0 0.2 0.0 5.4 3.3 7.3 -1.4 -2.5
Trade, restaurants, repair services 0.1 1.8 0.7 0.4 -0.1 3.4 1.7 0.1 0.3 0.0 8.4 3.7 10.4 -3.5 -6.8
Transport and storage 0.1 1.5 0.6 0.8 -0.1 3.0 2.7 0.0 0.3 0.0 9.6 3.7 11.9 -2.7 -5.7
Communications 0.1 1.5 0.7 1.0 0.0 3.5 3.1 0.0 0.3 0.0 11.5 4.5 14.6 -2.9 -5.4
Financial sector 0.1 1.6 0.7 0.5 0.0 3.7 2.8 0.0 0.3 0.0 10.4 4.1 12.7 -3.3 -5.9
Real estate 0.1 2.3 0.9 0.7 0.0 5.1 3.9 0.1 0.4 -0.1 14.9 5.2 18.7 -4.3 -8.0
Computer services, R&D 0.1 0.8 0.4 0.7 0.0 2.0 2.3 0.0 0.2 0.0 7.1 3.3 9.4 -1.6 -3.3
Other commercial services to
businesses 0.1 1.1 0.4 0.4 0.2 2.3 1.8 0.0 0.2 0.0 6.9 3.1 8.7 -2.0 -3.9
Public services 0.0 0.9 0.4 0.3 0.0 2.0 1.7 0.0 0.2 0.0 6.2 3.3 8.5 -1.5 -2.8
Other private services 0.0 0.9 0.4 0.3 0.0 2.1 1.7 0.0 0.2 0.0 6.4 3.4 8.7 -1.6 -3.0
Note: average annual percentage points deviations from the baseline scenario, period 2014-2023.
Source: simulation results.
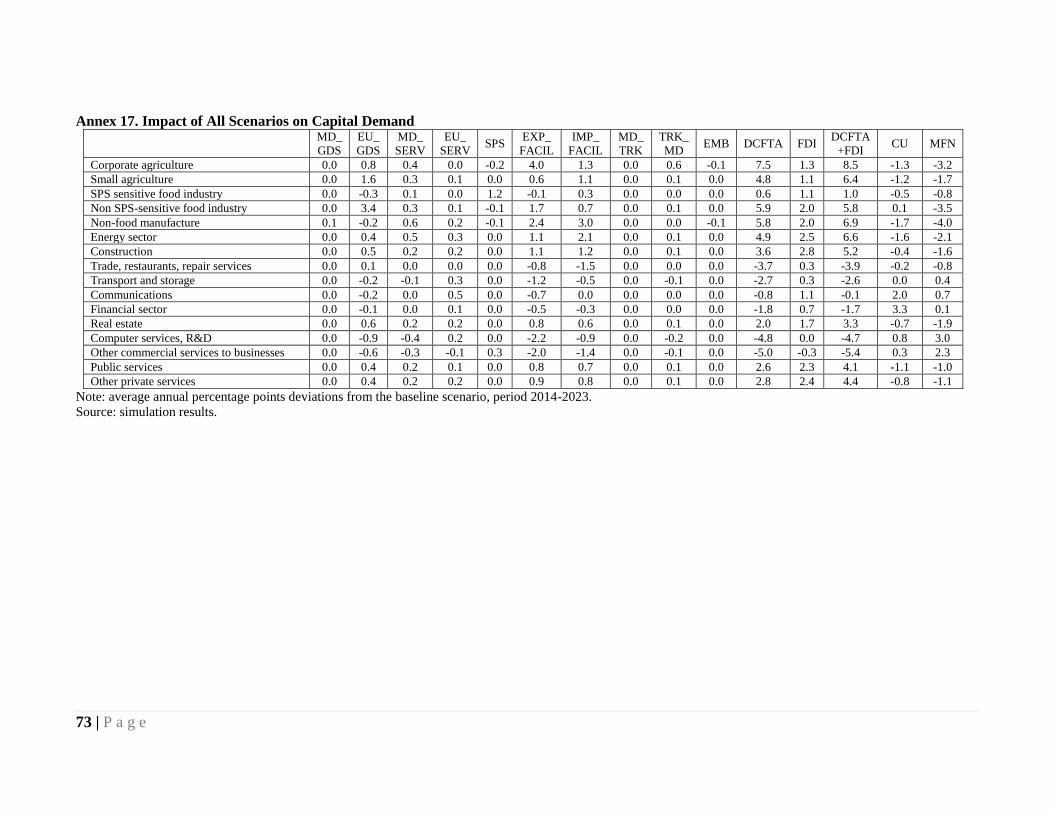
73 | P a g e
Annex 17. Impact of All Scenarios on Capital Demand
MD_
GDS
EU_
GDS
MD_
SERV
EU_
SERV SPS
EXP_
FACIL
IMP_
FACIL
MD_
TRK
TRK_
MD EMB DCFTA FDI
DCFTA
+FDI CU MFN
Corporate agriculture 0.0 0.8 0.4 0.0 -0.2 4.0 1.3 0.0 0.6 -0.1 7.5 1.3 8.5 -1.3 -3.2
Small agriculture 0.0 1.6 0.3 0.1 0.0 0.6 1.1 0.0 0.1 0.0 4.8 1.1 6.4 -1.2 -1.7
SPS sensitive food industry 0.0 -0.3 0.1 0.0 1.2 -0.1 0.3 0.0 0.0 0.0 0.6 1.1 1.0 -0.5 -0.8
Non SPS-sensitive food industry 0.0 3.4 0.3 0.1 -0.1 1.7 0.7 0.0 0.1 0.0 5.9 2.0 5.8 0.1 -3.5
Non-food manufacture 0.1 -0.2 0.6 0.2 -0.1 2.4 3.0 0.0 0.0 -0.1 5.8 2.0 6.9 -1.7 -4.0
Energy sector 0.0 0.4 0.5 0.3 0.0 1.1 2.1 0.0 0.1 0.0 4.9 2.5 6.6 -1.6 -2.1
Construction 0.0 0.5 0.2 0.2 0.0 1.1 1.2 0.0 0.1 0.0 3.6 2.8 5.2 -0.4 -1.6
Trade, restaurants, repair services 0.0 0.1 0.0 0.0 0.0 -0.8 -1.5 0.0 0.0 0.0 -3.7 0.3 -3.9 -0.2 -0.8
Transport and storage 0.0 -0.2 -0.1 0.3 0.0 -1.2 -0.5 0.0 -0.1 0.0 -2.7 0.3 -2.6 0.0 0.4
Communications 0.0 -0.2 0.0 0.5 0.0 -0.7 0.0 0.0 0.0 0.0 -0.8 1.1 -0.1 2.0 0.7
Financial sector 0.0 -0.1 0.0 0.1 0.0 -0.5 -0.3 0.0 0.0 0.0 -1.8 0.7 -1.7 3.3 0.1
Real estate 0.0 0.6 0.2 0.2 0.0 0.8 0.6 0.0 0.1 0.0 2.0 1.7 3.3 -0.7 -1.9
Computer services, R&D 0.0 -0.9 -0.4 0.2 0.0 -2.2 -0.9 0.0 -0.2 0.0 -4.8 0.0 -4.7 0.8 3.0
Other commercial services to businesses 0.0 -0.6 -0.3 -0.1 0.3 -2.0 -1.4 0.0 -0.1 0.0 -5.0 -0.3 -5.4 0.3 2.3
Public services 0.0 0.4 0.2 0.1 0.0 0.8 0.7 0.0 0.1 0.0 2.6 2.3 4.1 -1.1 -1.0
Other private services 0.0 0.4 0.2 0.2 0.0 0.9 0.8 0.0 0.1 0.0 2.8 2.4 4.4 -0.8 -1.1
Note: average annual percentage points deviations from the baseline scenario, period 2014-2023.
Source: simulation results.
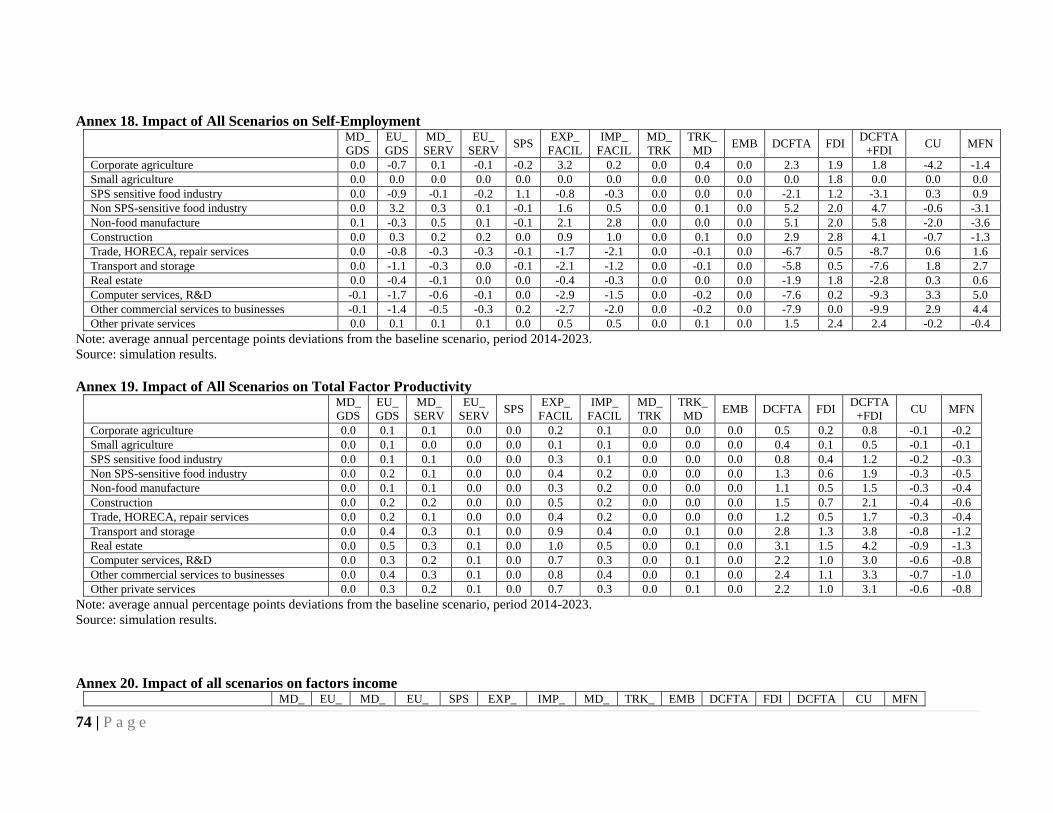
74 | P a g e
Annex 18. Impact of All Scenarios on Self-Employment
MD_
GDS
EU_
GDS
MD_
SERV
EU_
SERV SPS
EXP_
FACIL
IMP_
FACIL
MD_
TRK
TRK_
MD EMB DCFTA FDI
DCFTA
+FDI CU MFN
Corporate agriculture 0.0 -0.7 0.1 -0.1 -0.2 3.2 0.2 0.0 0.4 0.0 2.3 1.9 1.8 -4.2 -1.4
Small agriculture 0.0 0.0 0.0 0.0 0.0 0.0 0.0 0.0 0.0 0.0 0.0 1.8 0.0 0.0 0.0
SPS sensitive food industry 0.0 -0.9 -0.1 -0.2 1.1 -0.8 -0.3 0.0 0.0 0.0 -2.1 1.2 -3.1 0.3 0.9
Non SPS-sensitive food industry 0.0 3.2 0.3 0.1 -0.1 1.6 0.5 0.0 0.1 0.0 5.2 2.0 4.7 -0.6 -3.1
Non-food manufacture 0.1 -0.3 0.5 0.1 -0.1 2.1 2.8 0.0 0.0 0.0 5.1 2.0 5.8 -2.0 -3.6
Construction 0.0 0.3 0.2 0.2 0.0 0.9 1.0 0.0 0.1 0.0 2.9 2.8 4.1 -0.7 -1.3
Trade, HORECA, repair services 0.0 -0.8 -0.3 -0.3 -0.1 -1.7 -2.1 0.0 -0.1 0.0 -6.7 0.5 -8.7 0.6 1.6
Transport and storage 0.0 -1.1 -0.3 0.0 -0.1 -2.1 -1.2 0.0 -0.1 0.0 -5.8 0.5 -7.6 1.8 2.7
Real estate 0.0 -0.4 -0.1 0.0 0.0 -0.4 -0.3 0.0 0.0 0.0 -1.9 1.8 -2.8 0.3 0.6
Computer services, R&D -0.1 -1.7 -0.6 -0.1 0.0 -2.9 -1.5 0.0 -0.2 0.0 -7.6 0.2 -9.3 3.3 5.0
Other commercial services to businesses -0.1 -1.4 -0.5 -0.3 0.2 -2.7 -2.0 0.0 -0.2 0.0 -7.9 0.0 -9.9 2.9 4.4
Other private services 0.0 0.1 0.1 0.1 0.0 0.5 0.5 0.0 0.1 0.0 1.5 2.4 2.4 -0.2 -0.4
Note: average annual percentage points deviations from the baseline scenario, period 2014-2023.
Source: simulation results.
Annex 19. Impact of All Scenarios on Total Factor Productivity
MD_
GDS
EU_
GDS
MD_
SERV
EU_
SERV SPS
EXP_
FACIL
IMP_
FACIL
MD_
TRK
TRK_
MD EMB DCFTA FDI
DCFTA
+FDI CU MFN
Corporate agriculture 0.0 0.1 0.1 0.0 0.0 0.2 0.1 0.0 0.0 0.0 0.5 0.2 0.8 -0.1 -0.2
Small agriculture 0.0 0.1 0.0 0.0 0.0 0.1 0.1 0.0 0.0 0.0 0.4 0.1 0.5 -0.1 -0.1
SPS sensitive food industry 0.0 0.1 0.1 0.0 0.0 0.3 0.1 0.0 0.0 0.0 0.8 0.4 1.2 -0.2 -0.3
Non SPS-sensitive food industry 0.0 0.2 0.1 0.0 0.0 0.4 0.2 0.0 0.0 0.0 1.3 0.6 1.9 -0.3 -0.5
Non-food manufacture 0.0 0.1 0.1 0.0 0.0 0.3 0.2 0.0 0.0 0.0 1.1 0.5 1.5 -0.3 -0.4
Construction 0.0 0.2 0.2 0.0 0.0 0.5 0.2 0.0 0.0 0.0 1.5 0.7 2.1 -0.4 -0.6
Trade, HORECA, repair services 0.0 0.2 0.1 0.0 0.0 0.4 0.2 0.0 0.0 0.0 1.2 0.5 1.7 -0.3 -0.4
Transport and storage 0.0 0.4 0.3 0.1 0.0 0.9 0.4 0.0 0.1 0.0 2.8 1.3 3.8 -0.8 -1.2
Real estate 0.0 0.5 0.3 0.1 0.0 1.0 0.5 0.0 0.1 0.0 3.1 1.5 4.2 -0.9 -1.3
Computer services, R&D 0.0 0.3 0.2 0.1 0.0 0.7 0.3 0.0 0.1 0.0 2.2 1.0 3.0 -0.6 -0.8
Other commercial services to businesses 0.0 0.4 0.3 0.1 0.0 0.8 0.4 0.0 0.1 0.0 2.4 1.1 3.3 -0.7 -1.0
Other private services 0.0 0.3 0.2 0.1 0.0 0.7 0.3 0.0 0.1 0.0 2.2 1.0 3.1 -0.6 -0.8
Note: average annual percentage points deviations from the baseline scenario, period 2014-2023.
Source: simulation results.
Annex 20. Impact of all scenarios on factors income MD_ EU_ MD_ EU_ SPS EXP_ IMP_ MD_ TRK_ EMB DCFTA FDI DCFTA CU MFN
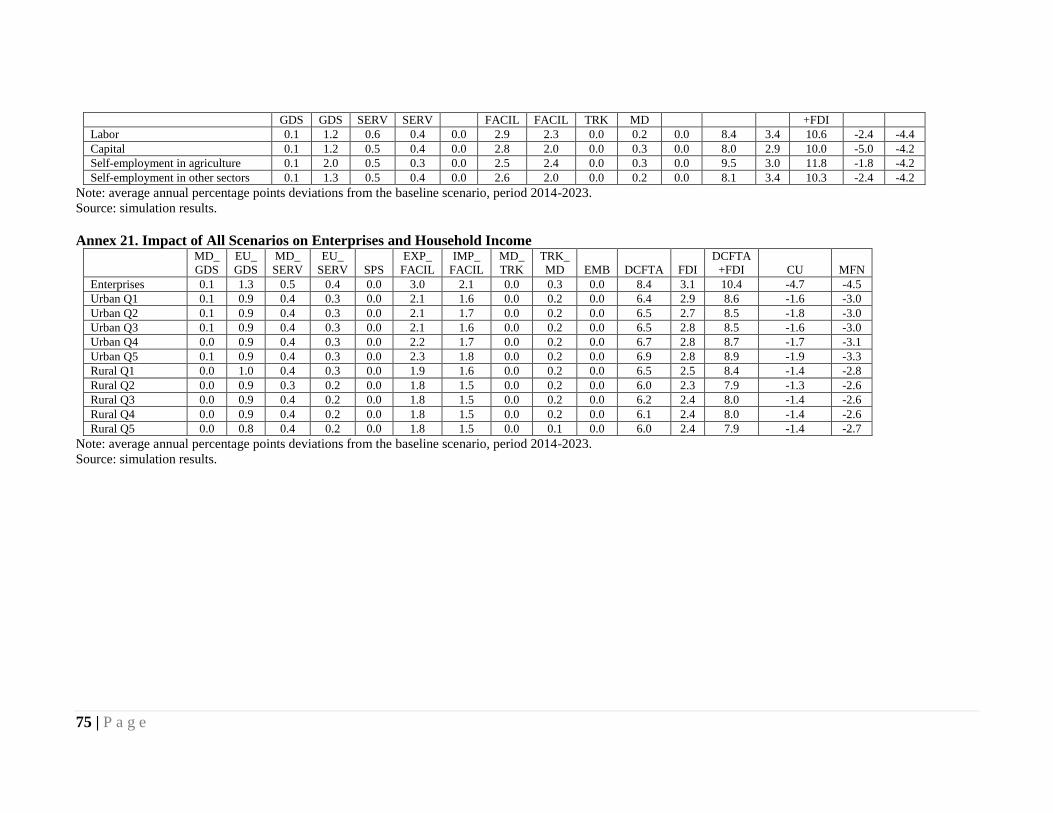
75 | P a g e
GDS GDS SERV SERV FACIL FACIL TRK MD +FDI
Labor 0.1 1.2 0.6 0.4 0.0 2.9 2.3 0.0 0.2 0.0 8.4 3.4 10.6 -2.4 -4.4
Capital 0.1 1.2 0.5 0.4 0.0 2.8 2.0 0.0 0.3 0.0 8.0 2.9 10.0 -5.0 -4.2
Self-employment in agriculture 0.1 2.0 0.5 0.3 0.0 2.5 2.4 0.0 0.3 0.0 9.5 3.0 11.8 -1.8 -4.2
Self-employment in other sectors 0.1 1.3 0.5 0.4 0.0 2.6 2.0 0.0 0.2 0.0 8.1 3.4 10.3 -2.4 -4.2
Note: average annual percentage points deviations from the baseline scenario, period 2014-2023.
Source: simulation results.
Annex 21. Impact of All Scenarios on Enterprises and Household Income
MD_
GDS
EU_
GDS
MD_
SERV
EU_
SERV SPS
EXP_
FACIL
IMP_
FACIL
MD_
TRK
TRK_
MD EMB DCFTA FDI
DCFTA
+FDI CU MFN
Enterprises 0.1 1.3 0.5 0.4 0.0 3.0 2.1 0.0 0.3 0.0 8.4 3.1 10.4 -4.7 -4.5
Urban Q1 0.1 0.9 0.4 0.3 0.0 2.1 1.6 0.0 0.2 0.0 6.4 2.9 8.6 -1.6 -3.0
Urban Q2 0.1 0.9 0.4 0.3 0.0 2.1 1.7 0.0 0.2 0.0 6.5 2.7 8.5 -1.8 -3.0
Urban Q3 0.1 0.9 0.4 0.3 0.0 2.1 1.6 0.0 0.2 0.0 6.5 2.8 8.5 -1.6 -3.0
Urban Q4 0.0 0.9 0.4 0.3 0.0 2.2 1.7 0.0 0.2 0.0 6.7 2.8 8.7 -1.7 -3.1
Urban Q5 0.1 0.9 0.4 0.3 0.0 2.3 1.8 0.0 0.2 0.0 6.9 2.8 8.9 -1.9 -3.3
Rural Q1 0.0 1.0 0.4 0.3 0.0 1.9 1.6 0.0 0.2 0.0 6.5 2.5 8.4 -1.4 -2.8
Rural Q2 0.0 0.9 0.3 0.2 0.0 1.8 1.5 0.0 0.2 0.0 6.0 2.3 7.9 -1.3 -2.6
Rural Q3 0.0 0.9 0.4 0.2 0.0 1.8 1.5 0.0 0.2 0.0 6.2 2.4 8.0 -1.4 -2.6
Rural Q4 0.0 0.9 0.4 0.2 0.0 1.8 1.5 0.0 0.2 0.0 6.1 2.4 8.0 -1.4 -2.6
Rural Q5 0.0 0.8 0.4 0.2 0.0 1.8 1.5 0.0 0.1 0.0 6.0 2.4 7.9 -1.4 -2.7
Note: average annual percentage points deviations from the baseline scenario, period 2014-2023.
Source: simulation results.
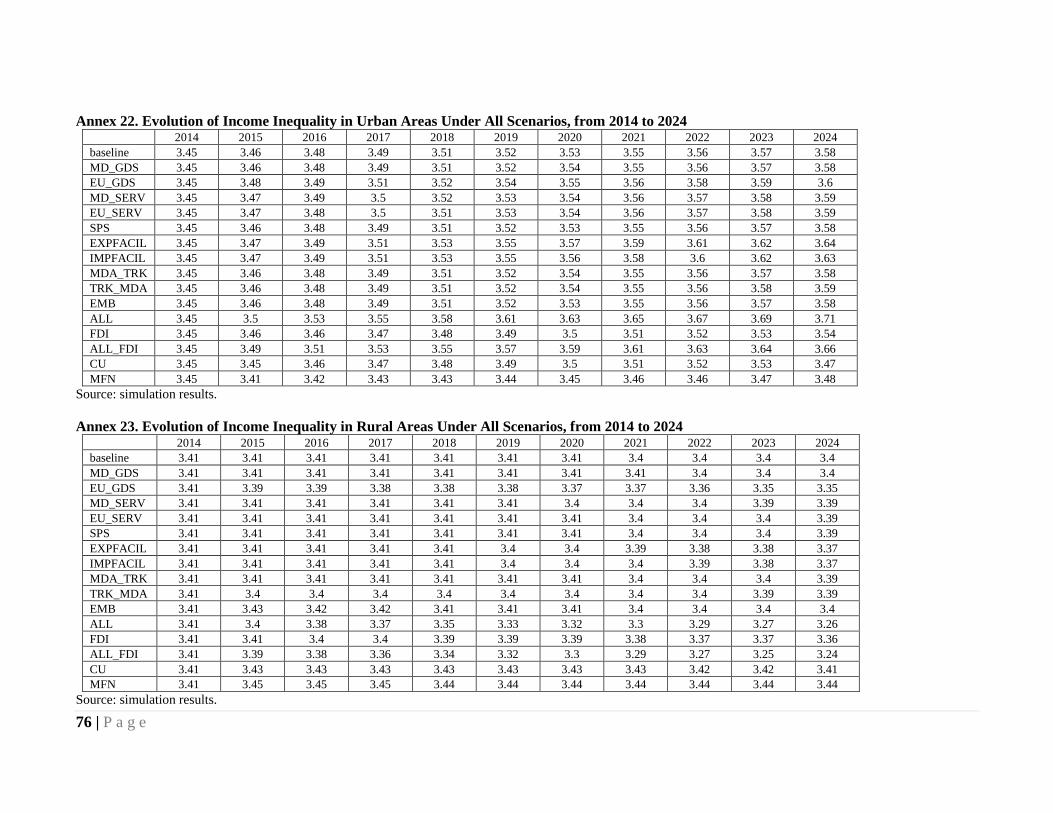
76 | P a g e
Annex 22. Evolution of Income Inequality in Urban Areas Under All Scenarios, from 2014 to 2024 2014 2015 2016 2017 2018 2019 2020 2021 2022 2023 2024
baseline 3.45 3.46 3.48 3.49 3.51 3.52 3.53 3.55 3.56 3.57 3.58
MD_GDS 3.45 3.46 3.48 3.49 3.51 3.52 3.54 3.55 3.56 3.57 3.58
EU_GDS 3.45 3.48 3.49 3.51 3.52 3.54 3.55 3.56 3.58 3.59 3.6
MD_SERV 3.45 3.47 3.49 3.5 3.52 3.53 3.54 3.56 3.57 3.58 3.59
EU_SERV 3.45 3.47 3.48 3.5 3.51 3.53 3.54 3.56 3.57 3.58 3.59
SPS 3.45 3.46 3.48 3.49 3.51 3.52 3.53 3.55 3.56 3.57 3.58
EXPFACIL 3.45 3.47 3.49 3.51 3.53 3.55 3.57 3.59 3.61 3.62 3.64
IMPFACIL 3.45 3.47 3.49 3.51 3.53 3.55 3.56 3.58 3.6 3.62 3.63
MDA_TRK 3.45 3.46 3.48 3.49 3.51 3.52 3.54 3.55 3.56 3.57 3.58
TRK_MDA 3.45 3.46 3.48 3.49 3.51 3.52 3.54 3.55 3.56 3.58 3.59
EMB 3.45 3.46 3.48 3.49 3.51 3.52 3.53 3.55 3.56 3.57 3.58
ALL 3.45 3.5 3.53 3.55 3.58 3.61 3.63 3.65 3.67 3.69 3.71
FDI 3.45 3.46 3.46 3.47 3.48 3.49 3.5 3.51 3.52 3.53 3.54
ALL_FDI 3.45 3.49 3.51 3.53 3.55 3.57 3.59 3.61 3.63 3.64 3.66
CU 3.45 3.45 3.46 3.47 3.48 3.49 3.5 3.51 3.52 3.53 3.47
MFN 3.45 3.41 3.42 3.43 3.43 3.44 3.45 3.46 3.46 3.47 3.48
Source: simulation results.
Annex 23. Evolution of Income Inequality in Rural Areas Under All Scenarios, from 2014 to 2024 2014 2015 2016 2017 2018 2019 2020 2021 2022 2023 2024
baseline 3.41 3.41 3.41 3.41 3.41 3.41 3.41 3.4 3.4 3.4 3.4
MD_GDS 3.41 3.41 3.41 3.41 3.41 3.41 3.41 3.41 3.4 3.4 3.4
EU_GDS 3.41 3.39 3.39 3.38 3.38 3.38 3.37 3.37 3.36 3.35 3.35
MD_SERV 3.41 3.41 3.41 3.41 3.41 3.41 3.4 3.4 3.4 3.39 3.39
EU_SERV 3.41 3.41 3.41 3.41 3.41 3.41 3.41 3.4 3.4 3.4 3.39
SPS 3.41 3.41 3.41 3.41 3.41 3.41 3.41 3.4 3.4 3.4 3.39
EXPFACIL 3.41 3.41 3.41 3.41 3.41 3.4 3.4 3.39 3.38 3.38 3.37
IMPFACIL 3.41 3.41 3.41 3.41 3.41 3.4 3.4 3.4 3.39 3.38 3.37
MDA_TRK 3.41 3.41 3.41 3.41 3.41 3.41 3.41 3.4 3.4 3.4 3.39
TRK_MDA 3.41 3.4 3.4 3.4 3.4 3.4 3.4 3.4 3.4 3.39 3.39
EMB 3.41 3.43 3.42 3.42 3.41 3.41 3.41 3.4 3.4 3.4 3.4
ALL 3.41 3.4 3.38 3.37 3.35 3.33 3.32 3.3 3.29 3.27 3.26
FDI 3.41 3.41 3.4 3.4 3.39 3.39 3.39 3.38 3.37 3.37 3.36
ALL_FDI 3.41 3.39 3.38 3.36 3.34 3.32 3.3 3.29 3.27 3.25 3.24
CU 3.41 3.43 3.43 3.43 3.43 3.43 3.43 3.43 3.42 3.42 3.41
MFN 3.41 3.45 3.45 3.45 3.44 3.44 3.44 3.44 3.44 3.44 3.44
Source: simulation results.
77 | P a g e
8. List of References
Ahmed Zidi and Saïd Miloud Dhifallah. 2013. “Trade Creation and Trade Diversion between
Tunisia and EU: Analysis by Gravity Model.” International Journal of Economics and Finance 5
(5) 2013.
Breisinger Clemens, Diao Xinshen, Schweickert Rainer, Wiebelt Manfred. 2009. “Managing future
oil revenues in Ghana. An assessment of alternative allocation options.” Kiel Institute for the World
Economy, Working Papers, 1518, Kiel, Germany.
ECORYS and CASE. 2012. “Trade Sustainability Impact Assessment in support of negotiations of a
DCFTA between the EU and Georgia and the Republic of Moldova”, Final Version, Client:
European Commission – DG Trade, Rotterdam.
http://tsia.ecorys.com/images/Moldova/ac24377%20fr%20georgia%20moldova27102012.pdf.
International Finance Corporation. 2011. “Implementing Food Safety Management Systems in
Ukrainian Food Processing Enterprises. A Cost-Benefit Analysis.” Washington, D.C: IFC.
Jensen Jesper and Tarr David. “Deep Trade Policy Options for Armenia: the Importance of Trade
Liberalization, Services and Standards Liberalization.” 2012. Economics The Open-Access, Open-
Assessment E-Journal 6, (1) http://dx.doi.org/10.5018/economics-ejournal.ja.2012-1.
Kaminski Bartlomiej. 2000. “How Accession to the European Union Has Affected External Trade
and Foreign Direct Investment in Central European Economies.” Revised version of a background
paper prepared for the “Prague 2000 Accession” session at the IMF/World Bank annual meeting,
Prague, September, http://elibrary.worldbank.org/doi/pdf/10.1596/1813-9450-2578.
Lahcen ACHY and Juliette Milgram. 2005. “Does a free trade area favors an optimum currency
area? The Case of Morocco and the European Union.”
http://128.118.178.162/eps/it/papers/0512/0512012.pdf.
Lofgren, Hans et al. 2002. “A Standard Computable General Equilibrium (CGE) Model in GAMS.”
Washington, D.C: International Food Policy Research Institute.
http://www.ifpri.org/pubs/microcom/5/mc5.pdf.
National Bureau of Statistics of Moldova, 2012. “Results of the enterprises structural survey.”
Chisinau: National Bureau of Statistics.
Prohnițchi Valeriu. 2012. “Strategic comparison of Moldova’s Integration options: Deep and
Comprehensive Economic Integration with the EU versus the Accession to the Russia-Belarus-
Kazakhstan Customs Union.” Independent Think-Tank Expert-Grup. http://www.expert-
grup.org/en/biblioteca/item/306-compararea-strategic%C4%83-a-op%C8%9Biunilor-
integra%C8%9Bioniste-ale-republicii-moldova-integrarea-economic%C4%83-aprofundat%C4%83-
%C8%99i-cuprinz%C4%83toare-cu-ue-versus-aderarea-la-uniunea-vamal%C4%83-rusia-belarus-
kazahstan&category=65.
Prohnitchi Valeriu, Popa Ana, Oprunenco Alex, Luecke Matthias, Tekce Mahmut, Hristev Eugen,
Mincu Georgeta and Vasilescu Victoria. 2009. “A Free Trade Area between the Republic of
Moldova and the European Union: Feasibility, Perspectives and Potential Impact.” Expert-Grup,
Chisinau, Moldova. http://expert-
grup.org/en/biblioteca/item/download/812_52db0254536832d1c28809572d8103cf.
78 | P a g e
Radeke Jorg. 2014. “Moldova’s fruits exports: can the EU substitute the Russian market?” German
Economic Team Moldova, Policy Briefings Series [PB / 05/ 2014]. Berlin/Chisinau. http://get-
moldau.de/download/policybriefings/2014/PB_05_2014_en.pdf.
Robinson Sherman, Wang Zhi, and Martin Will. 2002. “Capturing the Implications of Services
Trade Liberalization,” quoted as forthcoming in Economic System Research 14(1). Downloaded on
GTAP website at https://www.gtap.agecon.purdue.edu/resources/download/664.pdf.
Sébastien Jean , Nanno Mulder and Maria Priscila Ramos. 2012. “A general equilibrium, ex-post
evaluation of the EU-Chile Free Trade Agreement.”
http://www.cepal.org/comercio/tpl/contenidos/CGE_evaluation_EU_Chile_FTA_JEAN_MULDER
_RAMOS.pdf.
Thurlow, James. 2004. “A Dynamic Computable General Equilibrium Model for South Africa:
Extending the Static IFPRI Model.” Trade and Industrial Policy Strategies (TIPS) Working Paper 1.
World Trade Organization. 2014. “World Tariff Profiles 2014. Applied MFN tariffs.”
https://www.wto.org/english/res_e/booksp_e/tariff_profiles14_e.pdf