moldovan economic trends - ince.md
TRANSCRIPT

MOLDOVAN ECONOMIC TRENDS
Ministry of Economy of Moldova
Academy of Science of Moldova
National Institute for Economic Research
No. 26 (Q II) 2017
ISSN 1857-3126
Chisinau

ISSN 1857-3126
MET TEAM: Alexandru Stratan, Alexandru Ceban, Zaharia Olarescu, Olga Timofei, Victoria Cociug, Tatiana Iatisin, Alexandra Novac, Tatiana Colesnicova, Zinaida Toaca The MET team would like to acknowledge the cooperation with public institutions of the Republic of Moldova: the Ministry of Economy, the Ministry of Finance, the National Bank of Moldova and the National Bureau of Statistics. All rights reserved. No information in this publication can be reprinted or reproduced in any form without written permission of NIER
© National Institute for Economic Research of ASM
For additional information please contact us: National Institute for Economic Research 45 Ion Creanga street, Chisinau, RM, 2064 Tel: (+ 373 22) 50-11-00, Fax: (+ 373 22) 74-37-94 e-mail: [email protected], web site: www.ince.md

3
Nr. 26 (trim. II) 2017
TENDINŢE ÎN ECONOMIA MOLDOVEI
CONTENTS Main political, economic and social events from the Republic of Moldova .......... 11
Edition summary ......................................................................................................................
14
Chapter I. PRODUCTION .........................................................................................................
19
Chapter II. PRICES, EXCHANGE RATES AND MONETARY POLICY ..............................
28
Chapter III. FINANCES ..............................................................................................................
36
Chapter IV. EXTERNAL SECTOR ............................................................................................
50
Chapter V. BUSINESS ENVIRONMENT .................................................................................
59
Chapter VI. SOCIAL SECTOR ................................................................................................... 62
Chapter VII. FORECAST FOR 2017 ....................................................................................... 72
STATISTICAL ANNEXES ...........................................................................................................
77

4
TENDINŢE ÎN ECONOMIA MOLDOVEI
Nr. 26 (trim. II) 2017
GENERAL DATA Official name
REPUBLIC OF MOLDOVA
Capital Chisinau President Igor Dodon, elected on November 13, 2016 President of the Parliament Andrian Candu Prime Minister Pavel Filip Parliament of the Republic of Moldova
101 deputies: Socialist Party of the Republic of Moldova – 24, Liberal Democratic Party of Moldova – 5, Communist Party of the Republic of Moldova – 7, Democratic Party of Moldova – 39, Liberal Party – 11, Unaffiliated deputies – 15.
Independence was obtained on August 27, 1991 Area 33.8 thousand km2 Administrative units 32 districts, 5 municipalities (Chisinau, Balti,
Bender, Comrat, Tiraspol), ATU Gagauzia, Administrative Territorial Units from the left of the Dniester
Resident Population 3550.9 thousand inhabitants (beginning of 2017)
Main religions Orthodox (93.34%), Protestant (1.98%), Old-Rite Christians (0.15%), Catholic (0.14%), etc.
National currency Moldovan leu (average exchange rate, quarter II, 2017 – 1 USD = 18.8 MDL, 1 EUR = 20.6 MDL)

5
Nr. 26 (trim. II) 2017
TENDINŢE ÎN ECONOMIA MOLDOVEI
ABBREVIATIONS
CEFTA - Central European Free Trade Agreement RCA - Revealed Comparative Advantage GATS - General Agreement on Trade in Services HACCP - Hazard Analysis and Critical Control Points IDA - International Development Association DCFTA - Deep and Comprehensive Free Trade Agreement ATP - Autonomous Trade Preferences PCA - Partnership and Cooperation Agreement EBRD - European Bank for Reconstruction and Development ILO - International Labour Office BMA - Bureau for Migration and Asylum NBM - National Bank of Moldova NPB - National Public Budget NBS - National Bureau of Statistics GAP - Good Agricultural Practice TBT - Technical Barriers to Trade NBC - National Bank Certificates EC - European Commission FCPA - Final Consumption of Public Administration FCH - Final Consumption of Households NCFM - National Commission of Financial Market TRC - Total Regulatory Capital EPC - Effective Protection Coefficient SITC - Standard International Trade Classification CIS - Commonwealth of Independent States TRQ - Tarrif Rate Quota IPR - Intellectual Proprety Rights SDR - Special Drawing Rights AVE - Ad-Valorem Equivalent IMF - International Monetary Fund NIER - National Institute for Economic Research HHI - Herfendahl-Hirschman Index

6
TENDINŢE ÎN ECONOMIA MOLDOVEI
Nr. 26 (trim. II) 2017
SMEs - Small and Medium Enterprises CPI - Consumer Price Index PPI - Production Price Index IIPP - Index of Industrial Products Prices FDI - Foreign Direct Investment IPV - Index of Physical Volume UVI - Unit Value Index MAFI - Ministry of Agriculture and Food Industry MAIB - Moldova Agroindbank MDL - Moldovan Leu MF - Ministry of Finance SPM - Sanitary and Phytosanitary Measures MFN - Most Favoured Nation NEER - Nominal Effective Exchange Rate NPC - Nominal Protection Coefficient OBSEC - Organization of the Black Sea Economic Cooperation ODSMEs - Organization for Development of Small and Medium Enterprises IOM - International Organization for Migration WTO - World Trade Organization UN - United Nations GDP - Gross Domestic Product CR - Concentration Ratio REER - Real Effective Exchange Rate GSP - Generalised System of Preferences MET - Moldovan Economic Trends TN - Transnistria VAT - Value Added Tax EU - European Union USD - US Dollar ATU - Autonomous Territorial Unit GVA SS
- Gross Value Added - State Securities

7
Nr. 26 (trim. II) 2017
TENDINŢE ÎN ECONOMIA MOLDOVEI
TABLES Table 1.1. Gross domestic product in 1st half of 2017 ....................................................................... 19
Table 1.2. Industrial sector activity in January-June 2017 .................................................................. 21
Table 1.3. Investment in long-term tangible assets by funding sources during January-June 2017 ....................................................................................................... 24
Table 1.4. Tourists and excursionists participating in tourism through tourism agencies and tour operators ........................................................................................ 25
Table 2.2.1. NBM activity on interbank foreign exchange market during January 2016–August 2017 .......................................................................................... 33
Table 4.1. Dynamics of main aggregates of balance of payments in S I, 2016-2017, mln. USD (preliminary data) ................................................................................................... 50
Table 4.2. Dynamics of trade exchanges in S I, 2016-2017, mln. US Dollars .................................... 54
Table 5.1. Growth indices in the number of registered and deregistered enterprises in S I 2011-2017 compared to the same period of the previous year, %.................................... 59
Table 5.2. Data on net profit (loss) of organizations from the left bank of the Dniester River by types of activity in January-June, 2017 .............................................. 60
Table 6.1. Subsistence minimum in the region from the left bank of the Dniester River in the first half of 2017 .......................................................................... 71
Table 7.1. Development of macroeconomic indicators in 2012-2016 and forecast for 2017 .............................................................................................................. 74

8
TENDINŢE ÎN ECONOMIA MOLDOVEI
Nr. 26 (trim. II) 2017
FIGURES Figure 1.1. GDP dynamics, January-June 2009-2017, % ................................................................... 19
Figure 1.2. Contribution of resource components to GDP formation in 2017 and to its increase compared to 2016, %................................................................................. 20
Figure 1.3. Contribution of components by categories of uses to GDP formation and increase in January-June 2017 compared to the same period of 2016, % .......................... 20
Figure 1.4. Indexes of industrial production during January-June 2009 - 2017, % .............................. 21
Figure 1.5. Dynamics of agricultural production in January-June 2009-2017, % ................................ 22
Figure 1.6. Transported commodities in January-June 2009-2017, thousand tonnes ........................... 23
Figure 1.7. Dynamics in volume of investment in fixed assets in January-June 2009-2017, % ............................................................................................... 24
Figure 1.8. Indexes of industrial production in January-June 2009-2017, % ....................................... 26 Figure 1.9. Dynamics of investment in fixed assets in January-June 2009-2017, % ............................ 26
Figure 2.1.1. Annual growth rate of CPI and its components, % ........................................................ 28
Figure 2.1.2. Annual growth rate of CPI and core inflation, % ........................................................... 29
Figure 2.1.3. Annual growth rate of industrial production prices and its components, % .................... 30
Figure 2.1.4. Development of average monthly nominal exchange rate of MDL in relation to USD and EURO ................................................................................................ 31
Figure 2.1.5. Annual growth rate of CPI in region from the left side of the Dniester River, %......................................................................................................... 31
Figure 2.2.1. Development of interest rates on monetary policy instruments of the National Bank of Moldova during 2015-2017 .............................................................. 32
Figure 2.2.2. Ratio of Required Reserves at the NBM, % .................................................................. 33
Figure 2.2.3. Structure of money supply M3...................................................................................... 35
Figure 3.1.1. Structure of revenues in NPB in S I, 2017, mln. MDL .................................................. 36
Figure 3.1.2. Structure of revenues by source in NPB in S I, 2016-2017, mln. MDL .......................... 37 Figure 3.1.3. Structure of expenditures in NPB in S I, 2017, %.......................................................... 38
Figure 3.1.4. NPB deficit, mln. MDL ................................................................................................ 39
Figure 3.1.5. Structure of public sector debt during 2016-2017, thousand MDL................................. 39
Figure 3.1.6. Relation of debt types compared to GDP ...................................................................... 40
Figure 3.2.1. Development of quality of bank assets .......................................................................... 42
Figure 3.2.2. Development of quality of bank capital ........................................................................ 43 Figure 3.2.3. Level of liquidity in the banking sector on June 30, 2017 .............................................. 43
Figure 3.2.4. Development of loans by currency and categories of debtors, thousand MDL ............... 44
Figure 3.2.5. Development of non-performing loans in banking sector .............................................. 45
9
Nr. 26 (trim. II) 2017
TENDINŢE ÎN ECONOMIA MOLDOVEI
Figure 3.2.6. Development of net banking margin, average interest rates on new deposits and loans in MDL, % ................................................................................... 46
Figure 3.2.7. Development in the balance of deposits in S I, 2017, mln. MDL ................................... 47
Figure 3.2.8. Development of banking return and profitability in 2016-2017 ..................................... 47
Figure 3.2.9. Annual growth rates of bank assets, deposits and loans in the region to the left bank of the Dniester River, % ............................................................ 48
Figure 4.1. FDI stock by quarters in 2014-2017, mln. USD ............................................................... 51 Figure 4.2. Distribution of FDI, equity capital accumulated on June 30, 2017, by activities ............... 51
Figure 4.3. Remittances from abroad made in favour of individuals through Moldovan banks by quarters during 2011-2017, mln. USD ....................................... 52
Figure 4.4. Structure by main countries of remittances from abroad made in favour of individuals in Q II, 2017, % ............................................................................................... 53
Figure 4.5. Trends of external trade in goods, January-June 2010-2017, mln lei ................................ 54
Figure 4.6. Structure of exports by groups of countries in S I, 2010-2017, % ..................................... 55 Figure 4.7. Structure of imports by groups of countries in S I, 2010-2017, %..................................... 56
Figure 4.8. Dynamics of external trade in the region of the Republic of Moldova to the left of the Dniester River in S I, 2016 - 2017, mln. USD .............................................. 57
Figure 4.9. Dynamics of external trade in the region of the Republic of Moldova to the left of the Dniester River by main groups of countries during the period January-July, 2016 – 2017, mln.USD .................................................................... 58
Figure 5.1. Dynamics in the number of registered and deregistered enterprises in semester I 2010-2017, unit. ................................................................................................ 59
Figure 5.2. Dynamics in the net number of enterprises registered in the State Register in S I 2011-2016 .................................................................................................................... 60
Figure 6.1. Natural movement of population in quarter II in 2010-2017 ............................................. 62
Figure 6.2. Dynamics of activity, employment and unemployment rates of population aged 15 and over in quarter II in 2010-2017 ..................................................... 63
Figure 6.3. Dynamics of disposable revenues of population, nominal value and growth rates by quarters, Q I 2013 – Q II 2017 ................................................................ 66
Figure 6.4. Dynamics of consumer expenditures, nominal value and growth rates by quarters, Q I 2013 – Q II 2017 .................................................................................. 67
Figure 7.1. GDP dynamics of the Republic of Moldova during 1990-2016 and forecast for 2017 ............................................................................................................. 75

10
TENDINŢE ÎN ECONOMIA MOLDOVEI
Nr. 26 (trim. II) 2017
BOXES Box 6.1. Rise in salaries of teaching and teaching-scientific staff
in state educational institutions ...................................................................................................................... 65 Box 6.2. Increase of tariffs on heat energy for final consumers from Chisinau and Balti .................. 67 Box 6.3. Dynamics of average amount of pension for retirement age ....................................................... 68 Box 6.4. Increase of retirement age and contribution ....................................................................................... 69

11
Nr. 26 (trim. II) 2017
TENDINŢE ÎN ECONOMIA MOLDOVEI
MAIN POLITICAL, ECONOMIC AND SOCIAL EVENTS FROM THE REPUBLIC OF MOLDOVA
The first half of 2017 was marked by several important events of political, economic and social nature.
April 12
The European Commission has approved the start of negociation on macro-financial assistance for the Republic of Moldova in the amount of 100 mln. EUR, of which 60 mln. EUR will be provided as a loan and 40 mln. EUR – as a grant. The aim of the financial assistance is to stabilize the Moldovan economy, to improve the economic governance of the country and to achieve several crucial reforms. May 2
The International Monetary Fund has adopted the decision to allocate for the Republic of Moldova a new tranche of the loan provided as a financial support in order to redress the financial system and promote structural reforms to the tune of 15.7 mln. SDR, equivalent of about 21.5 mln. USD. May 4
The Parliament of the Republic of Moldova has ratified the Paris Climate Change Agreement which provides a reduction of at least 67% or even 78% of total net national greenhouse gas emissions by 2030. May 5
The Prime-Minister of the Republic of Moldova, Pavel Filip has had a meeting with the prince of Monaco, Albert II. During the meeting the possibilities for deeping the cooperetation between the two countries have been discussed. In the meeting, the framework agreement of cooperation between the two countries highlighting the environmental protection and exploration of renewable energies, exchange of experience in adopting and implementing the 2030 Agenda for Sustainable Development Goals, agriculture and agri-food industry, tourism and hotel services, culture, education and sport among the main areas of cooperation has been signed. May 5 – 6
The Prime-Minister of Turkey, Binali Yıldırım paid an official visit to the Republic of Moldova having a meeting with the Prime-Minister of Moldova, Pavel Filip. During this meeting, both parts have appreciated the dynamics of actual bilateral relations noting that the discussions in the meeting have contributed to the creation of optimal conditions in order to intensify the cooperation of the economic agents between the two countries. Also, there was agreed to create a trade and economic office to the Embassy of the Republic of Moldova in Turkey to make the implementation of stipulations included in the Free Trade Agreement between the two countries more efficient. May 6
The Moldovan-Turkish business forum, held in Chisinau brought over 50 companies from Turkey in the field of light industry, logistics, pharmaceutical industry, agriculture, constructions, trade etc. The aim of the event was to intensify the Moldovan-Turkish trade and economic relations, to

12
TENDINŢE ÎN ECONOMIA MOLDOVEI
Nr. 26 (trim. II) 2017
identify new business opportunities, to establish direct contacts of cooperation with the direct economic agents of the two countries, to develop investment, etc. May 9 – 11
The Deputy Prime-Minister, Minister of Economy, Octavian Calmac attended the XXVI Annual Meeting of the Governing Council of the European Bank for Reconstruction and Development. During the meeting MR. Deputy Prime-Minister has mentioned about the priorities of the Government of the Republic of Moldova in the process of reforming and modernizing all social-economic fields in the country as well as the priorities of cooperation with the EBRD. May 12 – 22
The President of the Academy of Science, the acad. Gheorghe Duca payed a working visit to the Sichuan University of People’s Republic of China. During the visit, the president of ASM has discussed with the rector of Sichuan University, prof. Xe Herping, about aspects and opportunities of Moldovan-Chinise bilateral cooperation in the field of science, research and innovation. The parts agreed to conclude an Academic Exchange Agreement between the University of Academy of Science of Moldova and Sichuan University of People’s Republic of China which will be negotiated and signed in the near future. The Agreement also includes the exchange of students, researchers and lecturers in order to promote science, research, and education in both countries. May 17
The Prime-Minister of Moldova, Pavel Filip and UN Resident Coordinator and permanent representative of UNDP in the Republic of Moldova, Dafina Gercheva have signed a new UN Assistance Framework Program for Sustainabvle Development in the Republic of Moldova for 2018-2022 in the amount of 155.5 mln. USD. The new assistance program should contribute to the development priorities of the Republic of Moldova in the following areas: government, human rights and gender equality; sustainable, inclusive and equitable economic growth; sustainability and resilience of environment; inclusive and equitable social development. May 24
The Cabinet Ministers of the Government of the Republic of Moldova has approved the Draft law for ratification of Grant Agreement with Japan on implementation of the Project “Conservation agriculture – development of a sustainable soil management system in the Republic of Moldova”. The Agreement provides the allocation of a non-reimbursable funding in the amount of 4.8 mln. USD to develop the conservation agriculture in the Republic of Moldova, especially to purchase agricultural equipments and appliances. May 29
The Parliament of the Republic of Moldova has approved the mechanism for introduction of a single tax for IT-Park residents at first reading. Thus, the draft law implies the introduction of several amendments and completions in Tax Code to provide for the opportunity of applying the single tax rate in the ratio of 7% of sales revenues for IT-Park residents which will increase the attractiveness of IT sector for internal and external investors as well as acceleration of development and full potential of this industry. June 6
The European Commission will grant Moldova 150 thousand EUR for the fight against African swine fever. The funding agreement has been signed between ANSA and European Commission

13
Nr. 26 (trim. II) 2017
TENDINŢE ÎN ECONOMIA MOLDOVEI
under achievement of efficient and operative actions made to bring under control the outbreaks of African swine fever. June 12
The Government of the Republic of Moldova has approved several legislative amendments on regulation through authorization of entrepreneurial activity. Thus, according to the document, the number of permissive documents has been reduced by about 150. This has a direct impact on business environment and reduces the actual burden on the entrepreneurial community. June 9
The Board of Executive Directors of World Bank has approved a fund in the amount of 27.2 mln. USD granted to the Republic of Moldova for the Climate Change Adaptation Project which will provide assistance to protect agricultural households, forests and grazings against climate changes in specific areas as well as to fund the national systems for managing the natural disasters. June 29
The Executive Board of the National Bank of Moldova has adopted the decrease of the base rate applied on the main monetary policy operations in the short-term by 1 percentage point, from 9 to 8 percent annually. It was also decided to decrease the interest rate on overnight loans by 1 percentage point from 12 to 11 percent annually and interest rate on overnight deposits from 6 to 5 percent annually. At the same time, it was decided to maintain the required reserves ratio from means attracted in Moldovan lei and non-convertible currency at the actual level of 40 percent of the computation base and requred reserves ratio from means attracted in freely convertible currency at the actual level of 14 percent of the computation base.

14
TENDINŢE ÎN ECONOMIA MOLDOVEI
Nr. 26 (trim. II) 2017
EDITION SUMMARY Production
The first semester of 2017, to a great extent, was ituated on an upward trend showing slight increases in most sectors of the national economy. In semester I of 2017, the gross domestic product totaled 63921 mln. MDL (at current prices) increasing by 2.8% compared to the same period of the previous year. The most significant contributions to the GDP increase have had: wholesale and retail trade; maintenance and repair of vehicles and motorcycles; transport; storage and accommodation and food service activities – 1.5%, constructions – 0.2% and information and communications – 0.2%. The volume of industrial production in semester I, 2017 is up by 0.3% (gross series) compared to the similar period of the last year. The positive influence was due to the increase in the production of mining industry by 1.6% and manufacturing industry which grew by 0.4%. The agricultural production in all types of households has decreased by 5% compared to the same period of the previous year. This is greatly due to the significant reduction of vegetable production by 28.4%. However, the livestock production showed an insignificant decrease of 0.4% compared to the same period of the last year. In the first semester of 2017, transport services increased their activity. Thus, the volume of transported commodities by railway, road, fluvial and air transport enterprises reached 6576.6 thousand tonnes or by 22.5% more in comparison with semester I of 2016. This growth was influenced by railway transport which totaled an increase of 32.7%, road transport 19.1% and air one holding a low weight increased its activity by 2 times. Investment in fixed assets in semester I, 2017 reached 6175.6 mln. MDL (at current prices), thus registering an increase of 2.5% compared to the same period of the last year. The highest influence had the investment in tangible assets totaling 6062.3 mln. MDL which increased by 2.3%. Prices and exchange rates
In the first semester of 2017, the consumer price index has increased by 5.7%, declining by 3.8p.p. against the same period of the previous year. During the same period, there were recorded the following rises for CPI components: food products – 6.5%, non-food products – 4.8%, services – 5.6%. In quarter II, 2017 the growth rate of CPI was 7.1%, decreasing by 0.8 p.p compared to the same period of the previous year. There were recorded the following increases for CPI components in April-June, 2017: food products – 8.4%, non-food products – 4.9%, services – 8.2%. Core inflation since the beginning of 2017 registers a deceleration compared to CPI dynamics. During April - June, 2017 the core inflation index amounted to 4.8% sply decreasing by 4.8 p.p compared to the same period of 2016. The decrease of core inflation was especially due to the slight appreciation of the national currency against USD and single European currency mitigating partially the rise of regulated prices and amendments in fiscal policy of the country. In quarter II, 2017 other price indexes have also recorded uneven increases which compared to the same period of the last year had the following developments:

15
Nr. 26 (trim. II) 2017
TENDINŢE ÎN ECONOMIA MOLDOVEI
ü idustrial production price index dropped by 1.6 p.p compared to the same period of the previous year reaching 3.6%;
ü growth price index in constructions has decreased compared to the level recorded in the similar period of the previous year by 3p.p., accounting for 4.6%
ü producer prices for agricultural products have declined by 1.1% against the same period of 2016;
ü growth rate of fuel prices recorded 9.7% sply which increased by 13.1 p.p sply. In the second quarter of 2017, the average nominal exchange rate against the major reference currencies amounted to 20.6 MDL/EUR and 18.8 MDL/USD, appreciating compared to the similar period of the previous year by 7.9% in relation to single European currency and by 5.3% against US dollar. In real terms, Moldovan leu has appreciated during this period by 10.3% against USD (compared to the same period, last year) and by 10.3% against Euro sply. Monetary policy
In quarter II, 2017 the base rate maintained at the level established since November 2016 amounting to 9%, declining by about 6 p.p. against its level during the similar period of the previous year. The interest rate on overnight loans is still maintained at the level of 12% and interest rate on overnight deposits is 6%. At the beginning of quarter III of 2017, the NBM made further reductions in monetary policy rates. Reserve requirements ratio. In quarter II of this year the NBM has gradually increased the reserve requirements ratio from means attracted in Moldovan lei and non-convertible currency by 5.0 percentage points up to 40% of computation base under the influence of intensifying the inflationary pressures. This reflects on the economy by maintaining a low level of lending in the real sector. Stock of official reserve assets at the end of the first semester of 2017 has increased by 183 mln. USD since the beginning of this year and continues to grow. The stock of official reserve assets at the end of quarter II, 2017 amounted to 2.38 bln. USD, increasing by 27.4% sply. Money supply loosely (M3) declines slightly in growth rates. The components of monetary aggregate M1, especially demand deposits in national currency have had the main contribution to the increase of money supply. The growth rate of money supply, during this period has increased compared to its values recorded in the same period of the previous year, as a result of the increase in the volume of deposits in national currency. Public finances
National public budget revenues were up by 18.5% in the first semester of 2016. To the increase of the public budget revenues have vastly contributed tax revenues especially taxes and duties on goods and services which had a weight of 63.09 of total budget revenues which is specific to a consumer economy. In semester I, 2017, the Republic of Moldova received grants in the amount of 84.4 mln. MDL, which is only 37.8% of the amount received in the last year. The most important grants were from international organizations while the governments of other countries transfered only 13.5% of the grants received in the first semester of 2016. The external granters reduced the volume of funding by grants given that there is no predominantly political stability in the country and the Government’s agenda on reforms coordinated with the EU is not fulfilled. National public budget expenditures in semester I of 2017 amounted to 25 010.7 mln. lei, by 15.2% (3 302.2 mln. lei) more compared to the same period of the previous year. The highest weight in total expenditures hold those made for funding the social sector -70.7%, including social
16
TENDINŢE ÎN ECONOMIA MOLDOVEI
Nr. 26 (trim. II) 2017
protection -38.4, health care -13.3%, education -18.7% and the lowest ones, under 1% are funds of environmental protection activities. National public budget execution in semester I of 2017 has resulted in a deficit equating to 101.5 mln. MDL. The public sector debt decreased by 1 097.7 mln. MDL or by 1.8% compared to the end of 2016 and amounted to 58 248.1 mln. MDL. This decrease is due to the reduction of the external public debt resulted from the appreciation of the national currency. According to the data on GDP foreseen for 2017, the weight of public sector debt in GDP on June 30, 2017 accounted for 39.3%, recording a decrease of 4.7 p.p compared to the end of 2016 and an increase of 6.0 p.p in relation to the same period of 2016. Banking sector
The major problem of the banking sector activity during the first semester of 2017 is the decrease in the value of gross loan portfolio granted by the commercial banks which registered a depreciation of 1.57 percent or 544.7 mln. lei. The decline in the pace of lending was not associated with the decrease of the level of portfolio risk. Thus, in semester I of 2017, the value of non-performing loans amounted to 6 034.22 mln. MDL up by 36 mln MDL or 0.6% compared to June 30, 2016 and by 364.4 mln. MDL or 6.07% against January 1, 2017. At the same time, there is observed the migration of loans from legal entities to individuals and from foreign in national currency due to the appreciation of Moldovan leu. Rise in asset value, was unfortunately due especially to the increase in liquidities. Thus, the weight of liquid assets in total assets (liquidity principle II) registers 51.30%, more by 6.81 p.p. compared to June 30, 2016 and by 2.1 compared to January 1, 2017 and by about 2.5 times more than the minimum requirement set by the NBM. The continuous growth of liquidities in the banking system is the result of tightening the monetary policy promoted by the NBM which aims to sterilize the excess of money supply in order to maintain the inflation target however it affects the ability of banks to lend. As long as the NBM will continue to manage the surplus liquidity in order to support a proper functioning of interbank money market through open-market operations the banks will be discouraged from placing in loans which at a similar return could produce a higher risk than state securities and the increase of required reserve ratio will only act to the increase of the liquidity requirements maintained on the banks’ accounts at the NBM. In this case it is important to express a decision which could clearly establish the monetary policy option of the NBM – maintaining the inflation target or increasing the banking system’s ability to lend and implicitly, the economic growth of the country. Problems of the banking system, previously identified are reflected by the financial result made by banks in semester I, 2017. In June 2017 the banks’ profit in the entire banking system amounted to 956.73 mln. MDL, increasing by 102.3 mln. MDL or 11.98% compared to the same period of the last year. The increase in profit is due to the decrease in interest expenditures (deposits) by 39.9 percent, decline of depreciation on financial assets by 76.6 percent and growth of non-interest revenues by 5.4 percent (mostly from duties and commissions by 11.8 percent). Thus, the growth of bank’s profit is not determined by the increase of returns from loans, the share of net interest revenue in total bank’s revenue remaining – at the level of 40.4%, attesting a very low involvement of banks in funds redistribution activity and implicitly in the economic growth by providing the real economy with the necessary resources. The priorities of the Moldovan banking sector remain to ensure the transparency in structure of shareholders’ structure and to improve enforcement of the prudential supervision norm by domestic banks. The largest commercial banks of the Republic of Moldova remain under intensive supervision by 3 more months and on July 1, 2017 when the deadline for sale of equity stake of 41.09% of B.C. „Moldova-Agroindbank" S.A., the NCFM has extended it for another 6 months because there was not found yet any buyer.

17
Nr. 26 (trim. II) 2017
TENDINŢE ÎN ECONOMIA MOLDOVEI
External sector
Balance of payments. In semester I, 2017, the current account of the balance of payments of the Republic of Moldova was increasing by 77.8% compared to the same period of the previous year. In semester I, 2017 the current account has registered a deficit of 307.22 mln. USD. The total stock of foreign direct investment of the Republic of Moldova was on the rise amounting to 3958.60 mln. US dollars in semester I, 2017. The volume of remittances from abroad made through licensed banks in favour of individuals in semester I was increasing. Compared to semester I of 2016 the volume of remittances were up by 9.6%, after two years of decline. External trade in goods in semester I, 2017 has registered an increase of 14.5%, compared to the similar period of the last year. The exports of goods, during January-June 2017 amounted to 1028.2 mln. US dollars, up by 13.6% in comparison with the same period of 2016. The imports of goods, in semester I of 2017 as against the similar period of the previous year increased by 15%. In the first semester of 2017, the considerable gap in the development of exports and imports led to the formation of a deficit of the balance of trade in the amount of 1153.2 mln. USD by 190.3 mln. USD (+19.8%) higher compared to the same period of 2016. Business environment
In S I, 2017, the number of enterprises registered by the State Registration Chamber increased by 8.2% sply. According to the data of the State Registration Chamber, 3192 new enterprises were recorded in the State Register in the first semester of 2017. At the same time, the growth trend in the number of deregistered enterprises continues. Thus, in S I, 2017 the number of deregistered enterprises has marked the highest increase compared to the similar period of 2011-2016. The number of deregistered enterprises in the State Register in S I, 2017 has increased by 85.9% sply amounting to 4166 enterprises. Social sector
Demographic situation. In quarter II of 2017, according to the data of the NBS, the total number of live births in the country amounted to 16868 pers., down by 7.6% compared to the same period of the previous year, the birth rate amounted to 9.5 live births per 1000 inhabitants. The number of deaths accounted for 19775 pers., declining by 1.9% sply and mortality rate reached 11.2 deaths per 1000 inhabitants. The number of deaths of children aged under 1 year in the second quarter of 2017 equated to 174 cases and reduced by 5 cases compared to the similar period of the last year. The natural decrease in Q II, 2017 numbered - 2907 persons or - 1.6 persons per 1000 inhabitants. The natural decrease in quarter II, 2017 became the most pronounced in the last 7 years. The total number of marriages in the country, in Q II, 2017amounted to 8060, declining by 6.9% against the same period of the last year and marriage rate equated to 4.6 marriages per 1000 inhabitants. In the case of divorces in the country, the indicator was 4980, decreasing by 10.7% compared to the same period of the last year. The divorce rate equaled 2.8 divorces per 1000 inhabitants. Labor market. In quarter II of 2017, the economically active population amounted to 1316.0 thousand pers., reducing by 3.4% or by 46.9 thousand persons as compared with the same quarter of the previous year. At the same time, the activity rate of population accounted for 44.1% declining by 1.6 p.p. sply. Employed population was 1270.3 thousand persons in Q II of 2017 decreasing by 2.9% sply. Employment rate of population aged 15 and over reached 42.6%, declining slightly compared to the level in the same period of the last year (43.8%). Number of unemployed, according to the International Labour Office amounted to 45.7 thousand persons, by

18
TENDINŢE ÎN ECONOMIA MOLDOVEI
Nr. 26 (trim. II) 2017
16.9% lower sply (55.0 thousand). Unemplyment rate in the country in Q II, 2017 was 3.5%, diminishing by only 0.5 p.p. sply (4.0%). Inactive population in the country (aged 15 and over) in Q II of 2017 amounted to 1667.9 thousand persons being 55.9% of total population of this age reducing by 1.5 p.p. sply. NEET group held a weight of 28.2% of population in the age group of 15-29 years. People who do not want to work amount to 79.7% of inactive population (aged 15 and over). Labor remuneration. Quarter II of 2017 is characterized by an increase of 13.2% of the average monthly nominal salary (5636.7 MDL) compared to the same quarter of the last year and the average monthly real one – by 5.7%. In the budgetary sector, the average monthly salary (4924.2 MDL) has increased by 13.2% sply, in a greater measure than the average monthly salary in the real sector (5924.7 MDL), which increased by 13.0% sply. The highest-paying economic activities are: Information and communications (12553.8 MDL), Financial and Insurance activities (10503.2 MDL) and Production and supply of electricity, heat energy, gas, hot water and conditioned air (9981.9 MDL). Disposable revenues of population per month in quarter II, 2017 amounted to 2227.6 MDL on average per person, up by 9.8% sply. In real terms, the revenues of population increased by 2.5%. The most important sources of revenues remain to be: salaries (43.2%), social benefits (22.0%) and remittances from abroad (17.7%). Average monthly consumption expenditures of population in Q II, 2017 amounted to 2245.3 MDL per person, increasing by 8.0% against Q II of 2016. In real terms adjusted to the consumer price index, the expenditures of population rose by 0.8% sply. The highest part of expenditures continues to be directed towards: food consumtion (44.3%), housing maintenance (18.4%) and clothing and footwear (10.4%). Social protection of population. According to the data of the National Social Insurance House, the number of pensioners registered with the social protection bodies on July 1, 2017 amounted to 712.5 thousand persons or by 28.8 thousand persons more compared to July 1, 2016. The average amount of the monthly pension set on July 1, 2017 amounted to 1484.72 MDL, up by 16.1% compared to July 1, 2016. Subsistence minimum. In semester I of 2017 the subsistence minimum was on average 1866.3 MDL per person monthly, rising by 2.9% sply. In case of cities it accounted for 2015.6 MDL, by 2.2% more sply. The subsistence minimum was 1836.7 MDL in towns by 4.5% more sply. In villages it amounted to 1809.9 MDL, by 2.4% more sply. The co-ratio between the average monthly salary on economy and subsistence minimum for working age population in semester I of 2017 was by 2.7 times compared to 2.5 times sply.

19
Nr. 26 (trim. II) 2017
TENDINŢE ÎN ECONOMIA MOLDOVEI
Chapter I PRODUCTION1
Gross domestic product
In the first semester of 2017, the gross domestic product has registered a nominal value of 63921 mln. MDL, at current market prices, having a net higher value by 2.8% in real terms against the same period of the previous year.
Table 1.1. Gross domestic product in 1st half of 2017
Quarter I Quarter II Semester I Million lei at current prices 29 670 34 251 63 921 in % compared to: similar period of last year 103.1 102.5 102.8 previous quarter 99.4 100.7 - Source: According to the data of the National Bureau of Statistics.
These increases were mainly contingent on the wholesale and retail trade; maintenance and repair of vehicles and motorcycles; transport and storage; accommodation and food service activities which have contributed to the GDP increase by 1.5%, to the GVA increase by 7.2%, holding a weight of 21% in its structure. At the same time, constructions and information and communications had a 0.2% contribution to the GDP increase contributing by 3.8% and 6.4%, respectively to its formation, the GVA values have also increased by 4.5% and 2.8%, respectively.
Figure 1.1. GDP dynamics, January-June 2009-2017, %
Source: According to the data of the National Bureau of Statistics. During the same period, the volume of taxes on products has increased against the same period of the previous year (+6.4%), thus contributing to the GDP increase by 1.1%, holding a weight of 17.7%.
1 The analysis is presented without the data on enterprises and organizations from the left bank of the Dniester River and Bender municipality based on the official statistics compiled by the National Bureau of Statistics. In some cases, apropriately specified, available data regarding the Transnistrian region, disseminated by the regional statistical body are presented.
100
106.6
113.5 114.4120
124.7129.2 130.9
134.6
92.2
106.6 107.5
100.8104.9 103.9 103.6
101.3 102.8
9095
100105110115120125130135
2009 2010 2011 2012 2013 2014 2015 2016 2017
1st half of 2009=100 1st half of the previous year= 100

20
TENDINŢE ÎN ECONOMIA MOLDOVEI
Nr. 26 (trim. II) 2017
At the same time, several activities have negatively contributed to the GDP formation. Agriculture, forestry and fishing holding a weight (to GDP formation) of 4.9% have contributed to a decline in GDP by 0.2% and GVA by 0.8%. Public administration and defense; mandatory social insurance; education; health and social security have contributed to a decline in GDP by 0.1% with a weight of 15.3%, thus reducing the GVA by 0.8%.
Figure 1.2. Contribution of resource components to GDP formation in 2017
and to its increase compared to 2016, % Source: According to the data of the National Bureau of Statistics. Growth by categories of uses is especially due to the household final consumption (HFC) with 3.5%, which contributed to the GDP formation by 87.8% and a 4% increase in the volume and a 1.1% in the gross fixed capital formation (GFCF) holding a 22.1% contribution to the GDP formation and a 4.8% increase in the volume. At the same time, the net export of goods and services has negatively influenced on the GDP physical volume index contributing by 4.1% to its reduction. This is due to a more pronounced contribution of imports of goods and services which reached 79.4% against exports of goods and services, with a weight of 45.4%.
Figure 1.3. Contribution of components by categories of uses to GDP formation and
increase in January-June 2017 compared to the same period of 2016, % Source: According to the data of the National Bureau of Statistics.
100
4.9
15.3
3.8
21
6.4 5.9 5.615.3 17.1
4.7
2.8
-0.2 0.10.2
1.5
0.2 0 0.1
-0.1
0.8
0.2
-0,5
00,5
11,5
22,53
0102030405060708090
100Contribution to GDP formation, % Contribution to GDP growth,%
100
87.8
21.6 22.12.5
-.34
2.8
3.5
0.1 1.1
2.3
-4.1-4,5
-2,5
-0,5
1,5
3,5
-60
-40
-20
0
20
40
60
80
100
120
Total GDP HFC AFC GFCF Stock variation Net export
Contribution to GDP formation, %Contribution to GDP growth,%

21
Nr. 26 (trim. II) 2017
TENDINŢE ÎN ECONOMIA MOLDOVEI
Industry
The volume of industrial production in semester I, 2017 is up by 0.3% (gross series) compared to the similar period of the last year. This was mainly due to the production of mining industry and manufacturing industry which grew compared to the same period of the previous year.
Figure 1.4. Indexes of industrial production during January-June 2009 - 2017, %
Source: According to the data of the National Bureau of Statistics. In the first semester of 2017, the highest increase was obtained by mining industry: +1.6% compared to the similar period of the previous year. Manufacturing industry, experienced also increases during this period, but more moderate, reaching values by 0.4% higher compared to the same period of the previous year. In the first semester of 2017, the most significant increments have been obtained by the following groups in manufacturing industry: ”Manufacture of rubber and plastic products” (+23.6%), ”Manufacture of electrical equipments” (+16.8%), ”Manufacture of beverages” (+8.6%), ”Manufacture of pharma-ceutical preparations” (+7.7%) and ”Manufacure of wood and products of wood and cork except furniture” (+7.7%). However, reductions on several categories of manufacturing industry have also took place, the highest ones being registered by ”Manufacture of other means of transportation” (-90.3%), ”Manufacture of tobacco products” (-39.7%), ”Manufacture of textiles” (-17%), ”Manufacture of paper and paper products” (-13.9%) and ”Manufacture of other non-metallic mineral products” (-8.8%). A reduction has also took place in the production and supply of electricity, heat energy, gas, hot water and conditioned air which decreased by 0.5% compared to the same period of the last year.
Table 1.2. Industrial sector activity in January-June 2017
in % Jan.-June 2017 A 1
INDUSTRY – TOTAL 100.3 MINING INDUSTRY 101.6 MANUFACTURING INDUSTRY. of which: 100.4 Food industry 101.8 Manufacture of beverages 108.6 Manufacture of tobacco products 60.3 Manufacture of textiles 83.0 Clothing manufacturing 99.6 Leather tanning and finishing; manufacture of travel goods and leather 96.4 Manufacure of wood and products of wood and cork 107.7 Manufacture of paper and paper products 86.1
75.1
108100.1
105.9 104.4 105.9100 100.3
100105.6
115.1 115.2122
127.4134.9 134.9 135.3
60
70
80
90
100
110
120
130
140
2009 2010 2011 2012 2013 2014 2015 2016 2017
1st half of previous year =100% 1st half of 2009=100

22
TENDINŢE ÎN ECONOMIA MOLDOVEI
Nr. 26 (trim. II) 2017
Table 1.2 – continue A 1
Printing and reproduction of recorded media 106.6 Manufacture of coke products and crude-oil processing products 94.9 Manufacture of chemicals and chemical products 101.7 Manufacture of pharmaceutical preparations 107.7 Manufacture of rubber and plastic products 123.6 Manufacture of other non-metallic mineral products 91.2 Metallurgical industry 98.5 Metal construction and metal products industry 101.4 Manufacture of computer. electronic and optical products 100.4 Manufacture of electrical equipments 116.8 Manufacture of machinery. equipments and appliances n.c.a. 96.1 Manufacture of motor vehicles. trailers and semi-trailers 98.6 Manufacture of other means of transportation 9.7 Manufacture of furniture 102.6 Other industrial activities n.c.a. 94.8 Repair. maintenance and installation of machinery and equipments 95.8 PRODUCTION AND SUPPLY OF ELECTRICITY. HEAT ENERGY. GAS. HOT WATER AND CONDITIONED AIR
99.5
Source: According to the data of the National Bureau of Statistics. Agriculture
In the first semester of 2017, for the first time since 2012 the agricultural production broke the growth pace registering a 5% reduction (in comparable prices) compared to the similar period of the previous year.
Figure 1.5. Dynamics of agricultural production in January-June 2009-2017, %
Source: According to the data of the National Bureau of Statistics. This is vastly due to the reduction of vegetable production by 28.4%, which hung on the delay in harvesting crops as a result of the unfavorable weather conditions in spring of this year. However, livestock production showed an insignificant decrease of 0.4%, compared to the same period of the previous year. The livestock sector in semester I of this year has seen both increases and reductions. Thus, in all types of households there was registered an amount of 348.4 mln. eggs showing an increase of 6.6% compared to semester I of 2016, production (breeding) of cattle and poultry (in live weight) has registered values of 81.1 thousand tonnes, by 0.8% less compared to the similar period of the previous year and milk production amounted to 223.9 thousand tonnes – by 3.9% less sply.
100
111.4115.7 113.3
116.5
125.5129
134.3
127.6
102.6 103.997.9
102.8107.7
102.8 104.1
95
90
100
110
120
130
140
2009 2010 2011 2012 2013 2014 2015 2016 2017
1st half of 2009=100 1st half of previous year=100

23
Nr. 26 (trim. II) 2017
TENDINŢE ÎN ECONOMIA MOLDOVEI
During the same period, the highest part in livestock sector of animal production was produced in households holding a share in milk production of 94.1%, in production (breeding) of cattle and poultry (in live weight) of 55% and eggs production – 53%, respectively. In agricultural enterprises (including peasant (farm) enterprises) holding animals), in semester I of 2017 compared to the same period of 2016 there was recorded a growth in the volume of breeding of cattle and poultry (in live weight) of 1.9%, in the volume of cow milk production of 1.1% and in the volume of poultry eggs of 7.9%. Transport
During January-June, 2017 the volume of transported commodities by railway, road, fluvial and air transport enterprises reached 6576.6 thousand tonnes, by 22.5% more compared to January-June, 2016. This growth is due to the railway transport which increased by 32.7%, road transport – by 19.1% and air one by 2 times in comparison with semester I of 2016, however it still holds a very low share, of 0.006%, in total transported commodities. At the same time, there were recorded reductions, especially for commodities transported by river which decreased by 19.6% compared to the similar period of 2016.
Figure 1.6. Transported commodities in January-June 2009-2017, thousand tonnes
Sorce: According to the data of the National Bureau of Statistics. By means of railway transport, 1967.9 thousand tonnes commodities were transported accounting for 29.92% of total transported commodities by all means of transport during this period. In semester I, 2016, this share reached 27.5%. The highest share in transported commodities holds the road transport, by which 4564.3 thousand tonnes were transported in semester I of 2017 reaching a weight of 69.4% of total transported commodities. During the same period of the previous year this weight was reaching the weight of 71.5%. The mileage co commodities by all means of transportation amounted to 1989.3 mln. tonnes-km, thus reaching higher values by 15.3% compared to semester I, 2016. The railway, road and air transports favoured this result showing increases of 31.1%, 11.6% and 18.7%, respectively. On the other hand, fluvial transport particiated to the reduction of this result by 19.7%. The road transport is the main source of passenger transport which in semester I of 2017 marked a weight of 96.7% of total transports. The number of passengers who chose to go by buses and
19121573
2106
1723
2138 2227 2106
1476
1968
14041570
1874
2156
2812
3249
3882 3787
4564
1000
1500
2000
2500
3000
3500
4000
4500
5000
2009 2010 2011 2012 2013 2014 2015 2016 2017
Railway Auto transport

24
TENDINŢE ÎN ECONOMIA MOLDOVEI
Nr. 26 (trim. II) 2017
microbuses amounted to about 49.46 mln. passengers, by 2.1% less compared to the same period of 2016. The railway transport has been chosen by 930.7 thousand passengers, by 23.3% less compared to the same period of 2016. On the other side, the number of people who chose the air transport reached 697 thousand passengers exceeding the figure registered in semester I of 2016 by 55.3%. Investment in fixed assets
In the first semester of 2017, the investment in fixed assets experience a slight increase of 2.5% (at current prices), compared to the similar period of the previous year, thus reaching the amount of 6175.6 mln. MDL (at current prices). This increase is especially due to the tangible assets holding a weight of 98.16% in total investment in fixed assets which resulted in an increase of 2.3% compared with the first semester of 2016, thus totaling 6062.3 mln lei. At the same time, the intangible assets increased by 13.9%. Although, the main sources of finance of the investment activities remain the own resources of the economic agents and population, with a weight of 73% of total sources of finance in fixed assets, during the respective period they decreased by 3.6% compared to the first semester of 2016 and amounted to 4505.3 mln. MDL. The rest of sources of finance of the investment activities have seen increases, thus 3.6% of total investment were funded by the state budget, with an increase of 57.6% sply, followed by administrative-territorial authorities’ finance with a 31.4% growth and a weight of 3.9% of total investment sources; foreign sources rised by 27.8%, holding a weight of 5.6% of total and by other sources, a weight of 13.9% was funded which compared with the similar period of the last year increased by 13.7%.
Figure 1.7. Dynamics in volume of investment in fixed assets
in January-June 2009-2017, % Source: According to the data of the National Bureau of Statistics.
Table 1.3. Investment in long-term tangible assets by funding sources during January-June 2017
Achievements. mln. lei
In % against: Jan.-June
2016 total A 1 2 3
Investment in fixed assets – total 6 175.6 102.5 100 of which. funded from: state budget 225.1 157.6 3.6 administrative-territorial units’ budgets 238.8 131.4 3.9
61.6
96.4
131.8
99.4 101.5104.5
97.5
79
102.5
10096.4
127.1
126.3 128.2134 130.6
103.2 105.8
60
80
100
120
140
2009 2010 2011 2012 2013 2014 2015 2016 2017
1st half of 2009=100 1st half ofprevious year = 100

25
Nr. 26 (trim. II) 2017
TENDINŢE ÎN ECONOMIA MOLDOVEI
Table 1.3 – continue
A 1 2 3 own resources 4 505.3 96.4 73 foreign sources 346.8 127.8 5.6 other sources 859.6 113.7 13.9 Source: According to the data of the National Bureau of Statistics. Trade and other market services
In the first semester of 2017, the enterprises of which the main activity is retail trade (excepting trade in vehicles and motorcycles) experienced a 4% reduction in turnover (in comparable prices) compared to the same period of the previous year. The turnover of enterprises of which main activity is market services provided to population during January-June, 2017 increases by 3% compared to semester I of 2016. The enterprises of which the main activity is wholesale trade (excepting trade of vehicles and motorcycles) during the respective period welcome a significant increase of 18.6% against the same period of the previous year. At the same time, the turnover for market services provided especially to enterprises, has also recorded a growth, however a lower one of only 8.8%. Tourism
In the first semester of 2017, the travel agencies and tour operators have enjoyed an increase of the services provided for 110.4 thousand tourists, their number was up by 27% compared to the similar period of 2016. This was determined by the growth in the number of people participating in outbound tourism (+31.5%), inbound tourism (+16.2%) and domestic one (+13.4%).
Table 1.4. Tourists and excursionists participating in tourism through tourism agencies and tour operators
Tourists and excursionists during January-June 2017
% against January-June 2016
TOTAL 110 356 127 Inbound tourism (foreign citizens visiting our country) 6 658 116.2 Outbound tourism (Moldovan residents travelling abroad) 85 012 131.5 Domestic tourism (Moldovan residents travelling within the country. for tourism purpose) 18 686 113.4 Source: According to the data of the National Bureau of Statistics. Of total inbound tourism having the benefit of the services of travel agencies and tour operators 76.6% arrived for recreation and leisure, 19.1% for business and professional purposes and 4.3% for treatment. Almost a half (49.3%) of total non-residents visiting the Republic of Moldova during this period were from Romania (14.2%), the Russian Federation (10.3%), Austria (7.9%), Poland (6.3%), Ukraine (5.8%) and Greece (4.8%). The main directions of departure abroad (accounting for 81.2%) of Moldovan residents through travel agencies and tour operators were: Turkey (32.6%), Bulgaria (20.4%), Romania (18.4%) and Greece (9.8%).

26
TENDINŢE ÎN ECONOMIA MOLDOVEI
Nr. 26 (trim. II) 2017
During the analyzed period, the domestic tourism had 18.7 thousand participants marking a 3.4% growth sply. The domestic tourism was especially organized by travel agencies and tour operators from Chisinau municipality (50.1%), development regions of Center (23.6%) and South (21.9%). Industrial and investment activity in districts of the Dniester River and Bender municipality2
According to the information disseminated by the statistical body of the Transnistrian region, in semester I of 2017, the enterprises in the region to the left of the Dniester River and Bender muni-cipality manufactured industrial production by 5.3% less compared to the same period, last year.
Figure 1.8. Indexes of industrial production in January-June 2009-2017, %
Source: According to the data of the statistical body of the region to the left of the Dniester River. During the analyzed period, the volume of investment has reduced by 33.2% compared to the I semester of 2016, however compared to the same period of 2008 this decrease accounts for 24.32%.
Figure 1.9. Dynamics of investment in fixed assets in January-June 2009-2017, %
Source: According to the data of the statistical body of the region to the left of the Dniester River. The investment expenditures in both construction and assembly works and equipments, machinery and means of transportation have continued to decrease, thus reaching the values of -22.1% and -31.2%, respectively.
2 According to the data of the statistical body of the Transnistrian region: http://mer.gospmr.org/gosudarstvennaya-sluzhba-statistiki/informacziya/o-soczialno-ekonomicheskom-polozhenii-pmr.html
61.3
121.3
75.5
114.3
71.3
156.8
87.5
90.5 94.7
100
91.6104.7 75.8
117.3 102.7
92.987.9
40
60
80
100
120
140
160
2009 2010 2011 2012 2013 2014 2015 2016 2017
1st half of previous year=100 1st half of 2009=100
69.1
91.2
178.5
54.2
102.5 105
63.777.5
94.7100
91.2
162.8
99.3 101.8 106.9
68.152.8
50
40
60
80
100
120
140
160
180
2009 2010 2011 2012 2013 2014 2015 2016 2017
1st half of previous year=100 1st half of 2009=100

27
Nr. 26 (trim. II) 2017
TENDINŢE ÎN ECONOMIA MOLDOVEI
During the respective period, the volume of construction works made in enterprises increases by 22.8% compared with semester I of 2016. Thus, there was also recorded a 25.6% increase of dwellings put into commission of which 29.8% belong to urban environment. Retail trade and services provided to population have significantly decreased, reducing by 6% and 1.3%, respectively compared to the similar period of 2016.

28
TENDINŢE ÎN ECONOMIA MOLDOVEI
Nr. 26 (trim. II) 2017
Chapter II PRICES, EXCHANGE RATES AND MONETARY POLICY
2.1. Prices and exchange rates Prices
In the first semester of 2017, the consumer price index has increased by 5.7%, declining by 3.8p.p. against the same period of the previous year. During the same period, there have been registered the following increases for CPI components: food products – 6.5%, non-food products – 4.8%, services – 5.6%. In quarter II, 2017 the growth rate of CPI was 7.1%, decreasing by 0.8 p.p compared to the same period of the previous year. In April-June, 2017 there have been registered the following increases for CPI components: food products – 8.4%, non-food products – 4.9%, services – 8.2%. In the first half of 2017, the annual inflation rate stressed the upward trend, with monthly developments increasing. The growth rate of prices in April, May and June, 2017 was 6.4%, 7.4% and 7.3% sply. During this period, the rise in prices was especially due to the rise in prices for several food products as well as adjustment of some tariffs for regulated services.
Figure 2.1.1. Annual growth rate of CPI and its components, % Source: According to the data of the National Bureau of Statistics.
In the second quarter of 2017, the prices of food products have increased by 8.4%, by 0.1 percentage points above the level recorded in quarter II of the previous year (in monthly expression, compared to the similar period of the last year the following increases have been recorded: in April – 7%, in May – 9.1%, in June – 9%). In quarter II of 2017, there have been considerable rises in the prices of vegetables by 24%, including cabbage by 14.6%, tomatoes –24.6%, potatoes – 19.2%; eggs by 28.2%; prices of fresh fruits rose by 17.2% etc. There have been registered decreases in the prices only in case of onion, carrot and wheat and maize flour. In quarter II of 2017, the prices of non-food products have increased by 4.9% sply, the value of this indicator dropping by 2.2 p.p. against the same period of 2016 (in monthly expression, compared to the same period of the previous year, the increases were: 5.5% in April, 5% in May
-202468
10121416
CPI, % Food, % Non-food, % Services, %

29
Nr. 26 (trim. II) 2017
TENDINŢE ÎN ECONOMIA MOLDOVEI
and 4.2% in June). During this period, there were recorded increases in prices of most non-food products, excepting vehicles and drugs. The highest increases in price were registered for: cigarettes – by 27.7%, footwear – by 9.1%, fuels – 9.7%. The increase in prices of non-food products was mainly due to the rises in price of regulated products as well as the changes made in fiscal policy which led to higher excises duties on several products. In quarter II of 2017, the services have registered essential rises in price advancing by 8.2% sply, by 0.5 p.p. over the level of this indicator in 2016 (in monthly expression, compared to the similar period of the previous year there were registered the following increases: in April – 7.5%, in May – 8.1% and in June – 8.9%). In the reference period compared to quarter II of the last year, the highest rises in price were recorded for health services – by 75.1%, education services – by 11.6% and public utility services – by 4.8%, including: water and sewage by 11.4%, hot water by 11.9% and central heating by 12.5%. The increase in health services tariffs adopted by the Government in the previous quarter and rise in other regulated prices have vastly contributed to the rise in service prices.
Figure 2.1.2. Annual growth rate of CPI and core inflation, % Source: According to the data of the National Bureau of Statistics.
Since the beginning of 2017, core inflation registers a deceleration compared to CPI dynamics. In April-June, 2017 the core inflation index amounted to 4.8% sply decreasing by 4.8 p.p compared to the same period of 2016. In monthly expression, compared to the same period of last year, the growth rate of core inflation has recorded the following rises: in April – 4.9%, in May – 4.8% and in June – 4.7%. The decrease of core inflation was mainly due to the slight appreciation of national currency against USD and single Euopean currency which has partially mitigated the rise in regulated prices and amendments in state fiscal policy. In quarter II of 2017, the dynamics of industrial production prices has registeres a slight deceleration. In April-June, 2017 the growth rate of annual index of industrial production prices has dropped compared to the same period of the previous year by 1.6p.p. reaching 3.6%. In this industry there were recorded the following increases: mining industry – 1.9%, manufacturing industry – 3.1%, energy sector – 8.7% sply. During this period, there were recorded rises in tariffs of production, supply and distribution of electricity and heat energy services. Construction prices have reistered a slight decrease. The growth rate of construction prices in quarter II, 2017 declined by 3 p.p amounting to 4.6% against the similar period of the previous year.
2468
101214
The basic inflation CPI

30
TENDINŢE ÎN ECONOMIA MOLDOVEI
Nr. 26 (trim. II) 2017
Figure 2.1.3. Annual growth rate of industrial production prices and its components, % Source: According to the data of the National Bureau of Statistics. A decrease of pace has also been recorded in dynamics of agricultural producer prices. In quarter II of 2017, the producer pices for agricultural products declined by 1.1% against the same period of 2015. During the reference period, the vegetable products, whose prices reduced by 2.4% sply have especially contributed to the decrease of annual growth rate of this category of prices. At the same time, prices of livestock products have registered a 0.6% growth compared to the same period of the previous year. An upward dynamics was attested for dynamics of fuel prices. In quarter II of 2017, the growth rate of fuel prices have recorded 9.7% sply which shows an increase of this indicator by 13.1 p.p.sply (in monthly expression, compared to the same period of the last year the fuel price indices have registered the following values: in April – 12.2%, in May – 9.8% and in June – 7.2%). There is seen a monthly decreasing dynamics of these prices, i.e. the decline in fuel prices on international markets and appreciation of national currency in relation to USD during this period. Exchange rates
The attenuation of the exchange rate fluctuations of the national currency since the beginning of this year ended in a slight appreciation in quarter II. In quarter II, 2017 the average nominal exchange rate against the major reference currencies was 20.6 MDL/EUR and 18.8 MDL/USD, appreciating compared to the similar period of the last year by 7.9% against single European currency and by 5.3% in relation to US dollar. In monthly expression, the average exchange rate of the national currency against the single European currency had an upward development, amounting to: 20.7MDL/EUR – in April, 20.6 MDL/EUR – in May and 20.4 MDL/EUR – in June. The development of the average exchange rate of leu against USD during quarter II, 2017 was 19.4 MDL/USD in April, 18.7 MDL/USD in May and 18.2 MDL/USD in June. The appreciation of the nominal exchange rate in Q II, 2017 consolidated also the position of the real exchange rate of the national currency. In real terms, Moldovan leu has appreciated during this period by 10.3% in relation to USD (in comparison with the same period of the last year) and by 10.3% against euro sply.
-3-113579
1113
Industry
Mining andquarryingManufacturing
Electricity, gas andand water

31
Nr. 26 (trim. II) 2017
TENDINŢE ÎN ECONOMIA MOLDOVEI
Figure 2.1.4. Development of average monthly nominal exchange rate of MDL in relation to USD and EURO
Sorce: According to the data of the National Bank of Moldova. Region of the Republic of Moldova to the left of the Dniester River
Since the beginning of 2017, the annual inflation rate in the region to the left of the Dniester River is situated on a relatively upward trend. In quarter II of 2017 the annual growth rate of CPI amounted to 6.1% growing by 5.7 p.p. compared to the similar period of 2016. The highest inflationary pressures on CPI during this period came from prices of food products, which is considered to be seasonal by local authorities.
Figure 2.1.5. Annual growth rate of CPI in region
from the left side of the Dniester River, % Source: According to the data of Central Bank in the region to the left of the Dniester River. The situation on the domestic foreign exchange market where the exchage rate set by the Central Bank and foreign exchange intermediaries on the market reached a maximum deference had a major impact on the economic situation in the region to the left of the Dniester River. Under these conditions, the Central Bank has intervened risind in June 2017 the fixed exchange rate of US dollar from 11.30 to 15.00 rubles. As a result of these amendments, the real effective exchange rate index has decreased which is the main index in decision making on foreign exchange policy. After the interventions of the Central Bank, at the end of semester I, 2017 the ruble has slightly depreciated. The average nominal exchange rate, during the reference period was 13.06 rubles per one Euro, depreciating by 6.4% against the value of the similar period of the last year.
17181920212223
MDL/USD rate MDL/EUR rate
-4-202468
10

32
TENDINŢE ÎN ECONOMIA MOLDOVEI
Nr. 26 (trim. II) 2017
2.2. Monetary policy
The slight signs of revival of the economic situation in the country and decrement of inflationary pressures encouraged in the first half of 2017 the National Bank of Moldova to loose monetary conditions in the country. Monetary policy instruments
By the end of quarter II, 2016, the National Bank of Moldova maintained the same monetary policy rates, which reduced compared to the same period of the previous year by about 9 p.p.
In quarter II, 2017 the base rate maintained at the level set since November 2016 amounting to 9%, declining by about 6 p.p. against its level during the similar period of the previous year. The interest rate on overnight loans is still maintained at the level of 12% and interest rate on overnight deposits is 6%. At the beginning of quarter III of 2017, the NBM made further reductions in monetary policy rates.
Figure 2.2.1. Development of interest rates on monetary policy instruments of the
National Bank of Moldova during 2015-2017 Source: According to the data of the National Bank of Moldova. Required reserves
The decision to reduce the monetary policy rates did not equally affect the ratio of required reserves. Regardless of the fact that the ratio of required reserves froze longer than a year, over a third of the commercial banks’ resources which could be directed towards lending and funding the national economy, the NBM makes new increases having no other opportunities to sterilize the excessive liquidities in the economy. In quarter II of this year, the NBM has gradually increased the reserve requirements ratio from means attracted in Moldovan lei and non-convertible currency by 5.0 percentage points up to 40% of computation base under the influence of intensifying the inflationary pressures. The ratio of required reserves from means attracted in convertible currencies remained unchanged at the level of 14%.
0
5
10
15
20
25
Base rate, %The interest rate on overnight loans, %The interest rate on overnight deposits, %

33
Nr. 26 (trim. II) 2017
TENDINŢE ÎN ECONOMIA MOLDOVEI
Figure 2.2.2. Ratio of Required Reserves at the NBM, %
Source: According to the data of the National Bank of Moldova. Open market operations and standing facilities
In quarter II of 2017 in order to sterilize the excessive liquidities on the market, the volume of the NBM sterilization operations has considerably increased. During quarter II of 2017 the average monthly balance of sterilization operations was higher compared to the same period of the previous year (up by 3.5 bln. MDL) amounting to 5.5 bln. MDL. The highest balance was recorded in June 2017 when the average daily balance of the NBC sales was – 5.8 bln. MDL. In quarter II of 2017 compared to the similar period of the previous year, the demands of "overnight" deposits doubled practically, the average daily balance amounting to – 1105 mln. MDL, 1126 mln. MDL and 1092 mln. MDL, respectively for April, May and June. The request for "overnight" loans facility from the NBM on behalf of the commercial banks came only in April and amounted to 8.2 mln. MDL. Foreign exchange market interventions
In quarter II of 2017, the NBM has intervened on the foreign exchange market especially as a buyer of foreign currency and the volume of foreign currency purchases amounted to about 99.7 mln. USD. These interventions were in accordance with the monetary policy promoted by the NBM and aimed to supply the official reserve assets.
Table 2.2.1. NBM activity on interbank foreign exchange market during January 2016–August 2017
Month Volume of purchases, (equivalent mln. USD)
Volume of sales, (equivalent mln. USD)
A 1 2 January 2016 0.38 - February 2016 0 - March 2016 11 - April 2016 108.8 - May 2016 47.5 - June 2016 20.6 - July 2016 74.4 - August 2016 94.3 - September 2016 62.9 - October 2016 5.98 10.7
13182328333843
Required reserves ratio from financial means attractedin freely convertible currency , % Required reserves ratio from financial means attractedin MDL and non-convertible currencies, %

34
TENDINŢE ÎN ECONOMIA MOLDOVEI
Nr. 26 (trim. II) 2017
Table 2.2.1 – continue A 1 2
November 2016 0 17.5 December 2016 0.59 - January 2017 0.48 - February 2017 0.46 - March 2017 28 - April 2017 9.5 - May 2017 37.4 - June 2017 52.81 - July 2017 70 - August 2017 58.9 - Source: According to the data of the National Bank of Moldova. The volume of the official reserve assets at the end of the first semester of 2017 has increased by 183 mln. USD since the beginning of this year and continues to rise. The balance of the official reserve assets at the end of quarter II, 2017 equated to 2.38 bln. USD, increasing by 27.4% sply. The increase in the stock of the official reserve assets was due to the NBM’s interventions on the domestic foreign exchange market in foreign currency purchases, registration of loans and grants in favour of Ministry of Finance of Moldova, revenues from managing foreign exchange reserves etc. Monetary indicators
In quarter II, 2017 the growth rate of money supply loosely (M3) decelerates slightly however keeping its positive value. The main contribution to the money supply increase have had the components of the monetary aggregate M1, especially demand deposits in national currency. The growth rate of money supply, during this period has increased against its values recorded in the similar period of the last year, a growth generated by the increase in the volume of deposits in national currency. In this context, the stock of monetary aggregates on June 30, 2017 compared to the data registered on June 30, 2016 has developed as follows: - monetary aggregate M0 has increased by 8.3%, amounting to about 16.9 bln. MDL; - monetary aggregate M1 grew up by 17.2% and reached a level of 28.6 bln. MDL; - growth rate of monetary aggregate M2 raised by 13.4%, accounting for 47.9 bln. MDL - monetary aggregate M3 posted an increase of 17.6% and equated to 71.4 bln. MDL.
At the end of quarter II of 2017 the volume of monetary base has recorded an essential increase of 19.8% sply and amounted to 35.9 bln. MDL. The money supply in national currency strengthens slightly the value in total money supply. In quarter II, 2017 major structural changes regarding the weight distribution of different components in money supply did not occur loosely. On June 30, 2017 the money supply components were distributes as follow: monetary aggregate M0 (currency in circulation) – 23.7%; demand deposits –16.3%; term deposits – 27% and deposits in foreign currency – 32.9%. Compared to the data at the end of quarter II of 2016 it is mentioned a 3.4p.p. reduction in the weight of deposits in foreign currency and a development determined by the consolidation of the position of demand deposits in national currency which increased its weight by 3.1 p.p.

35
Nr. 26 (trim. II) 2017
TENDINŢE ÎN ECONOMIA MOLDOVEI
Figure 2.2.3. Structure of money supply M3 Source: Calculations according to the data of the National Bank of Moldova. Monetary policy in the region from the left of the Dniester River
The monetary policy strategy of the central bank of the Republic of Moldova’s region to the left of the Dniester River provides for maintenance of the financial system stability and support of the economic growth based on targeting the exchange rate. During the second quarter of 2017, the refinancing rate of central bank was maintained at the level of 7% under several stably inflationary processes in the region. The required reserves ratio was maintained at the level of 12% set in February, 2017 for sources attracted in foreign currency and 15% for those attracted in rubles. At the end of quarter II, 2017, the money supply in the region from the left of the Dniester was 6641.9 mln. rubles (equivalent of about 5487 mln. MDL3), recording an increase of about 20.2%, compared to the volume of money supply recorded at the end of quarter II of the previous year. This growth is due to the depreciation of ruble by the central bank in the region of the Republic of Moldova from the left of the Dniester River during this period (in June 2017, the exchange rate of US dollar increased from 11.30 to 15.00 rubles). The changes in monetary policy left their mark on the money supply structure too. On July 1, 2017 the money supply components were distributed as follow: monetary aggregate M0 (currency in circulation) – 16.2%; quasi money – 18.4%; money supply in foreign currency – 65.4%. Compared to the similar period of the previous year, at the end of the second quarter of 2017 there have been some significant changes in the weight of money supply in foreign currency by 8.8% and the weight of currency in circulation and quasi money decreased by 2.3 p.p and 6.5 p.p., respectively.
3Calculated according to the official exchange rate of the CBPMR on July 1, 2017, http://www.cbpmr.net/?kv=1&lang=ru
Monetary aggregate M0
Short term deposits
Long term deposits
Currency deposits
0%10%20%30%40%50%60%70%80%90%
100%

36
TENDINŢE ÎN ECONOMIA MOLDOVEI
Nr. 26 (trim. II) 2017
Chapter III FINANCES
3.1. Public finances
The first semester of this year was more dynamic for the development of domestic economy compared to the same period of 2016, creating favorable conditions for the national public budget execution. Thus, the national public budget revenues were collected in the first semester of 2017 by 18.5% higher compared to the first semester of the previous year despite the pessimistic expectations.
In the 6 months of 2017, the total national public budget revenues amounted to 24909.2 mln. MDL, increasing by 18.5 % or by 3881.2 mln. MDL compared to the same period of the previous year, including: the state budget revenues rised by 2 830.2 mln. MDL, public social insurance budget – by 1 213.1 mln. MDL, mandatory health insurance funds – by 353.6 mln. MDL and local budgets – by 511.3 mln. lei. The analysis of the net revenues structure of NPB (without transfers between budgetary components) reflects a significant weight of the national budget receipts, with 63.09% contributions in total revenues, followed by social insurance budget with 22.22%, a lower weight of the local budgets with 7.03% and the lowest contribution have had MHIFR (mandatory health insurance funds revenues) with 6.62%.
Figure 3.1.1. Structure of revenues in NPB in S I, 2017, mln. MDL Source: According to the data of the Ministry of Finance. At the same time, the transfers between the national budgetary components show a major discrepancy between their ability to collect funds and necessity to fund their expenditures. Thus, from the government budget have been made transfers in the amount of 9 206.3 mln. MDL, however only 71 mln. MDL were collected, the highest ones being made in favour of local budgets and Public Social Insurance budget. Hence, the government budget provided 4 450.9 mln. MDL as local budgets transfers, 1295.5 – MHIFR and 3458.9 – social insurance budget. The funding trend of local budgets and other NPB components from the government budget is maintained during the last year putting the issue of amending the funding formation and administration mechanism at the level of each budget apart either social or MHIFR fund or local ones on the government agenda. The value of tax and duties revenues during the analyzed period amounted to 16353.6 mln. MDL, increasing by 23.0% or 2095.0 mln. MDL compared to the previous year. The highest contribution to the NPB’s revenue formation have had the taxes on goods and services with 45.74%, (or 69.41%
63,09%22,22%
7,03% 7,66%
National Budget Social Insurance BudgetMandatory Health Insurance Funds Revenues Local Budget

37
Nr. 26 (trim. II) 2017
TENDINŢE ÎN ECONOMIA MOLDOVEI
of total tax revenues), of which the VAT accumulated 31.11% of total NPB revenues and excise duties -11.02%, the largest part, about 96%, belonging to excise duties on imported goods. The income tax has contributed to the NPB’s revenue formation with 15.82%, taxes and duties from external trade –3.0% and taxes on real estate had an insignificant value of 1.32%. We mention that the low weight of income taxes in the first semester of 2017 compared to the taxes and duties on goods and services let us to say that the economy of the Republic of Moldova still bases on the model of consumer economy.
Figure 3.1.2. Structure of revenues by source in NPB in S I, 2016-2017, mln. MDL
Source: According to the data of the Ministry of Finance. The non-tax revenues, in semester I, 2017 amounted to 1198.4 mln. MDL, by 19.4% more compared to semester I of 2016, however its components have significantly changed: „State property revenues totaled 236.3 mln. MDL, down by 4.7% compared to the similar period of the previous year, „Duties and administrative payments” with 158.3 mln. MDL, declining by 1.4% while received equities increased by more than 200% as well as the revenues from fines and sanctions. On June 30, 2017 contributions and required insurance premiums equated to 7272.8 mln. MDL, contributing to the NPB formation by 29.20%, up by 15.2% compared to the same period of the previous year. In semester I, 2017, the Republic of Moldova received grants in the amount of 84.4 mln. MDL, which is only 37.81% of the amount received in the previous year. The most important donations were from international organizations while the governments of other countries transfered only 13.5% of grants in the first semester of 2016. The external granters reduced the volume of funding by grants given that there is no predominantly political stability in the country and several projects funded by the international bodies were frozen or postponed. The share of national public budget expenditures in semester I of 2017 accounted for 25 010.7 mln. lei, representing an increase of 3 302.2 mln. lei or by 15.2% against the similar period of the previous year. As a weight in GDP these have registered a 1.4 p.p. growth, from 16.1% of PIB in semester I 2016 up to 17.5% of GDP in semester I 2017. The expenditures made in semester I, 2017 on NPB components were: • government budget – 16 668.1 mln. lei, • public social insurance budget – 8 713.1 mln. lei, • mandatory health insurance funds – 2 916.4 mln. lei, • local budgets – 5 926.5 mln. lei.
13504,9
1041,20
13,00
6262,00
16353,6
1198,40
84,40
7272,80
Income tax
Non-tax revenues
Grants
Contributions andinsurance premiums
30.06.2017
Income tax
65,65%Non-tax
revenues4,81%
Grants0,34%
Contributions and
insurance premiums
29,20%

38
TENDINŢE ÎN ECONOMIA MOLDOVEI
Nr. 26 (trim. II) 2017
Compared to semester I of 2016, the lowest increase of expenditures was recorded in the government budget – 10.6%, the highest increase was the mandatory health insurance funds – 30.0%, and increase of public social insurance budget and local budgets expenditures accounted for 17.3% and 15.2%, respectively. During this period, the social sector fundings had the highest weight of the total recording also the highest growths. Thus, the expenditures for social protection have increased compared to the similar period of the year by 10.8% up to 9420 mln. MDL; education was funded by 13.1% more sply reaching 4670.4 mln. MDL; and health care expenditures rose by 31.2%, amounting to 3324 mln. MDL on June 30, 2017. However, the highest increase compared to the similar period of the last year, by over 200% was for housing and utility services households and services in economy expenditures. The decrease of expenditures was attested for environmental protection by 5%. We mention a decrease in expenditures for environmental protection for the third consecutive year which cannot be considered a positive thing for the economic and social future of the Republic of Moldova.
Figure 3.1.3. Structure of expenditures in NPB in S I, 2017, %
Source: According to the data of the Ministry of Finance. The national public budget execution in semester I, 2017 has resulted in a deficit equating to 101.5 mln. lei (0.07% in GDP) given that for 2017 there was set the budget deficit target of 3.0% of GDP. Compared to the same period of 2016, the budget deficit was lower by 579.0 mln. lei, especially due to the faster accumulation of budgetary revenues compared to the growth rate of government expenditures. At the end of June, 2017, the balances of funds in the national public budget accounts compared to the beginning of the year increased by 1 215.9 mln. MDL and amounted to 5 996.3 mln. lei, including 1 000.9 mln. lei from projects funded by external sources. Of all NPB components, only the government budget ended in a deficit during the respective period, the external funding sources representing the main funding source of the deficit. The other components of the national public budget ended in a surplus. At the end of semester I of this year, a primary surplus of 0.5% of GDP has been recorded (budget balance excepting interest rates) given that for 2017 there is foreseen a primary deficit of 1.6% of GDP.
state services with general destination
9,36%national defense
0,93% defense and public order
6,84%expenditures of
economic nature 8,47% environment
protection 0,26%communal and
locative households
2,14%health care 13,29%
culture, youth and
sport 2,38%
education18,67%
social protection
37,66%

39
Nr. 26 (trim. II) 2017
TENDINŢE ÎN ECONOMIA MOLDOVEI
Figure 3.1.4. NPB deficit, mln. MDL
Source: According to the data of the Ministry of Finance. On June 30, 2017 the public sector debt amounted to 58248.1 mln. MDL, the largest part, about 87% belonging to public debt, the public sector enterprises having a debt of 2103.2 mln. MDL or 3.61% of debt and the NBM – 5122.7 mln. MDL or 8.8%. According to the data on GDP forecast for 2017, the weight of public sector debt in GDP on June 30, 2017 amounted to 39.3%, decreasing by 4.7 p.p. compared to the end of 2016 and an increase of 6.0 p.p compared to the same period of 2016.
Figure 3.1.5. Structure of public sector debt during 2016-2017, thousand MDL
Source: According to the data of the Ministry of Finance. The increase in the balance of public sector at the end of semester I, 2017 compared to the end of 2016 is conditional on the increase in the balance of public debt by 863.4 mln. lei. In this period, the NBM debt balance decreased by 540.6 mln. lei, public sector enterprises debt diminished by 176.8 mln. lei, and ATU debt declined by 23.8 mln. lei. On June 30, 2017, the public sector external debt amounted to 1 908.9 mln. USD (equivalent of 34 655.3 mln. MDL), or 59.5% of public sector debt balance and public sector domestic debt accounted for 23 592.8 mln. lei (40.5%). During semester I of 2017, the public debt has decreased reacting especially to the public sector domestic debt which recorded a decreasing development of 2.5 percent.
1362,6953,2
450,3 465 673,4 680,5101,50
200400600800
1000120014001600
T.II-2011 T.II-2012 T.II-2013 T.II-2014 T.II-2015 T.II-2016 T.II-2017Q II,2011 Q II,2012 Q II,2013 Q II,2014 Q II,2015 Q II,2016 Q
30 June2016 2016 30 June
2017UAT debt 398,3 406,9 364,9Debt of public
sectorenterprises
2.542,90 2.313,20 2.103,20
NBM debt 6.356,20 5.839,90 5.122,70State debt 35.596,40 50.785,80 50.657,30
010.00020.00030.00040.00050.00060.00070.000
33.877,40
35.544,70
34.655,30
11.016,40
23.801,10 23.592,8
0
010.00020.00030.00040.00050.00060.00070.000
30 June2016
2016 30 June2017
The domestic public debt, mil.MDLExternal public debt, US $ million

40
TENDINŢE ÎN ECONOMIA MOLDOVEI
Nr. 26 (trim. II) 2017
On June 30, 2017 the public debt balance amounted to 50 657.3 mln. MDL, consisting of 1 604.6 mln. USD external public debt (equiva-lent of 29 130.7 mln. MDL) and 21 526.6 mln. MDL domestic public debt recording a decrease of 128.5 mln. MDL or by 0.3% compared to the end of 2016. The decrease in the public debt balance on June 30, 2017 compared to the end of 2016 is especially due to the decline of external public debt denominated in Moldovan lei depending on the appreciation of national currency by 9.1% during semester I, 2017. The amendment in the public debt balance of the SS issuing was insig-nificant – by about 7.0 mln. lei. The weight of public debt in GDP on June 30, 2017 amounted to 35.5%, recording a decrease compared to the end of 2016 by 2.1 %. The public debt structure by maturity denotes a high quality because the short-term public debt holds a weight of 18.5 %, which means that about a fifth of the public debt balance will arrive at maturity during a year. The long-term debt accounts for 81.5 % of the public debt portfolio, the longest maturity periods belong to the external and domestic public debt issued for the execution of the state guaratees. According to the structure by currencies of public debt, the highest weight falls under the head of the domestic public debt in Moldovan lei – 42.5%, followed by the external public loans denominated in the SDR currency basket by 33.8%. The following positions are occupied by Euro – 15.7%, US Dollar – 5.9%, Japanese yen – 2.1% and Sterling – 0.02%. The debt with floating interest rate accounted for 15.0 percent of the public debt portfolio on June 30, 2017 representing a decrease by 0.3 p.p compared to the end of 2016 and by 5.2 p.p. compared to June 30, 2016. At the same time, on June 30, 2017 the public debt of fixed interest rate debt amounted to 85.0 percent of the public debt portfolio. Public finances in the region from the left side of the Dniester River In the first semester of 2017, the republican budget collected revenues in the amount of 813.4 mln. rubles, by 46.9 mln. rubles (6.1%) more compared to the real revenues for the same period of 2016. These revenues were obtained from the following sources: − Tax revenues in the amount of 457.5 mln. rubles (56.3% of total government revenues),
which is by 29.8 mln. rubles (7%) more compared to the real revenues for semester I, 2016; − Non-tax revenues amounting to 29.8 mln. rubles, by 24.7 mln. Transnistrian rubles (by 5.8
times) more compared to the real revenues for semester I 2016; − Voluntary donations to the tune of 1.7 mln. Transnistrian rubles transfered in the Republican
budget to fund the businesses; − Revenues from special funds accounting for 38.57 mln. Transnistrian rubles, which is by 3.49
mln. Transnistrian rubles (8.3%) less than the real revenue for semester I, 2016;
Figure 3.1.6. Relation of debt types compared to GDP Source: According to the data of the National Bank of Moldova.
20,1 21,6 19,7
6,3316 14,5
26,4
37,6 34,2
05
10152025303540
30 June 2016 2016 30 June 2017
External state debt/GDPThe domestic state debt/GDPState debt / GDP,%

41
Nr. 26 (trim. II) 2017
TENDINŢE ÎN ECONOMIA MOLDOVEI
− Revenues from other economic activities equating to 40.75 mln. Transnistrian rubles, by 2.84 mln. Transnistrian rubles (6.5%) less compared to the real revenue for semester I, 2016.
In the structure of tax revenues, the highest weight holds the following types of taxes: - corporate tax from legal entities in the amount of 204.2 million Transnistrian rubles, by 10.1
million Transnistrian rubles or 4.7% less compared to the real revenue for the first half of 2016;
- customs duties amounting to 122.6 million Transnistrian rubles, which is by 2.2 million Transnistrian rubles (1.8%) more than the real revenue for the first half of 2016;
- excise duties worthing 58.1 million Transnistrian rubles or by 13 million Transnistrian rubles (28.9%) more than the real revenue for the first half of 2016;
- income tax from individuals equating to 12.9 million Transnistrian rubles, being by 2.3 million Transnistrian rubles (15%) less against the real revenue for the first half of 2016.
During the reporting period, the local budget revenues collected funds worthing 365.6 million Transnistrian rubles, by 11 million Transnistrian rubles (2.9%) less than the real revenue for the first half of 2016. In semester I, 2017 the national budget expenditures were funded in the amount of 1 299.6 mln. Transnistrian rubles, by 37.08 mln. Transnistrian rubles more than in the same period of 2016, however at the level of only 81.8% of the planned ones. From the declarations of the separatist Republic authorities, the republican budget had a social nature, the weight of expenditures for social protection funding equated to 1 114.6 mln. Transnistrian rubles or 85.76% of total budget expenditures in this period. The budget execution ended in a deficit balance of 486.2 Transnistrian rubles increasing by 20.08% compared to the same period of the previous year. 3.2. Banking sector
The banking sector of the Republic of Moldova experienced positive developments during the first semester of 2017 being conditional on both domestic macroeconomic factors and financial and advisory support of te IMF and EU. However there are gaps in terms of transparency and corporate governance at the first 3 banks in the system, BC „Moldova-Agroindbank" S.A., and B.C. „Victoriabank" S.A., for which the intensive supervision regime was maintained with which was replaced the special supervision set on June 11, 2015 following the amendments in legislation as of October 4, 2016 and for BC „Moldindconbank" S.A., the early intervention regime was introduced. This leads to some uncertainty in the future developments of the banking system because the above-mentioned banks currently hold 65.0% of the banking sector’s assets, 55.47% of capital and 65.6% of loans portfolio. In the first six months of 2016, the bank assets have recorded growing trends both in volume and quality. During 2016, the growth rate of bank assets was on an upward trend and in the first six months of this year, the volume of assets increased by 1 013.5 mln. MDL or 1.37%, amounting to 75 025.74 at the end of June, 2017. The risk-weighted assets have also arisen from 32 553 mln. MDL at the end of 2016 to 34 166.76 mln. MDL at the end of June 2017. The growth in the volume of risk-weighted assets was similar to the growth rate of total assets so that the weight of risk assets in total assets registers a continuous decline since the beginning of 2017 reaching 45.54%, less by 1.85 p.p compared to the end of semester I, 2016.

42
TENDINŢE ÎN ECONOMIA MOLDOVEI
Nr. 26 (trim. II) 2017
Figure 3.2.1. Development of quality of bank assets
Source: Authors’ calculations according to the data of the National Bank of Moldova. At the same time, there is seen that only 4 banks B.C. „Victoriabank" S.A, B.C. „EXIMBANK-Gruppo Veneto Banca” S.A., B.C. „ProCredit Bank” S.A, B.C. „Moldindconbank" S.A. improved their asset quality against the similar period of the previous year. There can be mentioned especially B.C. „Victoriabank" S.A., its risk asset value being reduced by 668.94 mln. MDL and B.C. .„Moldindconbank" S.A. bank with a decrease of 793.98. The other 7 banks arose the value of risk-weighted assets. BC „MOBIASBANCA-Groupe Societe Generale” S.A. may be named the head in this respect with 972.34 mln. MDL and B.C. „Moldova-Agroindbank" S.A. with 671.92 mln. MDL. Two of the banks under intensive supervision improved their positions regarding this respect and „Moldova-Agroindbank" S.A. – worsened it. The quality of bank assets was also supported by the volume of equity capital, so that, the capital adequacy makes rings round the minimum imposed by the prudential requirements of 16% reaching on average 29.7% in the system. The slope of the chart representing the level of capital adeqacy for the period of the first semester, 2017 was the same as in the similar period of last year but it started to rise from a higher level and registered variation within the limit of 1.5% which can be considered unsignificant at such a higher rate of capital adequacy. The sharp decrease of this indicator recorded in January, 2017 was the result of the increase in risk-weighted assets at a faster rate than the growth of Total Regulatory Capital (Figure 3.2.2 compared to Figure 3.2.1). The rise of the asset value was regrettably due more to the liquidity increase than loans. On June 30, 2017 the gross loan portfolio amounted to 45.6% of total assets or 34 216.57 million lei decreasing by 1.57 percent (544.7 mln. MDL) during semester I, 2017. Compared to the same period of the previous year, the reduction was even more drastic amounting to 3 019.7 mln. MDL or 8.69%. Taking into account that the real sector lending is the main pillar which ensures a tenable growth of the country, this trend can be considered a negative one. The investment in securities (National Bank certificates and state securities) have recorded a weight of 13.2 % of total assets being by 2.1 p.p. lower compared to the end of 2016, following the drop of the base rate from 9 percent to 8.0 percent. The rest of assets amounting to 41.2 percent are maintained by banks in the accounts opened at the National Bank, in other banks, cash etc. forming with the state securities, the component of liquid assets which are taken into account in the calculation of liquidity principle II.
4344444545464647474848
010.00020.00030.00040.00050.00060.00070.00080.000
Risk-weighted assetsTotal asset, mil.MDLRisk-weighted assets /total assets
10.331,49390,64193,11
871,261.915,38
1.122,943.722,73
7.534,312.042,43
2465.068,62
11.003,41493,17296,76
1.019,491.694,32
1.363,684.694,07
6.770,332.038,51
393,334.399,68
MOLDOVA - AGROINDBANKCOMERTBANK
EuroCreditBankENERGBANK
EXIMBANK - Gruppo Veneto…FinComBank
MOBIASBANCA - Groupe…Moldindconbank
ProCredit BankBCR Chisinau
VICTORIABANK
Risk-weighted assets, mil,MDL
30-06-1731-06-2016

43
Nr. 26 (trim. II) 2017
TENDINŢE ÎN ECONOMIA MOLDOVEI
Figure 3.2.2. Development of quality of bank capital Source: According to the data of the National Bank of Moldova.
Figure 3.2.3. Level of liquidity in the banking sector on June 30, 2017
Source: According to the data of the National Bank of Moldova. In the first six months of 2017, the liquidity indicators of the banking sector fall within the prudential limits set by the NBM, the weight of liquid assets in total assets (liquidity principle II) registers 51.30%, more by 6.81 p.p. against June 30, 2016 and by 2.1 p.p. against January 1, 2017 and by about 2.5 times more than the minimum limit set by the NBM. The value of the long-term liquidity indicator (liquidity principle I (≤1)) of the entire banking system amounted to 0.62, as of June 30, 2017 less by 0.08 compared to June 30, 2016. Consequently, we state an excessive increase of bank liquidities as well as a migration of an asset share from loans to low-risk liquid assets and adequate return such as the state securities.
Most banks register a liquidity excess, the actual liquidity indicator being increasing permanently. In this respect B.C. „Comertbank" S.A. with 60.61%, B.C. „Victoriabank" S.A. with 60.44% and B.C. „Energbank" S.A. with 57.48% are leaders in this respect. B.C. „BCR Chisinau" S.A. decreased considerably the weight of liquid assets from 66.64% at the end of last year to 61.29% as of June 30, 2017. Except for B.C. „Victoriabank" S.A., which increased its liquidity as a result of amending its loan risk assessment strategy given the intensive supervision, a liquidity excess report the banks with low capital which under intensive supervision choose to reorient their activity from
25262728293031
8.0008.5009.0009.500
10.00010.500
Capital tier I TRC risk-weighted capital adequancy
0,010,020,030,040,050,060,0
0,60,60,60,60,60,70,70,7
Principle I - Long-term liquidity (≤ 1)
40,2858,8360,74
54,4943,15
48,1352,55
42,1738,7
66,3947,11
44,4460,61
51,6957,48
53,6245,5
49,5353,49
39,5561,2960,44
MAIBCOMERTBANK
EuroCreditBankENERGBANKEXIMBANK -…FinComBank
MOBIASBANCA -…Moldindconbank
ProCredit BankBCR Chisinau
VICTORIABANK
Current Liquidity Ratio,%
30-06-17 31-06-2016

44
TENDINŢE ÎN ECONOMIA MOLDOVEI
Nr. 26 (trim. II) 2017
lending to placements of means in low-risk assets but with an acceptable level of profit. Unfortunately, this situation is encouraged by the NBM which maintains the interest rate on securities issued by it and deposits attracted by banks at a fairly high level. The continual liquidity growth in the banking system is the result of tightening the monetary policy promoted by the NBM which essentially aims to sterilize the money supply excess in order to maintain the inflation targeting but affects the banks’ ability to lend. As long as the NBM will continue to manage the liquidity excess to support a proper functioning of interbank money market by open-market operations, the banks will feel low from placing loans which at a similar return produce a much higher risk than the state securities and the increase of required reserves ratio will only act to the rise of liquidity requirement maintained on the bank accounts at the NBM. In this case, it is important to express a decision which would clearly set the monetary policy option of the NBM – maintenance of inflation targeting or lending growth of the banking system and implicitly the economic growth of the country. The slowdown in the volume of new loans which began at the end of 2014 changed in a moderate reduction of lending during 2015 and 2016, continuing also at the beginning of 2017. The gross loans portfolio granted by the commercial banks had a negative development in semester I, 2017. Though, in January there was recorded a sharp increase in loans provided to legal entities by 6 425 mln. MDL which can be considered as an abnormality. Moreover, this abnormal value of loans appeared in January, was not found either in February or June, at the end of semester I, the value of loans being even lower than at the beginning. At the same time, there is observed the migration of loans from legal entities to individuals and from foreign in national currency (44.86 %). Thus, the loans provided to individuals increased by 154.61 mln.MDL and those provided to legal entities decreased by 727.70 mln.MDL, against the reduction in the total volume of loans. The increasing trend in loans provided to legal entities and in national currency is due to the appreciation of Moldovan leu against other currencies and the refuse of banks to assume the foreign currency risk too apart from the loan one. However the high level of loans provided to individuals shows a high level of uncertainty and depression of domestic real economy which makes the business unable or unwilling to lend. Thus we are present at the continuing amendment in the pattern of national economy development from production to consumption.
Figure 3.2.4. Development of loans by currency and categories of debtors, thousand MDL Source: According to the data of the National Bank of Moldova.
3940414243444546
05.000
10.00015.00020.00025.00030.00035.00040.00045.000
%
individuals legal entities the share of credits in foreign currency
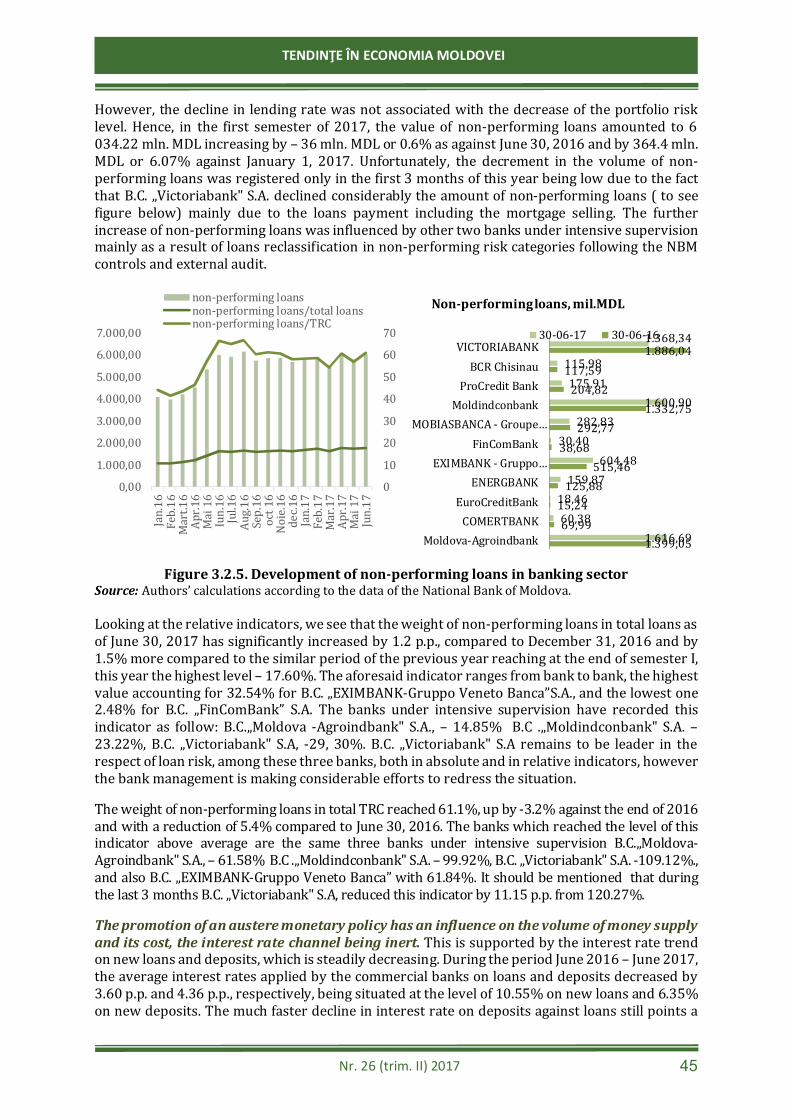
45
Nr. 26 (trim. II) 2017
TENDINŢE ÎN ECONOMIA MOLDOVEI
However, the decline in lending rate was not associated with the decrease of the portfolio risk level. Hence, in the first semester of 2017, the value of non-performing loans amounted to 6 034.22 mln. MDL increasing by – 36 mln. MDL or 0.6% as against June 30, 2016 and by 364.4 mln. MDL or 6.07% against January 1, 2017. Unfortunately, the decrement in the volume of non-performing loans was registered only in the first 3 months of this year being low due to the fact that B.C. „Victoriabank" S.A. declined considerably the amount of non-performing loans ( to see figure below) mainly due to the loans payment including the mortgage selling. The further increase of non-performing loans was influenced by other two banks under intensive supervision mainly as a result of loans reclassification in non-performing risk categories following the NBM controls and external audit.
Figure 3.2.5. Development of non-performing loans in banking sector Source: Authors’ calculations according to the data of the National Bank of Moldova. Looking at the relative indicators, we see that the weight of non-performing loans in total loans as of June 30, 2017 has significantly increased by 1.2 p.p., compared to December 31, 2016 and by 1.5% more compared to the similar period of the previous year reaching at the end of semester I, this year the highest level – 17.60%. The aforesaid indicator ranges from bank to bank, the highest value accounting for 32.54% for B.C. „EXIMBANK-Gruppo Veneto Banca”S.A., and the lowest one 2.48% for B.C. „FinComBank” S.A. The banks under intensive supervision have recorded this indicator as follow: B.C.„Moldova -Agroindbank" S.A., – 14.85% B.C .„Moldindconbank" S.A. – 23.22%, B.C. „Victoriabank" S.A, -29, 30%. B.C. „Victoriabank" S.A remains to be leader in the respect of loan risk, among these three banks, both in absolute and in relative indicators, however the bank management is making considerable efforts to redress the situation. The weight of non-performing loans in total TRC reached 61.1%, up by -3.2% against the end of 2016 and with a reduction of 5.4% compared to June 30, 2016. The banks which reached the level of this indicator above average are the same three banks under intensive supervision B.C.„Moldova-Agroindbank" S.A., – 61.58% B.C .„Moldindconbank" S.A. – 99.92%, B.C. „Victoriabank" S.A. -109.12%., and also B.C. „EXIMBANK-Gruppo Veneto Banca” with 61.84%. It should be mentioned that during the last 3 months B.C. „Victoriabank" S.A, reduced this indicator by 11.15 p.p. from 120.27%. The promotion of an austere monetary policy has an influence on the volume of money supply and its cost, the interest rate channel being inert. This is supported by the interest rate trend on new loans and deposits, which is steadily decreasing. During the period June 2016 – June 2017, the average interest rates applied by the commercial banks on loans and deposits decreased by 3.60 p.p. and 4.36 p.p., respectively, being situated at the level of 10.55% on new loans and 6.35% on new deposits. The much faster decline in interest rate on deposits against loans still points a
0,001.000,002.000,003.000,004.000,005.000,006.000,007.000,00
Jan.16
Feb.1
6Ma
rt.16
Apr.1
6Ma
i 16
Iun.16
Jul.16
Aug.1
6Sep
.16oct
16No
ie.16
dec.1
6Jan
.17Fe
b.17
Mar.1
7Ap
r.17
Mai 1
7Jun
.17
010203040506070
non-performing loansnon-performing loans/total loansnon-performing loans/TRC
1.399,0569,99
15,24125,88
515,4638,68
292,771.332,75
204,82117,59
1.886,04
1.616,6960,38
18,46159,87
604,4830,40
282,831.600,90
175,91115,98
1.368,34
Moldova-AgroindbankCOMERTBANK
EuroCreditBankENERGBANK
EXIMBANK - Gruppo…FinComBank
MOBIASBANCA - Groupe…Moldindconbank
ProCredit BankBCR Chisinau
VICTORIABANK
Non-performing loans, mil.MDL
30-06-17 30-06-16

46
TENDINŢE ÎN ECONOMIA MOLDOVEI
Nr. 26 (trim. II) 2017
downward trend which will discourage the population to put aside money. Although in March there was attested an increasing interest rate on deposits up to 6.91%, it was in the short term returning on a decreasing trend in the coming month.
Figure 3.2.6. Development of net banking margin, average interest rates on new deposits
and loans in MDL, % Source: According to the data of the National Bank of Moldova. On June 30, 2017 the balance of banks’ deposits amounted to 55 370.36 mln. MDL, increasing by 6.04%, compared to June 30, 2016 and by 1% compared to December 31, 2016. This growth was mainly due to the increase in the balance of deposits in lei by 3 617.01 mln. MDL or by 13.52% compared to the same period of the previous year and by 1 008.66 or 3.46% compared to the end of 2017, prevailingly from legal entities account. Hereby, against the increase in the volume of deposits, the deposit rate of individuals decreases, reaching 67.87%, down by 0.85% against December 31, 2017 and by 3.31% against semester I of 2016. This decrement is caused by the revenue drop intended for population’s savings, reduction of remittances flow and decrease of confidence of individuals in the banking system after the Billion Dollar Theft. At the same time, the increase in the balance of deposits of leagal entities leads to the conclusion that the business is waiting for a change of the economic situation and is not investing choosing to hold the free funds in the bank accounts to the detriment of funding some investment activities.The balance of deposits in foreign currency has diminished by 462.79 mln. MDL or 1.81% compared to the same period of the previous year and by 476.81 mln. MDL or 1.87% as against December 31, 2017. The decrease in the balance of deposits in foreign currency in conjunction with the sharp increase in the balance of deposits in lei is the result of the significant appreciation of the national currency on the foreign exchange market attested during 2017. (Figure 3.2.7) The problems in the banking system, previously identified are reflected by the financial result of the banks in semester I, 2017. In June, 2017, the bank’s profit in the entire banking system amounted to 956.73 mln. MDL, up by – 102.3 mln. MDL or 11.98% in comparison with the same period of the previous year. The increase in the profit is determined by the decrease in interest expenditures (from deposits) by 39.9 percent, decline of financial assets depreciation by 76.6 percent and increase of non-interest revenues by 5.4 percent (vastly from duties and commissions by 11.8 percent). There is also seen an increase of revenues from the primary activity of banks, the ratio between net interest revenue and total revenues reaching from 37.84% at the beginning of this year to 40.4% as of June 30, 2017. The weight growth of interest revenues in total revenues was also due to the rise in receipts of holding to maturity of state securities and not to the rise in receipts of loans.
0,002,004,006,008,00
10,0012,0014,0016,0018,00
%, Deposits %, Loans NIM

47
Nr. 26 (trim. II) 2017
TENDINŢE ÎN ECONOMIA MOLDOVEI
Figure 3.2.7. Development in the balance of deposits in S I, 2017, mln. MDL Source: According to the data of the National Bank of Moldova. Under the growth of revenues in absolute form there was also recorded an increase in relative indicators of return – ROE and ROA by 2.7 p.p. and 0.4 p.p., respectively reaching the weight of 14.6% for return on equity and 2.4% for return on assets. However, only 40.4% of total revenues are provided by the financial intermediation activity confirming a low involvement of banks in funds redistribution activity and implicitly to the economic growth by providing the necessary resources of real economy.
Figure 3.2.8. Development of banking return and profitability in 2016-2017
Source: Authors’ calculations according to the data of the National Bank of Moldova. The analysis of each bank’s contribution to the net profit formation in the banking system reveals that only 5 banks of 11 have registered an increase in the value of profits, the other banks recording a negative trend. Thus, compared to June 30, 2016 B.C. „BCR Chișinău” S.A increased its profit by 3.3 mln. MDL or 32.55%, B.C. „MOBIASBANCA-Groupe Societe Generale” S.A. by 9.4 mln. MDL or 6.89%, B.C. „VICTORIABANK” S.A. by 40.8 mln. MDL or 34.98% B.C. „Moldindconbank”
0102030405060708090
010.00020.00030.00040.00050.00060.000
%
mil.
MD
LForeign currency, mil.MDLNational currency, mil.MDL
0
5
10
15
20
25
3536
373839
404142
Ian.16
Mart.1
6Ma
i 16
Iul.16
Sep.16
Noie.1
6Ian
.17Ma
r.17
Mai 1
7
%
mil.
MD
L
Venitul net aferent dobânzilor / Total venit,%Rentabilitatea capitalului (ROE),%Rentabilitatea activelor (ROA), %
238,3023,61
8,2532,7530,7126,30
135,89200,43
32,049,46
116,73
312,927,843,86
25,6917,5418,35
145,26248,11
6,7912,80
157,57
Moldova-AgroindbankCOMERTBANK
EuroCreditBankENERGBANK
EXIMBANK - Gruppo…FinComBank
MOBIASBANCA -…Moldindconbank
ProCredit BankBCR Chisinau
VICTORIABANKProfit, mil.MDL 31-06-2017 31-06-2016

48
TENDINŢE ÎN ECONOMIA MOLDOVEI
Nr. 26 (trim. II) 2017
S.A., by 47.7 mil. MDL or 23.79% and BC „MOLDOVA-AGROINDBANK” S.A. by 74.6 mil. MDL or 31.31%. For the last 2 banks, the positive trend began in quarter II of 2017, the first trimester of this year being less profitable than in the previous year. The pioneers regarding the net profit decrease compared the same period of 2016 were B.C. ProCredit Bank” S.A, with 78.79% or 25.2 mln. MDL, B.C. „COMERTBANK” S.A with 66.81% or 15.8 mln. MDL, B.C. „Energbank” S.A. with 25.57 or 7.1 mln. MDL and B.C. „EXIMBANK-Gruppo Veneto Banca” with 42.67% or 13.2mln. MDL. Indeed, we mention that the value of profit during the financial year is less informative being adjusted with all seasonal growths and reductions by the end of the year. We hope that the banks will supply their non-profits during the year. Banking sector in the region to the left of the Dniester River
In the first six months of 2016, the banking sector in the region to the left of the Dniester River has recorded revival trends in the main activity indicators. In semester I, 2017 the average annual growth rate of bank assets in Transnistrian region was situated on an upward trend amounting to a 4.34% increase sply or 323.7 mln. rubles, forming the value of 6660.02 mln. Transnistrian rubles4 on March 31, 2017.
Figure 3.2.9. Annual growth rates of bank assets, deposits and loans in the region to the left bank of the Dniester River, %
Source: Author’s calculation according to the data of the Transnistrian Bank. The balance of loans provided to the economic sector reached the amount of 4225.11 mln. Transnistrian rubles on March 31, 2017, by 306.6 mln. Transnistrian rubles more or by 1.05% against December 31, 2016. During this period, the loans for individuals accounted for 724.3 mln. Transnistrian rubles, by 19.19% less against March 31, 2016 and loans provided to real sector totaled 3284.7 mln. Transnistrian rubles, by 2.4% more. At the same time, it is attested a much higher growth rate of reductions in the losses on loans proving the increase in loan risk. Hence, the amount of reductions went up by 84.45 mln. Transnistrian rubles or 20.68%, reaching 493.23 mln. Transnistrian rubles. On March 31, 2017 the balance of bank deposits from population accounted for 1376.6 mln. rubles, increasing by 18.3% or 59.3 mln. Transnistrian rubles compared to December 31, 2016. The total balance of deposits equated to 3002.09 mln. Transnistrian rubles up by 4.81%. Due to
4 www.cbpmr.net
010002000300040005000600070008000
Capital Depozits Loans Assets

49
Nr. 26 (trim. II) 2017
TENDINŢE ÎN ECONOMIA MOLDOVEI
the major discrepancies between the attracted deposits and volume of loans demanded by economy, the banks are forced to make greater efforts to attract funds on the interbank market. Thereby, the volume of attracted resources except those from population’s deposits amounted to 5049.0 mln. rubles increasing by 274.4 mln. rubles or 8.12%. In the case of the banking sector to the right of the Dniester River there is also an important problem regarding the transparency of the Transnistrian banks’ shareholders and a major loan risk. The local banking sector is getting harder to face the foreign currency risk due to the depreciation of Transnistrian ruble.
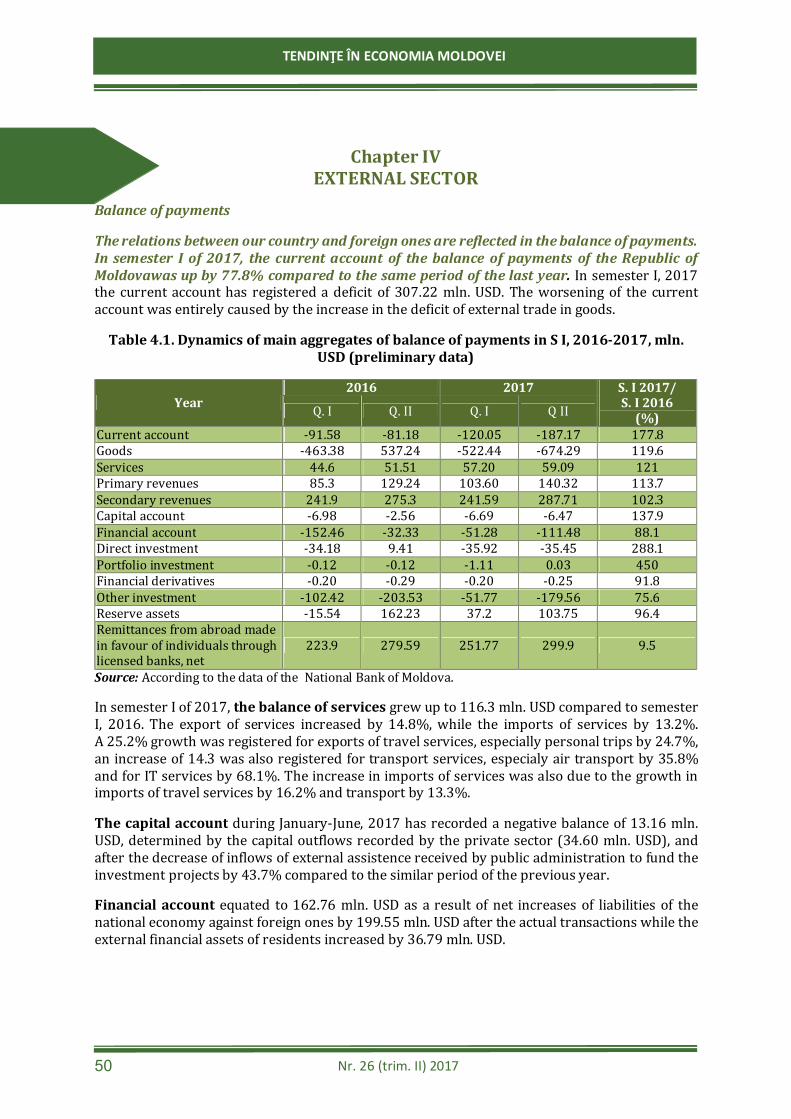
50
TENDINŢE ÎN ECONOMIA MOLDOVEI
Nr. 26 (trim. II) 2017
Chapter IV EXTERNAL SECTOR
Balance of payments
The relations between our country and foreign ones are reflected in the balance of payments. In semester I of 2017, the current account of the balance of payments of the Republic of Moldovawas up by 77.8% compared to the same period of the last year. In semester I, 2017 the current account has registered a deficit of 307.22 mln. USD. The worsening of the current account was entirely caused by the increase in the deficit of external trade in goods.
Table 4.1. Dynamics of main aggregates of balance of payments in S I, 2016-2017, mln. USD (preliminary data)
Year 2016 2017 S. I 2017/
S. I 2016 (%) Q. I Q. II Q. I Q II
Current account -91.58 -81.18 -120.05 -187.17 177.8 Goods -463.38 537.24 -522.44 -674.29 119.6 Services 44.6 51.51 57.20 59.09 121 Primary revenues 85.3 129.24 103.60 140.32 113.7 Secondary revenues 241.9 275.3 241.59 287.71 102.3 Capital account -6.98 -2.56 -6.69 -6.47 137.9 Financial account -152.46 -32.33 -51.28 -111.48 88.1 Direct investment -34.18 9.41 -35.92 -35.45 288.1 Portfolio investment -0.12 -0.12 -1.11 0.03 450 Financial derivatives -0.20 -0.29 -0.20 -0.25 91.8 Other investment -102.42 -203.53 -51.77 -179.56 75.6 Reserve assets -15.54 162.23 37.2 103.75 96.4 Remittances from abroad made in favour of individuals through licensed banks, net
223.9 279.59 251.77 299.9 9.5
Source: According to the data of the National Bank of Moldova. In semester I of 2017, the balance of services grew up to 116.3 mln. USD compared to semester I, 2016. The export of services increased by 14.8%, while the imports of services by 13.2%. A 25.2% growth was registered for exports of travel services, especially personal trips by 24.7%, an increase of 14.3 was also registered for transport services, especialy air transport by 35.8% and for IT services by 68.1%. The increase in imports of services was also due to the growth in imports of travel services by 16.2% and transport by 13.3%. The capital account during January-June, 2017 has recorded a negative balance of 13.16 mln. USD, determined by the capital outflows recorded by the private sector (34.60 mln. USD), and after the decrease of inflows of external assistence received by public administration to fund the investment projects by 43.7% compared to the similar period of the previous year. Financial account equated to 162.76 mln. USD as a result of net increases of liabilities of the national economy against foreign ones by 199.55 mln. USD after the actual transactions while the external financial assets of residents increased by 36.79 mln. USD.

51
Nr. 26 (trim. II) 2017
TENDINŢE ÎN ECONOMIA MOLDOVEI
Foreign direct investment
The international investment position of the Republic of Moldova continued its trend from the previous periods. In semester I of 2017 the international investment position was increasing and amounted to 3958.60 mln. USD.
Compared to semester I of 2016, the international investment position was up by 7.8%, and against the end of 2016 by 11.6% (the FDI stock in 2016 amounted to 3548.32 mln. USD). During semester I of 2017 the increase in the debtor balance of the international investment position was due to the exchange rate fluctuations of the original currencies against US Dollar (-275.76 mln. USD), net effective transactions with non-residents (-162.77 mln. USD), price changes (-55.25 mln. USD) of financial instruments while other changes (83.51 mln. USD) have influenced the debtor balance of position in the downward direction. All above-mentioned changes have resulted in a total deterioration of position at the end of semester I, 2017 of 410.27 mln. USD.
Figure 4.1. FDI stock by quarters in 2014-2017, mln. USD Source: According to the data of the National Bank of Moldova. In the geographical distribution of FDI of the total accumulated capital, the investors in the EU countries received the majority weight – 86.7%, the investors from CIS countries had a weight of 3.7%, those from other countries hold investment in the ratio of 9.6%.
Figure 4.2. Distribution of FDI, equity capital accumulated on June 30, 2017, by activities Source: According to the data of the National Bank of Moldova.
320033003400350036003700380039004000
Q.I Q. II Q.I Q. II Q.I Q. II Q.I Q. II2014 2015 2016 2017
financial activities and insurancemanufacturing industry
wholesale and retail trade; repair of…electric andtherminal energy, gaz air…
information and communicationstransportation and storage
real estate transactionsother
26.20%26.20%
14.30%12.40%
10%4.80%
2.40%3.70%

52
TENDINŢE ÎN ECONOMIA MOLDOVEI
Nr. 26 (trim. II) 2017
The main economic activities benefiting from foreign investment in the FDI stock as own capital are: financial and insurance activities 26.2% and manufacturing industry 26.2%. Other activities which attracted foreign investors were trade, energy industry, information and communications, transport and storage, real estate transactions. Remittances from abroad
In the first semester of this year, the volume of remittances from abroad reached 551.7 mln. USD. This amount is higher compared to the previous quarter of the last year, after two years of decline.
In the first six months of 2017, the volume of remittances in Moldova in favour of individuals increased by 48.8 mln. USD (9.6%) compared to the reference period of 2016. The volume of remittances in favour of individuals in Semester I amounted to 551.7 mln. US dollars.
Figure 4.3. Remittances from abroad made in favour of individuals through Moldovan banks by quarters during 2011-2017, mln. USD
Source: According to the data of the National Bank of Moldova. In quarter II of 2017, the volume of remittances from abroad amounted to 299.91 million US dollars by 7.4% more compared to the same period of the last year (279.44 mln. USD). This increase in the last two months a positive thing, however it is not sure that this development will be maintained given the family reunification living abroad. The amount is almost a half compared to 2014 when these remitances exceeded 505 million US dollars. In July, the remittances accounted for 105 mln. US dollars, up by 8.4% compared to the same month of the last year. According to the geographical origin of remittances in favour of individuals,the higher volume of remittances from Moldavians working abroad came from Russia, Italy and Israel.
The remittances from CIS held the weight of 36.3%, decreasing by 1.3 p. p. compared to quarter II of 2016. The remittances from EU recorded a weight of 33.7%, up by 1.2 p. p. compared with quarter II of 2016. Respectively, the remittances from other countries, except for CIS and EU amounted to 30% in quarter II, 2017 and 29.9% in quarter II, 2016. The weight of remittances from Israel, USA and Turkey in quarter II of 2017 amounted to 85.8% of the total of other countries. The main partner of Moldova on remittances from CIS remains Russia. The remittances from Russia hold a major weight of 96.4% of total remittances from CIS. The remittances from other CIS countries have the following weights: Ukraine – 1.1%, Kazakhstan – 1.0%, Belarus – 0.6%, Azerbaijan – 0.3%, Uzbekistan – 0.3% and the rest of CIS countries – 0.3%.
-40-30-20-100102030
0100200300400500
Q. I Q. II Q. I Q. II Q. I Q. II Q. I Q. II Q. I Q. II Q. I Q. II Q. I Q. II2011 2012 2013 2014 2015 2016 2017
personal transfers mln. Dollarsgrowth rate compared to the same period of the previous yar

53
Nr. 26 (trim. II) 2017
TENDINŢE ÎN ECONOMIA MOLDOVEI
In the case of remittances from EU, the remittances from Italy had the highest weight, of 36.0%, followed by remittances from Great Britain (14.8%), Germany (13.3%), France (8.3%), Spain (3.4%), Irleland (2.8%), Czech Republic (2.6%), Portugal (2.5%), Romania (2.3%), Belgium (2.2%), Poland (1.9) Cyprus (1.8%) and Greece (1.3%).
Figure 4.4. Structure by main countries of remittances from abroad made in favour of individuals in Q II, 2017, %
Source: According to the data of the National Bank of Moldova. Distribution of remittances by countries, in Q. II, 2017 was allocated as follows: USA – 7.4% (22.24 mln. USD), Great Britain – 5% (14.91 mln. USD), Germany – 4.5% (13.45 mln. USD), France – 2.8% (8.36 mln. USD), Turkey – 1.2% (3.65 mln. USD), Spain – 1.1% (3.42 mln. USD), Portugal – 0.9% (2.56 mln. USD), Czech Republic – 0.9% (2.67 mln. USD), Romania – 0.8% (2.31 mln. USD), Belgium – 0.7% (2.18 mln. USD), United Arab Emirates – 0.6% (1.93 mln. USD), Poland – 0.6% (1.89 mln. USD), Canada – 0.6% (1.77 mln. USD), Cyprus – 0.6% (1.83 mln. USD), Ukraine – 0.4% (1.20 mln. USD) and Kazakhstan – 0.4% (1.12 mln. USD). The remittances in this nineteen countries (including Russia) represent 92.8% of total remittances in the Republic of Moldova (263.93 mln. USD). Foreign trade in goods
In semester I, 2017 the foreign trade in goods increased by 14.5%, compared to the same period of the last year. Thus, the foreign trade in goods amounted to 3209.6 mln. US dollars (by 406.4 mln. USD more). One of the main factors which had an impact on foreign trade was the increase in the volume of agricultural production in 2016. As a result, the exports of goods rose by 13.6% (in nominal terms), and imports by 15%. In absolute value, the exports of goods, during January-June, 2017 amounted to 1028.2 mln. USD, by 122.1 mln. USD more compared to the similar period of 2016. The imports of goods, in semester I of 2017 equated to 2181.4 mln. USD, by 284.3 mln. US dollars more.
0 5 10 15 20 25 30 35
RussiaIsrael
ItalyU.S.A.
Great BritainGermany
FranceTurkey
SpainPortugal
Czech RepublicRomaniaBelgiumCanada
United Arab…Poland
UkraineOther

54
TENDINŢE ÎN ECONOMIA MOLDOVEI
Nr. 26 (trim. II) 2017
Figure 4.5. Trends of external trade in goods, January-June 2010-2017, mln lei Source: According to the data of the National Bureau of Statistics. In semester I, 2017 the considerable gap between the development of exports and imports led to the accumulation of the balance of trade deficit to the tune of 1153.2 mln. USD, by 190.3 mln. USD (+19.8%) higher compared to the same period of 2016. The balance of trade deficit, in June 2017 was by 3.6% lower or by 8 mln. USD compared to the one recorded in May and by 50.5 mln. USD higher (30.2%), compared to June 2016. The balance of trade deficit amounted to 217.7 mln. USD. In the case of trade by groups of countries, the balance of trade with EU countries ended in a deficit of 420.7 mln. USD (in January-June 2016 – 349.3 mln. USD), and with CIS countries - 325.9 mln. USD (in January-June 2016 – 284.9 mln. USD). The degrre of imports coverage by exports in January-June 2017 was 47.1%, compared with 48.5% during the respective period of 2016.
Table 4.2. Dynamics of trade exchanges in S I, 2016-2017, mln. US Dollars
S I 2016
S I 2017
Dynamics 2017/2016
mln. US dollars mln. US dollars % Foreign trade in goods 2803.2 3209.6 14.5 Export 905.5 1028.2 13.6 Including:
EU countries 573.6 652.2 13.7 CIS countries 187.7 216.9 15.6
Other countries 144.2 159.1 10.3 Import 1868.3 2181.4 16.8 Including:
EU countries 922.7 1072.9 16.3 CIS countries 472.5 542.8 14.9
Other countries 473.1 565.4 Balance of trade -991 -1153.2 16.4 Degree of imports coverage by exports 48.5% 47.1%, - Source: According to the data of the National Bureau of Statistics.
-1069.2 -1378.8 -1419 -1457.6 -1374.8 -992.7 -962.9 -1153.2-2000-1500-1000
-5000
50010001500200025003000
Jan.,-Jun.2010
Jan.,-Jun.2011
Jan.,-Jun.2012
Jan.,-Jun.2013
Jan.,-Jun.2014
Jan.,-Jun.2015
Jan.,-Jun.2016
Jan.,-Jun.2017
Export Import Balance of payments

55
Nr. 26 (trim. II) 2017
TENDINŢE ÎN ECONOMIA MOLDOVEI
In semester I of 2017 the exports of goods totaled 1028.8 mln. USD, by 13.6% more compared with semester I of 2016. The exports increased thanks to the demand from the main partner countries which still registered an economic growth (both from CIS and from EU). The exports of goods aimed to EU countries amounted to 652.2 mln. USD, by 13.7% more compared to January-June 2016. The EU countries maintain their position as the largest market for goods from Moldova, with a weight of 63.4% of total deliveries on external markets (63.4% – in January-June 2016). The value of exports of goods aimed to CIS countries equated to 216.9 mln. US dollars, up by 15.6% in relation to January-June 2016. The CIS countries in the exports of Moldova had a weight of 21.1% (20.7% – in January-June 2016).
Figure 4.6. Structure of exports by groups of countries in S I, 2010-2017, % Source: According to the data of the National Bureau of Statistics. Compared with the first semester of 2016, in semester I of 2017 the development of exports by groups of countries shows an increase in exports to: Romania (+16.5%), the Russian Federation (+19.5%), Turkey (+48.5%), Germany (+21.3%), Bulgaria (+31.2%), Spain (by 2.8 times), Ukraine (+28.1%), Austria (+38.5%), Poland (+10.7%), Greece (+34.4%), Belarus (+4.9%), Cyprus (by 3.7 times), Serbia (by 3.1 times), the Netherland (+23.1%), Italy (+2.3%), Georgia (+27.8%), the United Kingdom of Great Britain and Northern Ireland (+2.7%), Belgium (+35.7%), Saudi Arabia (by 4.1 times), United Arab Emirates (by 2.6 times ), Hungary (+41.2%) and Canada (by 1.7 times), which favoured the increase in total exports by 15.1%. At the same time, the deliveries to Iraq (-58.8%), France (-24.1%), Lebanon (-31.9%), Egypt (-95.6%), Switzerland (-10.6%), Indonesia (-7.0%), Jordan (-54.6%) and Israel (-42.1%) have reduced. The analysis in the development of exports by groups of goods in semester I, 2017 compared to the same period of the las year, registered increases on exports of machinery and electrical equipment (+29.0%), oil seeds and oleaginous fruits (+19.1%), fruits and vegetables (+13.8%), medicinal and pharmaceutical products (by 1.6 times), clothing and accessories (+8.3%), alcoholic and non-alcoholic beverages (+7.8%), cereals and cereal preparations (+8.9%), organic chemicals (by 1.6 times), petroleum, fuel and related products (by 2.8 times), milk products and poultry eggs (+43.2%), furniture and its parts (+5.6%), road vehicles (+25.8%), pre-fabricated constructions; other installations and fittings for sanitary, heating and lighting installations (by 2.5 times), yarns, fabrics and textile items (+7.5%), metal minerals and wastes (+41.7%), natural fertilizers and minerals (by 1.7 times), meat and meat products (by 1.9 times), raw and processed tobacco (+31.5%), which contributed to the increase in total exports by 13.7%. At the same time, there were registered decreases in exports of processed rubber (-85.4%), essential oils, aromatic substances (-23.5%), suggar, sugar preparations; honey (-12.4%), livestock (-47.9%), non-metallic mineral products (-14.3%), processed metal products (-10.5%), travel goods; bags and similar (-18.3%).
39.2
24.3
20.7
21.1
49
63.1
63.4
63.4
11.8
12.6
15.9
15.5
0 20 40 60 80 100
Sem. I 2010
Sem. I 2015
Sem. I 2016
Sem. I 2017
CIS countries EU countries Other statis

56
TENDINŢE ÎN ECONOMIA MOLDOVEI
Nr. 26 (trim. II) 2017
The exports of domestic goods amounted to 649.3 mln. US dollars (63.1% of total exports), increasing by 13.6% compared to January-June 2016 which contributed to the increase in total exports by 8.6%. The re-exports of foreign goods totaled 378.9 mln. US dollars (36.9% of total exports), increasing by 13.5% against January-June 2016. The re-exports of goods after processing held 24.5% in total exports and the re-exports of classical goods did not experience essential transformations – 12.4%. The imports of goods from EU countries in semester I of 2017 was increasing by 16.3%, compared to January-June 2016. Thus, the imports of goods from EU countries accounted for 1072.9 mln. USD holding a weight of 49.2% in total imports (49.4% - in January-June 2016). At the same time, the imports of goods from CIS countries were up by 14.9% compared to January-June, 2016. The imports of goods from CIS countries totaled 542.8 mln. US dollars equating to 24.9% in total imports (25.3% – in January-June 2016).
Figure 4.7. Structure of imports by groups of countries in S I, 2010-2017, % Source: According to the data of the National Bureau of Statistics. The analysis of imports by countries in January-June 2017, compared to the similar period of 2016 reveals the increase in imports from Romania (+24.1%), Ukraine (+31.1%), China (+29.9%), Germany (+15.6%), Italy (+12.5%), Poland (+22.7%), Turkey (+8.5%), the Russian Federation (+3.8%), the United States of America (+29.3%), France (+17.5%), Hungary (+21.0%), Belarus (+17.1%), Viet Nam (by 1.9 times), Bulgaria (+16.8%), Czech Republic (+15.5%), Spain (+13.7%), Switzerland (+27.5%), the Netherland (+15.1%), Slovakia (+37.9%), Macedonia (by 1.9 times), India (+17.8%), Slovenia (+27.4%) and Bangladesh (by 1.7 times), which favoured the increase in total imports by 16.4%. At the same time, the deliveries from Israel (-33.9%) and the United Kingdom of Great Britain and Northern Ireland (-7.2%) have declined. The structure of imports by groups of goods, in semester I, 2017 compared to the same period of 2016 have registered growths in: petroleum, fuel and related products (+31.2%), electricity (by 137.6 times), medicinal and pharmaceutical products (+37.7%), machinery and electrical equipment (+17.9%), telecommunication appliances and equipments (+48.8%), industrial machinery and appliances with general applications (+26.0%), clothing and accessories (+29.6%), road vehicles (+13.6%), specialized machinery and appliances for specific industries (+22.6%), suggar, suggar preparations; honey (by 1.9 times), footwear (by 1.8 times), non-ferrous metals (+33.7%), milk products and poultry eggs (+39.2%), travel goods; bags and similar (by 4.1times), processed metal items (+12.1%), yarns, fabrics and textile items (+5.0%), non-metallic mineral products (+13.8%), coal, briquettes (by 3.0 times), mineral or chemical fertilizers (+21.5%), processed plastics (+14.7%), meat and meat products (+40.3%), professional, scientific and control apparatus and appliances (+23.4%), furniture and its parts (+18.8%), wood products
0% 20% 40% 60% 80% 100%
Sem. I 2010
Sem. I 2015
Sem. I 2016
Sem. I 2017
32.1
25.5
25.3
24.9
44.2
48.5
49.4
49.2
23.7
26
25.3
25.9CIS countries EU countries Other statis
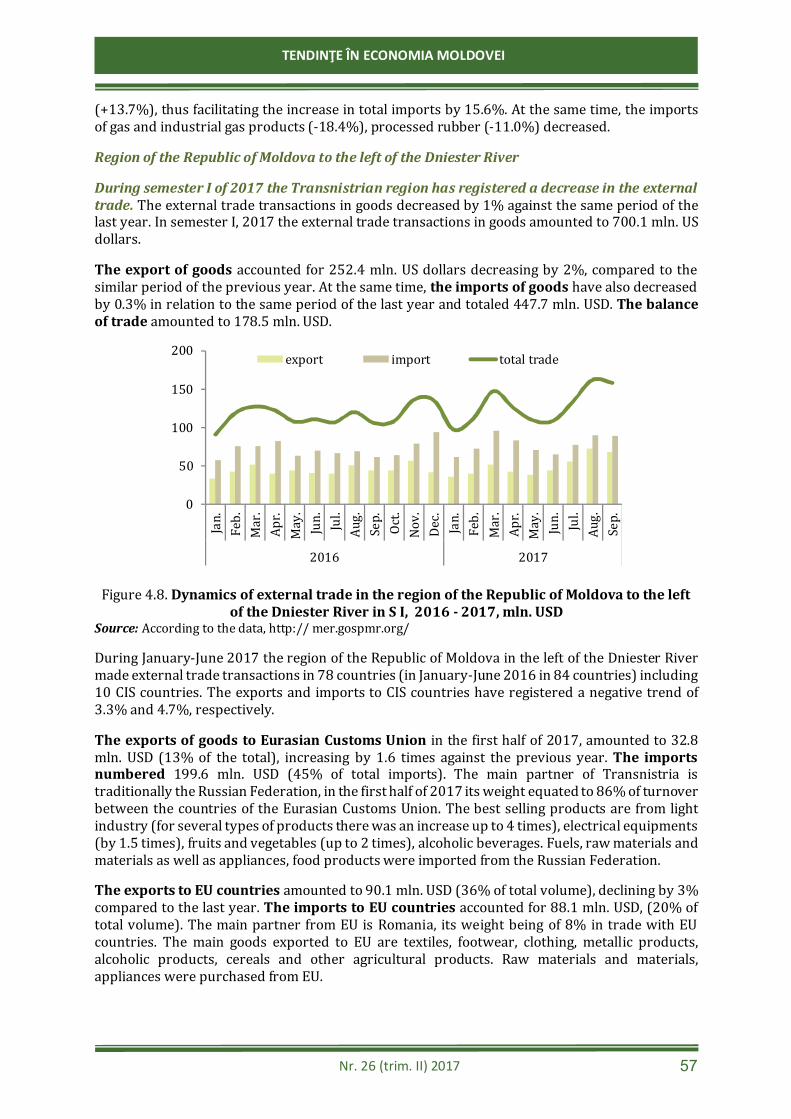
57
Nr. 26 (trim. II) 2017
TENDINŢE ÎN ECONOMIA MOLDOVEI
(+13.7%), thus facilitating the increase in total imports by 15.6%. At the same time, the imports of gas and industrial gas products (-18.4%), processed rubber (-11.0%) decreased. Region of the Republic of Moldova to the left of the Dniester River
During semester I of 2017 the Transnistrian region has registered a decrease in the external trade. The external trade transactions in goods decreased by 1% against the same period of the last year. In semester I, 2017 the external trade transactions in goods amounted to 700.1 mln. US dollars. The export of goods accounted for 252.4 mln. US dollars decreasing by 2%, compared to the similar period of the previous year. At the same time, the imports of goods have also decreased by 0.3% in relation to the same period of the last year and totaled 447.7 mln. USD. The balance of trade amounted to 178.5 mln. USD.
Figure 4.8. Dynamics of external trade in the region of the Republic of Moldova to the left of the Dniester River in S I, 2016 - 2017, mln. USD
Source: According to the data, http:// mer.gospmr.org/ During January-June 2017 the region of the Republic of Moldova in the left of the Dniester River made external trade transactions in 78 countries (in January-June 2016 in 84 countries) including 10 CIS countries. The exports and imports to CIS countries have registered a negative trend of 3.3% and 4.7%, respectively. The exports of goods to Eurasian Customs Union in the first half of 2017, amounted to 32.8 mln. USD (13% of the total), increasing by 1.6 times against the previous year. The imports numbered 199.6 mln. USD (45% of total imports). The main partner of Transnistria is traditionally the Russian Federation, in the first half of 2017 its weight equated to 86% of turnover between the countries of the Eurasian Customs Union. The best selling products are from light industry (for several types of products there was an increase up to 4 times), electrical equipments (by 1.5 times), fruits and vegetables (up to 2 times), alcoholic beverages. Fuels, raw materials and materials as well as appliances, food products were imported from the Russian Federation. The exports to EU countries amounted to 90.1 mln. USD (36% of total volume), declining by 3% compared to the last year. The imports to EU countries accounted for 88.1 mln. USD, (20% of total volume). The main partner from EU is Romania, its weight being of 8% in trade with EU countries. The main goods exported to EU are textiles, footwear, clothing, metallic products, alcoholic products, cereals and other agricultural products. Raw materials and materials, appliances were purchased from EU.
0
50
100
150
200
Jan.
Feb.
Mar.
Apr.
May. Jun
.Jul
.Au
g.Se
p. Oct.
Nov.
Dec. Jan.
Feb.
Mar.
Apr.
May. Jun
.Jul
.Au
g.Se
p.
2016 2017
export import total trade

58
TENDINŢE ÎN ECONOMIA MOLDOVEI
Nr. 26 (trim. II) 2017
The exports to other countries amounted to 129.4 mln. USD, 58% of total exports of which 88.1 million US dollars in the Republic of Moldova and the imports to other countries were 49.2 mln. USD.
Figure 4.9. Dynamics of external trade in the region of the Republic of Moldova to the left of the Dniester River by main groups of countries during the period January-July, 2016 –
2017, mln.USD Source: According to the data, http://customs.gospmr.org/category/c69-statistika-vyed
0 100 200 300 400 500 600 700
export
import
export
importSe
m. I 2
016
Sem.
I 201
7
EU Customs Union Other countries

59
Nr. 26 (trim. II) 2017
TENDINŢE ÎN ECONOMIA MOLDOVEI
Chapter V BUSINESS ENVIRONMENT
Dynamics of registered and deregistered enterprises in semester I, 2017.
On July 1, 2017 the State Register had informations about 170.596 legal entities and individual entrepreneurs according to the data of the State Registration Chamber
Figure 5.1. Dynamics in the number of registered and deregistered enterprises in semester I 2010-2017, unit.
Source: According to the data of the State Registration Chamber. In S I, 2017 the number of enterprises registered by the State Registration Chamber increased by 8.2% sply. In S I, 2017 3192 new enterprises were recorded in the State Register according to the State Registration Chamber. Simultaneously, in S I, 2017 the number of deregistered enterprises marked the highest growth compared to the similar period of 2011-2016. Thus, in S I, 2017 the number of enterprises deregistered from the State Register increased by 85.9% sply amounting to 4166 enterprises. Table 5.1. Growth indices in the number of registered and deregistered enterprises in S I
2011-2017 compared to the same period of the previous year, %
Period Enterprises registration Enterprises deregistration Semester I 2011 108.9 115.0 Semester I 2012 91.5 91.5 Semester I 2013 101.5 84.9 Semester I 2014 97.7 99.1 Semester I 2015 95.5 117.4 Semester I 2016 95.7 140.8 Semester I 2017 108.2 185.9 Source: Author’s calculations according to the data of the State Registration Chamber. In S I of 2011 – 2017 there is seen a decreasing trend in the number of registered enterprises (excepting S I 2011, S I 2013, S I 2017, when a slight increase was recorded sply). In S I, 2017 this indicator has reduced up to 3192 registrations declining by 10% compared to semester I, 2011 when 3560 registrations across the country were recorded.
3269
3560
3256 33063230 3084 2950
3192
15321762
16121368 1356
1592
2241
4166
0
500
1000
1500
2000
2500
3000
3500
4000
4500
S I 2010 S I 2011 S I 2012 S I 2013 S I 2014 S I 2015 S I 2016 S I 2017
Registered enterprises Deregistered enterprises

60
TENDINŢE ÎN ECONOMIA MOLDOVEI
Nr. 26 (trim. II) 2017
Figure 5.2. Dynamics in the net number of enterprises registered in the State Register
in S I 2011-2016 Source: Author’s calculations according to the data of the State Registration Chamber. On the other part, a negative thing is the increase in the number of enterprises deregistered from the State Register. Thus, if in S I, 2011 1762 enterprises were deregistered from the State Register, in the first half of 2017 their number reached 4166 enterprises, growing by 2.3 times.
At the same time, in S I 2011-2016 there is noticed a negative trend in the net number of created enterprises, their number decreasing during the analyzed period by 61% (excepting for the first half of 2011 and 2013, which marked an increase in the net number of new enterprises sply, by a growth trend of 3.5%, 17.9%, respectively). In S I of 2017, the net number of new enterprises has also marked a negative value representing that the number of deregistered enterprises during this period exceeded considerably the number of registered enterprises.
Business development indicators in the region to the left of the Dniester River
During January-June 2017 in the region to the left of the Dniester River 48.0% of organizations and enterprises achieved profit amounting to 108 organizations, declining by 9.2% compared to the previous year and 50.7%, respectively have recorded losses (except for small enterprises, banks, public and insurance organizations). Among the organizations which in semester I, 2017 achieved profit, the housing and utility services household (66.7%), trade and food service (57.4%), transport (57.1%) hold the highest weight. In terms of value, as in the same period of the previous year, most enterprises have recorded a net loss (excepting transport, trade and food service enterprises, housing and utility services household).
Table 5.2. Data on net profit (loss) of organizations from the left bank of the Dniester River by types of activity in January-June, 2017
Organizations achieving profit
In % of total
number
Organizations recording loss
In % of total number
Net profit (net loss), thousand
RUB. A 1 2 3 4 5
Total 108 48.0 114 50.7 -256.261 including: Industry 25 37.9 41 62.1 -223.870 Agriculture 10 47.6 10 47.6 -93.004 Transport 16 57.1 12 42.9 17.887 Communications 4 44.4 5 55.6 -8.425
3.5
-8.6
17.9
-3.3-20.4
-52.5
1798
709
0
500
1000
1500
2000
2500
-60,0-50,0-40,0-30,0-20,0-10,0
0,010,020,030,0
S I 2011 S I 2012 S I 2013 S I 2014 S I 2015 S I 2016
Growth rate of new net created enterprises, %Net new created enterprises, un.

61
Nr. 26 (trim. II) 2017
TENDINŢE ÎN ECONOMIA MOLDOVEI
Table 5.2 – continue A 1 2 3 4 5
Constructions 1 11.1 8 88.9 -6.671 Trade and food service 31 57.4 22 40.7 122.184 Housing and utility services household 10 66.7 4 26.7 6.028 Other branches 4 40.0 6 60.0 -23.511 Sursa: Press-edition ”Financial activity of Organizations for January-June 2017” (except for small enterprises, banks, public and insurance organizations).

62
TENDINŢE ÎN ECONOMIA MOLDOVEI
Nr. 26 (trim. II) 2017
Chapter VI SOCIAL SECTOR
Demographic situation In quarter II of 2017, the values of several indicators of natural movement, such as: number of live births, deaths, marriages, divorces have reduced. The decrease in the number of live births was higher compared to the decrease in the number of deaths. The decrement in the number of divorces was also higher compared to the decline in the number of marriages. In quarter II of 2017, the total number of live births in the country amounted to 16868 pers., declining by 7.6% compared to the same period of the previous year, the birth rate was 9.5 live births per 1000 inhabitants, down by 0.8 p.p. sply compared to the data of the NBS. The number of deaths accounted for 19775 pers., recording a decrease of 1.9% sply and mortality rate reached 11.2 deaths per 1000 inhabitants, down by 0.2 p.p. sply. The number of deaths of children aged under 1 year, in quarter II of 2017 amounted to 174 cases reducing by 5 cases compared to the similar period of the last year. The natural increase in quarter II, 2017 numbered -2907 persons (-1902 persons in the same quarter of the previous year) or -1.6 persons per 1000 inhabitants (-1.1 persons per 1000 inhabitants in the similar quarter of the last year). The natural decrease for quarter II became the most pronounced in the last 7 years. The total number of marriages in the country, in Q II of 2017 amounted to 8060, declining by 6.9% against the same period of the last year and marriage rate equated to 4.6 marriages per 1000 inhabitants reducing by 0.3 p.p. sply. In the case of divorces in the country, this indicator reached 4980, declining by 10.7% compared to the same period of the previous year. The divorce rate amounted to 2.8 divorces per 1000 inhabitants, by 0.4 p.p. less sply.
Figure 6.1. Natural movement of population in quarter II in 2010-2017 Source: According to the data of the National Bureau of Statistics. In Q II, 2017 the population aged 15 and over working or seeking a job abroad amounted to 314.8 thousand pers., by 0.6 thousand pers. or by 0.2% less compared to the same period of the previous year. The men hold the major weight (67.6%). Most of these immigrants are from rural area
1996
1
1860
2
1899
3
1778
3
1825
0
1852
3
1825
8
1686
8
2348
3
2120
5
2084
6
1993
6
2054
8
2104
9
2016
0
1977
5
-2.0-1.5
-1.0-1.2
-1.4 -1.4 -1.1-1.6
-2,5
-2,0
-1,5
-1,0
-0,5
0,0
0,5
1,0
0
5000
10000
15000
20000
25000
QII 2010 QII 2011 QII 2012 QII 2013 QII 2014 QII 2015 QII 2016 QII 2017
PromillesPe
rson
s
Live briths, persons Deceased, persons Natural growth

63
Nr. 26 (trim. II) 2017
TENDINŢE ÎN ECONOMIA MOLDOVEI
(70.1%). Among men prevail the immigrants aged between 25 and 34 years (40.7%), 18.9% – between 15 and 24 years, 21.8% – between 35 and 44 years. Among women, 27.5% of these are between 25 and 34 years, 28.1% – between 35 and 44 years and 14.3% – between 15 and 24 years. Labor market
In Q II of 2017, the indicators on economic activity of labor such as economically active population, employed population, activity rate, number of unemployed and unemployment rate have reduced compared to the similar period of the previous year. The NEET group had a weight of 28.2% of population aged 15-29 years. People who do not want to work amount to 79.7% of inactive population (aged 15 and over), which is 55.9% of total population of this age group.
In quarter II of 2017 the economically active population amounted to 1316.0 thousand pers., reducing by 3.4% or by 46.9 thousand pers., compared to the same quarter of the previous year. At the same time, the activity rate of population was 44.1% reducing by 1.6 p.p. sply. Among economically active population there were not registered any significant discrepancies between men (51.6%) and women (48.4%), while in terms of area there are disparities, the activity rate being higher in rural area (55.8%), compared to urban one (44.2%). In the age group of 15-29 years, the weight of economically active population accounted for 31.1%, and in the group of 15-64 years – 48.8%. The economically activity rate of working age population (according to national legislation: 16-56 years – women and 16-61 years – men) numbered 51.3%. Employed population amounted to 1270.3 thousand pers, in Q II, 2017 declining by 2.9% sply. As in the case of economically active population there were no discrepancies by gender – men – 51.4% and women – 48.6%. The weight of employed population in urban area was lower in relation to rural area: in urban areas – 43.5%, in rural areas – 56.5%. The employment rate of population aged 15 and over reached over 42.6%, declining slightly compared to the level of the same period, last year (43.8%). It was higher for men – 46.3% against women (39.2%). By distribution of residence area, the employment rate was – 42.9% in rural area exceeding slightly that in urban area – 42.2%. The employment rate of working age population (16-56/61 years) amounted to 49.3%, of people aged 15-64 years – 47.1%, and age group of 15-29 was 29.2%.
Figure 6.2. Dynamics of activity, employment and unemployment rates of population aged
15 and over in quarter II in 2010-2017 Source: According to the data of the National Bureau of Statistics.
1255
.1
1246
.1
1209
.3
1227
.6
1280
.1
1284
.0
1307
.9
1270
.3
94.5 82.657.6 60.8 48.5 55.1 55.0 45.7
42.3 41.9 40.5 41.1 42.8 43.0 43.8 42.6
7.0 6.2 4.5 4.7 3.7 4.1 4.0 3.5 0
15
30
45
60
600,0
800,0
1000,0
1200,0
1400,0
1600,0
Q II 2010 Q II 2011 Q II 2012 Q II 2013 Q II 2014 Q II 2015 Q II 2016 Q II 2017
%
thous
and p
erson
s
Number of unemployed (according ILO), thousand personsEmployed population, thousand personsRate of employment of population aged 15 and over, %Rate of unemployment (according ILO), %
64
TENDINŢE ÎN ECONOMIA MOLDOVEI
Nr. 26 (trim. II) 2017
The number of unemployed, amounted to 45.7 thousand pers., by 16.9% lower sply (55.0 thousand) according to the International Labour Office. The unemployment was higher among men – 56.0% of total unemployed as well as among people in urban areas – 63.6%. The unemployment rate across the country in quarter II of 2017 was 3.5%, declining by only 0.5 p.p. sply (4.0%). The unemployment rate for men accounted for 3.8%, and for women – 3.2%. There were descrepancies in the unemplyment rate between urban and rural areas (5.0% and 2.3%, respectively). Among young people (15-24 years) the unemployment rate was 10.1%, and in the age group of 15-29 years 6.2%. The inactive population in the country (aged 15 and over) in Q II, 2017 amounted to 1667.9 thousand pers., forming 55.9% of total population of this age reducing by only 1.5 p.p. sply. Inactive population includes: - people who don’t want to work (1329.2 thousand pers. or 79.7% of inactive population), of them:
a) pensioners (596.8 thousand pers. or 44.9% of people who don’t want to work); b) people who don’t want to work because study or learn (252.3 thousand pers.
or 19.0% of people who don’t want to work); c) persons who don’t want to work for an income because they take care of family (214.9
thousand pers. or 16.2% of people who don’t want to work); d) people who live in the country but don’t want to work in Moldova because they have already
a (permanent or seasonal) job abroad or people who plan to work abroad (211.4 thousand pers. or 15.9% of people who don’t want to work);
- people announced by households as working or seeking a job abroad (314.8 thousand pers. or 18.9% of inactive population);
- discouraged persons to find a job in the country (6.8 thousand pers. or 0.4% of inactive population).
The NEET group consists of young people aged 15-29 years who are not in Education, Employment or Training. In Q II of 2017, this group held a weight of 28.2% of population aged 15-29 years (excepted the population working or seeking a job abroad). Remuneration of labor
Quarter II of 2017 is characterized by a growth both in average monthly nominal salary (5636.7 MDL) by 13.2 and in average monthly real one – by 5.7% % against the same quarter of the the previous year. In the public sector, the average monthly salary (4924.2 MDL) increased by 13.2% sply, in a greater measure than the average monthly salary in the real sector (5924.7 MDL), which grew up by 13.0% sply. The highest paying types of economic activities are: Information and communications, Financial and Insurance activities and Production and supply of electricity, heat energy, gas, hot water and conditioned air.
In the second quarter of 2017, the gross average monthly nominal salary amounted to 5636.7 MDL, increasing by 13.2% against Q II of 2016. The real salary index for quarter II of 2017 against Q II of 2016 (calculated as ratio between the gross nominal salary index and consumer price index) accounted for 105.7%, up by 5.7% compared to the level of quarter II, last year. In quarter II of 2017 the average monthly salary in public sector was 4924.2 MDL (more by 13.2% compared to Q II of 2016), in real sector – 5924.7 MDL (more by 13.0% compared to Q II of 2016). According to the types of economic activities, the highest average monthly salary in Q II, 2017 has been registered in: Information and communications – 12553.8 MDL (222.7% of average salary),

65
Nr. 26 (trim. II) 2017
TENDINŢE ÎN ECONOMIA MOLDOVEI
Financial and Insurance activities – 10503.2 MDL (186.3%), Production and supply of electricity, heat energy, gas, hot water and conditioned air – 9981.9 MDL (177.1%). In Q II of 2017 the lowest salaries were found in the following economic activities: Art, leisure and recreation activities – 3307.2 MDL (58.7% of the average salary), Agriculture, forestry and fishing – 3554.6 MDL (63.1%) and Accommodation and food service activities – 3680.1 MDL (65.3%). In Q II of 2017, the disposable revenues of population amounted to 2227.6 MDL on average per capita monthly increasing by 9.8% sply. In real terms, the revenues of population have registered an increase of 2.5%. The most important sources of revenues remain to be: salaries (43.2%), social benefits (22.0%) and remittances from abroad (17.7%).
In quarter II of 2017, the disposable revenues of population averaged out at 2227.6 MDL per capita monthly, by 9.8% more sply. In the second quarter of 2017, in real terms the revenues of population adjusted to the consumer price index have recorded a growth of 2.5%. The contribution of salaries in the revenues structure of population still remains the most important financial source. The revenues from salaries represent 43.2% of total disposable revenues, their weight being down by 2.1 p.p. compared to quarter II of 2016. The social benefits are the second signifiant source of revenues of Moldavians amounting to 22.0%, growing by only 0.6 p.p. sply. The self-employment activities with a weight of 13.8% of the average monthly revenues per capita of which from agricultural individual activities – 7.3%, and from non-agricultural individual activity – 6.5% have also contributed to the formation of revenues. Another important source for the household budget are the remittances from abroad. These represent 17.7% of total revenues or by 0.5 p.p. less sply. The revenues of population from urban area were on average by 651.1 MDL higher or by 1.3 times higher than the ones from rural area. For the population in urban area, the main sources of revenues are the salaries which ensured the revenues of population in the ratio of 55% (increasing by 3.3 p.p. sply) and social benefits – 19.7% (decreasing by 1.3 p.p. sply). The revenues of population in rural area are generated on the basis of salaries in the ratio of 31.1%, and their contribution is by 1.8 times lower than in urban area. At the same time, the revenues from agricultural individual activity had a weight of 13.8% of total disposable revenues.
Box 6.1. Rise in salaries of teaching and teaching-scientific staff in state educational institutions
Since September 1, 2017 the salaries of teaching and teaching-scientific staff in state educational institutions have increased by 5,3%. The Ministry of Labour, Social Protection and Family of the Republic of Moldova drew up the draft law on the salary system in the public sector according to which the average salary in education is equal to the average one of 5300 MDL for 2017. Following these increases, the salaries of teaching and teaching-scientific staff in state educational institutions are as follow:
− Rector – 5977 MDL, − University Professor – 4485 MDL, − Associate Professor – 4035 MDL, − Senior Lecturer – 3734 MDL, − Assistant Lecturer, trainer, master – 3289 MDL, − Highly-qualified teacher and schoolmaster in universal and vocational education – 3289 MDL,
and for the secondary specialized-qualified ones – 2688 MDL, − Teaching staff in vocational education, except for highly-qualified teachers with higher education
– 2983 MDL, secondary specialized-qualified ones – 2688 MDL.
According to the National Bureau of Statistics of the Republic of Moldova, the average monthly salary forecast for the current year amounts to 5600 de MDL. Source: https://monitorul.fisc.md/editorial/salariile-profesorilor-vor-crete-cu-113.html

66
TENDINŢE ÎN ECONOMIA MOLDOVEI
Nr. 26 (trim. II) 2017
Figure 6.3. Dynamics of disposable revenues of population, nominal value and growth
rates by quarters, Q I 2013 – Q II 2017 Source: According to the data of the National Bureau of Statistics. The revenues of population in rural area depend to a greater extent on the social benefits and remittances from abroad in relation to revenues of population in urban area. Thus, the social benefits in villages are in the ratio of 24.3%, while in urban areas their weight was of 19.7%, and remittances from abroad in villages hold a weight of 23.3%, while in cities this weight accounts for 12.2%. The average monthly consumption expenditures of population in Q II of 2017, amounted to 2245.3 MDL per capita increasing by 8.0% compared to Q II, 2016. In real terms adjusted to the consumer price index, the expenditures of the population increased on average by 0.8% sply. The largest part of expenditures continues to be directed towards: food consumption (44.3%), housing maintenance (18.4%) and clothing and footwear (10.4%).
The average monthly consumption expenditures of population in Q II of 2017 amounted to 2245.3 MDL per capita increasing by 8.0% sply. In real terms (ajusted to the consumer price index), the expenditures of population increased on average by 0.8% sply. In Q II of 2017, the food consumption is the highest part of expenditures – 44.3% (43.4% in Q II of 2016). The housing maintenance expenditures had a weight of 18.4% of total consumption expenditures on average per capita (18.5% in Q II, 2016). The clothing and footwear expenditures accounted for 10.4% (10.7% sply), for health services – 5.5% (5.8% sply), for communications - 4.5%, transport – 3.9%, housing facilities – 3.8%, education - 0.5%, etc. The monthly consumption expenditures of population in urban area equated to 2626.9 MDL on average per capita, by 672.9 MDL or by 1.3 times more as in rural area. The population in urban area directed 41.9% of monthly consumption expenditures (41.2% in Q II of 2016) towards food consumption, and in rural area – 46.87% (45.9% in Q II of 2016). At the same time, the urban population spent more for housing maintenance – 19.2% versus 17.6% in rural area, for communications – 4.7% versus 4.4%, for transport – 4.2% versus 3.5%, for hotels, cafes and restaurants – 2.2% versus 0.7%, leisure services – 2.0% versus 0.4%. The rural population spent more for clothing, footwear – 10.5% in comparison with 10.2% in urban area, for health services – 6.0% (against 5.0% in urban area) and for housing facilities – 4.5% versus 3.2%.
1559
.816
67.2
1755
.517
43.0
1650
.017
56.1
1787
.418
77.8
1854
.019
97.2
1978
.319
99.4
2026
.820
30.4
2080
.520
60.2
2134
.522
27.6
3.1 5.612.1 5.6
0.4 0.2 -3.12.8 5.8 5.3
-3.1 0.9 -1.51.7
-1.00.9 2.5
8.5 9.816.6
10.95.8 5.3 1.8
7.7 12.313.712.210.7 9.3
-5.8
5.2 5.3 5.3 9.8
-80-70-60-50-40-30-20-10010
0
500
1000
1500
2000
2500
3000
3500
4000 %M
DL
Nominal value of average monthly revenue/person, MDLThe growth rate of monthly real incomes of the population,%, compared to s.p.l.y.The growth rate of monthly nominal incomes of the population,%, compared to s.p.l.y.

67
Nr. 26 (trim. II) 2017
TENDINŢE ÎN ECONOMIA MOLDOVEI
Box 6.2. Increase of tariffs on heat energy for final consumers from Chisinau and Balti
As of March 24, 2017 in the Official Journal has been published the Decision of the National Energy Regulatory Agency No. 109 of March 17, 2017 on tariffs on heat energy delivered to consumers by S.A. „Termoelectrica” for final consumers from Chisinau and Balti connected with „Termoelectrica” and „CET-Nord” system. This new heat tariff for S.A. „Termoelectrica” consumers which became effective on May 1, 2017 will be applied since the following heating season. The new tariff on heat energy delivered to S.A. „Termoelectrica” consumers has been approved in the amount of 1122 MDL per Gcal (without VAT) and increased by 5%, compared with the previous tariff which accounted for 1068,22 MDL per 1 Gcal according to the decision of Managing Board of the National Energy Regulatory Agency. At the same time, the new tariff on heat energy delivered to S.A. „CET-Nord” consumers will be 1220 MDL per 1 Gcal (without VAT) and will increase by 15,5% (from 1 056 MDL per Gcal). Source: http://lex.justice.md/viewdoc.php?action=view&view=doc&id=369581&lang=1
Figure 6.4. Dynamics of consumer expenditures, nominal value and growth rates by
quarters, Q I 2013 – Q II 2017 Source: According to the data of the National Bureau of Statistics.
Social protection of population. According to the data of the National House of Social Insurance, the number of pensioners registered to the social protection bodies as of July 1, 2017 amounted to 712.5 thousand pers. or by 28.8 thousand pers. more compared to July 1, 2016. On July 1, 2017 the monthly average pension amounted to 1484.72 MDL, up by 16.1% against July 1, 2016.
1656
.117
62.0
1888
.017
98.5
1733
.718
07.9
1832
.018
93.7
1913
.320
75.9
2132
.720
72.9
2058
.520
79.6
2200
.121
16.8
2091
.022
45.3
9.6 11.3 12.610.74.7 2.6 -3.0
5.310.3 14.816.712.8
7.60.2 3.2 3.3 1.6
8.0
4.2 7.1 8.3 5.5-0.7 -2.4 -7.6
0.5 4.0 6.3 5.0 2.8-3.1 -7.2 -1.3 -2.9 -2.6 0.8
-90,0
-70,0
-50,0
-30,0
-10,0
10,0
0
500
1000
1500
2000
2500
3000
3500
4000
Q I 20
13Q I
I 201
3Q I
II 201
3Q I
V 201
3Q I
2014
Q II 2
014
Q III 2
014
Q IV 2
014
Q I 20
15Q I
I 201
5Q I
II 201
5Q I
V 201
5Q I
2016
Q II 2
016
Q III 2
016
Q IV 2
016
Q I 20
17Q I
I 201
7
%M
DL
Nominal value of average monthly consumer expenditures/person, MDLRate of growth of nominal monthly consumer expenditures, %, compared to s.p.l.y.Rate of growth of real monthly consumer expenditures, %, compared to s.p.l.y.

68
TENDINŢE ÎN ECONOMIA MOLDOVEI
Nr. 26 (trim. II) 2017
Box 6.3. Dynamics of average amount of pension for retirement age
In the above-mentioned graph there can be noticed that the growth rate in the amount of average pension for retirement age has continuously increased since July 1, 2014 reaching 1425,85 MDL on July 1, 2017 with the growth rate of 9,1% in comparison with the similar period of the previous year. As it can be noticed in the graph, the increase in the pension for retirement age due to the valorization of the insured income is not significant as it was foreseen according to the pension reform. This is due to the fact that the valorization took place only for pensions set during 2001-2008, only for 68014 pensioners, i.e. about 12,8% of the number of pensioners for retirement age (532039 persons (until indexing) on April 1, 2017). According to the NHSI information, the amount of pension for retirement age increased on average by 131,69 MDL. The number of pensioners for retirement age who achieved a higher increase amounted to 22135 persons or about 32,5% of total number of pensioners for retirement age, their pensions being subject to valorization (68014 persons). The amount of valorization varies according to the achieved income and the period it was made. For example, the pension for retirement age which was set in 2005 has increased on average by 105,54 MDL following valorization and the pension set in 2008 grew up by 193,39 MDL. Source: http://www.cnas.md/libview.php?l=ro&idc=360&id=4393&t=/Mass-media/Noutati/Pensiile-pentru-83358-de-persoane-au-fost-valorizate http://www.cnas.md/lib.php?l=ro&idc=244&t=/Statistica/
987,31 1052,521200,21
1307,251425,856,6
6,0
7,6
8,9 9,1
0
500
1000
1500
2000
0123456789
10
01 july2012
01 july2013
01 july2014
01 july2015
01 july2016
01 july2017
The average pension for age limit, M
DLG
row
th r
ate
com
pare
d to
the
prev
ious
yea
r, %
The average pension for age limit, MDLGrowth rate compared to the previous year, %
Subsistence minimum. In semester I, 2017 the average monthly subsistence minimum amounted to 1866.3 MDL per person, increasing by 2.9% sply. In case of cities it accounted for 2015.6 MDL, by 2.2% more sply. The subsistence minimum was 1836.7 MDL in towns, by 4.5% more sply. In villages it equated to 1809.9 MDL, by 2.4% more sply. The co-ratio between the average monthly salary and subsistence minimum for working age population in semester I of 2017 was 2.7 times compared to 2.5 times sply.

69
Nr. 26 (trim. II) 2017
TENDINŢE ÎN ECONOMIA MOLDOVEI
Social development of the region to the left bank of the Dniester River5
Demographic situation. In the second quarter of 2017, the natural decrease of population amounted to 1338 pers., increasing by 5.4% compared to the same period of the previous year. During January-June, 2017 2164 live births were registered representing 96.2% sply, and the number of deaths reached 3502 pers., representing 99.5% sply. During January-June of 2017, the number of deaths caused by coronary heart diseases increased by 3.4%, from neoplasmas (tumours) – by 1.7%, while the deaths caused by poisions, lesions and murders decreased by 8.6%, from vascular brain lesions – by 6.2%, from digestive diseases – by 1.3%, sply. The infant mortality rate of children under the age of 1 year for January-June, 2017 amounted to 19 pers., by 26.7% more compared to January-June, 2016. The main causes are: − Conditions from perinatal period - 10 cases; − Congenital abnormalities - 8 cases.
Migration increase of population in January-June, 2017 taking into account internal and external migration reached 94 pers., while during the same period of the last year there took place a decrease of 818 pers. During January-June 2017, 3996 pers. (out of the region – 1738 pers.) arrived, representing 156.6% of total number of arrivals during the same period of the previous year, of them children under 16 years - 893 pers., or 22.3% of total number of arrivals. 3902 pers (out of the region – 1272 pers.) left or 115.8% of those who left during January-June, 2016 including children under 16 years - 646 pers. or 16.6% of total number of departures. Of total number of arrivals in the region – 49.5% are men (1978 pers.), the weight of total number of men who had left the region is 49.9% (1946 pers.). In January-June, 2017 2650 pers. arrived in urban areas and 2750 left, which is - 157.9% and 114.2%, respectively compared to January-June, 2016. 1324 pers. arrived from abroad and 1004 pers. left the region. 1346 pers. arrived in rural area and 1152 pers. left the region representing 154.0%, 119.8% respectively compared to January-June, 2016. 414 pers. arrived out of the region and 268 pers. left the region. The number of registered marriages amounted to 1095, decreasing by 2.5% compared to quarter II of 2016. The number of divorces reached 887, increasing by 6.5% compared to the same period of the last year.
5 The analysis was conducted based on the Statistical Service of Transnistria.
Box 6.4. Increase of retirement age and contribution
According to the amendments made in the Law on the public pension system no. 156-XIV as of October 14, 1998, the increase of the gradual retirement age and contribution both for men and for women became effective since July 1, 2017. According to the National House of Social Insurance of the Republic of Moldova, the standard retirement age of 63 years for men will be reached on July 1, 2019 and for women – on July 1, 2028. The reach of these ages will be made through the annual increase of the standard retirement age for men with 4 months and for women with 6 months. Thus, the retirement contribution for men and women will be equal to 34 years. It will be set since July 1, 2018 for men and since July 1, 2024 – for women. Source: http://www.cnas.md/libview.php?l=ro&idc=360&id=4392&t=/Mass-media/Noutati/De-la-1-iulie-incepe-majorarea-treptata-a-varstei-de-pensionare-si-a-stagiului-de-cotizare

70
TENDINŢE ÎN ECONOMIA MOLDOVEI
Nr. 26 (trim. II) 2017
Labor market. The number of employees in the organizations of all economic sectors (except for small enterprises, religious and non-profit organizations, security structures and customs authorities) on July 1, 2017 amounted to 96.9 thousand pers., decreasing by 1404 pers. or by 1.4% compared to the same period of the previous year. Since the beginning of 2017, the number of citizens registered to the employment agencies numbered 8209 , of them 492 – to newly created jobs. The procent of substitution of retired employees with new staff was 98.7%. During January-June, 2017, 8318 persons layed off from institutions and organizations representing 8.6% of the number of employees since the beginning of the year. The main reason of dismissal is worker’s own motion, 6924 pers. (83.2%) sit on this category. According to the Social Insurance Fund of Transnistria, at the end of June, 2017, the number of citizens officially registered as unemployed amouned to 6879 pers., by 49.8% more against the end of June, 2016. 3393 pers. or 49.3% are women of total number of registered citizens. During January-June 2017, through the Transnistrian Agency for Employment 7169 pers. were recorded as unemployed, of them 3372 pers. are women (47% of total number of registered citizens). In January-June of 2017, 11413.2 thousand rubles were spent for payment of unemplyment benefits. 5887 pers. received unemployment benefits, the average amount of unemployment benefits accounted for 417.1 rubles or 31.4% per capita of the average subsistence minimum budget. Remuneration of labor. During January-June, 2017, the average monthly nominal salary calculated for an employee in the region (except small enterprises and religious and non-profit organizations, law enforcement agencies and customs authorities) amounted to 3845 rubles6, which is 101.3% compared to January-June, 2016. The average salary at public organizations amounted to 2716 rubles, increasing by 0.8% against the same period of last year. In January-June, 2017 the highest average monthly nominal salaries were in the following economic branches: „Electrical– and radio-communication” (9645 rubles or 832 US dollars), „Banks and credits” (6736 rubles or 581 US dollars), „Insurances” (6577 rubles or 567 US dollars), „Information and computer services” (5228 rubles or 451 US dollars), „Industry” (5079 rubles or 438 US dollars). At the same time, the lowest average monthly nominal salaries were in the following economic branches: „Geology and meteorology” (2048 rubles or 177 US dollars), „Social assistance” (2124 rubles or 183 US dollars), "Forestry” (2192 rubles or 189 US dollars), „Postal communication” (2228 rubles or 192 US dollars), „Culture and art” (2462 rubles or 212 US dollars). During January-June, 2017 the average monthly nominal salary of employees in almost all industry sub-branches was lower than the average in industry (5079 rubles or 438 US dollars), excepting „Energetics” (6221 rubles or 537 US dollars, by 61.8% more compared to the average salary in the region), „Ferrous Metallurgy”(5988 rubles or 517 US dollars, by 55.7%) and „Mechanical construction and metalworking” (5352 rubles or 462 US dollars, by 39.2%). Social protection of population. During the period April-June, 2017 the average number of pensioners amounted to 123770 pers., by 2.3% less compared to the same period of the previous year, of them 119564 benefited by labor pension and – 4207 pers. by social pension. During April-June, 2017 the average amount of the pensions was 1349.60 rubles, by 0.5% less compared to April-June 2016. Labor pension – 1374.65 rubles and social pension – 637.59 rubles.
6 The official average exchange rate of the monetary authority of the region to the left of the Dniester River in January – June, 2017 – 1 US dollar=11,5862 rubles (http://www.cbpmr.net/data/svk_narast_itog_03_09_2017.pdf)

71
Nr. 26 (trim. II) 2017
TENDINŢE ÎN ECONOMIA MOLDOVEI
Subsistence minimum. During January-June, 2017, the amount of the subsistence minimum on average per capita accounted for 1327.67 rubles which is by 3.7% more compared to January-June, 2016.
Table 6.1. Subsistence minimum in the region from the left bank of the Dniester River in the first half of 2017
(average per person, rubles per month)
Total population
Including: Able to work
Pensioners Children
Men Women aged under 6 years
from 7 up to 15 years
January 1317 1447 1369 1111 1219 1464 February 1310 1440 1362 1106 1211 1457 March 1301 1429 1352 1098 1203 1447 April 1315 1446 1366 1110 1216 1464 May 1333 1467 1383 1125 1231 1487 June 1390 1530 1438 1172 1290 1565 Source: According to the data of the Transnistrian Statistical Body. Crimes. In January-June, 2017, according to the the public order protection bodies, 5769 requests and reports on crimes were registered which is by 7.2% more than in January-June, 2016. During January-June, 2017, 2379 crimes were registered which is by 0.6% less compared to January-June, last year. During January-June, 2017 there were registered 113 crimes related to illegal trafficking in arms; 268 drug related crimes; 21 crimes committed by use of arms, munitions and explosives. Of the total number of recorded crimes – 452 (19.0%) were classified as serious and 170 (7.1%) - extremely serious. Compared to January-June, 2016, the number of extremely serious crimes dropped by 2.8% and serious ones – by 1.7%. During January-June, 2017, 2156 crimes were investigated of which: 445 (20.6%) crimes were committed by persons previously convicted, 222 (10.3%) – women, 279 (12.9%) – group of individuals, 164 (7.6%) – crimes committed by minors. During January-June, 2017, 336 (15.6%) crimes were committed in drunkenness, drugging or in any other nature condition. As a result of these crimes, 1272 pers. suffered, including 18 pers. died (1.4%), and 37 pers (2.9%) were subjected to serious health injuries.

72
TENDINŢE ÎN ECONOMIA MOLDOVEI
Nr. 26 (trim. II) 2017
Chapter VII MACROECONOMIC FORECAST FOR 2017
(updated version)
Social-economic development of the Republic of Moldova in the first semester of 2017
In the first semester of 2017, the Moldovan economy has registered several developments on certain activities and areas: the external trade has risen, more public revenues have been accumulated and respectively, the public expenditures forecast for this period were made, the real salaries and consumption of population have increased. Simultaneously, the development of the national economy, as a whole, causes disturbance regarding the stability of the macroeconomic balance, sustainability in the real progress in the future. The investment activity continues to be very low. The industrial production is in a stagnant state and the agricultural one depends largely on the favourable or unfavourable weather conditions of an agricultural year. The advance in the volume of imports compared to exports increases the current account deficit of the balance of payments. The internal and external public debt continues to rise at major rates. There is noticed the appreciation trend of the national currency, the inflationary level is still high almost as in the previous year which exceeds far the one targeted by the National Bank for this year. Achieved results
Gross domestic product in semester I, 2017 totaled 63.9 bln. lei, recording an increase of 2.8% compared to the respective period of 2016 (in comparable prices) decreasing from 3.1% in quarter I to 2.5% in quarter II. The most significant contribution on GDP growth, by categories of resources, had the gross value added in wholesale and retail trade, maintenance and repair of vehicles and motorcycles; transport and storage; accomodation and food service activities (+1.5%), constructions; information and communications (each by +0.2%). Negative contributions on the GDP physical volume index have had the activities: agriculture, forestry and fishing (-0.2%); public administration and defense; mandatory social insurance; education; health and social assistance (-0.1%) By categories of uses, the increase was mainly due to the: final consumption of households (+3.5%); gross fixed capital formation (+1.1%). The net export had a negative contribution on the GDP physical volume index (-4.1%), consequence of a more pronounced contribution to the GDP formation of imports of goods and services (79.4%) compared to exports (45.4%). During January-August, 2017 inflation rate amounted to 7.3% against January-August, 2016 being almost at the same level (7.4%) as the inflation rate during the same period of 2016. However, the annual inflation exceeds the target set by the NBM (5% +/-1.5%). Moldovan leu has appreciated against the main currencies. Since the beginning of 2017, the national currency has marked an appreciation of 9.1% in relation to US dollar in nominal terms (from 19.98 lei per 1 US dollar on January 1, 2017 up to 18.15 lei on June 30, 2017). The Moldovan leu has appreciated by 0.9% against euro.

73
Nr. 26 (trim. II) 2017
TENDINŢE ÎN ECONOMIA MOLDOVEI
The stock of foreign exchange reserve assets of the NBM on June 30, 2017 reached 2388.7 mln. US dollars increasing by 8.3% compared to the level recorded at the end of 2016 and by 27.4% against June 30, 2016. Money supply M3 at the end of June 2017 amounted to about 71.4 bln. lei increasing by 7.6% compared to the end of June of the last year. The development of money supply M3 was due to the increase in the volume of deposits in national currency by 16.4%, especially demand deposits (+33.2%). The balance of deposits in foreign currency (calculated in lei) diminished by 2.5%. The balance of loans granted to the economy were below the level of the same period of the previous year (-7.9%). During January-June, 2017, there were accumulated revenues in the amount of 24.9 bln. lei in the national public budget (NPB), by 18.4% more compared to January-June, 2016. There were made expenditures in the amount of 25 bln. lei – by 15.2% more, respectively. On the whole, the NPB registered a deficit of 101.5 mln. lei, compared to 678.1 mln. lei in January-June, 2016. The total amount of the (internal and external) public debt managed by the Government on June 30, 2017 amounted to about 50.7 bln. lei, up by 42.3% in relation to the same period of 2016. The internal public debt increased by about 2.5 times (from the emission of the state stocks for the execution of the state guarantees account), and the external public debt – by 17.8%. During January-June, 2017 the exports grew up by 13.6%, and imports – by 16.7%. The negative balance of trade amounted to 1153.4 mln. US dollars against 963.6 mln. USD in January-June, 2016. The degree of imports coverage by exports accounted for 47.1%, lower by 1.3 p.p. than in the same period of 2016. The industrial enterprises from the Republic of Moldova, during January-June, 2017 produced by 0.3% more goods in terms of value compared to the similar period of 2016. The production of mining industry rose by 1.6%, of manufacturing industry- by 0.4%, and production and supply of electricity, heat energy, gas, hot water and conditioned air reduced by 0.5%,
In semester I, 2017 the agricultural production decreased by 5% (in comparable prices) against the respective period of 2016. The decline of agricultural production was due to the decrease of vegetable production by 28.4% and livestock production by 0.4%, which held about 82.9% of total agricultural production. In the first semester of 2017, the volume of investment in fixed assets totaled about 6.2 bln. lei, with an increase of 2.5% (in comparable prices) in comparison with the same period of 2016. The railway, road, fluvial and air transport enterprises during January-June, 2017 transported about 6.6 mln. tonnes commodities or by 22.5% more compared to the volume transported in the same period of 2016. The volume of turnover in retail trade during January-June, 2017 has reduced by 4% (in comparable prices) against January-June 2016 and the volume of turnover in market services provided to population increased by 3%. The average nominal salary of an employee in the national economy for January-June, 2017 amounted to 5636.7 lei increasing by 13.2% compared to the same period of 2016. In real terms, the salary grew by about 5.5%. The monthly disposable revenues of population for quarter II, 2017 amounted to 2227.6 lei on average per person, up by 9.8% in nominal terms and by 2.5% - in real terms, in comparison with the same period of 2016. The average montly consumption expenditures of population for quarter II, 2017 accounted for 2245.3 lei per person, up by 8% in nominal terms and by 0.8% in real terms compared to the same period of 2016. The average value of monthly pension on July 1, 2017 was 1484.7 lei and

74
TENDINŢE ÎN ECONOMIA MOLDOVEI
Nr. 26 (trim. II) 2017
increased by 16.1% in relation to the same date of 2016 in nominal terms and the remittances from abroad have risen. The number of unemployed, was 45.7 thousand forecast according to the International Labour Office’s definition, declining compared to the level of quarter II, 2016 (55.0 thousand). The unemployment rate (ILO unemployed weight in active population) in the country has registered 3.5%, decreasing slightly against quarter II, 2016 (4.0%). The unemploy-ment rate was 3.8% for men and – de 3.2% for women. Forecasts for 2017
In the second quarter of the year, there are not foreseen radical changes which would improve the final results of the year according to the forecasts made by experts under the macroeconomic simulation model experienced within the NIER. On the contrary, against the fairly good results achieved in the second half of the year, especially in agriculture it is naturally to expect an improvement of the main macroeconomic indicators in the seond half of the year. Starting from the actual situation, taking into account the trend set in the development of the macroeconomic indicators from the last period there were made the forecast calculations for 2017 presented in the table below. Table 7.1. Development of macroeconomic indicators in 2012-2016 and forecast for 2017
Measurement Unit
2012 2013 2014 2015 2016 2017 actual Forecast
A 1 2 3 4 5 6 7 Nominal GDP bln. Lei 88.2 100.5 112.1 122.6 134.9 144 Compared to the previous year in comparable prices
% 99.3 109.4 104.8 99.6 104.3 102.4
Annual average consumer price index
% 104.6 104.6 105.1 109.7 106.4 106
Average exchange rate lei/USD 12.11 12.59 14.04 18.81 19.92 18.5 Export of goods mln. USD 2162 2428 2340 1967 2045 2290 Compared to the previous year
% 97.5 112.3 96.3 84.1 103 112
Import of goods mln. USD 5213 5492 5317 3967 4020 4660 Compared to the previous year
% 100.4 105.4 96.8 75 101.9 116
Balance of trade mln. USD -3051 -3064 -2977 -2020 -1975 -2370 Industrial production at current prices
bln. Lei 36.4 39.4 43.5 45.7 47.6 51
Compared to the previous iear in comparable prices
% 98.1 108.6 107.3 100.6 100.9 101
Agricultural production at current prices
bln. Lei 19.9 23.8 27.3 27.2 30.5 35
Compared to the previous year in comparable prices
% 78 139.1 109 87 118.6 100 Investment in fixed assets bln. Lei 17.2 19.1 21.2 21.1 19.7 22.7 Compared to the previous year in comparable prices
% 98.9 104.2 103.8 90.6 87.2 102.5
Average montly nominal salary
Lei 3478 3765 4172 4611 5084 5700
Compared to the previous year
nominal % 108.9 108.3 110.8 110.5 110.3 112 real % 104.1 103.5 105.4 100.7 104.8 105.8 Labor remuneration fund bln. Lei 39.7 42.9 46.1 52.1 57.6 66.6 Labor force (economically active population)
thousand pers. 1215 1236 1232 1266 1273 1230
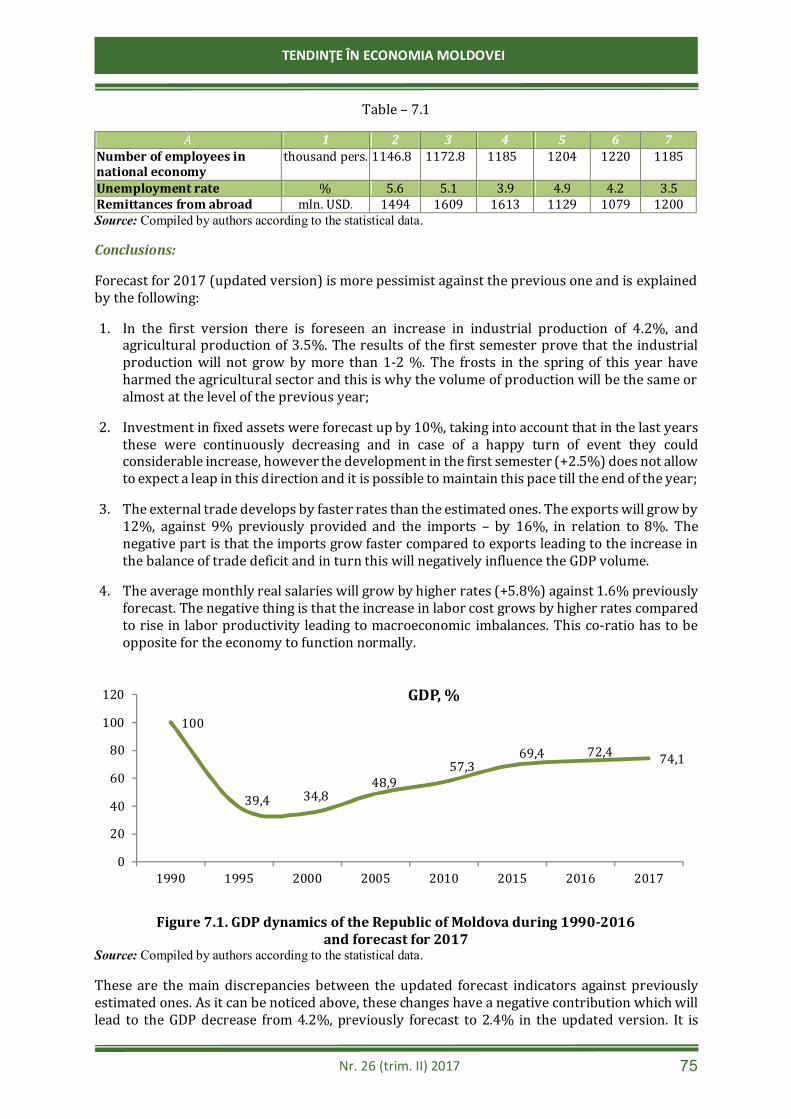
75
Nr. 26 (trim. II) 2017
TENDINŢE ÎN ECONOMIA MOLDOVEI
Table – 7.1 A 1 2 3 4 5 6 7
Number of employees in national economy
thousand pers. 1146.8 1172.8 1185 1204 1220 1185
Unemployment rate % 5.6 5.1 3.9 4.9 4.2 3.5 Remittances from abroad mln. USD. 1494 1609 1613 1129 1079 1200 Source: Compiled by authors according to the statistical data.
Conclusions:
Forecast for 2017 (updated version) is more pessimist against the previous one and is explained by the following: 1. In the first version there is foreseen an increase in industrial production of 4.2%, and
agricultural production of 3.5%. The results of the first semester prove that the industrial production will not grow by more than 1-2 %. The frosts in the spring of this year have harmed the agricultural sector and this is why the volume of production will be the same or almost at the level of the previous year;
2. Investment in fixed assets were forecast up by 10%, taking into account that in the last years these were continuously decreasing and in case of a happy turn of event they could considerable increase, however the development in the first semester (+2.5%) does not allow to expect a leap in this direction and it is possible to maintain this pace till the end of the year;
3. The external trade develops by faster rates than the estimated ones. The exports will grow by 12%, against 9% previously provided and the imports – by 16%, in relation to 8%. The negative part is that the imports grow faster compared to exports leading to the increase in the balance of trade deficit and in turn this will negatively influence the GDP volume.
4. The average monthly real salaries will grow by higher rates (+5.8%) against 1.6% previously forecast. The negative thing is that the increase in labor cost grows by higher rates compared to rise in labor productivity leading to macroeconomic imbalances. This co-ratio has to be opposite for the economy to function normally.
Figure 7.1. GDP dynamics of the Republic of Moldova during 1990-2016 and forecast for 2017
Source: Compiled by authors according to the statistical data.
These are the main discrepancies between the updated forecast indicators against previously estimated ones. As it can be noticed above, these changes have a negative contribution which will lead to the GDP decrease from 4.2%, previously forecast to 2.4% in the updated version. It is
100
39,4 34,848,9
57,369,4 72,4 74,1
020406080
100120
1990 1995 2000 2005 2010 2015 2016 2017
GDP, %

76
TENDINŢE ÎN ECONOMIA MOLDOVEI
Nr. 26 (trim. II) 2017
considered that this is the highest growth which can be reached taking into account the challenging socio-economic and political situation of our country. To reach the level foreseen for 2017 on GDP increase it is necessary that in the second half of the year to achieve a 2% growth compared to the same period of the last year. The development of the national economy at insufficient rates during the period of economic relaunch (in 2001-2016 equal to 4.5% annually) did not let to recover that throwback produced in the first 10 years, thus in 2017 in case we have a 2.4% growth we will reach only almost ¾ of the initial GDP volume.
77
Nr. 26 (trim. II) 2017
TENDINŢE ÎN ECONOMIA MOLDOVEI
STATISTICAL ANNEXES

78
TENDINŢE ÎN ECONOMIA MOLDOVEI
Nr. 26 (trim. II) 2017
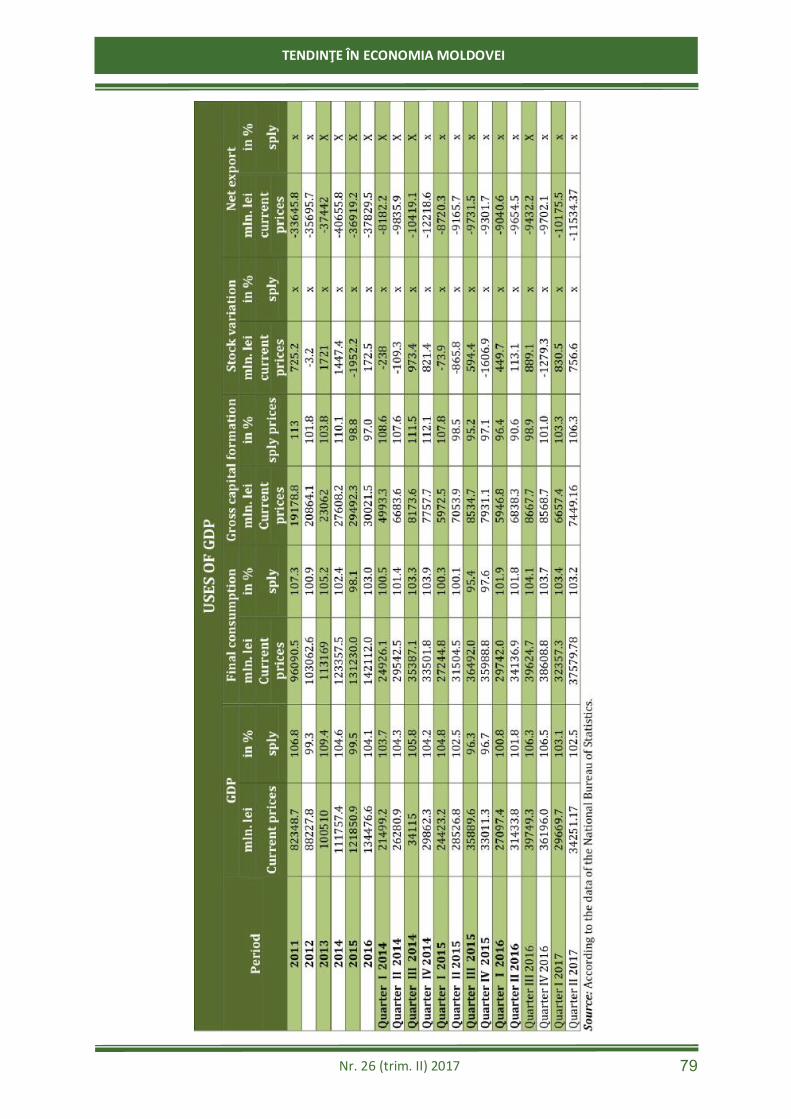
79
Nr. 26 (trim. II) 2017
TENDINŢE ÎN ECONOMIA MOLDOVEI

80
TENDINŢE ÎN ECONOMIA MOLDOVEI
Nr. 26 (trim. II) 2017

81
Nr. 26 (trim. II) 2017
TENDINŢE ÎN ECONOMIA MOLDOVEI

82
TENDINŢE ÎN ECONOMIA MOLDOVEI
Nr. 26 (trim. II) 2017

83
Nr. 26 (trim. II) 2017
TENDINŢE ÎN ECONOMIA MOLDOVEI

84
TENDINŢE ÎN ECONOMIA MOLDOVEI
Nr. 26 (trim. II) 2017

85
Nr. 26 (trim. II) 2017
TENDINŢE ÎN ECONOMIA MOLDOVEI

86
TENDINŢE ÎN ECONOMIA MOLDOVEI
Nr. 26 (trim. II) 2017

87
Nr. 26 (trim. II) 2017
TENDINŢE ÎN ECONOMIA MOLDOVEI

88
TENDINŢE ÎN ECONOMIA MOLDOVEI
Nr. 26 (trim. II) 2017

89
Nr. 26 (trim. II) 2017
TENDINŢE ÎN ECONOMIA MOLDOVEI

90
TENDINŢE ÎN ECONOMIA MOLDOVEI
Nr. 26 (trim. II) 2017

91
Nr. 26 (trim. II) 2017
TENDINŢE ÎN ECONOMIA MOLDOVEI

92
TENDINŢE ÎN ECONOMIA MOLDOVEI
Nr. 26 (trim. II) 2017
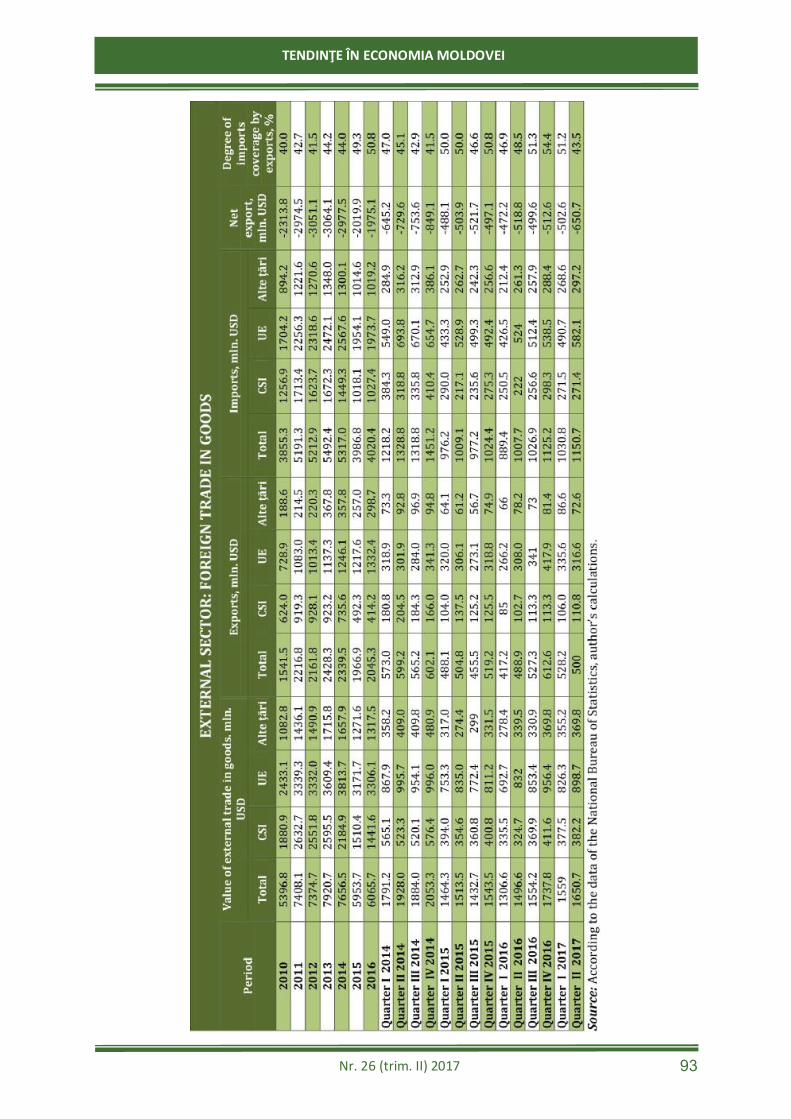
93
Nr. 26 (trim. II) 2017
TENDINŢE ÎN ECONOMIA MOLDOVEI

94
TENDINŢE ÎN ECONOMIA MOLDOVEI
Nr. 26 (trim. II) 2017

95
Nr. 26 (trim. II) 2017
TENDINŢE ÎN ECONOMIA MOLDOVEI
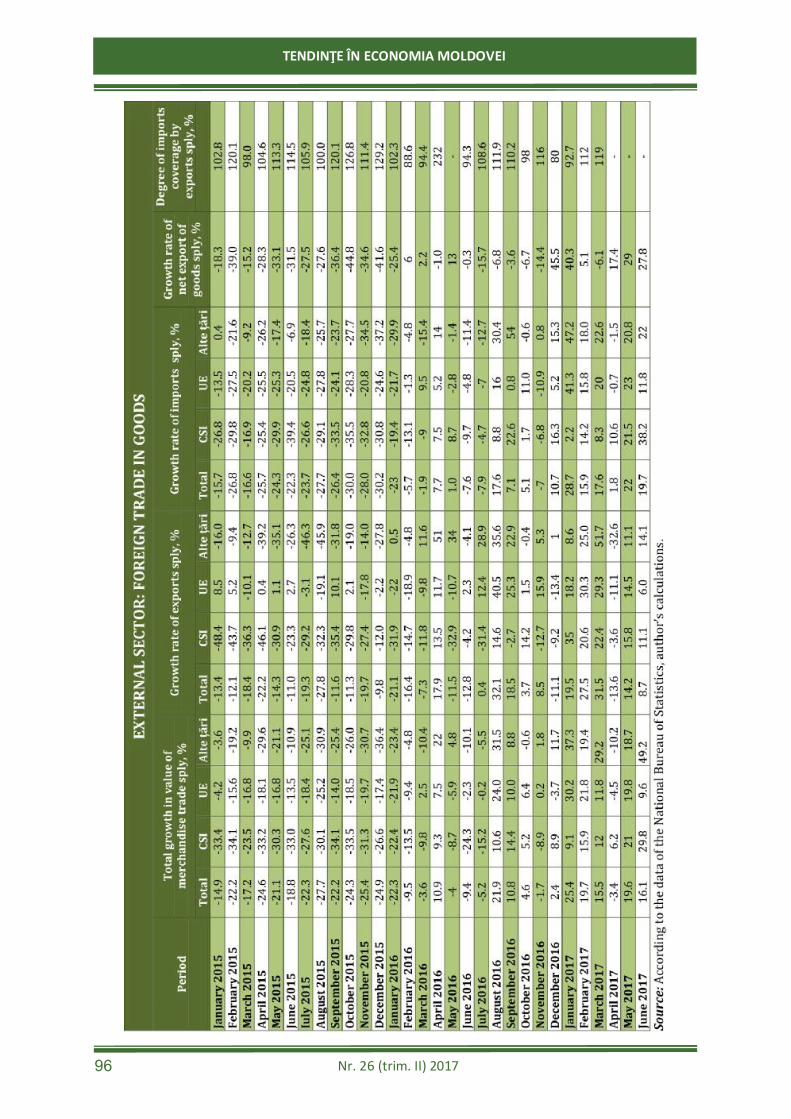
96
TENDINŢE ÎN ECONOMIA MOLDOVEI
Nr. 26 (trim. II) 2017

97
Nr. 26 (trim. II) 2017
TENDINŢE ÎN ECONOMIA MOLDOVEI

98
TENDINŢE ÎN ECONOMIA MOLDOVEI
Nr. 26 (trim. II) 2017

99
Nr. 26 (trim. II) 2017
TENDINŢE ÎN ECONOMIA MOLDOVEI

100
TENDINŢE ÎN ECONOMIA MOLDOVEI
Nr. 26 (trim. II) 2017

101
Nr. 26 (trim. II) 2017
TENDINŢE ÎN ECONOMIA MOLDOVEI

102
TENDINŢE ÎN ECONOMIA MOLDOVEI
Nr. 26 (trim. II) 2017

103
Nr. 26 (trim. II) 2017
TENDINŢE ÎN ECONOMIA MOLDOVEI
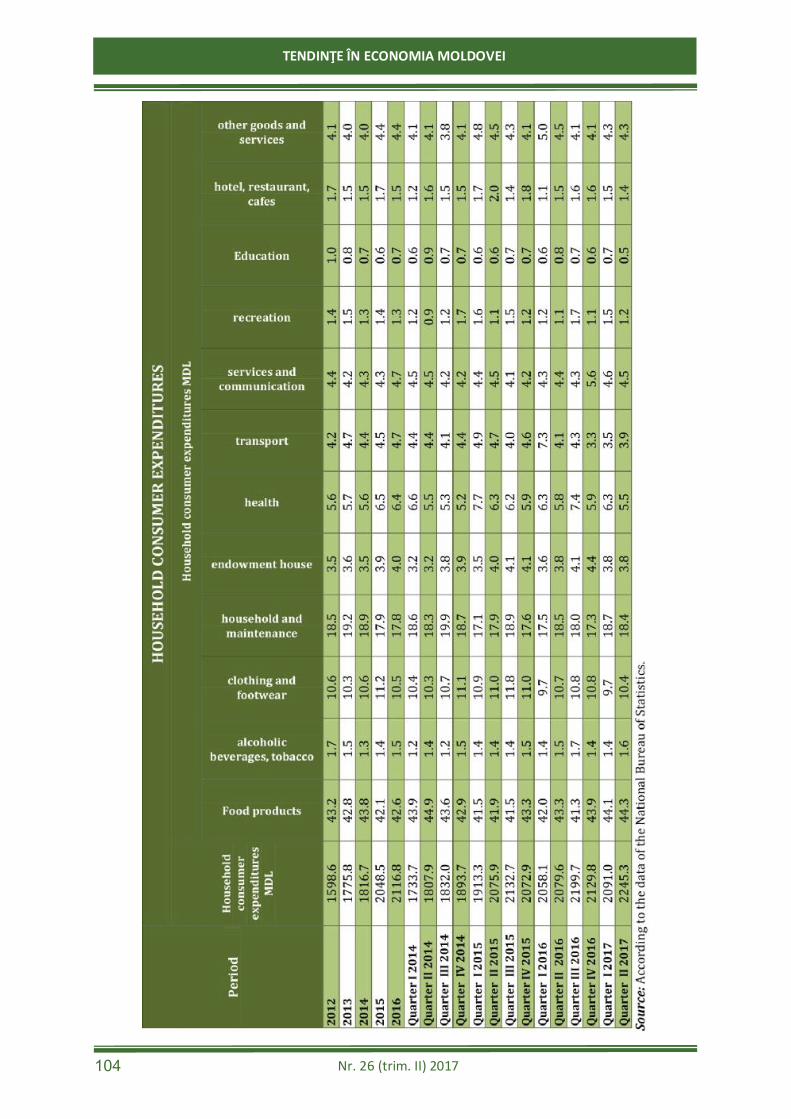
104
TENDINŢE ÎN ECONOMIA MOLDOVEI
Nr. 26 (trim. II) 2017

105
Nr. 26 (trim. II) 2017
TENDINŢE ÎN ECONOMIA MOLDOVEI

106
TENDINŢE ÎN ECONOMIA MOLDOVEI
Nr. 26 (trim. II) 2017
Editor-in-chief ER: Iulita BIRCA Cover Designer: Virgiliu MOREI
Adress of redaction: Editorial Office of NIER, MD-2064,
Chisinau city, 45 I. Creanga street, tel.: (+373-22) 50-11-30, fax: (+373-22) 74-37-94 web: www.ince.md/complexul-editorial/; e-mail: [email protected]
Good for print: 16.10.2017. Circulation 300 ex.
Printing sheets 6.6. Editorial sheets 7.1. Com. 11. Editorial Office of NIER, 2017