molecular cell article - bioinfo.sibs.ac.cnbioinfo.sibs.ac.cn/shaolab/pdf/2014 molecular cell; das...
TRANSCRIPT

Molecular Cell
Article
Distinct and Combinatorial Functionsof Jmjd2b/Kdm4b and Jmjd2c/Kdm4cin Mouse Embryonic Stem Cell IdentityPartha Pratim Das,1,10 Zhen Shao,1,10 Semir Beyaz,1 Eftychia Apostolou,3,4 Luca Pinello,5 Alejandro De Los Angeles,1
Kassandra O’Brien,1 Jennifer Marino Atsma,1,9 Yuko Fujiwara,1 Minh Nguyen,1 Damir Ljuboja,1,8 Guoji Guo,1
Andrew Woo,7 Guo-Cheng Yuan,5 Tamer Onder,1,6 George Daley,1,2,3 Konrad Hochedlinger,2,3,4 Jonghwan Kim,1,8
and Stuart H. Orkin1,2,*1Department of Pediatric Oncology, Dana-Farber Cancer Institute and Division of Hematology/Oncology, Boston Children’s Hospital,
Harvard Stem Cell Institute, Harvard Medical School, Boston, MA 02115, USA2Howard Hughes Medical Institute, Boston, MA 02115, USA3Department of Stem Cell and Regenerative Biology, Harvard University and Harvard Medical School, 7 Divinity Avenue, Cambridge,MA 02138, USA4Center for Regenerative Medicine, Massachusetts General Hospital Cancer Center, Boston, MA 02114, USA5Department of Biostatistics and Computational Biology, Dana-Farber Cancer Institute, Harvard School of Public Health, Boston,
MA 02115, USA6School of Medicine, Koc University, Rumelifeneri Yolu, Sariyer 34450, Istanbul, Turkey7Western Australian Institute for Medical Research, Royal Perth Hospital and School of Medicine and Pharmacology, The University of
Western Australia, Nedlands, WA 6009, Australia8Present address: Section of Molecular Cell and Developmental Biology, Institute for Cellular and Molecular Biology, University of Texasat Austin, Austin, TX 78712, USA9Present address: Abbott Bioresearch Center, 100 Research Drive, Worcester, MA 01605, USA10These authors contributed equally to this work*Correspondence: [email protected]
http://dx.doi.org/10.1016/j.molcel.2013.11.011
SUMMARY
Self-renewal and pluripotency of embryonic stemcells (ESCs) are established by multiple regulatorypathways operating at several levels. The roles of his-tone demethylases (HDMs) in these programs areincompletely defined. We conducted a functionalRNAi screen for HDMs and identified five potentialHDMs essential for mouse ESC identity. In-depthanalyses demonstrate that the closely related HDMsJmjd2b and Jmjd2c are necessary for self-renewalof ESCsand inducedpluripotent stemcell generation.Genome-wide occupancy studies reveal that Jmjd2bunique, Jmjd2cunique, and Jmjd2b-Jmjd2ccommontarget sites belong to functionally separable Core,Polycomb repressive complex (PRC), and Myc regu-latory modules, respectively. Jmjd2b and Nanog actthrough an interconnected regulatory loop, whereasJmjd2c assists PRC2 in transcriptional repression.Thus, twoHDMsof the same subclass exhibit distinctand combinatorial functions in control of the ESCstate. Such complexity of HDM function reveals anaspect of multilayered transcriptional control.
INTRODUCTION
Embryonic stem cells (ESCs) are capable of indefinite self-
renewal and differentiation into all lineages. Somatic cell reprog-
32 Molecular Cell 53, 32–48, January 9, 2014 ª2014 Elsevier Inc.
ramming to induced pluripotent stem cells (iPSCs) by defined
factors has greatly improved prospects for cellular therapies
(Takahashi and Yamanaka, 2006; Cherry and Daley, 2012).
Althoughmuch has been learned, the components that establish
and maintain ESC identity are incompletely defined.
ESC identity is maintained by activation of ESC-specific genes
and repression of lineage-specific developmental genes. This
balance of gene expression is maintained through crosstalk
between essential transcription factors (TFs) and chromatin reg-
ulators (Orkin and Hochedlinger, 2011; Young, 2011). Extensive
studies of protein-protein and protein-DNA interactions have re-
vealed distinct ESC regulatory modules, termed Core, Myc, and
Polycomb, that are essential for the entire ESC regulatory
network (Chen et al., 2008; Kim et al., 2010). The Core module
is composed of canonical ESC factors (Oct4, Sox2, and Nanog)
and their associated partners, which positively regulate ESC-
specific genes and repress lineage-specific genes (Kim et al.,
2010; Young, 2011). The Myc module, consisting of cMyc and
associated factors, is also transcriptionally active. However,
the Myc module is functionally separable from the Core module
and is activated earlier than the Core module during iPSC gener-
ation at the partial iPSC stage (Sridharan et al., 2009; Soufi et al.,
2012). The Polycomb repressive complex (PRC) module,
composed of PRC1 and PRC2 components, functions in repres-
sion of lineage-specific genes (Boyer et al., 2006; Kim et al.,
2010; Margueron and Reinberg, 2011).
Various approaches have implicated the role of chromatin reg-
ulators in self-renewal of ESCs (Fazzio et al., 2008; Hu et al.,
2009; Kagey et al., 2010). Histone demethylases (HDMs) are his-
tone-modifying enzymes, which have an opposing biochemical

Molecular Cell
Functions of Jmjd2b and Jmjd2c in Mouse ESCs
function to histone methyltransferases (HMTs). HDMs are
required for normal development and are implicated in patho-
logic states including cancers (Pedersen and Helin, 2010).
HDMs are divided into two broad classes, FAD-dependent
amine oxidases (Lsd1/Kdm1) and Fe(II)- and a-ketoglutarate-
dependent JmjC domain-containing HDMs (Mosammaparast
and Shi, 2010). The JmjC domain-containing HDMs have a
conserved catalytic triad (H, D/E, and H), which catalyzes lysine
demethylation of histones through an oxidative reaction that
requires Fe(II) and a-ketoglutarate as cofactors. JmjC domain-
containing HDMs are further subclassified based on their
sequence homology, domains, and substrate specificity (Agger
et al., 2008; Pedersen and Helin, 2010). Studies have proposed
roles for Jmjd1a, Jmjd2c, and Jarid1b/Kdm5b in ESC self-
renewal (Loh et al., 2007; Xie et al., 2011). However, roles of other
HDMs in ESCs remain unknown.
Here, we conducted a functional RNAi screen against all
annotated HDMs and identified five candidate HDMs essential
for mouse ESC (mESC) identity. To gain mechanistic insight,
we chose two closely related HDMs, Jmjd2b/Kdm4b and
Jmjd2c/Kdm4c, belonging to the same subclass (HDMs for
H3K9me2/me3 and H3K36me2/me3) for in-depth analysis. In
addition to their requirement in ESCs, both HDMs are required
for efficient somatic cell reprogramming. Although depletion of
either HDM generates a similar differentiation phenotype, chro-
matin occupancy studies reveal both unique and common target
sites. Jmjd2b unique, Jmjd2b-Jmjd2c common, and Jmjd2c
unique targets partition to the Core, Myc, and PRC regulatory
modules of the overall ESC network, respectively. Specifically,
we show that Jmjd2b and Nanog act through an interconnected
regulatory loop, whereas Jmjd2c assists PRC2 in full repression
at poised and repressed target genes. The dedicated and
combinatorial relationships between these two related HDMs
reveal an unsuspected level of complexity in how HDMs partic-
ipate in transcriptional control.
RESULTS
Functional RNAi Screens Reveal Candidate HDMs formESC IdentityMost HDMs are expressed in mESCs (Figure S1A available
online). To identify HDMs required for maintenance of the ESC
state, we performed a functional RNAi screen. We used five
different shRNA lentiviral constructs to knock down each of 20
HDMs in mESCs. The screen was scored in terms of alterations
of ‘‘ESC growth phenotype’’ and ‘‘colony morphology’’ (Fig-
ure 1A; Figure S1B; Table S1). Normally, ESCs grow as spherical
three-dimensional colonies. Upon depletion of a number of the
candidate HDMs, cells exhibited flattened morphology and
grew as a monolayer with reduced cell-cell contacts (Fig-
ure S1B), which we term a ‘‘differentiation’’ phenotype. A spec-
trum of differentiation phenotypes from mild to severe was
observed (Figure S1B; Table S1). For each candidate HDM, we
scored the phenotype from at least the two best individual
shRNAs. Two secondary screens were performed for validation.
All three screens reproduced the original phenotypes (Table S1).
Our functional RNAi screen identified five candidate HDMs,
namely Jmjd1a (Kdm3a), Jmjd2b (Kdm4b), Jmjd2c (Kdm4c),
Utx (Kdm6a), and Jmjd6. Among these, Jmjd1a (Kdm3a) and
Jmjd2c (Kdm4c) were identified previously as having a role in
self-renewal of mouse ESCs (Loh et al., 2007). Jmjd1a, Jmjd2b,
Jmjd2c, and Jmjd6 knockdown showed moderate to severe dif-
ferentiation phenotypes, whereas knockdown of Utx showed a
more subtle phenotype (Figure S1B; Table S1). Further analyses
were performed for the candidate HDMs. Alkaline phosphatase
staining typical of pluripotent ESCs was reduced upon knock-
down of candidate HDMs compared to controls (Anti-GFP and
Empty) (Figure 1B). Pluripotency marker SSEA-1 expression
was also reduced significantly upon knockdown (Figure 1C).
We validated each by western blotting (Figure S1C), and noted
general correlation of knockdown efficiency with the extent of
differentiation. mRNA expression and protein levels of all five
candidate HDMs were reduced upon ESC differentiation (Fig-
ures 1D and 1E). Additionally, these candidate HDMswere highly
expressed in mESCs compared to mouse embryonic fibroblasts
(Figure S1D), consistent with crucial roles in mESC identity.
Both Jmjd2b/Kdm4b and Jmjd2c/Kdm4c Are Requiredfor ESC Identity and Efficient Somatic CellReprogramming/iPSC GenerationWe selected two closely related candidate HDMs of the same
subclass, Jmjd2b and Jmjd2c, for in-depth study (Agger et al.,
2008). As depletion of either leads to an apparently similar differ-
entiation phenotype, we suspected that their comparison might
uncover insights into their nonredundant roles and possibly their
relationship to each other.
We first determined that Jmjd2b and Jmjd2c restore the
normal ESC growth and colony morphology in Jmjd2b-deficient
and Jmjd2c-deficient ESCs (Figure S1E). Indeed, full-length
Jmjd2b and Jmjd2c restored the normal ESC growth phenotype,
ESC colony morphology, and also SSEA-1 expression (Figures
S1F and S1G). However, catalytic domain (JmjC)-containing
Jmjd2b and Jmjd2c (1–333 aa) and catalytic mutants (JmjC
domain-containing catalytic triad [H, D/E, and H]) of Jmjd2b
and Jmjd2c achieved only partial rescue (Figures S1F and
S1G), suggesting that the full length of Jmjd2b and Jmjd2c,
as well as their catalytic residues, is required for self-renewal
of mESCs.
Next, we tested the role of Jmjd2b and Jmjd2c in somatic re-
programming. Depletion of Jmjd2b and Jmjd2c showed reduced
numbers of iPSC colonies compared to control knockdown, as
scored by colony morphology and SSEA-1-positive colonies
(Figure 1F), which is reminiscent of the effects of knockdown
of all H3K9 demethylases (Chen et al., 2013). Taken as a whole,
the functional assay demonstrates that Jmjd2b and Jmjd2c are
required for efficient somatic reprogramming induced by Oct4-
Sox2-Kl4-Myc and establishment of the ESC-like state.
Jmjd2b/Kdm4b and Jmjd2c/Kdm4c Are Required forSelf-Renewal of mESCsWe next conducted gene expression profiling upon depletion of
Jmjd2b and Jmjd2c compared to control (Anti-GFP) knockdown.
Gene expression profiling revealed that 1,787 genes were differ-
entially expressed by >2-fold upon depletion of Jmjd2b and
Jmjd2c (Figure 2A, left; Table S3). The gene cluster down-
regulated upon knockdown displayed higher expression in
Molecular Cell 53, 32–48, January 9, 2014 ª2014 Elsevier Inc. 33

shRNA plasmids against HDMs
Lentivirus production in HEK 293T cells
Infection to J1 mES cells
J1 mES cells 24 well
Puromycin selection Split cells after 2 days
Evaluate differentiation phenotype of mES cells
Check the knock down level
A
B C
D
24hrs
Differentiation (-LIF, +RA)
Day 0 2 6 8 10
anti-Actin
anti-Jmjd1a
anti-Jmjd2b
anti-Jmjd2c
anti-Utx
anti-Jmjd6
anti-Oct4
anti-Nanog
OSKM+Empty shRNA
OSKM+Jmjd2b-1 shRNA
OSKM+Jmjd2c-1 shRNA
E
Jmjd2c-2Jmjd2c-1 Utx-2 Utx-4
Jmjd6-2 Jmjd6-4 Oct4-1 Nanog-4
Jmjd1a-2 Jmjd1a-3 Jmjd2b-1 Jmjd2b-4 Anti-GFP
Empty
0
100
200
300
400
500
Num
ber o
f SS
EA
-1+
colo
nies
OSKM+E
mpt
y shR
NA
OSKM+J
mjd2
b-1s
hRNA
OSKM+J
mjd2
c-1
shRNA
******
SSEA-1
Anti-G
FP
Jmjd1
a-2
Jmjd1
a-3
Jmjd2
b-1
Jmjd2
b-4
Jmjd2
c-1
Jmjd2
c-2
Utx-2
Utx-4
Jmjd6
-2
Jmjd6
-4
Oct4-1
Nanog
-40
50
100
150
Mea
n F
luor
esce
nt In
tens
ity (
%)
F
***
*** ***
* * * *
***
** ***
*** ***
Undiff
5d_d
iff
7d_d
iff
11d_
diff
Undiff
5d_d
iff
7d_d
iff
11d_
diff
Undiff
5d_d
iff
7d_d
iff
11d_
diff
Undiff
5d_d
iff
7d_d
iff
11d_
diff
Undiff
5d_d
iff
7d_d
iff
11d_
diff
Undiff
5d_d
iff
7d_d
iff
11d_
diff
Undiff
5d_d
iff
7d_d
iff
11d_
diff
Undiff
5d_d
iff
7d_d
iff
11d_
diff
0.00000.00020.00040.00060.00080.0010
0.51.01.5
50010001500
Jmjd
1a
Jmjd
2b
Jmjd
2c
Jmjd
6
Gat
a6
Utx
Oct
4
Gat
a4
Fol
d ch
ange
diff
/und
iff m
RN
A le
vel
** * *** *** *
**
***
5days_diff 7days_diff 11days_diff
Differentiation (-LIF, +RA) Undiff
***
*
(legend on next page)
Molecular Cell
Functions of Jmjd2b and Jmjd2c in Mouse ESCs
34 Molecular Cell 53, 32–48, January 9, 2014 ª2014 Elsevier Inc.

Molecular Cell
Functions of Jmjd2b and Jmjd2c in Mouse ESCs
undifferentiated ESCs compared to differentiated ESCs; con-
versely, the gene cluster upregulated upon knockdown showed
reduced expression in undifferentiated ESCs (Figure 2A, right;
Figure S2A).
Expression of individual ESC-specific and lineage-specific
genes from Jmjd2b and Jmjd2c depleted cells revealed
reduced ESC-specific gene expression and enhanced expres-
sion of differentiation genes (Figures 2C and 2D; Figures S2B
and S2C). We observed modest downregulation of ESC-specific
genes, including Nanog, Esrrb, Klf4, and Tbx3, in Jmjd2b- or
Jmjd2c-depleted cells. In addition, specific knockdown of
Jmjd2b and Jmjd2c did not affect expression of other HDMs
of the same subclass. We observed upregulation of several
lineage-specific genes upon depletion of Jmjd2b or Jmjd2c,
such as Brachyury (T), Pitx2, Fgf8, Wnt, and Fgf5 for mesoendo-
derm/mesoderm, Otx2, Nestin, Pax6, Fabp7, and Zic1 for ecto-
derm/neuroectoderm, andCdx2 for trophoectoderm (Figures 2C
and 2D; Figures S2B and S2C).
Gene ontology (GO) and Ingenuity Pathway Analysis (IPA) of
the upregulated genes revealed significant enrichment for
several developmental processes and related signaling path-
ways, whereas the downregulated genes correlated with
several metabolic pathways, including glycolysis and gluconeo-
genesis (Figures S2D and S2E; Table S5). Furthermore, gene
set enrichment analyses (GSEAs) demonstrated that Jmjd2b
and Jmjd2c depletion significantly repressed the ‘‘undifferenti-
ated’’ ESC state and enhanced the ‘‘differentiation’’ state (Fig-
ures 2E and 2F; Figure S2F; Table S4), including changes in
several developmental signaling pathway gene sets (Fig-
ure S2G). In these analyses, we observed a similar overall
pattern of global gene expression upon depletion of Jmjd2b
or Jmjd2c. However, the total number of differentially ex-
pressed genes differed between Jmjd2b and Jmjd2c knock-
down cells (Figure 2B), raising the possibility that Jmjd2b and
Jmjd2c function through common and distinct mechanisms in
self-renewal of ESCs.
Differential Distribution of Genome-wide Targets ofJmjd2b/Kdm4b and Jmjd2c/Kdm4c in mESCsTo dissect mechanisms by which Jmjd2b and Jmjd2c function,
we determined their genome-wide DNA chromatin occupancy
using chromatin immunoprecipitation sequencing (ChIP-seq).
Due to the lack of suitable antibodies, we generated biotinylated
versions of Jmjd2b and Jmjd2c in mESCs (Figures S3A and S3B)
and performed in vivo biotinylation-mediated ChIP-seq (Bio-
Figure 1. Functional RNAi Screens Reveal Candidate HDMs for mESC
(A) Schematic diagram representing the outline of the RNAi screen.
(B) Alkaline phosphatase staining of mESCs upon knockdown of candidate HDM
(C) SSEA-1 staining of mESCs upon knockdown of candidate HDMs. SSEA-1-po
percentage of mean fluorescent intensity of candidate HDMs is represented. Dat
***p < 0.0001, **p < 0.001, *p < 0.01.
(D) Real-time PCR analyses of candidate HDMs at different time points during ES
levels are shown in differentiated ESCs relative to undifferentiated ESCs for each
using t test; ***p < 0.0001, **p < 0.001, *p < 0.01.
(E) Western blot analyses of candidate HDMs at different time points during ESC
(F) SSEA-1 staining of iPSC colonies from Empty (control) and Jmjd2b and Jmjd2
calculated using t test; ***p < 0.0001.
See also Figure S1.
ChIP-seq) (Kim et al., 2008, 2009, 2010); 16,807 and 18,025
significantly enriched binding peaks were identified for Jmjd2b
and Jmjd2c, respectively (Table S6). Despite their close relation-
ship, we observed differential genome-wide distribution of
Jmjd2b and Jmjd2c peaks. Jmjd2b peaks are distributed to
the promoter (�40%), intergenic (�32%), and gene body regions
(�28%), whereas Jmjd2c mostly occupies promoter regions
(�70%) compared to �20% binding at intergenic and �11% at
gene body regions (Figure 3A). Jmjd2b and Jmjd2c share
�40% common peaks/targets (Figure 3B). We further classified
targets as ‘‘Jmjd2b-Jmjd2c common,’’ ‘‘Jmjd2b unique,’’ and
‘‘Jmjd2c unique’’ (Figure 3B). Interestingly, the majority of
Jmjd2b-Jmjd2c common and Jmjd2c unique targets are distrib-
uted at promoter regions (�77% and �65%, respectively),
whereas Jmjd2b unique targets predominantly localized to
gene body regions (�42%) and intergenic regions (�48%), and
only �10% to promoter regions (Figure 3B).
Next, we compared the occupancy of Jmjd2b and Jmjd2c
with four metagenes, groups of genes with correlated expres-
sion (high, moderate, low, and very low) in mESCs. Further ana-
lyses showed that the majority of Jmjd2b-Jmjd2c common
targets and Jmjd2b unique targets are occupied at promoters
and distal regions, respectively, and correspond to highly ex-
pressed genes, whereas the majority of Jmjd2c unique targets
are occupied at the promoters of moderately, as well as lowly,
expressed genes (Figure S3C). These initial observations reveal
distinct distributions and functions of Jmjd2b and Jmjd2c in
mESCs.
Jmjd2b/Kdm4b Unique, Jmjd2c/Kdm4c Unique, andJmjd2b/Kdm4b-Jmjd2c/Kdm4c Common TargetRegions Belong to Different Regulatory Modules ofmESCsTo explore the significance of Jmjd2b-Jmjd2c common, Jmjd2b
unique, and Jmjd2c unique targets, we correlated occu-
pancy maps with histone marks (H3K4me1/3, H3K9me2/me3,
H3K27me3, H3K36me2/me3, and H3K27ac), components of
the PRC2 complex (Ezh2 and Suz12), ESC-related TFs (Oct4,
Nanog, Sox2, and Klf4), and associated transcription factors
and chromatin regulators (cMyc, E2F1, p300, Med1, and
Med12). As the majority of the Jmjd2b unique targets mapped
to ‘‘nonpromoter’’ regions (Figure 3B), we generated ChIP-seq
intensity heat maps around the summit of all three peak sets,
which were further classified into ‘‘promoter’’ and ‘‘distal’’ re-
gions. We found that the three target classes associated with
Identity
s. The scale bar represents 20 mm.
sitive cells were quantified through fluorescence-activated cell sorting, and the
a are represented as mean ± SEM; n = 3; p values were calculated using t test;
C differentiation. mRNA expression was normalized by actin, and expression
gene. Data are represented as mean ± SEM; n = 3; p values were calculated
differentiation.
c knockdown cells. Data are represented as mean ± SEM; n = 3; p values were
Molecular Cell 53, 32–48, January 9, 2014 ª2014 Elsevier Inc. 35

D
C
B
154
30699
Jmjd2c KD_up Jmjd2b KD_up
23982
583
Jmjd2c KD_down Jmjd2b KD_down
Downregulated genes
Upregulated genes
A
Tbx
3
Klf4
Esr
rb
Nan
og
Zfp
42
Sta
t3
Sox
2
Pou
5f1
Spa
rcl1
Sox
7
Pdg
fra
Pth
1r
Hnf
4a
Sox
17
Gat
a6
Gat
a4
Col
4a2
Lam
b1-1
Fox
a2
Sm
ad4
Sm
ad2
Nod
al
Lefty
1
Nkx
1-2
Pitx
2
Fgf
8
Fgf
5 T
Msx
2
Srf
Wnt
3
Sox
18
Pax
6
Otx
2
Krt
18
Nes
Zic
1
Fab
p7
Gat
a3
Cdx
2
Gap
dh
Act
b
1
0.1
0.01
10
100
1000
0.1
1
10
100
Jmjd
2c/K
dm4c
Jmjd
2b/K
dm4b
Jmjd
2a/K
dm4a
Jmjd
2d/K
dm4d
Tbx
3
Klf4
Esr
rb
Nan
og
Zfp
42
Pou
5f1
Sox
2
Sta
t3
Pdg
fra
Pth
1r
Hnf
4a
Gat
a6
Spa
rc
Gat
a4
Sox
17
Sox
7
Col
4a2
Lam
b1-1
Fox
a2
Nod
al
Sm
ad2
Lefty
1
Fgf
8
Pitx
2
Fgf
5
Srf
Wnt
3
Nes
Sox
18
Pax
6
Otx
2
Tubb
3
Olig
2
Zic
1
Olig
1
Gli1
Fab
p7
Olig
3
Gap
dh
Act
b
Kdm4 family members
ESC-specific genes Endoderm Mesoendoderm Mesoderm
Ectoderm Neuroectoderm House keeping genes
Kdm4 family members
ESC-specific genes Endoderm Mesoendoderm Mesoderm
Ectoderm Neuroecto-derm
Trophoecto-derm
House keeping genes
Fol
d ch
ange
Jm
jd2b
KD
/Ant
i-GF
P K
D
m
RN
A le
vel (
log
scal
e)
Fol
d ch
ange
Jm
jd2c
KD
/Ant
i-GF
P K
D
m
RN
A le
vel (
log
scal
e)
Jmjd
2c/K
dm4c
Jmjd
2b/K
dm4b
Jmjd
2a/K
dm4a
Jmjd
2d/K
dm4d
p-value =1E-256
p-value =2E-174
Anti-GFP vs Jmjd2b KD
Enr
ichm
ent s
core
Anti-GFP vs Jmjd2b KD
mES undiff. upregulated genes 6 day diff. upregulated genes
NES= -3.27p-value<0.01
NES= 2.67p-value<0.01
Enr
ichm
ent s
core
Anti-GFP vs Jmjd2c KD Anti-GFP vs Jmjd2c KD
NES= 2.16p-value<0.01 NES= -2.64
p-value<0.01
mES undiff. upregulated genes 6 day diff. upregulated genesE F
−2.5
−2
−1.5
−1
−0.5
0
0.5
1
1.5
2
2.5A
nti-G
FP
KD
_rep
1 2per_D
K P
FG-itn
A3per_
DK
PF
G-itnA
Jmjd
2b K
D_r
ep1
Jmjd
2b K
D_r
ep2
Jmjd
2b K
D_r
ep3
Jmjd
2c K
D_r
ep1
Jmjd
2c K
D_r
ep2
-1 -0.50 0.51
Diff d6 / Undiff ESCs(log2 scale)
(legend on next page)
Molecular Cell
Functions of Jmjd2b and Jmjd2c in Mouse ESCs
36 Molecular Cell 53, 32–48, January 9, 2014 ª2014 Elsevier Inc.

Molecular Cell
Functions of Jmjd2b and Jmjd2c in Mouse ESCs
different histone marks and transcription factors. Jmjd2c unique
targets strongly overlapped with bivalent marks (both
H3K4me3 and H3K27me3 marks), and also with components
of the PRC2 complex (Ezh2 and Suz12) at promoter and distal
target loci (Figure 3C; Figure S3E). Approximately 80% of Ezh2
and Suz12 targets overlapped with Jmjd2c targets genome-
wide (Figure 3D). Additionally, H3K36me3 and RNA Pol II occu-
pancy was reduced at Jmjd2c unique promoter and distal
target loci (Figure 3C; Figure S3E), suggesting that the majority
of Jmjd2c unique targets are poised or repressed. In contrast,
Jmjd2b-Jmjd2c common and Jmjd2b unique targets showed
reduced occupancy of H3K27me3, Ezh2, and Suz12 and gain
of H3K4me3, H3K36me3, and RNA Pol II occupancy both at
promoters and distal target loci (Figure 3C; Figure S3E), indi-
cating that these targets are transcriptionally active. Notably,
we found that binding of ESC-Core transcription factors Nanog
and Sox2 but not Oct4 was strongly biased toward Jmjd2b
unique targets rather than the other two peak sets at both pro-
moter and distal regions (Figures 3E and 3F). This was further
supported by peak overlap analysis (Figure 3G). Nonetheless,
H3K27ac, H3K4me1, p300, mediator (Med1, Med12), and
Klf4 binding sites overlapped with both Jmjd2b unique and
Jmjd2b-Jmjd2c common targets, and targets of cMyc and its
associated factor E2f1 showed significant overlap with
Jmjd2b-Jmjd2c common target genes at promoter and distal
target loci (Figures 3E–3G).
For a global view of Jmjd2b unique, Jmjd2c unique, and
Jmjd2b-Jmjd2c common targets along with transcription factors
and histone marks, we collated genome-wide targets. Hierarchi-
cal clustering tree and heat map representation of occupancy
correlation revealed three distinct ESC regulatory modules:
Polycomb, Myc, and Core, as described previously (Kim et al.,
2010). Jmjd2c unique targets segregated to the Polycomb mod-
ule, whereas Jmjd2b unique and Jmjd2b-Jmjd2c common target
genes correlated to the Core and Myc modules, respectively,
which were interconnected by targets of mediators Med1 and
Med12 (Figure 3H).
To determine whether genes targeted by Jmjd2b and Jmjd2c
correlate with different functions as predicted by the correlation
of common targets with distinct modules, we performed GO
analysis. Jmjd2b-Jmjd2c common target genes were highly
enriched for transcriptional regulation, DNA binding, and cell-
cycle-related terms, whereas Jmjd2b and Jmjd2c unique targets
related to nucleosome assembly and several development pro-
cesses, respectively (Figure S3F). In addition, IPA demonstrated
that Jmjd2b-Jmjd2c common target genes were closely related
to DNA damage and many cancer-related pathways, such as
Figure 2. Jmjd2b/Kdm4b and Jmjd2c/Kdm4c Are Essential for mESC
(A) Hierarchical clustering of gene expression profiles fromAnti-GFP (control) and
shRNAs)depletedcells. Theaverage foldchange fromtwodifferent shRNAswasca
redcurveshows the relativeexpressionchangesof thesecluster genesbetweenun
(B) Venn diagrams representing overlapping up- or downregulated genes betwe
(C and D) Gene expression analyses for ESC-specific genes and lineage-specific
were used as internal controls. Data shown are averaged from three biological rep
using ANOVA; p < 0.01.
(E and F) GSEA of a differentially expressed gene set of Jmjd2b and Jmjd2c dep
See also Figure S2.
p53, PI3K-AKT, and ESC pluripotency (Figure S3G), consistent
with the Myc module (Kim et al., 2010). Meanwhile, Jmjd2c
unique target genes were mainly associated with several
neuronal signaling pathways (Figure S3G), compatible with
association of the PRC2 module with development. Taken
together, these data provide evidence that Jmjd2b and Jmjd2c
act individually and combinatorially through different regulatory
cassettes in mESCs.
Jmjd2b/Kdm4b and Jmjd2c/Kdm4c Interact with KeyComponents of Different Regulatory ModulesNuclear factors that exhibit common targets often physically
associate (Kim et al., 2010). Therefore, we examined physical
interactions between Jmjd2b and Jmjd2c with core compo-
nents of each regulatory module. Coimmunoprecipitation (co-
IP) with Ezh2 antibody revealed an association of Jmjd2c and
components of the PRC2 complex (Ezh2, Suz12, Jarid2) (Fig-
ure 3I). In contrast, other Kdm4 family members, Jmjd2a,
Jmjd2b, and Jmjd2d, did not coimmunoprecipitate with Ezh2.
Conversely, co-IP with Jmjd2c antibody confirmed interaction
between Jmjd2c and members of the PRC2 complex, but not
with key components (Nanog and Sox2) of other regulatory
modules (Figure 3I). The interaction between Jmjd2c and
PRC2 components is specific, as Jmjd2c does not interact de-
tectably with the PRC1 subunit Bmi1. Jmjd2c does not interact
with Jmjd2b (Figure 3I). We further examined whether stability of
the PRC2 complex is affected upon depletion of Jmjd2c, and
the converse. The level of Ezh2 protein was unaffected upon
depletion of Jmjd2c; moreover, the level of Jmjd2c protein
was unaltered upon Ezh2 depletion (Figure S3H). Finally, co-IP
of Jmjd2b revealed association with Oct4, Nanog, and cMyc,
but not with Ezh2 and Suz12 of the PRC2 complex (Figure 3J).
These data strengthen the functional relationship between
Jmjd2b and Jmjd2c with their central components of different
ESC regulatory modules.
To explore molecular changes upon depletion of Jmjd2b
and Jmjd2c, we examined global histone marks, including
H3K9me2/me3 and H3K36me2/me3, the putative substrates of
the Jmjd2b and Jmjd2c demethylases (Cloos et al., 2006; Agger
et al., 2008). We did not observe significant global changes,
including H3K9me2/me3 and H3K36me2/me3 (Figures S3I and
S3J). To examine potential redundant function of Jmjd2b and
Jmjd2c for these histone modifications, knockdown of both
Jmjd2b and Jmjd2c was performed (Figure S3K). An increased
level of global H3K9me3 was observed (Figure S3L). This finding
implies redundant or overlapping roles among the members of
the same subclass.
Identity
Jmjd2b (Jmjd2b-1 and Jmjd2b-4 shRNAs) and Jmjd2c (Jmjd2c-1 and Jmjd2c-2
lculated. Theheatmap represents the zscoreof expressionvalues,whereas the
differentiatedanddifferentiatedESCssmoothedbyamovingwindowof size50.
en Jmjd2b and Jmjd2c depleted cells.
differentiation genes from Jmjd2b and Jmjd2c depleted cells. Gapdh and actin
licates. Data are represented as mean ± SEM; n = 3; p values were calculated
leted cells. NES, normalized enrichment score; p, nominal p value.
Molecular Cell 53, 32–48, January 9, 2014 ª2014 Elsevier Inc. 37

B
PromoterExonIntronIntergenic region
PromoterExonIntronIntergenic region
32.8%
18% 9.2%
40%
69.4%
19.3%
4%
7.3%
A
8732
670711022
Jmjd2b Jmjd2c
Jmjd2b/Jmjd2c
Jmjd2b unique (~60%) Jmjd2c unique (~60%)Jmjd2b & Jmjd2c common (~40%)
All Peaks
Ezh2Jarid2Suz12
BivalentJmjd2c_unique
H3K27me3_OnlyJmjd2b_Jmjd2c Common
H3K4me3_OnlyH3K27ac_Promoter
p300_PromoterE2f1
ZfxcMycnMyc
Med12Med1
Klf4Tcfcp2l1
Jmjd2b_uniqueH3K4me1
P300_Distal
NanogSox2Oct4
Smad1Stat3
−0.5 −0.4 −0.3 −0.2 −0.1 0 0.1 0.2 0.3 0.4 0.5
H3K27ac_Distal
PromoterExonIntronIntergenic region
10.3%
47.8%
12.5%
29.5%
22.3%
4.3%
8.6%64.8%
14.5%3.5%5.2%
76.8%
Peak overlap
Jmjd2b & Jmjd2c distal target loci
Jmjd2b−Jmjd2c common
Jmjd2b unique
Jmjd2c unique
Jmjd2b−Jmjd2c common
Jmjd2b unique
Jmjd2c unique
Jmjd2b Jmjd2c
Ezh2
Jmjd2b Jmjd2c
Suz12
Jmjd2b
Jmjd2c Nanog
cMyc
Jmjd2b Jmjd2c
C
D
E F
G
H I
Polycomb module
Core module
Myc module
Jmjd2b genome-wide peaks (16087) Jmjd2c genome-wide peaks (18025)
Genome-wide peak distribution
6143
845
8699 7704
3262 1052
33 2728
60298523 5548
170 4507
1435
5659
10466 17708
6096 3052
556 901 8513 10247
467
5427
219 775 1564
J
Inpu
t
Ezh2:
IP
Anti-Jmjd2c/Kdm4c
Anti-Suz12
Anti-Ezh2Ig
G
Anti-Jmjd2b/Kdm4b
Anti-Jarid2
Anti-Jmjd2a/Kdm4a
Anti-Jmjd2d/Kdm4d
Inpu
t
Jmjd2
c:IP
IgG
Anti-Ezh2
Anti-Jmjd2b
Anti-Bmi1
Anti-Suz12
Anti-Jarid2
Anti-Oct4
Anti-Nanog
Anti-Sox2
Anti-Jmjd2b/Kdm4b
Anti-Myc
Anti-Gcn5
Inpu
t
IgG
Jmjd2
b : I
P
Anti-Ezh2
Anti-Suz12
Anti-Nanog
Anti-Sox2
Ezh2 Suz12 Pol2 InputH3K36me2 H3K36me3H3K9me2 H3K9me3H3K4me3 H3K27me3Jmjd2cJmjd2b
5
4.5
4
3.5
3
2.5
2
1.5
1
Jmjd2b & Jmjd2c promoter target loci
Jmjd2b−Jmjd2c common
Jmjd2b unique
Jmjd2c unique
6
5.5
5
4.5
4
3.5
3
2.5
2
1.5
1
H3K27ac H3K4me1 Nanog Oct4 Sox2 P300 Med1 Med12 Tet1 Klf4 cMyc E2f1
Jmjd2b & Jmjd2c promoter target loci6
5.5
5
4.5
4
3.5
3
2.5
2
1.5
1H3K27ac H3K4me1 Nanog Oct4 Sox2 P300 Med1 Med12 Tet1 Klf4 cMyc E2f1
(legend on next page)
Molecular Cell
Functions of Jmjd2b and Jmjd2c in Mouse ESCs
38 Molecular Cell 53, 32–48, January 9, 2014 ª2014 Elsevier Inc.

Molecular Cell
Functions of Jmjd2b and Jmjd2c in Mouse ESCs
Jmjd2b/Kdm4b and Nanog Act through anInterconnected Regulatory LoopTo interrogate potential molecular mechanisms of Jmjd2b
action, we generated ChIP-seq data sets of Nanog, Oct4, and
cMyc, as well as histone marks H3K4me3, H3K27me3,
H3K36me3, H3K9me3, and H3K27ac from both control (Anti-
GFP) and Jmjd2b-depleted ESCs. We calculated the log2 ratio
(M value) of ChIP-seq intensities between the two cell types
using MAnorm, a quantitative comparison algorithm (Shao
et al., 2012). The vast majority of Nanog binding peaks were
reduced >2-fold upon Jmjd2b knockdown (corresponding to
M value < �1) (Figure 4A; Table S7). As Jmjd2b unique targets
predominantly occupy distal regions, we assessed H3K27ac
occupancy at distal regions from control and Jmjd2b depleted
cells. Global occupancy of H3K27ac was unchanged at both
promoter and distal regions upon depletion of Jmjd2b (Fig-
ure 4B). Further analyses showed that global Nanog occupancy
was not dependent on Jmjd2b occupancy (Figure 4C), although
global Nanog occupancy was reduced significantly upon deple-
tion of Jmjd2b, suggesting other mechanisms by which Jmjd2b
regulates Nanog binding.
To investigate how Jmjd2b impinges on the Nanog regulatory
pathway, we examined expression of Nanog upon Jmjd2b
knockdown and observed significant reduction of Nanog, but
not Oct4, expression (Figures 4D and 4E). Subsequently, we
examined binding of Jmjd2b, Jmjd2c, Nanog, Oct4, mediators
(Med1 and Med12), and H3K27ac specifically at the Nanog
locus, and observed loss of Nanog binding selectively at its
enhancer locus upon Jmjd2b knockdown (Figure 4F). Similarly,
reduction or loss of Nanog binding was also found at regulatory
regions of several of its downstream target genes, including both
ESC-specific (Klf4 and Tbx3) and lineage-specific genes (Lefty1
and Otx2) upon knockdown of Jmjd2b (Figure 4G; Figures S4A–
S4C). Next, we determined whether Nanog regulates Jmjd2b
expression; surprisingly, we found that expression of Jmjd2b
was also reduced upon depletion of Nanog (Figure 4H) and
that occupancy of Nanog was reduced at the Jmjd2b locus in
Jmjd2b knockdown cells (Figure 4I), suggesting that Jmjd2b
andNanog control each other through a regulatory loop. Further-
more, we compared global gene expression changes upon
knockdown of Jmjd2b, Jmjd2c, Oct4, and Nanog. We observed
Figure 3. Genome-wide Mapping of Jmjd2b/Kdm4b and Jmjd2c/Kdm4
(A) Pie charts showing genome-wide peak distribution of Jmjd2b and Jmjd2c.
(B) Venn diagram showing the number of Jmjd2b and Jmjd2c overlapped and u
unique, and Jmjd2b-Jmjd2c common peaks.
(C and E) Heat maps showing the ChIP intensities of selected histone marks, TF
the ±5 kb regions around the peak summit of Jmjd2b unique, Jmjd2c unique, an
(D and G) Venn diagram showing the peak overlaps between Jmjd2b, Jmjd2c, a
(F) Heat map showing the ChIP intensities of histonemarks, TFs, and chromatin re
unique, and Jmjd2b-Jmjd2c common target loci at distal regions.
(H) Correlation map of binding loci showing the degree of co-occupancy between
defined by the combination of Jmjd2b and Jmjd2c as described in (B). Here, the co
is derived from hierarchical clustering.
(I) Coimmunoprecipitation using antibodies against Ezh2, Jmjd2c, and IgG. End
mESCs, and their interacting partners were analyzed by western blot using antib
(J) Jmjd2b antibody was used to immunoprecipitate endogenous Jmjd2b from nu
blot using antibodies. The asterisk indicates unspecific interactions.
See also Figure S3.
the highest correlation of global gene expression changes
between Jmjd2b and Nanog knockdown samples (Figure 4J).
Genes differentially expressed upon knockdown of Nanog signif-
icantly overlapped with differentially expressed genes following
Jmjd2b depletion (Figure 4K), indicating that their regulatory
pathways are tightly interconnected. Further analyses revealed
that the combined binding targets of Jmjd2b and Nanog
highly correlated with Jmjd2b-depleted downregulated genes,
whereas Nanog-only binding targets were correlated with
Jmjd2b-depleted upregulated genes (Figure 4L). These findings
are consistent with the prior observation that Nanog acts combi-
natorially in target gene activation but binds alone or with few
other proteins at repressed or nonexpressed targets (Kim
et al., 2008). Taken together, our data argue that Jmjd2b and
Nanog act through highly interconnected regulatory pathways.
To test this further, we performed rescue experiments with full-
length Jmjd2b, the catalytic domain (JmjC) of Jmjd2b (1–333 aa),
a catalyticmutant (HTE>ATA) of Jmjd2b, and full-length Nanog in
Jmjd2b-deficient ESCs (Figures S1F, S4L and S4M). Full-length
Jmjd2b fully rescued Nanog expression, and vice versa, in
Jmjd2b-deficient ESCs, whereas the catalytic domain (JmjC)-
containing Jmjd2b (1–333 aa) and the catalytic mutant
(HTE>ATA) of Jmjd2b only partially rescued Nanog expression
(Figures S4L and S4M), which is correlated with the restored
ESC growth phenotype and SSEA-1 expression (Figure S1F).
Our findings fail to replicate a prior report that Jmjd2c binds at
the Nanog promoter and regulates Nanog expression through
H3K9me3 levels (Loh et al., 2007). We observed Jmjd2b occu-
pancy at the Nanog locus, but did not detect a change in
H3K9me3 at this locus upon depletion of Jmjd2b (Figure S4D).
Moreover, we observed significant reduction of Nanog expres-
sion and occupancy at target genes (Nanog, Klf4, Otx2) upon
depletion of Jmjd2b but not upon depletion of Jmjd2c (Fig-
ure S4E), suggesting Jmjd2b-Nanog interconnected regulation.
Jmjd2c/Kdm4c Assists PRC2 in Repression in mESCsJmjd2c associates with the PRC2 complex, and targets of
Jmjd2c in chromatin correlate with the PRC2 regulatory module.
To gain insight into these relationships, we performed ChIP-
seq of Oct4, Nanog, Ezh2, cMyc, H3K4me3, H3K27me3,
H3K36me3, and H3K9me3 in both control (Anti-GFP) and
c in mESCs by ChIP-Seq
nique peaks. Pie charts represent the distribution of Jmjd2b unique, Jmjd2c
s, and chromatin regulators including components of PRC2 and RNA Pol II at
d Jmjd2b-Jmjd2c common promoter target loci.
nd the other factors Ezh2, Suz12, Nanog, and cMyc.
gulators at the ±5 kb regions around the peak summit of Jmjd2b unique, Jmjd2c
selected histone modifications, TFs, chromatin regulators, and three peak sets
lor scale represents the Pearson correlation coefficient, and the clustering tree
ogenous Ezh2 and Jmjd2c were immunoprecipitated from nuclear extracts of
odies as shown on the right. Asterisks indicate unspecific interactions.
clear extracts of mESCs, and its interacting partners were analyzed by western
Molecular Cell 53, 32–48, January 9, 2014 ª2014 Elsevier Inc. 39

Anti-G
FP_kd
Jmjd2
b-1_
kd
Anti-Actin
Anti-Jmjd2b
Anti-Oct4
Anti-Nanog
Jmjd2b Nanog Oct4
M value = log2(Jmjd2b kd / Anti-GFP kd)
Promoter H3K27ac
Distal H3K27ac
B
D E
F
G
H
M value = log2(Jmjd2b kd / Anti-GFP kd)
−20 −15 −10 −5 0 5 10
−20 −15 −10 −5 0 5 10
Nanog with Jmjd2b targets
Nanog without Jmjd2b targets
M value = log2(Jmjd2b kd / Anti-GFP kd)
Anti-GFP_kd Jmjd2b-1_ kd
Anti-GFP_kd Jmjd2b-1_ kd C
log2 ratio of Jmjd2c Kd vs control
−0.5 −0.4 −0.3 −0.2 −0.1 0 0.1 0.2 0.3 0.4 0.5
Nanog kd
Jmjd2b kd
712
163
110
Down-regulated genes
695
158
288 Nanog kd
Jmjd2b kd
Up-regulated genes
Anti-G
FP_kd
Jmjd2
b-4_
kd
Anti-Oct4
Anti-Nanog
Anti-Jmjd2b
Anti-Actin
Anti-G
FP_kd
Jmjd2
c-1_
kd
Anti-Oct4
Anti-Nanog
Anti-Jmjd2c
Anti-Actin
1 0.66 0.25 0.01
0.66 1 0.36 0.18
0.25 0.36 1 0.44
0.01 0.18 0.44 1
I
J
−20 −15 −10 −5 0 5 10
Nanog
Oct4
cMyc
H3K27ac
H3K4me3
H3K27me3
H3K9me3
H3K36me3
Anti-GFP_kd Jmjd2b-1_ kd A
K L
p-value =7E-74
p-value =2E-94
Klf4
Nanog_Anti-GFP_kd
Nanog_Jmjd2b-1_kd
Oct4_Anti-GFP_kd
Oct4_Jmjd2b-1_kd
Med1
Med12
H3K27ac_Anti-GFP_kd
H3K27ac_Jmjd2b-1_kd
H3K4me3
RNA Pol II
BirA
Jmjd2b-Fb
020
020
015
015
025
25
012
012
50
90
0
0
0
0150
15
Nanog Jmjd2b Jmjd2cOct4
Kdm4b/ Jmjd2b
010
0
10
08.5
08.5
035
035
014
010
025
0
60
Nanog_Anti-GFP_kd
Nanog_Jmjd2b-1_kd
Oct4_Anti-GFP_kd
Oct4_Jmjd2b-1_kd
Med1
Med12
H3K27ac_Anti-GFP_kd
H3K27ac_Jmjd2b-1_kd
H3K4me3
RNA Pol II
Jmjd2b-Fb 0700
70
BirA
Pearson Correlation Coefficient
log2 ratio of Jmjd2b Kd vs control
log2 ratio of Nanog Kd vs control
log2 ratio of Oct4 Kd vs control 0 2 4 6 8 10 12
Jmjd2b & Nanog common target genes
Nanog unique target genes
Jmjd2b unique target genes
−log10(P−value)
Overlap with Jmjd2b KD FC2 downregulated GenesOverlap with Jmjd2b KD FC2 upregulated Genes
Jmjd2
b-1_
kd
Anti-G
FP
Anti-G
FP
Anti-G
FP0.0
0.5
1.0
1.5
Fol
dch
ange
(mR
NA
leve
l)
Jmjd2
b-1_
kd
Jmjd2
b-1_
kd
Anti-G
FP_kd
Nanog
_kd
Nanog
_kd
Nanog
_kd
Nanog
_kd
0.0
0.5
1.0
1.5
Fold
chan
ge(m
RN
Ale
vel)
Anti-G
FP_kd
Anti-G
FP_kd
Anti-G
FP_kd
**
*
** *
***
*
0
10
010
060
060
040
040
016
Nanog
030
030
0
750
65
0
20
Nanog_Anti-GFP_kd
Nanog_Jmjd2b-1_kd
Oct4_Anti-GFP_kd
Oct4_Jmjd2b-1_kd
Med1
Med12
H3K27ac_Anti-GFP_kd
H3K27ac_Jmjd2b-1_kd
H3K4me3
RNA Pol II
BirA
Jmjd2b-Fb
(legend on next page)
Molecular Cell
Functions of Jmjd2b and Jmjd2c in Mouse ESCs
40 Molecular Cell 53, 32–48, January 9, 2014 ª2014 Elsevier Inc.

Molecular Cell
Functions of Jmjd2b and Jmjd2c in Mouse ESCs
Jmjd2c knockdown mESCs. Quantitative comparison indicated
that none of these factors demonstrated a significant global
change of binding intensity (Figure 5A; Table S7), suggesting
that the predominant effect of Jmjd2c depletion is restricted to
a subset of genes.
Genes that displayed increased expression upon Jmjd2c
knockdown were composed principally of developmentally
regulated genes (Figures S2D and S2E). Because this class is
highly enriched in bivalent marks (and the presence of Ezh2) in
ESCs, we compared the binding of Ezh2/H3K27me3 and Jmjd2c
at the promoter region of these genes. We observed highly sig-
nificant co-occupancy of Jmjd2c and Ezh2 at these Jmjd2c-
depleted upregulated genes (Figure 5B). Yet neither Jmjd2c
nor Ezh2 alone significantly occupies these upregulated genes,
suggesting that Jmjd2c and Ezh2 act combinatorially in gene
repression and that Jmjd2c exerts a direct gene regulatory influ-
ence through occupancy of these promoters (Figure 5B). More-
over, Jmjd2c knockdown did not significantly alter occupancy of
Ezh2/H3K27me3 at Jmjd2c-depleted upregulated genes (Fig-
ure 5C; Figure S5A), indicating that Ezh2 alone is insufficient to
repress these upregulated genes and requires Jmjd2c for full
repression. Further study of several developmental genes,
Pitx2, Fgf5, Wnt3, T, and Olig3 that were strongly upregulated
in Jmjd2c knockdown cells, showed that indeed these gene
loci are occupied by both Jmjd2c and Ezh2. However, the bind-
ing of Ezh2 and the presence of H3K27me3 were largely
‘‘invariant’’ at these loci upon depletion of Jmjd2c (Figures 5D
and 5F; Figures S5B and S5C). Thus, although recruitment of
PRC2/Ezh2 and H3K27me3 deposition are independent of
Jmjd2c, full repression associated with PRC2 at these targets
requires Jmjd2c.
Jmjd2c/Kdm4c and PRC2 Block Transcription at PRC2Target GenesBecause the H3K27me3 mark is largely unchanged at upregu-
lated genes upon Jmjd2c depletion (Figures 5C–5F; Figure S5A),
we speculated that Jmjd2c might affect other aspects of PRC2-
mediated repression. Recent studies indicate that bivalent
genes bound by PRC2 exhibit RNA Pol II pausing at proximal
Figure 4. Jmjd2b/Kdm4b and Nanog Act through an Interconnected R
(A) Box plots of the log2 fold changes of binding intensities between Anti-GFP (c
H3K4me3, H3K27me3, H3K36me3, and H3K9me3. Red crosses correspond to
(B) Box plot of the log2 fold changes of H3K27ac marks at its promoter and dista
(C) Box plot of the log2 fold changes of Nanog binding intensities with or without
(D) mRNA expression levels of Jmjd2b, Nanog, and Oct4 from Anti-GFP (control)
represented as mean ± SEM; n = 3; p values were calculated using t test; **p < 0
(E) Western blot analyses of Nanog and Oct4 from Jmjd2b (using two individual
(F and G) Genomic tracks of ChIP intensities of factor and histone mark binding
(H)mRNA expression levels of Jmjd2b, Jmjd2c, Oct4, and Nanog fromNanog KD a
Data are represented as mean ± SEM; n = 3; p values were calculated using t te
(I) Genomic tracks of ChIP intensities of factor and histone mark binding at the Kdm
(J) Clustering patterns of global gene expression changes by log2 ratio in Jmjd2b, J
Colors and numbers represent the Pearson correlation coefficient.
(K) Venn diagram of overlapped up- or downregulated genes in Jmjd2b and Nan
(L) p values represent enrichment of overlap between up- or downregulated gene
and target genes occupied by either Jmjd2b or Nanog or both inmESCs (see Supp
target genes). The height of the bars represents a�log10-transformed p value, de
p value of 0.01, above which overlap will be considered as significantly enriched
See also Figure S4.
promoters with reduction of productive transcriptional elonga-
tion (Min et al., 2011), thereby providing another mechanism of
repression. Through co-IP, we observed that both Ezh2 and
Jmjd2c interact with pausing factors (NelfA and Spt5), as well
as with components of the core transcriptionmachinery involved
in initiation and elongation, including unphosphorylated RNA Pol
II (RNAP) (initiation), RNA Pol II Ser-5p (RNAP-S5p) (initiation),
RNA Pol II Ser-2p (RNAP-S2p) (elongation), Cdk9 (initiation),
Ctr9 (component of Paf1c elongation complex), and cMyc (initi-
ation; involved in pause release) (Peterlin and Price, 2006; Rahl
et al., 2010; Nechaev and Adelman, 2011) (Figure S6A). Further-
more, full-length Jmjd2c, as well as its catalytic domain (1–333
aa), interacted with Ezh2, RNAP, and Cdk9 (Figure S6B).
To gain further insights into themechanistic role of Jmjd2c and
Ezh2 in RNA Pol II pausing, we examined three sets of genes
defined by promoter occupancy of Jmjd2b, Jmjd2c, H3K4me3,
and H3K27me3: Jmjd2b-Jmjd2c common active genes
(H3K4me3-only), Jmjd2c unique active genes (H3K4me3-only),
and all H3K27me3 repressed genes (including both bivalent
and H3K27me3-only genes, most of which are PRC2 target
genes and overlap with Jmjd2c target genes) (Figure 6A; Fig-
ure S3D). Jmjd2b-Jmjd2c common active genes showed
strong binding of transcription initiation factors, including
RNAP, RNAP-S5p, NelfA, Spt5, and cMyc at the transcription
start site (TSS), as well as strong occupancy of factors
associated with elongation, including RNAP-S2p, Ctr9, Spt5,
H3K36me3, and H3K79me2 at gene bodies (Figure 6A). Binding
of these transcription initiation and elongation factors at Jmjd2c
unique active genes was reduced compared to Jmjd2b-Jmjd2c
common active genes. In addition, repressed genes bound by
Jmjd2c and PRC2 (H3K27me3) showed dramatic loss of binding
of these factors at the TSS and gene bodies (Figure 6A), indi-
cating that they are indeed poised/repressed in mESCs. Further-
more, comparing the expression levels among these three
sets of genes confirmed that they exhibit significantly different
levels of expression, which are themselves correlated with occu-
pancy of transcription initiation and elongation factors (Fig-
ure 6B). Specifically, we observed that combined PRC2/Jmjd2c
target genes are occupied by RNAP, RNAP-S5p, NelfA, and
egulatory Loop
ontrol) and Jmjd2b knockdown (KD) ESCs for Nanog, Oct4, cMyc, H3K27ac,
outliers.
l targets from Anti-GFP (control) and Jmjd2b KD cells.
Jmjd2b occupancy in Anti-GFP (control) and Jmjd2b KD cells.
and Jmjd2b KD cells. Transcript levels were normalized using Gapdh. Data are
.001, *p < 0.01.
shRNAs) and Jmjd2c and Anti-GFP (control) depleted cells.
at Nanog and Klf4 loci.
nd Anti-GFPKD (control) cells. Transcript levels were normalized usingGapdh.
st; **p < 0.001, *p < 0.01.
4b/Jmjd2b locus. Jmjd2b shows no enrichment of its binding at its own locus.
mjd2c, Nanog, andOct4 depleted cells relative to their corresponding controls.
og knockdown cells.
s in Jmjd2b knockdown cells compared to Anti-GFP (control) knockdown cells
lemental Experimental Procedures for the definition of Jmjd2b andNanogChIP
rived from right-tailed Fisher’s exact test, and the dotted line corresponds to a
.
Molecular Cell 53, 32–48, January 9, 2014 ª2014 Elsevier Inc. 41

A
B C
D
−20 −15 −10 −5 0 5 10
Nanog
Oct4
Ezh2
cMyc
H3K4me3
H3K27me3
H3K9me3
H3K36me3
Jmjd2c-1_kd Anti-GFP_kd
M value = log2(Jmjd2c kd / Anti-GFP kd)
E
F
Pitx2
0
10
0
10
015
0
15
015
0
15
0
10
010
0
3
03
0
8
08
Ezh2_Anti-GFP_kdEzh2_Jmjd2c-1_ kd
H3K27me3_Anti-GFP_kdH3K27me3_Jmjd2c-1_ kd
H3K4me3_Anti-GFP_kdH3K4me3_Jmjd2c-1_ kd
BirAJmjd2c-FB
H3K9me3_Anti-GFP_kdH3K9me3_Jmjd2c-1_ kd
H3K36me3_Anti-GFP_kdH3K36me3_Jmjd2c-1_ kd
Fgf5
0
10
0
10
010
010
010
010
08
08
0
3
03
0
5
05
Ezh2_Anti-GFP_kdEzh2_Jmjd2c-1_ kd
H3K27me3_Anti-GFP_kdH3K27me3_Jmjd2c-1_ kd
H3K4me3_Anti-GFP_kdH3K4me3_Jmjd2c-1_ kd
BirAJmjd2c-FB
H3K9me3_Anti-GFP_kdH3K9me3_Jmjd2c-1_ kd
H3K36me3_Anti-GFP_kdH3K36me3_Jmjd2c-1_ kd
Wnt3
0
10
0
10
010
0
10
015
015
0
10
010
010
0
10
010
010
Ezh2_Anti-GFP_kdEzh2_Jmjd2c-1_ kd
H3K27me3_Anti-GFP_kdH3K27me3_Jmjd2c-1_ kd
H3K4me3_Anti-GFP_kdH3K4me3_Jmjd2c-1_ kd
BirAJmjd2c-FB
H3K9me3_Anti-GFP_kdH3K9me3_Jmjd2c-1_ kd
H3K36me3_Anti-GFP_kdH3K36me3_Jmjd2c-1_ kd
Jmjd2c and Ezh2 common target genes
Jmjd2c unique target genes
Ezh2 unique target genes
Genes occupied by Ezh2 in both Anti-GFP kd and Jmjd2c kd cells
Genes occupied by Ezh2 only in Anti-GFP kd cells
Genes occupied by Ezh2 only in Jmjd2c kd cells
0 5 10 15 20
−log10(P−value)
Overlap with Jmjd2c kd downregulated GenesOverlap with Jmjd2c kd upregulated Genes
0 2 4 6 8 10 12 14 16 18
−log10(P−value)
Overlap with Jmjd2c kd downregulated GenesOverlap with Jmjd2c kd upregulated Genes
Figure 5. Jmjd2c/Kdm4c Assists PRC2 in Repression in mESCs
(A) Box plots of the log2 fold change of binding intensities between Anti-GFP (control) and Jmjd2c depleted cells for Nanog, Oct4, Ezh2, cMyc, H3K4me3,
H3K27me3, H3K36me3, and H3K9me3. Red crosses correspond to outliers.
(B) p values represent enrichment of overlap between up- or downregulated genes from Jmjd2c knockdown cells compared to Anti-GFP (control) knockdown
cells and target genes occupied by either Jmjd2c or Ezh2 or both in mESCs at promoters. The height of the bars represents�log10-transformed p value derived
from right-tailed Fisher’s exact test, and the dotted line corresponds to a p value of 0.01.
(legend continued on next page)
Molecular Cell
Functions of Jmjd2b and Jmjd2c in Mouse ESCs
42 Molecular Cell 53, 32–48, January 9, 2014 ª2014 Elsevier Inc.

Molecular Cell
Functions of Jmjd2b and Jmjd2c in Mouse ESCs
Spt5 at the promoter regions but not with elongation factors
(RNAP-S2p, Ctr9, H3K36me3, and H3K79me2) at gene bodies,
suggesting that these poised/repressed genes are probably
paused with RNA Pol II (Figure 6A) (Nechaev and Adelman,
2011). We observed that cMyc occupancy directly correlated
with transcription of two sets of active genes but not with
PRC2 target genes (Figure 6A), consistent with a role for cMyc
in active transcription through RNA Pol II pause release at
actively transcribed genes in mESCs (Rahl et al., 2010). These
data point to a role for Jmjd2c in transcriptional repression,
most likely through blocking of RNA Pol II recruitment and/or
pausing of RNA Pol II at Jmjd2c-occupied PRC2 target genes.
Next, we examined occupancy of selected factors and histone
marks involved in transcription initiation and elongation in
Jmjd2c and control (Anti-GFP) knockdown cells. Global occu-
pancy of these factors and histone marks did not differ signifi-
cantly between these cells (Figure 5A; Figure S6C; Table S7).
We then used a quantitative comparisonmethod to discover fac-
tors whose binding is altered significantly at Jmjd2c-depleted
up- and downregulated genes (see Supplemental Experimental
Procedures for detailed methods). Jmjd2c depleted upregu-
lated genes reveal significantly higher binding of RNAP, RNAP-
S5p, RNAP-S2p, Ctr9, and H3K36me3 mark (a mark associated
with transcription elongation), whereas Jmjd2c-depleted down-
regulated genes showed reduced occupancy of these factors
and histone marks (Figure 6C; Figure S6D). Moreover, we
observed increased and decreased occupancy of transcription
initiation and elongation factors at specific upregulated and
downregulated gene loci, respectively, upon Jmjd2c depletion
(Figures 6D–6I; Figures S6E–S6H), indicating correlation be-
tween occupancy of the transcription machinery and gene
expression. We demonstrate that Jmjd2c and Ezh2 co-occupy
significantly at Jmjd2c-depleted upregulated genes compared
to downregulated genes (Figure 5B) and that these upregulated
genes display increased binding of transcription machinery fac-
tors and histone marks upon depletion of Jmjd2c, suggesting
that Jmjd2c directly regulates these upregulated genes. On the
other hand, no correlation was observed between Jmjd2c occu-
pancy and Jmjd2c-depleted downregulated genes (Figure 5B),
indicative of indirect regulation of these genes through Jmjd2c.
Taken together, these data indicate that Jmjd2c is required in
ESCs for full repression by PRC2 at poised/repressed develop-
mental genes.
DISCUSSION
Jmjd2b/Kdm4b and Jmjd2c/Kdm4c Belong to DistinctRegulatory Modules in mESCsDepletion of either Jmjd2b or Jmjd2c leads to ostensibly similar
differentiation phenotypes and comparable overall global gene
expression patterns in ESCs (Figures 1B and 2; Figure S1B).
However, global chromatin occupancy studies of Jmjd2b and
(C) p values represent enrichment of overlap between up- or downregulated gen
cells and the promoter target genes of Ezh2 in these two cell types. The p value
(D–F) Genomic tracks of ChIP-seq intensities of Jmjd2c, Ezh2, and histone mark
loci upon Jmjd2c depletion (Pitx2, Fgf5, and Wnt3).
See also Figure S5.
Jmjd2c demonstrate that each occupies numerous unique and
common targets and correlates with functionally distinct regula-
tory modules. Jmjd2b unique, Jmjd2b-Jmjd2c common, and
Jmjd2c unique targets partition to the Core, Myc, and PRC reg-
ulatory modules of the overall ESC network, respectively (Fig-
ure 3H). Thus, these closely related HDMs subserve specialized
targets, in part relating to their combinatorial partitioning. Meta-
gene analyses provide further support that occupancy of Jmjd2b
and Jmjd2c unique and common targets is correlated with the
pattern of gene expression in mESCs (Figure S3C). Protein-
protein interaction studies corroborate that Jmjd2b and Jmjd2c
physically interact with distinct regulators, specifically Jmjd2b
with factors of the Core pluripotency network and Jmjd2c with
components of the PRC2 complex (Figures 3I and 3J). Therefore,
we speculate that combinatorial binding patterns of HDMs
across the genome will be critical for understanding regulatory
programs in cell-type-specific transcriptional regulation.
Jmjd2b/Kdm4b, Jmjd2c/Kdm4c, and HistoneModificationsCombinations of histone modifications play a crucial role in gene
regulation (Zhou et al., 2011). Jmjd2b and Jmjd2c are classified
as H3K9me2/3 and H3K36me2/3 HDMs (Agger et al., 2008;
Cloos et al., 2006). As H3K36me2/me3 and H3K9me2/3 are
indicative of divergent transcriptional outcomes, it is possible
that Jmjd2b and Jmjd2c function differently in a cell-type-
specific and context-dependent manner. A relatively low level
of H3K9me3 correlates with the highly active and open ESC
and iPSC genome (Meshorer and Misteli, 2006; Soufi et al.,
2012). Recent studies also demonstrate that depletion of all
H3K9 demethylases, including Jmjd2b and Jmjd2c, significantly
inhibits reprogramming of pre-iPSCs to iPSCs. Conversely,
depletion of the H3K9 methyltransferase Setdb1 leads to highly
efficient reprogramming, indicating that removal of H3K9me3 is
essential for establishment of the ESC/iPSC state (Chen et al.,
2013). In this study, we did not observe significant changes in
‘‘global’’ histone levels or occupancy, including H3K9me2/3
and H3K36me2/3 marks, upon depletion of either Jmjd2b or
Jmjd2c (Figures 4A and 5A; Figures S3I and S3J). However, dou-
ble knockdown of Jmjd2b and Jmjd2c led to an increased level
of global H3K9me3 (Figures S3K and S3L), suggesting a redun-
dant function in ESCs. We also monitored the effects of Jmjd2b
and Jmjd2c depletion on histone marks (H3K4me3, H3K27me3,
H3K9me3, and H3K36me3) at several ‘‘individual’’ loci. For
Jmjd2b-Jmjd2c common active genes, we observed reduction
of H3K4me3 and H3K36me3 occupancy at several active gene
loci, such as Klf4, Tbx3, and Esrrb, upon depletion of either
Jmjd2b or Jmjd2c (Figure 7; Figures S4F–S4K and S7A–S7C).
In the context of Jmjd2b-Nanog interconnected regulation, we
did not observe any significant change of H3K9me3 at theNanog
locus and its downstream target genes upon depletion of
Jmjd2b. However, we observed occupancy changes at several
es from Jmjd2c knockdown cells compared to Anti-GFP (control) knockdown
represents the same as in (B).
s in both Anti-GFP (control) and Jmjd2c KD cells at selected upregulated gene
Molecular Cell 53, 32–48, January 9, 2014 ª2014 Elsevier Inc. 43

Jmjd2b Jmjd2c cMyc Ezh2 K4me3 K27me3 K79me2 K36me3 NelfA Spt5 Ctr9 RNAP RNAP-S5pRNAP-S2p
Jmjd2b/2c Common Active Genes(+H3K4me3 -H3K27me3)
All H3K27me3 Repressed Genes
3.5
2.5
1.5
1
2
3
4
Jmjd2c Unique Active Genes(+H3K4me3 -H3K27me3)
Jmjd2b & Jmjd2c promoter target genes
Jmjd2b/2c Common Active Genes
Jmjd2c Unique Active Genes
All K27me3 Repressed Genes
Exp
ress
ion
Val
ue
B C
(both bivalent & H3K27me3 only)
A
Name Up-regulated genes (p-value)
Down-regulated genes (p-value)
Significance of differential binding of factors and histone marks at Jmjd2c up and down regulated genes
0
500
1000
1500
2000
2500
3000
3500
4000
P=4E-58
P<1E-100
0
5
05
08.5
08.5
0
6
0
6
05
0
5
03.5
03.5
Pax6
RNA Pol II_Anti-GFP_kd
RNA Pol II_Jmjd2c-1_kd
RNA Pol II Ser5p_Anti-GFP_kd
RNA Pol II Ser5p_Jmjd2c-1_kd
RNA Pol II Ser2p_Anti-GFP_kd
RNA Pol II Ser2p_Jmjd2c-1_kd
H3K36me3_Anti-GFP_kd
H3K36me3_Jmjd2c-1_kd
Ctr9_Anti-GFP_kd
Ctr9_Jmjd2c-1_kd
0
0.113
-0.734
0.694
0
2.288
0
1.552
0
3.391
Pax6
RNA Pol II_M value
RNA Pol II Ser5p_M value
RNA Pol II Ser2p_M value
H3K36me3_M value
Ctr9_M value
G
0
0.556
-0.387
1.108
0
1.053
0
1.552
0
3.072
Pitx2
RNA Pol II_M value
RNA Pol II Ser5p_M value
RNA Pol II Ser2p_M value
H3K36me3_M value
Ctr9_M value
0
8.5
08.5
012
012
05
05
03
03
03.5
0
3.5
Pitx2
RNA Pol II_Anti-GFP_kd
RNA Pol II_Jmjd2c-1_kd
RNA Pol II Ser5p_Anti-GFP_kd
RNA Pol II Ser5p_Jmjd2c-1_kd
RNA Pol II Ser2p_Anti-GFP_kdRNA Pol II Ser2p_Jmjd2c-1_kd
H3K36me3_Anti-GFP_kd
H3K36me3_Jmjd2c-1_kd
Ctr9_Anti-GFP_kd
Ctr9_Jmjd2c-1_kd
F
D E
RNA Pol II 1.7E 06 1.0E 06RNA Pol II Ser5p 0.001 4.4E 09RNA Pol II Ser2p 0.005 0.0017Ctr9 0.0002 NSSpt5 NS 3E 18H3K36me3 3.7E-05 4.5E 20Ezh2 NS 0.00017H3K27me3 NS NSH3K4me3 NS NScMyc NS NSH3K9me3 NS NS
0
45
045
025
025
05
05
020
020
07.5
07.5
Klf4
RNA Pol II_Anti-GFP_kd
RNA Pol II_Jmjd2c-1_kd
RNA Pol II Ser5p_Anti-GFP_kdRNA Pol II Ser5p_Jmjd2c-1_kd
RNA Pol II Ser2p_Anti-GFP_kd
RNA Pol II Ser2p_Jmjd2c-1_kd
H3K36me3_Anti-GFP_kd
H3K36me3_Jmjd2c-1_kd
Ctr9_Anti-GFP_kd
Ctr9_Jmjd2c-1_kd
-0.6880.023
-0.660
-6.3840
-0.6310
Klf4
RNA Pol II_M value
RNA Pol II Ser5p_M value
RNA Pol II Ser2p_M value
H3K36me3_M value
H I
(legend on next page)
Molecular Cell
Functions of Jmjd2b and Jmjd2c in Mouse ESCs
44 Molecular Cell 53, 32–48, January 9, 2014 ª2014 Elsevier Inc.
Molecular Cell
Functions of Jmjd2b and Jmjd2c in Mouse ESCs
discrete loci for H3K4me3 (e.g., Nanog, Klf4, Tbx3, and Esrrb
promoters) and H3K36me3 (e.g., Klf4, Tbx3, and Otx2 gene
bodies) (Figure 7; Figures S4F–S4K). Interestingly, we found
that some of the Jmjd2b-Jmjd2c common active genes are the
downstream targets of Nanog, suggesting a fraction of common
targets is regulated through the Jmjd2b-Nanog regulatory loop
(Figures 4G and 7; Figures S4A–S4C and S7A–S7C). On the
other hand, with respect to the role of Jmjd2c in PRC2-mediated
repression, we observed that the upregulated genes upon
Jmjd2c depletion are significantly co-occupied by Jmjd2c and
Ezh2, and that Jmjd2c assists PRC2 in full repression at these
poised/repressed genes (e.g., Fgf5, Pitx2, Pax6) through tran-
scription repression (Figure 5B). Moreover, these upregulated
genes showed significantly increased binding of the transcrip-
tional machinery (RNAP, RNAP-S5p, RNAP-S2p, Ctr9) and his-
tone marks, especially H3K36me3 (an elongation mark), but
not other histone marks upon depletion of Jmjd2c (Figures 6C–
6I and 7; Figures S6D–S6H), indicative of a link between
Jmjd2c-PRC2 and transcription elongation. This supports a pre-
vious observation in which Polycomb-like-PRC2 recognizes
H3K36me3 and silences active chromatin regions for mainte-
nance of ESC pluripotency (Cai et al., 2013).
Our study reveals unexpected outcomes of the histone deme-
thylase function of Jmjd2b and Jmjd2c and its substrate speci-
ficity. However, rescue studies demonstrate that catalytic
activity of Jmjd2b and Jmjd2c is indeed required for self-renewal
of ESCs. Moreover, our findings indicate a complex interplay
between various histone modifications and/or that Jmjd2b and
Jmjd2c may have additional roles beyond histone targets.
Recent studies have indicated that Jmjd2b is an integral part
of the MLL2 complex that deposits the H3K4me3 mark, and
H3K9me3 is a prerequisite of H3K4me3 deposition for ERa-acti-
vated gene transcription (Shi et al., 2011), suggesting crosstalk
between histone modifications.
Jmjd2b/Kdm4b and Jmjd2c/Kdm4cAct throughDistinctand Combinatorial Pathways in mESCsAs a core pluripotency factor, Nanog functions together with
other Core transcription factors (such as Oct4 and Sox2) to posi-
tively regulate their expression through autoregulatory loops, as
well as occupy and activate ESC-specific genes and repress
lineage-specific genes to maintain the ESC state (Young,
2011). We demonstrate that Jmjd2b is involved in the regulation
of Nanog expression and occupancy of its downstream target
genes. Moreover, Nanog regulates Jmjd2b expression that is
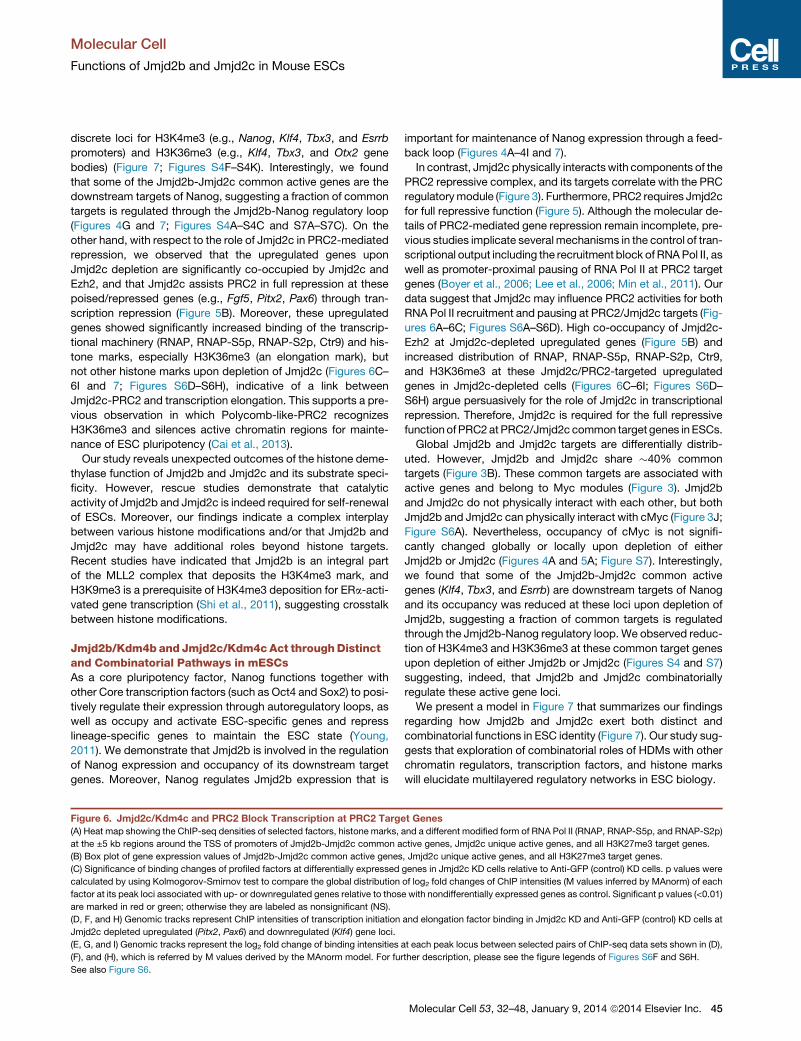
Figure 6. Jmjd2c/Kdm4c and PRC2 Block Transcription at PRC2 Targ
(A) Heat map showing the ChIP-seq densities of selected factors, histone marks,
at the ±5 kb regions around the TSS of promoters of Jmjd2b-Jmjd2c common a
(B) Box plot of gene expression values of Jmjd2b-Jmjd2c common active genes
(C) Significance of binding changes of profiled factors at differentially expressed
calculated by using Kolmogorov-Smirnov test to compare the global distribution
factor at its peak loci associated with up- or downregulated genes relative to thos
are marked in red or green; otherwise they are labeled as nonsignificant (NS).
(D, F, and H) Genomic tracks represent ChIP intensities of transcription initiation
Jmjd2c depleted upregulated (Pitx2, Pax6) and downregulated (Klf4) gene loci.
(E, G, and I) Genomic tracks represent the log2 fold change of binding intensities
(F), and (H), which is referred by M values derived by the MAnorm model. For fu
See also Figure S6.
important for maintenance of Nanog expression through a feed-
back loop (Figures 4A–4I and 7).
In contrast, Jmjd2c physically interactswith components of the
PRC2 repressive complex, and its targets correlate with the PRC
regulatorymodule (Figure 3). Furthermore, PRC2 requires Jmjd2c
for full repressive function (Figure 5). Although the molecular de-
tails of PRC2-mediated gene repression remain incomplete, pre-
vious studies implicate several mechanisms in the control of tran-
scriptional output including the recruitment block of RNAPol II, as
well as promoter-proximal pausing of RNA Pol II at PRC2 target
genes (Boyer et al., 2006; Lee et al., 2006; Min et al., 2011). Our
data suggest that Jmjd2c may influence PRC2 activities for both
RNA Pol II recruitment and pausing at PRC2/Jmjd2c targets (Fig-
ures 6A–6C; Figures S6A–S6D). High co-occupancy of Jmjd2c-
Ezh2 at Jmjd2c-depleted upregulated genes (Figure 5B) and
increased distribution of RNAP, RNAP-S5p, RNAP-S2p, Ctr9,
and H3K36me3 at these Jmjd2c/PRC2-targeted upregulated
genes in Jmjd2c-depleted cells (Figures 6C–6I; Figures S6D–
S6H) argue persuasively for the role of Jmjd2c in transcriptional
repression. Therefore, Jmjd2c is required for the full repressive
functionof PRC2at PRC2/Jmjd2c common target genes inESCs.
Global Jmjd2b and Jmjd2c targets are differentially distrib-
uted. However, Jmjd2b and Jmjd2c share �40% common
targets (Figure 3B). These common targets are associated with
active genes and belong to Myc modules (Figure 3). Jmjd2b
and Jmjd2c do not physically interact with each other, but both
Jmjd2b and Jmjd2c can physically interact with cMyc (Figure 3J;
Figure S6A). Nevertheless, occupancy of cMyc is not signifi-
cantly changed globally or locally upon depletion of either
Jmjd2b or Jmjd2c (Figures 4A and 5A; Figure S7). Interestingly,
we found that some of the Jmjd2b-Jmjd2c common active
genes (Klf4, Tbx3, and Esrrb) are downstream targets of Nanog
and its occupancy was reduced at these loci upon depletion of
Jmjd2b, suggesting a fraction of common targets is regulated
through the Jmjd2b-Nanog regulatory loop.We observed reduc-
tion of H3K4me3 and H3K36me3 at these common target genes
upon depletion of either Jmjd2b or Jmjd2c (Figures S4 and S7)
suggesting, indeed, that Jmjd2b and Jmjd2c combinatorially
regulate these active gene loci.
We present a model in Figure 7 that summarizes our findings
regarding how Jmjd2b and Jmjd2c exert both distinct and
combinatorial functions in ESC identity (Figure 7). Our study sug-
gests that exploration of combinatorial roles of HDMs with other
chromatin regulators, transcription factors, and histone marks
will elucidate multilayered regulatory networks in ESC biology.
et Genes
and a different modified form of RNA Pol II (RNAP, RNAP-S5p, and RNAP-S2p)
ctive genes, Jmjd2c unique active genes, and all H3K27me3 target genes.
, Jmjd2c unique active genes, and all H3K27me3 target genes.
genes in Jmjd2c KD cells relative to Anti-GFP (control) KD cells. p values were
of log2 fold changes of ChIP intensities (M values inferred by MAnorm) of each
e with nondifferentially expressed genes as control. Significant p values (<0.01)
and elongation factor binding in Jmjd2c KD and Anti-GFP (control) KD cells at
at each peak locus between selected pairs of ChIP-seq data sets shown in (D),
rther description, please see the figure legends of Figures S6F and S6H.
Molecular Cell 53, 32–48, January 9, 2014 ª2014 Elsevier Inc. 45

Jmjd2c/Kdm4c unique target genes (Poised/ Repressed Genes)
Jmjd2c depletion
ESC state Differentiated state
Fgf5, Pitx2, Pax6
RNAp
Ctr9RNAP-S5p
Jmjd2c RNAP-S2p
H3K36
me3
H3K4m
e3
H3K27
me3 RNAp Ctr9
RNAP-S5p RNAP-S2pH3K
36m
e3
H3K4m
e3
H3K27
me3
H3K36
me3
H3K4m
e3
Nanog
Oct4Med Smc
Jmjd2b
Sox2
Jmjd2cMyc RNAp
P300
Jmjd2b depletion
H3K36
me3
H3K4m
e3
Nanog
Oct4Med SmcSox2
Jmjd2c
H3K27ac
H3K4me1
Myc RNAp
P300
NanogNanog
H3K36
me3
H3K4m
e3
Nanog
Oct4Med Smc
Jmjd2b
Sox2RNAp
P300
Jmjd2b depletion H3K
36m
e3
H3K4m
e3
Nanog
Oct4Med Smc
Sox2RNAp
P300Nanog
Nanog
E2F1
Oct4Sox2
Nanog
Oct4Sox2
Klf4, Esrrb, Tbx3
Nanog
Nanog
Jmjd2b/Kdm4b unique target genes (Active Genes)
Jmjd2b/Kdm4b & Jmjd2c/Kdm4c common target genes (Active Genes)
E2F1
EEDSUZ12
EZH2
EEDSUZ12
EZH2
NanogNanog
NanogNanog
Nanog
Nanog target genes (Klf4, Esrrb, Tbx3, Jmjd2b Otx2, Lefty1) Nanog target genes
H3K36
me3
H3K4m
e3
Nanog
Oct4Med SmcSox2
H3K27ac
Myc RNAp
P300
E2F1Jmjd2b
Jmjd2c depletion
H3K4me1
H3K27ac
H3K4me1
H3K27ac
H3K4me1
H3K27ac
H3K4me1
Nanog
Nanog
RNAp
RNAP-S5p
Ctr9
RNAP-S2p
Jmjd2b
Figure 7. The Working Model of Jmjd2b/Kdm4b and Jmjd2c/Kdm4c in mESCsJmjd2b is generally associated with active genes, whereas Jmjd2c is associated with poised/repressive genes. However, we found that most of the active genes
are occupied by both Jmjd2b and Jmjd2c. We propose a model in which Jmjd2b and Jmjd2c work distinctly and combinatorially. Blue thick and thin lines
correspond to higher and lower levels of transcription, respectively. The black dotted line represents lower binding of Nanog to its target genes upon depletion of
Jmjd2b.
See also Figure S7.
Molecular Cell
Functions of Jmjd2b and Jmjd2c in Mouse ESCs
EXPERIMENTAL PROCEDURES
ESC Lines and Culture
Mouse ESC lines were maintained in ES medium as documented in Supple-
mental Experimental Procedures.
46 Molecular Cell 53, 32–48, January 9, 2014 ª2014 Elsevier Inc.
Lentiviral Production and RNAi Screen
Individual shRNA constructs were used for lentiviral production. We used five
different shRNA lentiviral constructs to knock down each of 20 histone deme-
thylases in mESCs. mESCs were seeded in 48-well plates and infected with in-
dividual shRNA lentiviruses, and the screen was scored in terms of alterations

Molecular Cell
Functions of Jmjd2b and Jmjd2c in Mouse ESCs
of ESC colony morphology. A detailed protocol of lentiviral production and
infection of mESCs is available in Supplemental Experimental Procedures.
Gene Expression Analysis
mRNA profiling of knocked down samples was performed using Affymetrix
mouse genome 430 2.0 arrays. See Supplemental Experimental Procedures.
ChIP
Bio-ChIP and native antibody ChIP were performed as described elsewhere
(Kim et al., 2008, 2009). Detailed procedures and lists of antibodies are avail-
able in Supplemental Experimental Procedures.
ChIP Sequencing and Library Generation
Purified ChIP DNA was used to prepare Illumina multiplexed sequencing
libraries. A New England BioLabs Next Generation Sequencing kit was used
to prepare the libraries.
ChIP-Seq Data Analysis
Peaks were called using MACS, a peak-finding algorithm to identify regions of
ChIP-seq enrichment over background (Zhang et al., 2008). Detailed analyses
are available in Supplemental Experimental Procedures.
Coimmunoprecipitation
Nuclear extracts were prepared from J1 mouse ESCs (Kim et al., 2010) and
immunoprecipitated using specific antibodies.
ACCESSION NUMBERS
The cDNA microarray and ChIP-seq data have been deposited in the Gene
Expression Omnibus (http://www.ncbi.nlm.nih.gov/geo) under accession
number GSE43231.
SUPPLEMENTAL INFORMATION
Supplemental Information includes Supplemental Experimental Procedures,
seven figures, and seven tables and can be found with this article online at
http://dx.doi.org/10.1016/j.molcel.2013.11.011.
ACKNOWLEDGMENTS
We thank Dan Bauer, Jian Xu for critical reading of the manuscript, and David
Hendrix for discussions. We also thank Marc Kerenyi for reagents. We thank
F. Abderazzaq and R. Rubio at the Center for Computational Biology
sequencing facility at the Dana-Farber Cancer Institute for Illumina HiSeq
2000 sequencing. This work was supported by funding from NIH grant HLBI
U01HL100001. S.H.O. is an Investigator of the Howard Hughes Medical
Institute.
Received: May 10, 2013
Revised: September 16, 2013
Accepted: November 13, 2013
Published: December 19, 2013
REFERENCES
Agger, K., Christensen, J., Cloos, P.A., and Helin, K. (2008). The emerging
functions of histone demethylases. Curr. Opin. Genet. Dev. 18, 159–168.
Boyer, L.A., Plath, K., Zeitlinger, J., Brambrink, T., Medeiros, L.A., Lee, T.I.,
Levine, S.S., Wernig, M., Tajonar, A., Ray, M.K., et al. (2006). Polycomb com-
plexes repress developmental regulators in murine embryonic stem cells.
Nature 441, 349–353.
Cai, L., Rothbart, S.B., Lu, R., Xu, B., Chen, W.-Y., Tripathy, A., Rockowitz, S.,
Zheng, D., Patel, D.J., Allis, C.D., et al. (2013). AnH3K36methylation-engaging
Tudor motif of polycomb-like proteins mediates PRC2 complex targeting. Mol.
Cell 49, 571–582.
Chen, X., Xu, H., Yuan, P., Fang, F., Huss,M., Vega, V.B.,Wong, E., Orlov, Y.L.,
Zhang, W., Jiang, J., et al. (2008). Integration of external signaling pathways
with the core transcriptional network in embryonic stem cells. Cell 133,
1106–1117.
Chen, J., Liu, H., Liu, J., Qi, J., Wei, B., Yang, J., Liang, H., Chen, Y., Chen, J.,
Wu, Y., et al. (2013). H3K9 methylation is a barrier during somatic cell reprog-
ramming into iPSCs. Nat. Genet. 45, 34–42.
Cherry, A.B.C., and Daley, G.Q. (2012). Reprogramming cellular identity for
regenerative medicine. Cell 148, 1110–1122.
Cloos, P.A.C., Christensen, J., Agger, K., Maiolica, A., Rappsilber, J., Antal, T.,
Hansen, K.H., and Helin, K. (2006). The putative oncogene GASC1 demethy-
lates tri- and dimethylated lysine 9 on histone H3. Nature 442, 307–311.
Fazzio, T.G., Huff, J.T., and Panning, B. (2008). An RNAi screen of chromatin
proteins identifies Tip60-p400 as a regulator of embryonic stem cell identity.
Cell 134, 162–174.
Hu, G., Kim, J., Xu, Q., Leng, Y., Orkin, S.H., and Elledge, S.J. (2009). A
genome-wide RNAi screen identifies a new transcriptional module required
for self-renewal. Genes Dev. 23, 837–848.
Kagey, M.H., Newman, J.J., Bilodeau, S., Zhan, Y., Orlando, D.A., van
Berkum, N.L., Ebmeier, C.C., Goossens, J., Rahl, P.B., Levine, S.S., et al.
(2010). Mediator and cohesin connect gene expression and chromatin archi-
tecture. Nature 467, 430–435.
Kim, J., Chu, J., Shen, X., Wang, J., and Orkin, S.H. (2008). An extended tran-
scriptional network for pluripotency of embryonic stem cells. Cell 132, 1049–
1061.
Kim, J., Cantor, A.B., Orkin, S.H., and Wang, J. (2009). Use of in vivo bio-
tinylation to study protein-protein and protein-DNA interactions in mouse
embryonic stem cells. Nat. Protoc. 4, 506–517.
Kim, J., Woo, A.J., Chu, J., Snow, J.W., Fujiwara, Y., Kim, C.G., Cantor, A.B.,
and Orkin, S.H. (2010). A Myc network accounts for similarities between
embryonic stem and cancer cell transcription programs. Cell 143, 313–324.
Lee, T.I., Jenner, R.G., Boyer, L.A., Guenther, M.G., Levine, S.S., Kumar, R.M.,
Chevalier, B., Johnstone, S.E., Cole, M.F., Isono, K.-I., et al. (2006). Control of
developmental regulators by Polycomb in human embryonic stem cells. Cell
125, 301–313.
Loh, Y.H., Zhang, W., Chen, X., George, J., and Ng, H.H. (2007). Jmjd1a and
Jmjd2c histone H3 Lys 9 demethylases regulate self-renewal in embryonic
stem cells. Genes Dev. 21, 2545–2557.
Margueron, R., and Reinberg, D. (2011). The Polycomb complex PRC2 and its
mark in life. Nature 469, 343–349.
Meshorer, E., and Misteli, T. (2006). Chromatin in pluripotent embryonic stem
cells and differentiation. Nat. Rev. Mol. Cell Biol. 7, 540–546.
Min, I.M., Waterfall, J.J., Core, L.J., Munroe, R.J., Schimenti, J., and Lis, J.T.
(2011). Regulating RNA polymerase pausing and transcription elongation in
embryonic stem cells. Genes Dev. 25, 742–754.
Mosammaparast, N., and Shi, Y. (2010). Reversal of histone methylation:
biochemical and molecular mechanisms of histone demethylases. Annu.
Rev. Biochem. 79, 155–179.
Nechaev, S., and Adelman, K. (2011). Pol II waiting in the starting gates: regu-
lating the transition from transcription initiation into productive elongation.
Biochim. Biophys. Acta 1809, 34–45.
Orkin, S.H., and Hochedlinger, K. (2011). Chromatin connections to pluripo-
tency and cellular reprogramming. Cell 145, 835–850.
Pedersen, M.T., and Helin, K. (2010). Histone demethylases in development
and disease. Trends Cell Biol. 20, 662–671.
Peterlin, B.M., and Price, D.H. (2006). Controlling the elongation phase of tran-
scription with P-TEFb. Mol. Cell 23, 297–305.
Rahl, P.B., Lin, C.Y., Seila, A.C., Flynn, R.A., McCuine, S., Burge, C.B., Sharp,
P.A., and Young, R.A. (2010). c-Myc regulates transcriptional pause release.
Cell 141, 432–445.
Molecular Cell 53, 32–48, January 9, 2014 ª2014 Elsevier Inc. 47

Molecular Cell
Functions of Jmjd2b and Jmjd2c in Mouse ESCs
Shao, Z., Zhang, Y., Yuan, G.-C., Orkin, S.H., and Waxman, D.J. (2012).
MAnorm: a robust model for quantitative comparison of ChIP-seq data sets.
Genome Biol. 13, R16.
Shi, L., Sun, L., Li, Q., Liang, J., Yu, W., Yi, X., Yang, X., Li, Y., Han, X., Zhang,
Y., et al. (2011). Histone demethylase JMJD2B coordinates H3K4/H3K9
methylation and promotes hormonally responsive breast carcinogenesis.
Proc. Natl. Acad. Sci. USA 108, 7541–7546.
Soufi, A., Donahue, G., and Zaret, K.S. (2012). Facilitators and impediments of
the pluripotency reprogramming factors’ initial engagement with the genome.
Cell 151, 994–1004.
Sridharan, R., Tchieu, J., Mason, M.J., Yachechko, R., Kuoy, E., Horvath, S.,
Zhou, Q., and Plath, K. (2009). Role of the murine reprogramming factors in
the induction of pluripotency. Cell 136, 364–377.
48 Molecular Cell 53, 32–48, January 9, 2014 ª2014 Elsevier Inc.
Takahashi, K., and Yamanaka, S. (2006). Induction of pluripotent stem cells
from mouse embryonic and adult fibroblast cultures by defined factors. Cell
126, 663–676.
Xie, L., Pelz, C., Wang, W., Bashar, A., Varlamova, O., Shadle, S., and Impey,
S. (2011). KDM5B regulates embryonic stem cell self-renewal and represses
cryptic intragenic transcription. EMBO J. 30, 1473–1484.
Young, R.A. (2011). Control of the embryonic stem cell state. Cell 144,
940–954.
Zhang, Y., Liu, T., Meyer, C.A., Eeckhoute, J., Johnson, D.S., Bernstein, B.E.,
Nusbaum, C., Myers, R.M., Brown, M., Li, W., and Liu, X.S. (2008). Model-
based analysis of ChIP-seq (MACS). Genome Biol. 9, R137.
Zhou, V.W., Goren, A., and Bernstein, B.E. (2011). Charting histone modifica-
tions and the functional organization ofmammalian genomes. Nat. Rev. Genet.
12, 7–18.