molecular characterization of bacterial communities in the
TRANSCRIPT
Molecular Characterization of Bacterial
Communities in the Human Gastrointestinal Tract
Erwin G. Zoetendal

Promoter: prof. dr. W. M. de Vos
Hoogleraar in de Microbiologic
Co-promotor: dr. A. D. L. Akkermans
Universitair hoofddocent bij de leerstoelgroep Microbiologic
Leden van de
promotiecommissie: dr. T. Abee
Wageningen Universiteit
prof. dr. ir. M. W. A. Verstegen
Wageningen Universiteit
dr. G. W. Welling
Rijksuniversiteit Groningen
prof. dr. A. von Wright
University ofKuopio, Finland

- , "̂ o o -• c
Molecular Characterization of Bacterial
Communities in the Human Gastrointestinal Tract
Erwin G. Zoetendal
Proefschrift
ter verkrijging van de graad van doctor
op gezag van de rector magnificus
van Wageningen Universiteit,
prof. dr. ir. L. Speelman,
in het openbaar te verdedigen
op dinsdag 13 november 2001
des namiddags te 13.30 uur in de Aula.
SAJ l Yl \u ~"?
ISBN: 90-5808-520-1
Keywords: GI tract, bacterial community, bacterial diversity, 16S rRNA, TGGE, DGGE,
FISH.
Thesis Wageningen University Research Centre, Wageningen, The Netherlands - With
References - With Summary in English and Dutch - 192 pages.

p i .V?0\ , 5 t •P. D ~/
Stellingen
1) Eeneiige tweelingen lijken ook wat betreft hun bacterigle samenstelling in de darm meer op
elkaar dan op andere mensen.
Dit proefschrift
2) Fermentatieve bacterign met relatief eenvoudige voedingsbehoeften zijn niet altijd
gemakkelijk op een vaste voedingsbodem te kweken.
Dit proefschrift
3) Door de enorme toename van het aantal 16S rDNA sequenties van ongecultiveerde
bacterign in databanken, is door het bos de boom nauwelijks nog te zien.
Maidaketal. (2001) Nucleic Acids Res. 29: 173-174
4) Op basis van enkelvoudige waamemingen kan geen uitspraak gedaan worden over PCR
fouten.
Wilson and Blitchington (1996) Appl. Environ. Microbiol. 62: 2273-2278
Whitford et al. (1998) Anaerobe 4: 153-163
5) Gezien de defmitie, is een reincultuur van bacterign niet te kweken.
6) Voor de medaille-ranglijst van de Olympische Spelen verdient het de aanbeveling om het
aantal behaalde medailles door het aantal inwoners van het betreffende land te delen.
7) Hoe dichter je bij Veenendaal komt, hoe vaker "Zoetendal" automatisch met twee a's
wordt geschreven.
Stellingen bij het proefschrift 'Molecular Characterization of Bacterial Communities in the
Human Gastrointestinal Tract'.
Erwin Zoetendal, Wageningen, 13 November 2001.

Contents
Chapter 1 General introduction 1
Chapter 2 Molecular characterization of microbial communities based on 16S 11
rRNA sequence diversity
Chapter 3 Temperature gradient gel electrophoresis analysis of 16S rRNA 47
from human fecal samples reveals stable and host-specific
communities of active bacteria
Chapter 4 DNA isolation protocols affect the detection limit of PCR 65
approaches of bacteria in samples from the human gastrointestinal
tract
Chapter 5 Molecular diversity of Lactobacillus spp., and other lactic acid 77
bacteria in the human intestine as determined by specific
amplification of 16S ribosomal DNA
Chapter 6 The host genotype affects the bacterial community in the human 101
gastrointestinal tract
Chapter 7 The attached bacterial community from the human gastrointestinal 113
tract is uniformly distributed along the colon and differs from the
fecal community
Chapter 8 Quantification of uncultured Ruminococcus obeum-like bacteria in 129
human fecal samples with fluorescent in situ hybridization and flow
cytometry using 16S ribosomal RNA targeted probes
Chapter 9 Victivallis vadensis gen. nov. sp. nov., a cellobiose-degrading 145
bacterium from human feces
Chapter 10 Concluding remarks and future perspectives 157
Chapter 11 Summary 167
Chapter 12 Samenvatting 173
Publications 181
Nawoord 183
Curriculum vitae 185

Chapter 1
General Introduction

The mammalian gastrointestinal (GI) tract can be regarded as an ecosystem, in which
contributions of the microorganisms, epithelium, the immune system, and compounds that
escaped digestion by the host have a major impact. This results in a very dynamic and
complex ecosystem that is, however, difficult to study notably because of the complexity of
the microbial community. This chapter will briefly summarize some characteristics of the GI
tract and its microbes, which have lead to the aim of this thesis.
THE GI TRACT
The GI tract can be regarded as a tube extending from the mouth to the anus which is divided
into several well-defined anatomical regions. The GI tract has several functions from which
the digestive and absorptive functions of nutritious compounds are most well known. After
intake of food, the digestion starts in the mouth and compounds that can easily be digested by
the host are already absorbed before they reach the large intestine. Enzymes, such as
glycosidases, lipases, peptidases, and proteinases play a key role in the digestion of food
compounds (reviewed by 5).
The GI tract harbors a bacterial community consisting of approximately 1014 cells and
therefore it outnumbers the total cells of the human body by one order of magnitude (25). The
epithelium of the GI tract is covered by a mucus layer which protects the GI tract against
mechanical and enzymatical damage as well as bacterial invasion. In addition, this continuous
renewing mucus layer serves as an additional carbohydrate source for the bacterial
community. The bacteria in the GI tract are not equally distributed. The stomach only harbors
a small number of bacteria, because of the low pH (pH~2 when gastric acids are produced).
The bacterial number in the small intestine is also low, because of the short transit time (~5h)
of the contents. The highest bacterial number and diversity are found in the colon, because it
has a relatively large transit time (-60 hours). It is estimated that this bacterial community
makes up to 55% of the fecal solids (reviewed by 5).
The human colon is about 150 cm long with a surface area (undissected) of
approximately 1300 cm2. It contains on average 220 g of contents from which the moisture
content is approximately 86% in the caecum, falling to 77% in the sigmoid-rectum. The pH
shifts from 5.4-5.9 in the beginning of the colon to 6.6-6.9 to the end. Therefore, the
physiological conditions vary from beginning to the end of the colon. In the colon water and

salts are absorbed. It is estimated that approximately 1.5 kg of material is entering the colon
each day while approximately 120 g of stool are excreted each day. Because of bacterial
fermentation of compounds that escaped digestion by the host the main end products found in
the colon are acetate, propionate, and butyrate. These short chain fatty acids (SCFA) provide a
powerful driving force for movement of water out of the colonic lumen and consequently,
may constitute an important protection against diarrhea. It is estimated that epithelial cells in
the colon obtain 60-70% of their energy from bacterial fermentation products (reviewed by 5).
CULTIVATION OF GI TRACT BACTERIA
The GI tract harbors a diverse bacterial community. Since the description of "Bacterium coli
commune" in 1885 (7) many attempts have been made to isolate and characterize bacteria in
the human GI tract and trying to understand their function. During the first half of the 20th
century research of the bacteria in the GI tract was not so intense. An increase in interest on
the GI tract bacteria appeared after several groups in the sixties started extensively studying
their function in the GI tract. The major findings from this period and their importance have
recently been summarized and discussed (26).
During the seventies the cultivation approaches were optimized after applying the
anaerobic incubation techniques, developed by Hungate (17), to cultivate microorganisms
from the human GI tract. A major increase in numbers of isolates from the GI tract has been
achieved, notably by Moore, Holdeman, Finegold, and their colleagues (8, 9, 15, 16, 23). The
most intensive culturing study performed has been described by Finegold and colleagues (9).
In this 10 years during study fecal samples from 141 volunteers having various diets and
disease states were analyzed. A high similarity in bacterial composition was found between
the volunteers despite the differences in diet and disease state. These and other cultivation
studies revealed many novel isolates, that the GI tract is dominated by strict anaerobic
bacteria, that number of colony forming units per gram of wet weight feces reaches 1010 -
1011, and that the dominant community is relatively stable. Even up to now still novel species
are being isolated from the human GI tract. It has been estimated that up to 400 bacterial
species may be present in the GI tract of healthy volunteers (6). Although many variations in
composition were found in various studies, the main genera which were commonly detected
include Bacteroides, Bifidobacterium, Clostridium, Eubacterium, Fusobacterium,
Peptostreptococcus, and Ruminococcus (reviewed by 31).

Since the different parts in the GI tract are hardly accessible, the majority of studies
have been performed using feces as inoculum. Only in some cases, the bacterial community at
other parts in the GI tract have been studies by taking samples from biopsies and intestinal
fluids, from sudden-death victims, or during surgery (2, 3, 11, 12, 18, 21, 37, reviewed by 9).
Although the culture-dependent studies gave many new insights in the distribution of
the bacteria in the GI tract, they do not give a complete picture of the bacterial composition.
For many ecosystems the so-called "great plate count anomaly" has been observed by
comparing those counts and direct microscopic counts (4, 28). The culturability of bacteria
from several habitats was found to vary between less than 1 to 15% (4). Similar comparisons
have been made for bacteria from the human GI tract and it is estimated that between 10 and
50% can be obtained in culture (19, 22, 30, 35). Moore and colleagues reported that they
could cultivate 93% of the total microscopic counts, although they mentioned that their
microscopic counts is likely underestimated because of the staining procedure and counting
clumps of cells instead of single cells (23). In addition, it has been found that the specificity
of selective media is often questionable (13, 14). Although these culturability estimates are
higher than observed for other ecosystems, the majority of bacteria has not been obtained in
culture. Therefore, culture-independent approaches are required to study the ecology of the
bacterial community in the human GI tract.
THE 16S rRNA APPROACH
The necessity of culture-independent approaches to study the ecology of microorganisms in
different environments resulted in the introduction of a novel discipline called Molecular
Ecology. Molecular Ecology is an emerging discipline that uses the detection of so-called
biomarkers to study the ecology of microorganisms. These biomarkers can be any biological
component that indicates a feature of a particular group of microorganisms. Ideally, these
biomarkers are specifically detected and decomposed after cell death. Therefore, biomarkers
could be cell components like proteins, lipids, DNA, RNA and even the cells themselves (24).
For more than a decade, culture-independent techniques using the small subunit ribosomal
RNA (SSU rRNA) sequence variability as biomarker have been added to or replaced by the
conventional culturing techniques. There are various reasons to use these SSU rRNA as
biomarkers (4, 36). These include (a) their presence in all cells, (b) their high degree of
sequence conservation which facilitates their detection, (c) the presence of highly variable

regions in their sequences which makes them useful to discriminate at (sub)species to higher
phylogenetic levels, and (d) the availability of many sequences from various organisms and
cloned amplicons from a variety of ecosystems. Approximately 20,000 SSU rRNA sequences
have been deposited in databases (20). Therefore, they facilitate a reliable phylogenetic
characterization of cultured and uncultured microbes.
Table 1. Comparison between viable, dot blot, and FISH counts of fecal bacteria from different individuals.
Target group
Bacteroides
Bifidobacteria
Eubacterium/Clostridium/Ruminococcus
Fusobacterium prausnitzii-group
Coverage
Mean counts in percentages
Cultivation3
59
5
21
<ld
10-50*
(9) Dot Blot (27)
36.8"
0.7
14.5C
16.3e
70g
FISH (10)
20b
3
29c
12
64g
a Percentages for cultivation are calculated from the sum of all target groups found by Finegold and
colleagues (9). b The Bactol080 and Bfra602/Bdis656 probes were used for dot blot and FISH, respectively. c Data from the Erec482 probe, which covers a significant fraction of eubacteria, Clostridia, and
ruminococci.
Percentage total fusobacteria including F. prausnitzii. e Counts of the Clostridium leptum-group which include F. prausnitzii and phylogenetically
related bacteria.
Estimated culturability based on comparisons between microscopic and plate counts. B Percentage of sum of all probe signals divided by the signal of the bacterial probe (Eub338).
The application of bacterial and archaeal SSU rRNA (or 16S rRNA) sequence
information to study microbial communities in a culture-independent way is called the 16S
rRNA approach (4). The past decade shows an explosive increase of studies in which the 16S
rRNA approach was used to study various ecosystems. As a result many cloned amplicons
have been sequenced and deposited in DNA databases (20). In common, all these studies
confirmed the observation that the majority of bacteria in an ecosystem cannot be cultured
(reviewed by 4). The past years, the application of the 16S rRNA approach to characterize and
monitor bacterial communities in the human GI tract is increasing. The number of reports and
review articles describing the 16S rRNA sequence diversity in the GI tract of various animals

by fluorescent in situ hybridization (FISH) and PCR-based cloning and fingerprinting
techniques is increasing (reviewed by 1, 29, 32-34). These studies provided novel insights
into our knowledge of the bacterial diversity in our GI tract. For example, comparison
between FISH, dot blot, and viable counts published by different authors revealed that the
number of bacteria related to Fusobacterium prausnitzii is underestimated by the viable count
(Table 1).
OUTLINE OF THE THESIS
The aim of this work was to study the bacterial community in the human GI tract using 16S
rRNA approaches. Using these approaches we studied the bacterial composition in the GI
tract and estimated its host-specificity, temporal stability and the impact of host-related
factors on the composition.
The outline of this thesis is as follows. Chapter 2 is an extensive review chapter
describing the application, benefits, and drawbacks of fingerprinting approaches based on the
16S rRNA sequence variability to study the bacterial diversity in ecosystems, such as the GI
tract. Chapters 3 to 5 mainly focus on the optimization and application of PCR-based 16S
rRNA approaches and analysis of amplicons by temperature and denaturing gradient gel
electrophoresis (TGGE and DGGE, respectively). In this way, the predominant and
Lactobacillus group community in different GI tract samples were characterized by a
combination of fingerprinting and identification of bands in the fingerprint by cloning and
sequence analysis. The temporal stability, host-specificity and bacterial composition of these
bacterial communities in the GI tract were determined. Chapter 6 focuses on the impact of the
host genotype and the environment of the hosts on the predominant bacterial community in
fecal samples from adults. The distribution of the predominant and Lactobacillus group
bacterial community at different locations in the colon is described in Chapter 7. The impacts
of the host and GI tract disorders were examined. Chapter 8 describes the FISH detection of
an uncultured group of bacteria which have only been detected by PCR-based approaches in
fecal samples of different individuals. Chapter 9 describes the isolation of a strain belonging
to a novel genus and discusses the use of alternative cultivation approaches to isolate species
from different ecosystems. Chapter 10 discusses the major findings described in the previous
chapters. Chapter 11 and 12 give a summary of the thesis in English and Dutch, respectively.

REFERENCES
1. Akkermans A. D. L., Zoetendal E. G., Favier C. F., G. H. J. Heilig, Akkermans-van Vliet W. M., and
Vos W. M. de. 2000. Temperature and denaturing gradient gel electrophoresis analysis of 16S rRNA from
human faecal samples. Bioscience Microflora 19:93-98.
2. Alander M., R. Korpela, M. Saxelin, T. Vilpponen-Salmela, T. Mattila-Sandholm, and A. von Wright.
1997. Recovery of Lactobacillus rhamnosus GG from human colonic biopsies. Lett. Appl. Microbiol. 24:361-
364.
3. Alander M., R. Satokari, R. Korpela, M. Saxelin, T. Vilpponen-Salmela, T. Mattila-Sandholm, and A.
von Wright. 1999. Persistence of colonization of human colonic mucosa by a probiotic strain, Lactobacillus
rhamnosus GG, after oral consumption. Appl. Environ. Microbiol. 65:351-354.
4. Amann R. I., W. Ludwig, and K-H. Schleifer. 1995. Phylogenetic identification and in situ detection of
individual cells without cultivation. Microbiol. Rev. 59:143-169.
5. Cummings J. H., and G. T. Macfarlane. 1991. The control and consequences of bacterial fermentation in
the human colon. J. Appl. Bact. 70:443-459.
6. Drasar B.S. and M. J. Hill. 1974. Human intestinal flora. Academic Press, New York, USA.
7. Escherich T. 1885. Die Darmbakterien des Neugebornenen und Sauglings. Fortschr. Med. 3:515-522.
8. Finegold S. M., H. R. Attebery, and V. L. Sutter. 1974. Effect of diet on human fecal flora: comparison of
Japanese and American diets. Am. J. Clin. Nutr. 27:1456-1469.
9. Finegold S. M, V. L. Sutter, and G. E. Mathisen. 1983. Normal indigenous intestinal flora, p.3-31. In. D.
J. Hentges (ed.), Human intestinal microflora in health and disease. Academic Press, New York.
10. Franks A. H. , H. J. M. Harmsen, G. C. Raangs, G. J. Jansen, F. Schut, and G. W. Welling. 1998.
Variations of bacterial populations in human feces measured by fluorescent in situ hybridization with group-
specific 16S rRNA-targeted oligonucleotide probes. Appl. Environ. Microbiol. 64:3336-3345.
11. Gibson G. R., J. H. Cummings, and G. T. Macfarlane. 1991. Growth and activities of sulphate-reducing
bacteria in the gut contents of healthy subjects and patients with ulcerative colitis. FEMS microbiol. Ecol.
86:103-112.
12. Gillian Hartley M., M. J. Hudson, E. T. Swarbrick, M. J. Hill, A. E. Gent, M. D. Hellier, and R. H.
Grace. 1992. The rectal mucosa-associated microflora in patients with ulcerative colitis. J. Med. Microbiol.
36:96-103.
13. Harmsen H. J. M., P. Elfferich, F. Schut, and G. W. Welling. 1999. A 16S rRNA-targeted probe for the
detection of lactobacilli and enterococci in faecal samples by fluorescent in situ hybridization. Microbial Ecol.
Health Dis. 11:3-12.
14. Hartemink R., and F. M. Rombouts. 1999. Comparison of media for the detection of bifidobacteria,
lactobacilli and total anaerobes from fecal samples. J. Microbiol. Meth. 36:181-192.
15. Holdeman L. V., and W. E. C. Moore. 1974. New genus, Coprococcus, twelve new species, and emended
descriptions of four previously described species of bacteria from human feces. Int. J. Syst. bacteriol. 24:260-
277.
16. Holdeman L. V., I. J. Good, and W. E. C. Moore. 1976. Human fecal flora: Variation in bacterial
composition within individuals and a possible effect of emotional stress. Appl. Environ. Microbiol. 31:359-375.
17. Hungate R. E. 1950. The anaerobic mesophilic cellulolytic bacteria. Bacterid. Rev. 14: 1-49.
18. Johansson M-L., G. Molin, B. Jeppsson, S. Nohaek, S. Ahrne, and S. Bengmark. 1993. Administration
of different Lactobacillus strains in fermented oatmeal soup: In vivo colonization of human intestinal mucosa
and effect on the indigenous flora. Appl. Environ. Microbiol. 59:15-20.
19. Langendijk P. S., F. Schut, G. J. Jansen, G. C. Raangs, G. R. Camphuis, M. F. Wilkinson, and G. W.
Welling. 1995. Quantative fluorescence in situ hybridization of Bifidobacterium spp. with genus-specific 16S
rRNA-targetted probes and its application in fecal samples. Appl. Environ. Microbiol. 61:3069-3075.
20. Maidak B. L., J. R. Cole, T. G. Lilburn, C. T. Parker Jr, P. R. Saxman, R. J. Farris, G. M. Garrity, G.
J. Olsen, T. M. Schmidt, and J. M. Tiedje. 2001. The RDP-II (Ribosomal Database Project). Nucleic Acids.
Res. 29:173-174.
21. Macfarlane G. T., G. R. Gibson, and J. H. Cummings. 1992. Comparison of fermentation reactions in
different regions of the human colon. J. Appl. Bacteriol. 72:57-64.
22. McFarlane G. T. and G. R. Gibson. 1994. Metabolic activities of the normal colonic microflora p. 17-38.
In: Human Health: Contribution of micro organisms, pp. 17-38, ed. S. A. W. Gibson, Springer. Frankfurt.
23. Moore W. E. C , and L. V. Holdeman. 1974. Human fecal flora: The normal flora of 20 Japanese-
Hawaiians. Appl. Microbiol. 27:961-979
24. Morgan J. A. W., and C. Winstanley. 1997. Microbial biomarkers. In: Modern soil microbiology, pp 331-
352. eds. J. D. van Elsas, J. T. Trevors, and E. M. H. Wellington. Marcel Dekker Inc., New York.
25. Savage D. C. 1977. Microbial ecology of the gastrointestinal tract. Ann. Rev. Microbiol. 31:107-133.
26. Savage D. C. 2001. Microbial biota of the human intestine: A tribute to some pioneering scientists. Curr.
Issues Intest. Microbiol. 2:1-15.
27. Sghir A., G. Gramet, A. Suau, V. Rochet, P. Pochart, and J. Dore. 2000. Quantification of bacterial
groups within human fecal flora by oligonucleotide probe hybridization. Appl. Environ. Microbiol. 66:2263-
2266.
28. Stanley J. T, and A. Konopka. 1985. Measurements of in situ activities of nonphototrophic microorganisms
in aquatic and terrestrial habitats. Annu. Rev. Microbiol. 39:321-346.
29. Steer T., H. Carpenter, K. Tuohy, and G. R. Gibson. 2000. Perspectives on the role of the human gut
microbiota and its modulation by pro-and prebiotics. Nutr. Res. Rev. 13:229-254.
30. Suau A., R. Bonnet, M. Sutren, J-J. Godon, G. R. Gibson, M. D. Collins, and J. Dore. 1999. Direct
analysis of genes encoding 16S rRNA from complex communities reveals many novel molecular species within
the human gut. Appl. Environ. Microbiol. 65:4799-4807.
31. Tannock G. W. Normal microflora. An introduction to microbes inhabiting the human body (Chapman and
Hall, London) 1995.
32. Tannock G. W. 2001. Molecular assessment of intestinal microflora. Am. J. Nutr. 73(Suppl):410S-414S.
33. Vaughan E. E., G. H. J. Heilig, E. G. Zoetendal, R. Satokari, J. K. Collins, A. D. L. Akkermans, and
W. M. de Vos. 1999. Molecular approaches to study probiotic bacteria. Trends in Food Sciences and
Technology 10(12): 400-404.
34. Vaughan E. E., F. Schut, G. H. J. Heilig, E. G. Zoetendal, W. M. de Vos and A. D. L. Akkermans.
2000. A molecular view of the intestinal ecosystem. Curr. Issues Intest. Microbiol. 1:1-12.
35. Wilson K. H., and R. H. Blitchington. 1996 Human colonic biota studied by ribosomal DNA sequence
analysis. Appl. Environ. Microbiol. 62:2273-2278.
36. Woese C. R. 1987. Bacterial evolution. Microbial Rev. 51:221-271.
37. Zinkevich V, and I. B. Beech. 2000. Screening of sulfate-reducing bacteria in colonoscopy samples from
healthy and colitic human gut mucosa. FEMS Microbiol. Ecol. 34:147-155.

Chapter 2
Molecular Characterization of Microbial Communities Based on
16S rRNA Sequence Diversity
Erwin G. Zoetendal, Antoon D. L. Akkermans, and Willem M. de Vos
Published as chapter 11 in "New Approaches for the Generation and Analysis of Microbial typing Data"
Reprinted with permission of Elsevier Science.
11
INTRODUCTION
This decade has shown an impressive development in the application of molecular techniques
based on 16S and 23S rRNA genes to study the microbial diversity in ecosystems. Several
overviews highlight the possibilities and drawbacks of these molecular approaches in ecology
(3,42,79, 122).
Before the rRNA approach, the composition of an ecosystem was investigated by the
isolation and physiological characterisation of many microorganisms living in an ecosystem.
The microbial composition of mammalian intestines, for example, has been studied
extensively by plate count analysis of fecal samples, which usually contain 1010- 1011 cfu/g
(34, 43, 64, 91). One of the limitations in using these conventional microbiological methods is
that easily cultivable microorganisms are detected, but not those that only grow on specific
media, require unknown growth conditions, or have obligate interactions with the host or
other microorganisms. Other limitations of cultivation include the selectivity of the media
used, the stress imposed by cultivation procedures, and the necessity of strictly anoxic
conditions. Estimates of the cultivability of GI tract microorganisms range from 10% to 50%,
but may vary considerably between species or genera (53, 61, 121). As a consequence, insight
into the function of the microbial community, its interactions with the host, and the influence
of environmental factors on the microbial composition is very limited.
During the past decade, the rRNA approach has been used to study the microbial
ecology of several ecosystems, and its application in ecological studies is still increasing. The
first application of this approach in studying GI tract ecology was focused on the detection of
Bacteroides vulgatus in fecal samples using a species-specific 16S rRNA-targeted probe (51).
Recently, several populations in the GI tract have been monitored, resulting in quantification
of Bacteroides populations by dot blot hybridization (23), and analysis of the genetic diversity
of cultivable Lactobacillus and Bifidobacterium spp. (60). From the latter study, it was
concluded that the microbial composition of lactic acid bacteria in the intestine varies
according to each individual. Fluorescent in-situ hybridization (FISH) has also been used to
quantify different phylogenetic groups in human fecal samples (37, 53). About two-thirds of
the total bacterial community could be counted with the probes used. The polymerase chain
reaction (PCR) has been used to quantify specific groups of bacteria in human feces (116),
and random cloning approaches have been used to analyze the microbial diversity of feces
12

from single individuals (106, 121, 128). In one case, this analysis was combined with another
powerful approach based on temperature gradient gel electrophoresis (TGGE) analysis of 16S
rRNA and rDNA amplicons, resulting in identification of the most prominent and expressed
sequences (128). In addition, individual differences and temporal changes in the predominant
microbial GI tract community could easily be monitored using this approach. TGGE and other
fingerprinting techniques, including denaturing gradient gel electrophoresis (DGGE) and
single strand conformation polymorphism (SSCP) analysis have been used in different
ecosystems to rapidly analyze microbial communities based on sequence-specific separation
of 16S rDNA amplicons (reviewed by 67, 69). This chapter describes the use, benefits and
drawbacks associated with the application of these genetic fingerprinting approaches, which
are based on the sequence variability of different 16S rRNA and 16S rDNA molecules, to
study the microbial composition of different environments, such as the GI tract.
I Environmental sample
Phytogeny IT"
Sequencing|*—[Cloning |*—|RT-PCR|
Fingerprinting
Cloning|—» Sequencing
Fig. 1. Schematic outline of molecular approaches used to analyze microbial communities.
METHODOLOGY
To describe the bacterial diversity in communities, molecular approaches based on the
sequence variability of the 16S rRNA gene can be used (Fig. 1). First, RNA and DNA have to
be isolated simultaneously from environmental samples, and used as templates for
amplification of fragments of the 16S rRNA gene by reverse transcriptase (RT)-PCR and
regular PCR, respectively. Subsequently, the genetic diversity of the amplicons can be
analyzed using different fingerprinting techniques. Additionally, a clone library of complete
16S rDNA and rRNA sequences can be made and divided into groups of different ribotypes
13
using the same fingerprinting techniques. Cloned fragments of the different ribotypes can be
sequenced and analyzed phylogenetically. Comparison of the fingerprinting techniques and
the cloning approaches may result in a reliable picture of the relative composition of
numerically dominating microbes in a community. However, the results cannot simply be
converted to total numbers of cells and the fingerprints only reflect the actual number of
rRNA genes when each product is amplified equally.
EXTRACTION OF RNA AND DNA
When genetic fingerprinting techniques are used to characterize a microbial community,
reliable extraction of DNA and RNA is the most critical step in the whole procedure because
all further analyses are based on the extracted nucleic acids. Various nucleic acid extraction
methods have been developed that can be applied to all kinds of ecosystems (1). While most
of the reported isolation procedures are promoted as rapid, accurate, simple, or universal
methods, a general protocol does not exist because all environments have their own
characteristics and, as a consequence, require dedicated purification procedures. In general,
procedures for the isolation of nucleic acids from microorganisms or environmental samples
consist of three steps that will be discussed below: cell lysis, purification of nucleic acids, and
isolation of nucleic acids (Fig. 2).
Cell lysis and purification of nucleic acids. One of the important steps in the extraction of
nucleic acids from an environmental sample is the lysis of microbial cells. Equally efficient
lysis of all cells in an ecosystem is necessary to obtain a reliable picture of the microbial
community. Efficient cell lysis may be hampered by the different cell envelope composition
of various microorganisms. Hence, a protocol which is suitable for one species may not
necessarily be suitable for another species. Microbial cells can be lysed chemically,
enzymatically or mechanically. Various Gram-negative bacteria can be lysed chemically by
treatment with detergents, such as sodium dodecyl sulphate (SDS). Disruption of the cell
envelope of Gram-positive bacteria by detergents needs prior treatment with enzymes such as
lyzozyme, N-acetylmuramidase or other muramidases. Most of these lytic enzymes are
restricted to a certain range of microorganisms, because the cell-envelope composition differs
for each species (44). As a consequence, it is very difficult to develop chemical or enzymatic
based lysis methods for complex communities. Therefore, procedures which include
14

mechanical cell lysis by French press disruption, freeze/thaw incubations, sonication, or bead
beating are preferred (1,44, 58).
Cell lysis
Microbial Cell
Nucleic Acid Purification
Nucleic Acid Isolation
&
Ribosome Isolation
DNA
Proteins Lipids Sugars RNA
Fig. 2. Schematic representation of the procedures used to isolate DNA and RNA from a mixture of bacterial
cells.
Bead beating is a widely used method to lyse bacterial communities, sometimes in
combination with different chemical, enzymatic, or other mechanical lysis procedures. Bead
beating has been shown to be successful in all kinds of samples, varying from soil systems to
the mammalian GI tract (23, 29, 39, 85, 104, 121, 128). In this procedure, glass or zirconium
beads are added to an environmental sample in a buffered solution and shaken vigorously
(3000 to 5000 rpm). The beads collide during this treatment, thereby facilitating the
disruption of cells between the beads. Phenol can be added to the sample to prevent enzymatic
degradation of the nucleic acids during the bead beating procedure.
A disadvantage of this mechanical cell lysis is that nucleic acids are partly sheared,
especially when fragile bacteria such as some Gram-negative species are involved. Sheared
nucleic acids cannot be used for genetic fingerprinting methods based on intact genomic
DNA, such as RAPD and RFLP. Shearing of nucleic acids may also result in a reduced
recovery of bacterial DNA or RNA, or increase the formation of chimeric structures during
amplification of certain genes (48). Determination of the optimal conditions for efficient cell
15

disruption is therefore very important. The easiest way is to examine the sample under the
microscope before and after the lysis procedure (4). However, it may be difficult to
distinguish between pieces of lysed cells and intact cells. Plate counting analysis of easily
cultivable bacteria may give some indication of lysis efficiency when non-detrimental
treatments are used during the lysis procedure (29). However, this may be difficult or
cumbersome, notably when anoxic environments such as the GI tract are analyzed.
Another way to check for lysis efficiency is to determine the nucleic acid
concentration before and after treatment. A disadvantage of this calculation method is that the
genome size and ribosome number may vary according to cell and species, making the
calculation less reliable. TGGE of 16S rDNA amplicons has been used to check the lysis
efficiency of GI tract samples following different periods of bead beating (128). In this way,
shearing of nucleic acids could be minimized by determining the minimal time required for
maximal disruption of the cells. It was shown that at least 3 min of bead beating was
necessary to lyse a Ruminococcus-like species in a fecal sample.
Following cell lysis, nucleic acids have to be purified, because most analytical
procedures involve enzymes and require relatively pure DNA or RNA. Most proteins,
carbohydrates and lipids can be removed using phenol and chloroform extractions (58). This
purification procedure can be enhanced by addition of cetyltrimethylammonium bromide
(CTAB), which forms complexes with the nucleic acids. It has been shown that CTAB
extraction following bead beating of actinorrhisal nodules facilitated the recovery of DNA
(85). High molecular size DNA can also be separated from contaminants by CsCl
centrifugation. Additional steps for purification can be added to the protocol, although it
should be kept in mind that each additional step results in a decreased yield of extracted
nucleic acids. An alternative step is the addition of specific proteins, such as bovine serum
albumine or protein gp32 to the DNA sample. These proteins have been shown to enhance the
amplification efficiency of template DNA containing PCR-inhibiting compounds (50).
Recently, improved DNA recovery from ancient fecal samples has been reported in which
cross-links between reducing sugars and amino groups could be cleaved by adding N-
phenacylthiazoliumbromide, thereby allowing for the amplification of DNA sequences (81).
Following purification, nucleic acids can be concentrated by polyethyleneglycol,
isoamylalcohol or ethanol. Addition of sodium acetate facilitates the precipitation of nucleic
acid fragments in ethanol. Instead of precipitation, nucleic acids can also be concentrated by
binding to glass fibers or silica materials. Most commercial nucleic acid isolation kits rely on
16

this procedure.
When RNA is isolated, all procedures should be performed with special care. RNA is
more sensitive to degradation than DNA because its ribose contains a 2 ' hydroxyl group
which makes RNA chemically less stable, especially under alkaline conditions. In addition,
the double helix B structure found in DNA cannot be formed by RNA. Besides the chemical
differences, RNase is much more stable than DNase, making removal of RNase more difficult
and contamination with RNase easier. If possible, every step should be performed at 4°C or
on ice, and equipment should be RNase free. Most procedures to isolate DNA and RNA are
based on the principle of lysing the cells followed by direct purification of the nucleic acids.
Another approach to obtain rRNA is based on the isolation of ribosomes (29, 33, Fig. 2). In
this procedure, cells from soil samples are mechanically lysed, followed by the isolation of
intact ribosomes by ultracentrifugation. RNA is then subsequently isolated from the ribosome
collection and purified. This method, which may also be applicable to other ecosystems such
as the GI tract, resulted in a high yield of purified 16S rRNA and 23S rRNA which could be
used directly for RT-PCR.
A number of studies have reported the extraction of nucleic acids from fecal and
rumen samples (4, 23, 104, 121, 128). Most protocols are based on bead beating cell lysis in
phenol, followed by phenol/chloroform extraction. A different approach has also been
described in which bacterial cells from feces are lysed by boiling in a phosphate-buffered
saline (PBS) solution containing 1% Triton X100 (116). Following cell lysis, the solution was
used directly as a template for PCR amplification. Amplicons derived from a variety of Gram-
positive and Gram-negative species known to be present in fecal samples could be detected
following amplification with specific primers. Although the number of strains tested is
limited, this fast PCR approach seems to be accurate and may be useful for analyzing samples
containing a low number of microorganisms.
Quantification of nucleic acids. Several methods to visualize and quantify nucleic acids have
been developed. DNA fragments separated on agarose or polyacrylamide gels are usually
visualized with fluorescent dyes, such as ethidium bromide (58), or by silver staining (8, 90).
Staining is used to quantify the yield of nucleic acids following addition of a concentration
standard. Quantification works fine when RNA and DNA are not sheared. The correlation
between the concentration of nucleic acids and the signal of the stain is normally not linear
and extrapolation is not possible. Instead of quantification by gel electrophoresis, DNA and
17

RNA can also be quantified by Southern, northern or dot blot hybridization using a universal
probe for a gene of interest. A third way to measure the nucleic acid concentration is to
determine the UV light absorption at 260 nm and 280 nm. Additionally, the ratio A260/A280
gives an indication of purity. DNA is relatively pure when this ratio is between 1.80 and 2.00.
Another less well-known procedure for measuring the DNA and RNA concentration is
use of High-Performance Liquid Chromatography (HPLC). HPLC has been used to determine
the copy number of plasmids in recombinant yeast or Escherichia coli cells. Chromosomal
DNA, plasmid DNA, rRNA and tRNA could be separated using HPLC (19, 20). When the
various methods were compared for nucleic acids isolated from marine sediments (22), it was
found that the yield of DNA appeared to be similar with spectrometric and HPLC
measurements, but was significantly lower when the yield was determined by the fluorescent
method. This might be due to the fact that the fluorescent stain is dependent on the structure,
the size and the composition of the nucleic acids. Another finding was that RNA and DNA
could be separated by HPLC, so that RNA measurement was not biased by DNA and vice
versa, which might not be the case for the other two techniques.
RT-PCR/PCR OF 16S rRNA/rDNA
In order to gain an insight into the microbial structure in different ecosystems, various
methods have been developed based on the nucleic acid sequences of small subunit (SSU)
rRNA or rDNA because these molecules are ideal phylogenetic and taxonomic markers (3,
123). There are various reasons to use rRNA and rDNA genes as markers, including (a) their
presence in all cells; (b) their high degree of sequence conservation which facilitates their
detection; (c) the presence of highly variable regions in their sequences which makes them
useful to discriminate at (sub)species to higher phylogenetic levels; and (d) the presence of
databases containing up to 20,000 SSU rRNA sequences (M. Wagner, personal
communication) from different taxa that facilitates the phylogenetic characterization of
cultured and uncultured microbes. Moreover, rDNA can be amplified by PCR in vitro (88).
The principle of PCR is that cycles of DNA melting, primer annealing and elongation
using a thermostable polymerase are repeated, resulting in an exponential increase of
amplified genes. In addition, rRNA can also be amplified, but it has first to be converted into
DNA by reverse transcription. This can be done by reverse transcriptase using an
oligonucleotide primer which targets the RNA template (a procedure termed RT-PCR).
Although DNA and RNA can be amplified with other techniques (14), this section will only
focus on RT- and regular PCR. Some important factors which may influence the amplification
procedure, notably when mixtures of DNA or RNA from different organisms are amplified,
include the purity of DNA, the G+C content of the target, the secondary structure of the
target, preferential amplification, and formation of chimeric structures. Several methods
minimizing these factors have been reported (9, 50, 82, 114, Table 1).
Preferential amplification. Some sequences may be preferentially amplified in a mixture of
different sequences from comparable genes. For 16S rDNA it has regularly been reported that
variations in primer pairs result in biased amplification when using mixtures of DNA as a
template (82, 86, 107, 121). Equal amplification efficiency of 16S rDNA is necessary to get
an insight into the microbial composition of an ecosystem. It was suggested that the bias in
amplification observed with the canonical universal primers 27F and 1492 (52) can be
decreased by (a) decreasing the number of amplification cycles; (b) mixing several replicate
PCR amplifications; (c) using high template concentrations; and (d) excluding degenerate
primers (82). A disadvantage of high template concentrations might be a high risk of the
formation of chimera, consisting of PCR fragments originating from more than one target
gene. Chimera formation during the amplification of 16S rDNA from an environmental
sample results in an overestimation of the biodiversity. Since the homology between different
16S rRNA genes is relatively high, chimeras are thought to arise from reannealing of different
16S rDNA genes during PCR (56).
Multiple competitive PCR and quantitative RT-PCR have been used to test the
universal bacterial primers U968-GC and LI401 when used to amplify 16S rRNA from soil
(32, 73). It was found that 16S rDNA clones and bacterial 16S rRNA sequences from
different phylogenetic groups were not preferentially amplified, although some target
sequences have some minor sequence differences at the annealing sites of the primers (32). It
has been shown that there are no differences in the TGGE patterns of DNA amplified for
different numbers of cycles with the same primers (128). However, it was observed that the
primers which were used to amplify complete 16S rDNA were preferentially amplifying
Prevotella-like sequences. This was specifically noted when amplified 16S rDNA was
reamplified using the primer pair which amplified the V6 to V8 regions. Reamplification of
amplicons using another primer pair is called nested PCR. Although primer pairs may show
limited preferential amplification, this undesired bias can never be excluded. For example, if
19
target DNA or rRNA from an unknown, uncultured microbe is not amplified during the first
PCR cycles then it will stay undetected forever.
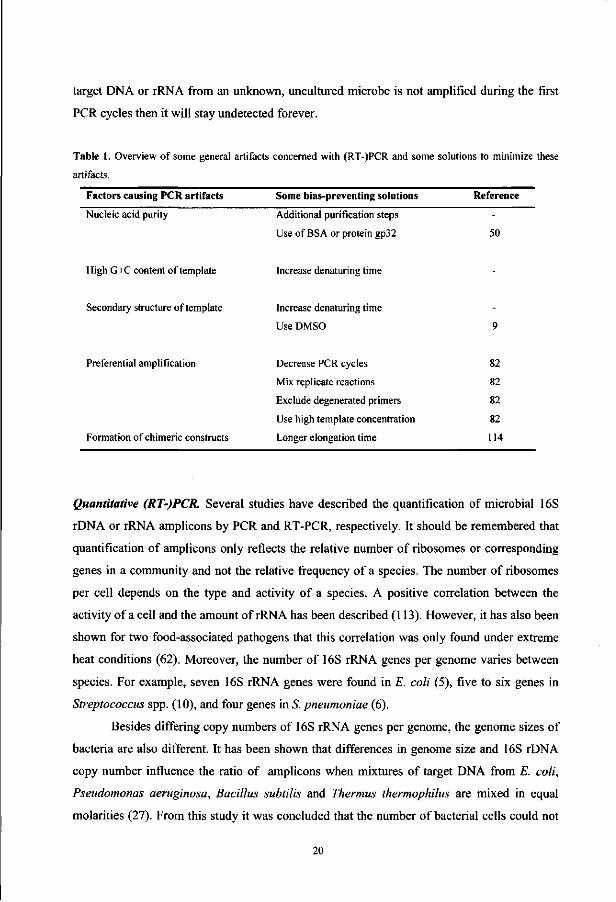
Table 1. Overview of some general artifacts concerned with (RT-)PCR and some solutions to minimize these
artifacts.
Factors causing PCR artifacts Some bias-preventing solutions Reference
Nucleic acid purity Additional purification steps
Use of BSA or protein gp32 50
High G+C content of template Increase denaturing time
Secondary structure of template Increase denaturing time
Use DMSO
Preferential amplification
Formation of chimeric constructs
Decrease PCR cycles
Mix replicate reactions
Exclude degenerated primers
Use high template concentration
Longer elongation time
82
82
82
82
114
Quantitative (RT-)PCR. Several studies have described the quantification of microbial 16S
rDNA or rRNA amplicons by PCR and RT-PCR, respectively. It should be remembered that
quantification of amplicons only reflects the relative number of ribosomes or corresponding
genes in a community and not the relative frequency of a species. The number of ribosomes
per cell depends on the type and activity of a species. A positive correlation between the
activity of a cell and the amount of rRNA has been described (113). However, it has also been
shown for two food-associated pathogens that this correlation was only found under extreme
heat conditions (62). Moreover, the number of 16S rRNA genes per genome varies between
species. For example, seven 16S rRNA genes were found in E. coli (5), five to six genes in
Streptococcus spp. (10), and four genes in S. pneumoniae (6).
Besides differing copy numbers of 16S rRNA genes per genome, the genome sizes of
bacteria are also different. It has been shown that differences in genome size and 16S rDNA
copy number influence the ratio of amplicons when mixtures of target DNA from E. coli,
Pseudomonas aeruginosa, Bacillus subtilis and Thermus thermophilus are mixed in equal
molarities (27). From this study it was concluded that the number of bacterial cells could not
20

be calculated exactly when both parameters are unknown.
Despite the fact that relative cell numbers cannot be extrapolated from (RT-)PCR data,
changes in the structure and activity of a microbial community can be analyzed when 16S
rRNA or rDNA amplicons are quantified. E. coli and P. aeruginosa 16S rRNA genes from
mixtures of these bacteria with ratios of 1:100 could be quantified using the Perkin Elmer
QPCR system 5000 (11). Biotinylated PCR products were captured on streptavidin-coated
paramagnetic beads after different PCR cycles, and specific PCR products were quantified by
measuring the electrochemoluminescent signals from the specific reporter probes directed
against the different amplicons.
Another way of quantifying 16S rRNA genes is a so-called most probable number
(MPN)-PCR (108). In this method the target DNA for PCR is diluted to extinction, followed
by analysis of PCR products by agarose gel electrophoresis. This approach was used to
quantify the relative amounts of 16S rDNA derived from different groups of bacteria in fecal
samples using different primer combinations (116). Although this form of multiplex PCR has
the potential to be useful, the data have to be analyzed carefully, since the PCR conditions
may not be quantitative as the primer pairs and product sizes are different.
Another approach involves the use of competitive PCR for the quantification of
mRNA (115). In this method a specific standard of known concentration is added in different
amounts to the target. The different sizes of the standard and target allows for differentiation
and subsequent quantification following agarose or polyacrylamide gel electrophoresis.
The combination of TGGE and competitive RT-PCR resulted in the development of a
new quantification method called multiple competitive RT-PCR (32). In this approach,
changes in amplification conditions were minimized because the products were amplified
with the same primer pairs and had the same size as the added standard. TGGE was used to
separate and quantify the different products. It was found that the 20 most abundant
sequences, which derived mainly from Gram-positive species of low G+C content,
represented about 50% of the total microbial community in the Drentse A grassland soils.
CLONING, SEQUENCING AND PHYLOGENETIC ANALYSIS
To get an overview of the complexity of ecosystems, it is essential to classify the individuals
from a population. Classification is used to clarify the relationships between different
organisms. It has to be emphasized that there is no single unifying classification of organisms.
21

This section will focus on classification based on phylogenetic relationships between
organisms.
Phylogeny is determined by scoring for the presence or absence of homologous
morphological or physiological characteristics across operational taxonomic units (OTUs),
which can be populations, species or strains. Both physiological and genetic characteristics
can be used for phylogenetic analysis. The principle of phylogenetic analysis is the
assumption that all life forms have evolved from a common origin. The common ancestor of
two closely related organisms disappeared more recently than that of two more distantly
related organisms. It is believed that evolution follows a pattern of successive branchings into
populations in which further evolutionary changes subsequently proceed independently.
Phylogeny involves the determination and analysis of these branching patterns.
Cloning, sequencing and phylogenetic analysis of 16S rDNA sequences have become
powerful tools in microbial ecology, particularly since it was discovered that the majority of
microorganisms in environmental samples are unknown (3). The highly conserved, but
discriminative 16S rDNA molecule makes it possible to identify a species in an ecosystem
without the use of unreliable culturing methods. Cloning and sequencing of 16S rDNA
amplicons has become a standard procedure in molecular ecology and provides information
about the genetic diversity and phylogenetic relationships between microorganisms in an
ecosystem. Since up to 20,000 different SSU rRNA sequences are available in different
databases, the comparison of new sequences is reliable. However, a clone library (a collection
of clones from a DNA sample) has to be very large to give a reliable picture of the genetic
diversity in complex ecosystems. This makes the approach expensive and time consuming.
Therefore, a rapid approach for screening 16S rDNA clone libraries has recently been
developed (59). Habitat-based probes were designed using subtractive hybridization. These
habitat-based probes were used to screen a 16S rDNA library generated from the same
habitat. It was shown that this screening method prevents sequencing many similar or
identical clones of the dominant members in sediments.
Cloning. To construct a clone library, a mixture of 16S rDNA amplicons is first generated by
PCR using bacterial or universal primers to amplify 16S rDNA from an environmental
sample. A cloning strategy is necessary to sequence individual amplicons derived from the
DNA of a complex microbial community. There are different strategies to create a clone
library. DNA fragments can be cloned into a plasmid vector or a bacteriophage. Detailed
22

principles, possibilities and procedures for cloning DNA fragments have been described
elsewhere (58, 77). Amplicons are usually cloned into a sequencing vector, which is then
transformed into an E. coli strain. Although a great variety of different cloning vectors are
available, they all show some common characteristics. One common feature is that amplicons
are inserted into a gene with many restriction sites (e.g., the polylinker in that part of the lacL
gene coding for the cc-peptide). The amplicons and the vectors have to be restricted with the
same restriction enzyme(s) for cloning. Some vectors contain a 3'T-overhang at the insertion
sites, and these are particularly useful for amplicons produced by certain polymerases (e.g.,
Tag polymerase) which sometimes make 3'A-overhangs (16). Amplicons of 16S rDNA are
cloned into the vector with a ligase. After ligation, the vectors containing a single 16S rDNA
insert are transformed into a competent E. coli strain. The cells are grown on selective plates
and single transformants are screened for the presence of vectors containing a 16S rDNA
insert by means of PCR or colony hybridization with 16S rDNA-specific probes. The vectors
containing a 16S rDNA insert can be isolated after regrowing the positive transformants and
can then be subjected to sequence analysis or fingerprinting.
Sequence analysis. Sequence analysis is used to provide information about the nucleotide
sequence of a cloned amplicon. There are different methods to determine the sequence of a
DNA fragment, but these will not be discussed here. Several programs to determine the
closest relative of the DNA sequence, are available on internet sites. Mostly, these programs
use homology searches provided by BLAST (2, http://www.ncbi.nlm. nih. gov/BLASTI) or
FASTA (80, http://biogate.mlg.co.jp/tssfree/Fasta.html). The benefit of these programs is that
the search for homology is fast and reliable, and several DNA databases can be used for
comparison. When DNA sequences are compared, the alignment of sequences for highest
homology is a crucial step. The alignment of sequences is performed by giving homologous
or conserved parts the same nucleotide position. The variable regions in between are
compared in such a way that the highest homology is found. Gaps in a nucleotide sequence
are also included in the alignment, but the number of gaps should be minimized. Each
position in a sequence can be one of the four nucleotide bases or a gap. This alignment of
nucleotide sequences is necessary in order to construct phylogenetic trees and to develop
oligonucleotide probes (52, 103).
23
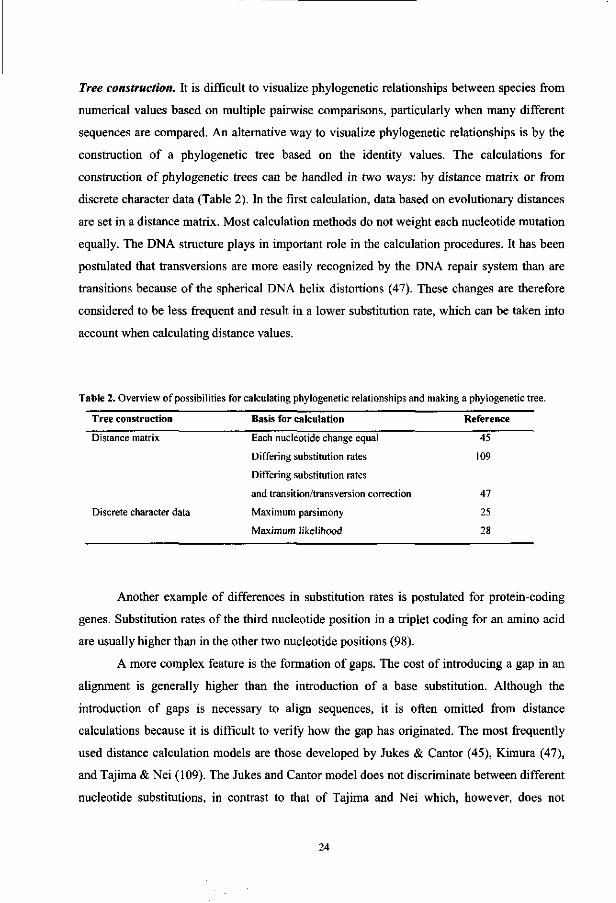
Tree construction. It is difficult to visualize phylogenetic relationships between species from
numerical values based on multiple pairwise comparisons, particularly when many different
sequences are compared. An alternative way to visualize phylogenetic relationships is by the
construction of a phylogenetic tree based on the identity values. The calculations for
construction of phylogenetic trees can be handled in two ways: by distance matrix or from
discrete character data (Table 2). In the first calculation, data based on evolutionary distances
are set in a distance matrix. Most calculation methods do not weight each nucleotide mutation
equally. The DNA structure plays in important role in the calculation procedures. It has been
postulated that transversions are more easily recognized by the DNA repair system than are
transitions because of the spherical DNA helix distortions (47). These changes are therefore
considered to be less frequent and result in a lower substitution rate, which can be taken into
account when calculating distance values.
Table 2. Overview of possibilities for calculating phylogenetic relationships and making a phylogenetic tree.
Tree construction
Distance matrix
Discrete character data
Basis for calculation
Each nucleotide change equal
Differing substitution rates
Differing substitution rates
and transition/transversion correction
Maximum parsimony
Maximum likelihood
Reference
45
109
47
25
28
Another example of differences in substitution rates is postulated for protein-coding
genes. Substitution rates of the third nucleotide position in a triplet coding for an amino acid
are usually higher than in the other two nucleotide positions (98).
A more complex feature is the formation of gaps. The cost of introducing a gap in an
alignment is generally higher than the introduction of a base substitution. Although the
introduction of gaps is necessary to align sequences, it is often omitted from distance
calculations because it is difficult to verify how the gap has originated. The most frequently
used distance calculation models are those developed by Jukes & Cantor (45), Kimura (47),
and Tajima & Nei (109). The Jukes and Cantor model does not discriminate between different
nucleotide substitutions, in contrast to that of Tajima and Nei which, however, does not
24

correct for nucleotide transitions or transversions, as does the model of Kimura. The model of
Jukes and Cantor has probably been applied most frequently in evolutionary studies because it
performed well in most studies simulating the evolution of nucleic acid sequences (112).
Phylogenetic trees can be plotted from distance matrices. Commonly used models
which calculate distance trees are the unweighted pair group method using arithmetic
averages (UPGMA; 101) and neighbor joining method (89). UPGMA is a clustering method
which pairs the least distant sequences into a node, and subsequently pairs two nodes into a
new node. The neighbour joining method uses a simplified algorithm to calculate branch
lengths and tree topologies.
Discrete character data calculations are not based on evolutionary distances, but
consider each character state of the nucleotide position in the sequence separately. Trees can
be constructed from each nucleotide position. The data can be handled in two ways. The first
way is based on the maximum parsimony principle in which the true tree is the one which
requires the fewest number of mutational changes to explain the differences observed between
the gene sequences (25). Only so called ,informative nucleotides' (a common nucleotide
position in a set of sequence positions which favor only some of all possible trees) are used.
In general, this means that a constant base in all sequences and a variable base which does not
favor one tree over all others are not informative. The second way to handle discrete character
data is called the maximum likelihood phylogeny. This calculation uses statistical models to
calculate the probability that one sequence is converted into another sequence by mutation
over time (28). More detailed explanations and comparison of the methods have been
described extensively elsewhere (83, 100, 125).
It has to be realized that evolutionary events cannot be checked for and that
phylogenetic trees therefore only represent a systematic ordering of genes. Furthermore,
calculations based on different DNA sequences or different genes may result in completely
different trees. As a consequence, it is difficult to choose which tree-constructing approach is
most optimal. For 16S rDNA sequences from cultured and uncultured Frankia strains, it was
found that trees constructed by methods based on discrete character data or distance matrices
were roughly the same (125). The choice of the program might therefore depend on the speed,
ease and possibilities of the different programs and on the applications of the user. A
comparison of different methods can be used to demonstrate the robustness of the
phylogenetic tree generated.
25

Phytogeny of16S rRNA genes. Phylogeny based on 16S and 23S rRNA analysis has led to
the construction of phylogenetic trees which illustrate the evolutionary relationship between
different organisms. This has resulted in a division of all life into three main domains:
Archaea, Bacteria and Eucarya (123, 124). The increasing number of 16S rDNA sequences of
bacterial isolates has allowed phylogenetic analysis of 16S rDNA to be applied to bacterial
taxonomy. The threshold for species determination is set at 70% DNA-DNA hybridization
between the genomes of different strains (119). Strains showing values above this threshold
are considered to be the same species and this threshold has been translated into a 16S rRNA
value (102). It was estimated that strains with less than 97% 16S rDNA sequence similarity
have less than 70% DNA-DNA hybridization values. This threshold can be used to determine
whether two strains do not belong to the same species, but cannot be used as the only
characteristic for species determination. Indeed, some Bacillus spp. have less than 70% DNA-
DNA hybridization, but more than 99.5% 16S rRNA sequence similarity (36).
Sometimes traditional taxonomic methods can be compared to the 16S rRNA
phylogeny. Some genera in the GI tract that have been characterized physiologically (e.g.,
bifidobacteria) form a monophyletic group in the 16S rRNA tree. However, many bacterial
genera in the GI tract do not form monophyletic clusters in the 16S rRNA phylogenetic tree.
In particular, the genera Clostridium and Eubacterium are mixed and divide into different
distinguishable clusters (18). Other genera like Ruminococcus and Butyrivibrio are mixed in
these clusters, making identification quite difficult. Additionally, it was found that the 16S
rRNA sequences of two strains, identified as Fusobacterium prausnitzii by physiological
characteristics, were not phylogenetically related to other Fusobacterium strains, but grouped
in one of the Clostridium clusters (117). In such cases, physiological characteristics cannot be
translated from phylogenetic characters when the species are not closely related.
The use of 16S rRNA sequence analysis in taxonomy has also resulted in proposals for
renaming bacterial species. Based on their 16S rRNA sequences and their physiological
characteristics, it was proposed to redesignate Peptostreptococcus productus and
Streptococcus hansenii as Ruminococcus species (26). In conclusion, it seems that
phylogenetic and physiological analysis are both necessary for a reliable identification.
Following the increase in the number of DNA sequences, databases such as EMBL
and Genbank have become available on internet sites. These databases contain up to 20,000
SSU rRNA sequences and are suitable for comparing, downloading and the deposition of
sequences. The most commonly used database for rRNA sequence analysis is that of the
26

~ I Pre
L A
Fecal clone A09 • Prevtttella oris Prevotella wroraiis
Adhufec 94 Adhufec 235
Adhufec 43 Prewteila oulora
J - Adhufec 23 j ^ Bacteroides thetaiotaomicron nr Bacteroides ovafus
J n Adhufec 355 P r Adhufec 51 J *• Bacteroides caccae
Bacteroides uniformis Adhufec 153
Bacteroides stercoris Adhufec 303
T Adhufec 27 _ [ Bacteroides vulgalus
J T Adhufec 367 ' Adhufec 151
Adhufec 55 Hacteroides merdae
Bacteroides splanchnicus Adhufec 291
Adhufec 84
J * Hi l i Bacteroi
J1 Adhufec | _ |— Hact ^ — AHhn'
I Adhufec 406 I I | Hutyrivibria t
J L Adhufec 363 1 P Adhufec
L F.u Eubacterium eligens Hu tyrivibrio fibrisolvens Eubacterium ramulus Adhufec 310
Adhufec 8 Eubacterium rectaie Fecal clone Al 3
Fecal clone A22 Roseburia ceticota Adhufec ISO
Adhufec 225 Fecal clone A11 Adhufec 68
Fecal clone A21 Fecal clone A54 Adhufec 217 Adhufec 250
Adhufec 382 Fecal clone A12
Adhufec 405 Adhufec 295
Clostridium celerecnseens J Ruminococcus obeum P— Adhufec 172
I - Fecal clone A14 | 1- Fecal clone A20 LI Adhufec 171 ^ Fecal clone A57 — Ruminococcus productm Adhufec 52 • Adhufec 40 Fecal clone A7I
Adhufec 420 Eu bacterium formUigenerans
Eubacterium ventriosum Adhufec 24
Adhufec 335 Adhufec 25 Eubacterium kadrum
Adhufec 236 r Fecal clone A07
Eubacterium kalii Fecal clone A19 Adhufec 157
Adhufec 57 • FccalcloncAK) Adhufec 113
Adhufec 365 Adhufec 2 IK Fu sobacterium prausnitzii
Fecal clone A03 Adhufec 13
Ruminococcus callidus Adhufec 58
Ruminococcus albus — Adhufec 101 Eubacterium siraeum • Adhufec 81 Ruminococcus bromii Adhufec 21
Clostridium Upturn Adhufec 168 Adhufec 269
f- Ad
. "- ft | _ | - Fecalc ^ — Adhi.i
| ^ ~ Ruminoc P — — Adh I r Eubactt
•— Adhul r Ruirdn
I l Adhufci L OO! ~ Adhi
i Adhi
f& n i A 1 Adh
Fecal clone A27 Clostridium viride
Adhufec 108 Adhufec 311
Fig. 3. Phylogenetic tree showing the phylogenetic relationships between cloned 16S rDNA from feces and the
closest cultivable relatives found in 16S rDNA databases. Complete and partial 16S rDNA sequences from fecal
samples were added to the phylogenetic tree of the ARB software. Sequences called fecal clone A03 - A71 and
adhufec 8 - 420 were retrieved from Zoetendal et al. (128) and Suau el al. (106), respectively. These sequences
and the sequences from the closest cultivable relatives were marked, and the remaining sequences were removed
from the tree. Bold-marked sequences represent the closest cultivable relative found in the database; the bar
indicates the calculated genetic distance between the sequences.
27

Ribosomal Database Project (RDP; 57, http://www.cme.msu.edu/RDP/analysis.html). The
RDP contains an aligned database of 16S rRNA sequences, which are present in a
phylogenetic tree. Another software package containing a rRNA database is the ARB
software package (105). This program is comparable to the RDP, but the package needs a
powerful computer for calculations. The secondary structure of the rRNA molecule is used for
the similarity calculation and is visualized in the alignment program of the ARB package.
This facilitates sequence analysis and is ideal when checking for sequencing errors. The
phylogenetic trees in both programs are comparable.
16S rRNA databases are not only used for strain identification, but are also used to
study the bacterial diversity in an ecosystem. The development of molecular methods in
microbial ecology has resulted in an increasing number of sequences from cloned amplicons
derived from different types of environments. Several papers on intestinal samples from
different types of animals have shown that many of the cloned 16S rDNA sequences show
identity below the 97% threshold to their closest cultivable relative in the DNA databases (76,
106, 120, 121, 128). This means that the species from which the sequences have been derived
have not yet been cultured or, alternatively, are present in a culture collection but their 16S
rDNA has not yet been sequenced. Fig 3 shows a phylogenetic tree built from 16S rDNA
sequences of bacterial clones from human feces and their closest cultured relatives found in
the 16S rDNA database of the ARB software package. These results reinforce the concept that
most bacteria in existence have not yet been cultured (3). For the GI tract, this means that our
knowledge about the role of the microbial community in the intestine is limited. Therefore,
cloning and sequencing of fecal or intestinal clones is needed to determine the microbial
diversity and to study the structure of the community in the GI tract.
FINGERPRINTING
Sequence analysis of 16S rDNA/rRNA clone libraries gives reliable information about the
genetic diversity of an ecosystem. However, this approach is expensive, time-consuming and
not suitable for monitoring complex ecosystems. It will be necessary to study complex
ecosystems using alternative methods that are better suited for studying the composition and
temporal variation in ecosystems, probably based on sequence differences of the nucleic
acids. Fingerprinting techniques are suitable to describe the genetic diversity at different
levels of a microbial community. There are many types of fingerprinting techniques which
28

can be useful at the community, species and even strain level. The next section describes
SSCP, DGGE and TGGE fingerprinting techniques which are commonly used to study the
microbial diversity of different ecosystems. These techniques are based on differences in the
nucleotide sequence of amplicons of similar size and are suitable for describing ecosystems at
the species level. The sequence-specific separation of PCR amplicons is an essential element,
but differs between the techniques. SSCP relies on the secondary structures of the single
strands, while the other techniques rely on the melting behavior of the double stranded
amplicon.
SSCP. SSCP is an electrophoretic technique which has been developed for the detection of
mutations in genes and has been used widely in the field of human genetics (41, 78). The
principle of SSCP is that the mobility of a single-stranded DNA fragment is dependent on the
secondary structure of the fragment. The secondary structure is determined by the nucleotide
sequence and the physiological environment (e.g., temperature, pH and ionic strength). SSCP
has been shown to be able to detect single base differences in 99% of amplicons which are up
to 300 bases in size. This detection limit drops using longer fragments (41, 42). A typical
SSCP profile consists of two single-stranded DNA fragments and one double-stranded
fragment, although different conformations from one strand are also possible. This technique
has only been used occasionally in ecological studies. SSCP of the 16S-23S rRNA spacer has
been used to analyze mixtures of bacteria (92), and SSCP of different regions in the rRNA
operon has been used to differentiate between root-associated fungi (17). SSCP has been
used to analyze microbial communities in a few studies. For example, the V3 region of the
16S rRNA gene was used for SSCP fingerprinting of bacterial strains and environmental
samples (54). The problem of bands caused by heteroduplex formation in mixed DNA
samples could be solved by removing glycerol from the gel, but this removal resulted in a
lower separation efficiency of the single strands. It has been reported that the bands in the
profiles of the environmental samples did not correspond to bands in the profiles of those
bacteria that could be cultivated. The 16S rDNA sequence of a bacterium making up about
1.5% of a community could be visualized with this technique.
Recently, a new approach for SSCP analysis was reported (96). In this study,
amplicons containing the V4 to V5 region were used. One of the primers was phosphorylated
at the 5'end. After amplification the phosphorylated strand could be digested selectively with
lambda exonuclease. Using this technique, the number of bands per species could be
29
minimized and heteroduplex formation in mixed DNA samples could be prevented. Clear
banding patterns could be obtained from environmental samples.
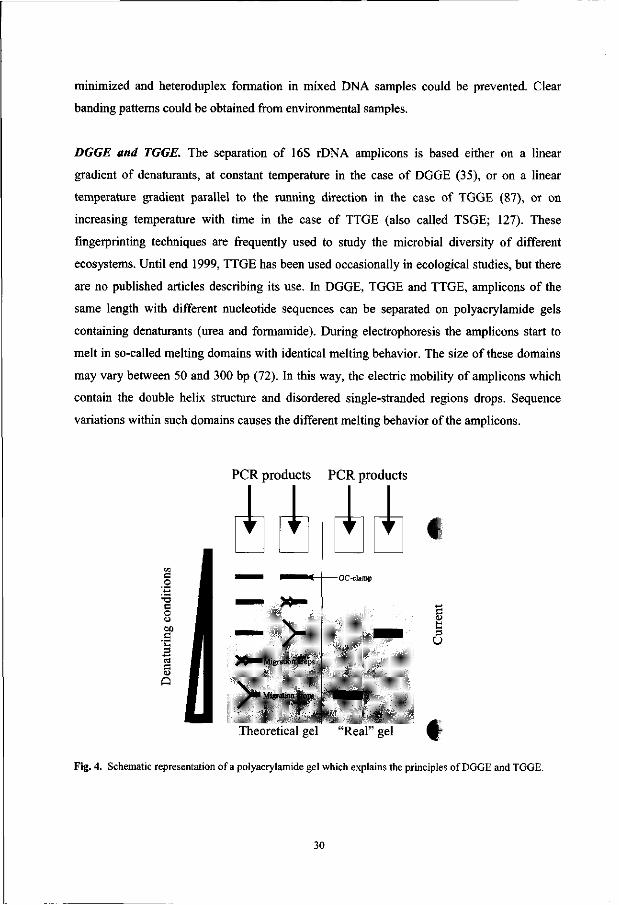
DGGE and TGGE. The separation of 16S rDNA amplicons is based either on a linear
gradient of denaturants, at constant temperature in the case of DGGE (35), or on a linear
temperature gradient parallel to the running direction in the case of TGGE (87), or on
increasing temperature with time in the case of TTGE (also called TSGE; 127). These
fingerprinting techniques are frequently used to study the microbial diversity of different
ecosystems. Until end 1999, TTGE has been used occasionally in ecological studies, but there
are no published articles describing its use. In DGGE, TGGE and TTGE, amplicons of the
same length with different nucleotide sequences can be separated on polyacrylamide gels
containing denaturants (urea and formamide). During electrophoresis the amplicons start to
melt in so-called melting domains with identical melting behavior. The size of these domains
may vary between 50 and 300 bp (72). In this way, the electric mobility of amplicons which
contain the double helix structure and disordered single-stranded regions drops. Sequence
variations within such domains causes the different melting behavior of the amplicons.
c o
a o o 00
'n 3
a Q
PCR products PCR products
U^ >
• Migration drops
• Migration drops >
Theoretical gel "Real" gel
-GC-clamp
a t s U
Fig. 4. Schematic representation of a polyacrylamide gel which explains the principles of DGGE and TGGE.
30

Attachment of a GC-clamp makes it possible that sequence variations in the most
stable domains can also be separated (71, 97). This GC-clamp is a G+C rich domain which is
attached to the amplicons by adding it at the 5'end of one of the primers, and which prevents
complete melting of the amplicons. In principle, all single base differences at each position of
the amplicons can be separated for amplicons of up to 500 bp (97). The final position of the
amplicons in the gel depends on the melting behavior of the amplicons (and, therefore, the
nucleotide sequence) and the running time. A simplified representation of DGGE and TGGE
analysis of amplicons is shown in Fig. 4.
The introduction of DGGE into ecological studies was originally designed to separate
amplified V3 regions of 16S rDNA from marine ecosystems. Amplicons derived from sulfate-
reducing bacteria could be detected after blotting the DGGE profiles with a specific probe
(70). Following this study, the application of these techniques to ecological studies increased
enormously. Different ecosystems have been analyzed by separation of different amplified
regions from 16S rDNA and 16S rRNA using these fingerprinting techniques. These
techniques have not only been used for analyzing the composition and stability of different
ecosystems, but have also been used for comparing DNA extraction protocols, screening of
clone libraries, determining 16S rRNA sequence heterogeneities, monitoring enrichment and
isolation procedures, and determining biases introduced by PCR and cloning. Recent
overviews of the use of these and other methods for studying different ecosystems are
available (67, 69).
To increase the separation efficiency, an optimal gradient has to be chosen. This can
be done by applying the gradient perpendicular to the running direction (70). For TTGE, the
optimal temperature gradient has to be calculated from known sequences. Amplicons with
only one nucleotide difference can be separated when an optimal gradient is applied (71, 73).
Additionally, it has been shown that a wobble base (either C or T) in the reverse primer may
result in two distinct bands (49). The opposite, however, also takes place. Sometimes, 16S
rDNA amplicons cannot be separated although they differ in nucleotide sequence (13, 111).
TGGE and DGGE of 16S rDNA and rRNA amplicons have been used to describe the
microbial composition of several ecosystems. In these studies, different universal primer pairs
have been used to describe dominant communities. An MPN (RT-)PCR can be used to check
if the dominant community is visualized on TGGE (Fig. 5). In general, 16S rDNA, but also
16S rRNA, is used as a target for analyzing microbial diversity (Fig. 5). Profiles derived from
16S rRNA represent the relative number of different ribosomes in an environmental sample,
31

which reflects the active fraction of a community. Comparing rRNA- and rDNA-derived
amplicons may give information about the activity in the microbial community of a certain
group (29, 110, 128), but it has to be realized that the number of ribosomes and rRNA genes
may differ per species. Several studies have shown that sequences derived from a bacterium
which makes up about 1% of a microbial community can still be visualized using TGGE and
DGGE (66, 70, 128), which is similar to the sensitivity of SSCP analysis. Instead of using
universal primers, group- or species-specific primers can be used to focus on particular
groups. The genetic diversity of uncultured ammonia-oxidizing bacteria (49) and
cyanobacteria (74) has been studied using specific 16S rDNA primers for both groups. DGGE
and TGGE have also been used to describe the expression of functional genes such as the
[NiFe] hydrogenases from Desulfovibrio populations (118). The combination of D/TGGE
analysis of 16S rDNA and a functional gene may be used to study relationships between the
structures and functions of ecosystems.
1 0 - ' lO" 2 1 0" 3 lO" 4 lO" 5 lO" 6
Fig. 5. TGGE profiles of amplified V6 to V8 regions of 16S rRNA from a fecal sample using the MPN RT-PCR approach. 10" represents the dilution of template RNA used for amplification.
TGGE and DGGE analysis of amplicons is semi-quantitative, i.e., an intensive band is
more abundant than a weak band in a profile. When an appropriate standard template of
known concentration is added to the nucleic acids extracted from a microbial community,
different genes or ribosome fractions can be quantified. Bands for which the intensity is
identical to the intensity of the standard can be quantified. This approach is called multiple
competitive (RT-)PCR (32). Different ribosome fractions from Drentse A soils could be
32
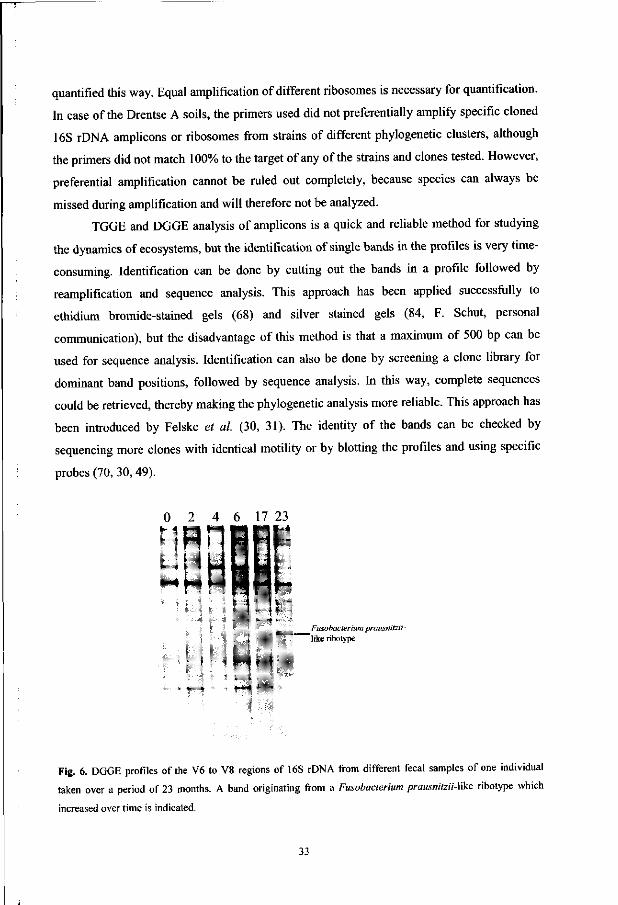
quantified this way. Equal amplification of different ribosomes is necessary for quantification.
In case of the Drentse A soils, the primers used did not preferentially amplify specific cloned
16S rDNA amplicons or ribosomes from strains of different phylogenetic clusters, although
the primers did not match 100% to the target of any of the strains and clones tested. However,
preferential amplification cannot be ruled out completely, because species can always be
missed during amplification and will therefore not be analyzed.
TGGE and DGGE analysis of amplicons is a quick and reliable method for studying
the dynamics of ecosystems, but the identification of single bands in the profiles is very time-
consuming. Identification can be done by cutting out the bands in a profile followed by
reamplification and sequence analysis. This approach has been applied successfully to
ethidium bromide-stained gels (68) and silver stained gels (84, F. Schut, personal
communication), but the disadvantage of this method is that a maximum of 500 bp can be
used for sequence analysis. Identification can also be done by screening a clone library for
dominant band positions, followed by sequence analysis. In this way, complete sequences
could be retrieved, thereby making the phylogenetic analysis more reliable. This approach has
been introduced by Felske et al. (30, 31). The identity of the bands can be checked by
sequencing more clones with identical motility or by blotting the profiles and using specific
probes (70, 30, 49).
0 2 4 6 17 23
- l i I (.-J t—j • 4 *j,«y| L^Jt i ^ l L I ^ J w—m f"<^ f«"«f p ^ f^ * " *
Fusobacterium prausnitzii-"likeribotype
Fig. 6. DGGE profiles of the V6 to V8 regions of 16S rDNA from different fecal samples of one individual
taken over a period of 23 months. A band originating from a Fusobacterium prausnitzii-\ike ribotype which
increased over time is indicated.
33

Despite the increasing number of applications in molecular ecology, only a few studies
have been performed with GI tract ecosystems. DGGE analysis of the V3 regions of 16S
rDNA was used to study the role of uncultured bacteria in pre-term infants with and without
necrotizing enterocolitis (NEC) (63). It was found that the number of uncultured bacteria in
fecal samples from children with NEC was not more frequent than in fecal samples from
children without NEC. TGGE based on the V6 to V8 regions of amplified 16S rDNA and 16S
rRNA has been used to study the bacterial composition of different fecal samples (128). This
study showed that each adult individual has his own fecal microbiota, which is relatively
stable over time. Only a few amplicons were shared by all fecal samples. It was found that the
fecal community in one person remained stable for almost 2 years (Fig. 6). A band
corresponding to a cloned Fusobacterium prausnitzii-Wks ribotype increased slightly over this
period. Furthermore, it was found that most dominant amplicons in an individual's profile
derived from species that have not been cultured. Recently, the microbial community in the
porcine GI tract has been studied using DGGE analysis of the V3 region of 16S rDNA. It was
observed that unique bands were found in the fingerprints of fecal samples from pigs differing
in age, and that the profiles were most similar within a single GI tract compartment and
between adjacent ones (99).
M O A 2 4 M
*- - j i •-« i r f i ^ .. -
B 0 A 2 4
0 100.0
50.4 33.5 62.1
A
100.0 42.7 37.5
2 4
100.0 73.3 100.0
Fig. 7. DGGE profiles (A) of the V6 - V8 regions of 16S rDNA, and (B) a similarity matrix expressed in
Pearson correlations (x 100) of the DGGE profiles from fecal samples of one individual taken before (0), during
(A), and after (2 and 4 months) treatment with doxycycline for 1 week. Lane M contains a marker consisting of
cloned V6 - V8 amplicons.
Quantitative fingerprint analysis. The use of TGGE and DGGE to study complex ecosystems
can be enhanced by quantifying profile similarities. Computer analysis of scanned fingerprints
34
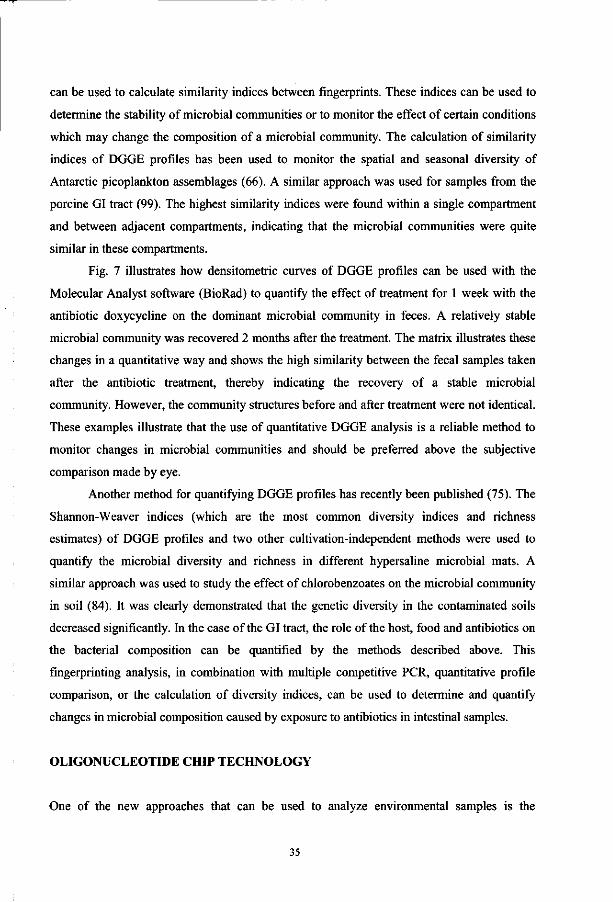
can be used to calculate similarity indices between fingerprints. These indices can be used to
determine the stability of microbial communities or to monitor the effect of certain conditions
which may change the composition of a microbial community. The calculation of similarity
indices of DGGE profiles has been used to monitor the spatial and seasonal diversity of
Antarctic picoplankton assemblages (66). A similar approach was used for samples from the
porcine GI tract (99). The highest similarity indices were found within a single compartment
and between adjacent compartments, indicating that the microbial communities were quite
similar in these compartments.
Fig. 7 illustrates how densitometric curves of DGGE profiles can be used with the
Molecular Analyst software (BioRad) to quantify the effect of treatment for 1 week with the
antibiotic doxycycline on the dominant microbial community in feces. A relatively stable
microbial community was recovered 2 months after the treatment. The matrix illustrates these
changes in a quantitative way and shows the high similarity between the fecal samples taken
after the antibiotic treatment, thereby indicating the recovery of a stable microbial
community. However, the community structures before and after treatment were not identical.
These examples illustrate that the use of quantitative DGGE analysis is a reliable method to
monitor changes in microbial communities and should be preferred above the subjective
comparison made by eye.
Another method for quantifying DGGE profiles has recently been published (75). The
Shannon-Weaver indices (which are the most common diversity indices and richness
estimates) of DGGE profiles and two other cultivation-independent methods were used to
quantify the microbial diversity and richness in different hypersaline microbial mats. A
similar approach was used to study the effect of chlorobenzoates on the microbial community
in soil (84). It was clearly demonstrated that the genetic diversity in the contaminated soils
decreased significantly. In the case of the GI tract, the role of the host, food and antibiotics on
the bacterial composition can be quantified by the methods described above. This
fingerprinting analysis, in combination with multiple competitive PCR, quantitative profile
comparison, or the calculation of diversity indices, can be used to determine and quantify
changes in microbial composition caused by exposure to antibiotics in intestinal samples.
OLIGONUCLEOTIDE CHIP TECHNOLOGY
One of the new approaches that can be used to analyze environmental samples is the
35

application of oligonucleotide microchips or microarrays (reveiwed by 55, 95). Microchips
consist of oligonucleotides which are immobilised in a polyacrylamide gel matrix bound to a
glass slide. Labeled target DNA or RNA can be added to the microchip, and the subsequent
hybridization signal can be detected and quantified using a computer-regulated camera
connected to the microscope. Microarrays consist of numerous cloned or amplified DNA
fragments rather than synthesized oligonucleotide probes, but the principle of microarrays is
the same as that of microchips. Oligonucleotide microchips and microarrays have already
been used several times for nucleotide sequencing. This sequencing by hybridisation (SBH)
has been proposed as an alternative technique for genome sequencing (12, 24, 126).
Microarrays have also been used to study the expression of certain genes, and also nucleotide
variability between genes (15, 93).
Recently, microarrays have been used to identify unique DNA regions present in a
pathogenic strain of Pseudomonas aeruginosa which appeared to be missing in a control
strain (7). The use of microchips could eventually be relatively cheap, because the
concentration of probes per chip is very low, the information per analysis is high, and the
chips can be used 20 to 30 times (38). The use of microarrays could be even cheaper because
cloned amplicons are produced more economically than oligonucleotide probes. The
application of these microchips or microarrays to answer microbial ecological questions looks
promising. Environmental samples can be screened on microchips containing hundreds or
thousands of 16S rRNA targeted probes, or on microarrays containing many cloned 16S
rDNA fragments. However, one of the difficulties in using these approaches is the
optimization of the hybridization conditions for the different immobilized DNA fragments
(46). Recently, it has been reported that nitrifying bacteria and Bacillus spp. could be detected
and identified at the rRNA level using oligonucleotide microchips (38, 46). These approaches
look promising for wider applications in microbial ecology. In the near future it might be
possible to monitor expression of ribosomal and functional genes of an ecosystem with a
single microchip or microarray.
CONCLUSIONS AND PERSPECTIVES
The application of TGGE, DGGE, and SSCP to studies in microbial ecology is growing and
the future perspectives are promising. The combination of (RT-)PCR, cloning and
fingerprinting of environmental samples may give an accurate description of a community.
36

Despite some pitfalls concerned with biases in nucleic acid extraction and amplification
methods, these techniques have been shown to be useful for describing the microbial
composition of different ecosystems. The power of these techniques is their reliability, speed
and ease of use. TGGE, DGGE and SSCP are ideal for studying the temporal and spatial
variation in microbial communities, both qualitatively and quantitatively. The only time-
consuming aspect is the identification of specific amplicons in the profiles. The approach of
combining 16S rDNA profiles and profiles of functional genes may enable the structure to be
related to the function of an ecosystem. Another variant of this approach is the use of
oligonucleotide microchips. Extensive data can be obtained from a single analysis and may be
quantitative, although the different Tm values might be a problem in quantification.
In studying the role of the microbial community in the intestine of man and other
animals, the approaches described in this chapter should be applied instead of unreliable plate
counting analysis to describe the microbial composition. The fingerprinting approach has
already demonstrated that the dominant microbial community in adults is quite stable with
time and differs for each individual. This approach can also be used to monitor the fate of
certain bacteria, such as probiotic strains in the intestine (21). The impact of these strains on
the microbial community in the GI tract can be analyzed by quantifying similarities between
the profiles, or calculating microbial diversity and richness indices from profiles. Changes in
band positions can be identified using cloning and sequencing analysis. The introduction of
internal standards to the profiles may help the changes to be monitored quantitatively. These
approaches will definitely help in gaining an understanding of some aspects of the microbial
community in the intestine.
It is evident that the use of PCR-based fingerprinting techniques is useful in answering
ecological questions. Although the use of these techniques is still in development, their
application has already been shown to be a powerful tool for determining the structure of
microbial communities in different environments and monitoring changes in microbial
communities without unreliable cultivation procedures.
ACKNOWLEDGMENTS
Part of this work was supported by The Wageningen Centre for Food Sciences, the EU FAIR
CT-97-3035, the PROBDEMO-Project Fair CT96-1028, and the VTT Biotechnology and
Food Research.
37

REFERENCES
1. Akkermans A. D. L., J. D. van Elsas, and F. J. de Bruijn, eds. 1999. Molecular microbial ecology manual.
Kluwer, Dordrecht.
2. Altschul S.F., W. Gish, W. Miller, E. W. Meyers, and D. J. Lipman, D.J. 1990. Basic local alignment
search tool. J. Mol. Biol. 215:403-410.
3. Amann R. I., W. Ludwig, and K-H. Schleifer. 1995. Phylogenetic identification and in situ detection of
individual cells without cultivation. Microbiol. Rev. 59:143-169.
4. Apajalathi J. H., L. K. Sarkilahti, B. R. E. Maki, J. P. Heikkinen, P. H. Nurminen, and W. E. Holben.
1998. Effective recovery of bacterial DNA and percent-guanine-plus-cytosine based analysis of community
structure in the gastrointestinal tract of broiler chickens. Appl. Environ. Microbiol. 64:4084-4088.
5. Bachmann B. J. 1990. Linkage map of Escherichia co//K-12, edition 8. Microbiol.l Rev. 54: 130-197.
6. Bacot CM., and R. H. Reeves. 1991. Novel tRNA gene organization in the 16S-23S intergenic spacer of the
Streptococcus pneumoniae rRNA gene cluster. J. Bacterid. 173:4234-4236.
7. Bangera M. G., A. Norris, S. Lorry, and M. Olsen. 1999. Pathogenicity determinants in Pseudomonas
aeruginosa associated with cystic fibrosis. In: Abstracts of the 99th general meeting of the American Society for
Microbiology, pp.32. American Society for Microbiology, Washington D.C.
8. Bassam B. J., G. Caetano-Anolles, and P. M. Gresshoff. 1991. Fast and rapid silver staining of DNA in
polyacrylamide gels. Anal. B iochem. 196:80-83.
9. Baskaran N., R. P. Kandpal, A. K. Bhargava, N. W. Glynn, A. Bale, and S. M. Weissman. 1996. Uniform
amplification of a mixture of deoxyribonucleic acids with varying GC content. Genome Res. 6:663-668.
10. Bentley R. W., and J. A. Leigh. 1995. Determination of 16S ribosomal RNA gene copy number in
Streptococcus uberis, S. agalactiae, S. dysgalactiae andS. pauberis. FEMS Immunol. Med. Microbiol. 12:1-8.
11. Blok H. J., A. M. Gohlke, A. D. L. Akkermans. 1997. Quantitative analysis of 16S rDNA using
competitive PCR and the QPCR™ system 5000. BioTechniques 22:700-704.
12. Broude N. E., T. Sano, C. L. Smith, and C. R. Cantor. 1994. Enhanced sequencing by hybridization. Proc.
Natl. Acad. Sci.USA 91:3072-3076.
13. Buchholz-Cleven B. E. E., B. Rattunde, and K. L. Straub. 1997. Screening for genetic diversity of isolates
of anaerobic Fe(II)-oxidizing bacteria using DGGE and whole cell hybridization. Syst. Appl. Microbiol. 20:301-
309.
14. Carrino J. J. and H. H. Lee. 1995. Nucleic acid amplification methods. J. Microbiol. Meth. 23:3-20.
15. Chee M., R. Yang, E. Hubbell, A. Berno, X. C. Huang, D. Stern, J. Winkler, D. J. Lockhart, M. S.
Morris, and S. P. A. Fodor. 1996. Accessing genetic information with high-density DNA arrays. Science
274:610-614.
16. Clark J. M. 1988. Novel non-templated nucleotide addition reactions catalyzed byprocariotic and eukariotic
DNA polymerases. Nucl. Acids Res. 16:9677-9686.
17. Clapp J. P. 1999. The identification of root-associated fungi by polymerase chain reaction-single strand
conformational polymorphism (PCR-SSCP). In: Molecular microbial ecology manual, 3.4.7, pp. 1-18, eds. A. D.
L. Akkermans, J. D. van Elsas, and F. J. de Bruijn. Kluwer, Dordrecht.
18. Collins M. D., A. Willems, J. J. Cordoba, J. Fernandez-Garayzabal, P. Garcia, J. Cal, H. Hippe, and J.
38

A. E. Farrow. 1994. The phylogeny of the genus Clostridium: proposal of five new genera and eleven new
species combinations. Int. J. Syst. Bacteriol. 44:812-826.
19. Coppella S. J., C. M. Acheson, and P. Dhurjati. 1987. Measurement of copy number using HPLC.
Biotechech. Bioeng. 29:646-647.
20. Coppella, S. J., C. M. Acheson, and P. Dhurjati. 1987. Isolation of high-molecular weight nucleic acids
for copy number analysis using high-performance liquid chromatography. J. Chrom. 402:189-199.
21. De Vos W. M., E. G. Zoetendal, E. Poelwijk, H. Heilig, and A. D. L. Akkermans. 1999. Molecular tools
for analyzing the functionality of probiotic properties of microorganisms. In: Proceedings of the 25th
international dairy congress, pp. 323-328. Danish National Committee of the International Dairy Federation,
Aarhus.
22. Dell' Anno A., M. Fabiano, G. C. A. Duineveld, A. Kok, and R. Danovaro. 1998. Nucleic acid (DNA,
RNA) quantification and RNA/DNA ratio determination in marine sediments: comparison of
spectrophotometric, fluorometric, and high-performance liquid chromatography methods and estimation
of detrital DNA. Appl.Environ. Microbiol. 64:3238-3245.
23. Dor6 J., A. Sghir, G. Hennequart-Gramet, G. Corthier, and P. Pochart. 1998. Design and evaluation of a
16S rRNA-targeted oligonucleotide probe for specific detection and quantitation of human faecal Bacteroides
populations. Syst. Appl. Microbiol. 21:65-71.
24. Drmanac R., S. Drmanac, Z. Strezosca, T. Paunesku, I. Labat, M. Zeremski, J. Snoddy, W. K.
Funkhouser, B. Koop, L. Hood, and R. Crkvanjakov. 1993. DNA sequence determination by hybridization: a
strategy for efficient large-scale sequencing. Science 260:1649-1652.
25. Edwards A. W. F. and L. L. Cavilla-Sforza. 1963. The reconstruction of evolution. Heredity 18:553.
26. Ezaki T., N. Li, Y. Hashimoto, H. Miura, and H. Yamamoto. 1994. 16S ribosomal DNA sequences of
anaerobic cocci and proposal of Ruminococcus hansenii comb. nov. and Ruminococcus productus comb. nov.
Int. J. Syst. Bacteriol. 44:130-136.
27. Farrelly V., F. A. Rainey, E. Stackebrandt. 1995. Effect of genome sizes and rrn gene copy number on
PCR amplification of 16S rRNA genes from a mixture of bacterial species. Appl. Environ. Microbiol. 61:2798-
2801.
28. Feisenstein J. 1981. Evolutionary trees from DNA sequences: a maximum likelihood approach. J. Mol.
Evol. 17:368-376.
29. Felske A., B. Engelen, U. Niibel, and H. Backhaus. 1996. Direct ribosome isolation from soil to extract
bacterial rRNA for community analysis. Appl. Environ. Microbiol. 62:4162-4167.
30. Felske A., H. Rheims, A. Wolterink, E. Stackebrandt, and A. D. L. Akkermans. 1997. Ribosome
analysis reveals prominent activity of an uncultured member of the class Actinobacteria in grassland soils.
Microbiol. 143:2983-2989.
31. Felske A., A. Wolterink, R. van Lis, and A. D. L. Akkermans. 1998. Phylogeny of the main bacterial 16S
rRNA sequences in Drentse A Grassland soils. Appl. Environ. Microbiol. 64:871-879.
32. Felske A., A. D. L. Akkermans, and W. M. de Vos. 1998. Quantification of 16S rRNAs in complex
bacterial communities by multiple competitive reverse transcription-PCR in temperature gradient gel
electrophoresis. Appl. Environ. Microbiol. 64:4581-4587.
33. Felske A., H. Backhaus, and A. D. L. Akkermans. 1998. Direct ribosome isolation from soil. In:
39

Molecular microbial ecology manual, 1.2.3, pp 1-10. eds A. D. L. Akkermans, J. D. van Elsas, and F. J. de
Bruijn, Kluwer, Dordrecht.
34. Finegold S. M., V. L. Sutter, and G. E. Mathisen. 1983. Normal indigenous intestinal flora. In: Human
intestinal microflora in health and disease, pp/ 3-31. ed. D. J. Hentges, Academic Press, New York.
35. Fischer S. G. and L. S. Lerman. 1979. Length-independent separation of DNA restriction fragments in two-
dimensional gel electrophoresis. Cell 16:191-200.
36. Fox G.E., J. D. Wisotzkey, and P. Jurtshuk. 1992. How close is close: 16S rRNA sequence identity may
not be sufficient to guarantee species identity. Int. J. Syst. Bacterid. 42:166-170.
37. Franks A. H., H. J. M. Harmsen, G. C. Raangs, G. J. Jansen, F. Schut, and G. W. Welling. 1998.
Variations of bacterial populations in human feces measured by fluorescent in situ hybridization with group-
specific 16S rRNA-targeted oligonucleotide probes. Appl. Environ. Microbiol. 64:3336-3345.
38. Guschin D. Y., B. K. Mobarry, D. Proudnikov, D.A. Stahl, B. E. Rittmann, and A. D. Mirzabekov.
(1997). Oligonucleotide microchips as genosensors for determinative and environmental studies in microbiology.
Appl. Environ. Microbiol. 63:2397-2402.
39. Harmsen H. J. M., A. J. M. Stams, A. D. L. Akkermans, and W. M. de Vos. 1995. phylogenetic analysis
of two syntrophic propionate-oxidizing bacteria in enrichment cultures. Syst. Appl. Microbiol. 18:67-73.
40. Hay ash i K. 1991. PCR-SSCP: a simple and sensitive method for detection of mutations in the genomic
DNA. PCR Meth. Appl. 1:34-38.
41. Hayashi K. and D. W. Yandell. 1993. How sensitive is PCR-SSCP? Human Mutation 2:38-346.
42. Head I. M., J. R. Saunders, and R. W. Pickup. 1998. Microbial evolution, diversity, and ecology: a decade
of ribosomal RNA analysis of uncultivated microorganisms. Microbial Ecol. 35:1-21.
43. Holdeman L. V., I. J. Good, and W. E. C. Moore. 1976. Human fecal flora: Variation in bacterial
composition within individuals and a possible effect of emotional stress. Appl. Environ. Microbiol. 31:359-375.
44. Johnson J. L. 1991. Isolation and purification of nucleic acids. In: Nucleic acid techniques in bacterial
systematics,pp. 1-19. eds.E. Stackebrandt, and M. Goodfellow, Wiley, Chichester.
45. Jukes T. H., and C. R. Cantor. 1969. Evolution of protein molecules. In: Mammalian protein metabolism,
pp. 21-132. ed. H. N. Munro, Academic Press, New York.
46. Kelly J. J., L. Sappelsa, S. G. Bavykin, A. D. Mirzabekov, and D. A. Stahl. 1999. Optimization of DNA
microarrays for the rapid characterization of microbial community population structure. In: Abstracts of the 99th
general meeting of the American Society for Microbiology, pp. 470-471. American Society for Microbiology,
Washington D.C.
47. Kimura M. 1980. A simple method for estimating evolutionary rates of base substitution through
comparative studies of nucleotide sequences. J. Mol. Evol. 16:111-120.
48. Kopczynski E. D., M. M. Bateson, and D. M. Ward. 1994. Recognition of chimeric small-subunit
ribosomal DNAs composed of genes from uncultivated micro-organisms. Appl. Environ. Microbiol. 60:746-748.
49. Kowalchuk G. A., J. R. Stephen, W. de Boer, J. I. Prosser, T. M. Embley, and J. W. Woldendorp.
1997. Analysis of ammonia-oxidizing bacteria of the P subdivision of the class Proteobacteria in coastal sand
dunes by denaturing gel electrophoresis and sequencing of PCR-amplified 16S ribosomal DNA fragments.
Appl. Environ. Microbiol. 63:1489-1497.
50. Kreader C. A. 1996. Relief of amplification in PCR with bovine serum albumin or T4 gene 32 protein.
40

Appl. Environ. Microbiol. 62:1102-1106.
51. Kuritza A. P. and A. A. Salyers. 1985. Use of a species-specific DNA hybridization probe for enumeration
of Bacteroides vulgatus in human feces. Appl. Environ. Microbiol. 50:958-964.
52. Lane D. J. 1991. 16S/23S rRNA sequencing. In: Nucleic acid techniques in bacterial systematics, pp 115-
175, eds. E. Stackebrandt and M. Goodfellow. Wiley, Chichester.
53. Langendijk P. S., F. Schut, G. J. Jansen, G. C. Raangs, G. R. Camphuis, M. F. Wilkinson, and G. W.
Welling. 1995. Quantitative fluorescence in situ hybridization of Bifidobacterium spp. with genus-specific 16S
rRNA-targeted probes and its application in fecal samples. Appl. Environ. Microbiol. 61:3069-3075.
54. Lee D-H., Y-G. Zo, and S-J. Kim. 1996. Nonradioactive method to study genetic profiles of natural
bacterial communities by PCR-single-strand-conformation polymorphism. Appl. Environ.Microbiol. 62:3112-
3120.
55. Lemieux B., A. Aharoni, and M. Schena. 1998. Overview of DNA chip technology. Molecular Breeding
4:277-289.
56. Liesack W., H. Weyland, and E. Stackebrandt. 1991. Potential risks of gene amplification by PCR as
determined by 16S rDNA analysis of a mixed-culture of strict barophilic bacteria. Microbial Ecol. 21:191-198.
57. Maidak B. L., G. J. Olsen, N. Larsen, R. Overbeek, M. J. McCaughey, and C. Woese. 1997. The RDP
(Ribosomal Database Project). Nucl. Acids Res. 25:109-111.
58. Maniatis T., E. F. Fritsch, and J. Sambrook. 1989. Molecular cloning: a laboratory manual, 2nd edn. Cold
Spring Harbor Laboratory, New York.
59. Mau M. and K. N. Tim mis. 1998. Use of subtractive hybridization to design habitat-based oligonucleotide
probes for investigation of natural bacterial communities. Appl. Environ. Microbiol. 64:185-191.
60. McCartney A.L., W. Wenzhi, and G. W. Tannock. 1996. Molecular analysis of the composition of the
Bifidobacterial and Lactobacillus microflora of humans. Appl. Environ. Microbiol. 62:4608-4613.
61. McFarlane G. T and G. R. Gibson. 1994. Metabolic activities of the normal colonic microflora. In: Human
health: contribution of microorganisms, pp. 17-38, ed. S. A. W. Gibson, Springer, Frankfurt.
62. McKillip J. L., L-A. Jaykus, and M. Drake. 1998. rRNA stability in heat-killed and UV-irradiated
enterotoxigenic Staphylococcus aureus and Escherichia coli Ol 57:H7. Appl. Environ. Microbiol. 64:4264-4268.
63. Millar M. R., C. J. Linton, A. Cade, D. Glancy, M. Hall, and H. Jalal. 1996. Application of 16S rRNA
gene PCR to study bowel flora of preterm infants with and without necrotizing enterocolitis. J. Clin. Microbiol.
34:2506-2510.
64. Moore W. E. C. and L. V. Holdeman. 1974. Human fecal flora: The normal flora of 20 Japanese-
Hawaiians. Appl. Environ. Microbiol. 27:961-979.
65. Murray A. E., J. T. Hollibaugh, and C. Orrego. 1996. Phylogenetic compositions of bacterioplankton
from two California estuaries compared by denaturing gradient gel electrophoresis of 16S rDNA fragments.
Appl. Environ. Microbiol. 62:2676-2680.
66. Murray A. E. C. M. Preston, R. Massana, L. T. Taylor, A. Blakis, K. Wu, and E. F. de Long. 1998.
Seasonal and spatial variability of bacterial and archaeal assemblages in the coastal waters near Avers island,
Antarctica. Appl. Environ. Microbiol. 64:2585-2595.
67. Muyzer G. 1999. DGGE/TGGE a method for identifying genes from natural ecosystems. Curr.Opinion
Microbiol. 2:317'-322.
41

68. Muyzer G. and E. C. de Waal. 1994. Determination of the genetic diversity of microbial communities using
DGGE analysis of PCR-amplified 16S rRNA. NATO ASI Series G35:207-214.
69. Muyzer G. and K. Smalla. 1998. Application of denaturing gradient gel electrophoresis (DGGE) and
temperature gradient gel electrophoresis (TGGE) in microbial ecology. Antonie van Leeuwenhoek 73:127-141.
70. Muyzer G., E. C. de Waal, and G. A. Uitterlinden. 1993. Profiling of complex populations by
denaturating gradient gel electrophoresis analysis of polymerase chain reaction-amplified genes coding for 16S
rRNA. Appl. Environ. Microbiol. 59:695-700.
71. Myers R. M., S. G. Fischer, L. S. Lerman, and T. Maniatis. 1985. Nearly all single base substitutions in
DNA fragments joined to a GC-clamp can be detected by denaturing gradient gel electrophoresis. Nucl. Acids
Res. 13:3131-3145.
72. Myers R. M., T. Maniatis, and L. S. Lerman. 1987. Detection and localization of single base changes by
denaturing gradient gel electrophoresis. Meth. Enzymol. 155:501-527.
73. Nlibel U., B. Engelen, A. Felske, J. Snaidr, A. Wieshuber, R. I. Amann, W. Ludwig, and H. Backhaus.
1996. Sequence heterogeneities of genes encoding 16S rRNAs in Paenibacillus polymyxa detected by
temperature gradient gel electrophoresis. J. Bacterid. 178:5636-5643.
74. NObel U., F. Garcia-Pichel, and G. Muyzer. 1997. PCR primers to amplify 16S rRNA genes from
Cyanobacteria. Appl. Environ. Microbiol. 63:3327-3332.
75. NObel U., F. Garcia-Pichel, M. Kiihl, and G. Muyzer. 1999. Quantifying microbial diversity:
morphotypes, 16S rRNA genes, and carotenoids of oxygenic phototrophs in microbial mats. Appl. Environ.
Microbiol. 65:422-430.
76. Ohkuma M. and T. Kudo. 1996. Phylogenetic diversity of the intestinal bacterial community in the termite
Reticulitermis speratus. Appl. Environ. Microbiol. 62:461-468.
77. Old R. W. and S. B. Primrose. 1989. Principles of gene manipulation: an introduction to genetic
engineering, 4th edn. Blackwell, Oxford.
78. Orita M., H. Iwahana, H. Kanazawa, K. Hayashi, and T. Sekiya. 1989. Detection of polymorphisms of
human DNA by gel electrophoresis as single-strand conformation polymorphism. Proc. Natl. Acad. Sci. USA
86:2766-2770.
79. Pace N. R. 1997. A molecular view of microbial diversity and the biosphere. Science 276:734-740.
80. Pearson W. R. and D. J. Lipman. 1988. Improved tools for biological sequence comparison. Proc. Natl.
Acad. Sci. USA 85:2444-2448.
81. Poinar H. N., M. Hofreiter, W. G. Spaulding, P. S. Martin, B. A. Stankiewitz, H. Bland, R. P.
Evershed, G. Possnert, and S. Paabo. 1998. Molecular coproscopy: dung and diet of the extinct ground sloth
Nothrotheriops shastensis. Science 281:402-406.
82. Polz M. F. and C. M. Cavanough. 1998. Bias in template-to-product ratios in multitemplate PCR. Appl.
Environ. Microbiol. 64:3724-3730.
83. Priest F. and B. Austin. 1993. Modern bacterial taxonomy, 2nd edn. Chapman and Hall, London.
84. Ramfrez-Saad H. C. 1999. Molecular ecology of Frankia and other soil bacteria under natural and
chlorobenzoate-stressed conditions. PhD thesis, Wageningen University.
85. Ramirez-Saad H. C , W. M. Akkermans, and A. D. L. Akkermans. 1996. DNA extraction from
Actinorhizal nodules. In: Molecular microbial ecology manual, 1.4.4. pp 1-11. eds. A.D.L. Akkermans, J. D.
42

van Elsas and F. J. de Bruin, Kluwer, Dordrecht.
86. Reysenbach A., L. J. Giver, G. S. Wickham, and N. R. Pace. 1992. Differential amplification of rRNA
genes by polymerase chain reaction. Appl. Environ. Microbiol. 58:3417-3418.
87. Rosenbaum V. and D. Riesner. 1987. Temperature-gradient gel electrophoresis - thermodynamic analysis
of nucleic acids and proteins in purified form and in cellular extracts. Biophys. Chem. 26:235-246.
88. Saiki R.K., D. H. Gelfand, S. J. Stoffel, S.J. Scharf, R. Higuchi, G. T. Horn, K. B. , Mullis, and H. A.
Erlich. 1988. Primer-directed enzymatic amplification of DNA with thermostable DNA polymerase. Science
239:487-491.
89. Saitou R. R. and M. Nei. 1987. A neighbour-joining method: a new method for reconstructing phylogenetic
trees. Mol. Biol. Evol. 44:406-425.
90. Sanguinetti C. J., E. Dias Neto, and A. J. G. Simpson. 1994. Rapid silver staining and recovery of PCR
products separated on polyacrylamide gels. BioTechniques 17:915-919.
91. Savage D. C. 1977. Microbial ecology of the gastrointestinal tract. An. Rev. Microbiol. 31:107-133.
92. Scheinert P., R. Krausse, U. Ullmann, R. Soller, and G. Krupp. 1996. Molecular differentiation of
bacteria by PCR amplification of the 16S-23S rRNA spacer. J. Microbiol. Meth. 26:103-117.
93. Schena M., D. Shalon, R. W. Davis, and P. O. Brown. 1995. Quantitative monitoring of gene expression
patterns with a complementary DNA microarray. Science 270:467-470.
94. Schena M., D. Shalon, R. Heller, A. Chai, P. O. Brown, and R. W. Davis. 1996. Parallel human genome
analysis: microarray-based expression monitoring of 1000 genes. Proc. Natl. Acad. Sci. USA 93:10614-10619.
95. Schena M., R. A. Heller, T. P. Theriault, K. Konrad, E. Lachenmeier, and R. W. Davis. 1998.
Microarrays: biotechnology's discovery platform for functional genomics. Trends Biotechnol. 16:301-306.
96. Schwieger F. and C. C. Tebbe. 1998. A new approach to utilize PCR-single-strand-conformation
polymorphism for 16S rRNA gene-based microbial community analysis. Appl. Environ. Microbiol. 64:4870-
4876.
97. Sheffield V. C , D. R. Cox, L. S. Lerman, and R. M. Myers. 1985. Attachment of a 40-base-pair G+C rich
sequence (GC-clamp) to genomic DNA fragments by polymerase chain reaction results in improved detection of
single-base changes. Proc. Natl. Acad. Sci. USA 86:232-236.
98. Shoemaker J. S. and W. M. Fitch. 1989. Evidence from nuclear sequences that invariable sites should be
considered when sequence divergence is calculated. Mol. Biol. Evol. 6:270-289.
99. Simpson J. M., V. J. McCracken, B. A. White, H. R. Gaskins, and R. I. Mackie. 1999. Application of
denaturing gradient gel electrophoresis for the analysis of the porcine gastrointestinal microbiota. J. Microbiol.
Meth. 36:167-179.
100. Sneath P. H. A. 1989. Analysis and interpretation of sequence data for bacterial systematics: the view of a
numerical taxonomist. Syst. Appl. Microbiol. 12:15-31.
101. Sokal R. R. and C. D. Michener. 1958. A statistical method for evaluating systematic relationships.
University of Kansas Scientific Bulletin 28:1409-1438.
102. Stackebrandt E. and B. M. Goebel. 1994. Taxonomic note: a place for DNA-DNA reassociation and 16S
rRNA sequence analysis in the present species definition in bacteriology. Int. J. Syst. Bacteriol. 44:846-849.
103: Stahl D. A. and R. Amann. 1991. Development and application of nucleic acid probes. In: Nucleic acid
techniques in bacterial systematics, pp 115-175, eds. E. Stackebrandt and M. Goodfellow, Wiley, Chichester.
43

104. Stahl D., B. Flesher, H. M. Mansfield, and L. Montgomery. 1988. Use of phylogenetically based
hybridization probes for studies of ruminal microbial ecology. Appl. Environ. Microbiol. 54:1079-1084.
105. Strunk O. and W. Ludwig. 1995. ARB - a software environment for sequence data. Department of
Microbiology, Technical University of Munich, Munich, Germany, (http://www.mikro.biologie.tu-
muenchen.de/pub/ARB/documentation/arb.ps).
106. Suau A., R. Bonnet, M. Sutren, J-J. Godon, G. R. Gibson, M. D. Collins, and J. Dore. 1999. Direct
analysis of genes encoding 16S rRNA from complex communities reveals many novel molecular species within
the human gut. Appl. Environ. Microbiol. 65:4799-4807.
107. Suzuki M. T. and S. J. Giovannoni. 1996. Bias caused by template annealing in the amplification of
mixtures of 16S rRNA genes by PCR. Appl. Environ. Microbiol. 61:625-630.
108. Sykes P. J., S. H. Neoh, M. J. Brisco, E. Hughes, J. Condon, and A. A. Morley, A.A. (1992).
Quantitation of targets for PCR by use of limiting dilution. BioTechniques 13:444-449.
109. Tajima F. and M. Nei. 1984. Estimation of evolutionary distance between nucleotide sequences. Mol.
Biol. Evol. 41:269-285.
110. Teske A., C. Wawer, G. Muyzer, and N. B. Ramsing. 1996. Distribution of sulfate-reducing bacteria in a
stratified fjord (Manager Fjord, Denmark) as evaluated by most-probable-number counts and denaturating
gradient gel electrophoresis of PCR-amplified ribosomal DNA fragments. Appl. Environ. Microbiol. 62:1405-
1415.
111. Vallaeys T., E. Topp, G. Muyzer, V. Macheret, G. Laguerre, and G. Soulas. 1997. Evaluation of
denaturing gradient gel electrophoresis in the detection of 16S rDNA sequence variation in Rhizobia and
Methanotrophs. FEMS Microbiol. Ecol. 24:279-285.
112. Van de Peer Y. and R. de Wachter. 1995. Investigation of fungal phylogeny on the basis of small
ribosomal subunit RNA sequences. In: Molecular microbial ecology manual, 3.3.4. pp. 1-12, eds. A. D. L.
Akkermans, J. D. van Elsas, and F. D. de Bruijn, Kluwer, Dordrecht,
113. Wagner R. 1994. The regulation of ribosomal RNA synthesis and bacterial cell growth. Arch. Microbiol.
161:100-106.
114. Wang G. C. Y. and Y. Wang. 1996. The frequency of chimeric molecules as a concequence of PCR co-
amplification of 16S rRNA genes from different bacterial species. Microbiol. 142:1107-1114.
115. Wang A. M. M. V. Doyle, and D. F. Mark. 1989. Quantification of mRNA by the polymerase chain
reaction. Proc. Natl. Acad. Sci. USA 86:9717-9721.
116. Wang R-F., W-W. Cao, and C. E. Cerniglia. 1996. PCR detection of predominant anaerobic bacteria in
human and animal fecal samples. Appl. Environ. Microbiol. 62:1242-1247.
117. Wang R-F., W-W Cao, and C. E. Cerniglia. 1996. Phylogenetic analysis of Fusobacterium prausnitzii
based upon the 16S rRNA gene sequence and PCR confirmation. Int. J. Syst. Bacteriol. 6:341-343.
118. Wawer C , M. S. M. Jetten, and G. Muyzer, G. 1997. Genetic diversity and expression of the [NiFe]
hydrogenase large subunit gene of Desulfovibrio spp. in environmental samples. Appl. Environ. Microbiol.
63:4360-4369.
119. Wayne L. G., D. J. Brenner, R. R. Colwell, P. A. D. Grimont, O. Kandler, M. I. Krichevski, L. H.
Moore, W. E. C. Moore, R. G. E. Murray, E. Stackebrandt, M. P. Starr, and H. G. Triiper. 1987. Report of
the ad hoc committee on reconciliation of approaches to bacterial systematics. Int. J. Syst. Bacteriol. 37:463-464.
44

120. Whitford M. F., R. J. Forster, C. E. Beard, J. Gong, and R. M. Teather. 1998. Phylogenetic analysis of
rumen bacteria by comparative sequence analysis of cloned 16S rRNA genes. Anaerobe 4:153-163.
121. Wilson K. H. and R. H. Blitchington. 1996. Human colonic biota studied by ribosomal DNA sequence
analysis. Appl. Environ. Microbiol. 62:2273-2278.
122. Wintzingrode F. v., U. B. Gobel, and E. Stackebrandt. 1997. Determination of microbial diversity in
environmental samples: pitfalls of PCR-based rRNA analysis. FEMS Microbiol. Rev. 21:213-229.
123. Woese C. R. 1987. Bacterial evolution. Microbiol. Rev. 51:221-271.
124. Woese C. R., O. Kandler, and M. L. Wheelis. 1990. A definition of the domains Archaea, Bacteria, and
Eucarya in terms of small subunit ribosomal characteristics. Syst. Appl. Microbiol. 14:305-310.
125. Wolters D. J. 1998. Ineffective Frankia in wet alder soils. PhD Thesis, University of Groningen.
126. Yershov G., V. Barsky, A. Belgovskiy, E. Kirillov, E. Kreidlin, I. Ivanov, S. Parinov, D. Guschin, A.
Drobishev, S. Dubiley, and A. Mirzabekov. 1996. DNA analysis and diagnostics on oligonucleotide
microchips. Proc. Natl. Acad. Sci. USA 93:4913-4918.
127. Yoshino K., K. Nishigaki, and Y. Husimi. 1991. Temperature sweep gel electrophoresis: a simple method
to detect point mutations. Nucl. Acids Res. 19:3153.
128. Zoetendal E. G., A. D. L. Akkermans, and W. M. de Vos. 1998. Temperature gradient gel
electrophoresis analysis from human fecal samples reveals stable and host-specific communities of active
bacteria. Appl. Environ. Microbiol. 64:3854-3859.
45

Chapter 3
Temperature Gradient Gel Electrophoresis Analysis of 16S rRNA
from Human Fecal Samples Reveals Stable and Host-Specific
Communities of Active Bacteria
Erwin G. Zoetendal, Antoon D. L. Akkermans, and Willem M. de Vos
Applied and Environmental Microbiology 64: 3854-3859 (1998)
Reprinted with permission of the American Society of Microbiology
47

Abstract
The diversity of the predominant bacteria in the human gastrointestinal tract was
studied by using 16S rRNA-based approaches. PCR amplicons of the V6 to V8 regions
of fecal 16S rRNA and ribosomal DNA (rDNA) were analyzed by temperature gradient
gel electrophoresis (TGGE). TGGE of fecal 16S rDNA amplicons from 16 individuals
showed different profiles, with some bands in common. Fecal samples from two
individuals were monitored over time and showed remarkably stable profiles over a
period of at least 6 months. TGGE profiles derived from 16S rRNA and rDNA
amplicons showed similar banding patterns. However, the intensities of bands with
similar mobilities differed in some cases, indicating a different contribution to the total
active fraction of the prominent fecal bacteria. Most 16S rRNA amplicons in the TGGE
pattern of one subject were identified by cloning and sequence analysis. Forty-five of the
78 clones matched 15 bands, and 33 clones did not match any visible band in the TGGE
pattern. Nested PCR of amplified 16S rDNA indicated preferential amplification of a
sequence corresponding to 12 of the 33 non-matching clones with similar mobilities in
TGGE. The sequences matching 15 bands in the TGGE pattern showed 91.5 to 98.7%
similarity to sequences derived from different Clostridium clusters. Most of these were
related to strains derived from the human intestine. The results indicate that the
combination of cloning and TGGE analysis of 16S rDNA amplicons is a reliable
approach to monitoring different microbial communities in feces.
48

INTRODUCTION
The human gastrointestinal tract harbors a diverse community of microorganisms which
include a large number of mainly anaerobic bacteria. These have largely been studied by plate
count analysis of fecal samples, which usually contain 10' to lO11 CFU per g (9, 13, 29). One
of the limitations in using conventional microbiological methods is that only easily cultivable
organisms are counted. Bacteria which have obligate interactions with the host or other
microorganisms, or which require unknown growth conditions, will not be selected this way.
Estimates of culturability of bacteria in the gastrointestinal tract vary from 10 to 50% (16, 20,
38). Other limitations of cultivation include the selectivity of the medium used, the stress
imposed by cultivation procedures, and the necessity of strictly anoxic conditions. As a
consequence, insight into the interaction between the host and the microbial community, and
into the influence of environmental factors on microbial composition, is still lacking.
This decade has shown an explosive development in the application of molecular
techniques based on 16S and 23 S rRNA to the study of microbial diversity in ecosystems
(reviewed in references 1 and 32). So far, the rRNA approach has been used only incidentally
to study human intestinal microbial ecology, and only specific groups of bacteria, such as
Bifidobacterium and Lactobacillus, have been studied (16, 19). In addition, PCR has been
used to quantify specific groups of bacteria in human feces (35), and random cloning
approaches have been used to analyze the microbial diversity of feces from one individual
(38). Although these studies report significant information on specific bacteria and specific
individuals, the approaches are time-consuming, expensive, and unsuitable for characterizing
complex microbial communities. Methods such as denaturing gradient gel electrophoresis
(10) or temperature gradient gel electrophoresis (TGGE) (28) have been developed to analyze
microbial communities rapidly, based on sequence specific separation of 16S rDNA
amplicons (8, 22).
The aim of the present study was to use molecular approaches to describe the bacterial
diversity in human fecal samples and to investigate to what extent this diversity is affected by
the host. We analyzed PCR-amplified V6 to V8 regions of 16S rRNA (23) by TGGE to
describe the diversity of the predominant bacteria in fecal samples. Since the ratio of 16S
ribosomal DNA (rDNA) and rRNA is dependent on cellular activity (33), we compared
TGGE patterns derived from 16S rRNA and rDNA amplicons. Finally, to gain insight into the
phylogenetic positions of the most prominent bacteria, we prepared a 16S rDNA clone library
49

and sequenced clones corresponding to dominant bands in the TGGE pattern of a single
individual.
MATERIALS AND METHODS
Experimental approach. To describe the bacterial diversity in the human gastrointestinal tract, we used a
molecular approach based on the sequence variability of the 16S rRNA gene (Fig. 1). RNA and DNA were
simultaneously isolated from fecal samples and were used as templates for amplification by reverse transcriptase
PCR (RT-PCR) and regular PCR, respectively, of fragments of the 16S rRNA gene. Amplicons of the V6 to V8
regions were analyzed by TGGE. Migration distances from different gels were compared by using a marker
which consisted of amplified V6 to V8 regions from nine clones with different mobilities. Additionally, a clone
library of 16S rDNA amplicons (Escherichia co//positions 8 to 1510) from a fecal sample of one individual was
prepared. The mobilities of cloned amplicons were screened by TGGE, and those corresponding to specific
bands in the RNA-derived profile were sequenced.
* DNA
* PCR
968 -1401
I TGGE
¥ PCR > 8-1510
Fecal sample
i
* Cloning ; PCR 968-1401
I i Sequence TGGE
> f rRNA
4 PCR
968-1401
> ' TGGE
Fig. 1. Outline of the molecular approaches used to analyze the fecal bacterial communities. (RT-)PCR 968-
1401 represents the (RT-)PCR with primers U968-GC and L1401, which amplify the V6 to V8 regions. PCR 8-
1510 represents the PCR with primers 8f and 151 Or, which amplify the complete 16S rDNA.
Recovery, preparation, and storage of fecal samples. Fresh fecal samples were collected from 16 unrelated
individuals (A to P) from different geographical locations within The Netherlands and Finland, differing in
dietary preferences, age (25 to 78 years), and sex (7 men and 9 women). Four fecal samples from individual A
(male; 25 years old) were taken within a 6-month period at 2-month intervals, and two samples from individual
B (female; 43 years old) were taken within a 7-month period. Three grams (wet weight) of fecal samples was
homogenized in 50 ml of ice-cold 0.05 M potassium phosphate buffer (pH 7.0), and aliquots of 1 ml were stored
at -20°C.
50
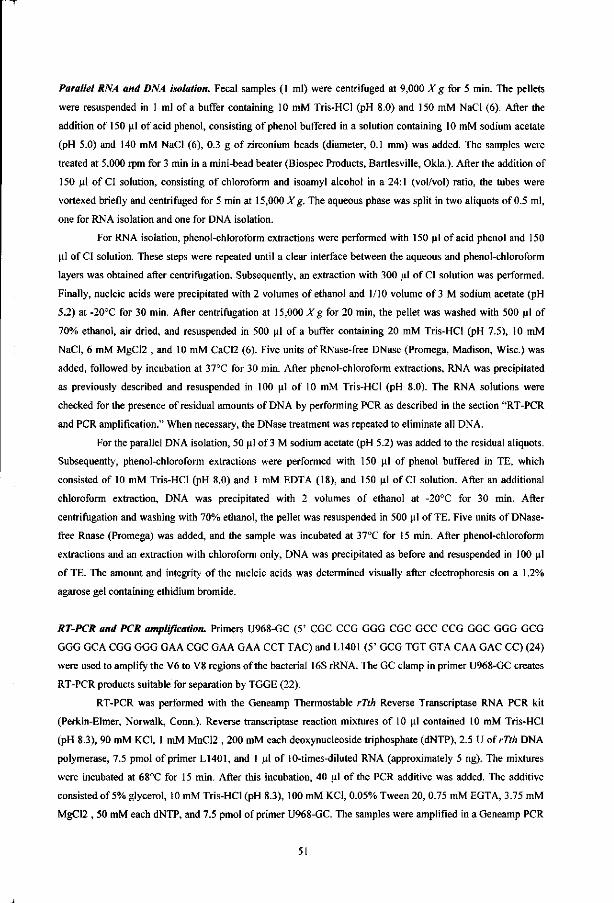
Parallel RNA and DNA isolation. Fecal samples (1 ml) were centrifuged at 9,000 X g for 5 min. The pellets
were resuspended in 1 ml of a buffer containing 10 mM Tris-HCl (pH 8.0) and 150 mM NaCl (6). After the
addition of 150 ul of acid phenol, consisting of phenol buffered in a solution containing 10 mM sodium acetate
(pH 5.0) and 140 mM NaCl (6), 0.3 g of zirconium beads (diameter, 0.1 mm) was added. The samples were
treated at 5,000 rpm for 3 min in a mini-bead beater (Biospec Products, Bartlesville, Okla.). After the addition of
150 ul of CI solution, consisting of chloroform and isoamyl alcohol in a 24:1 (vol/vol) ratio, the tubes were
vortexed briefly and centrifuged for 5 min at 15,000 X g. The aqueous phase was split in two aliquots of 0.5 ml,
one for RNA isolation and one for DNA isolation.
For RNA isolation, phenol-chloroform extractions were performed with 150 ul of acid phenol and 150
ul of CI solution. These steps were repeated until a clear interface between the aqueous and phenol-chloroform
layers was obtained after centrifugation. Subsequently, an extraction with 300 fxl of CI solution was performed.
Finally, nucleic acids were precipitated with 2 volumes of ethanol and 1/10 volume of 3 M sodium acetate (pH
5.2) at -20°C for 30 min. After centrifugation at 15,000 Xg for 20 min, the pellet was washed with 500 ul of
70% ethanol, air dried, and resuspended in 500 ul of a buffer containing 20 mM Tris-HCl (pH 7.5), 10 mM
NaCl, 6 mM MgC12 , and 10 mM CaC12 (6). Five units of RNase-free DNase (Promega, Madison, Wise.) was
added, followed by incubation at 37°C for 30 min. After phenol-chloroform extractions, RNA was precipitated
as previously described and resuspended in 100 ul of 10 mM Tris-HCl (pH 8.0). The RNA solutions were
checked for the presence of residual amounts of DNA by performing PCR as described in the section "RT-PCR
and PCR amplification." When necessary, the DNase treatment was repeated to eliminate all DNA.
For the parallel DNA isolation, 50 ul of 3 M sodium acetate (pH 5.2) was added to the residual aliquots.
Subsequently, phenol-chloroform extractions were performed with 150 ul of phenol buffered in TE, which
consisted of 10 mM Tris-HCl (pH 8.0) and 1 mM EDTA (18), and 150 ul of CI solution. After an additional
chloroform extraction, DNA was precipitated with 2 volumes of ethanol at -20°C for 30 min. After
centrifugation and washing with 70% ethanol, the pellet was resuspended in 500 ul of TE. Five units of DNase-
free Rnase (Promega) was added, and the sample was incubated at 37°C for 15 min. After phenol-chloroform
extractions and an extraction with chloroform only, DNA was precipitated as before and resuspended in 100 ul
of TE. The amount and integrity of the nucleic acids was determined visually after electrophoresis on a 1.2%
agarose gel containing ethidium bromide.
RT-PCR and PCR amplification. Primers U968-GC (5' CGC CCG GGG CGC GCC CCG GGC GGG GCG
GGG GCA CGG GGG GAA CGC GAA GAA CCT TAC) and L1401 (5' GCG TGT GTA CAA GAC CC) (24)
were used to amplify the V6 to V8 regions of the bacterial 16S rRNA. The GC clamp in primer U968-GC creates
RT-PCR products suitable for separation by TGGE (22).
RT-PCR was performed with the Geneamp Thermostable rTth Reverse Transcriptase RNA PCR kit
(Perkin-Elmer, Norwalk, Conn.). Reverse transcriptase reaction mixtures of 10 ul contained 10 mM Tris-HCl
(pH 8.3), 90 mM KC1, 1 mM MnC12 , 200 mM each deoxynucleoside triphosphate (dNTP), 2.5 U of rTth DNA
polymerase, 7.5 pmol of primer L1401, and 1 ul of 10-times-diluted RNA (approximately 5 ng). The mixtures
were incubated at 68°C for 15 min. After this incubation, 40 ul of the PCR additive was added. The additive
consisted of 5% glycerol, 10 mM Tris-HCl (pH 8.3), 100 mM KC1, 0.05% Tween 20, 0.75 mM EGTA, 3.75 mM
MgC12 , 50 mM each dNTP, and 7.5 pmol of primer U968-GC. The samples were amplified in a Geneamp PCR
51

system 2400 (Perkin-Elmer) by using the following program: 94°C for 1 min; 30 cycles of 94°C for 30 s, 56°C
for 30 s, and 68°C for 1 min; and finally, 68°C for 7 min. Aliquots of 5 ul were analyzed by electrophoresis on a
1.2% (wt/vol) agarose gel containing ethidium bromide to check the sizes and amounts of the amplicons.
PCR was performed with the Taq DNA polymerase kit from Life Technologies (Gaithersburg, Md.).
PCR mixtures of 50 ul contained 20 mM Tris-HCI (pH 8.4), 50 mM KC1, 3 mM MgC12 , 50 mM each dNTP,
1.25 U of Taq polymerase, 5 pmol of the primers LI401 and U968-GC, and 1 ul of 10-times-diluted DNA
(approximately 1 ng). Amplification and analysis by agarose gel electrophoresis were performed as described
above for the RT-PCR, with the exception that the first incubation at 94°C was performed for 3 min instead of 1
min.
Cloning of the PCR-amplified products. PCR was performed with primers 8f [5' CAC GGA TCC AGA GTT
TGA T(C/T)(A/C) TGG CTC AG] and 1510r [5' GTG AAG CTT ACG G(C/T)T ACC TTG TTA CGA CTT]
(15) by using the Taq DNA polymerase kit from Life Technologies to amplify the bacterial 16S rDNA. PCR was
performed under the following conditions: 94°C for 3 min; 30 cycles of 94°C for 30 s, 52°C for 30 s, and 68°C
for 1.5 min; and finally 68°C for 7 min. The PCR products were purified with the Qiaquick PCR purification kit
(Qiagen, Hilden, Germany) according to the manufacturer's instructions. Purified PCR products were quantified
by electrophoresis on a 1.2% (wt/vol) agarose gel with a DNA solution of known concentration as the
concentration standard and were cloned in E. coli JMI09 by using the Promega pGEM-T vector system.
Colonies of ampicillin-resistant transformants were transferred with a sterile toothpick to 50 ul of TE and were
boiled for 15 min to lyse the cells. Subsequently, PCR was performed with pGEM-T-specific primers T7 (5'
AAT ACG ACT CAC TAT AGG) and SP6 (5' ATT TAG GTG AC A CTA TAG) to check the size of the inserts
by using the cell lysates as the template. The plasmids containing inserts of approximately 1.6 kb in the cell
lysates were used to amplify the V6 to V8 regions. The amplified V6 to V8 regions were compared to the rRNA-
derived TGGE profile from the same fecal sample. Plasmids containing an insert of a clone corresponding to a
dominant band were purified by the Wizard Plus miniprep DNA purification system (Promega) and were used
for sequence analysis.
TGGE analysis of PCR amplicons. The Diagen (Dilsseldorf, Germany) TGGE system was used for sequence-
specific separation of RT-PCR products. Electrophoresis was performed in a 0.8-mm polyacrylamide gel (6%
[wt/vol] acrylamide, 0.1% bisacrylamide, 8 M urea, 20% [vol/vol] formamide, 2% [vol/vol] glycerol) with 40
mM Tris-acetate (pH 8.0) as the electrophoresis buffer at a fixed voltage of 120 V (69 mA) for 18 h. A gradient
from 36 to 45°C was applied parallel to the electrophoresis running direction. After the completion of
electrophoresis, the gel was stained with AgN03 and developed (3).
Sequence analysis. Purified plasmid DNA (1 ul) was used for sequence analysis of the cloned 16S rDNA by
using the Sequenase (T7) sequencing kit (Amersham, Slough, United Kingdom) according to the manufacturer's
instructions with Infrared Dye 41 (MWG-Biotech, Ebersberg, Germany)-labeled primers 515r (5' ACC GCG
GCT GCT GGC AC) (15), 338f (5' ACT CCT ACG GGA GGC AGC), and 968f (5' AAC GCG AAG AAC
CTT AC) (24) as sequencing primers. The sequences were automatically analyzed on a LI-COR (Lincoln, Nebr.)
DNA sequencer 4000L and corrected manually. The fraction of unidentified bases was 1% or less. The
52

sequences were checked for reading errors with the alignment programs of the ARB package, which are based
on secondary structures of rRNA (31). Homology searches of the ARB, EMBL, and GenBank DNA databases
for these partial sequences were performed with FASTA (25), and the homologies were checked with the ARB
programs. The complete 16S rDNA sequences were checked for chimerical constructs by using the CHECK-
CHIMERA program of the Ribosomal Database Project (17) and the ARB software package.
Nucleotide sequence accession numbers. The sequences of the fecal rDNA clones were deposited in the
GenBank database. The new sequences from subject A (with their accession numbers in parentheses) are A03
(AF052408), A07 (AF052409), A09 (AF052410), A10 (AF052411), All (AF052412), A12 (AF052413), A13
(AF052414), A14 (AF052415), A19 (AF052416), A20 (AF052417), A21 (AF052418), A22 (AF052419), A27
(AF052420), A54 (AF052421), A57 (AF052422), and A71 (AF052423).
RESULTS
Nucleic acid extraction and reproducibility of TGGE patterns. Nucleic acids were extracted
from the fecal samples by a mechanical procedure which has been shown to be effective in
disrupting bacterial cells from a variety of ecosystems (6, 11, 26, 38). To optimize the
efficiency of the nucleic acid extraction, the effect of increased bead-beating time on the
concentration of the nucleic acids, as well as on their integrity and competence to generate a
reproducible TGGE pattern, was determined. With 1 to 5 min of bead beating, no effect on the
amount of nucleic acids extracted or on their integrity, as analyzed by agarose gel
electrophoresis (data not shown), was observed. No nucleic acids were detected in the
samples that had not been subjected to the bead-beating procedure or in the supernatant of the
potassium phosphate buffer used to homogenize the fecal samples, indicating that lysis was
limited. The TGGE patterns of the rRNA-based amplicons of fecal samples tested remained
constant after increased bead-beating time (data not shown). However, in the rDNA-derived
pattern of subject A, a new amplicon appeared only after 3 min of bead beating, suggesting
the presence of a bacterium which was difficult to lyse (Fig. 2). Since further treatment did
not affect the TGGE profiles, 3 min of bead beating was used in further experiments.
The effect of template concentration on the TGGE profile was studied by amplifying fecal
rRNA and rDNA at different concentrations. Dilution to approximately 10 pg of DNA/^l or 1
pg of RNA/ul did not affect the TGGE profiles. However, further dilutions resulted in the
disappearance of faint bands (data not shown). This indicated that the TGGE profiles were
derived from 16S rRNA and 16S rDNA that were present in abundance, suggesting that they
reflect the most prominent bacteria.
53
To determine the detection limits of the methods used, the amplified V6 to V8 regions
of a cloned 16S rRNA gene were added at different concentrations to fecal V6 to V8
amplicons before TGGE analysis. Band intensities of the diluted amplicons from the clone
and the fecal amplicons were compared (data not shown). This competitive-PCR approach
indicated that the difference between concentrations of amplicons resulting in a dominant or a
faint band was maximally 1 order of magnitude, indicating that only 90 to 99% of the
amplicons can be visualized by TGGE.
• • M h -«
' ' * • > !
• • * • •--* #a| i | k ^
Fig. 2. Optimization of nucleic acid extraction. Lanes 1 to 5 show the TGGE patterns of amplified V6 to V8
regions of DNA extracted after 1, 2, 3, 4, and 5 min of bead beating, respectively. The arrowhead points to the
dominant band in the pattern, which appeared after at least 3 min of bead beating.
The possibility of preferential amplification (27) was checked by analyzing TGGE
profiles of PCR products generated after different numbers of cycles of amplification.
Amplicons obtained after 25 cycles or fewer had to be concentrated. No difference was
observed in the TGGE patterns of amplicons obtained after 20, 25, 30, and 35 cycles of
amplification. The dominant bands of these patterns were also present in the TGGE profiles of
amplicons obtained after 10 cycles, which contained large amounts of single-stranded DNA,
54

preventing further detailed comparison (data not shown). Since the extent of the amplification
had no apparent effect on the TGGE pattern of the amplicons, we used 30 cycles of
amplification in further experiments. The TGGE pattern obtained in this way shows a mixture
of dominant and faint bands that were separated when the applied temperature gradient was
used (Fig. 2). Careful analysis of this TGGE pattern and others revealed the presence of more
than 30 prominent amplicons of different mobilities (Fig. 2).
Comparison between RNA- and DNA-derived TGGE profiles. TGGE profiles derived from
fecal RNA and DNA amplicons were compared in order to determine the expression levels of
the 16S rRNA genes of the most prominent bacteria, which may reflect their contributions to
total activity (Fig. 3). The TGGE patterns derived from RNA and DNA from the same fecal
sample were highly similar. However, some bands were more prominent in the RNA-derived
profile than in the DNA-derived profile in both subjects, indicating that these bacteria could
be very active metabolically. In contrast, few bands in the rRNA-derived pattern were faint,
while bands at this position in the DNA-derived pattern were more prominent in both
subjects. Such bands probably represent predominant bacteria in the feces that became
inactive at the end of the large intestine.
A B PCR RT-PCR PCR RT-PCR
te4 H
j. U R U u 4 M i - l M |rl1 : 4
i i j i 1 • • • » • ' *
2
* f _ . . . . . - *
« W H « < | 1 2
3» 03
Fig. 3. Comparison between TGGE patterns of PCR and RT-PCR products of the V6 to V8 regions from
simultaneous rRNA and DNA isolations of fecal samples from individuals A and B (two replicates each). Solid
arrowheads indicate bands with higher intensities in DNA- than in RNA-derived patterns. Open arrowheads
indicate bands of higher intensities in RNA- than in DNA-derived patterns. Numbers 1 to 3 represent dominant
bands found in all TGGE profiles.
55

Host-dependent TGGE patterns. TGGE analysis of PCR products of fecal samples from 14
individuals (Fig. 4) was performed, and their TGGE profiles were compared to those of PCR
products from individuals A and B (Fig. 3). Remarkable differences in individual banding
patterns were observed. Differences were found in both the positions of specific bands and the
number of bands (up to 38 in the profile of subject profile C). While most prominent bands
were found at different positions, some distinct bands were observed in all fecal samples
(indicated in Fig. 3 and 4). This indicates that each individual harbors a specific bacterial
community in the intestine but that a few dominant bacterial species may be present in many
individuals.
C D E F G H I J K L M N O P
,B,iM-l=! I ftKI Mm M
*"• M m* fm trite •—•
Fig. 4. TGGE of PCR products of the V6 to V8 regions of fecal samples from individuals C to Q (from Finland).
Numbers 1 to 3 represent dominant bands found in all TGGE profiles.
Stability of TGGE patterns over time. Since the observed differences in banding patterns
could also be influenced by temporal variation, the fecal samples of two healthy individuals,
A and B, were monitored over time (Fig. 5). Four samples from individual A were taken
within a period of 6 months. The two fecal samples from individual B were taken within a
period of 7 months. In both individuals, the RNA-derived banding patterns were highly
constant over a period of approximately half a year. Only some slight differences in the
56

intensities of the bands were observed in both individuals. Similar results were found in the
DNA-derived patterns (data not shown). This indicates that the dominant microbial
composition remains quite constant over time for these healthy individuals.
Fig. 5. (A) TGGE of RT-PCR products of the V6 to V8 regions of four fecal samples from individual A taken at
different times during a period of 6 months. (B) TGGE of RT-PCR products of the V6 to V8 regions of two fecal
samples from individual B taken after 0 and 7 months.
Phylogenetic analysis of dominant bands in a TGGE pattern. To gain insight into the
phylogenetic positions of the predominant bacteria, 16S rDNA from fecal samples of
individual A was amplified and cloned into E. coli JM109 by using pGEM-T. The V6 to V8
regions of the 16S rDNA of the cell lysates of 78 transformants were amplified, and their
mobilities after TGGE were compared to the rRNA-derived pattern of individual A (Fig. 1).
In this way, 45 clones were each assigned to 1 of the 15 prominent bands in the TGGE
pattern, while 33 did not match any of the detectable bands (Fig. 6). Twelve of the 33 clones
which did not match any band in the pattern showed similar mobilities during TGGE. The
sequence showed the highest similarity (98.9%) to an unidentified rumen bacterium
(GenBank accession no. AF018503) (37). The next closest relative was Prevotella veroralis
(89.9%). Nested amplification of the V6 to V8 regions of the 16S rDNA amplicons showed
the appearance of this band in the pattern (data not shown), indicating a preferential
amplification of this sequence in the first PCR amplification.
57

For identification of the prominent bands in the rRNA-derived TGGE pattern, the
plasmid DNA from the corresponding clone was purified and the nucleotide sequence of the
16S rDNA insert was determined and compared to the 16S rRNA databases. Among the
sequences of the 15 prominent amplicons, only 2 showed more than 97% similarity (Fig. 6).
This indicates that the majority of the sequences were derived from new, as yet undescribed
bacterial species. The phylogenetic positions of these 15 sequences were located in different
Clostridium clusters of the low-G+C gram-positive species (4).
Since their partial sequences showed low similarities to the sequences of the closest
relatives in the databases, seven clones were completely sequenced, analyzed, and checked for
chimerical constructs. The percentages of identity to the closest relatives were similar to those
of the partial sequences.
Clone ID Closest Relative Identity (%) Number of Clones in Library Sequence Analysis
/A22 Roseburia cecicola 94.1 1 P - ^^A57 Ruminococcus obeum 92.2 2 C
/ A 7 1 Eubacterium formicigenerans 92.3 3 C - ^ / A l l # Butyrivibrio fibrisolvens 92.0 3 C -j/--A19 Coprococcus eutactus 95.3 2 C
-A10 Fusobacterium prausnitzii 94.7 9 P ~~-~ A13# Eubacterium rectale 97.8 3 P ^^-A12 Ruminococcus productus 93.1 2 P
, . _—-A14 Ruminococcus obeum 94.1 1 P ' ~~--A20 Ruminococcus obeum 93.1 6 P
A03 Fusobacterium prausnitzii 91.5 7 C 2
* * A54 Clostridium celerecrescens 93.1 2 C ~~A21 Clostridium celerecrescens 92.7 1 C
A27 Eubacterium plautii 96.8 1 P
3 ; A07 Eubacterium halii 98.7 2 P
45 15
Fig. 6. Identification of dominant bands in the RT-PCR pattern of the V6 to V8 regions of fecal samples from
individual A. Listed are the closest relatives of the clones corresponding to the bands, their percent identity, the
number of corresponding clones, and the sequence analysis. #, the VI to V3 regions of two clones with identical
mobility have been sequenced. P, partial 16S rDNA sequence; C, complete sequence. Amplicons encoded with
1,2, and 3 were found in the TGGE patterns of all subjects.
In order to estimate whether bands in the TGGE profiles originated from one or more
sequences, pairs of 16S rDNA clones which gave identical TGGE band positions in the V6 to
V8 regions were further sequenced. Three pairs of clones were analyzed in this way. Two
pairs corresponded to two bands in the TGGE profile of subject A (Fig. 6), and one pair
58

corresponded to the band which originated from the preferentially amplified sequence. Each
pair of clones showed more than 99.5% identity in the VI to V3 regions, indicating that each
band harbors only one type of sequence.
DISCUSSION
In this study we have shown that TGGE analysis of the V6 to V8 amplicons of fecal 16S
rRNA and rDNA is a powerful tool for analysis of complex microbial communities in fecal
samples. TGGE patterns were unique for each individual. Since no major changes in banding
patterns were found during amplification or dilution of the template, the differences in the
patterns must reflect the differences in fecal composition among individuals. The results
indicate that each individual has his or her own personal and unique microbial community,
extending previous work based on the composition of Lactobacillus spp. and Bifidobacterium
spp. (19) in selective plate counts (9, 13, 19, 29).
RT-PCR products and PCR products from the same fecal sample were very similar.
Because eubacterial primers which show very limited efficiency in the amplification of
Archaea and Eucarya have been used, the TGGE pattern reflects the predominant bacteria in
fecal samples. The differences between intensities of specific bands in the 16S rDNA- and
16S rRNA-derived patterns are most probably due to differences in the activities of different
groups of bacteria. The amount of rRNA per cell is dependent on the type of species and the
physiological condition of the cell. In addition, differences in the copy number of the rRNA
operon per species (2) also play a role in differences in intensity. Some bacteria which have
reached high numbers in the intestine could have been inactivated by losing contact with the
mucosa or by exposure to oxygen during the collection of the fecal samples.
In comparisons of the TGGE profiles of fecal samples with those of clones, it
appeared that 42% of the clones did not match any band in the TGGE profile. Twelve clones
with similar mobilities during TGGE did not correspond to any dominant band in the rRNA-
and rDNA-derived profiles of individual A. The partial sequence showed the highest
homology with an unidentified rumen bacterium and was grouped in the Prevotella cluster.
However, this amplicon was found in the DNA-derived pattern after nested amplification of
the V6 to V8 regions of amplified 16S rDNA. This result supports the existence of PCR and
cloning biases as reported previously (27, 32, 34, 38). Another reason for the difference
between the results of cloning and TGGE analysis was described by Felske et al. (7). Analysis
59

of a PCR amplicon by TGGE visualizes only the dominant fraction of the population, while a
cloning approach randomly selects 16S rDNA amplicons. As a consequence, hundreds of
bacteria which represent a numerically important part of the total community do not form
visible bands in the TGGE profiles, although some of them will be selected by cloning.
The 15 clones corresponding to dominant bands in the TGGE patterns of individual A
showed the highest homology with sequences derived from different Clostridium clusters (4).
Only two partial 16S rDNA sequences showed more than 97% identity to a sequence in the
databases. The other complete and partial 16S rDNA sequences did not match any of the
sequences found in the ARB, GenBank, and EMBL databases. Furthermore, their similarities
were below the 97% threshold for being considered the same species (30), and they could
therefore be considered to be derived from new bacterial species. The identity values of
clones corresponding to Coprococcus eutactus could be underestimated, since the sequence of
this species in the databases contains a large number of unidentified nucleotides.
Two complete sequences corresponding to two bands in the TGGE pattern showed the
highest homology with Clostridium celerecrescens. These sequences showed 97.5% identity
and differed by at least 9 bases in the V6 to V8 regions. This explains the different locations
of these clones in the TGGE profiles. Ruminococcus obeum-like and Fusobacterium
prausnitzii-like amplicons were also found several times among the most prominent bacteria.
Previously, similar observations have been reported for closely related Bacillus benzoevorans-
like sequences in Drentse A grassland soils (8). These observations could be due to 16S
rDNA sequence heterogeneity of bacterial strains (24). However, one of the three R. obeum-
like sequences derived from a species which was difficult to lyse, indicating the presence of at
least two different types of/?. obeum-\\ke species.
Sequences derived from R. obeum showed high-intensity bands in both rRNA- and
rDNA-derived patterns in individual A, and they could therefore be considered numerically
important in composition and in the total activity. The genera Ruminococcus and
Coprococcus are anaerobic cocci, and members of this group, especially Ruminococcus and
Peptostreptococcus, have been found numerically important in fecal samples (9, 21).
Clones corresponding to two dominant bands showed the highest homology with a F.
prausnitzii sequence described previously (36). It was reported that this sequence was not
clustering in the Fusobacterium group and that this strain was one of the most common
species in human feces, based on PCR quantitation (35, 36). F. prausnitzii, and also
Roseburia cecicola and Butyrivibrio fibrisolvens, are known to be gram-negative species but
60

are phylogenetically related to low-G+C gram-positive species in the Clostridium group
described by Collins et al. (4).
The other clones traced in the TGGE profiles showed the highest homology to
Eubacterium spp. and Ruminococcus productus (also known as Peptostreptococcus
productus) (5). Eubacterium plautii was found as an endosymbiont of Entamoeba histolytica
(12). The other eubacteria have been found previously in human fecal samples (9, 21).
All individual-specific patterns had some bands in common. Sequences corresponding
to these bands were found in the clone library and showed the highest homologies to R.
obeum, Eubacterium hallii, and F. prausnitzii. This indicates that these bacteria have an
important function at the end of the gastrointestinal tract in all individuals. Eubacteria and
ruminococci are known to have a fermentative metabolism, while fusobacteria in general have
a weakly fermentative metabolism (14).
Surprisingly, Bacteroides spp. were not found in the TGGE profile of subject A. Since
we used bacterial primers, we did not select to the benefit of Bacteroides spp. The TGGE
profile represents only 90 to 99% of the total bacterial community. This means that bacteria
which reach levels of 109 cells or fewer (this number is not unusual for Bacteroides spp.) per
g of feces will not be visualized on TGGE, assuming that 1 g of feces contains 10" cells.
Overall, it can be concluded that the results support the hypothesis that each healthy
person has his or her own unique fecal flora and that the dominant active flora is stable over
time. Since the individuals were unrelated, were of different ages, and had different dietary
preferences, the reasons for this uniqueness are likely to be found in host factors. The
conclusions are based on an approach which could be biased by irregular cell lysis and primer
specificity, which are general drawbacks of molecular microbial ecology. Even though the
quality and reproducibility of the extraction of nucleic acids and their amplification have been
investigated, the possibility that some important, hitherto unknown bacteria were missed
cannot be excluded. The approach reported here can be useful in studying the effects of
certain diets, food components, probiotics, prebiotics, and antibiotics, as well as the genetic
background of the host, on the stability and composition of the dominant microbial
community.

ACKNOWLEDGMENTS
This study was partly supported by VTT Biotechnology and Food Research (Helsinki,
Finland). We thank all individuals who provided the fecal samples for this study. In
particular, we thank Arte von Wright and Minna Alander from VTT Biotechnology and Food
Research for sending us the fecal samples from the Finnish individuals.
REFERENCES
1. Amann R. I., W. Ludvvig, and K-H. Schleifer. 1995. Phylogenetic identification and in situ detection of
individual microbial cells without cultivation. Microbiol. Rev. 59:143-169.
2. Bentley R. W., and J. A. Leigh. 1995. Determination of 16S ribosomal RNA gene copy number in
Streptococcus uberis, S. agalactia^, S. dysgalactiae and S. parauberis. FEMS Immunol. Med. Microbiol. 12:1
8.
3. Cairns M. J., and V. Murray. 1994. Rapid silver staining and recovery of PCR products separated on
polyacrylamide gels. BioTechniques 17:915-919.
4. Collins M. D., P. A. Lawson, A. Willems, J. J. Cordoba, J. Fernandez-Garayzabal, P. Garcia, J. Cai, H.
Hippe, and J. A. E. Farrow. 1994. The phylogeny of the genus Clostridium: proposal of five new genera and
eleven new species combinations. Int. J. Syst. Bacterid. 44:812-826.
5. Ezaki T., N. Li, Y. Hashimoto, H. Miura, and H. Yamamoto. 1994. 16S ribosomal DNA sequences of
anaerobic cocci and proposal of Ruminococcus hansenii comb. nov. and Ruminococcus productus comb. nov.
Int. J. Syst. Bacteriol. 44:130-136.
6. Felske A., B. Engelen, U. Niibel, and H. Backhaus. 1996. Direct ribosome isolation from soil to extract
bacterial rRNA for community analysis. Appl. Environ. Microbiol. 62:4162^1167.
7. Felske A., H. Rheims, A. Wolterink, E. Stackebrandt, and A. D. L. Akkermans. 1997. Ribosome analysis
reveals prominent activity of an uncultured member of the class Actinobacteria in grassland soils. Microbiology
143:2983-2989.
8. Felske A., A. Wolterink, R. van Lis, and A. D. L. Akkermans. 1998. Phylogeny of the main bacterial 16S
rRNA sequences in Drentse A Grassland soils. Appl. Environ. Microbiol. 64:871-879.
9. Finegold S. M., V. L. Sutter, and G. E. Mathisen. 1983. Normal indigenous intestinal flora, p. 3-31. In D. J.
Hentges (ed.), Human intestinal microflora in health and disease. Academic Press, New York, N.Y.
10. Fischer S. G., and L. S. Lerman. 1979. Length-independent separation of DNA restriction fragments in
two-dimensional gel electrophoresis. Cell 16: 191-200.
11. Harmsen H. J. M., A. J. M. Stains, A. D. L. Akkermans, and W. M. de Vos. 1995. Phylogenetic analysis
of two syntrophic propionate-oxidizing bacteria in enrichment cultures. Syst. Appl. Microbiol. 18:67-73.
12. Hofstad T., and P. Aasjord. 1982. Eubacterium plautii (Seguin 1928) comb. nov. Int. J. Syst. Bacteriol.
32:346-349.
13. Holdeman L. V., I. J. Good, and W. E. C. Moore. 1976. Human fecal flora: variation in bacterial
62

composition within individuals and a possible effect of emotional stress. Appl. Environ. Microbiol. 31:359-375.
14. Holt J. G., N. R. Krieg, P. H. A. Sneath, J. T. Staley, and S. T. Williams. 1994. Bergey's manual of
determinative bacteriology, 9th ed. The Williams and Wilkins Co., Baltimore, Md.
15. Lane D. J. 1991. 16S/23S rRNA sequencing, p. 115-175. In E. Stackebrandt and M. Goodfellow (ed.),
Nucleic acid techniques in bacterial systematics. J. Wiley & Sons, Chichester, United Kingdom.
16. Langendijk P. S., F. Schut, G. J. Jansen, G. C. Raangs, G. R. Kamphuis, M. H. F. Wilkinson, and G.
W. Welling. 1995. Quantitative fluorescence in situ hybridization of Bifidobacterium spp. with genus-specific
16S rRNA-targeted probes and its application in fecal samples. Appl. Environ. Microbiol. 61:3069-3075.
17. Maidak B. L., G. J. Olsen, N. Larsen, R. Overbeek, M. J. McCaughey, and C. J. Woese. 1997. The RDP
(Ribosomal Database Project). Nucleic Acids Res. 25:109-111.
18. Maniatis T., E. F. Fritsch, and J. Sambrook. 1989. Molecular cloning: a laboratory manual, 2nd ed. Cold
Spring Harbor Laboratory, Cold Spring Harbor, N.Y.
19. McCartney A. L., W. Wenzhi, and G. W. Tannock. 1996. Molecular analysis of the composition of the
bifidobacteria! and lactobacillus microflora of humans. Appl. Environ. Microbiol. 62:4608^1613.
20. McFarlane G. T., and G. R. Gibson. 1994. Metabolic activities of the normal colonic microflora, p. 17-38.
In S. A. W. Gibson (ed.), Human health: contribution of microorganisms. Springer, Frankfurt, Germany.
21. Moore W. E. C , and L. V. Holdeman. 1974. Human fecal flora: the normal flora of 20 Japanese-
Hawaiians. Appl. Microbiol. 27:961-979.
22. Muyzer G., E. C. de Waal, and G. A. Uitterlinden. 1993. Profiling of complex populations by
denaturating gradient gel electrophoresis analysis of polymerase chain reaction-amplified genes coding for 16S
rRNA. Appl. Environ. Microbiol. 59:695-700.
23. Neefs J., Y. van der Peer, L. Hendriks, and R. de Wachter. 1990. Compilation of small ribosomal subunit
RNA sequences. Nucleic Acids Res. 18 (Suppl.):2237-2317.
24. Niibel U., B. Engelen, A. Felske, J. Snaidr, A. Wieshuber, R. I. Amann, W. Ludwig, and H. Backhaus.
1996. Sequence heterogeneities of genes encoding 16S rRNAs in Paenibacillus polymyxa detected by
temperature gradient gel electrophoresis. J. Bacteriol. 178:5636-5643.
25. Pearson W. R., and D. J. Lipman. 1988. Improved tools for biological sequence comparison. Proc. Natl.
Acad. Sci. USA 85:2444-2448.
26. Ramirez-Saad H. C , W. M. Akkermans, and A. D. L. Akkermans. 1996. DNA extraction from
actinorhizal nodules, p. 1-11. In A. D. L. Akkermans, J. D. van Elsas, and F. J. de Bruijn (ed.), Molecular
microbial ecology manual. Kluwer Academic Publishers, Dordrecht, The Netherlands.
27. Reysenbach A., L. J. Giver, G. S. Wickham, and N. R. Pace. 1992. Differential amplification of rRNA
genes by polymerase chain reaction. Appl.Environ. Microbiol. 58:3417-3418.
28. Rosenbaum V., and D. Riesner. 1987. Temperature-gradient gel electrophoresis - thermodynamic analysis
of nucleic acids and proteins in purified form and in cellular extracts. Biophys. Chem. 26:235-246.
29. Savage D. C. 1977. Microbial ecology of the gastrointestinal tract. Annu. Rev. Microbiol. 31:107-133.
30. Stackebrandt E., and B. M. Goebel. 1994. Taxonomic note: a place for DNA-DNA reassociation and 16S
rRNA sequence analysis in the present species definition in bacteriology. Int. J. Syst. Bacteriol. 44:846-849.
31. Strunk O., and W. Ludwig. 1995. ARB - a software environment for sequence data. Department of
Microbiology, Technical University of Munich, Munich, Germany. (E-mail: [email protected]
63
muenchen.de.)
32. von Wintzingrode F., U. B. Gobel, and E. Stackebrandt. 1997. Determination of microbial diversity in
environmental samples: pitfalls of PCR-based rRNA analysis. FEMS Microbiol. Rev. 21:213-229.
33. Wagner R. 1994. The regulation of ribosomal RNA synthesis and bacterial cell growth. Arch. Microbiol.
161:100-106.
34. Wallner G., B. Fuchs, S. Spring, W. Beisker, and R. 1. Amann. 1997. Flow sorting of microorganisms for
molecular analysis. Appl. Environ. Microbiol. 63:4223-4231.
35. Wang R.-F., W.-W. Cao, and C. E. Cerniglia. 1996. PCR detection of predominant anaerobic bacteria in
human and animal fecal samples. Appl. Environ. Microbiol. 62:1242-1247.
36. Wang R.-F., W.-W. Cao, and C. E. Cerniglia. 1996. Phylogenetic analysis of Fusobacterium prausnitzii
based upon the 16S rRNA gene sequence and PCR confirmation. Int. J. Syst. Bacteriol. 46:341-343.
37. Whitford M. F. R. J. Forster, C. E. Beard, J. Gong, and R. M. Teather. 1998. Phylogenetic analysis of
rumen bacteria by comparative sequence analysis of cloned 16SrRNA genes. Anaerobe 4:153-163.
38. Wilson, K. H. and R. B. Blitchington. 1996. Human colonic biota studied by ribosomal DNA sequence
analysis. Appl. Environ. Microbiol. 62:2273-2278.
64

Chapter 4
DNA Isolation Protocols Affect the Detection Limit of PCR
Approaches of Bacteria in Samples from the Human
Gastrointestinal Tract
Erwin G. Zoetendal, Kaouther Ben-Amor, Antoon D. L. Akkermans, Tjakko Abee, and Willem
M. de Vos
Systematic and Applied Microbiology (2001) in press
Reprinted with permission of Urban & Fischer
65
Abstract
A major concern in molecular ecological studies is the lysis efficiency of different
bacteria in a complex ecosystem. We used a PCR-based 16S rDNA approach to
determine the effect of two DNA isolation protocols (i.e. the bead beating and Triton-
XI00 method) on the detection limit of seven feces-associated bacterial species of
different genera. Glycogen was used in these protocols to improve the precipitation of
small concentrations of DNA in ethanol without affecting the sequential procedures. The
PCR detection limit of 16S rDNA amplicons on agarose gel from the seven strains tested
varied between 8.0 (±1.3) X 104 and 4.3 (±1.6) X 106 cells for the bead beating method,
and between 8.0 (±1.3) X 104 and 5.4 (±0.7) X 108 cells for the Triton X-100 method.
Denaturing gradient gel electrophoresis (DGGE) analysis was performed to investigate
the effect of both DNA isolation protocols on the lysis efficiency of bacteria in fecal
samples. A higher diversity in fecal samples was observed with the bead beating method
than with the Triton-XlOO method. Bands in the bead beating method-derived DGGE
profiles corresponding to bands of cloned sequences of the Clostridium coccoides-
Eubacterium rectale group and uncultured Fusobacterium prausnitzii were absent or had
low intensity in the Triton X-100 method-derived profiles. The applicability of the bead
beating method was further investigated by analyzing biopsy samples from the human
colon which contain approximately 106 cells.
66
INTRODUCTION
Molecular approaches based on the sequence diversity of 16S rDNA have become very
important in analyzing and monitoring bacterial diversity (4, 9, 16). These have been applied
to a variety of ecosystems, including the human gastrointestinal tract (21, 22, 23, 25). In all
approaches, lysis of bacterial cells is the first and one of the most crucial steps and should be
equally efficient for all bacterial species and independent of the growth phase of the bacteria,
the preparation of the sample, and the concentration of cells in the sample.
Determining the lysis efficiency has mainly been performed either by examining the
samples microscopically or by counting the number of colony forming units before and after
treatment (5, 8, 24). Since many DNA isolation protocols use toxic chemicals, the latter
approach is of limited use. The main problem of microscopic examination is that cell numbers
below 107 ml"1 are difficult to detect. Hence we developed a PCR-based approach to evaluate
the detection limit of cells using two different DNA isolation protocols. We used the human
GI tract as a model for a complex ecosystem and applied the approach to detect bacterial
diversity in fecal samples and small biopsy samples from the human colon that usually
contain low numbers of bacteria (2, 7).
In the study described here we optimized the recovery of low concentrations of DNA
and combined flow cytometry and PCR of 16S rDNA to determine the total minimal number
of living and dead cells needed to obtain a quantifiable PCR product. Although many DNA
isolation procedures have been described (1), we focused on two widely used but basically
different methods to estimate the difference in detection limit for different bacterial species
and compared a relatively advanced method based on disruption by bead beating with a
relatively simple method based on the addition of Triton X-100.
MATERIALS AND METHODS
Fecal and biopsy sample collection. Fresh fecal samples were collected and homogenized in the sampling tubes.
Three grams of fecal samples were resuspended in 50 ml 0.05 M potassium phosphate buffer (pH 7.0) on ice for
5 to 10 minutes and divided in 1 ml aliquots as described previously (25). These aliquots were used for DNA
isolation. Duplicate fecal and descending colonic biopsy samples (diameter ~ 3 mm) from a previous study were
kindly provided (3).
67

Bacterial strains and culture conditions. The seven strains used for this experiment were Bifidobacterium
longum (ATCC 15707), Bifidobacterium breve (ATCC 15700), Lactobacillus casei (ATCC 393), Lactobacillus
acidophilus (ATCC 4356), Clostridium clostridiiforme (Lille-JTV), Enterococcus faecal is (ATCC 29212), and
Bacteroides fragilis (Lille-TM6). Representatives of the Bacteroides, Bifidobacterium and Clostridium
coccoides-Eubacterium rectale group (Bacteroides fragilis, Bifidobacterium spp., and Clostridium
clostridiiforme, respectively) were chosen since these groups are dominantly present in fecal samples (12).
Enterococcus faecalis was selected as a member of the anaerobic gram positive cocci and the Lactobacillus
species were chosen since lactobacilli are known to be present in low numbers in fecal samples and since this
genus is often used in feeding trials as probiotic. The Lactobacillus and Bifidobacterium species were grown in
10 ml MRS broth (Difco Laboratories, Detroit, MI, USA) while the other species were grown in 10 ml Wilkins-
Chalgren Anaerobe Broth (Oxoid, Basingstoke, UK). All media contained 0.5 g/1 L-cysteine monochloride and
cultures were incubated at 37°C under anoxic conditions. Cells were harvested when they reached the stationary
phase and centrifuged at 9000 X g for 5 min. After resuspending cells in 1 ml 0.05 M potassium phosphate
buffer (pH 7.0), cells were extensively vortexed to minimize clumping, and ten-fold dilution series were made
for flow cytometric analysis and DNA isolation.
Flow cytometric analysis. The total number of cells in different dilutions was determined by a flow cytometric
count approach to quantify the total number of stationary grown cells accurately and rapidly (6, 14). The number
of bacteria in the higher dilutions (lower than ~106 cells per ml) was determined by extrapolation from the lower
dilutions, since the number of cells in these dilutions was too low for accurate counting. The bacterial count kit
(Molecular probes Inc, Leiden, The Netherlands) was used according to the manufacturer's instructions in order
to determine cell numbers in the sample. Samples were analyzed using a FACScalibur flow cytometer (Beckton
Dickinson). A 488 nm laser was used for excitation and green fluorescence of the SYTO BC probe was collected
through an FL1 (530/30 nm) detector. The system threshold was set on side scatter signals and all bacterial
analyses were performed at the low rate settings (12 ul/min). The sample concentration was adjusted to keep the
count lower than 1,000 events/sec to avoid coincidence. Data were collected in list mode as pulse height signals
(four decades in logarithmic scale each) and 5,000 to 10,000 cells were acquired for further analysis which was
performed using CellQuest software (Beckton Dickinson) and/or WinMDI version 2.8 software
(http://facs.Scripps.edu/software.html).
DNA isolation. Two DNA isolation procedures were used to isolate DNA from the cultures and fecal samples.
For the bead beating method, resuspended cells and fecal samples were lyzed by incubation for 1 hour at 55°C
with 10 u.1 Proteinase K solution (20 mg/ml) and 50 ul 10% SDS solution followed by bead beating (3 min at
5,000 rpm) in 150 ul phenol (pH 7.5) using a mini bead beater (Biospec Products, Bartlesville, Oklahoma,
USA). The additional incubation with Proteinase K and SDS prior to the bead beating procedure as described
previously (25) did not alter the DGGE profiles. For the Triton X-100 method, cells were lyzed by adding 11%
Triton X-100 (100 ul) to the cell and fecal resuspensions followed by 10 minutes incubation at 95°C (24,
modified). After the cell lysis, phenol/chloroform extractions and one chloroform extraction were performed. To
enhance the precipitation of low concentrations of DNA, a 20 mg/ml glycogen solution was prepared as
precipitation carrier (18). After preparation this glycogen solution was cross-linked using UV light to remove
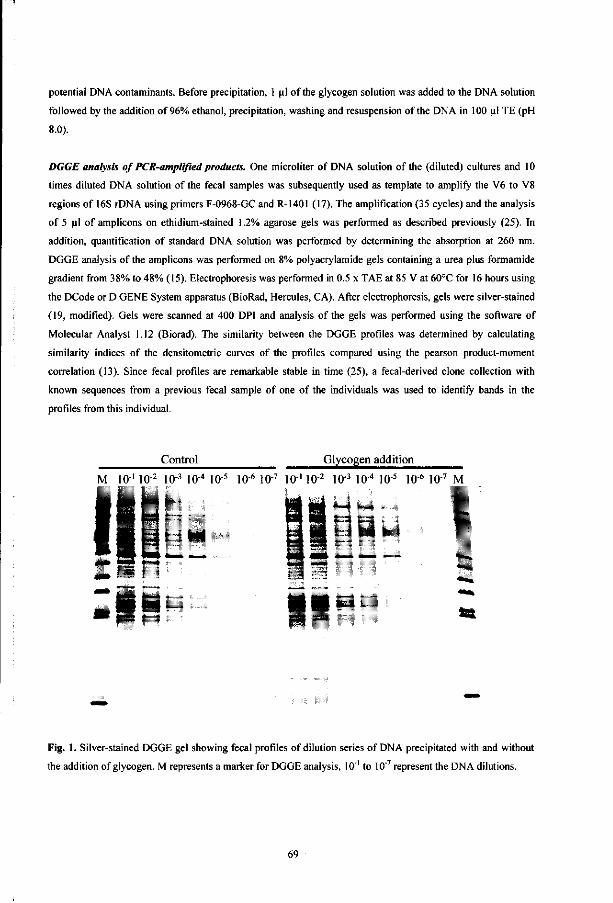
potential DNA contaminants. Before precipitation, 1 ul of the glycogen solution was added to the DNA solution
followed by the addition of 96% ethanol, precipitation, washing and resuspension of the DNA in 100 ul TE (pH
8.0).
DGGE analysis of PCR-amplified products. One microliter of DNA solution of the (diluted) cultures and 10
times diluted DNA solution of the fecal samples was subsequently used as template to amplify the V6 to V8
regions of 16S rDNA using primers F-0968-GC and R-1401 (17). The amplification (35 cycles) and the analysis
of 5 ul of amplicons on ethidium-stained 1.2% agarose gels was performed as described previously (25). In
addition, quantification of standard DNA solution was performed by determining the absorption at 260 nm.
DGGE analysis of the amplicons was performed on 8% polyacrylamide gels containing a urea plus formamide
gradient from 38% to 48% (15). Electrophoresis was performed in 0.5 x TAE at 85 V at 60°C for 16 hours using
the DCode or D GENE System apparatus (BioRad, Hercules, CA). After electrophoresis, gels were silver-stained
(19, modified). Gels were scanned at 400 DPI and analysis of the gels was performed using the software of
Molecular Analyst 1.12 (Biorad). The similarity between the DGGE profiles was determined by calculating
similarity indices of the densitometric curves of the profiles compared using the pearson product-moment
correlation (13). Since fecal profiles are remarkable stable in time (25), a fecal-derived clone collection with
known sequences from a previous fecal sample of one of the individuals was used to identify bands in the
profiles from this individual.
Control Glycogen addition
M I O 1 in-2 io • in ' io-5 lfr6 lo-7 io-' lo-2 in-3 io-4 in-5 in-610-7 M
s*^" * -• S 3 3 8BgSt ETT5» aa'i"̂ 4ii^h
Skis. Li: • • y fe§ fci W *•* 5"
=Bc fW " - * f*̂ ^ ^ •*" ^m
Fig. 1. Silver-stained DGGE gel showing fecal profiles of dilution series of DNA precipitated with and without
the addition of glycogen. M represents a marker for DGGE analysis, 10"' to IO"7 represent the DNA dilutions.
69

RESULTS AND DISCUSSION
Effect of glycogen addition. To test the effect of glycogen in enhancing the DNA
precipitation, dilution series of fecal DNA solutions was made and the DNA was precipitated
with ethanol in the presence or absence of glycogen. After amplifying the V6 - V8 regions of
16S rDNA the PCR fragments were analyzed by DGGE. As shown in figure 1 the complete
DGGE profile could be retrieved in a 10 times more diluted DNA solution when glycogen
was added before the precipitation, indicating that glycogen enhances the DNA recovery. It is
clearly visible that glycogen did not affect the amplification and the silver staining procedure,
and was therefore compatible with the DGGE analysis of PCR amplicons.
HTritonX-100 Method
QBead beating Method
• & ^ <? y .**? # y ^ ^b y &» &"• jy . a
' «|v A* V „A3 „«..' *$• <$••' <^' £ ^
c X
Fig. 2. Diagram showing the minimal number of cells needed to get a visible PCR product on agarose gel for
different species using the two DNA isolation protocols. The mean and standard deviations of the flow
cytometric counts are indicated. The black and gray bars indicate the cells lyzed with the Triton X-100 method
and the bead beating method, respectively.
Detection limit of bacterial cultures. Seven feces-associated bacterial species of different
genera were selected to determine the detection limit of two DNA isolation protocols that
differ in the cells lysis procedure, i.e. bead beating and addition of Triton X-100. Bacterial
numbers were counted by flow cytometry, which results in accurate counts of the different
70
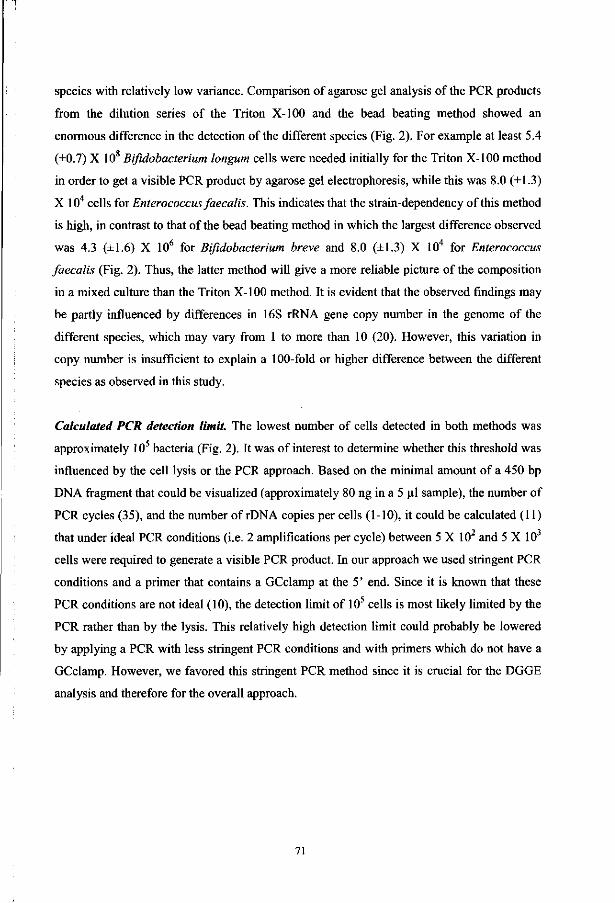
species with relatively low variance. Comparison of agarose gel analysis of the PCR products
from the dilution series of the Triton X-100 and the bead beating method showed an
enormous difference in the detection of the different species (Fig. 2). For example at least 5.4
(±0.7) X 108 Bifidobacterium longum cells were needed initially for the Triton X-100 method
in order to get a visible PCR product by agarose gel electrophoresis, while this was 8.0 (±1.3)
X 104 cells for Enterococcusfaecalis. This indicates that the strain-dependency of this method
is high, in contrast to that of the bead beating method in which the largest difference observed
was 4.3 (±1.6) X 106 for Bifidobacterium breve and 8.0 (±1.3) X 104 for Enterococcus
faecalis (Fig. 2). Thus, the latter method will give a more reliable picture of the composition
in a mixed culture than the Triton X-100 method. It is evident that the observed findings may
be partly influenced by differences in 16S rRNA gene copy number in the genome of the
different species, which may vary from 1 to more than 10 (20). However, this variation in
copy number is insufficient to explain a 100-fold or higher difference between the different
species as observed in this study.
Calculated PCR detection limit. The lowest number of cells detected in both methods was
approximately 105 bacteria (Fig. 2). It was of interest to determine whether this threshold was
influenced by the cell lysis or the PCR approach. Based on the minimal amount of a 450 bp
DNA fragment that could be visualized (approximately 80 ng in a 5 ul sample), the number of
PCR cycles (35), and the number of rDNA copies per cells (1-10), it could be calculated (11)
that under ideal PCR conditions (i.e. 2 amplifications per cycle) between 5 X 10² and 5 X 10³
cells were required to generate a visible PCR product. In our approach we used stringent PCR
conditions and a primer that contains a GCclamp at the 5' end. Since it is known that these
PCR conditions are not ideal (10), the detection limit of 105 cells is most likely limited by the
PCR rather than by the lysis. This relatively high detection limit could probably be lowered
by applying a PCR with less stringent PCR conditions and with primers which do not have a
GCclamp. However, we favored this stringent PCR method since it is crucial for the DGGE
analysis and therefore for the overall approach.
71
Fl F2 M B T B T M
lliMSII * 4
4
4 t
Fusobacterium prausnitzii (94.7%, AF052411)
Ruminococcus obeum (94.3%, AF052417)
• Clostridium celerecrescens (93.1%, AF052421) i Eubacterium halii (98.0%, AF052409)
Fig. 3. Silver-stained DGGE gel showing profiles derived from fecal DNA (Fl and F2) using the bead beating
(B) and Triton X-100 (T) method. M represents the marker for DGGE analysis. The boxed amplicons, which
were only present in the bead beating method-derived profiles were identified by fecal clones with know
sequence and identical mobility on DGGE. Accession numbers are indicated .
Analysis of fecal samples and biopsies. In order to determine the effect of the different strain-
dependent detection limits of both protocols on the anticipated diversity in environmental
samples, DNA was isolated from human fecal samples followed by PCR and DGGE analysis.
DGGE analysis showed that the profiles generated after the Triton X-100 method were less
complex than those generated after the bead beating method (Fig. 3). For each fecal sample
the majority of bands were present in the profile of both methods, indicating the robustness of
both DNA isolation procedures. Some amplicons missing or clearly less abundant in the
Triton X-100 were identified based on their migration during DGGE (25) as Fusobacterium
prausnitzii (94.7%), Ruminococcus obeum (94.3%), Clostridium celerecrescens (93.1%), and
Eubacterium halii (98.0%), from which the last three belong to the Clostridium coccoides-
Eubacterium rectale group. This indicates that the difference in detection limit of the
protocols is not restricted to one specific genus or phylogenetically related group of organisms
which is in line with the culture-based observations. Occasionally, a few bands in the profile
generated after the Triton X-100 method were not observed in the profile generated after the
72

bead beating method. These bands most likely represent bacteria in low abundance that are
relatively easy to lyze and therefore overestimated in the profile generated after the Triton X-
100 method. The reduced complexity of the profiles after the Triton X-100 method is in line
with the high strain dependency of the lysis as observed with pure cultures.
— <N (N — (N (N < < < m m <a >-, >> >% ™ >. >> >> CO co CO CO CO CO CO
ex o. a. <u n . : x o . o o o H . 2 . 2 . 2 5 S 5 u- 3 5 5
!=S
Fig. 4. Silver-stained DGGE gel showing profiles derived from DNA of feces and biopsy samples of two
individuals (A and B). Biopsies Al and A2, and Bl and B2 are duplo samples from the descending colon of
individuals A and B respectively. The superscribed -1 indicates that template DNA was ten times diluted.
Since the bead beating method was found to be less strain dependent, fecal samples
and descending colonic biopsy samples, which contained approximately 10 bacterial cells
(3), were analyzed using this method. Fecal and biopsy samples from different individuals
resulted in very different DGGE profiles, while duplicate biopsy samples from the same
individuals gave the same profiles (similarity index: 98.9 and 98.2; Fig. 4). In individual 1 the
fecal and biopsy profiles were different (similarity index: 37.0 and 37.8), while they were
highly similar in individual 2 (similarity index: 93.1 and 93.4). The high similarity of the fecal
and biopsy profile of the latter individual indicates that the bead beating method was not
biased by the approximately 1000-fold difference in cell number. This is strengthened by the
fact that 10-fold dilution of template DNA of the biopsy samples prior to PCR did not alter
the profiles of both individuals (similarity index: 97.4 and 97.6 for individual A and B,
respectively). Despite the fact that samples from only two individuals were analyzed, it is
73

evident that fecal samples do not necessarily represent the community at other locations in the
human colon.
Conclusions. In this study the bias caused by the strain dependent DNA isolation procedure
was investigated by combining PCR of 16S rDNA and flow cytometric counting of the cells.
It is evident that the DNA isolation procedures tested have some degree of difference in lysis
efficiency for the detection limit of the different species, although this was lowest in the bead
beating method. It was shown that the latter method was more suitable for analyzing fecal and
biopsy samples. Despite the shearing of DNA during the bead beating procedure, this method
has shown to be very efficient for analyzing fecal and biopsy samples. In a previous study the
optimization and application of a bead beating method for the analysis of fecal samples has
already been described (25). Despite such optimization of DNA isolation protocols, one
should still be critical when DNA from environmental samples is isolated. Uncultured
bacteria are present in environmental samples, that may have novel properties and hence it
cannot be excluded that certain bacteria will not be disrupted during a lysis treatment.
In conclusion, the present study demonstrates that the combination of flow cytometry
and PCR-DGGE analysis of dilution series of pure cultures gives an estimate of the detection
limit of the DNA isolation protocols. Therefore, this detection limit should be determined
before DNA and PCR based approaches are used to study the bacterial diversity in an
ecosystem.
ACKNOWLEDGMENTS
We thank all volunteers for providing fecal samples. We would like to thank VTT
Biotechnology and Food Research, MSc. Minna Alander, and MSc. Reetta Satokari for
providing the ATCC strains, and biopsy samples and fecal samples from a previous study. Dr.
Christine Favier is acknowledged for providing the bacterial strains from Lille. MSc. Arjen
Brinkman was very helpful with the optimization of the DNA recovery. We thank Dr. Elaine
Vaughan for critically reading the manuscript.
74
REFERENCES
1. Akkermans A. D. L., J. D. van Elsas, and F. J. de Bruijn. 1999. Molecular microbial ecology manual + 4
suppl. Kluwer Academic publishers, Dordrecht, The Netherlands.
2. Alander M., R. Korpela, M. Saxelin, T. Vilpponen-Salmela, T. Mattila-Sandholm, and A. von Wright.
1997. Recovery of Lactobacillus rhamnosus GG from human colonic biopsies. Lett. Appl. Microbiol. 24:361-
364.
3. Alander M., R. Satokari, R. Korpela, M. Saxelin, T. Vilpponen-Salmela, T. Mattila-Sandholm, and A.
von Wright. 1999. Persistence of colonization of human colonic mucosa by a probiotic strain, Lactobacillus
rhamnosus GG, after oral consumption. Appl. Environ. Microbiol. 65:351-354.
4. Amann R. I., W. Ludwig, and K-H. Schleifer. 1995. Phylogenetic identification and in situ detection of
individual cells without cultivation. Microbiol. Rev. 59:143-169.
5. Apajalathi J. H., L. K. Sarkilahti, B. R. E. Maki, J. P. Heikkinen, P. H. Nurminen, and W. E. Holben.
1998. Effective recovery of bacterial DNA and percent-guanine-plus-cytocone based analysis of community
structure in the gastrointestinal tract of broiler chickens. Appl. Environ. Microbiol. 64:4084-4088.
6. Davey H. M. and D. B. Kell. 1996. Flow cytometry and cell sorting of heterogeneous microbial populations:
the importance of single-cell analysis. Microbiol. Rev. 60:641-696 (1996).
7. Drasar B. S. and P. A. Barrow. 1985. Intestinal microbiology. American Society for Microbiology,
Washington, D.C., USA.
8. Felske A., B. Engelen, U. Nttbel, and H. Backhaus. 1996. Direct ribosome isolation from soil to extract
bacterial rRNA for community analysis. Appl. Environ. Microbiol. 62:4162-4167.
9. Felske A., A. Wolterink, R. van Lis, and A. D. L. Akkermans. 1998. Phylogeny of the main bacterial 16S
rRNA sequences in Drentse A Grassland soils. Appl. Environ. Microbiol. 64:871-879.
10. Felske A., A. D. L. Akkermans, and W. M. de Vos. 1998. Quantification of 16S rRNAs in complex
bacterial communities by multiple competitive reverse transcription-PCR in temperature gradient gel
electrophoresis fingerprints. Appl. Environ. Microbiol. 64:4581-4587.
11. Frank M. B. 1997. Nucleic Acid Conversion Factors: Moles - ug - O.D. http://omrf.ouhsc.edu/~frank/
dnamole.html. In: Molecular Biology Protocols, ed. M. B. Frank, Oklahoma City, USA.
12. Franks A. H., H. J. M. Harmsen, G. C. Raangs, G. J. Jansen, F. Schut, and G. W. Welling. 1998.
Variations of bacterial populations in human feces measured by fluorescent in situ hybridization with group-
specific 16S rRNA-targeted oligonucleotide probes. Appl. Environ. Microbiol. 64:3336-3345.
13. Hane B. G., K. Jager, and H. Drexler. 1993. The pearson product-moment correlation coefficient is better
suited for identification of DNA fingerprint profiles than band matching algorithms. Electrophoresis 14:967-972.
14. Marie D., D. Vaulot, and F. Partensky. 1996. Application of the novel nucleic acid dyes YOYO 1, YO-
PRO-1 and PicoGreen for flow cytometry analysis of Marine prokaryotes. Appl. Environ. Microbiol. 62:1649-
1655.
15. Muyzer G., E. C. de Waal, and G. A. Uitterlinden. 1993. Profiling of complex populations by
denaturating gradient gel electrophoresis analysis of polymerase chain reaction-amplified genes coding for 16S
rRNA. Appl. Environ. Microbiol. 59:695-700.
75
16. Muyzer G. and K. Smalla. 1998. Application of denaturing gradient gel electrophoresis (DGGE) and
temperature gradient gel electrophoresis (TGGE) in microbial ecology. Antonie van Leeuwenhoek 73:127-141.
17. Niibel U., B. Engelen, A. Felske, J. Snaidr, A. Wieshuber, R. I. Amann, W. Ludwig, and H. Backhaus.
1996. Sequence heterogeneities of genes encoding 16S rRNAs in Paenibacillus polymyxa detected by
temperature gradient gel electrophoresis. J. Bacteriol. 178:5636-5643.
18. Paul J. H. 1996. Extraction of microbial DNA from aquatic sources: Marine environments. In: Molecular
microbial ecology manual 1.1.1. pp. 1-13, eds A.D. L. Akkermans, J. D. van Elsas, and F. J. de Bruijn., Kluwer
Academic publishers, Dordrecht, the Netherlands.
19. Sanguinetti C. J., E. Dias Neto, and A. J. G. Simpson. 1994. Rapid silver staining and recovery of PCR
products separated on polyacrylamide gels. BioTechniques 17:915-919.
20. Schmidt T. M. 1997. Multiplicity of ribosomal RNA operons in prokaryotic genomes, pp. 221-229. In:
Bacterial genomes: physical structure and analysis, pp. 221-229, eds. F. J. de Bruijn, J. R. Lupski, and G. M.
Weinstock, Chapman and Hall Co, New York, USA.
21. Suau A., R. Bonnet, M. Sutren, J-J. Godon, G. R. Gibson, M. D. Collins, and J. Dore. 1999. Direct
analysis of genes encoding 16S rRNA from complex communities reveals many novel molecular species within
the human gut. Appl. Environ. Microbiol. 65:4799-4807.
22. Tannock G. W., K. Munro, H. J. M. Harmsen, G. W. Welling, J. Smart, and P. K. Gopal. 2000.
Analysis of the fecal microflora of human subjects consuming a probiotic product containing Lactobacillus
rhamnosus DR20. Appl. Environ. Microbiol. 66:2578-2588.
23. Vaughan E. E., F. Schut, G. H. J. Heilig, E. G. Zoetendal, W. M. de Vos, and A. D. L. Akkermans.
2000. A molecular view of the intestinal ecosystem. Curr. Issues Intest. Microbiol. 1:1-12.
24. Wang R-F., W-W Cao, and C. E. Cerniglia. 1996. PCR detection of predominant anaerobic bacteria in
human and animal fecal samples. Appl. Environ. Microbiol. 62:1242-1247.
25. Zoetendal E. G., A. D. L. Akkermans, and W. M. de Vos. 1998. Temperature gradient gel electrophoresis
analysis from human fecal samples reveals stable and host-specific communities of active bacteria. Appl.
Environ. Microbiol. 64:3854-3859.
76

Chapter 5
Molecular Diversity of Lactobacillus spp., and Other Lactic Acid
Bacteria in the Human Intestine as Determined by Specific
Amplification of 16S Ribosomal DNA
Hans G.H.J. Heilig, Erwin G. Zoetendal, Elaine E. Vaughan, Philippe Marteau, Antoon D.L.
Akkermans, and Willem M. de Vos
Submitted
11

Abstract
A Lactobacillus group-specific PCR primer S-G-Lab-0677-a-A-17 was developed to
selectively amplify 16S ribosomal DNA (rDNA) from lactobacilli and related lactic acid
bacteria, including members of the genera Leuconostoc, Pediococcus, and Weissella.
Amplicons generated by PCR from a variety of gastrointestinal (GI) tract samples,
including those originating from feces and cecum, resulted predominantly in
Lactobacillus-like sequences, of which approximately 28% were most similar to the 16S
rDNA of Lactobacillus ruminis. Moreover, four sequences of Leuconostoc species were
retrieved that, so far, have only been detected in environments other than the GI tract,
such as fermented food products. Stability in time of the GI tract bacterial community
in different age groups were studied using Lactobacillus-specific PCR and denaturing
gradient gel electrophoresis (DGGE) of the 16S rDNA amplicons. The Lactobacillus
community in adults over a two years period showed variation in composition and
stability depending on the individual, while successional change of the Lactobacillus
community was observed during the first five months of an infant's life. Furthermore,
the specific PCR and DGGE approach was used to study the retention in fecal samples
of a Lactobacillus strain administered during a clinical trial. In conclusion, the
combination of specific PCR and DGGE analysis of 16S rDNA amplicons, allows the
diversity of important groups of bacteria that are present in low numbers in specific
ecosystems to be characterized, such as the lactobacilli in the human GI tract.
78
INTRODUCTION
The human gastrointestinal (GI) tract consists of different habitats, which especially in the
right and distal colon are occupied by mostly obligate anaerobic bacteria (28). The activity of
these commensal bacteria in the GI tract has a major impact on the characteristics of the host.
The microbiota-associated roles include protection against pathogens, development of the
immune system, and positive effects on colonic health and host nutrition (6, 15). Although the
diversity of the gut microbiota has been investigated extensively by anaerobic culture
techniques (8, 28), it is recently receiving renewed interest due to the development and
application of molecular techniques, especially those based on the 16S and 23S ribosomal
RNA (rRNA) genes (45, 47, 48).
Fluorescent in situ hybridization (FISH) and group-specific hybridization approaches
targeting rRNA in combination with advanced microscopy have indicated that the majority of
the GI tract microbial community is not accounted for by cultivation (19, 39, 42, 48).
Phylogenetic analysis of rRNA genes, amplified by polymerase chain reaction (PCR), has
been used as a rapid and efficient strategy to investigate the biodiversity of intestinal bacteria
and revealed many novel species (42, 49). Furthermore, fingerprinting methods such as
denaturing or temperature gradient gel electrophoresis (DGGE or TGGE, respectively) of
rRNA or rDNA amplicons, that allow the rapid evaluation of composition and activity of
bacteria over time in complex ecosystems (27), have been applied to the human intestine (47,
49, 50). It was observed that each individual harbors its own unique dominant bacterial
community that is relatively stable in time (49). However, all these molecular approaches,
including a recent study on the bifidobacterial community in human feces (36), focus on the
numerically dominant bacteria and do not address the diversity of other important species that
are present in low numbers in the GI tract. These include lactic acid bacteria, such as
Lactobacillus spp., that have been shown to constitute less than 1% of the total bacterial
community (39). The genus Lactobacillus contains a diverse assemblage of Gram-positive,
catalase-negative, non-sporulating, rod-shaped organisms and includes more than 25 species
(4, 11). They inhabit a wide variety of habitats, including the GI tracts of animals and
phytosphere, and are traditionally used in the manufacture of fermented foods, and more
recently in functional foods (23, 45). Based on plate counts it was found that Lactobacillus
strains are present in the GI tract of 70% of humans that consume a Western-like diet, but are
not detectable in the remainder of subjects (8, 43). The number of Lactobacillus cells in
79

neonates was found to be in the range of 105 colony forming units per gram (CFU/g) of feces,
whilst in infants of one month and older the counts ranged from 106 to 108 CFU/g of feces
(20).
The primary aim of the present study was to develop a PCR primer targeting the 16S
rRNA gene that is highly specific for the genus Lactobacillus. There have been numerous
reports on the development of oligonucleotide probes or PCR primers that target specific
Lactobacillus species (3, 5, 13, 14, 29, 30, 31), or groups of Lactobacillus species (40).
However, designing a Lactobacillus genus-specific probe or primer is more challenging. The
developed primer was used to analyze the diversity of members of this group in GI tract
samples in space and time. Sequence analysis of the PCR amplicons generated using this
primer, showed selective amplification of Lactobacillus-like 16S rDNA sequences, some of
which have not yet been described to be present in the GI tract. Furthermore, we demonstrate
that application of the primer in combination with DGGE of the 16S rDNA amplicons allows
the diversity and development of these bacterial groups to be monitored and their response to
the additional dietary intake of lactobacilli within the human GI tract.
MATERIALS AND METHODS
Bacterial strains and growth conditions. Reference microorganisms, their sources and the growth media for
each strain used in this study are indicated in Table 1. Escherichia coli transformants were grown overnight
shaking at 250 rpm in Luria Bertani (LB) broth (34). Lactobacillus strains were grown in tubes containing 10 ml
of Lactobacillus MRS broth (Difco Laboratories, Detroit, MI, U.S.A.), and 0.3 g l"1 cysteine hydrochloride. The
remaining strains were grown in either LB or Wilkins West (WW) broth that contains per litre 33 g Wilkins-
Chalgren Anaerobe broth (Oxoid, Basingstoke, U.K.), 2 g glucose, 4 g arginine HC1, 5 ml of 5% Tween-80, and
0.3 g cysteine hydrochloride, and the pH was adjusted to 7.0 with HC1. All bacteria were incubated at 37°C. The
strict anaerobes, i.e. Clostridium, Bacteroides, and Peptostreptococcus species, were handled and cultured in an
anaerobic glove box with a constant atmosphere of 96% N2 and 4% H2, and incubated in an anaerobic jar using
Anaerocult A (Merck Microbiologie, Darmstadt, F.R.G.) to ensure an oxygen-free environment. Prior to
inoculation of the remaining species, the tubes containing media were boiled for 20 minutes and cooled to room
temperature to remove oxygen from the medium. After inoculation, which was performed on the bench, tubes
were rapidly sealed with a paraffin plug to ensure anoxic conditions.
Recovery, preparation, and storage of fecal and cecal samples. Fecal samples were provided by healthy
volunteers of both sexes, and of different age, in spatula-containers and were stored at -20°C until further use.
Informed consent was obtained from the parents of children. One healthy full-term baby-boy, vaginally delivered
and breast-fed, has participated in this study. The infant was followed in time and was breast-fed until day 17,
80

Table 1. Bacterial strains, their sources, and media used for their cultivation. The formation of specific PCR
products with a size of 0.7 kb using primer set Bact-001 If and Lab-0677r, or 0.4 kb using primer set Lab-0159f
and Uni-0515r is also indicated employing an annealing temperature of 66°C (+, present; -, absent).
Species Source" Medium PCR PCR 0.7 kb 0.4 kb
Bacteroides fragilis Bacteroides thelaiotaomicron Bifidobacterium lactis Bb 12 Butyrivibrio fibrisolvens-\ike clone Al 1 Clostridium beyerinkii Clostridium bifermentas Clostridium celerescens-\\ke clone A54 Coprococcus eutactus-\\ke clone A19 Enterococcus faecal is Escherichia coli JM109 Eubacterium biforme-like clone F44 Eubacterium halii-Yike clone A07 Eubacterium rectale-Wke clone A13 Fusobacterium prausnitzii-\\ke clone A03 Fusobacterium prausnitzii-Wke clone A10 Lactococcus lactis lactis Lactobacillus acidophilus Lactobacillus brevis Lactobacillus buchneri Lactobacillus curvatus Lactobacillus fermentum Lactobacillus helveticus Lactobacillus helveticus Lactobacillus paracasei F19 Lactobacillus plantarum Lactobacillus reuteri Lactobacillus rhamnosus LGG Lactobacillus ruminis Lactobacillus salivarius ssp. salicinius Leuconostoc sp. Pediococcus sp. Peptostreptococcus anaerobius Roseburia cecicola-\ike clone A22 Ruminococcus obeum-Wke clone A20 Streptococcus thermophilus Vagococcus fluvialis Weissella kandleri
MMBS16 MMB S20 VTT
MMB 3318 N1ZO B529
DSM 20478 Promega
NIZOB17 VTT E96276 VTT E91458 VTT E93445 VTT E90391 VTT E93489 ATTC 15009 NCIMB 8652 VTT VTT E79098 VTTE92142 ATCC 53103 VTT E91470 DSM 20554 NIZOB179 FM0001 MMB 2828
N1ZOB119 DSM 5731 DSM 20593
WW WW WW LB WW WW LB LB WW LB LB LB LB LB LB MRS MRS MRS MRS MRS MRS MRS MRS MRS MRS MRS MRS MRS MRS WW MRS WW LB LB WW WW WW
_ ---------
ND -----
+ + + + + + + + + + + + + + + -----
+
NDC
ND ND ND ND ND ND ND ND ND ---
ND ND ND + + + + + + + + + + + + + + + ND ND ND ND ND ND
aMMB, Department of Medical Microbiology, University of Groningen, Hanzeplein 1, 9713 GZ Groningen, the
Netherlands. VTT, VTT culture collection, P.O. Box 1504, FIN-02044, Finland. NIZO-Netherlands Institute for
Dairy Research, P.O. Box 20, 6710 BA Ede, the Netherlands. DSM-German Collection for Microorganisms,
Mascheroder Weg 1, 3300 Braunschweig-Stockheim, F.R.G. ATCC-American Type Culture Collection, 12301
Parklawn Drive, Rockville, Maryland 20852, U.S.A. NCIMB, National Collection of Industrial, Food and
Marine Bacteria, 23 St. Machar Drive, Aberdeen, AB24 3RY, Scotland, U.K. F.M. Food Microbiology,
Wageningen University, Bomenweg 2, 6703 HD Wageningen, The Netherlands. bWW-Wilkins West. LB-Luria
Bertani broth. MRS, Lactobacilli MRS broth. CND not determined.

received the first formula-food after two weeks, and then received progressively more formula. Solid food was
given after 3 months. Besides these non-trial affiliated volunteers, fecal samples were provided by individuals
that were involved in a trial where subjects were fed with fermented products containing Lactobacillus paracasei
F19 (23). Upon use samples were thawed on ice-water and mixed after which they were homogenized in 0.05 M
ice-cold potassium phosphate buffer (pH 7.0) at a ratio of 3 g of feces (wet weight) per 50 ml (49). Aliquots of 1
ml were stored at -20°C. Cecal samples were collected as described previously (9, 22). Samples were stored at -
20°C until used for bacterial DNA extraction.
DNA isolation. Bacterial DNA from fecal and cecal samples was isolated according to Zoetendal et al. (1998).
DNA from 5 ml bacterial cultures was isolated by bead-beating, phenol-chloroform extraction, and ethanol-
precipitation. Plasmid isolations from transformants were performed using QIAprep Spin Miniprep Kit (Qiagen,
Hilden, FRG).
Table 2. Primers used in this study.
Primer name Primer sequence (5'-3') Reference aS-D-Bact-0011-a-S-17 AGA GTT TGA T(C/T) (A/C) TGG CTC AG 16 aS-D-Bact-0124-a-S-27 GGA CGG GTG AGT AAC ACG 18 aS-D-Lab-0158-a-S-20 TGG AAA CAG (A/G) TG CTA ATA CC 12 aS-G-Lab-0159-a-S-20 GGA AAC AG (A/G) TGC TAA TAC CG This study aS-*-Univ-0515-a-A-24 ATC GTA TTA CCG CGG CTG CTG GCA 18 aS-G-Lab-0667-a-A-17 CAC CGC TAC ACA TGG AG This study aS-G-Lacb-0722-a-A-25 (C/T)CA CCG CTA CAC ATG (A/G)AG TTC CAC T 38
GC-clamp CGC CGG GGG CGC GCC CCG GGC GGG GCG 27
GGG GCA CGG GGG G
T7 TAA TAC GAC TCA CTA TAG G Promega
Sp6 GAT TTA GGT GAC ACT ATA G Promega
"Nomenclature according to Aim et al. (1996)
Primer design and PCR conditions. All primers used in this study are listed in Table 2. 16S rDNA sequences of
phylogenetically related species were retrieved from Genbank (www.ncbi.nlm.nih.gov) and used to perform
multiple alignments using Clustal W (46). A potential target site starting at position 677 was selected and based
on this site a 17-mer PCR primer was designed and designated S-G-Lab-0677-a-A-17 (Lab-0677r) according to
the OPD nomenclature (1). A second primer S-G-Lab-0159-a-S-20 (Lab-0159f) was designed based on another
conserved site starting at position 158 targeting Lactobacillus and Enterococcus genera (12). The specificity of
the primers was screened by submitting the sequence to the Check Probe program of Ribosomal Database
Project (www.cme.msu.edu/ RDP) (21), and the ARB software package (41). The genomic DNA of relevant
reference strains and predominant GI tract species was used as the template in PCR experiments to validate the
Lab-0677r and Lab-0159f primer specificities (Table 1).
82

Primers were synthesized commercially by MWG Biotech AG, Ebersberg, FRG. Bacterial primer S-D-
Bact-001 l-a-S-17 (Bact-001 If), formerly named 27f (18) was paired with the designed reverse primer Lab-
0677r, whilst primer Lab-0159f was paired with the universal reverse primer S-*-Univ-0515-b-A-24 with a GC-
clamp (Uni-0515-GCr). The GC-clamp attached at the 5'-end of one of the primers creates products suitable for
separation by DGGE/TGGE. PCR was performed employing the Tag polymerase kit from Life Technologies
(Gaithersburg, MD, USA). PCR mixtures of 50 ul contained 20 mM TRIS-HC1 (pH 8.4), 50 mM KC1, 3 mM
MgCl2, 50 mM each dNTP, 1.25 U of Taq polymerase, 5 pmol of each primer and approximately 250 ng of
genomic DNA isolated from pure cultures. Samples were amplified in a PE Applied Biosytems GenAmp PCR
System 9700 (Foster City, CA, U.S.A.), using the following program: pre-denaturation at 94°C for 5 min; 35
cycles of denaturation 94°C for 30 sec, variable annealing temperature for 20 s, extension at 68°C for 40 sec, and
final extension at 68°C for 7 min.
PCR to investigate the general or Laclobacillus-specific GI tract bacterial community by DGGE, was
performed with the following 16S rDNA primer combinations: S-D-Bact-0124-a-S-27 with a GC-clamp (Bact-
0124-GCf) and Univ-515r, or Lab-0159f and Uni-0515-GCr. Nested PCR was performed with these primers on
previously generated products from amplification with Bact-001 If and Lab-0677r. The cycling program
consisted of 94°C for 5 min; and 35 cycles of 94°C for 30 sec, 56°C for 20 sec, 68°C for 40 min; and finally 7
min at 68°C. PCR products that were used as templates in nested PCR reactions, were purified with the Qiaquick
PCR purification kit (Qiagen, Hilden, FRG) according to the manufacturer's instructions.
DGGE analysis of PCR amplicons. PCR products generated with primers Bact-0124f-GC and Univ-0515r, or
Lab-0159f and Univ-0515r-GC were separated by DGGE according to the specifications of Muyzer et al. (1993)
using the Dcode™ system (Bio-Rad Laboratories, Hercules, Ca., USA) with the following modifications.
Polyacrylamide gels (dimensions 200x200x1 mm) consisted of 8% (v/v) polyacrylamide (37.5:1 acrylamide-
bisacrylamide) and 0.5xTAE (34). Denaturing acrylamide of 100% was defined as 7 M urea and 40%
formamide. The gels were poured from the top using a gradient maker, and a pump (Econopump, BioRad
Laboratories, Hercules, Ca., USA) set at a speed of 4.5 ml/min, and gradients of 30-60% were employed for the
separation of the generated amplicons. Before polymerization of the denaturing gel (28 ml gradient volume), a
7.5 ml stacking gel without denaturing chemicals was added and the appropriate comb was subsequently
inserted. Electrophoresis was performed for 16 hrs at 85 V in a 0.5xTAE buffer at a constant temperature of
60°C. Gels were stained with AgN03 according to Sanguinetti et al. (1994).
Cloning of the PCR-amplifled products. Amplicons derived from PCR with primers Bact-001 If and Lab-0677r,
and nested PCR amplicons were purified with the Qiaquick PCR purification kit according to the manufacturer's
instructions. PCR products were cloned into E. coli JM109 by using the Promega pGEM-T vector system
(Promega, Madison, Wi., USA). White colonies were transferred with a sterile toothpick to an eppendorf tube
containing 20 ul of TE buffer. The cells were lyzed by heating them at 95°C for 15 min. PCR was performed on
the cell-lysates using pGEM-T specific primers T7 and Sp6 to confirm the size of the inserts. The cycling
program consisted of initial denaturation at 94°C for 3 min; 35 cycles of 94°C for 30 sec, 44°C for 30 sec, 68°C
for 90 sec, and a final extension for 7 min at 68°C. To establish the diversity within the group of 25 selected
clones of each origin, amplicons of the correct size were subjected to restriction fragment length polymorphism
83

(RFLP) analysis using the restriction enzyme Mspl. Plasmids containing an unique insert of the appropriate size
or corresponding to a band in the community fingerprint were purified by the QIAprep Spin Miniprep Kit
(Qiagen, Hilden, FRG) and were subjected to DNA sequence analysis.
Sequence analysis. One microgram of purified pGEM plasmid was employed for sequence analysis of the
cloned 16S rDNA fragments. Sequencing reactions were performed using the Sequenase (T7) sequencing kit
(Amersham Life Sciences, Slough, U.K.) according to the manufacturer's specifications using IRD-800 5' end
labelled primers T7 and Sp6. Sequences were automatically analyzed on a LI-COR DNA Sequencer 4000L
(Lincoln, Nb, U.S.A), and corrected manually.
Phylogenetic placement. Phylogenetic analysis was performed using the ARB software package (41).
Sequences were aligned and a rooted neighbor-joining tree (E. coli positions 31-648) was constructed using
Bacillus subtilis as an outgroup species.
Nucleotide sequence accession numbers. Thirty-nine 0.7 kb and nine 0.4 kb sequences of the 16S rDNA
determined in this study were deposited with the GenBank database and assigned the accession numbers;
AF335874 to AF335918, and AF368382 to AF368390, respectively.
RESULTS
Development and evaluation of a Lactobacillus group-specific primer. Based on the
alignment of the complete 16S rRNA sequences of various members of the three recognized
Lactobacillus subgroups (4) and those of several other related lactic acid bacteria, a potential
PCR primer binding site was identified starting at E. coli position 677 of the 16S rDNA
(Table 3). Primer S-G-Lab-0677-a-A-17, complementary to this part of the 16S rRNA, was
designed taking into consideration: the nucleotide mismatches with related species, the
complementarity with the target at the 3'-end, possibly ending with a C, a G+C content of
over 50%, and a size of approximately 20 nucleotides. Sequence comparison using the Check
Probe, ARB and BLAST programs confirmed that the targeted region was conserved only
among all the 16S rRNA sequences of Lactobacillus, Leuconostoc, Pediococcus, Weissella,
and Aerococcus species present in the Ribosomal Database Project and Genbank, except for
L. maltaromicus, L. vitulinus, L. catenaformis and L. helveticus. The first three of the latter
lactobacilli are more related to Clostridium and Carnobacterium spp. than to the genus
Lactobacillus (37). Their exclusion may have only limited consequences since these particular
Lactobacillus spp. as well as members of the Pediococcus, Weissella, and Aerococcus species
are generally not indigenous to the human GI tract. Moreover, specific PCR products were
84

obtained with DNA from two strains of L. helveticus, suggesting that the mismatches found in
the database with the primer, are most likely the result of sequencing errors (see below). The
terminal 3'-end of the primer was also complementary to Eubacterium biforme and E.
cylindroides 16S rDNA sequences. Most importantly, the primer had one mismatch at the
3'end with 16S rDNA sequences of several other related species including some bacteria
commonly found in large numbers in the GI tract, such as Clostridium, Eubacterium,
Bacteroides, and Bifidobacterium spp. that should prevent annealing (Table 3).
Table 3. An alignment of primer S-G-Lab-0667-a-A-17 with target sequences of 16S rDNA (region 667 to 683
of E. coli numbering) from Lactobacillus and other species (3'-5'). The number of species found in the database
is indicated in parentheses. The mismatches with the primer sequence are indicated in bold and are underlined.
S-G-Lab-0667-a-A-17 reverse primer All Lactobacillus spp. subgroups" (94) All Leuconostoc spp. (18) All Weissella spp. (16) All Pediococcus spp. (12) Bacteroides fragilis Bacteroides vulgatus Bifidobacterium bifidum Clostridium coccoides Clostridium perfringens Clostridium ramosum Enterococcus faecalis Eubacterium biforme Eubacterium rectale Lactococcus lactis Staphylococcus aureus Streptococcus thermophilus Vagococcus fluvialis
5'-c ace get aca cat gga g-3' gta agg tgg cga tgt gta cct caa g gta agg tgg cga tgt gta cct caa g gta agg tgg cga tgt gta cct caa g gta aag tgg cga tgt gta cct caa g gta aag tgg cga tgt ggt get taa g gta aag tgg cga tgt ggt get taa g gta agg tgg caa tgt ggc cct taa g gta aag tgg cga tgt gat cct taa g gta aag tgg cga tgt gat cct taa g gta aag tgg cga tgt gta cct taa g gta aag tgg cga tgt gta cct taa g gta aaa tgg cga tgt gta cct caa g gta aag tgg cga tgt gat cct taa g gta aag tgg cga tgt gta cct taa g gta aag tgg cga tgt gta cct taa g gta aag tgg cga tgt gta cct taa g gta aag tgg cga tgt gta cct taa g
"Includes all Lactobacillus species in Genbank, except Lactobacillus maltoromicus, L. catenaformis, and L.
vitulinus.
The primer was experimentally tested by performing PCR on genomic DNA isolated
from a range of Lactobacillus species, related lactic acid and other bacteria, as well as cloned
16S rDNA sequences that have been demonstrated to be present in large numbers in the GI
tract (49). The optimal annealing temperature was empirically determined by raising it in
steps of 2°C from 56°C to 68°C, using genomic DNA of 27 bacterial species and plasmid
DNA from 9 clones (Table 1). The optimum was found to be 66°C and, following a maximum
of 35 cycles, products were obtained with DNA from all tested Lactobacillus, Leuconostoc,
85

and Weissella spp., whereas the 16S rDNA of all other species was not amplified (Table 1).
Table 4. Clones with the percentage of identity to known sequences in Genbank and the RDP database, that
were retrieved from intestinal samples of different origin, using primer-sets Bact-001 If and Lab-0667r (A), and
Lab-0159f and Uni-0515r(B).
Origin Individual Species3 Fragment
Number of Clone (% similarity) Clones
A Fecal Adult
Fecal Infant
Cecal Adult
A
B
C
D E
F
G
H
I J
Total number of clones used for
B Ftca\ Adult K
L
M
Lactobacillus sake Eubacterium biforme Lactobacillus ruminis
Eubacterium biforme Lactobacillus delbrueckii Lactobacillus fermentum Eubacterium biforme
Lactobacillus ruminis Lactobacillus acidophilus Lactobacillus crispatus Lactobacillus rhamnosus Leuconostoc argentinum Lactobacillus casei Lactobacillus salivarius Lactobacillus rhamnosus
Lactobacillus ruminis
Lactobacillus gasseri Lactobacillus vaginalis Leuconostoc mesenteroides Lactobacillus ruminis
phylogenetic analysis
Lactobacillus gasseri Lactobacillus casei Lactobacillus paracasei Lactobacillus ruminis Lactobacillus ruminis Lactobacillus sake Lactobacillus casei Lactobacillus ruminis Lactobacillus ruminis
1 1 4
1 1 1 4
2 2 2 2 2 1 2 3
4
1 2 2 1
39
1 1 1 1 1 1 1 1 1
F45 (98) F44 (98) F68(98), F70(98), F71 (98), F73 (98) F67(97) F93 (98) F81 (99) F83 (97), F85 (97), F87 (98), F96 (98) FI(99),F11 (98) F158 (98), F168 (98) F159 (99), F163 (99) F154(99),F155(97) F160 (98), F165 (99) B121 (99) B123 (99), B129 (99) B103(99),B108(99), B124 (99) S137(99), S144(98), S146(99), S152(98) SI (99) S6 (97), S14 (98) S27 (98), S38 (99) S55 (98)
F706 (99) F703(98) F723 (99) F748(98) F754 (98) F749 (98) F747 (98) F761(99) F763 (98)
"Species were named according to their closest relative.
Biodiversity of the Lactobacillus genus evaluated by Lab-0677r. The diversity of members
of the Lactobacillus genus was investigated using primer S-G-Lab-0677-a-A-17. PCR
products of 0.7 kb were generated using this primer in combination with primer Bact-001 If

on bacterial DNA isolated from fecal and other intestinal samples. Sequence analysis of
unique clones from fecal origin of five healthy adults and an infant showed that sequences
were amplified with significant identity to the 16S rDNA of known Lactobacillus spp. (Table
4). Additionally, samples taken from the cecal chyme during intestinal intubation in four
healthy volunteers were used to study the diversity in this particular part of the GI tract. Ten
clones were analyzed and found to contain sequences similar to Lactobacillus spp., showing
97-99% identity with rRNA database entries. PCR products obtained using bacterial DNA
isolated from feces from an infant resulted in 6 Lactobacillus-like sequences (Table 4).
Among all the sequences retrieved, L. ruminis-Mke sequences were the most frequently
encountered in both fecal and cecal samples. Leuconostoc-like sequences were found in both
fecal and cecal samples, and showed similarity to Leuconostoc mesenteroides and
Leuconostoc argentinum. Eubacterium biforme-\\kz sequences were found in the feces of
three adults (Table 4). A total of 39 sequences were obtained in this approach and these were
used to construct a phylogenetic tree (Fig. 1). This phylogenetic analysis clearly showed that
sequences were retrieved from all three subgroups of the genus Lactobacillus (37). Most
representatives were positioned in the Lactobacillus casei-Pediococcus subgroup (I) and the
majority were most similar to L. ruminis. Sequences retrieved from the infant feces grouped
with L. salivarius, L. rhamnosus, and L. paracasei. Some sequences grouped within the L.
delbrueckii subgroup (II), whilst the Leuconostoc paramesenteroides subgroup (III) was
represented by sequences that were similar to Leuconostoc mesenteroides and Leuconostoc
argentinum. Overall, the sequence-results confirmed the validity of the developed primer.
DGGE analysis of Lactobacillus amplicons. To facilitate rapid monitoring of Lactobacillus-
specific sequences, use was made of sequence-specific separation of PCR amplicons by
DGGE, that requires the presence of a stable GC-clamp attached to one of the primers.
However, a low product yield was observed when either of the primers, Bact-OOllf or Lab-
0677r, was equipped with a GC-clamp. Circumventing the need to perform multiple PCR
amplifications or concentrate samples before DGGE analysis, we opted for the use of a nested
PCR approach. This involved a first round of PCR with primers Bact-OOllf and Lab-0677r
amplifying the Lactobacillus-like community, followed by a second PCR with established
GC-containing universal primers. To prevent amplification of residual genomic DNA or low-
yield aspecific amplicons formed in the first PCR, only samples yielding sufficient product
(15 ng/ul) were used for a second round of PCR with primers Bact-0124-GCf and Uni-0515r.
87

r LabC144 | LabFI I LabC146 : LabF68 if LabC55 I LabC152
Labi II ! UbC137
Lactobacillus ruminis I LabF71
LabF73 1 LabF70
; LabF123 I LabF129
Lactobacillus salivarius l.abUM
LabFlSS LabB124 LabB108 LabB103
Lactobacillus casei M5SS15 Lacobacillus rhamnosus
I Lactobacillus paracasei Lactobacillus casei M23928
•- LabB121 i ~ Lactobacillus sake 1 LabF45
Lactobacillus plantarum LabF158
- LabF168 _ Lactobacillus acidophilus
- LabF159 J LabFlto
Lactobacillus crispatus L ^ Lactobacillus delbrueckii
' LabF93 I Lactobacillus gasseri L LabCI
LabCH —- LabC6
Lactobacillus vaginalis Lactobacillus panis
Lactobacillus pontis Lactobacillus oris
Lactobacillus reuteri - Lactobacillusfermentum
Labi 81 I— LabF160 I Leuconostoc argentinum
] L LabF165
_ J Leuconostoc lactis j LabC27 U LabC38
Leuconostoc mesenteroides j LabF87 V- LabF96
I
II
\ III
Bacillus subtilis
t Eubacterium biforme T^ LabF44 | i LabF67 U LabF83
- LabF85 Eubacterium cylindroides
Fig. 1. Phylogenetic tree based upon the neighbor-joining method of partial 16S rDNA sequences (£. coli
positions 31-648) from clones derived by PCR using primer Bact-OOllf and specific primer Lab-0677r.
Suffixed are F, feces; C, cecal chyme; B, baby. Reference sequences are included which were found to be the
closest relatives of the retrieved clones. Three subgroups are indicated by: I, L. casei-Pediococcus-group; II, L.
delbrueckii-group; III, Leuconostoc paramesenteroides-gxoup. Bacillus subtilis is used as an outgroup. The
scalebar represents (calculated) distance. The origin of the clones is presented in Table 4.

Succession of Lactobacillus spp. following birth. The intestinal microbial community of
infants is developing and therefore highly unstable (7, 20). A study into the development of
the Lactobacillus-like community in babies was performed by PCR with primers Bact-001 If
and Lab-0677r on fecal DNA from baby F from delivery (day 1) to five months later (day
147) at regular intervals. No PCR products were obtained up to day 55, indicating that the
template was either absent or the amount of template was too low to be detected. The PCR
amplicons obtained from day 55 to 147 were used for the nested PCR with primers Bact-
0124-GCf and Uni-0515r, and the resulting 0.4 kb fragments were separated in a 30-60%
DGGE gel (Fig. 2). Two amplicons with different intensity were present from day 55
throughout the experiment and the sequences of these 0.4kb fragments were identical to
clones earlier retrieved from the infant, i.e. B103 (L. rhamnosus) and B121 (L. casei) (Table
4). Successional change was observed with amplicon 3, which was identical to clone B123
(Lactobacillus salivarius), that appeared at day 93 and faded between day 129 and 147.
55 62 75 84 93 108 123 129 147
Fig. 2. Development of the Lactobacillus-like community over time in an infant. DGGE analysis of amplicons
generated by nested PCR from fecal samples taken on day 55 up to day 147. Fragments that are indicated by
arrows and numbers were identified by the Lab-clone library of the infant as described in Table 4. The origin of
the fragments and the corresponding clone are: 1, L. rhamnosus (B103); 2, L. casei (B121); and 3, L. salivarius
(B123).
Effect of consumption of lactobacilli on the Lactobacillus spp. diversity in children. The
fate of orally administered L. paracasei F19 in a clinical trial with children was investigated
using primer Lab-0677r in the nested PCR and DGGE approach as described above. Fecal
samples from children between 10 and 18 months, that were administered 1010 CFU of L.
89

paracasei F19 twice a day for three weeks or a placebo for the same time, were analyzed in a
blind fashion. Although L. paracasei F19 was not detected in the dominant bacterial
community of these young children (47), it could be detected as a double band when the Lab-
0677-specific PCR-DGGE approach was used (Fig. 3). This analysis also revealed that in
some children the specific community is also unstable. This instability of the Lactobacillus-
like community was demonstrated particularly in two individuals and appeared independent
of the L. paracasei F19 administration. In individual I the community was changing
throughout the experiment, but despite this change strain F19 could be detected during the
administration period. In individual III, the double band of strain F19 or a Lactobacillus
species with the same melting-behavior was present even before the trial started and was
enhanced during the experiment. However, after the cessation of placebo-administration (Fig.
3, individual III) it disappeared. In a subject where the Lactobacillus-like community
appeared to be stable (Fig. 3, individual II), the administration of L. paracasei F19 had a
temporary impact on the composition but it returned to its original composition after cessation
of the strain-administration.
+F19 -F19
F19 _HF19
f**3f
Fig. 3. Effect of orally administered L. paracasei F19 on the Laclobacillus-\ike community in time. DGGE
analysis of amplicons generated in a nested PCR with primers Bact-0124-GCf and Uni-0515r. Children were
administered L. paracasei F19 (I, II) or placebo (III, IV) for 4 weeks. Fecal samples were taken before the
experiment (0), after 2 weeks of administration (2), and two weeks after administration had ceased (6). The PCR
amphcon for L. paracasei F19 was concomitantly separated. The fragments in the profiles corresponding to F19
are indicated by the box.
90
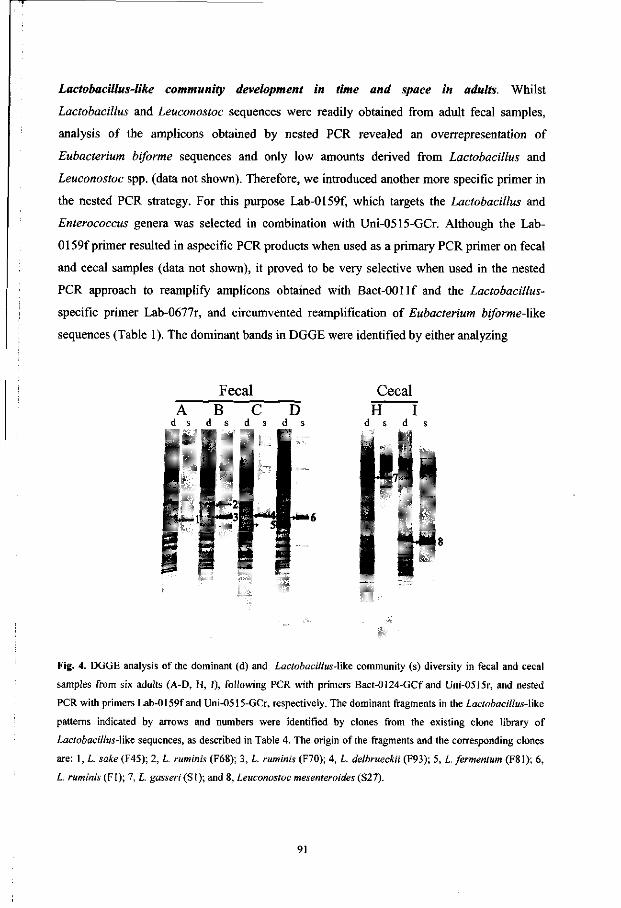
Lactobacillus-like community development in time and space in adults. Whilst
Lactobacillus and Leuconostoc sequences were readily obtained from adult fecal samples,
analysis of the amplicons obtained by nested PCR revealed an overrepresentation of
Eubacterium biforme sequences and only low amounts derived from Lactobacillus and
Leuconostoc spp. (data not shown). Therefore, we introduced another more specific primer in
the nested PCR strategy. For this purpose Lab-0159f, which targets the Lactobacillus and
Enterococcus genera was selected in combination with Uni-0515-GCr. Although the Lab-
0159f primer resulted in aspecific PCR products when used as a primary PCR primer on fecal
and cecal samples (data not shown), it proved to be very selective when used in the nested
PCR approach to reamplify amplicons obtained with Bact-OOllf and the Lactobacillus-
specific primer Lab-0677r, and circumvented reamplification of Eubacterium biforme-like
sequences (Table 1). The dominant bands in DGGE were identified by either analyzing
Fecal Cecal H I
d s d s
Fig. 4. DGGE analysis of the dominant (d) and Lactobacillus-like community (s) diversity in fecal and cecal
samples from six adults (A-D, H, I), following PCR with primers Bact-0124-GCf and Uni-0515r, and nested
PCR with primers Lab-0159f and Uni-0515-GCr, respectively. The dominant fragments in the Lactobacillus-like
patterns indicated by arrows and numbers were identified by clones from the existing clone library of
Lactobacillus-Wke sequences, as described in Table 4. The origin of the fragments and the corresponding clones
are: \,L. sake (F45); 2, L. ruminis (F68); 3, L. ruminis (F70); 4, L. delbrueckii (F93); 5, L.fermentum (F81); 6,
L. ruminis (Fl); 7, L. gasseri (SI); and 8, Leuconostoc mesenteroides (S27).
91
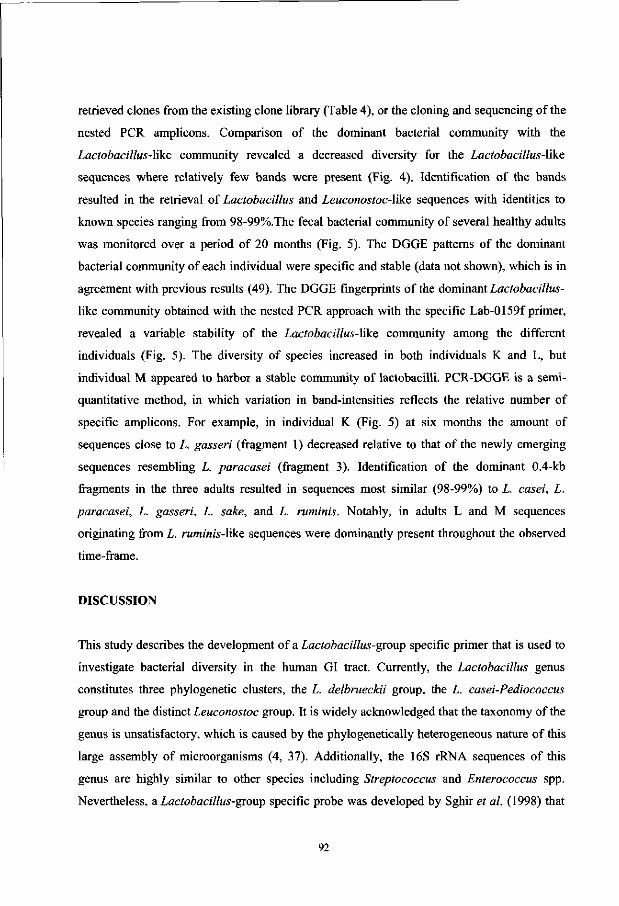
retrieved clones from the existing clone library (Table 4), or the cloning and sequencing of the
nested PCR amplicons. Comparison of the dominant bacterial community with the
Lactobacillus-\ike community revealed a decreased diversity for the Lactobacillus-\ike
sequences where relatively few bands were present (Fig. 4). Identification of the bands
resulted in the retrieval of Lactobacillus and Leuconostoc-like sequences with identities to
known species ranging from 98-99%.The fecal bacterial community of several healthy adults
was monitored over a period of 20 months (Fig. 5). The DGGE patterns of the dominant
bacterial community of each individual were specific and stable (data not shown), which is in
agreement with previous results (49). The DGGE fingerprints of the dominant Lactobacillus-
like community obtained with the nested PCR approach with the specific Lab-0159f primer,
revealed a variable stability of the Lactobacillus-Wkc community among the different
individuals (Fig. 5). The diversity of species increased in both individuals K and L, but
individual M appeared to harbor a stable community of lactobacilli. PCR-DGGE is a semi
quantitative method, in which variation in band-intensities reflects the relative number of
specific amplicons. For example, in individual K (Fig. 5) at six months the amount of
sequences close to L. gasseri (fragment 1) decreased relative to that of the newly emerging
sequences resembling L. paracasei (fragment 3). Identification of the dominant 0.4-kb
fragments in the three adults resulted in sequences most similar (98-99%) to L. casei, L.
paracasei, L. gasseri, L. sake, and L. ruminis. Notably, in adults L and M sequences
originating from L. ruminis-\ike sequences were dominantly present throughout the observed
time-frame.
DISCUSSION
This study describes the development of a Lactobacillus-group specific primer that is used to
investigate bacterial diversity in the human GI tract. Currently, the Lactobacillus genus
constitutes three phylogenetic clusters, the L. delbrueckii group, the L. casei-Pediococcus
group and the distinct Leuconostoc group. It is widely acknowledged that the taxonomy of the
genus is unsatisfactory, which is caused by the phylogenetically heterogeneous nature of this
large assembly of microorganisms (4, 37). Additionally, the 16S rRNA sequences of this
genus are highly similar to other species including Streptococcus and Enterococcus spp.
Nevertheless, a Lactobacillus-group specific probe was developed by Sghir et al. (1998) that
92

was used in dot-blot hybridization, but has only a single mismatch with enterococci,
streptococci and staphylococci. HarmseneJ al. (1999) developed an oligonucleotide probe for
fluorescent in situ hybridization (FISH), that targets the three subgroups and has additional
specificity for some Weissella, Vagococcus and Enterococcus species. Attempts to use the
latter two oligonucleotide probes, being the sense version of S-G-Lab-0158-a-A-20 (13) or
probe S-G-Lacb-0722-a-A-25 (38) directly, as PCR primers resulted in non-specific PCR
products (data not shown). In general it is not possible to use probes as specific primers since
the specific bases of a probe are located centrally, whilst PCR primers harbor their specificity
at the 3'-end, where initial hybridization and elongation takes place. New alignments of the
16S rRNA revealed that a reverse primer S-G-Lab-0677-a-A-17, targeting E. coli positions
677 to 693, would specifically encompass Lactobacillus, Leuconostoc, Weisella, Pediococcus
and Aerococcus. Phylogenetically related genera that are usually present in intestinal samples
in reasonably high numbers like Streptococcus, Enterococcus, Vagococcus, and
Staphylococcus were eliminated, as well as more abundant genera such as Bifidobacterium,
Bacteroides, Eubacterium, and Clostridium.
K L M
i"t)i
20 0 6 20 0 6 20
<« m
. 2 — ' " -»-=-/ h%*
-» 5
Fig. 5. Monitoring of the LactobacillusAike community of adults in time. DGGE analysis of amplicons
generated by nested PCR with primers Lab-0159f and Uni-0515-GCr, originating from three individuals (K, L,
and M) of whom fecal samples were taken at 0, 6, and 20 months. The dominant fragments in Lactobacillus-Y\ke
patterns indicated by arrows and numbers were sequenced and compared to known sequences in Genbank, as
described in Table 4B. The origin of the fragments and the corresponding clones (see Table 4) are: \,L. gasseri
(F706); 2, L. casei (F703); 3, L. paracasei (F723); 4, L. ruminis (F748); 5, L. ruminis (F754); 6, L. sake (F749);
7, L. casei (F747); 8, L. ruminis (F761); and 9, L. ruminis (F763).
93

The specificity of primer S-G-Lab-0677-a-A-17 was established by performing PCR
with this primer on bacterial DNA from pure cultures. This resulted in the formation of
specific amplicons for Lactobacillus, Leuconostoc, Pediococcus and Weissella species.
Additionally, the effectiveness of the primer was confirmed during the investigation of the
diversity of the Lactobacillus sequences in a variety of intestinal samples amplified with
primer Lab-0677r and Bact-OOllf. Notably, no PCR products were obtained from fecal
samples for three out of eight adult subjects suggesting that either the numbers were below the
detection level or Lactobacillus-like species were completely absent. Samples from five
adults of different ages yielded PCR products that were used for cloning and sequencing.
Specific PCR products were also readily obtained when cecal material from the proximal
colon of another four healthy volunteers was used as template. Differences between cecal and
fecal microbiota have been reported in humans with lactobacilli in reasonably high numbers
in the cecum (22, 32).
Previous culturing studies of the human GI tract reported Lactobacillus species similar
to those described here. For example L. fermentum, L. salivarius, and L. casei have been
isolated from both the rectum and the oral cavity (2), whilst L. ruminis, L. paracasei, L.
crispatus, L. vaginalis and L. gasseri were isolated from stools (24, 25, 44). However, none of
the retrieved 16S rRNA sequences were identical to those of known Lactobacillus spp. and
some showed considerable differences. Unexpectedly, a number of sequences in this study
were similar to those of species that are frequently found in fermented food products. L.
delbrueckii and L. acidophilus are known to be present in yoghurt, whilst L. sake is used in
industrial meat and sourdough fermentation (10, 26). Members of the Leuconostoc-group are
also well known for their use in fermented food products and as food-spoilage
microorganisms. Leuconostoc mesenteroides and Leuconostoc argentinum-like sequences
were retrieved from cecal and fecal samples. However, the retrieved intestinal sequences are
not identical to those of starter bacteria, and therefore may be derived from several indigenous
species rather than of transitional nature from ingested foods. Mitsuoka (1992) reported on the
occasional presence of L. ruminis in the GI tract of humans, but L. ruminis-Uke sequences
were found in six out of the thirteen individual samples in this study, indicating that it is a
common GI tract species. As mentioned none of the sequences were identical and in two
clones (F155, S6) the similarity to deposited sequences was only 97%. This indicates that,
although the Lactobacillus genus is considered cultivable, the diversity appears to be still
insufficiently described.
94

As Eubacterium biforme and E. cylindroides are considered to be common
constituents of the adult GI tract (8), this coincidentally prohibits the strict specificity of
primer S-G-Lab-0677-a-A-17 for the 16S rDNA of Lactobacillus clusters. Eubacterium-\ike
sequences were found in fecal samples from three out of five adult individuals, with
similarities ranging from 97-98%. The screened material from cecal origin lacked this
common constituent, which supports the presence of differences in the specific bacterial
communities of the proximal and distal parts of the large intestine as observed from culturing
studies (32).
PCR-DGGE with nested PCR in which primers Bact-0124-GCf and Uni-0515r were
used resulted in an overrepresentation of Eubacterium biforme-\ike sequences. This species is
apparently present in high amounts in adult fecal samples and hence the use of general
bacterial primers in the nested PCR amplified them to large proportions. This almost obscured
the Lactobacillus and Leuconostoc bacterial community (data not shown) which was
demonstrated to be present by the earlier cloning and sequencing results (Table 4). The use of
a second more general Lactobacillus-targeted PCR primer Lab-0159f in a nested approach
readily resulted in the retrieval of only Lactobacillus and Leuconostoc-\\kt sequences which
matched the bands found in DGGE analysis (Figs. 2 and 3, and Table 4). This supported the
earlier cloning results of this study that L. ruminis is a dominant organism. Culture-based
approaches showed that the Lactobacillus-Wke community in the GI tract at the strain level
was highly fluctuating in composition and numbers over time, and was different from
individual to individual (17, 24). The current culture-independent approach reveals a
relatively stable Lactobacillus composition in the three individuals while the relative
proportions could vary considerably in time depending on the individual (24). The 16S rDNA
is a discriminative gene on the species level, but exact copies of sequences for different
strains of the same species can undermine its power for strain detection. Thus, there is a
possibility that for some individuals the stability in time of the Lactobacillus-Wke community
as observed in this study may not fully represent the actual situation on the strain level.
In contrast to adults, PCR with primers Bact-0124GCf and Uni-0515r can efficiently be used
in babies and infants where Eubacterium biforme strains are either absent or in sufficiently
low numbers not to result in a distorted representation of the Lactobacillus community. The
combination of specific PCR and DGGE could effectively demonstrate the succession of the
different LactobacillusAike species for the first five months of an infants' life.
Increasing consumer awareness of the link between diet and health has promoted the
95
introduction of lactic acid bacteria, especially lactobacilli, into functional foods such as
probiotics that may exert an effect in the human GI tract (23, 33). Beneficial influences of
probiotics reported include protection against gastrointestinal infections and inflammatory
bowel disease, anti-allergic effects and other immune-related effects (23). The effect of
consumption of probiotics on the composition of the dominant microbiota was investigated
for several probiotic feeding trials using DGGE which indicated that no extensive changes
occurred (47). This present study clearly demonstrates that specific PCR using S-G-Lab-
0677-a-A-17 followed by DGGE allows monitoring of the presence of a L. paracasei strain
in clinical trials. In conclusion, the strategy described here that combines specific
Lactobacillus PCR with DGGE is widely applicable and elevates this significant group of
bacteria, that is often present in low numbers within an ecosystem, from total community
obscurity.
ACKNOWLEDGEMENTS
The authors wish to thank Drs. Joel Dore, Abdelghani Sghir, and Christine Favier for
providing us with fecal and cecal samples, and DNA from various sources, and the many
volunteers that donated samples. We are grateful to Prof. Rangne Fonden for providing
samples of the ARLA probiotic trial and Dr. Maria Saarela for providing the Lactobacillus
VTT-strains. We are also grateful to Masja Nierop-Groot and Patrick Verbaarschot for
providing us with additional strains. Dr. Hermie Harmsen is especially acknowledged for
providing us the bacterial strains and for helpful discussions on the initial primer design.
This work was supported by grants from the European Community: EC-FAIR-CT96-3035
and EC-FAIR-CT96-1028.
REFERENCES
1. Aim E. W., D. B. Oerther, N. Larsen, D. A. Stahl, and L. Raskin. 1996. The oligonucleotide probe
database. Appl. Environ. Microbiol. 62:3557-3559.
2. Ahrne S., S. Nobaek, B. Jeppson, I. Adlerberth, A. E. Wold, and G. Molin. 1998. The normal
Lactobacillus flora of healthy human rectal and oral mucosa. J. Appl. Microbiol. 85:88-94.
3. Chagnaud P., K. Machinis, L. A. Coutte, A. Marecat, and Y. Mercenier. 2001. Rapid PCR-based
procedure to identify lactic acid bacteria: application to six common Lactobacillus species. J. Microbiol. Meth.
44:139-148.
96

4. Collins M. D., U. Rodrigues, M. Aguirre, J. A. E. Farrow, A. Martinez-Murcia, B. A. Philips, A. M.
Williams, and S. Wallbanks. 1991. Phylogenetic analysis of the genus Lactobacillus and related lactic acid
bacteria as determined by reverse transcriptase sequencing of 16S rRNA. FEMS Microbiol. Lett. 77:5-12.
5. Delley M., B. Mollet, and H. Hottinger. 1990. A DNA probe for Lactobacillus delbrueckeii. Appl. Environ.
Microbiol. 56:1967-1970.
6. Falk P. G., L. V. Hooper, T. Midtvedt & J. I. Gordon. 1998. Creating and maintaining the gastrointestinal
ecosystem: what we know and need to know from gnotobiology. Microbiol. Mol. Biol. Rev. 62:1157-1170.
7. Favier C. F., E. E. Vaughan, A. D. L. Akkermans, and W. M. de Vos. Unpublished results.
8. Finegold S. M., V. L. Sutter, and G. E. Mathisen. 1983. Normal indigenous intestinal flora, p 3-31. In: D.J.
Hentges (ed.). Human intestinal microflora in health and disease. Academic Press, New York, N.Y.
9. Flourie B., C. Florent, J. P. Jouany, P. Thivend, F. Etachaud, and J. C. Rambaud. 1986. Colonic
metabolism of wheat starch in health of humans. Effects on fecal outputs and clinical symptoms.
Gastroenterology 90:111 -119
10. Hammes W. P., A. Bantleon, and S. Min. 1990. Lactic acid bacteria in meat fermentation. FEMS
Microbiol. Rev.87:165-174.
11. Hammes W. P. and R. F. Vogel. 1995. The genus Lactobacillus, p. 19-52. In: B.J.B. Wood and W.H.
Holzapfel (ed.). The genera of lactic acid bacteria; The lactic acid bacteria, Vol. 2. Chapman and Hall, Glasgow,
UK.
12. Harmsen H. J. M., P. Elfferich, F. Schut, and G. W. Welling. 1999. A 16S rRNA- targeted probe for
detection of lactobacilli and enterococci in fecal samples by fluorescent in situ hybridization. Microbiol. Ecol.
Health Dis. 11:3-12.
13. Hensiek R., G. Krupp, and E. Stackebrandt. 1992. Development of diagnostic oligonucleotide probes for
four Lactobacillus species occurring in the intestinal tract. Syst. Appl. Microbiol. 15:123-128.
14. Hertel C , W. Ludwig, M. Obst, R. F. Vogel, W. P. Hammes, and K. H. Schleifer. 1991. 23S rRNA-
targeted oligonucleotide probes for rapid identification of meat lactobacilli. Syst. Appl. Microbiol. 14:173-177.
15. Hooper L. V., M. H. Wong, A. Thelin, L. Hansson, P. G. Falk, and J. I. Gordon. 2001. Molecular
analysis of commensal host-microbial relationships in the intestine. Science 291:881-884.
16. Kane M. D., L. K. Poulsen, and D. Stahl. 1993. Monitoring the enrichment and isolation of sulfate
reducing bacteria by using oligonucleotide hybridisation probes designed from environmentally derived 16S
rRNA sequences. Appl. Environ. Microbiol. 59:682-686.
17. Kimura K., A. L. McCartney, M. A. McConnell, and G. W. Tannock. 1997. Analysis of fecal
populations of bifidobacteria and lactobacilli and investigations of the immunological responses of their human
hosts to the predominant strains. Appl. Environ. Microbiol. 63:3394-3398.
18. Lane D. J. 1991. 16S/23S rRNA sequencing, p. 115-175. In: E. Stackebrandt and M. Goodfellow (ed.).
Nucleic acid techniques in bacterial systematics. J. Wiley & Sons, Chichester, U.K.
19. Langendijk P. S., F. Schut, G. J. Jansen, G. C. Raangs, G. Kamphuis, M. H. F. Wilkinson, and G. W.
Welling. 1995. Quantitative fluorescence in situ hybridisation of Bifidobacterium spp. with genus-specific 16S
rRNA targetted probe and its application in fecal samples. Appl. Environ. Microbiol. 61:3069-3075.
20. Mackie R. I., A. Sghir, and H. R. Gaskins. 1999. Developmental microbial ecology of the neonatal
gastrointestinal tract. Am. J. Clin. Nutr. 69:1035-1045.
97

21. Maidak B. L., G. J. Olsen, N. Larsen, R. Overbeek, M. J. McCaughey, and C. J. Woese. 1997. The RDP
(Ribosomal Database Project). Nucleic Acid Res. 25:109-111.
22. Marteau P., B. Flour ie, C. Cherbut, J. L. Correze, P. Pellier, J. Seylaz, J. C. Rambaud. 1994.
Digestibility and bulking effect of ispaghula husks in healthy humans. Gut 35:1747-1752.
23. Mattila-Sandholm T., S. Blum, J. K. Collins, R. Crittenden, W. M. de Vos, C. Dunne, R. Fonden, G.
Grenov, E. Isolauri, B. Kiely, P. Marteau, L. Morelli, A. Ouwehand, R. Reniero, M. Saarela, S. Salminen,
M. Saxelin, E. Schiffrin, F. Shanahan, E. Vaughan, and A. von Wright. 1999. Probiotics: towards
demonstrating efficacy. Trends Food Sci. Tech. 10:393-399.
24. McCartney A. L., Wang Wenzhi, and G. W. Tannock. 1996. Molecular analysis of the composition of the
bifidobacteria! and Lactobacillus microflora of humans. Appl. Environ. Microbiol. 62:4608-4613.
25. Mitsuoka T. (1992). The human gastrointestinal tract, p. 69-114. In B.J.B. Wood (ed.). The lactic acid
bacteria. Volume 1, The lactic acid bacteria in health and disease. Elsevier Applied Science, London, UK.
26. Miiller M. R. A., M. A. Ehrmann, and R. F. Vogel. 2000. Multiplex PCR for the detection of
Lactobacillus pontis and two related species in a sourdough fermentation. Appl. Environ. Microbiol. 66:2113-
2116.
27. Muyzer G., E. C. de Waal, and G. A. Uitterlinden. 1993. Profiling of complex populations by denaturing
gradient gel electrophoresis of polymerase chain reaction-amplified genes coding for 16S rRNA. Appl. Environ.
Microbiol. 59:695-700.
28. Moore W. E. C , and L. V. Holdeman. 1974. Human fecal flora: the normal flora of 20 Japanese-
Hawaiians. Appl. Microbiol. 27:961-979
29. Osawa R., K. Kuroiso, S. Goto, and A. Shimizu. 2000. Isolation of tannin-degrading lactobacilli from
humans and fermented foods. Appl. Environ. Microbiol. 66:3093-3097.
30. Petrick H. A. R., R. E. Ambrosio, and W. H. Holzapfel. 1988. Isolation of a DNA probe for Lactobacillus
curvatus. Appl. Environ. Microbiol. 54:404-408.
31. Pilloud N., and B. Mollet. 1990. DNA probes for the detection of Lactobacillus helveticus. Syst. Appl.
Microbiol. 13:345-349.
32. Pochart P, F. Lemann, B. Flourie, P. Pellier, I. Goderel, and J. C. Rambaud. 1993. Pyxigraphic
sampling to enumerate methanogens and anaerobes in the right colon of healthy humans. Gastroenterology
108:1281-1285.
33. Salminen S., E. Isolauri, and E. Salminen. 1996. Clinical uses of probiotics for stabilizing the gut mucosal
barrier: successful strains and future challenges. Antonie Leeuwenhoek 70:347-358.
34. Sambrook J., E. F. Fritsch, and T. Maniatis. 1989. Molecular cloning, a laboratory manual, 2"d ed. Cold
Spring Harbor Laboratory, Cold Spring Harbor, N.Y.
35. Sanguinetti C. J., E. Dias Neto, and A. J. G. Simpson. 1994. Rapid silver staining and recovery of PCR
products separated on polyacrylamide gels. Biotechniques 17:915-919.
36. Satokari R. M., E. E. Vaughan, A. D. L. Akkermans, M. Saarela, and W. M. de Vos. 2001.
Bifidobacterial diversity in human feces detected by genus-specific PCR and denaturing gradient gel
electrophoresis. Appl. Environ. Microbiol. 67:504-513.
37. Schleifer K. H. and W. Ludwig. 1995. Phylogenetic relationships of lactic acid bacteria, p. 7-17. In B.J.B.
Wood and W.H. Holzapfel (ed.). The genera of lactic acid bacteria; The lactic acid bacteria, Vol. 2. Chapman
98

and Hall, Glasgow.
38. Sghir A., D. Antonopoulos, and R. I. Mackie. 1998. Design and evaluation of a Lactobacillus group-
specific ribosomal RNA-targeted hybridisation probe and its application to the study of intestinal microecology
in pigs. System. Appl. Microbiol. 21:291-296.
39. Sghir A., G. Gramet, A. Suau, V. Rochet, P. Pochart, and J. Dore\ 2000. Quantification of bacterial
groups within the human fecal flora by oligonucleotide probe hybridisation. Appl. Environ. Microbiol. 66:2263-
2266.
40. Simpson J. M., V. J. McCracken, H. R. Gaskins, and R. I. Mackie. 2000. Denaturing gradient gel
electrophoresis analysis of 16S ribosomal DNA amplicons to monitor changes in fecal bacterial populations of
weaning pigs after introduction of Lactobacillus reuteri strain MM53. Appl. Environ. Microbiol. 66:4705-4714.
41. Strunck O., and W. Ludwig. 1995. ARB - a software environment for sequence data. Department of
Microbiology, Technical University of Munich, Munich, Germany, (http://www.mikro.biologie.tu-
muenchen.de/pub/ARB/documentation/arb.ps).
42. Suau A., R. Bonnet, M. Sutren, J. J. Godon, G. R. Gibson, M. D. Collins, and J. Dore\ 1999. Direct
analysis of genes encoding 16S rRNA from complex communities reveals many novel molecular species within
the human gut. Appl. Environ. Microbiol. 65:4799-4807.
43. Tannock G. W. 1991. The microecology of lactobacilli inhabiting the gastrointestinal tract. Adv. Microbial.
Ecol. 11:147-171.
44. Tannock G. W., A. Tilsala-Timisjarvi, S. Rodtong, J. Ng, K. Munro, and T. Alatossava. 1999.
Identification of Lactobacillus isolates from the gastrointestinal tract, silage, and yoghurt by 16S-23S rRNA
gene intergenic spacer region sequence comparisons. Appl. Environ. Microbiol. 65:4264-4267.
45. Tannock G. W. 1999. Analysis of the intestinal microflora: a renaissance. Antonie van Leeuwenhoek
76:265-278.
46. Thompson J. D., Higgins, D. G. and T. J. Gibson. 1994. CLUSTAL W: improving the sensitivity of
progressive multiple sequence alignment through sequence weighting, position specific gap penalties and weight
matrix choice. Nucleic Acids Res. 22:4673-4680.
47. Vaughan E. E., H. G. H. J. Heilig, E. G. Zoetendal, R. Satokari, J. K. Collins, A. D. L. Akkermans, and
W. M. de Vos. 1999. Molecular approaches to study probiotic bacteria. Trends Food Sci. Tech. 10:400-404.
48. Vaughan E. E., F. Schut, H. G. H. J. Heilig, E. G. Zoetendal, W. M. de Vos, and A. D. L. Akkermans.
2000. A molecular view of the intestinal ecosystem. Curr. Issues Intest. Microbiol. 1:1-12.
49. Zoetendal E. G., A. D. L. Akkermans, and W. M. de Vos. 1998. Temperature gradient gel electrophoresis
analysis of 16S rRNA from human fecal samples reveals stable and host-specific communities of active bacteria.
Appl. Environ. Microbiol 64:3854-3859.
50. Zoetendal E. G., A. D. L. Akkermans, and W. M. de Vos. 2001. Molecular characterisation of microbial
communities based on 16S rRNA sequence diversity, p. 267-298. In: L. Dijkshoorn, K. Towner, and M.
Struelens (ed.). New approaches for the generation and analysis of microbial typing data, chapter 11. Elsevier.
99

Chapter 6
The Host Genotype Affects the Bacterial Community in the
Human Gastrointestinal Tract
Erwin G. Zoetendal, Antoon D. L. Akkermans, Wilma M. Akkermans-van Vliet, J. Arjan G M.
de Visser, and Willem M. de Vos
Microbial Ecology in Health and Disease 13: 129-134 (2001)
Reprinted with permission of Taylor & Francis Group.
101

Abstract
The gastrointestinal (GI) tract is one of the most complex ecosystems consisting of
microbial and host cells. The host genotype, the physiology of the host, and
environmental factors are suggested to affect the composition and function of the
bacterial community in the intestine. However, the relative impact of these factors is
unknown. In this study, we used a culture-independent approach to analyze the
bacterial composition in the GI tract. Denaturing gradient gel electrophoresis (DGGE)
profiles of fecal bacterial 16S rDNA amplicons from adult humans with varying degrees
of genetic relatedness were compared by determining the similarity indices of the
profiles compared. The similarity between fecal DGGE profiles of monozygotic twins
were significantly higher than those for unrelated individuals (*s=2.73, P/.(flfl=0.0063,
d.f.=21). In addition, a positive relationship (Fi30=8.63, P=0.0063) between the similarity
indices and the genetic relatedness of the hosts was observed. In contrast, fecal DGGE
profiles of marital partners, which are living in the same environment and which have
comparable feeding habits, showed low similarity which was not significantly different
from that of unrelated individuals (4=1.03, Pi-tau=Q.1561, d.f.=27). Our data indicate that
factors related to the host genotype have an important effect on determining the
bacterial composition in the GI tract.
102
INTRODUCTION
While prokaryotes are the most abundant form of life on our planet (1), it is also well known
that microbes are present in vast amounts in the animal gastrointestinal (GI) tract where they
often exceed the number of host cells (2). Therefore, they live in very close contact with each
other and with the epithelial cells of the host. The succession of this complex microbial
community starts after birth when empty niches become colonized by the first invading fast-
growing microbes. Successive shifts of different microbial populations finally result in a
climax community (3, 4). Although most of the interactions in the GI tract are still unknown,
several studies indicate that signaling between host and microbes is very important in this
ecosystem (5, 6). Recently, the molecular details of the communication between Bacteroides
thetaiotaomicron and its murine host have been elucidated (7-9). Furthermore, it has been
reported for various animal systems that the presence of methanogens in the intestine is a
phylogenetic character that obeys 'Dollo's rule', i.e. traits that are lost in the course of
evolution do not appear in any of the descendants of the common ancestor that lost these traits
(10, 11). On the other hand, a recent study with humans and rats has indicated that shared and
unique environmental conditions are important in the ecology of methanogens (12). These
rather contradicting observations indicate the complexity of the ecology of methanogens in
the GI tract. It is at least remarkable that only a fraction of humans harbors significant
numbers of intestinal methanogens (13). Moreover, it has been established that each
individual harbors specific strains of Helicobacter pylori or Bifidobacterium and
Lactobacillus spp. (14, 15). All these observations argue strongly for the genetic
predisposition of the host determining the composition in the GI tract.
A serious problem that limits the global analysis of the whole GI tract community is
the inability to isolate and characterize all microbes. Viable plate count techniques only reveal
a minor fraction of the GI tract community (16-18). Hence, analysis of the contribution of the
host in determining the microbial composition in the GI tract requires the application of
culture-independent techniques. These are mainly based on the sequence variability of 16S
rRNA genes that have shown to be useful phylogenetic markers (19-21). Recently, it has been
shown that the dominant bacterial community in feces remains stable in time (22, 23). In
addition, temperature or denaturing gradient gel electrophoresis (TGGE or DGGE) of the
PCR-amplified sequences of fecal 16S rRNA and rDNA indicated that the bacterial
composition was host-specific (22).
103

To study whether factors related to the genetic predisposition of the host rather than
environmental factors determine a host-specific composition in the GI tract, we analyzed fecal
samples from human individuals with different degrees of genetic relatedness, varying from
monozygotic twins to marital partners, and four non-human primate species. Although fecal
samples do not reflect the bacterial composition in all parts of the GI tract, the majority of
bacteria leaves the GI tract via the fecal route and therefore an observed effect on the fecal
composition reflects an GI tract-related effect. The V6 to V8 regions of the 16S rDNA were
amplified using fecal DNA as template and the amplicons were analyzed by DGGE (24, 25).
Similarity indices between the DGGE profiles were calculated and statistical analyses were
performed.
MATERIALS AND METHODS
Fecal sample collection. Fecal samples from fifty adult human volunteers (21 to 56 years) with varying genetic
relationships (from mono- and dizygotic twins to genetically unrelated individuals) were collected after
defecation in sterile plastic bags or collection tubes, and processed or transported to the lab as fast as possible, or
stored at -20°C until use (freezing did not affect the procedures). In addition, fresh fecal samples were collected
from four other primates (gorilla, chimpanzee, macaque, and orangutan) and transported immediately from the
zoo to the lab. Fecal samples from genetically related individuals were analyzed only if they were living at
separate locations. Individuals older than 60 years were not included, since it has been suggested that the
physiological conditions of aging people affects the microbial community (26). In addition, two fecal samples
were taken in a four months period from each of four unrelated human adults in order to assess the temporal
stability of the fecal community.
DNA isolation, PCR, and DGGE analysis. The DNA isolation from fecal samples was performed as described
previously (22). One microliter of the fecal DNA solution was 10 times diluted and subsequently used as
template to amplify the V6 to V8 regions of 16S rDNA using primers F-0968-GC and R-1401 (27). DGGE
analysis of the amplicons was performed on 8% polyacrylamide gels containing a urea plus formamide gradient
from 38% to 48% (100% denaturing solution contains 7 M urea and 40% (vol/vol) formamide). Electrophoresis
was performed in 0.5 x TAE at 85 V at 60°C for 16 hours using the DCode or D GENE System apparatus
(BioRad, Hercules, CA). After electrophoresis, gels were silver-stained according to the protocol of Sanguinetti
and colleagues (28) with some minor modifications.
Calculating similarity indices and statistical analysis. DGGE gels were scanned at 400 dpi and the software of
Molecular Analyst 1.12 (Biorad) was used for comparing the DGGE profiles. Similarity indices of the compared
profiles were calculated from the densitometric curves of the scanned DGGE profiles by using the Pearsons
product-moment correlation coefficient (29). This procedure was performed three times. In this way,
104

comparisons were made between fecal samples originating from human individuals with different degrees of
genetic relatedness, with different ages, living in similar or different environments, four non-human primate
species. In addition, fecal samples taken in a four months period were compared to access the temporal stability
of the host-specific bacterial community. To obtain independent comparisons for statistical analysis, a random
set of comparisons was selected from each gel in which each DGGE profile occurred only once. Regression
analysis and student's t-tests were performed for statistical analysis of the data.
RESULTS
Comparison between fecal samples from monozygotic twins, marital partners, unrelated
individuals, and non-human primates. To study whether factors related to the genetic
predisposition of the host rather than environmental factors determine a host-specific
composition in the GI tract, fecal samples from human individuals with identical genetic
relatedness (monozygotic twins), with similar environmental conditions (marital partners),
and unrelated individuals were analyzed. Amplicons of the variable regions V6 to V8 were
analyzed by DGGE, resulting in complex profiles which represent the host-specific dominant
bacterial communities in which each band in a profile represents at least one unique bacterial
16S rDNA sequence (Fig. 1).
Twin A Twin B Family C
M Tl T2 T3 T4 M P5 T5 T6 P6 M
p^-^Uia *=i ua
Fig. 1. DGGE profiles of the V6 to V8 regions of 16S rDNA from fecal samples of monozygotic twins (Tl and
T2, T3 and T4, T5 and T6) and marital partners (T5 and P5, T6 and P6). Twin A, Twin B, and Family C indicate
the three different families. M indicates the marker for DGGE analysis.
105

The DGGE profiles of fecal 16S rDNA amplicons from monozygotic twins from three
different families showed higher similarity within twin couples than between twin couples
(Table 1). In addition, the similarity between the marital partners within family C was
relatively low compared to the similarity within each twin couple.
Table 1. Similarity matrix calculated from the DGGE profiles of figure 1. T indicates a member of a
monozygotic twin and P indicates the marital partner of the twin member. Tl and T2; T3 and T4; and T5, T6,
P5, and P6 are members of respectively Twin A, Twin B, and Family C. Similarity indices of monozygotic twins
are highlighted and underlined, similarity indices of marital partners are highlighted only.
P6
Tl
T2
T3
T4
P5
T5
T6
P6
Tl
100
81.2
36.1
47.4
13.4
30.0
32.4
50.2
T2
100
44.9
45.1
11.8
35.5
34.5
50.5
T3
100
14.1
18.9
58.3
62.1
60.8
T4
100
23.3
59.4
45.5
75.7
P5
100
17.2
16.7
19.0
T5
100
62.8
52.1
T6
100
45.2 100
In general, the similarity indices of all monozygotic twins (N=6) were significantly
higher than those of genetically unrelated individuals (4=2.73, P/_to,/=0.0063, d.f.=21), despite
some occasional observations of high similarity indices for genetically unrelated individuals
(Fig. 2.). On the other hand, a comparison between the fecal communities of the marital
partners did not show significant higher similarities than those for unrelated persons (4=1.03,
P'i-taii=0.1561, d.f.=27) notwithstanding the fact that the partners lived in the same
environment and had in general comparable feeding habits (based on questionnaires). This
may indicate that factors related to the host genotype or to the sex difference of the
individuals compared have a significant influence on the bacterial community in the human
GI tract. However, no significant difference was observed between the similarity indices of
unrelated persons of the same sex and those of different sexes (4=0.41, P2-iair0.69, d.f.=15).
This strongly argues for factors related to the host genotype to have an important effect on the
106

GI tract composition. In addition, the similarity between the bacterial communities of
genetically unrelated individuals was significantly higher than that of humans compared with
other primates that we consider as the baseline level (ts=3.99, P;.to,/=0.0004, d.f.=19).
0 10 20 30 40 50 60 70 80 90 100 1 '•••i ' ' ' In mi ml It I I I Similarity Index (Xav±SD)
H Temporal variation (N=4)
Monozygotic twins (N=6)
Marital partners (N=12)
Unrelated persons (N=17)
Human and other primate comparison (N=4)
Fig. 2. Plot of the similarity indices from the human and primate, unrelated individuals, monozygotic twins,
marital partners, and temporal variation comparisons. The mean (bullet) ± standard deviation (black bar) are
plotted.
DGGE analysis of feces from individuals with varying degrees of genetic relatedness. To
study the impact of the genetic predisposition of adult humans in more detail, similarity
indices were calculated for comparisons between DGGE profiles of fecal samples from
individuals with varying degrees of genetic relatedness (Fig. 3). The similarity between the
DGGE profiles of fecal samples appears to show a positive linear relationship with the genetic
relatedness (r) between those individuals (Fi3o=8.63, P=0.0063), despite the high variation
within the similarity indices of individuals with the same genetic relatedness. For example,
the SD of the similarity indices for r = 0 (genetically unrelated) and r = 0.5 (brother and
sisters, parents and children) are 14.7 and 16.4 respectively. These high variations could be
caused by a variety of factors, such as age, diet, condition of the host, and experimental errors.
The variation caused by replicate DNA isolation, PCR amplification, and DGGE analysis was
found to be small and did not exceed a SD of 3.1.
The positive relationship between the similarity indices of fecal DGGE profiles and
the genetic relatedness between the hosts compared indicates that factors related to the genetic
predisposition of the host have a significant influence on the bacterial composition in feces.
However, since the mean age difference between the individuals decreases with an increasing
107
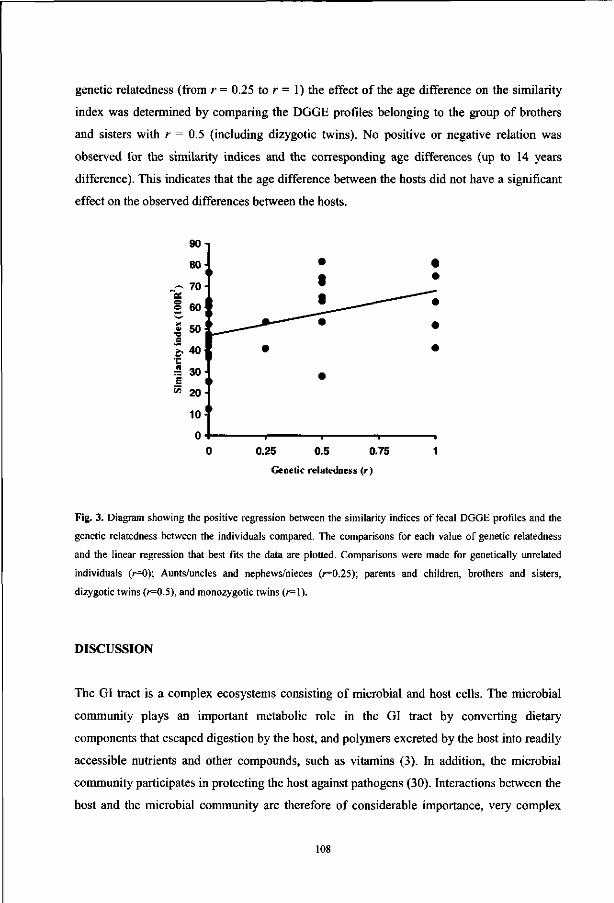
genetic relatedness (from r = 0.25 to r = 1) the effect of the age difference on the similarity
index was determined by comparing the DGGE profiles belonging to the group of brothers
and sisters with r = 0.5 (including dizygotic twins). No positive or negative relation was
observed for the similarity indices and the corresponding age differences (up to 14 years
difference). This indicates that the age difference between the hosts did not have a significant
effect on the observed differences between the hosts.
0.25 0.5 0.75 Genetic relatedness (r)
Fig. 3. Diagram showing the positive regression between the similarity indices of fecal DGGE profiles and the
genetic relatedness between the individuals compared. The comparisons for each value of genetic relatedness
and the linear regression that best fits the data are plotted. Comparisons were made for genetically unrelated
individuals (r=0); Aunts/uncles and nephews/nieces (r=0.25); parents and children, brothers and sisters,
dizygotic twins (r=0.5), and monozygotic twins (r=\).
DISCUSSION
The GI tract is a complex ecosystems consisting of microbial and host cells. The microbial
community plays an important metabolic role in the GI tract by converting dietary
components that escaped digestion by the host, and polymers excreted by the host into readily
accessible nutrients and other compounds, such as vitamins (3). In addition, the microbial
community participates in protecting the host against pathogens (30). Interactions between the
host and the microbial community are therefore of considerable importance, very complex
108

and just starting to be understood (5, 7-9). In the current study, we describe a culture-
independent analysis of the dominant bacterial composition in the GI tract based on the 16S
rRNA sequence variability of bacteria. DGGE and related electrophoretic analyses of 16S
rDNA amplicons have shown to be powerful in studying the ecology of bacteria in different
ecosystems including the GI tract (reviewed by 31, 32). In a previous study, we have shown
that the diversity and stability of bacterial communities in the human GI tract could easily be
analyzed using such an approach (22). In addition, the determination of similarity indices for
DGGE profiles has shown to be a suitable tool to make the comparisons objectively (33, 34).
In the current study, we determined the similarity indices of fecal DGGE profiles from hosts
with varying degrees of genetic relatedness. It was observed that the host genotype has a
significant effect on determining the dominant bacterial composition in the GI tract. The
effect of the environment seems to be of less importance as indicated by the similarity indices
of the bacterial communities between monozygotic twins and marital partners.
A strong positive correlation between the similarity indices and the genetic relatedness
of the hosts was found, suggesting that either the host genotype or the colonization history,
presumably via the fecal oral route from mother to child, has a significant effect on the
bacterial composition in the GI tract. Another possible factor influencing the fecal comparison
could be the age difference between the hosts compared. As reported previously, the fecal
communities might be affected by the physiological conditions of aging people (26).
Therefore, individuals older than the arbitrary 60 years were excluded from this study. Since
no significant relationship was found for the age differences between brothers and sisters with
r = 0.5 and the corresponding similarity indices, it is not likely that our findings can be
explained by the effect of age differences. Furthermore, the combination of previous findings
that the bacterial community in adults is stable in time (22, 23) and the fact that all genetic
relatives in this study are already living separately for a long period of time (more than 5
years, some more than 15 years) also argues for a strong effect of the host genotype.
Our findings may explain why the fecal composition is host-specific and stable in time
in adults, and the presence or absence of certain strains in the GI tract as described previously
(10, 11, 13-15, 22). Currently, we can only speculate if immunological properties of the host,
specific receptors for GI tract bacteria, or other communication systems between the host and
the microbial community are responsible for the observed findings. Recently, the molecular
details of the communication between Bacteroides thetaiotaomicron and its gnotobiotic
murine host have been elucidated (7-9). Unfortunately, such studies can only be performed
109

under well-controlled laboratory conditions and cannot be used to study the communication
between humans and the GI tract community. Nevertheless, it is evident that the composition
of the GI tract community is not only affected by the colonization history, the physiological
(aging) effects in the GI tract and environmental factors, but also by the host genotype.
Therefore, the effects of the consumption of for example probiotics or prebiotics may be
difficult to determine in different individuals as a consequence of the variation in the bacterial
community in the GI tract. To correct for these host-specific effects, the volunteers in a
feeding trial should include individuals which are genetically closely related.
ACKNOWLEDGEMENTS
We thank Mr. P. Knossenburg for assistance in standardizing the application of the Molecular
Analyst software to analyze DGGE profiles, Mr. G. H. J. Heilig for technical assistance, Dr.
G. Welling and Dr. H. Harmsen for discussions, and Dr. G. W. Tannock and Dr. J. H. P.
Hackstein for critically reading the manuscript. In addition, we thank all volunteers and Ms.
M. Spaans (Burger's Zoo, Arnhem, the Netherlands) for providing fecal samples.
REFERENCES
1. Whitman W. B., D. C. Coleman, and W. J. Wiebe. 1998. Prokaryotes: The unseen majority. Proc. Natl.
Acad. Sci. USA 95:6578-6583.
2. Savage D. C. 1977. Microbial ecology of the gastrointestinal tract. Ann. Rev. Microbiol. 31:107-133.
3. Tannock G. W. 1995. Normal microflora. An introduction to microbes inhabiting the human body. Chapman
and Hall, London.
4. Mackie R. I., A. Sghir, and H. R. Gaskins. 1999. Developmental microbial ecology of the neonatal
gastrointestinal tract. Am. J. Clin. Nutr. 69(suppl):1035S-1045S.
5. Falk P. G., L. V. Hooper, T. Midtvedt, and J. I. Gordon. 1998. Creating and maintaining the
gastrointestinal ecosystem: What we know and need to know from gnotobiology. Microbiol. Mol. Biol. Rev.
62:1157-1170.
6. Strauss E. 1999. Microbes feature as pathogens and pals at gathering. Science 284:1916-1917.
7. Bry L, P. G. Falk, T. Midtvedt, and J. I. Gordon. 1996. A model of host-microbial interactions in an open
mammalian ecosystem. Science 273:1381-1383.
8. Hooper L. V., J. Xu, P. G. Falk, T. Midtvedt, and J. I. Gordon. 1999. A molecular sensor that allows a gut
commensal to control its nutrient foundation in a competitive ecosystem. Proc. Natl. Acad. Sci. USA 96:9833-
9838.
9. Hooper L. V, M. H. Wong, A. Thelin, L. Hansson, P. G. Falk, and J. I. Gordon. 2000. Molecular analysis
110

of host-microbial relationships in the intestine. Science 291:881-884.
10. Hackstein J. H. P. and C. K. Stumm. 1994. Methane production in terrestrial arthropods. Proc. Natl. Acad.
Sci. USA 91:5441-5445.
11. Hackstein J. H. P. and T. A. van Alen 1996. Fecal methanogens and vertebrate evolution. Evolution
50:559-572.
12. Florin T. H. J., G. Zhu, K. M. Kirk, and N. G. Martin. 2000. Shared and unique environmental factors
determine the ecology of methanogens in humans and rats. Am. J. Gastroenterol. 95:2872-2879.
13. Miller T. L. and M. J. Wolin. 1986. Methanogens in human and animal intestinal tracts. Syst. Appl.
Microbiol. 7:223-229.
14. McCartney A. L., W. Wenzhi, and G. W. Tannock. 1996. Molecular analysis of the composition of the
bifidobacterial and Lactobacillus microflora of humans. Appl. Environ. Microbiol. 62:4608-4613.
15. Covacci A., J. L. Telford, G. Del Giudice, J. Parsonnet, and R. Rappouli. 1994. Helicobacter pylori
virulence and genetic geography. Science 284:1328-1333.
16. McFarlane G. T. and G. R. Gibson. 1994. Metabolic activities of the normal colonic microflora In: Human
Health: Contribution of Micro Organisms, pp.17-38, ed. S. A. W. Gibson, Springer, Frankfurt..
17. Langendijk P. S., F. Schut, G. J. Jansen, G. C. Raangs, G. R. Camphuis, M. F. Wilkinson, and G. W.
Welling. 1996. Quantative fluorescence in situ hybridization of Bifidobacterium spp. with genus-specific 16S
rRNA-targeted probes and its application in fecal samples. Appl. Environ. Microbiol. 61:3069-3075.
18. Wilson K. H. and R. H. Blitchington. 1996. Human colonic biota studied by ribosomal DNA sequence
analysis. Appl. Environ. Microbiol. 62:2273-2278.
19. Amann R. I., W. Ludwig, and K-H. Schleifer. 1995. Phylogenetic identification and in situ detection of
individual cells without cultivation. Microbiol. Rev. 59:143-169.
20. Woese C. R. 1987. Bacterial Evolution. Microbial Rev. 51:221-271.
21. Woese C. R. 1990. A definition of the domains Archaea, Bacteria, and Eucarya in terms of small subunit
ribosomal characteristics. System. Appl. Microbiol. 14:305-310.
22. Zoetendal E. G, A. D. L. Akkermans, and W. M. de Vos. 1998. Temperature gradient gel electrophoresis
analysis from human fecal samples reveals stable and host-specific communities of active bacteria. Appl.
Environ. Microbiol. 64:3854-3859.
23. Franks A. H, H. J. M. Harmsen, G. C. Raangs, G. J. Jansen, F. Schut, G. W. Welling. 1998. Variations
of bacterial populations in human feces measured by fluorescent in situ hybridization with group-specific 16S
rRNA-targeted oligonucleotide probes. Appl. Environ. Microbiol. 64:3336-3345.
24. Fischer S. G. and L. S. Lernian. 1979. Lenght-independent separation of DNA restriction fragments in two-
dimensional gel electrophoresis. Cell 16:191-200.
25. Muyzer G, E. C. de Waal, and G. A. Uitterlinden. 1993. Profiling of complex populations by denaturating
gradient gel electrophoresis analysis of polymerase chain reaction-amplified genes coding for 16S rRNA. Appl.
Environ. Microbiol. 59:695-700.
26. Mitsuoka T. 1992. Intestinal flora and aging. Nutrition Rev. 50:438-446.
27. NUbel, U., B. Engelen, A. Felske, J. Snaidr, A. Wieshuber, R. I. Amann, W. Ludwig, and H. Backhaus.
1996. Sequence heterogeneities of genes encoding 16S rRNAs in Paenibacillus polymyxa detected by
temperature gradient gel electrophoresis. J. Bacteriol. 178:5636-5643.
I l l
28. Sanguinetti C. J., E. Dias Neto E, and A. J. G. Simpson. 1994. Rapid silver staining and recovery of PCR
products separated on polyacrylamide gels. Biotechniques 17:915-919.
29. Hane B. G., K. Jager. and H. Drexler. 1993. The pearson product-moment correlation coefficient is better
suited for identification of DNA fingerprint profiles than band matching algorithms. Electrophoresis 14:967-972.
30. van der Waaij D., J. M. Berghuis-de Vries, and J. E. C. Lekkerkerk-van der Wees. 1971. Colonization
resistance of the digestive tract in conventional and antibiotic-treated mice. J. Hyg. 67:405-411.
31. Muyzer G. and K. Smalla. 1998. Application of denaturing gradient gel electrophoresis (DGGE) and
temperature gradient gel electrophoresis (TGGE) in microbial ecology. Antonie van Leeuwenhoek 73:127-141.
32.Vaughan E. E., F. Schut, G. H. J. Heilig, E. G. Zoetendal, W. M. de Vos, and A. D. L. Akkermans.
2000. A molecular view of the intestinal ecosystem. Curr. Issues Intest. Microbiol. 1:1-12.
33. Murray A. E. C. M. Preston, R. Massana, L. T. Taylor, A. Blakis, K. Wu, and E. F. de Long. 1998.
Seasonal and spatial variability of bacterial and archaeal assemblages in the coastal waters near Avers island,
Antarctica. Appl. Environ. Microbiol. 64:2585-2595.
34. Simpson J. M., V. J. McCracken, B. A. White, H. R. Gaskins, and R. I. Mackie. 1999. Application of
denaturing gradient gel electrophoresis for the analysis of the porcine gastrointestinal microbiota. J. Microbiol.
Methods 36:167-179.
112

Chapter 7
The Attached Bacterial Community from the Human
Gastrointestinal Tract is Uniformly Distributed Along the Colon
and Differs From the Fecal Community
Erwin G. Zoetendal, Attevon Wright, Terttu Vilpponen-Salmela, Kaouther Ben-Amor, Antoon
D. L. Akkermans, and Willem M. de Vos
Submitted
113
Abstract
Background-The human gastrointestinal tract harbors a complex community of
bacterial cells in the mucosa, lumen, and feces. Since most attention has been focused on
bacteria present in feces, knowledge about the mucosa-associated bacterial community
at different parts in the colon is limited to a few studies based on culturing approaches.
Aim-To analyze the bacterial composition in feces and biopsies from the ascending,
transverse, and descending colon using molecular approaches based on 16S rRNA
sequence diversity.
Subjects- The group of individuals from which fecal and colonic biopsy samples were
taken include six healthy individuals (43-70 years) and four individuals diagnosed with
ulcerative colitis or polyposis (30-79 years).
Methods-DNA was isolated from biopsy and fecal samples. Denaturing gradient gel
electrophoresis (DGGE) analysis of the PCR-amplified V6 to V8 regions of 16S rDNA,
which reflects the predominant community, and Lactobacillus group-specific 16S rDNA
amplicons were analyzed. Similarity indices were calculated to compare the DGGE
profiles.
Results-Flow cytometric analysis indicated that 10s - 106 bacteria were present in the
biopsy samples. DGGE analysis and similarity index comparisons demonstrated that the
predominant mucosa-associated bacterial community was host-specific, equally
distributed along the colon but significantly different from the fecal community
(p<0.01). The Lactobacillus group-specific profiles were less complex than the profiles
reflecting the predominant community. In six of the ten individuals the Lactobacillus
group community in the biopsies was similar to the fecal community while in three
individuals some minor differences between the biopsies could be detected. No
significant differences were observed between the healthy and diseased individuals.
Conclusions-The observed host-specific DGGE profiles of the mucosa-associated
bacterial community in the colon support the hypothesis that host-related factors are
involved in the determination of the GI tract microbial community.
114
INTRODUCTION
The human gastrointestinal (GI) tract harbors a diverse microbial community which mainly
consists of obligate and facultative anaerobic bacteria. These bacteria have an important
metabolic and protective function in the GI tract (1). The complex interactions between the
host and the bacterial community are of considerable importance, but just starting to be
understood (2-4). Most knowledge about the bacterial community in the human GI tract has
been obtained by selective cultivation of microbes from fecal samples. Recently, culture-
independent approaches using the sequence variability of the 16S ribosomal RNA genes have
shown that most of the predominant bacteria in human fecal samples have not been obtained
in culture yet, which indicates that our knowledge about these predominant members is very
limited (5-7). In addition, denaturing and temperature gradient gel electrophoresis
(DGGE/TGGE) analysis of fecal 16S rDNA and rRNA amplicons has shown to be powerful
approaches in determining and monitoring the bacterial community in feces (6, 8). Such
studies revealed that the predominant bacterial community in mammalian feces is stable in
time, host-specific, affected by aging, and not altered after consumption of certain probiotic
strains (6, 8-12). Furthermore, DGGE has been used to compare bacterial communities in
fecal samples from infants with and without necrotizing enterocolitis (NEC), although no
NEC-associated differences were observed (13).
Our present knowledge of the bacterial diversity associated with the human GI tract is
mainly based on analysis of fecal samples and in a few cases samples have been characterized
that originated from different parts of the intestine. Most of these analyses with contents from
sudden-death victims (14) or with biopsy samples from living individuals involved a culturing
approach and focused on the attachment of certain probiotic strains (15-17), presence of
sulfate reducers (18-19) and/or on bacterial population level in diseased persons (20). Since
biopsy samples are very small in size and therefore more easily exposed to oxygen during
sampling, the number of viable strict anaerobes might be reduced easily. Not surprisingly,
relatively high levels of facultative anaerobes were reported to be present in intestinal
biopsies. So far, no studies exist in which the bacterial composition of biopsy samples has
been analyzed at species level. Molecular approaches based on the sequence variability of 16S
rRNA genes could be instrumental to analyze the bacterial composition in intestinal biopsy
samples. Recently, such an approach was used to study the bacterial diversity within the
human subgingival crevice (21). In another recent study, temporal temperature gradient gel
115

electrophoresis analysis of 16S rDNA fragments was successfully used to compare the
bacterial composition in gastric biopsy samples and showed that Helicobacter is detectable in
healthy individuals and those suffering from gastritis (22).
The aim of our research was to determine whether the bacterial composition in colonic
biopsy samples was significantly different from that in fecal samples and to investigate
whether composition differences could be detected at different locations in the colon. We
used DGGE approaches to characterize the 16S rDNA sequence variability of predominant
bacterial composition and that of the Lactobacillus-like species using general and specific
PCR primers (6, Chapter 5). The compositional variability was studied in feces and colonic
biopsy samples from the ascending, transverse, and descending colon of ten volunteers. Since
it appeared after diagnosis that four persons suffered from a colonic disorder, we also
investigated if significant differences could be found between these persons and those without
a diagnosed colonic disease.
MATERIALS AND METHODS
Experimental approach. To describe the bacterial diversity in fecal and biopsy samples a 16S rRNA approach
was used. DNA was isolated from these samples derived from the same individual and the V6 to V8 regions
were PCR-amplified using general primers and analyzed using DGGE. After scanning of the gels, similarity
indices of DGGE profiles were compared and statistically analyzed. In addition, a specific PCR was performed
to amplify the V2 to V4 region of the Lactobacillus group that subsequently were separated by DGGE. To
quantify the number of bacteria per biopsy a flow cytometric approach was used.
Volunteers. Fecal and biopsy samples from ten adult human volunteers were collected as fresh as possible. The
ten volunteers donating biopsy- and fecal samples were patients coming to a routine diagnostic colonoscopy. The
procedure normally includes taking of biopsies, and so the study did not cause any extra risk, pain or discomfort
to the participants. Informed consent was obtained from each volunteer before the sampling. The group consisted
of five men and five women (table 1). With the exception of various gastrointestinal symptoms, for which they
came to the examination, they considered themselves healthy. They did not follow any special dietary regime,
and none had recently received any antibiotic treatment.
Colonoscopy, fecal sample collection, and treatment of samples. The colonic evacuation before the
colonoscopy was performed using a laxative (Colonsteri, Orion Oy, Finland) according to the instructions of the
manufacturer. The instrument used for the actual colonoscopy and sampling of biopsies was Pentax EC-3801 L.
Biopsies (~ 0.5 mg) were obtained from the ascending (A), transverse (T), and descending (D) parts of the colon
(two parallels per location). One of the parallel samples was stored in 0.05 M potassium phosphate buffer (pH
7.0), and the other in phosphate-buffered saline (PBS; per litre: 8 g NaCl, 0.2 g KC1, 1.44 g Na2HP04, and 0.24 g
116
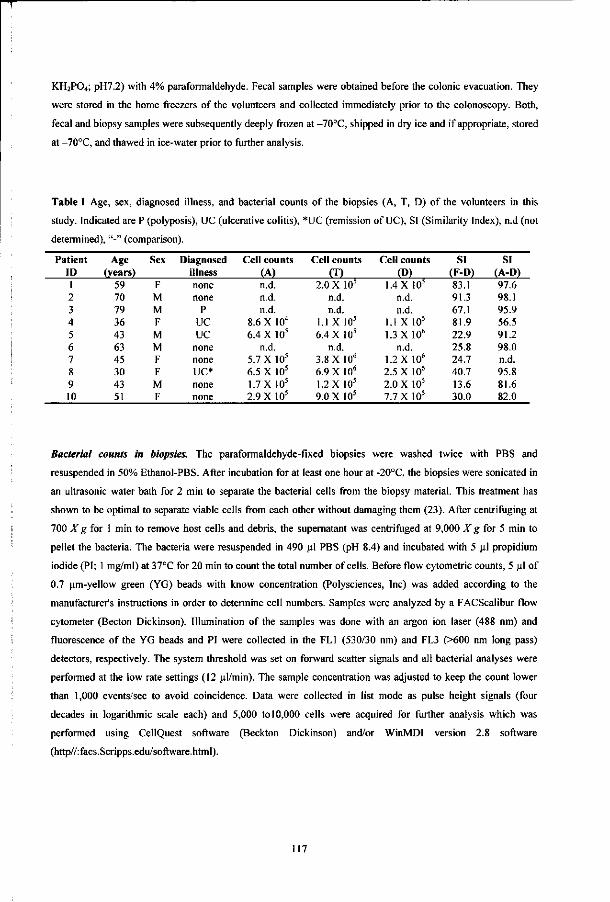
KH2P04; pH7.2) with 4% paraformaldehyde. Fecal samples were obtained before the colonic evacuation. They
were stored in the home freezers of the volunteers and collected immediately prior to the colonoscopy. Both,
fecal and biopsy samples were subsequently deeply frozen at -70°C, shipped in dry ice and if appropriate, stored
at -70°C, and thawed in ice-water prior to further analysis.
Table 1 Age, sex, diagnosed illness, and bacterial counts of the biopsies (A, T, D) of the volunteers in this
study. Indicated are P (polyposis), UC (ulcerative colitis), *UC (remission of UC), SI (Similarity Index), n.d (not
determined),"-" (comparison).
Patient ID 1 2 3 4 5 6 7 8 9 10
Age (years)
59 70 79 36 43 63 45 30 43 51
Sex
F M M F M M F F M F
Diagnosed illness none none
P UC UC none none UC* none none
Cell counts (A) n.d. n.d. n.d.
8.6 X 10⁴
6.4 X 10⁵
n.d. 5.7 X 10⁵
6.5 X 10⁵
1.7 X 10⁵
2.9 X 10⁵
Cell counts (T)
2.0 X 10⁵
n.d. n.d.
1.1 X 10⁵
6.4 X 10⁵
n.d. 3.8 X 10⁶
6.9 X 10⁶
1.2 X 10⁵
9.0 X 10⁵
Cell counts (D)
1.4 X 10⁵
n.d. n.d.
1.1 X 10⁵
1.3 X 10⁶
n.d. 1.2 X 10⁶
2.5 X 10⁶
2.0 X 10⁵
7.7 X 10⁵
SI (F-D) 83.1 91.3 67.1 81.9 22.9 25.8 24.7 40.7 13.6 30.0
SI (AD) 97.6 98.1 95.9 56.5 91.2 98.0 n.d. 95.8 81.6 82.0
Bacterial counts in biopsies. The paraformaldehyde-fixed biopsies were washed twice with PBS and
resuspended in 50% Ethanol-PBS. After incubation for at least one hour at -20°C, the biopsies were sonicated in
an ultrasonic water bath for 2 min to separate the bacterial cells from the biopsy material. This treatment has
shown to be optimal to separate viable cells from each other without damaging them (23). After centrifuging at
700 X g for 1 min to remove host cells and debris, the supernatant was centrifuged at 9,000 X g for 5 min to
pellet the bacteria. The bacteria were resuspended in 490 \i\ PBS (pH 8.4) and incubated with 5 fj.1 propidium
iodide (PI; 1 mg/ml) at 37°C for 20 min to count the total number of cells. Before flow cytometric counts, 5 (j.1 of
0.7 um-yellow green (YG) beads with know concentration (Polysciences, Inc) was added according to the
manufacturer's instructions in order to determine cell numbers. Samples were analyzed by a FACScalibur flow
cytometer (Becton Dickinson). Illumination of the samples was done with an argon ion laser (488 nm) and
fluorescence of the YG beads and PI were collected in the FL1 (530/30 nm) and FL3 (>600 nm long pass)
detectors, respectively. The system threshold was set on forward scatter signals and all bacterial analyses were
performed at the low rate settings (12 ul/min). The sample concentration was adjusted to keep the count lower
than 1,000 events/sec to avoid coincidence. Data were collected in list mode as pulse height signals (four
decades in logarithmic scale each) and 5,000 tol0,000 cells were acquired for further analysis which was
performed using CellQuest software (Beckton Dickinson) and/or WinMDI version 2.8 software
(http//:facs.Scripps.edu/software.html).
117
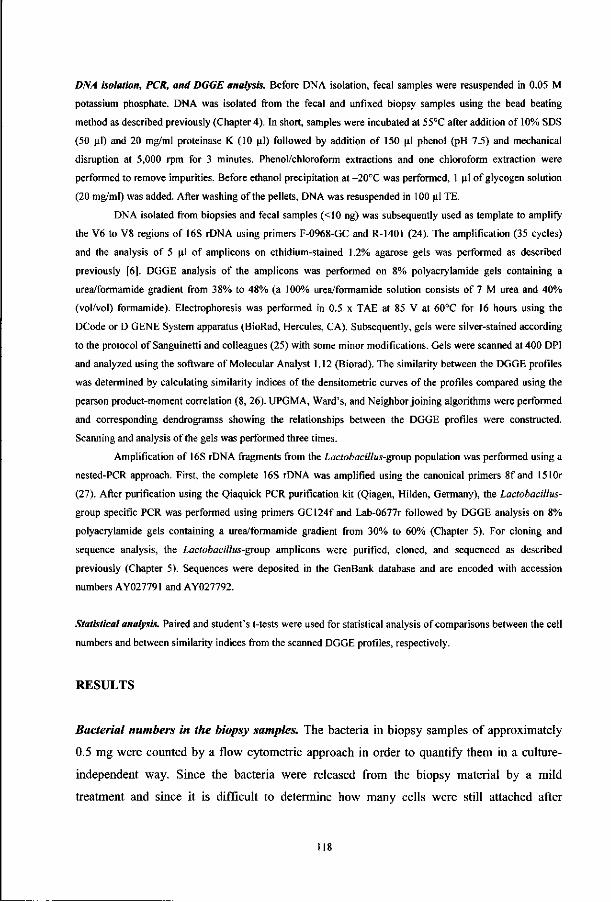
DNA isolation, PCR, and DGGE analysis. Before DNA isolation, fecal samples were resuspended in 0.05 M
potassium phosphate. DNA was isolated from the fecal and unfixed biopsy samples using the bead beating
method as described previously (Chapter 4). In short, samples were incubated at 55°C after addition of 10% SDS
(50 |il) and 20 mg/ml proteinase K (10 ul) followed by addition of 150 ul phenol (pH 7.5) and mechanical
disruption at 5,000 rpm for 3 minutes. Phenol/chloroform extractions and one chloroform extraction were
performed to remove impurities. Before ethanol precipitation at -20°C was performed, 1 \i\ of glycogen solution
(20 mg/ml) was added. After washing of the pellets, DNA was resuspended in 100 ul TE.
DNA isolated from biopsies and fecal samples (<10 ng) was subsequently used as template to amplify
the V6 to V8 regions of 16S rDNA using primers F-0968-GC and R-1401 (24). The amplification (35 cycles)
and the analysis of 5 JJ.1 of amplicons on ethidium-stained 1.2% agarose gels was performed as described
previously [6]. DGGE analysis of the amplicons was performed on 8% polyacrylamide gels containing a
urea/formamide gradient from 38% to 48% (a 100% urea/formamide solution consists of 7 M urea and 40%
(vol/vol) formamide). Electrophoresis was performed in 0.5 x TAE at 85 V at 60°C for 16 hours using the
DCode or D GENE System apparatus (BioRad, Hercules, CA). Subsequently, gels were silver-stained according
to the protocol of Sanguinetti and colleagues (25) with some minor modifications. Gels were scanned at 400 DPI
and analyzed using the software of Molecular Analyst 1.12 (Biorad). The similarity between the DGGE profiles
was determined by calculating similarity indices of the densitometric curves of the profiles compared using the
pearson product-moment correlation (8, 26). UPGMA, Ward's, and Neighbor joining algorithms were performed
and corresponding dendrogramss showing the relationships between the DGGE profiles were constructed.
Scanning and analysis of the gels was performed three times.
Amplification of 16S rDNA fragments from the Laclobacillus-group population was performed using a
nested-PCR approach. First, the complete 16S rDNA was amplified using the canonical primers 8f and 1510r
(27). After purification using the Qiaquick PCR purification kit (Qiagen, Hilden, Germany), the Lactobacillus-
group specific PCR was performed using primers GC124f and Lab-0677r followed by DGGE analysis on 8%
polyacrylamide gels containing a urea/formamide gradient from 30% to 60% (Chapter 5). For cloning and
sequence analysis, the Laclobacillus-group amplicons were purified, cloned, and sequenced as described
previously (Chapter 5). Sequences were deposited in the GenBank database and are encoded with accession
numbers AY027791 and AY027792.
Statistical analysis. Paired and student's t-tests were used for statistical analysis of comparisons between the cell
numbers and between similarity indices from the scanned DGGE profiles, respectively.
RESULTS
Bacterial numbers in the biopsy samples. The bacteria in biopsy samples of approximately
0.5 mg were counted by a flow cytometric approach in order to quantify them in a culture-
independent way. Since the bacteria were released from the biopsy material by a mild
treatment and since it is difficult to determine how many cells were still attached after
118
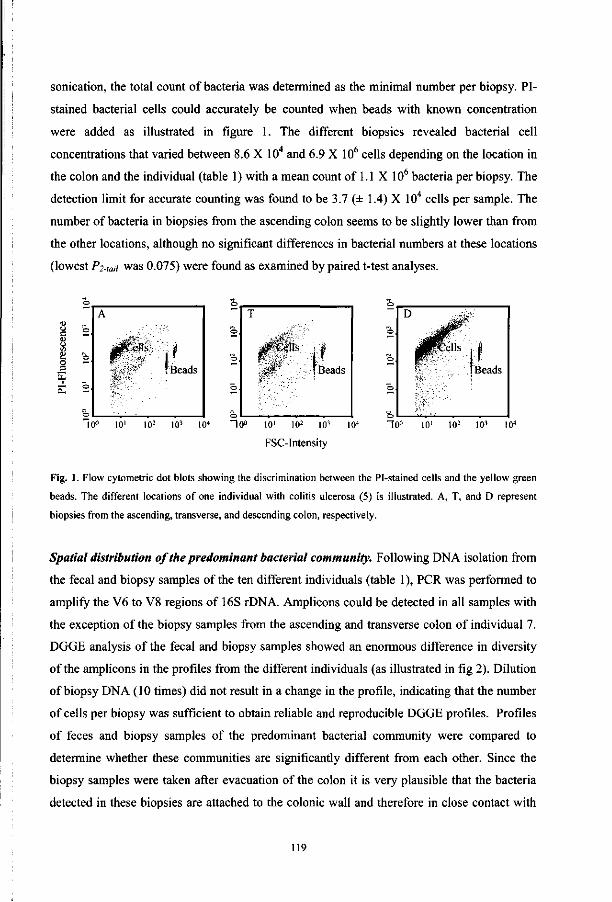
sonication, the total count of bacteria was determined as the minimal number per biopsy. PI-
stained bacterial cells could accurately be counted when beads with known concentration
were added as illustrated in figure 1. The different biopsies revealed bacterial cell
concentrations that varied between 8.6 X 10⁴ and 6.9 X 10⁶ cells depending on the location in
the colon and the individual (table 1) with a mean count of 1.1 X 10⁶ bacteria per biopsy. The
detection limit for accurate counting was found to be 3.7 (± 1.4) X 104 cells per sample. The
number of bacteria in biopsies from the ascending colon seems to be slightly lower than from
the other locations, although no significant differences in bacterial numbers at these locations
(lowest P2-tan was 0.075) were found as examined by paired t-test analyses.
u in s-O
o §
o
© ,
o ©
A
j feel ts
' Beads
© ,
© ,
© ,
T
, fBeads
o ,
o ,
© ,
D
ffe-•
• jUS?'
gells , |
TBeads
10° 101 102 103 10" 1 0 ° 101 102 103 104
FSC-Intensity
"lo° 10' io2 io3 io4
Fig. 1. Flow cytometric dot blots showing the discrimination between the Pi-stained cells and the yellow green beads. The different locations of one individual with colitis ulcerosa (5) is illustrated. A, T, and D represent biopsies from the ascending, transverse, and descending colon, respectively.
Spatial distribution of the predominant bacterial community. Following DNA isolation from
the fecal and biopsy samples of the ten different individuals (table 1), PCR was performed to
amplify the V6 to V8 regions of 16S rDNA. Amplicons could be detected in all samples with
the exception of the biopsy samples from the ascending and transverse colon of individual 7.
DGGE analysis of the fecal and biopsy samples showed an enormous difference in diversity
of the amplicons in the profiles from the different individuals (as illustrated in fig 2). Dilution
of biopsy DNA (10 times) did not result in a change in the profile, indicating that the number
of cells per biopsy was sufficient to obtain reliable and reproducible DGGE profiles. Profiles
of feces and biopsy samples of the predominant bacterial community were compared to
determine whether these communities are significantly different from each other. Since the
biopsy samples were taken after evacuation of the colon it is very plausible that the bacteria
detected in these biopsies are attached to the colonic wall and therefore in close contact with
119
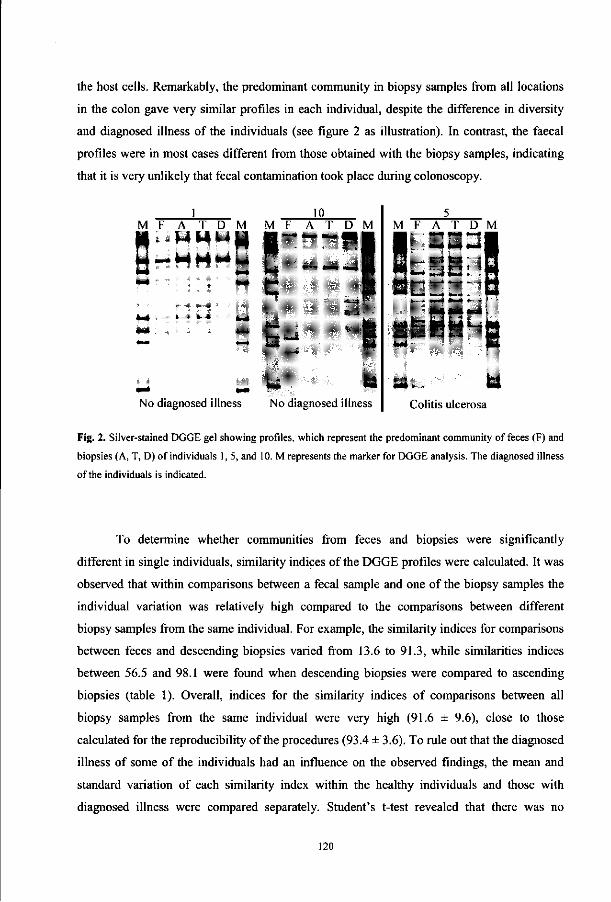
the host cells. Remarkably, the predominant community in biopsy samples from all locations
in the colon gave very similar profiles in each individual, despite the difference in diversity
and diagnosed illness of the individuals (see figure 2 as illustration). In contrast, the faecal
profiles were in most cases different from those obtained with the biopsy samples, indicating
that it is very unlikely that fecal contamination took place during colonoscopy.
10 M F A T D M M F A T D M
+*, M * # •«• M ,
No diagnosed illness No diagnosed illness.
M F A T D M • i — •—• —
1
Colitis ulcerosa
Fig. 2. Silver-stained DGGE gel showing profiles, which represent the predominant community of feces (F) and
biopsies (A, T, D) of individuals 1, 5, and 10. M represents the marker for DGGE analysis. The diagnosed illness
of the individuals is indicated.
To determine whether communities from feces and biopsies were significantly
different in single individuals, similarity indices of the DGGE profiles were calculated. It was
observed that within comparisons between a fecal sample and one of the biopsy samples the
individual variation was relatively high compared to the comparisons between different
biopsy samples from the same individual. For example, the similarity indices for comparisons
between feces and descending biopsies varied from 13.6 to 91.3, while similarities indices
between 56.5 and 98.1 were found when descending biopsies were compared to ascending
biopsies (table 1). Overall, indices for the similarity indices of comparisons between all
biopsy samples from the same individual were very high (91.6 ± 9.6), close to those
calculated for the reproducibility of the procedures (93.4 ± 3.6). To rule out that the diagnosed
illness of some of the individuals had an influence on the observed findings, the mean and
standard variation of each similarity index within the healthy individuals and those with
diagnosed illness were compared separately. Student's t-test revealed that there was no
120

significant difference between the similarity indices of both groups for each comparison, since
the lowest P2-UM observed was 0.065 (d.f =7) for the similarity indices for comparison
between ascending and transverse colonic biopsies. This indicates that the physiological state
of the individual had no significant effect on the spatial difference in composition in general.
The similarity indices between a fecal sample and one biopsy sample were compared
with those between the residual biopsy samples in order to obtain independent comparisons
for statistical analysis (figure 3). All combinations of comparisons showed that the bacterial
composition in fecal samples was significantly different from that in the biopsy samples. The
highest P2-iaii was 0.0012 (d.f.=16) for comparison between the similarity indices of feces and
transverse biopsies with ascending and descending biopsies.
E 55
00 80 60 40 20 0 -
1 • • Ul l
F-A
T i • • • F-T
I • i l l 1
r*i ft
f*i
1 ' F-D A-T A-D T-D
Com pari son
Fig. 3. Diagram showing the comparisons between fecal and biopsy samples. F represents feces, A, T, D
represent biopsies from the different locations, - represents the comparison. The mean and standard deviations of
the similarity indices are indicated.
Spatial distribution of the Lactobacillus community. A nested PCR approach was used to
specifically amplify the V2 to V4 regions of the 16S rDNA of the Lactobacillus group
community since no amplicons were retrieved using a direct specific PCR approach. In
contrast to the DGGE profiles of the predominant bacterial community the Lactobacillus
group specific profiles were lower in diversity as illustrated in figure 4. Because of this low
diversity similarity indices for the DGGE profiles cannot be determined. In contrast to the
predominant bacterial community, the Lactobacillus community in fecal and biopsy samples
were very similar in six of the ten individuals. In these individuals, only one amplicon was
dominating (see for example for individuals 1 and 5 in figure 4). In the other individuals one
of the fecal amplicons was the only predominant one in the biopsy samples or vice versa
(such as in individual 10 in figure 4). Furthermore, in three of the ten individuals some minor
121
differences in the Lactobacillus group composition between the biopsies were found. These
small differences could not be explained by the physiological condition, age or gender of the
host since they were found in individual 2 (healthy), 8 (remission of ulcerative colitis), and 10
(healthy).
1 10 F A T D F A T D
No diagnosed illness No diagnosed illness
A T D
i 1 Colitis ulcerosa
Fig. 4. Silver-stained DGGE gel showing profiles, which represent the Lactobacillus group community of feces (F) and biopsies (A, T, D) of individuals 1, 5, and 10. M represents the marker for DGGE analysis. The physiological conditions of the individuals are indicated.
Comparison between healthy individuals and individuals with diagnosed illness. DGGE
profiles of biopsy samples from the descending colon of individuals with and without a
diagnosed illness were compared to see if the presence or absence of specific bacteria could
be correlated to the illness. The descending colon was chosen since all diagnosed illnesses
were at least observed in this part. The profiles of the predominant bacterial community
appeared to be unique for each individual and no specific amplicon could be assigned to the
presence or absence of a colonic illness (figure 5A). To analyze the predominant
communities, similarity indices were calculated of the comparisons between the DGGE
profiles. Repetitive comparisons between the UPGMA, Ward, and neighbor-joining
algorithms were performed and dendrograms were constructed. Only two clusters were found
in all dendrograms, while the position of the others branches in the dendrogram changed
depending on the clustering method. The large error bars of the nodes in the UPGMA tree
(figure 5B) could be seen as an indication that the corresponding branches of these nodes may
vary between the different algorithms. One of the repetitive clusters consisted of four healthy
individuals (i.e. individuals 1,2, 6, and 7) and the other consisted of two individuals (i.e. 3
and 5) with a diagnosed illness. This preliminary observation suggests that there might be
122

differences in the predominant bacterial composition between healthy and diseased
individuals, although the group of individuals in this study is too small to draw a definite
conclusion.
M 1 2 6 7 9 10
§» - " f. 4 i JMtt £ 3 • i — * —
No diagnosed illness Diagnosed illness
3 4 5 8 M
M"- i i-4 — a u
B 0 20 40 60 80 100 1 • i • I • i • I • • • I • • i I • i • I
21 6
^ 71 Cluster I l l
=i c I Cluster II
Fig. 5. (A) Silver-stained DGGE gel showing profiles, which represent the predominant community of the
descending biopsy from individuals 1 to 10. M represents the marker for DGGE analysis. The physiological
conditions of the individuals are indicated. (B) UPGMA dendrogram illustrating the correlation between the
different DGGE profiles of figure 5 (A). Cluster I and TI represent the repetitive clusters obtained using different
algorithms. The black bars represent the error bars.
1 2 6 7 9 10
•if 1
y i o t *—* k_l .4
No diagnosed illness Diagnosed illness
3 4 5 8
_ <
Fig. 6. Silver-stained DGGE gel showing profiles, which represent the Lactobacillus group community of the
descending biopsy from individuals 1 to 10. M represents the marker for DGGE analysis. The physiological
conditions of the individuals are indicated. The arrowheads indicate the amplicons which have been identified by
cloning and sequencing.
For the Lactobacillus-group community also no specific differences could be found
between the individuals with and without diagnosed illness (figure 6). A striking observation
was the presence of an amplicon with identical DGGE band position in nine of the ten
individuals. In six of them it was predominantly present. Since it appeared to be a
123

Lactobacillus gasseri-hke species (see below) we tested whether its predominance might be a
result of preferential amplification. Our nested PCR approach did not show any preference in
favor of L. gasseri when mixtures of its DNA with that from L. acidophilus and L. paracasei
were used as template DNA for PCR. Cloning and sequence analysis of the amplicon from the
DGGE profiles of healthy individual 1 and individual 3 with polyposis showed that both
sequences had 99% similarity with L. gasseri. Alignment of the two sequences showed that
they only differ one base (Adenine/Thymine difference). This indicates that L. gasseri is
likely to be a predominant Lactobacillus species in the biopsy samples.
DISCUSSION
In this study we have used a culture-independent approach based on the 16S rDNA sequence
variability to analyze bacterial communities at different parts in the colon. Fecal and biopsy
samples were taken from people with and without a diagnosed illness. Since the colon was
evacuated before biopsy samples were taken, it is very likely that the bacteria in the biopsy
samples are mucosa-associated. The minimum number of cells per biopsy sample as measured
by flow cytometry is comparable to numbers found by cultivation of bacteria from biopsies
which were obtained in a similar procedure (16). Considerable variation was found in the
bacterial numbers from different biopsies. Factors that may cause this variation include the
evacuation procedure, the sonication procedure, and individual differences. On the other hand,
this variation in bacterial number may explain why no PCR product could be obtained from
two biopsy samples.
DGGE analysis of 16S rDNA was used to determine, compare, and visualize the
composition of the predominant bacterial and the Lactobacillus-group community. The
DGGE profiles reflecting the predominant bacterial community in biopsy samples from
different locations in the GI tract were highly similar to each other while they differ
significantly from those of fecal samples (figure 3). Therefore, it seems that the attached
bacteria are equally distributed along the complete colon and that different populations are
dominating in the mucosa and the feces. Culture-dependent studies on contents from different
parts of the colon (including the ascending, transverse and descending colon) of sudden-death
individuals has revealed that the conditions, like for example pH and concentration of
fermentation products, in these part differ considerably from each other (14). This suggests
that the equal distribution of the attaching bacterial composition is very likely due to host-
124

bacterium interactions at the mucosa. Several studies have already suggested that the bacterial
community in the GI tract has a strong effect on host and that signaling between host and
bacterium is very important (2-4). In a recent study, we found a significant positive
relationship between the genetic relatedness of the hosts and the similarity between their
bacterial communities (8). However, it is not clear yet what the nature is of these host-related
factors.
Using a nested PCR approach the Lactobacillus-group specific composition could be
analyzed. In contrast to the predominant community, the profiles of biopsy and fecal samples
were quite similar in six of the ten individuals. Furthermore, in three of the ten individuals
some minor differences were found in the Lactobacillus group composition between the
biopsies. This suggests that the changing conditions in the GI tract influence the presence or
absence of certain species belonging to the Lactobacillus group. Another explanation could be
the detection limit of these bacteria in the biopsies. Since we are focusing on a sub-population
in a community, which contains approximately 10 bacteria, a small difference in the number
of a certain species might have a large impact on its detection. Remarkably, one amplicon
with highest sequence similarity (99%) to L. gasseri, was found in descending biopsy samples
of nine of the ten individuals. Moreover, it was the most predominant one in most biopsies.
Since the 16S rDNA of this species was not preferentially amplified using the nested PCR
approach, L. gasseri may be regarded as a general mucosa-associated bacterium in humans.
Because colonic illnesses were observed during colonoscopy, samples from healthy
individuals and those with a diagnosed illness were compared to each other. Since the
illnesses are found especially in the descending colon, we carefully compared the samples
from these regions and compared them with those from healthy individuals. No significant
difference could be detected with respect to the number of bacteria per biopsy, the
composition of the predominant bacterial community, and that of the Lactobacillus group
community. This is supported by the observation that the profiles reflecting the predominant
community were highly similar along the complete colon in both groups. Lactobacilli were
detected in both feces and biopsies from all individuals and no significant differences in the
Lactobacillus group populations between healthy and diseased tissue were found. Hence, no
specific beneficial effect of these Lactobacillus species is likely to be expected. However, the
number of volunteers in this study was too small to draw significant conclusions about
comparisons between healthy and diseased individuals.
The molecular approach used in this study can be influenced by preferential
125

amplification and difference in DNA isolation efficiency of different species. DNA from
biopsy samples could be diluted 10 times without changing the profiles. Furthermore, for two
individuals the similarity between fecal and biopsy samples was very high, while the number
of bacteria per fecal sample was at least 103 to 104 times higher. These data indicate that it is
very unlikely that the procedures such as sampling, storage, and transport or preferential lysis
of specific groups of bacteria have a major impact on our observations.
In conclusion, using a culture-independent approach we could clearly demonstrate that
mucosa-associated bacterial communities in the colon are significantly different in
composition from those in feces. A strikingly high similarity was observed between bacterial
communities from different locations in the colon. This observation assumes that host-related
factors are really important in the colonic ecosystem, which is in line with previous
observations (2-4, 8). Small differences between healthy and diseased individuals were
observed, but the number of samples analyzed was too small to allow a definite conclusion. In
other studies no significant differences were observed when healthy individuals were
compared to those suffering from gastritis (22) or NEC (13). However, the number of
individuals in these study was also relatively low (13 and 32, respectively). Therefore, our
knowledge of the exact role of GI tract bacteria in intestinal disorders remains limited. We
clearly showed that sub-populations of the Lactobacillus group could be well characterized
using a culture-independent approach. Such approaches can easily be applied to for example
(sub-) populations of Bacteroides, sulfate-reducing bacteria, and pathogenic Escherichia coli
strains since they have been suggested to be involved in the initiation and maintenance of
ulcerative colitis, although their role is still questionable (18, 19, 28). Therefore, we suggest
that systematic culture-independent approaches should be applied to study the role of varying
GI tract sub-populations in the pathogenesis of colonic diseases.
ACKNOWLEDGMENTS
We thank Mr. G. H. J. Heilig, Mr P. Verbaarschot, Ms. M-L Kekalainen, and Ms. M. Rekola
for technical assistance. In addition, we thank all volunteers for providing fecal and biopsy
samples. Dr. J. A. G. M. de Visser was very helpful in his advisory function on the statistical
analysis.
126

REFERENCES
1. Tannock G. W. 1995. Normal microflora. An introduction to microbes inhabiting the human body. London,
Chapman and Hall.
2. Bry L, P. G. Falk, T. Midtvedt, and J. I. Gordon. 1996. A model of host-microbial interactions in an open
mammalian ecosystem. Science 273:1381-1383.
3. Hooper L. V., J. Xu, P. G. Falk, T. Midtvedt, and J. I. Gordon. 1999. A molecular sensor that allows a gut
commensal to control its nutrient foundation in a competitive ecosystem. Proc. Natl. Acad. Sci. USA 96:9833-
9838.
4. Hooper L. V, M. H. Wong, A. Thelin, L. Hansson, P. G. Falk, and J. I. Gordon. 2000. Molecular analysis
of host-microbial relationships in the intestine. Science 291:881-884.
5. Wilson K. H. and R. H. Blitchington. 1996. Human colonic biota studied by ribosomal DNA sequence
analysis. Appl. Environ. Microbiol. 62:2273-2278.
6. Zoetendal E. G., A. D. L. Akkermans, and W. M. de Vos. 1998. Temperature gradient gel electrophoresis
analysis from human fecal samples reveals stable and host-specific communities of active bacteria. Appl.
Environ. Microbiol. 64:3854-3859.
7. Suau A., R. Bonnet, M. Sutren, J.J. Godon, G.R. Gibson, M.D. Collins, and J. Dore. 1999. Direct analysis
of genes encoding 16S rRNA from complex communities reveals many novel molecular species within the
human gut. Appl. Environ. Microbiol. 65:4799-4807.
8. Zoetendal E. G., A. D. L. Akkermans, W. M. Akkermans van-Vliet, J. A. G. M. de Visser, and W. M. de
Vos. 2001. The host genotype affects the bacterial community in the human gastrointestinal tract. Microbial
Ecol. Health Dis. 13:129-134.
9. Vaughan E. E., G. H. J. Heilig, E. G. Zoetendal, R. Satokari, J. K. Collins, A. D. L. Akkermans, and W.
M. de Vos. 1999. Molecular approaches to study probiotic bacteria. Trends Food Sci. Tech. 10(12): 400-404.
10. Simpson J. M., V. J. McCracken, H. R. Gaskins, and R. I. Mackie. 2000. Denaturing gradient gel
electrophoresis analysis of 16S ribosomal DNA amplicons to monitor changes in fecal bacterial populations of
weaning pigs after introduction of Lactobacillus reuteri strain MM53. Appl. Environ. Microbiol. 66:4705-4714.
11. Tannock G. W., K. Munro, H. J. M. Harmsen, G. W. Welling, J. Smart, and P. K. Gopal. 2000.
Analysis of the fecal microflora of human subjects consuming a probiotic product containing Lactobacillus
rhamnosus DR20. Appl. Environ. Microbiol. 66:2578-2588.
12. Hopkins M. J., R. Sharp, and G. T. Macfarlane. 2001. Age and disease related changes in intestinal
bacterial populations assessed by cell culture, 16S rRNA abundance, and community cellular fatty acid profiles.
Gut 2001;48:198-205.
13. Millar M. R., C. J. Linton, A. Cade, D. Glancy, M. Hall, and H. Jalal. 1996. Application of 16S rRNA
gene PCR to study bowel flora of preterm infants with and without necrotizing enterocolitis. J. Clin. Microbiol.
34:2506-2510.
14. Macfarlane G. T., G. R. Gibson, and J. H. Cummings. 1992 Comparison of fermentation reactions in
different regions of the human colon. J. Appl. Bacteriol. 72:57-64.
15. Johansson M-L., G. Molin, B. Jeppsson, S. Nobaek, S. Ahrne, and S. Bengmark. 1993. Administration
127

of different Lactobacillus strains in fermented oatmeal soup: In vivo colonization of human intestinal mucosa
and effect on the indigenous flora. Appl. Environ. Microbiol. 59:15-20.
16. Alander M., R. Korpela, M. Saxelin, T. Vilpponen-Salmela, T. Mattila-Sandholm, and A. von Wright.
1997. Recovery of Lactobacillus rhamnosus GG from human colonic biopsies. Lett. Appl. Microbiol. 24:361-
364.
17. Alander M., R. Satokari, R. Korpela, M. Saxelin, T. Vilpponen-Salmela, T. Mattila-Sandholm, and A.
von Wright. 1999. Persistence of colonization of human colonic mucosa by a probiotic strain, Lactobacillus
rhamnosus GG, after oral consumption. Appl. Environ. Microbiol. 65:351-354.
18. Gibson G. R., J. H. Cummings, and G. T. Macfarlane. 1991. Growth and activities of sulphate-reducing
bacteria in the gut contents of healthy subjects and patients with ulcerative colitis. FEMS microbiol. Ecol.
86:103-112.
19. Zinkevich V. and I. B. Beech. 2000. Screening of sulfate-reducing bacteria in colonoscopy samples from
healthy and colitic human gut mucosa. FEMS Microbiol. Ecol. 34:147-155.
20. Gillian Hartley M., M. J. Hudson, E. T. Swarbrick, M. J. Hill, A. E. Gent, M. D. Hellier, and R. H.
Grace. 1992. The rectal mucosa-associated microflora in patients with ulcerative colitis. J. Med. Microbiol.
36:96-103.
21. Kroes I, P. W. Lepp, and D. A. Relman. 1999. Bacterial diversity within the human subgingival crevice.
Proc Natl. Acad. Sci. USA 96:14547-14552.
22. Monstein H-J, A. Tiveljung, C. H. Kraft, K. Borch, and J. Jonasson. 2000. Profiling of bacterial flora in
gastric biopsies from patients with Helicobacter /^y/on'-associated gastritis and histologically normal control
individuals by temperature gradient gel electrophoresis and 16S rDNA sequence analysis. J. Med.
Microbiol. 49:817-822.
23. Nebe-von-Caron G, P. Stephens, C. H. Hewitt, J. R. Powel, and R. A. Badley. 2000. Analysis of bacterial
function by multi-colour fluorescence flow cytometry and single cell sorting. J. Microbiol. Meth. 42:97-114.
24. Niibel U., B. Engelen, A. Felske, J. Snaidr, A. Wieshuber, R. I. Amann, W. Ludwig, and H. Backhaus.
1996. Sequence heterogeneities of genes encoding 16S rRNAs in Paenibacillus polymyxa detected by
temperature gradient gel electrophoresis. J. Bacteriol. 178:5636-5643.
25. Sanguinetti C. J., E. Dias Neto, and A. J. G. Simpson. 1994. Rapid silver staining and recovery of PCR
products separated on polyacrylamide gels. BioTechniques 17:915-919.
26. Hane B. G., K. Jager, and H. Drexler. 1993. The pearson product-moment correlation coefficient is better
suited for identification of DNA fingerprint profiles than band matching algorithms. Electrophoresis 14:967-972.
27. Lane D. J. 1991. 16S/23S rRNA sequencing. In: Nucleic acid techniques in bacterial systematics.pp 115-
175, ed. E. Stackebrandt and M. Goodfellow, Chichester, J. Wiley & Sons.
28. Campieri M., and P. Gionchetti. 2001. Bacteria as the cause of ulcerative colitis. Gut 48:132-135.
128

Chapter 8
Quantification of Uncultured Ruminococcus obeum-tike Bacteria
in Human Fecal Samples with Fluorescent In Situ Hybridization
and Flow Cytometry using 16S Ribosomal RNA Targeted Probes
Erwin G. Zoetendal, Kaouther Ben-Amor, Hermie J. M. Harmsen, Frits Schut, Antoon D. L.
Akkermans, and Willem M. de Vos
Submitted
129
Abstract
A 16S rRNA-targeted probe was designed and validated in order to quantify the
number of uncultured Ruminococcus obeum-like bacteria using fluorescent in situ
hybridization (FISH). These bacteria have frequently been found in 16S rDNA clone
libraries from bacterial communities in the human intestine. Thirty-two reference
strains from the human intestine, including a phylogenetically related and some other
Ruminococcus species were used as negative control and did not hybridize with the
newly designed probe. Microscopic and flow cytometric analysis revealed that a group
of morphologically similar bacteria in feces did hybridize with this probe. Moreover, it
was found that all hybridizing cells also hybridized with a probe specific for the
Clostridium coccoides - Eubacterium rectale group, a group that included the uncultured
R. obeum-like bacteria. Quantification of the uncultured R. obeum-like bacteria and the
Clostridium coccoides - Eubacterium rectale group by flow cytometry and microscopy
revealed that these groups comprised approximately 2.5% and 16% of the total
community in fecal samples, respectively. This indicates that the uncultured R. obeum-
like bacteria are predominantly present in human feces and that they comprise a major
fraction of the Clostridium coccoides - Eubacterium rectale group. Statistical analysis
revealed no significant difference between the microscopic and flow cytometric counts
and the sampling time of the feces while a significant host-specific effect on the counts
was observed. Our data demonstrates that the combination of FISH and flow cytometry
is a useful approach for studying the ecology of uncultured bacteria in the human
gastrointestinal tract.
130
INTRODUCTION
The human gastrointestinal (GI) tract harbors a diverse microbial community which has an
important metabolic and protective function in the GI tract (reviewed by 17). Recent studies
indicate that interactions between the host and the bacterial community are of considerable
importance, but very complex and just starting to be understood (4, 9, 10, 24). Most
knowledge about the bacterial community in the human GI tract has been obtained by
selective cultivation of microbes from fecal samples. The past 5 years, culture-independent
approaches using the sequence variability of the 16S rRNA genes have demonstrated that
most of the predominant bacteria in human fecal samples have not yet been obtained in
culture, illustrating the limitation in our knowledge of these predominant members (15, 22,
23). In addition, denaturing and temperature gradient gel electrophoretic (DGGE/TGGE)
analysis of fecal 16S rDNA and rRNA amplicons has demonstrated to a be powerful culture-
independent approach in determining and monitoring the bacterial community in feces (23,
24). Such studies revealed that the predominant bacterial community in human feces is
relatively stable in time, host-specific, and not significantly altered following consumption of
certain probiotic strains (18, 19, 23).
Although the application of 16S rDNA-directed DGGE, cloning, and sequencing has
provided new insights into the bacterial composition of the human GI tract, these approaches
are all based on the use of PCR amplification methods and hence cannot be accurately
converted to real numbers of bacteria. Fluorescent in situ hybridization (FISH) using 16S
rRNA targeted oligonucleotide probes has demonstrated to be very powerful in detecting and
quantifying uncultured bacteria in environmental samples (reviewed by 3). FISH analysis of
fecal populations has demonstrated that these were found to be relatively stable in time (5).
Various genera, like Bacteroides, Bifidobacterium, Streptococcus, Lactobacillus, Collinsella,
Eubacterium, and Clostridium could be quantified accurately in feces using the FISH
approach (5, 6, 7, 12). In addition, a group of Fusobacterium prausnitzii-like bacteria, which
was predominantly found in several fecal clone libraries (15, 22, 23), was also found as a
predominant member using the FISH approach (5, 16).
In several studies, a group of uncultured bacteria that have Ruminococcus obeum as
closest cultivable relative was found to predominate fecal 16S rDNA clone libraries (15, 23).
These were also found to be present in fecal TGGE profiles of dominant and active bacteria
and could be an important member of the bacterial community in the human GI tract (23).
131

Since these cloned amplicons have less than 97% sequence similarity to R. obeum they
represent a group of hitherto unknown species. Up to now no quantitative data have been
obtained and the morphology of these bacteria remains unknown, since their presence is only
derived from PCR-based data.
In many studies, FISH analysis is combined with microscopic analysis. Although less
frequently used, also the combination of FISH with flow cytometry has been applied
successfully in analyzing different microbial communities (2, 13, 20, 21). Major advantages
of this combination are the multiparametric analysis of samples, and the relatively fast and
sensitive quantification of populations, even those that make up only about 1% of the total
community.
In the present study, we have developed a set of two probes to detect and quantify the
group of uncultured Ruminococcus obeum-like bacteria using FISH in combination with
direct microscopy and flow cytometry. After validation, the probe was used to quantify the
number of hybridized cells in fecal samples from three individuals by microscopic and flow
cytometric analysis. In addition, the Eubacterium rectale - Clostridium coccoides group, that
includes the uncultured R. obeum-like. bacteria, and the total number of bacteria were
quantified. Variations over time, among individuals and between the approaches were
statistically analyzed.
MATERIALS AND METHODS
Design and validation of the oligonucleotide probes. Sequences of closely related uncultured R. obeum-\ike
bacteria from human fecal samples were obtained from two studies in which fecal 16S rDNA clone libraries
were constructed and analyzed (Fig. 1.; 15, 23). The identity and accession number of these sequences are A14
(AF052415), A20 (AF052417), A57 (AF052422), adhufecl71 (AF132243), and adhufec35.25 (AF153853).
These sequences were aligned using the ARB software package (14) and probes targeting these sequences were
designed. The newly designed probe (Robe63 probe) was screened for specificity based on comparative analysis
of 16S rRNA sequences from the ARB database and ribosomal database project (RDP, 11) and newly deposited
sequences from GenBank using the ARB and RDP software (Table. 1). The CHECK PROBE analysis function
of the RDP and the Probe Match function of ARB were used to screen the 16S and 23 S rRNA sequence
databases for target sequences for the newly developed probe.
Thirty-two reference strains from various phylogenetic groups in the GI tract, including R. obeum, were
used as negative control to evaluate the specificity of the Robe63 probe (Table 2). The Eub338 probe (2) was
used as positive control for the hybridization of the negative reference strains. Since the positive target of the
Robe63 probe constitutes a 16S rDNA sequence of an uncultured group of R. obeum-like bacteria, no positive
reference strain could be used. Therefore, bacteria from a reference fecal sample were added to the reference
132

strains in order to verify hybridization signals of the Robe63 probe. In addition, fecal samples were hybridized
with the specific probe and the Erec482 probe (5), which targets the Clostridium coccoides - Eubcaterium
rectale group that includes the uncultured R. obeum-tike bacteria, to determine whether the Robe63-positive
cells appeared double-labeled.
I Adhufec 35.25, AF153853 I ! Fecal clone A14, AF052415
f ' Fecal clone AS7, AF052422 1 _ | Fecal clone A20.AF052417
' Adhufecl71,AF132243 Ruminococcus obeum, L76601
Lachnospira multipara,l>]4674 liubacterium ventriosum, L34421
Clostridium polyfiacchawlyticwn, X71858
Fig. 1. Neighbor-joining tree showing the phylogenetic relationships between the 16S rDNA sequences of the
uncultured Ruminococcus obeum-Wke bacteria (indicated in bold) and some closely related reference strains used
in this study. The phylogenetic tree was generated from the tree-of-life of the ARB software package. Accession
numbers of the 16S rDNA sequences are indicated. The bar represents 10% sequence divergence.
Table 1. Alignments of probe sequences and their target sequences having maximal two mismatches. N, R, W,
and Y are the IUPAC codes for ambiguous base annotations. Dots indicate that bases are identical to the target
site. Differences between the probes are represented as bold nucleotides. Mismatches of target sequences with
the probe target site are underlined.
Sequence ID Sequence
S-*-Robe-0063-a-A-20" 3' GC-TTG-CCC-TTA-ATG-AAA-TAA
S-*-Robe-0063-b-A-20a 3' GC-TTG-CCC-TTT-ATR-AAR-TAA
Target 5' CG AAC GGG AAW UAY OUY AUU
Fecal clones A14, A20, A57
Adhufec35.25
Adhufecl71 NN NNN NNN NN
Ruminococcus obeum CY
Rumen clone RFN27 U. A
a According to the ODP nomenclature (1). A 1:1 mixture of these probes is encoded as Robe63 probe.
Reference strains, culture conditions, and fixation. The thirty-two reference strains used in this study were
obtained from various sources as indicated: Deutsche Sammlung von Mikroorganismen und Zellcultures [DSM;
Braunschweig, Germany], American Type Culture Collection [ATCC; Rockville, Md], and Laboratory for
Medical Microbiology [MMB; Groningen, The Netherlands (5)] (Table 2). The ATCC and DSM strains were
cultivated as described in the respective catalogues. All MMB stains are clinical or human fecal isolates from
133
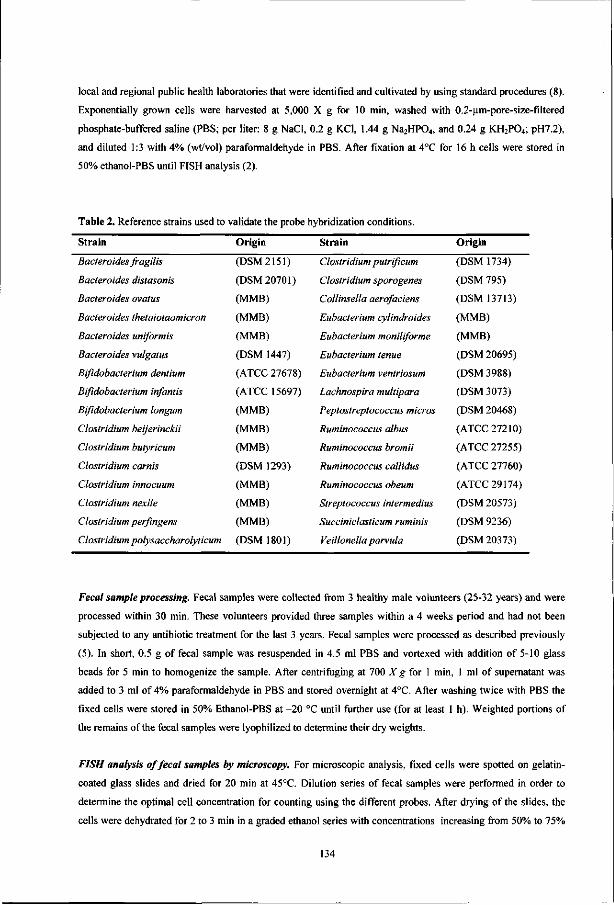
local and regional public health laboratories that were identified and cultivated by using standard procedures (8).
Exponentially grown cells were harvested at 5,000 X g for 10 min, washed with 0.2-um-pore-size-filtered
phosphate-buffered saline (PBS; per liter: 8 g NaCI, 0.2 g KC1, 1.44 g Na2HP04, and 0.24 g KH2P04; pH7.2),
and diluted 1:3 with 4% (wt/vol) paraformaldehyde in PBS. After fixation at 4°C for 16 h cells were stored in
50% ethanol-PBS until FISH analysis (2).
Table 2. Reference strains used to validate the probe hybridization conditions.
Strain Origin Strain Origin
Bacteroides fragilis (DSM 2151)
Bacteroides distasonis (DSM 20701)
Bacteroides ovatus (MMB)
Bacteroides thetaiotaomicron (MMB)
Bacteroides uniformis (MMB)
Bacteroides vulgatus (DSM 1447)
Bifidobacterium dentium (ATCC 27678)
Bifidobacterium infantis (ATCC 15697)
Bifidobacterium longum (MMB)
Clostridium beijerinckii (MMB)
Clostridium butyricum (MMB)
Clostridium carnis (DSM 1293)
Clostridium innocuum (MMB)
Clostridium nexile (MMB)
Clostridium perfingens (MMB)
Clostridium polysaccharolyticum (DSM 1801)
Clostridium putrificum
Clostridium sporogenes
Collinsella aerofaciens
Eubacterium cylindroides
Eubacterium moniliforme
Eubacterium tenue
Eubacterium ventriosum
Lachnospira multipara
Peptostreptococcus micros
Ruminococcus albus
Ruminococcus bromii
Ruminococcus callidus
Ruminococcus obeum
Streptococcus intermedius
Succiniclasticum ruminis
Veillonella parvula
(DSM 1734)
(DSM 795)
(DSM 13713)
(MMB)
(MMB)
(DSM 20695)
(DSM 3988)
(DSM 3073)
(DSM 20468)
(ATCC 27210)
(ATCC 27255)
(ATCC 27760)
(ATCC 29174)
(DSM 20573)
(DSM 9236)
(DSM 20373)
Fecal sample processing. Fecal samples were collected from 3 healthy male volunteers (25-32 years) and were
processed within 30 min. These volunteers provided three samples within a 4 weeks period and had not been
subjected to any antibiotic treatment for the last 3 years. Fecal samples were processed as described previously
(5). In short, 0.5 g of fecal sample was resuspended in 4.5 ml PBS and vortexed with addition of 5-10 glass
beads for 5 min to homogenize the sample. After centrifuging at 700 X g for 1 min, 1 ml of supernatant was
added to 3 ml of 4% paraformaldehyde in PBS and stored overnight at 4°C. After washing twice with PBS the
fixed cells were stored in 50% Ethanol-PBS at -20 °C until further use (for at least 1 h). Weighted portions of
the remains of the fecal samples were lyophilized to determine their dry weights.
FISH analysis of fecal samples by microscopy. For microscopic analysis, fixed cells were spotted on gelatin-
coated glass slides and dried for 20 min at 45°C. Dilution series of fecal samples were performed in order to
determine the optimal cell concentration for counting using the different probes. After drying of the slides, the
cells were dehydrated for 2 to 3 min in a graded ethanol series with concentrations increasing from 50% to 75%
134

and finally 96% ethanol/H20. Ten microliters of hybridization buffer (0.9 M NaCl, 20 mM Tris-HCl (pH7.5),
0.1% (wt/vol) SDS) containing 3 ng/ul of Cy3-labeled Robe63 probe or 5 ng/ul FITC-labeled Erec482 probe
was added to each well, followed by incubation at 50°C for 3 h. After hybridization the slides were washed in 50
ml hybridization buffer without SDS for 10 to 20 min. For the Robe63 probe a 20% formamide (vol/vol)
containing hybridization buffer and a low salt washing buffer (0.225 M NaCl, 20 mM Tris-HCl (pH7.5), 10 mM
EDTA) was used. For total counts 4',6-diamidino-2-phenylindole (DAPI) was added to the wash buffer at a final
concentration of 100 ng/ml. After rinsing the slides in water they were immediately air-dried and mounted in
Vectashield (Vector Labs, Burlingame, CA). Digital images of the slides, viewed with a Leica (Wetzlar,
Germany) DMRXA epifluorescence microscope, were taken with a Kodak Megaplus 1.4 charge-coupled device
camera. These images were analyzed and fluorescent cells were counted by using Quantimet HR550 image
analysis software (Leica). For each analysis 25 microscopic fields were counted.
FISH analysis of fecal samples by flow cytometry. For each hybridization 50 ul of fixed cells were centrifuged
for 3 min at 9,000 Xg and resuspended in 20 ul of hybridization buffer (0.9 M NaCl, 20 mM Tris-HCl (pH8.0),
0.1% (wt/vol) SDS). After addition of 2 ul of the Cy5- and/or double (at 5' and 3' end) FITC-labeled probes (30
ng/ul and 50 ng/ul respectively) the samples were incubated for 16 hours at 50°C in the dark. The Robe63 and
Erec482 probes were Cy5-labeled for counting and the Erec482 probe was FITC-labeled for validation the
specificity of the Robe63 probe. After hybridization, 980 (j.1 of prewarmed washing buffer was added and the
samples were incubated at 50°C for 5 min. The hybridization buffer without SDS was used as washing buffer
after hybridization with the Erec482 probe, and the low salt washing buffer consisting of 0.225 M NaCl, 20 mM
Tris-HCl (pH8.0), 10 mM EDTA was used after hybridization with the Robe63 probe. The cells were
centrifuged at 9,000 Xg for 5 min and resuspended in 1 ml of ice-cold PBS (pH 8.4). To avoid loosing the signal
intensity the hybridized cells were kept in the dark on ice until flow cytometric analysis. Cells hybridized with
the labeled probes were compared to cells, which were incubated in hybridization buffer only, in order to
optimize the settings for flow cytometric analysis. Afterwards, the unlabeled cells were incubated with 10 u,l/ml
of propidium iodide (PI; 1 mg/ml) at 37°C for 20 min to count the total number of bacteria. The bacterial
concentration was adjusted to keep the count lower than 1,000 events/sec in order to avoid coincidence. During
analysis of fecal samples, 0.7 nm-yellow green fluorescent beads (for counting Pi-labeled cells) or PC
fluorescent beads (for counting Cy5-labeled cells) with known concentration (Polysciences, Inc) were added
according to the manufacturer's instructions in order to determine cell numbers. Samples were analyzed using a
Becton and Dickinson FACScalibur flow cytometer. An air-cooled argon ion laser (488 nm) and a red-diode
laser (635 nm) were used for excitation and the green, red, and far red signals of the bacteria and the beads were
collected in the FL1 (530/30 nm), FL3 (>600 nm long pass filter) and FL4 (661/16 nm) detectors, respectively.
The system threshold was set on forward scatter signals and all bacterial analyses were performed at the low
flow rate settings (12 ul/min). Data was collected in list mode as pulse height signals (four decades in
logarithmic scale each) and 10,000 cells were acquired for further analysis which was performed using
CellQuest software (Beckton Dickinson) and/or WinMDI version 2.8 software
(http//:facs.Scripps.edu/software.html). The whole hybridization and counting analysis was performed three
times for each probe and fecal sample.
135

Statistical analysis. The analyses performed on the various samples included the variables of methodology
(microscopy or flow cytometry), probe type (DAPI, Erec482 probe, or Robe63 probe), individual, and time.
Therefore, the coefficient of variation (i.e. the standard variation divided by the mean, termed CV) for the time,
for the reproducibility of the counts, and for the different individuals were compared. In addition, regression
analysis on the mean counts of fecal samples taken at different time intervals was performed for each individual.
Since it appeared that time had no significant effect on the counts, these counts were used as replicates in a three-
factor-ANOVA-test to statistically analyze the effect of the other variables.
RESULTS
Probe design and validation. Probes targeting the uncultured R. obeum-Mke bacteria were
designed based on comparative analysis of 16S rRNA sequences from the ARB and RDP
database and newly deposited sequences from GenBank. Despite the small sequence variation
in the hyper-variable VI region between the different sequences of this uncultured group, a
combination of two probes was sufficient to discriminate between this uncultured group and
the rest of the sequences in all databases (Table 1). These two probes hybridize at the same
target site and were used in a 1:1 mixture during all Robe63 probe hybridizations. Analysis of
the 16S rRNA sequence databases showed that the Robe63 probe has only two mismatches
with the targets of the R. obeum sequence and a sequence of a 16S rDNA clone from a rumen
sample (Table 1). All other sequences have three or more mismatches with the probe target
site. No match was found with the adhufecl71 sequence since the first non-discriminative
bases of the Robe63 probe target were not present in this sequence (15). Furthermore, no
match was found with any of the 23S rRNA sequences. Thirty-two reference strains (Table 2),
including R. obeum, did not hybridize with the Robe63 probe, while all of them showed
strong hybridization with the Eub338 probe as determined by microscopic and flow
cytometric analysis. For the microscopic analysis, hybridization buffer containing 20%
formamide was chosen since a few cells (~1% of Eub338 positive cells) of the
Peptostreptococcus micros culture and about 10-20% of Eub338 positive R. obeum cells
hybridized with the Robe63 probe when no formamide was added. For flow cytometric
analysis Cy5-labeled probes, which give emission in the far red, were used since no adverse
autofluorescence was observed in this detector channel (FL4) when fecal samples or reference
strains were analyzed. However, autofluorescence of unlabeled fecal samples was observed in
all other detectors (FL1 to FL3), which detect green, yellow, and red fluorescent signals,
respectively (data not shown). It appeared that the addition of formamide in the hybridization
136

buffer could not be used during flow cytometric analysis when Cy5-labeled probes were used.
No hybridization signal could be detected when formamide was added even when the
reference strains were hybridized with the Eub338 probe. However, washing of Robe63
probe-hybridized cells with the low-salt washing buffer was sufficient to render all negative
reference strains unlabeled, while maintaining specific hybridization in fecal samples. Only
the cells of R. obeum showed some weak positive hybridization with the Robe63 probe under
these conditions, although the signal was more than ten-fold lower than positively hybridized
cells in a fecal sample.
Fig. 2. Photographs of fecal cells in one microscopic field hybridized with (A) the Cy3-labeled Robe63 probe
and (B) the FITC-labeled Erec482 probe. The bar scale is 5 |itn.
Since no isolate is available to serve as a positive control strain for the Robe63 probe,
a double hybridization of fecal samples was performed using the Robe63 and Erec482 probes.
This latter probe targets the Clostridium coccoides - Eubacterium rectale group to which the
uncultured group of R. obeum-like bacteria belongs. Microscopic analysis revealed that all
cells that hybridized with the Robe63 probe also hybridized with the Erec482 probe (Fig. 2).
All Robe63-positive cells were morphologically similar in all fecal samples examined (a
relatively large duplococcus; Fig. 2A), while the Erec482-positive cells exhibited many
different morphotypes (Fig. 2B). Flow cytometric analysis revealed similar results as obtained
with microscopic examination (Fig. 3). Although the Erec482 probe was double FITC-
labeled, it could be used in combination with the Cy5-labeled Robe63 probe, since the
Robe63-positive cells did not show auto fluorescence in the FL1 detector, which detects the
FITC-labeled cells. The Cy5-labeled Robe63-positive cells were also detected as Erec482-
137

positive cells and could clearly be discriminated from unlabeled cells (Figs. 3A and 3B).
When these double labeled cells were gated, they appeared as a very small cluster in the flow
cytometric dot blots of the forward-angle light scatters (FSC) versus side-angle light scatters
(SSC), indicating that these cells exhibited limited morphological variability (Fig 3C). This
combination of microscopic and flow cytometric analyses indicate that it is very likely that
the right approach is taken to detect the uncultured R. obeum-likc bacteria.
& i n •<-
& 2
A
10° 101 102 103
Erec482-FITC 10"
e> V-J • •-
>* U
< ^ >=> \o ^ .o Us
o
R
lial t«-
* • • .
10° 101 102 103
Erec482-FITC 104
Fig. 3. Flow cytometric analysis of fecal samples showing the dot plots representing the Robe63-Cy5
fluorescence intensity and Erec482-FITC fluorescence intensity of (A) unhybridized bacteria and (B) Robe63
plus Erec482 hybridized bacteria in feces. Cells labeled with both probes (as indicated by the arrow in plot B)
were marked with a dark color and appeared as a small cluster in dot plots of the forward-angle light scatters
(FSC) versus side-angle light scatters (SSC) of the total community (C), indicating limited morphological
variability among these bacteria.
Comparison between microscopic and flow cytometric analysis. Microscopic and flow
cytometric counts were determined and compared to determine the total number of bacteria,
the number of uncultured R. obeum bacteria and the Clostridium coccoides - Eubacterium
rectale group in feces (Table 3). To visualize the difference between the two approaches the
ratio of the mean counts for each probe per sample was determined. The ratios varied between
0.64 and 1.47 and only one relatively high ratio (1.93), which was found for a Robe63 count.
The mean percentage of the Clostridium coccoides - Eubacterium rectale group varied
between 16.9% and 13.5% as determined by microscopy and flow cytometry, respectively.
Similarly, the percentage of the uncultured R. obeum group was found to be 2.6% and 2.2% of
the total community, and 15.6% and 16.7% of the Clostridium coccoides - Eubacterium
rectale group. This indicated that both groups were predominantly present in fecal samples
138

u CO
<
o
0. < a
a •H
u
2 6 £ o
•5 5=
o
pi
^
w
C*
S -3 H IS
o -H
^f r-— o
os
o 41 so
o -H so
o 41 vo
— -H O
o 41 0>
o -H VO
o -H "n Os
o -H CN
en
™
-H o Os
VO O
O en o -H oo
o
o o -H VO in o
r -
VO
^ -H VD
r^
o p ^ 41 i n en oo
i n
o
t -o 41 CN t -
• *
• *
O -H in m en
o
VO O
en o 41
en
' '
O CN O 41 o o 0 0 o
»n
~
" n
~ -H i n
i n
o\ VO
O -H en Os >n
p
Os •n o -H o en en
e'en o
+1 CN
en
(N
Os O
CN
O -H i n
o
r -
o -H
r^ o
so
m
^ -H oo OS ^ f
o Os
^ 41 o en 00
en O
»n
O 41 i n
en
en en o 41
CN en
^
•n CN
' '
Os
O 4H
>n o
CN o 41
r--o
o oo o
Os
~ 41 i n • t t '
00 i n o 41 i n i n en
O
VO o 4H vo o CN
Tf o 41
IN
o
CN CN
' '
© © ' 41
en ©
VO o © 41 00 en o
ON ©
Os o 41
Os CN
VO
O 41 i n
CN
o p
OS © ' 41
•<t CN
i n (N o 41 en -3-CN
<N
O r n
' '
so
o 41
5-o
i n
o 41
i n o
en OS o
o p 7 - ^
41 so Os
oi
CN VO
o 41 Os
csi
o p
o i n ~ 41
CN CN
i n
d 41 en CN
CN
TT
o
'5 S
Q)
^ O
Q
x> -a
3 O
B at
H H
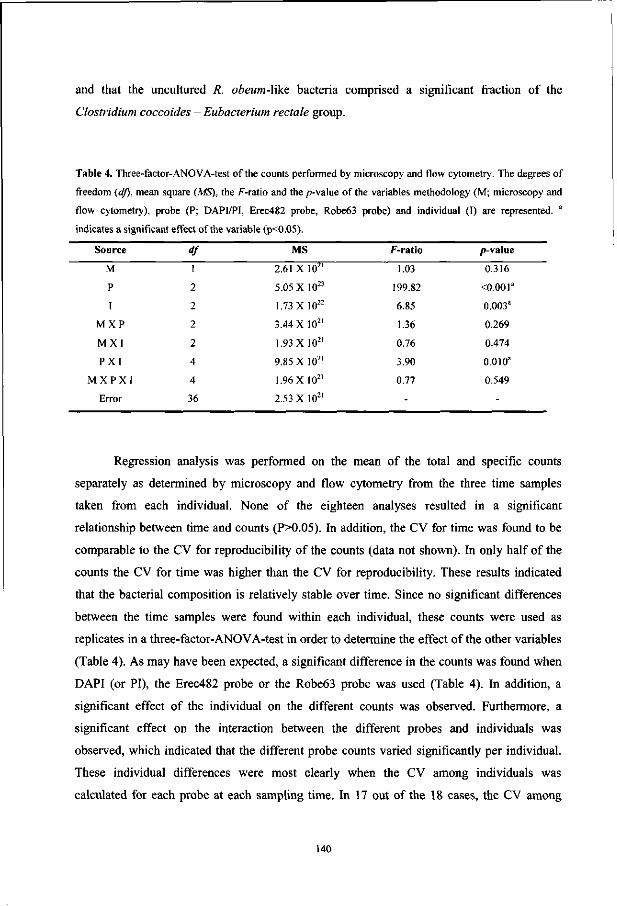
and that the uncultured R. obeum-like bacteria comprised a significant fraction of the
Clostridium coccoides - Eubacterium rectale group.
Table 4. Three-factor-ANOVA-test of the counts performed by microscopy and flow cytometry. The degrees of
freedom (df), mean square (MS), the F-ratio and the p-value of the variables methodology (M; microscopy and
flow cytometry), probe (P; DAPI/PI, Erec482 probe, Robe63 probe) and individual (I) are represented. a
indicates a significant effect of the variable (p<0.05).
Source
M
P
I
M X P
M X I
P X I
M X P X 1
Error
df
1
2
2
2
2
4
4
36
MS
2.61 X 10²¹
5.05 X 10²³
1.73 XI0 2 2
3.44 X 10²¹
1.93 X 10²¹
9.85 X 10²¹
1.96 X 10²'
2.53 X 10²¹
f-ratio
1.03
199.82
6.85
1.36
0.76
3.90
0.77
-
/>-value
0.316
<0.001a
0.003a
0.269
0.474
0.010a
0.549
-
Regression analysis was performed on the mean of the total and specific counts
separately as determined by microscopy and flow cytometry from the three time samples
taken from each individual. None of the eighteen analyses resulted in a significant
relationship between time and counts (P>0.05). In addition, the CV for time was found to be
comparable to the CV for reproducibility of the counts (data not shown). In only half of the
counts the CV for time was higher than the CV for reproducibility. These results indicated
that the bacterial composition is relatively stable over time. Since no significant differences
between the time samples were found within each individual, these counts were used as
replicates in a three-factor-ANOVA-test in order to determine the effect of the other variables
(Table 4). As may have been expected, a significant difference in the counts was found when
DAPI (or PI), the Erec482 probe or the Robe63 probe was used (Table 4). In addition, a
significant effect of the individual on the different counts was observed. Furthermore, a
significant effect on the interaction between the different probes and individuals was
observed, which indicated that the different probe counts varied significantly per individual.
These individual differences were most clearly when the CV among individuals was
calculated for each probe at each sampling time. In 17 out of the 18 cases, the CV among
140

individuals was higher than the CV for the assay (data not shown). This suggests that the
feces of each individual had a different bacterial composition. Furthermore, it was observed
that the different counting approaches did not have a significant influence on the outcome of
the counts.
DISCUSSION
This study describes the development, validation and application of the Robe63 probe to
detect, examine, and quantify uncultured R. obeum-like bacteria in human fecal samples. We
used a microscopic and flow cytometric approach in order to characterize the specificity of
the probe, the morphology of the cells, and the number of cells in different fecal samples. All
reference strains used as negative control in this study did not hybridize with the Robe63
probe and all Robe63 probe-labeled fecal cells also hybridized with the Erec482 probe that is
specific for the Clostridium coccoides - Eubacterium rectale group (5). This indicates that the
right target group was detected. While many different morphotypes of bacteria hybridized
with the Erec482 probe, only one morphotype, hybridized with the newly developed Robe63
probe. The Robe63 probe did not hybridize with the type strain R. obeum, which has of all
known sequences the least (only two) mismatches at the target site. The Robe63 probe was
designed and validated using currently available 16S rRNA sequences including several
hundreds of 16S rRNA sequences derived from cultured and uncultured GI tract bacteria.
Since various R. obeum-like sequences have been found frequently in fecal clone libraries
from different human individuals (15, 23), we conclude from the present data that the probe
can specifically detect a new and numerically important group of intestinal bacteria.
For microscopic analysis and flow cytometric analysis of FISH samples different
protocols were required due to the difference in handling procedures. Despite these different
approaches our data showed that the counts obtained for the Robe63 and the Erec482 probes
with either method were very similar (Table 3). Moreover they were reproducible. This
indicates that both approaches will give similar results when quantifying the number of
specific bacteria in environmental samples. In general, about 16% of the total bacterial
community in the fecal samples belonged the Clostridium coccoides - Eubacterium rectale
group, which is slightly lower than reported in another study (5). This difference may be due
to host-specific factors as observed previously (23). The percentage of the uncultured R.
obeum-like bacteria in the investigated samples was about 2.5%. This indicates that they
141

comprise a significant fraction of the predominant bacterial community in feces as observed
previously using PCR-based approaches (15, 23). Based on statistical analysis, we could
clearly observe a host-specific effect on the counts, while the counts did not vary significantly
in time. These results are in line with previous observations based on PCR and TGGE
analysis of fecal samples (23).
The results described in this study reveal that a group of uncultured R. obeum-like
bacteria, whose presence was only suggested repeatedly by 16S rDNA cloning studies of fecal
samples, is predominantly present in fecal samples as determined by FISH analysis using a
newly developed specific 16S rRNA targeted probe. Although the power of the 16S rRNA
probe hybridization has been demonstrated in many independent studies, its definitive value
in studying the ecology of uncultured bacteria requires additional systematic research. The
application of FISH combined with flow cytometry was demonstrated and offers a possibility
to sort the R. obeum-like bacteria and other uncultured populations in order to study them in
detail. Such studies may ultimately be helpful in refining our knowledge about the ecology of
the microorganisms in the human GI tract.
ACKNOWLEDGMENTS
We thank the volunteers that provided fecal samples for this study. We thank Chantal
Doeswijk for lyophilizing the fecal samples and Patrick Verbaarschot for technical assistance
during the flow cytometric analysis. Dr. Arjan de Visser was very helpful in the statistical
analysis of the data. In addition, we thank Dr. Michael Wagner and co-workers (TU Munich)
for their initial help and advice on FISH techniques.
REFERENCES
1. Aim E. W., D. B. Oerther, N. Larsen, D. A. Stahl, and L. Raskin. 1996. The oligonucleotide probe
database. Appl. Environ. Microbiol. 62:3557-3559.
2. Amann R. I., B. J. Binder, R. J. Olsen, S. W. Chrisholm, R. Devereux, and D. A. Stahl. 1990.
Combination of 16S rRNA-targeted oligonucleotide probes with flow cytometry for analyzing mixed
populations. Appl. Environ. Microbiol. 56:1919-1925.
3. Amann R. I., W. Ludwig, and K-H. Schleifer. 1995. Phylogenetic identification and in situ detection of
individual cells without cultivation. Microbiol. Rev. 59:143-169.
4. Bry L., P. G. Falk, T. Midtvedt, and J. I. Gordon. 1996. A model of host-microbial interactions in an open
mammalian ecosystem. Science 273:1381-1383.
142

5. Franks A. H. , H. J. M. Harmsen, G. C. Raangs, G. J. Jansen, F. Schut, and G. W. Welling. 1998.
Variations of bacterial populations in human feces measured by fluorescent in situ hybridization with group-
specific 16S rRNA-targeted oligonucleotide probes. Appl. Environ. Microbiol. 64:3336-3345.
6. Harmsen H. J. M., P. Elfferich, F. Schut, and G. W. Welling. 1999. A 16S rRNA-targeted probe for the
detection of lactobacilli and enterococci in faecal samples by fluorescent in situ hybridization. Microbial
Ecology in Health and Disease 11:3-12.
7. Harmsen H. J. M., A. C. M. Wildeboer-Veloo, J. Grijpstra, J. Knol, J. E. Degener, and G. W. Welling.
2000. Development of 16S rRNA-based probes for the Coriobacterium group and the Atopobium cluster and
their application for enumeration of Coriobacteriaceae in human feces from volunteers of different age groups.
Appl. Environ. Microbiol. 66:4523-4527.
8. Holdeman L. V., E. P. Cato, and W. E. C. Moore. 1977. Anaerobe laboratory manual, 4th ed. Virginia
Polytechnic Institute and State University, Blacksburg.
9. Hooper L. V., J. Xu, P. G. Falk, T. Midtvedt, and J. I. Gordon. 1999. A molecular sensor that allows a
gut commensal to control its nutrient foundation in a competitive ecosystem. Proc. Natl. Acad. Sci. USA
96:9833-9838.
10. Hooper L. V., M. H. Wong, A. Thelin, L. Hansson. P. G. Falk, and J. I. Gordon. 2000. Molecular
analysis of host-microbial relationships in the intestine. Science 291:881-884.
11. Maidak B. L., J. R. Cole, T. G. Lilburn, C. T. Parker Jr, P. R. Saxman, R. J. Farris, G. M. Garrity, G.
J. Olsen, T. M. Schmidt, and J. M. Tiedje. 2001. The RDP-1I (Ribosomal Database Project). Nucleic Acids.
Res. 29:173-174.
12. Schwiertz A., G. Le Blay, and M. Blaut. 2000. Quantification of different Eubacterium spp. in Human
fecal samples with species-specific 16S rRNA-targeted oligonucleotide probes. Appl. Environ. Microbiol.
66:375-382.
13. Simon N., N. LeBot, D. Marie, F. Parentsky, and D. Vaulot. 1995. Fluorescent in situ hybridization with
rRNA-targeted oligonucleotide probes to identify small phytoplankton by flow cytometry. Appl. Environ.
Microbiol. 61:2506-2513.
14. Strunk O., and W. Ludwig. 1995. ARB - a software environment for sequence data. Department of
Microbiology, Technical University of Munich, Munich, Germany, (http://www.mikro.biologie.tu-
Muenchen.de/pub/ARB/documentation/arb.ps).
15. Suau A., R. Bonnet, M. Sutren, J-J. Godon, G. R. Gibson, M. D. Collins, and J. Dore. 1999. Direct
analysis of genes encoding 16S rRNA from complex communities reveals many novel molecular species within
the human gut. Appl. Environ. Microbiol. 65:4799-4807.
16. Suau A., V. Rochet, A. Sghir, G. Gramet, S. Brewaeys, M. Sutren, L. Rigottier-Gois, and J. Dore\ 2001.
Fusobacterium prausnitzii and related species represent a dominant group within the human fecal flora. Sys.
Appl. Microbiol. 24:139-145.
17. Tannock G. W. 1995. Normal microflora. An introduction to microbes inhabiting the human body.
Chapman and Hall, London.
S 18. Tannock G. W., K. Munro, H. J. M. Harmsen, G. W. Welling, J. Smart, and P. K. Gopal. 2000.
! Analysis of the fecal microflora of human subjects consuming a probiotic product containing Lactobacillus
rhamnosus DR20. Appl. Environ. Microbiol. 66:2578-2588.
143

19. Vaughan E. E., G. H. J. Heilig, E. C. Zoetendal, R. Satokari, J. K. Collins, A. D. L. Akkermans, and
W. M. de Vos. 1999. Molecular approaches to study probiotic bacteria. Trends in Food Sciences and
Technology 10 (12): 400-404.
20. Wallner G., R. Amann, and W. Beisker. 1993. Optimizing fluorescent in situ hybridization with rRNA-
targeted oligonucleotide probes for flow cytometric identification of microorganisms. Cytometry 14:136-143.
21. Wallner G., B. Fuchs, S. Spring, W. Beisker, and R. Amann. 1997. Flow sorting of microorganisms for
molecular analysis. Appl. Environ. Microbiol. 63:4223-4231.
22. Wilson K. H., and R. H. Blitchington. 1996 Human colonic biota studied by ribosomal DNA sequence
analysis. Appl. Environ. Microbiol. 62:2273-2278.
23. Zoetendal E. G., A. D. L. Akkermans, and W. M. de Vos. 1998. Temperature gradient gel electrophoresis
analysis from human fecal samples reveals stable and host-specific communities of active bacteria. Appl.
Environ. Microbiol. 64:3854-3859.
24. Zoetendal E. G., A. D. L. Akkermans, W. M. Akkermans van-Vliet, J. A. G. M. de Visser, and W. M.
de Vos. 2001. The host genotype affects the bacterial community in the human gastrointestinal tract. Microbial
Ecol. Health Dis. 13:129-134.
144

Chapter 9
Victivallis vadensis gen. nov. sp. nov., a cellobiose-degrading
bacterium from human feces
Erwin G. Zoetendal, Caroline M. Plugge, Antoon D. L. Akkermans, and Willem M. de Vos
145

Abstract
A novel anaerobic cellobiose-degrading bacterium, strain Cello" was isolated from a
human fecal sample by combining enrichments in liquid and soft agar basal media. A
noteworthy characteristic was its inability to grow on normal agar plates and in roll
tubes. The cells were coccus shaped and non-motile. An extracellular slime layer was
surrounding the cells. Growth of strain Cello1 occurred between 20 and 40°C with
optimal growth rate at 37°C. The pH range for growth was 5 - 7.5 with optimum at 6.5.
In pure culture, strain Cello7 could only grow on a variety of sugars. Glucose was
converted to acetate, traces of propionate, H2, and an unidentified compound. The
doubling time on glucose was 0.5 h. In a syntrophic coculture with Methanospirillum
hugatei strain JF 1 strain Cello7 converted glucose to acetate and H2. The G+C content
of strain CelloT was 59.2 mol%. 16S rDNA analysis revealed that strain Cello7 was
phylogenetically related to a cluster of uncultured bacteria from a variety of ecosystems
belonging to the environmental_clone_WCHBl-41_subgroup. The closest relatives of
strain Cello7 were two uncultured bacteria from anaerobic digestors, both with 94%
16S rDNA sequence similarity. We propose the name Victivallis vadensis for strain
Cello as a new species of a new genus.
146

INTRODUCTION
The human gastrointestinal (GI) tract is a very complex ecosystem in which bacteria are in
close contact with each other and with the host's cells. Communication between the host and
the bacteria, from which the majority is strictly anaerobic, seems to be very important in this
ecosystem (2, 4, 5). Despite many intensive cultivation trials in order to isolate bacteria from
the human GI tract, it is estimated that at the moment only 10 to 50% of the bacteria in the
human GI tract can be obtained in culture (7, 10, 16, 17). Several reasons for this
unculturability may include the unknown growth requirements of the bacteria, the selectivity
of the very rich media which have mainly been used, the stress imposed by the cultivation
procedures and the necessity of strictly anoxic conditions, and the interactions of the bacteria
with other microbes and host cells. Many novel bacteria have been detected in feces using
several culture-independent approaches based on the variability of the 16S rRNA gene (16-
18). This implies that the physiological characteristics and function of the majority of the
human GI tract community is unknown.
In this study, we describe the isolation of a novel species belonging to a new genus,
strain Cello1 from the GI tract by using an alternative cultivation approach. Exposure of the
fecal sample to oxygen was minimized and a combination of liquid and soft agar basal
medium having cellobiose as the carbon source was used for isolation and cultivation.
MATERIALS AND METHODS
A fecal sample (-0.5 g) from a healthy Dutch man (25 years) was transferred within one minute after defecation
without homogenization into 10 ml sterile anoxic Ringers solution by using a syringe. This fecal suspension was
vortexed and 10,000 times diluted in anaerobic ringers. From this dilution 0.3 ml was used to inoculate 30 ml of
a bicarbonate-buffered anaerobic medium as described previously by Stams et al. (14), supplemented with 10
mM cellobiose and 0.7% (vol/vol) clarified, sterile rumen fluid. This medium was subsequently used to isolate
and cultivate strain Cello1 and to prepare plates and roll tubes by supplementation of 2% agar (agar noble: Difco,
Detroit, MI, USA) and soft agar (0.75% agar noble). For the plates the concentration of the phosphates was 5
times increased to enhance the buffering capacity. Other media used to cultivate the isolated strain Cello1
include: Wilkins-Chalgren broth (WC broth; Oxoid; 16 g l"1), medium (KA medium) as described by Kamlage
and colleagues (6) with minor modifications [no hemin, bacteriological peptone (Oxoid) instead of tryptic
peptone from meat], both supplemented with 0.7% clarified, sterile rumen fluid, and Biolog Universal Anaerobic
(BUA) agar plates (Stag, St. Katalijne Waver, Belgium). Antibiotics streptomycin (100 mg l"1) and polymyxin B
(20 mg l"1) were used to remove a fecal contaminant. Aerobic LB medium (9) was used to check the presence of
147

the contaminant. All incubations were done at 37°C. Basal media containing several carbon sources were used to
determine the utilization of different carbon sources by strain Cello1. The optimal growth temperature of strain
Cello1 was determined in basal medium of pH 7 containing cellobiose ranging from 4°C to 45°C. The pH range
was determined in WC broth at 37°C ranging from pH 5 to pH 8 (with 0.5 pH unit intervals, adjusted with
NaOH or HC1). HPLC and GC analyses were performed as described previously (14).
Methanospirillum hungatei JF1 (DSM 864) was used as partner organism in syntrophic cultures. For the
cultivation of M. hungatei a gas phase of 182 kPa H2/C02 (80:20, v/v) was used and after growth the gas phase was
exchanged to N2/C02 and the bottles were inoculated with strain Cello (1%, v/v) and glucose (approx. 10 mM final
concentration).
Gram staining and light microscopy were performed as described elsewhere (11). For transmission
electron microscopy, cells were fixed in 2.5% glutaraldehyde in cacodylate buffer at 0°C for 2 h. After rinsing
with cacodylate buffer a post-fixing was performed in a 2:1 mixture of 1% Os04 and 5% K2Cr207 at room
temperature for 2 h. After rising with water the cells were post-stained with 1% uranyl acetate overnight,
dehydrated in graded ethanol series, and embedded in Epon (Glycid ether (Serva)). Ultra thin coupes were post-
stained with lead citrate (3) and analyzed using a Philips CM10 TEM.
DNA isolation, PCR and sequencing of the complete 16S rDNA, and determination of the G+C content
was performed as reported recently (12). BLAST was used for homology searches (1) and the ARB and RDP
programs were used for phylogenetic analysis (8, 15). PCR and DGGE analysis of the V6 to V8 regions of 16S
rDNA of the enrichment cultures was performed as described before (19).
RESULTS AND DISCUSSION
Anaerobic basal medium with cellobiose as sole carbon source was inoculated with a diluted
fecal suspension in Ringers. After two days of incubation at 37°C growth was observed.
Microscopic analysis revealed that a coccus-shaped bacterium became predominant. In
addition, a rod-shaped organism was observed. This rod-shaped bacterium grew very well
under oxic conditions in LB medium at 37°C. Repeated transfers in serial dilution of the
enrichment to fresh media showed a decrease in number of rod-shaped bacteria. However, it
was never outcompeted completely, since the rod-shaped bacteria still could be found in
parallel incubations in LB medium. DGGE analysis of 16S rDNA revealed that this rod-
shaped bacterium is very likely an E. coli strain. Therefore, the enrichment was transferred to
medium containing streptomycin and polymyxin B to inhibit growth of the rod-shaped
bacterium. After one week of incubation growth of the coccus-shaped bacterium was
observed while no growth of the enrichment culture was observed in LB medium. This could
also be visualized when the V6 to V8 regions of the 16S rDNA from the cultures were
analyzed by DGGE (Fig 1).
148

Before the antibiotic treatment there is still a tiny band representing the rod-shaped bacterium
present, while it is absent after the antibiotic treatment. This indicates that the rod-shaped
bacterium was not present anymore in the enrichment. Cultivation of the enrichment in two
different very rich media for growing fermentative bacteria (KA medium and WC broth),
resulted only in the growth the same coccus-shaped bacterium after one and two days
respectively as indicated by microscopic and DGGE analysis (Fig 1).
Before After
B C D
Strain CelloT
Fig. 1. DGGE analysis of amplified V6 to V8 regions of the 16S rRNA gene of strain Cello1 cultures before (A)
and after (B-D) the antibiotic treatment. Lanes B, C, and D represent the cultures grown on minimal medium
with cellobiose, KA medium, and WC broth, respectively. The contaminant in culture A before the antibiotic
treatment is indicated (X).
Despite several attempts to cultivate this isolate on solid media containing 2% agar
(plates and roll tubes) having the same components as the liquid media, no colonies were
obtained. In addition, no colonies were formed on BUA agar plates, which are regarded as
universal media for anaerobic bacteria. The lack of growth on solid media might be a reason
why this fermentative bacterium has never been cultivated so far. In addition, this lack of
growth on agar plates can be seen as a confirmation of its purity, since it is very unlikely that
a random contaminant cannot grow on general solid media as well. Incubation in soft agar
(0.75%) was more successful. Serial dilution of the enrichment in basal medium having
cellobiose as carbon source resulted after 10 days in the development of beige, shiny, lens-
149
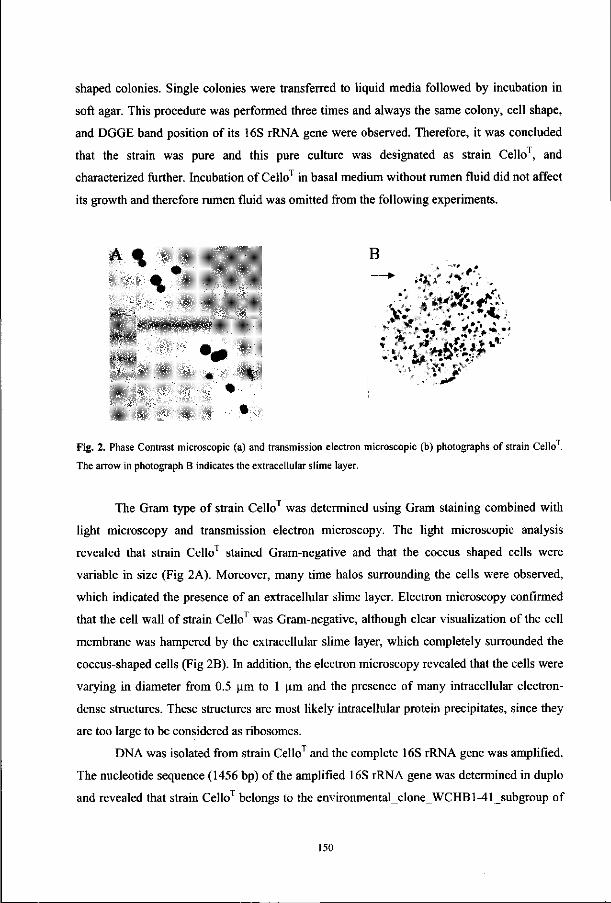
shaped colonies. Single colonies were transferred to liquid media followed by incubation in
soft agar. This procedure was performed three times and always the same colony, cell shape,
and DGGE band position of its 16S rRNA gene were observed. Therefore, it was concluded
that the strain was pure and this pure culture was designated as strain Cello1, and
characterized further. Incubation of Cello1 in basal medium without rumen fluid did not affect
its growth and therefore rumen fluid was omitted from the following experiments.
°*
Fig. 2. Phase Contrast microscopic (a) and transmission electron microscopic (b) photographs of strain Cello .
The arrow in photograph B indicates the extracellular slime layer.
The Gram type of strain Cello7 was determined using Gram staining combined with
light microscopy and transmission electron microscopy. The light microscopic analysis
revealed that strain Cello1 stained Gram-negative and that the coccus shaped cells were
variable in size (Fig 2A). Moreover, many time halos surrounding the cells were observed,
which indicated the presence of an extracellular slime layer. Electron microscopy confirmed
that the cell wall of strain Cello7 was Gram-negative, although clear visualization of the cell
membrane was hampered by the extracellular slime layer, which completely surrounded the
coccus-shaped cells (Fig 2B). In addition, the electron microscopy revealed that the cells were
varying in diameter from 0.5 um to 1 urn and the presence of many intracellular electron-
dense structures. These structures are most likely intracellular protein precipitates, since they
are too large to be considered as ribosomes.
DNA was isolated from strain Cello7 and the complete 16S rRNA gene was amplified.
The nucleotide sequence (1456 bp) of the amplified 16S rRNA gene was determined in duplo
and revealed that strain Cello7 belongs to the environmentalcloneWCHB 1-41 subgroup of
150

the Prosthecobacter group according to the tree-of-life of the RDP (8). It is noteworthy that
this subgroup has no cultured reference organism and that it only consists of sequences from
different environments retrieved by PCR and cloning approaches. A neighbor-joining tree was
constructed using the closest related 16S rDNA sequences of the Cello1 sequence,
Verrucomicrobium spinosum and Prosthecobacter species to represent the Prosthecobacter
group (Fig 3). This tree demonstrates that strain Cello1 is closest related to clones from
anaerobic digestors (clones AA08, vadinHB65, and vadinBE97), rumen (clones RFN4 and
RFN44), and a deep-sea sediment (clone BD2-3). The closest relatives of strain Cello7 were
clone AA08 and clone vadinHB65 with only 94% sequence similarity which is below the
97% threshold for species discrimination (13). No cultured strain is closely related to strain
CelloT which indicates that we isolated a bacterium belonging to a yet undescribed genus. The
G+C content of strain Cello1 was 59.2 mol%.
I Clone vadinHB65,U81755 _ j Clone AA08.AF275917
1 Strain cello, AY049713 Clone RFN44, AB009200
Clone RFN4.AB009195 Clone vadinBE97, U81707
Clone BD2-3, AB015533 j " Prosthecobacter fitsiformis, U60015
. 1 Prosthecobacter sp. FC-3, U60014
| Prosthecobacter sp. K'- /, U60012 Prosthecobactersp. FC-2, U600I3
Verrucomicrobium spinosum, X905I5
Escherichia coli, JO 1859
Fig. 3. Neighbor-joining tree showing the phylogenetic relationship of 16S rDNA sequences from strain Cello1
(indicated in bold) and it's closest relatives in the DNA databases. The bar represents 10% sequence divergence.
Clones vadinBE97, vadinHB65 and AA08 originate from anaerobic digestor samples, clones RFN4 and RFN44
originate from rumen samples.
Since no cultivable bacterium is closely related to strain Cello , a detailed
physiological comparison with distantly related bacteria is not possible. To characterize strain
Cello1 it was cultured in basal liquid media supplemented with several carbon sources. A
variety of sugars and other carbon sources were tested (table 1). It appeared that strain Cello1
grows well on a variety of sugars, while no growth was observed on alcohols, proteins,
pyruvate, and fumarate.
151
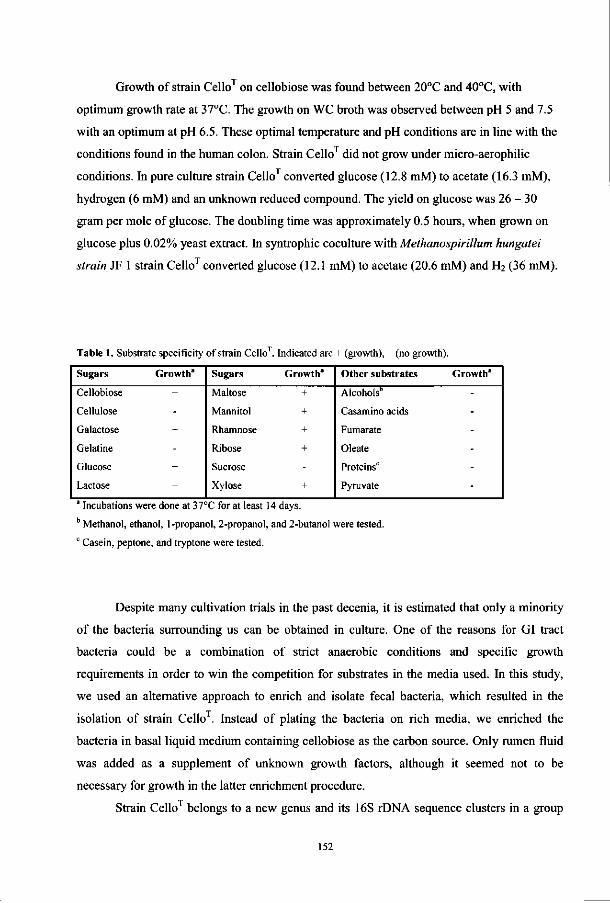
Growth of strain Cello1 on cellobiose was found between 20°C and 40°C, with
optimum growth rate at 37°C. The growth on WC broth was observed between pH 5 and 7.5
with an optimum at pH 6.5. These optimal temperature and pH conditions are in line with the
conditions found in the human colon. Strain Cello1 did not grow under micro-aerophilic
conditions. In pure culture strain Cello1 converted glucose (12.8 mM) to acetate (16.3 mM),
hydrogen (6 mM) and an unknown reduced compound. The yield on glucose was 26 - 30
gram per mole of glucose. The doubling time was approximately 0.5 hours, when grown on
glucose plus 0.02% yeast extract. In syntrophic coculture with Methanospirillum hungatei
strain JF 1 strain Cello1 converted glucose (12.1 mM) to acetate (20.6 mM) and H2 (36 mM).
Table 1. Substrate specificity of strain Cello . Indicated are + (growth), - (no growth).
Sugars
Cellobiose
Cellulose
Galactose
Gelatine
Glucose
Lactose
Growth"
+
-+
-+
+
Sugars
Maltose
Mannitol
Rhamnose
Ribose
Sucrose
Xylose
Growth"
+
+
+
+
-+
Other substrates
Alcohols"
Casamino acids
Fumarate
Oleate
Proteins"
Pyruvate
Growth"
------
Incubations were done at 37°C for at least 14 days. b Methanol, ethanol, 1-propanol, 2-propanol, and 2-butanol were tested. c Casein, peptone, and tryptone were tested.
Despite many cultivation trials in the past decenia, it is estimated that only a minority
of the bacteria surrounding us can be obtained in culture. One of the reasons for GI tract
bacteria could be a combination of strict anaerobic conditions and specific growth
requirements in order to win the competition for substrates in the media used. In this study,
we used an alternative approach to enrich and isolate fecal bacteria, which resulted in the
isolation of strain Cello . Instead of plating the bacteria on rich media, we enriched the
bacteria in basal liquid medium containing cellobiose as the carbon source. Only rumen fluid
was added as a supplement of unknown growth factors, although it seemed not to be
necessary for growth in the latter enrichment procedure.
Strain Cello1 belongs to a new genus and its 16S rDNA sequence clusters in a group
152

which only comprised of many cloned sequences from different ecosystems. Since most
cultivation trials of bacteria from ecosystems including the human GI tract are performed on
agar media and since strain Cello grows relatively slow in soft-agar media, we speculate that
this is the main reason why Cello like bacteria have never been isolated before. The limited
carbon source specificity of strain Cello could also be a reason why such strains have not
been obtained in culture before. Therefore, we suggest that alternative cultivation approaches,
such as the approach described here, may result in the isolation of novel species. Remarkably,
the closest uncultured relatives of strain Cello1 derive from the rumen and anaerobic digestors
fed with wastewater containing plant material. Since cellulose is a major component of plant
material consisting of cellobiose units, on which strain Cello1 was isolated, cellobiose could
be used as carbon source in cultivation trials of similar strains from the rumen and reactors.
Description of Victivallis gen. nov. Victivallis (Vic.ti.vaP. lis. M.L. m. Victus, N. L. m. food.
Vallis, N.L.f. valley). Victivallis referring to the Wageningen "Food Valley", which includes
Wageningen and surroundings, an area in The Netherlands in which Food Science is a major
research topic.
Non motile, Gram-negative cocci. Non-spore forming. Strictly anaerobic. Cells produce
extracellular material. Growth on sugars. Type species: Victivallis vadensis.
Description of Victivallis vadensis sp. nov. Victivallis vadensis (va.den'.sis M.L.n. Vada,
Wageningen, M.L.adj). vadensis referring to Wageningen. The complete name Victivallis
vadensis refers to the Wageningen Food Valley.
Gram-negative non-motile cocci. Single cells diameters vary between 0.5 and 1 urn. In pure
culture the cells can grow anaerobically on cellobiose, galactose, glucose, lactose, maltose,
mannitol, ribose, rhamnose, and xylose. Growth on 2% agar media is not observed. Cells
grow optimal at 37°C and pH 6.5. The DNA G+C base composition is 59.2 mol%. The type
strain is Cello1.
ACKNOWLEDGEMENTS
We thank Klaas Sjollema of the University of Groningen for performing the electron
microscopy. The determination of the G+C % by Dr. Lysenko at the institute of Microbiology
of the Russian Academy of Sciences in Moscow is highly appreciated. We thank Prof. H. G.
153
Triiper for his help regarding the Latin nomenclature.
REFERENCES
1. Altschul S. F., W. Gish, W. Miller, E. W. Meyers, and D. J. Lipman, D. J. 1990. Basic local alignment
search tool. J. Mol. Biol. 215:403-410.
2. Bry L., P. G. Falk, T. Midtvedt, and J. I. Gordon. 1996. A model of host-microbial interactions in an open
mammalian ecosystem. Science 273:1381-1383.
3. Cole R. M. and T. J. Popkin. 1981. Electron microscopy. In: Manual of methods for general bacteriology,
pp. 34-51, Eds. P. Gerhardt, R. G. E. Murray, R. N. Costilow, E. W. Nester, W. A. Wood, N. R. Krieg, and G. B.
Phillips. Washington DC: ASM.
4. Hooper L. V., J. Xu, P. G. Falk, T. Midtvedt, and J. I. Gordon. 1999. A molecular sensor that allows a gut
commensal to control its nutrient foundation in a competitive ecosystem. Proc. Natl. Acad. Sci. USA 96:9833-
9838.
5. Hooper L. V., M. H. Wong, A. Thelin, L. Hansson, P. G. Falk, and J. I. Gordon. 2000. Molecular analysis
of host-microbial relationships in the intestine. Science 291:881-884.
6. Kamlage B., L. Hartmann, B. Gruhl, and M. Blaut. 1999. Intestinal microorganisms do not supply
associated gnotobiotic rats with conjugated linoleic acid. J. Nutr. 129(12):2212-2217.
7. Langendijk P. S., F. Schut, G. J. Jansen, G. C. Raangs, G. Camphuis, M. F. Wilkinson, and G. W.
Welling. 1995. Quantative fluorescence in situ hybridization of Bifidobacterium spp. with genus-specific 16S
rRNA-targetted probes and its application in fecal samples. Appl. Environ. Microbiol. 61:3069-3075.
8. Maidak B. L., J. R. Cole, T. G. Lilburn, C. T. Parker Jr, P. R. Saxman, R. J. Farris, G. M. Garrity, G.
J. Olsen, T. M. Schmidt, and J. M. Tiedje. 2001. The RDP-II (Ribosomal Database Project). Nucleic Acids.
Res. 29:173-174.
9. Maniatis T., E. F. Fritsch, and J. Sambrook. 1989. Molecular cloning: a laboratory manual, 2nd ed. New
York: Cold Spring Harbor Laboratory, Cold Spring Harbor.
10. McFarlane G. T. and G. R. & Gibson. 1994. Metabolic activities of the normal colonic microflora In:
Human Health: Contribution of micro organisms, pp. 17-38, ed. S. A. W. Gibson. Frankfurt: Springer.
11. Plugge C. M., E. G. Zoetendal, and A. J. M. Stains. 2000. Caloramator coolhaasii sp. nov., a glutamate-
degrading, moderately thermophilic anaerobe. Int. J. Syst. Evol. Microbiol. 50:1155-1162.
12. Plugge C. M., M. Balk, E. G. Zoetendal, and A. J. M. Stams. 2001. Gelria glutamica, gen. nov., sp. nov.,
a thermophylic obligate syntrophic glutamate-degrading anaerobe. Int. J. Syst. Evol. Microbiol, in press.
13. Stackebrandt E. and B. M. Goebel. 1994. Taxonomic note: A place for DNA-DNA reassociation and 16S
rRNA sequence analysis in the present species definition in bacteriology. Int. J. Syst. Bacteriol. 44:846-849.
14. Stams A. J. M, J. B. van Dijk, C. Dijkema, and C. M. Plugge. 1993. Growth of syntrophic propionate-
oxidizing bacteria with fumarate in the absence of methanogenic bacteria. Appl. Environ. Microbiol. 59:1114-
1119.
15. Strunk O. and W. Ludwig. 1995. ARB - a software environment for sequence data. Department of
Microbiology, Technical University of Munich, Munich, Germany, (http://www.mikro.biologie.tu-
154

Muenchen.de/pub/ARB/documentation/arb.ps).
16. Suau A., R. Bonnet, M. Sutren, J-J. Godon, G. R. Gibson, M. D. Collins, and J. Dore. 1999. Direct
analysis of genes encoding 16S rRNA from complex communities reveals many novel molecular species within
the human gut. Appl. Environ. Microbiol. 65:4799-4807.
17. Wilson K. H. and R. H. Blitchington. 1996. Human colonic biota studied by ribosomal DNA sequence
analysis. Appl. Environ. Microbiol. 62:2273-2278.
18. Zoetendal E. G., A. D. L. Akkermans, and W. M. de Vos. 1998. Temperature gradient gel electrophoresis
analysis from human fecal samples reveals stable and host-specific communities of active bacteria. Appl.
Environ. Microbiol. 64:3854-3859.
19. Zoetendal E. G., A. D. L. Akkermans, W. M. Akkermans van-Vliet, J. A. G. M. de Visser, and W. M.
de Vos. 2001. The host genotype affects the bacterial community in the human gastrointestinal tract. Microbial
Ecol. Health Dis. 13:129-134.
155

Chapter 10
Concluding Remarks and Future Perspectives
157

The results described in this thesis are all based on a 16S rRNA approach which revealed new
insights into the ecology of the human GI tract. The major achievements will be highlighted
and discussed in the following paragraphs. Figure 1 gives a schematic representation of the
major findings and the possibilities for future research.
1.) COMPARISON BETWEEN PCR-DEPENDENT AND FISH APPROACHES
The combination of TGGE analysis, cloning and sequencing of 16S rDNA revealed that the
majority of GI tract bacteria have not been obtained in culture (Chapter 3). Similar
observations were confirmed by a study in which fecal 16S rDNA was randomly cloned and
sequenced (25). Although the fecal clone libraries from different studies (25, 32, Chapter 3)
show variations in composition, they all had in common that the majority of GI tract bacteria
belongs to the low G+C Gram positive species, which is in line with studies based on FISH
analysis using 16S rRNA targeted probes (7, 27). In addition, bacteria resembling
Fusobacterium prausnitzii and Ruminococcus obeum were found regularly in the fecal TGGE
profile of one individual and the clone libraries of different individual (25, Chapter 3) and
FISH analysis confirms that these bacteria are present in high numbers in fecal samples (7, 26,
Chapter 8). Notably, no bifidobacteria were detected in these clone libraries, while this group
represents a few percentages of the total community based on FISH quantification (7, 16).
This may be a result of biased PCR amplification and cloning to the disadvantage of high
G+C Gram positive species. On the other hand, bifidobacteria could easily be detected in
DGGE profiles of babies and healthy individuals (4) and after amplification using genus-
specific primers (23). Surprisingly, Bacteroides species were not detected in the TGGE
profile of the single individual that was analyzed in detail. Bacteroides 16S rDNA showed
one mismatch (10 bases from 3' end) with the U968-GC primer, which is used to amplify the
predominant bacterial community for DGGE and TGGE analysis. However, it is unlikely that
the absence of Bacteroides is a result of preferential amplification of the other bacteria. The
sequence analysis of some clones which did not correspond to the TGGE profile did also not
result in the retrieval of Bacteroides sequences, while Prevotella sequences having the same
mismatch with the primer could be visualized in the TGGE profile (Chapter 3). Furthermore,
the detection limit for PCR-DGGE analysis of Bacteroides fragilis was comparable to that of
158

some high and low G+C Gram positive GI tract species (Chapter 4) and competitive PCR
using complete 16S rDNA of Bacteroides fragilis and Clostridium clostridiiforme as template
DNA revealed that both could be visualized after DGGE analysis (33). However, it has to be
mentioned that Bacteroides fragilis and also clones corresponding to Prevotella species gave
fussy bands in DGGE and TGGE profiles and therefore they may fall into the background of
sharp bands, which hampers their detection. FISH analysis revealed that the number of
Bacteroides varies considerably (from approximately 0.1% to 20%) between individuals (1,
7). Cultivation of Bacteroides and total anaerobic bacteria from feces of the single individual
indicated that the total community only harbors a few percent of Bacteroides (33). Therefore,
it is likely that the absence of bands corresponding to Bacteroides species in the TGGE profile
and clone library of that individual is caused by the low numbers of Bacteroides in the feces
of the individual studied.
In our study we combined cloning and TGGE analysis. A major difference between
this approach and random clone library analysis is that the first approach will only select for
the dominant 16S rDNA sequences from a community. A numerically important group of
bacteria may consist of many underrepresented species. If for example these species
separately represent less than 1% of the community but about 10% as a group than some of
these underrepresented species will be selected by random cloning while they will not be
visualized by TGGE or DGGE analysis.
TGGE, DGGE, and randomly cloning of 16S rRNA genes are all PCR-based
approaches and therefore the outcome of these approaches cannot be converted to bacterial
numbers. FISH can be used to specifically detect and quantify bacteria using 16S rRNA
targeted probes, but it has to be realized that FISH is dependent on the available sequences in
the DNA databases. In addition, FISH analysis can be hampered by cross-reactions during
hybridization, the inaccessibility of the target, and a low number of target molecules.
In conclusion, comparison between the PCR-DGGE, random cloning, and FISH
approaches indicated that these approaches showed a high overlap in the detection of the
different groups of bacteria in feces. Since all methods on their own have their limitations, we
suggest that they should be combined to study the GI tract composition, since they
supplement each other with valuable information.
159

2.) LACTOBACILLUS-GROVP SPECIFIC PCR-DGGE
Lactobacillus and related lactic acid bacteria are suggested to have beneficial effects to the
host and are regularly used as probiotics in clinical trials. De Roos and Katan reviewed and
discussed the studies on the health effects of probiotics between 1988 to 1998 and concluded
that the only clear probiotic effect was the shortening of the course of rotavirus infection by
Lactobacillus GG (22). The authors argue that well-designed placebo-controlled studies with
validated outcome variables are needed to determine the other health effects of probiotics.
Recently, it was observed that Lactobacillus GG was effective in prevention of early atopic
disease in children at high risk (14).
The effect of such probiotics on the predominant bacterial community is still
questionable and could easily be demonstrated using the PCR-DGGE approach. Two
independent studies revealed that the probiotic strains tested did not affect a shift in the
human GI tract community (27, 29). Although these bacteria did not affect the dominant
community, they might affect the composition of related Lactobacillus and other lactic acid
bacteria in the GI tract. Since these lactic acid bacteria consist normally less than 1% of the
total community, they will not be visualized in DGGE profiles when general 16S rDNA
primers are used for PCR. Therefore, a primer specific for the Lactobacillus group was
developed to detect and monitor this group of bacteria in the GI tract. The primer appeared to
be suitable for specifically amplifying 16S rDNA from Lactobacillus, Pediococcus,
Leuconostoc, and Weissella species and the amplicons could be used for DGGE analysis
when a nested PCR approach was used (Chapter 5).
Another pair of primers to amplify the 16S rDNA from these lactic acid bacteria has
been described previously by Walter and colleagues (31). The authors claimed that only a
single PCR was sufficient to specifically detect these bacteria and analyze the amplicons by
DGGE. However, the validation of the primers was not stringent. Furthermore, a degenerated
primer having a C/T wobble base close to the 5' end was used, which may result in an
overestimation of the diversity of the Lactobacillus group. The bias caused by degenerated
primers has been reported for nitrifying bacteria (15).
Using our newly developed primer, several known Lactobacillus species were
detected in fecal samples and in addition some food-associated Lactobacillus and
Leuconostoc species were found in fecal and other GI tract samples, which is in line with
previous observations (31). During a probiotic trial, shifts in the Lactobacillus group
160

communities were found and the probiotic strain could be detected in feces. Recently, this
primer was also successfully applied in studying the shift in community structure during the
production of Ragusano cheeses (21). Therefore, we think that the newly developed primer set
will be very useful in studying the Lactobacillus group community in the human GI tract and
other ecosystems.
3.) HOST-RELATED IMPACT ON THE BACTERIAL COMMUNITY IN THE
HUMAN GI TRACT
Based on comparisons between fecal TGGE profiles, it was observed that these profiles were
host-specific and stable in time (Chapter 3). Similar observations were made previously by a
cultivation approach (13). These findings were confirmed during feeding trials using probiotic
strains with humans (27, 29) and pigs (24) based on DGGE approaches. In line with this, it
has been established that each individual harbors specific strains of Helicobacter pylori or
Bifidobacterium and Lactobacillus species (3, 17).
We also observed that host-genotype related factors may have a major impact on the
bacterial community structure in the GI tract as based analysis of fecal samples from adult
individuals with varying degrees of genetic relatedness and of colonic biopsy samples
(Chapters 6 and 7). The important role of the host on the bacterial community has been
discussed in several other studies. To our knowledge the first study with feces from mono-
and dizygotic twins was performed by van de Merwe and colleagues (19). They observed a
significant difference between mono- and dizygotic twins based on difference in cell
morphology of selected colonies from plates. It has to be mentioned that the twins in this
study include only children of varying ages. Therefore, the presence of a climax bacterial
community in these children is still questionable.
A stronger argument for a major role of the host genotype was given by Hackstein and
colleagues (8, 9). They performed studies in which the methane production in the intestine of
several vertebrates and invertebrates was measured. They found that the presence or absence
of methane production in the intestine is a phylogenetic character that obeys 'Dollo's rule',
i.e. traits that are lost in the course of evolution do not appear in any of the descendants of the
common ancestor that lost these traits. In line with this, only a fraction of humans harbor
significant methanogens in the intestine (20). On the other hand, comparisons between mono-
and dizygotic twins revealed that shared environmental factors have a major impact on the
161

methane production (6). However, the twin pairs consisted of children in their puberty and
therefore it is likely that they still do not harbor a climax community in their intestine, making
the enhancing influence of environmental factors possible.
A major impact of the host genotype on the bacterial community was also observed in
mice. Toivanen and colleagues studied the bacterium-derived cellular fatty acids in fecal
samples of mouse strains cogenic for the major histocompatability complex (28). In line with
the above-mentioned studies they suggested that the bacterial composition in the GI tract is
genetically regulated.
The host-related influences on the GI tract community have been observed by a
variety of studies, based on different microbiological approaches. These studies argue
strongly that host-related factors have a major impact on the bacterial community in the GI
tract. However, we can so far only speculate what these factors are. The GI tract is a very
complex ecosystem in which interactions between the bacteria, the immune system, the
epithelium, host secreted compounds, and food take place. A major effect of the host may be
related to receptors in the epithelium, the action of the immune system, the secretion of
specific compounds or a combination of these. Recent studies indicate that communication
between bacteria and the host are important for a stable GI tract community (2, 10, 11). The
first molecular details of the cross talk between Bacteroides thetaiotaomicron and its murine
host have been elucidated. Therefore, future studies on the GI tract ecosystem should include
those trying to unravel the molecular details of the interactions between host and bacterial
cells.
4.) ALTERNATIVE APPROACHES TO STUDY THE ROLE OF UNCULTURED GI
TRACT BACTERIA
Using 16S rRNA approaches many novel species have been detected in the human GI tract
(25, 32, Chapter 3). Despite, our knowledge about the majority of the GI tract bacteria
remains still limited. To understand the ecology of the GI tract the physiological activity of
these uncultured bacteria should be determined. In Chapter 9 we describe a strain isolated
from feces which belongs to a novel genus. This strain was isolated using an alternative
cultivation method with liquid basal medium and cellobiose as major carbon source. The
majority of isolates from the GI tract have been obtained by using (selective) solid media
(reviewed by 5). Total anaerobic counts are mostly done after incubation of feces in very rich
162

media for a few days at 37 °C. A striking characteristic of our novel isolate is its inability to
grow on conventional plates solidified with agar. However, after 10 days of incubation it
appears as colonies in soft agar. This characteristic may be a reason why bacteria belonging to
this genus have never been found before. Therefore, one way to obtain novel isolates from the
human GI tract may include the enrichment in liquid basal media using several carbon
sources. Another possibility for retrieving new isolates might be a longer incubation of the
plates at 37°C and look for colonies derived from slower-growing bacteria.
Despite many cultivation trials, it may of course still be possible that important
members of the GI tract community will not be isolated, because we simply do not know their
growth requirements or they have obligate syntrophic interactions. In Chapter 8 we
compared a microscopic and a flow cytometric quantification of Ruminococcus obeum-like
bacteria. Since both methods gave similar results, the flow cytometric approach may give new
opportunities to study uncultured bacteria. Hybridized cells could specifically be sorted and
used for further analysis.
External effects
Novel bacteria
GI tract ecosystem
16SrRNA approach
New cultivation trials
Flow cytometric sorting
In situ activity
Host-related impact
Unravel interactions
Climax community'
Development of Genome and Microarray-based Approaches
Fig. 1. Schematic overview of the findings obtained during this study and the possibilities for future research
(bold) in the GI tract ecology.
FUTURE PERSPECTIVES
The current study demonstrated that molecular approaches based on the 16S rRNA sequence
163

variability gave novel insights into the bacterial diversity in the GI tract. These approaches
could be instrumental for studying the development of a host-specific bacterial community
until a climax host-specific community is reached (Figure 1). In addition, these approaches
could be used to study effects of external factors such as prebiotics, probiotics, antibiotics,
food additives, and GI tract disorders.
Several studies indicated already the power of combining flow cytometry and 16S
rDNA analysis. Wallner and colleagues (30) showed that specific groups of bacteria could be
sorted from several environmental samples and afterwards the sorted fractions could be used
for further molecular analysis. Such flow cytometric approaches will be very instrumental to
analyze uncultured bacteria from the human GI tract.
An explosive increase in the availability of various genome sequences in DNA
databases and the development of microarrays and related technological developments
occurred during the past years. These developments are promising for studying the role of the
bacterial community, the host, and external effects on the GI tract ecosystem (Figure 1). It
should be possible to correlate changes in bacterial gene expression and in host gene
expression using the sequence information of genomes and microarray technology and relate
the observations to the physical state of the GI tract or the role of food, probiotics, and other
external effects. Hooper and colleagues used a microarray approach to study the
transcriptional responses of the host cells on colonization of Bacteroides thetaiotaomicron
(11). In addition, they suggested to use the collective genomes of the microbes in the GI tract,
a so-called microbiome, for future studies (12). Such studies may help in unraveling the role
of the bacteria in the human GI tract and expend our knowledge about the ecology of the
human GI tract.
REFERENCES
1. Apostolou E., L. Pelto, P. V. Kirjavainen, E. Isolauri, S. J. Salminen, and G. R. Gibson. 2001.
Differences in the gut bacterial flora of healthy and milk-hypersensitive adults, as measured by fluorescence in
situ hybridization. FEMS. Immunol. Med. Microbiol. 30:217-221.
2. Bry L., P. G. Falk, T. Midtvedt, and J. I. Gordon. 1996. A model of host-microbial interactions in an open
mammalian ecosystem. Science 273:1381-1383.
3. Covacci A., J. L. Telford, G. Del Giudice, J. Parsonnet, and R. Rappouli. 1999. Helicobacter pylori
virulence and genetic geography. Science 284:1328-1333.
4. Favier C. F., E. E. Vaughan, W. M. de Vos, and A. D. L. Akkermans. 2001. Molecular monitoring of
succession of bacterial communities in human neonates. Appl. Environ. Microbiol, submitted.
164

5. Finegold S. M., V. L. Sutter, and G. E. Mathisen. 1983. Normal indigenous intestinal flora, p.3-31. In. D.
J. Hentges (ed.), Human intestinal microflora in health and disease. Academic press, New York.
6. Florin T. H. J., G. Zhu, K. M. Kirk, and N. G. Martin. 2000. Shared and unique environmental factors
determine the ecology of methanogens in humans and rats. Am. J. Gastroenterol. 95:2872-2879.
7. Franks A. H. , H. J. M. Harmsen, G. C. Raangs, G. J. Jansen, F. Schut, and G. W. Welling. 1998.
Variations of bacterial populations in human feces measured by fluorescent in situ hybridization with group-
specific 16S rRNA-targeted oligonucleotide probes. Appl. Environ. Microbiol. 64:3336-3345.
8. Hackstein J. H. P., C. K. Stumm. 1994. Methane production in terrestrial arthropods. Proc. Natl. Acad. Sci.
USA 91:5441-5445.
9. Hackstein J. H. P., T. A. van Alen. 1996. Fecal methanogens and vertebrate evolution. Evolution 50:559-
572.
10. Hooper L. V., J. Xu, P. G. Falk, T. Midtvedt, and J. I. Gordon. 1999. A molecular sensor that allows a
gut commensal to control its nutrient foundation in a competitive ecosystem. Proc. Natl. Acad. Sci. USA
96:9833-9838.
11. Hooper L. V., M. H. Wong, A. Thelin, L. Hansson. P. G. Falk, and J. I. Gordon. 2000. Molecular
analysis of host-microbial relationships in the intestine. Science 291:881-884.
12. Hooper L. V., and J. I. Gordon. 2001. Commensal host-bacterial relationships in the gut. Science
292:1115-1118.
13. Holdeman L. V., I. J. Good, and W. E. C. Moore. 1976. Human fecal flora: Variation in bacterial
composition within individuals and a possible effect of emotional stress. Appl. Environ. Microbiol. 31:359-375.
14. Kalliomaki M., S. Salminen, H. Arvilommi, P. Kero, P. Koskinen, and E. Isolauri. 2001. Probiotics in
primary prevention of atopic disease: a randomised placebo-controlled trial. Lancet 357:1076-1079.
15. Kowalchuk G. A., J. R. Stephen, W. de Boer, J. I. Prosser, T. M. Embley, and J. W. Woldendorp.
1997. Analysis of ammonia-oxidizing bacteria of the p subdivision of the class Proteobacteria in coastal sand
dunes by denaturing gel electrophoresis and sequencing of PCR-amplified 16S ribosomal DNA fragments. Appl.
Environ. Microbiol. 63:1489-1497.
16. Langendijk P. S., F. Schut, G. J. Jansen, G. C. Raangs, G. R. Camphuis, M. F. Wilkinson, and G. W.
Welling. 1995. Quantative fluorescence in situ hybridization of Bifidobacterium spp. with genus-specific 16S
rRNA-targeted probes and its application in fecal samples. Appl. Environ. Microbiol. 61:3069-3075.
17. McCartney A. L., W. Wenzhi, and G. W. Tannock. 1996. Molecular analysis of the composition of the
Bifidobacterial and Lactobacillus microflora of humans. Appl. Environ. Microbiol. 62:4608-4613.
18. McFarlane G. T. and G. R. Gibson. 1994. Metabolic activities of the normal colonic microflora p. 17-38.
In. S. A. W. Gibson (ed.) Human Health: Contribution of microorganisms. Springer. Frankfurt.
19. Merwe J. P. van de, J. H. Stegeman, and M. P. Hazenberg. 1983. The resident flora is determined by
genetic characteristics of the host. Implications for Crohn's disease? Antonie van Leeuwenhoek 49:119-124.
20. Miller T. L., and M. J. Wolin. 1986. Methanogens in human and animal intestinal tracts. System. Appl.
Microbiol. 7:223-229.
21. Randazzo C. L., S. Torriani, A. D. L. Akkermans, W. M. de Vos, and E. E. Vaughan. 2001. Diversity
and dynamics of bacterial communities during production of an artisanal Sicilian cheese as evaluated by PCR-
DGGE and 16S rRNA analysis. Appl. Environ. Microbiol, submitted.
165

22. Roos N. M. de, and M. B. Katan. 2000. Effects of probiotic bacteria on diarrhea, lipid metabolism, and
carcinogenesis: a review of papers published between 1988 and 1998. Am J. Clin. Nutr. 71:405-411.
23. Satokari R. M., E. E. Vaughan, A. D. L. Akkermans, M. Saarela, and W. M. de Vos. 2001.
Bifidobacteria! diversity in human feces detected by genus-specific PCR and denaturing gradient gel
electrophoresis. Appl. Environ. Microbiol. 67:504-513.
24. Simpson J. M., V. C. McCracken, H. R. Gaskins, and R. I. Mackie. 2000. Denaturing gradient gel
electrophoresis analysis of 16S ribosomal DNA amplicons to monitor changes in fecal bacterial populations of
weaning pigs after introduction of Lactobacillus reuteri strain MM53. Appl. Environ. Microbiol. 66:4705-4714.
25. Suau A., R. Bonnet, M. Sutren, J-J. Godon, G. R. Gibson, M. D. Collins, and J. Dore. 1999. Direct
analysis of genes encoding 16S rRNA from complex communities reveals many novel molecular species within
the human gut. Appl. Environ. Microbiol. 65:4799-4807.
26. Suau A., V. Rochet, A. Sghir, G. Gramet, S. Brewaeys, M. Sutren, L. Rigottier-Gois, and J. Dore. 2001.
Fusobacterium prausnitzii and related species represent a dominant group within the human fecal flora. Sys.
Appl. Microbiol. 24:139-145.
27. Tannock G. W., K. Munro, H. J. M. Harmsen, G. W. Welling, J. Smart, and P. K. Gopal. 2000.
Analysis of the fecal microflora of human subjects consuming a probiotic product containing Lactobacillus
rhamnosus DR20. Appl. Environ. Microbiol. 66:2578-2588.
28. Toivanen P., J. Vaahtovuo, and E. Eerola. 2001. Influence of major histocompatibility complex on
bacterial composition of fecal flora. Infect. Immun. 69:2372-2377.
29. Vaughan E. E., G. H. J. Heilig, E. G. Zoetendal, R. Satokari, J. K. Collins, A. D. L. Akkermans, and
W. M. de Vos. 1999. Molecular approaches to study probiotic bacteria. Trends in Food Sciences and
Technology 10 (12): 400-404.
30. Wallner G., B. Fuchs, S. Spring, W. Beisker, and R. I. Amann. 1997. Flow sorting of microorganisms for
molecular analysis. Appl. Environ. Microbiol. 63:4223-4231.
31. Walter J., Hertel, C , Tannock, G. W., Lis, C. M., Murno, K., and Hammes, W. P. 2001. Detection of
Lactobacillus, Pediococcus, Leuconostoc, and Weissella species in human feces by using group-specific PCR
primers and denaturing gradient gel electrophoresis. Appl. Environ. Microbiol. 67:2578-2585.
32. Wilson K. H., and R. H. Blitchington. 1996 Human colonic biota studied by ribosomal DNA sequence
analysis. Appl. Environ. Microbiol. 62:2273-2278.
33. Zoetendal E. G. unpublished results.
166

Chapter 11
Summary
167

The human gastrointestinal (GI) tract is a complex ecosystem in which host and
microbial cells live in close contact with each other. The microbial community in the human
GI tract has an important nutritional and protective function (reviewed by 8). After birth, the
germ-free GI tract and is being colonized by the first invading microbes and this community
is successively changing in time, ultimately resulting in a stable climax community. Although
the details of obtaining and sustaining a complex microbial community in the GI tract are
unknown, recent studies indicate that interactions on molecular level between microbes and
host cells are important in this ecosystem (1-3). One of the major problems that hampers
studying the bacterial composition in the GI tract is the inability to obtain the predominant
bacteria in culture. Estimates of culturability vary between 10% and 50% (4, 6, 7, 9). One way
to overcome these culturability problems is the use of culture-independent approaches to
detect, monitor, and quantify bacteria in the human GI tract. Approaches using the sequence
variability of the 16S ribosomal (r)RNA gene have become widely applied, since the 16S
rRNA gene is an ideal phylogenetic marker consisting of variable and conserved regions. In
the middle of the year 2001 there were up to 20,000 nucleotide sequences of different 16S
rRNA genes available in several databases, which is far more than for any other gene (5).
In the present study, the bacterial communities in the human GI tract were investigated
using a culture-independent approach based on the sequence variability of bacterial 16S
rRNA genes. Our main questions to be answered were related to the composition of the
bacterial community in the GI tract, its stability in time, and the effect of the host on the GI
tract community (Chapter 1).
Based on estimates of culturability we expected a majority of uncultured bacteria to be
detected in the human GI tract. Therefore, our first approach was based on direct DNA
isolation from feces followed by PCR of 16S rDNA. Temperature and denaturing gradient gel
electrophoresis (TGGE and DGGE, respectively) combined with cloning and sequence
analysis of amplified 16S rDNA was performed to analyze and monitor the bacterial diversity
in human GI tract samples. The application of such fingerprinting techniques, their benefits,
and their drawbacks to describe bacterial communities in ecosystems like the human GI tract
have extensively been discussed in Chapter 2.
Chapter 3 describes the application of TGGE and sequence analysis of 16S rRNA
and rDNA amplicons to characterize and monitor the predominant bacterial community in
human fecal samples. Before starting this culture-independent analysis of varying GI tract
168

samples from humans, we optimized and validated carefully the nucleic acid isolation from
feces, the subsequent reverse transcriptase (RT-) and regular PCR amplification, and the
generation of TGGE profiles from the bacterial communities. TGGE analysis of the V6 toV8
regions of fecal 16S rRNA and rDNA revealed that the bacterial communities were host-
specific and stable in time. Only slight differences in band intensities were observed when
DNA and rRNA derived profiles were compared, indicating that the predominant bacterial
16S rRNA genes are also predominantly expressed in the colon. Since TGGE profiles
revealed to be host-specific, the bands of a fecal profile from one individual were identified
by a cloning and sequencing approach. Somewhat more than half of the clones corresponded
to one of the predominant amplicons in the TGGE profile and most of them appeared to
originate from novel Gram-positive species which is in line with cloning-based observations
(7, 9).
An improved procedure to isolate DNA from samples containing a small number of
cells, such as biopsy samples from the human colon is described in Chapter 4. Compared to
feces which may contain up to 1012 cells per gram the number of cells in biopsy samples is
very small (approximately 106 cells per biopsy) and therefore the DNA recovery must be
optimal and the bias introduced by the cell lysis procedure has to be minimized. The recovery
of DNA during the precipitation could be improved by adding glycogen as co-precipitant and
a detection limit of 105 cells was reached for the PCR-DGGE approach. Although the
detection limit varied between the different species, this bias was relatively small compared to
another DNA isolation protocol in which cells were lyzed by boiling in a Triton-XlOO
solution. The improved DNA isolation procedure revealed to be accurate for generating
reproducible DGGE profiles from biopsy samples.
Chapter 5 describes the specific detection of Lactobacillus species and related lactic
acid bacteria in the GI tract by using a specific primer. Lactic acid bacteria may have a
beneficial effect on the human GI tract but their number hardly exceeds 1% of the total
community and therefore lactic acid bacteria will not be detected in DGGE profiles reflecting
the predominant bacterial community. A specific 16S rDNA primer to target lactobacilli was
developed, validated, and used for DGGE analysis. This primer appeared to be specific for the
genera Lactobacillus, Leuconostoc, Pediococcus, and Weissella. While also Eubacterium
biforme-\ike sequences were detected, these could be excluded when a second primer was
used, which did not match the 16S rDNA of Eubacterium biforme. The utility of the
Lactobacillus group-specific primer was demonstrated by cloning and DGGE analysis of 16S
169

rDNA from feces of adults and children, although a nested PCR approach was necessary to
obtain sufficient PCR product for DGGE analysis, since very stringent PCR conditions were
required. In addition, the primer was successfully used to monitor the fate of a probiotic
Lactobacillus strain in a clinical trial.
Based on DGGE analysis of 16S rDNA from fecal samples originating from different
individuals it revealed that the human GI tract communities were stable in time and host-
specific. The study described in Chapter 6 was performed to estimate the impact of the host
and of environmental factors on the GI tract community of human adults. DGGE profiles of
fecal samples from individuals with varying degrees of genetic relatedness were performed
and similarity indices of the profiles were calculated for comparisons. A significant positive
relationship was found between the genetic relatedness of the hosts compared and the
similarity indices of the fecal profiles. In addition, no significant difference was found
between unrelated individuals and marital partners, which are sharing similar environmental
conditions. These data suggest that host genotype-related factors have a major impact on the
bacterial composition in the GI tract of human adults.
Although fecal samples may reflect the community structure at the end of the GI tract,
they do not necessarily reflect the bacterial community at other parts in the intestine.
Therefore, the bacterial composition of feces was compared to that of biopsy samples taken
from the ascending, transverse, and descending colon (Chapter 7). For the DGGE profiles
reflecting the predominant bacterial composition, remarkably high similarity indices were
found when biopsy samples from the different locations within single individuals were
compared, indicating that the mucosa-associated bacterial community is equally distributed
along the colon, while significant differences were observed between feces and the biopsy
samples. Together with the observation that these communities were host-specific, we
concluded that host-related factors have a high impact on the bacterial composition. Although
we observed some differences between healthy and individuals and those with a diagnosed GI
tract disorder, the groups of volunteers were too small to draw a definite conclusion. Similar
results were obtained when analyzing the Lactobacillus group-specific profiles, although it
was noteworthy that a Lactobacillus gasseri-likc bacterium was observed as the predominant
lactic acid bacterium of the mucosa-associated community in most individuals.
Most of the above-described analyses are based on the isolation of DNA from feces
and the amplification of 16S rDNA. Unfortunately, these data cannot be converted to cell
numbers. A group of uncultured bacteria which appeared dominantly present in the TGGE
170

profiles of several individuals and clone libraries of two individuals (7, Chapter 3) are related
to Ruminococcus obeum. Chapter 8 describes the development, validation, and application of
probe Robe63, a 16S rRNA targeted probe which could be used for fluorescent in situ
hybridization (FISH) to quantify this uncultured R. obeum-like bacteria. Microscopic and
flow cytometric counts revealed that this group of bacteria makes up approximately 2.5% of
the total community. The predominance of this group of bacteria confirms the PCR-based
observations.
Chapter 9 gives a description of a fecal isolate, strain cello1 belonging to a novel
genus. Strain cello was obtained using a cultivation approach in which anaerobic basal liquid
medium with cellobiose as main carbon source was used instead of the canonical plating on
extremely rich media. The 16S rDNA sequence of strain cello1 clusters with sequences of
cloned 16S rDNA from several environments, while no cultured relative was closely related.
The difficulty to grow strain cello7 on agar media might be an explanation that this and
related bacteria have never been detected before. We propose the name Victivallis vadensis to
identify strain cello1. Victivallis vadensis refers to the Wageningen "Food Valley".
In Chapter 10 the main achievements of the current study is discussed.
REFERENCES
1. Bry L., P. G. Falk, T. Midtvedt, and J. I. Gordon. 1996. A model of host-microbial interactions in an open
mammalian ecosystem. Science 273:1381-1383.
2. Hooper L. V., J. Xu, P. G. Falk, T. Midtvedt, and J. I. Gordon. 1999. A molecular sensor that allows a
gut commensal to control its nutrient foundation in a competitive ecosystem. Proc. Natl. Acad. Sci. USA
96:9833-9838.
3. Hooper L. V., M. H. Wong, A. Thelin, L. Hansson. P. G. Falk, and J. I. Gordon. 2000. Molecular analysis
of host-microbial relationships in the intestine. Science 291:881-884.
4. Langendijk P. S., F. Schut, G. J. Jansen, G. C. Raangs, G. R. Camphuis, M. F. Wilkinson, and G. W.
Welling. 1995. Quantative fluorescence in situ hybridization of Bifidobacterium spp. with genus-specific 16S
rRNA-targetted probes and its application in fecal samples. Appl. Environ. Microbiol. 61:3069-3075.
5. Maidak B. L., J. R. Cole, T. G. Lilburn, C. T. Parker Jr, P. R. Saxman, R. J. Farris, G. M. Garrity, G.
J. Olsen, T. M. Schmidt, and J. M. Tiedje. 2001. The RDP-I1 (Ribosomal Database Project). Nucleic Acids.
Res. 29:173-174.
6. McFarlane G. T. and G. R. Gibson. 1994. Metabolic activities of the normal colonic microflora p. 17-38. In.
S. A. W. Gibson (ed.) Human Health: Contribution of micro organisms. Springer. Frankfurt.
7. Suau A., R. Bonnet, M. Sutren, J-J. Godon, G. R. Gibson, M. D. Collins, and J. Dore. 1999. Direct
analysis of genes encoding 16S rRNA from complex communities reveals many novel molecular species within
171
the human gut. Appl. Environ. Microbiol. 65:4799-4807.
8. Tannock G. W. 1995. Normal microflora. An introduction to microbes inhabiting the human body. Chapman
and Hall, London.
9. Wilson K. H., and R. H. Blitchington. 1996 Human colonic biota studied by ribosomal DNA sequence
analysis. Appl. Environ. Microbiol. 62:2273-2278.
172

Chapter 12
Samenvatting
173

Dit hoofdstuk geeft de achtergrondinformatie en samenvatting van dit proefschrift weer.
DE DARMFLORA
Het menselijke maagdarmkanaal kan beschouwd worden als een complex ecosysteem waarbij
de darmcellen en micro-organismen heel dicht bij elkaar leven. Deze micro-organismen
spelen een belangrijke rol bij het omzetten van voedselcomponenten en de bescherming van
de darm tegen de invasie van pathogene bacterien. Bij de geboorte is er nog geen enkele
bacterie aanwezig in de darm. De eerste bacterien die via het maagdarmkanaal binnenkomen
vestigen en vermeerderen zich in de darm. In de loop der tijd zullen er steeds meer
verschillende bacterien zich gaan vestigen, terwijl andere bacterien verdwijnen. Dit zal
uiteindelijk resulteren in een complexe, maar stabiele leefgemeenschap van verschillende
bacterien in de darm. Deze leefgemeenschap staat ook wel bekend als de "darmflora". Er
wordt geschat dat het aantal bacteriecellen 10 maal meer is dan het aantal menselijke cellen,
zodat het aantal bacterien in de darm gigantisch moet zijn. Hoewel de exacte details voor de
ontwikkeling en het behoud van een stabiele darmflora onbekend zijn, wordt er vermoed dat
de bacterien en darmcellen met elkaar communiceren door middel van het uitwisselen van
signaalstoffen. Een van de nadelen die het bestuderen van de samenstelling van de darmflora
bemoeilijkt, is het kweken van deze bacterien in het laboratorium. Men weet niet precies wat
iedere bacterie nodig heeft om te kunnen groeien. Men schat dat hierdoor maar 10 tot 50%
van alle darmbacterien in het laboratorium te kweken is. Dit betekent dat de kweekmethoden
ontoerijkend zijn, wanneer men de samenstelling van de darmflora wilt onderzoeken. Om de
gehele samenstelling van de darmflora te karakteriseren zijn dus kweek-onafhankelijke
methodes nodig. Een van de mogelijkheden om dit te doen is door een specifieke
karaktereigenschap van de bacterien aan te tonen, en zodoende de verschillende bacterien te
identificeren.
DE BACTERIECEL
Voordat het kweek-onafhankelijk aantonen van de bacterien wordt uitgelegd, is het nodig om
wat basiskennis van de bacteriecel te verwerven. Om een idee te krijgen hoe bacterien emit
zien, is een microscopische foto van bacterien en een foto van bacterien op een
voedingsbodem (of plaat) in figuur 1 weergegeven.
174

Iedere eel, en dus ook een bacteriecel heeft DNA waarop de erfelijke eigenschappen
beschreven staan in de vorm van genen. Dit DNA is een lange dubbelstrengs keten waarbij de
afzonderlijke ketens opgebouwd zijn uit vier verschillende bouwstenen. Deze bouwstenen zijn
de nucleotiden adenine (A), cytosine (C), guanine (G) en thymine (T). Doordat er
waterstofbruggen tussen de nucleotiden gevormd worden, wordt de dubbelstrengsketen
gestabiliseerd. In een dubbelstrengsketen ligt een A tegenover een T (A-T paar) en een G
tegenover een C (G-C paar). Genen bestaan dus uit specifieke volgordes van deze
nucleotiden. Om de genen om te zetten naar een eigenschap van de bacterie worden de genen
eerst overgeschreven naar een zogenoemd boodschapper RNA (messenger RNA of mRNA).
Dit mRNA wordt vervolgens door de ribosomen oftewel "eiwitfabriekjes" omgezet in een
eiwit, wat een belangrijke rol speelt bij een bepaalde eigenschap van de bacterie.
A B
'•tS- ' •< ' •' \
• > . % : .rjJ---J
Fig. 1. A. Voorbeeld van bacterign die groeien op een agar voedingsbodem en daar zogenoemde kolonies
vormen. B. Een microscopische foto van bacterign.
RIBOSOMEN ALS BASIS VOOR DE DETECTIE EN IDENTIFICATIE VAN
BACTERIEN
De ribosomen spelen een cruciale rol in het leven van de bacterie en zijn dus in alle bacterien
aanwezig. Een onderdeel van een ribosoom is een molecuul dat het 16S ribosomaal RNA of
kortweg 16S rRNA wordt genoemd. Net als genen bestaat dit 16S rRNA ook uit een
specifieke volgorde van de vier nucleotiden, waarbij geen thymine maar uracil (U) als
nucleotide wordt gebruikt. In tegenstelling tot het DNA is het 16S rRNA enkelstrengs, maar
stabilisatie vindt plaats doordat er nucleotideparen gevormd worden tussen specifieke
regionen van het 16S rRNA. Door het bepalen van de nucleotide volgorde of sequentie van
16S rRNA is gebleken dat dit 16S rRNA van alle bacterien regionen heeft die erg veel op
175

elkaar lijken (conservatieve regionen), waardoor het 16S rRNA eenvoudig te herkennen is.
Daarnaast bevat hetl6S rRNA 9 variabele regionen (V-regionen) die bacterie-specifiek zijn en
daarom gebruikt kunnen worden om de bacterien van elkaar te onderscheiden. Aan de hand
van een database is waarin wel 20.000 16S rRNA sequenties van verschillende bekende
bacterien staan, kun je dus al redelijk betrouwbaar zeggen of de bacterie die je detecteert een
bekende is of niet. Op deze manier kunnen alle bacterien van de darmflora gei'dentificeerd
worden zonder ze te kweken. De 16S rRNA benadering kan men vergelijken met het nemen
van een vingerafdruk. Ieder mens heeft vingers die qua vorm op elkaar lijken en daarom te
herkennen zijn als onderdeel van de mens, terwijl je alle mensen uit elkaar kunt houden aan
de hand van de verschillen in de vingerafdrukken. Doordat er al vele vingerafdrukken in
verschillende databases staan, kun je dus zien of het om een bekende gaat of niet.
I t
*—* Bacterie A
Bacterie B
Bacterie C
Fig. 2. Voorbeeld van een DGGE streepjescode van de darmflora. Ieder streepje geeft een specifiek 16S rRNA
molecuul weer. Door de nucleotide sequentie van de afzonderlijke 16S rRNA streepjes te analyseren, kunnen de
bacterign waarvan ze afkomstig zijn gei'dentificeerd worden, zoals in dit geval bacterign A, B en C.
KARAKTERISATIE VAN DE DARMFLORA MET BEHULP VAN HET 16S rRNA
Dit proefschrift gaat over het gebruik van 16S rRNA informatie voor het karakteriseren van
de menselijke darmflora. De vragen die we hiermee proberen op te lossen zijn met name
gericht op de samenstelling van de darmflora van verschillende mensen, of deze samenstelling
verandert in de tijd, en wat de effecten van de mens zelf zijn op deze darmflora.
Op basis van literatuurgegevens over de kweekbaarheid van de bacterien in de darm zijn we
ervan uitgegaan dat er veel onbekende bacterien aanwezig zijn in de darmflora. Er is daarom
176

een analytische methode gekozen waarin in een oogopslag de verschillen en overeenkomsten
tussen de darmflora van verschillende mensen zichtbaar gemaakt kan worden. Het principe
van deze methode is dat eerst de verschillende 16S rRNA moleculen of het gen daarvan (het
16S rDNA) uit de bacterie ge'i'soleerd wordt, waama het kunstmatig wordt vermeerderd
(wordt in dit proefschrift aangeduid met PCR) en vervolgens van elkaar gescheiden wordt
(aangeduid met TGGE en DGGE). Door gebruik te maken van de DGGE en TGGE
technieken wordt een streepjescode gemaakt van de darmflora waarbij ieder streepje
afkomstig is van het 16S rRNA of 16S rDNA van een bepaalde base sequentie en dus een
specifieke bacterie voorstelt. Figuur 2 geeft een voorbeeld van DGGE streepjescodes van de
darmflora van een persoon.
IEDER MENS HEEFT EEN UNIEKE DARMFLORA
Het gebruik van TGGE en DGGE technieken om de menselijke darmflora te onderzoeken is
eerst geoptimaliseerd en vervolgens gebruikt om monsters uit de darm (ontlasting of feces)
van verschillende mensen te onderzoeken. Uit dit onderzoek is gebleken dat deze
samenstelling per individu nauwelijks verandert in de tijd, en daarnaast dat ieder volwassen
mens zijn eigen unieke streepjescode heeft voor de samenstelling van de darmflora.
Omdat iedere mens een unieke en redelijk stabiele bacteriele samenstelling heeft in de
darm, is vervolgens gekeken of dit gerelateerd kan worden aan de genetische achtergrond van
de mens of zijn directe leefomgeving. Daarom werd feces verzameld van mensen behorende
tot verschillende families, inclusief een- en tweeeiige tweelingen. Eeneiige tweelingen zijn
genetisch gezien identiek terwijl tweeeiige tweelingen dat niet zijn. Bij het verzamelen van de
feces werd ervoor gezorgd dat alle mensen die genetisch verwant waren met elkaar niet in
hetzelfde huis leefden. Echtparen waren dus wel qua omgeving maar niet qua genetische
achtergrond verwant aan elkaar. Uit de DGGE analyses is gebleken dat er geen significant
effect waar te nemen is van de omgeving waarin de mensen leven, maar dat er wel een
positief verband bestaat tussen een toenemende genetische verwantschap van de mensen en de
overeenkomst in de samenstelling van de darmflora. Het lijkt er dus op dat de genetische
achtergrond van de mens een belangrijke factor is bij de samenstelling van de darmflora. Wat
precies deze factoren zijn zal uit vervolgonderzoek moeten blijken.
177

DE SAMENSTELLING VAN AANGEHECHTE BACTERIEN
De bacteriele samenstelling in feces geeft weer hoe de darmflora emit ziet aan het eind van de
dikke darm, maar zegt in principe niets over de samenstelling in de verschillende delen van de
dikke darm. Om dit te onderzoeken werden monsters van de darmwand van de dikke darm en
feces met elkaar vergeleken. De monsters van de darmwand zijn genomen via endoscopie en
bevatten dus de bacterien die aan de darmwand gehecht zijn. Uit DGGE analyse is gebleken
dat bacteriele gemeenschap die aan de darmwand gehecht is overal hetzelfde is in de dikke
darm, maar verschilt per individu. Dit komt overeen met wat er voor fecale monsters
gevonden is en bevestigt dat gastheer-specifieke factoren belangrijk zijn voor de
samenstelling van de darmflora. Ondanks dat er verschillende leefcondities voor de bacterien
zijn aan het begin en het eind van de dikke darm, bleek dit geen invloed te hebben op de
samenstelling van de bacterien die zich aan de darmwand hechten. Als echter de bacteriele
samenstelling van de darmwand vergeleken wordt met die van feces dan blijkt dat er
significante verschillen zijn.
DETECTIE VAN ONBEKENDE BACTERIEN
De DGGE streepjescode van de feces van een persoon is ontrafeld door de afzonderlijke
streepjes te identificeren. Uit deze analyse bleek dat er veel 16S rDNA van onbekend origine
aanwezig is. Dit is dus afkomstig van tot nu toe onbekende of nieuwe bacteriesoorten. Twee
typen van bacterien bleken veelvuldig voor te komen in de darmflora, namelijk bacterien die
lijken op Fusobacterium prausnitzii en Ruminococcus obeum. Deze bacterien zijn ook in
andere laboratoria aangetoond in feces van mensen en blijken dus veelvuldig voor te komen
bij verschillende mensen. Helaas kun je uit de streepjescode niet berekenen van hoeveel
bacterien zo'n streepje afkomstig is. Daarom is een andere techniek gebruikt waarbij deze
bacterien specifiek geteld konden worden. Er werd een probe (kunstmatig kort stukje DNA)
gemaakt welke alleen maar bindt aan het 16S rRNA van de Ruminococcus obeum-achtige
bacterien. Door een fluorescerend label aan deze probe te hangen zullen deze Ruminococcus
obeum-achtige bacterien een fluorescerend signaal geven als ze onder een fluorescente
microscoop bekeken worden of met een flow cytometer (complexe machine waarmee o.a.
fluorescerende bacterien worden geteld) geanalyseerd worden. Op deze manieren van tellen
bleek dat zo'n 2.5% van de totale darmflora bestaat uit bacterien die op Ruminococcus obeum
178

lijken. Op een vergelijkbare manier is door andere onderzoekers aangetoond de totale
darmflora voor 10 tot 15% bestaat uit Fusobacterium prausnitzii-achtige bacterien. Deze
specifieke tellingen geven aan dat de gebruikte DGGE methoden een goede weergave zijn van
de menselijke darmflora.
ISOLATIE VAN EEN NIEUWE BACTERIE
Vanaf het eind van de 19de eeuw zijn er veel bacterien uit de menselijke darm gei'soleerd en
beschreven. De meest gebruikte methode om zoveel mogelijk bacterien met verschillende
eigenschappen te isoleren is door vaste agar voedingsbodems te gebruiken met zoveel
mogelijk ingredienten (zoals in figuur 1 weergegeven is). Hierop zullen de afzonderlijke
bacterien gaan groeien, wat betekent dat ze zich vermenigvuldigen. Uiteindelijk resulteert dit
in de vorming van een zichtbare kolonie op de voedingsbodem. Ruwe schattingen geven weer
dat je op deze manier maar 10 tot 50% van de totale darmflora kunt kweken. In dit
proefschrift is een onderzoek beschreven waarin een alternatieve methode is geprobeerd
waarbij geen voedingsbodem, maar een vloeibaar medium is gebruikt om de bacterien te
kweken. Daarnaast is het medium specifieker gemaakt door alleen maar cellobiose (een
suiker) als hoofdbestanddeel te gebruiken. Dit heeft uiteindelijk geresulteerd in de isolatie van
een nog niet eerder gekweekte soort. Verwante soorten zijn alleen maar met kweek
onafhankelijke technieken aangetoond in verschillende ecosystemen (zoals de maag van
koeien en bioreactoren), maar niet in humane feces. Dit nieuwe isolaat werd Victivallis
vadensis genoemd, wat "Wageningen Food Valley" betekent. De isolatie van deze nieuwe
bacterie geeft aan dat er mogelijkheden bestaan om nieuwe soorten te isoleren, wanneer
alternatieve kweekmethoden bedacht en toegepast worden.
DETECTIE VAN MELKZUURBACTERIEN IN DE DARM
Melkzuurbacterien worden veel gebruikt bij o.a. de productie van levensmiddelen, zoals
bijvoorbeeld kaas. Verder zie je in de supermarkten ook steeds meer producten waar levende
melkzuurbacterien inzitten (zoals Yakult en Mona Vifit). Van deze zogenoemde probiotische
producten wordt gezegd dat ze goed zijn voor de darmflora en voor de gezondheid. Uit
experimenten in verschillende laboratoria is gebleken dat de betreffende melkzuurbacterie
weliswaar in feces aangetoond kan worden, maar dat het nauwelijks een effect heeft op
179
samenstelling van de darmflora. Hierbij moet opgemerkt worden dat melkzuurbacterien bij de
mens in lage aantallen in de darmflora aanwezig zijn en daardoor niet te herkennen zijn met
een DGGE analyse waarmee alle bacterien aangetoond worden. Een probiotische
melkzuurbacterie kan dus wel een effect hebben op de al bestaande melkzuurbacterien in de
darmflora. Om de samenstelling van deze melkzuurbacterie-populatie en het effect van een
probiotische melkzuurbacterie te onderzoeken, is eerst het 16S rRNA van melkzuurbacterien
in de darmflora gei'soleerd en specifiek vermenigvuldigd. Vervolgens werd dit met behulp van
DGGE geanalyseerd zodat de streepjescodes van de samenstelling van de melkzuurbacterien
in de darmflora bekend werd. Deze methode bleek zeer geschikt te zijn voor het analyseren
van feces van volwassenen en baby's en ook voor het analyseren van darmwand monsters. Op
deze manier werden zowel bekende als onbekende melkzuurbacterien gevonden in de
verschillende darmmonsters. Een bacterie met de naam Lactobacillus gasseri bleek een
veelvoorkomende melkzuurbacterie te zijn in de monsters van de darmwand. Tijdens
consumptie van de probiotische producten kon de probiotische bacterie aangetoond worden in
de feces en dus een verschuiving in de darmpopulatie van melkzuurbacterien veroorzaken,
maar zodra de consumptie van het probiotische product gestopt werd verdween deze bacterie
ook weer snel uit de darm. Een permanente vestiging had in dit geval dus niet plaatsgevonden.
Met deze resultaten is aangetoond dat het effect van probiotische producten op de bestaande
melkzuurbacterie populatie in de darm onderzocht kan worden met behulp van DGGE
analyses.
.TOT SLOT
In bovenstaande samenvatting staat beschreven wat er uit mijn onderzoek naar voren is
gekomen. De toepassing van nieuwe kweek onafhankelijke technieken heeft ons nieuw
inzicht gegeven in de samenstelling van de darmflora van verschillende mensen en de
belangrijke invloed van de mens zelf op deze samenstelling. Vervolgonderzoek naar de rol
van de darmflora zal gericht moeten worden op het ontrafelen van de functie van met name de
aangetoonde onbekende bacterien in de darm.
180

Publications
Wolters D. J., Dijk C. van, Zoetendal E. G., and Akkermans A. D. L. 1997. Phylogenetic
characterization of ineffective Frankia in Alnus glutinossa (L.) Gaertn. nodules from wetland
soil inoculants. Molecular Ecology 6: 971-981.
Zoetendal E. G., Akkermans A. D. L., and Vos W. M. de. 1998. Temperature gradient gel
electrophoresis analysis of 16S rRNA from human fecal samples reveals stable and host-
specific communities of active bacteria. Applied and Environmental Microbiology 64: 3854-
3859.
Vos W. M. de, Poelwijk E., Sessitsch A., Zoetendal E. G., Overbeek L. S. van, and
Akkermans A. D. L. 1998. Molecular approaches for analyzing the functionality of probiotic
lactic acid bacteria in the gastrointestinal tract. In: Lactic acid bacteria. Actes de colloques
LACTIC 1997. Adria Normandie, Villers-Bocage, France. pp51-57.
Plugge C. M., Zoetendal E. G., and Stams A. J. M. 1999. Caloramator coolhaasii sp. nov., a
glutamate-degrading moderate thermophilic anaerobe. Int. J. Syst. Evol. Microbiol. 50: 1155-
1162.
Vos W. M. de, Zoetendal E. G., Poelwijk E. Heilig H., and Akkermans A. D. L. 1999.
Molecular tools for analyzing the functionality of probiotic properties of microorganisms.
Proc. 25th Intern. Dairy Congress, Aarhus Sept. 1998. pp. 323-328. Danish National
Committee of the IDF, Denmark
Vaughan E. E., Heilig G. H. J., Zoetendal E. G., Satokari R., Collins J. K., Akkermans A. D.
L., and Vos W. M. de. 1999. Molecular approaches to study probiotic bacteria. Trends in
Food Sciences and Technology 10(12): 400-404
Vaughan E. E., Schut F., Heilig G. H. J., Zoetendal E. G., Vos W. M. de, and Akkermans A.
D. L. 2000. A molecular view of the intestinal ecosystem. Current Issues in Intestinal
Microbiology 1: 1-12.
181
Akkermans A. D. L., Zoetendal E. G., Favier C. F., Hans G. H. J. Heilig, Akkermans-van
Vliet W. M., and Vos W. M. de. 2000. Temperature and denaturing gradient gel
electrophoresis analysis of 16S rRNA from human faecal samples. Bioscience Microflora 19:
93-98.
Akkermans A. D. L., Zoetendal E. G., Konstantinov S., Favier C, Satokari R., Vaughan
E.E., Heilig G. H. J., and de Vos W. M. 2001. Culture-independent detection of bacterial
populations in the human intestinal tract. Int. J. Antimicrob. Agents 17 (1): S104.
Zoetendal E. G., Akkermans A. D. L., and Vos W. M. de. 2001. Molecular characterisation
of microbial communities based on 16S rRNA sequence diversity. In: L. Dijkshoorn, K.
Towner, and M. Struelens (eds.). New approaches for the generation and analysis of microbial
typing data, chapter 11, pp 267-298. Elsevier.
Zoetendal E. G., Akkermans A. D. L., Akkermans van-Vliet W. M., de Visser J. A. G. M.,
and de Vos W. M. 2001. The host genotype affects the bacterial community in the human
gastrointestinal tract. Microbial Ecol. Health Dis. 13: 129-134.
Plugge C. M., Balk M., Zoetendal E. G., Stams A, J, M. 2001. Gelria glutamica gen. nov.,
sp. nov., a thermophilic obligately syntrophic glutamate-degrading anaerobe. Int. J. Syst.
Evol. Microbiol, (in press).
Zoetendal E. G., Ben-Amor K., Akkermans A. D. L., Abee T., and de Vos W. M. 2001.
DNA isolation protocols affect the detection limit of PCR approaches of bacteria in samples
from the human gastrointestinal tract. Syst. Appl. Microbiol, (in press).
182

Nawoord
Het boekje is af, althans bijna. Nu komt het belangrijkste en tevens meest lastige hoofdstuk,
namelijk het nawoord. Op de omslag staat namelijk maar een naam, maar zonder de hulp van
heel veel mensen was dit boekje nooit verschenen. Een aantal woorden van waardering is dan
ook zeker op zijn plaats, hoewel ik me realiseer dat dit altijd te weinig zal zijn om mijn dank
te uiten. Onmogelijk om de afgelopen jaren in een paar zinnen samen te vatten, weet ik zeker
dat ik qua inhoud tekort ga schieten. Aan de andere kant is het een goed gevoel om bij dit
gedeelte van mijn proefschrift aan te komen, waarin je iedereen mag gaan bedanken. Je krijgt
hierbij echt het gevoel dat al het werk binnenkort met zeer grote voldoening afgerond zal zijn.
Daarnaast zullen de vervelende maar goedbedoelde vragen als "Hoever ben je met je
proefschrift?", en "Wanneer ga je promoveren?", binnenkort gelukkig tot het verleden
behoren. De afgelopen jaren heb ik mij uitstekend vermaakt in Wageningen, wat voor een
groot deel te danken is aan de prettige sfeer die er heerst bij Microbiologie. Daarom wil ik
iedereen bedanken voor het creeren van die goede sfeer. Verder ben ik alien zeer dankbaar
voor de hulp die mij geboden is, voor het vrijwillig afstaan van fecale monsters en, zeker niet
onbelangrijk, voor het gedoogbeleid wat betreft het draaien van mijn muziek en de eventuele
stankoverlast gedurende mijn experimenten.
Allereerst wil ik mijn promotor en co-promotor bedanken. Willem, je enthousiasme en
betrokkenheid bij mijn onderzoek heb ik altijd zeer gewaardeerd. De manier van coachen,
waarbij ik veel vrijheid kreeg om mijn onderzoek uit te voeren, en het kritische commentaar
op mijn manuscripten hebben op mijn wetenschappelijke ontwikkeling een positieve invloed
gehad. Antoon, van je ideeen over de microbiele ecologie, maar ook de wetenschap in het
algemeen heb ik enorm veel geleerd. Daarnaast ben je als een soort "vader" van de Moleco's
altijd zeer bepalend geweest voor de geweldig goede sfeer op het lab.
Aan mijn paranimfen ben ik ook veel dank verschuldigd. Met name voor hun hulp
gedurende mijn verblijf in Finland. Hans, bedankt voor al je hulp tijdens het labwerk en
schrijven. Je functie als eerste auteur van hoofdstuk 5 en Neerlandicus zijn van groot belang
geweest voor dit proefschrift. Sergey, also thanks for your support and friendship. Our
scientific discussions at Microbiology and the nice chats at Het Gat were good sources for
creating new ideas.
183
The co-authors of the chapters deserve a special acknowledgement. It was impossible
for me to finish this thesis without the help of Kaouther, Arjan, Elaine, Wilma, Caroline, Arte,
Terttu, Tjakko, Philippe, Hermie, and Frits.
Tijdens mijn AIO periode wist ik ook vier studenten te strikken om een afstudeervak
te doen. Mickel, Maaike, Petra en Nico. Bedankt voor jullie enthousiasme, inzet en
gezelligheid.
De afgelopen jaren zouden een stuk minder succesvol en gezellig geweest zijn zonder
de aanwezigheid van de nog niet opgenoemde Moleco's. Het was me een waar genoegen om
gewerkt te hebben met/naast Hugo, Diederick, Bart, Esther, Andreas, Robert, Arthur, Leo,
Maria, Patrick, Ronald, Angela, Kees, Alcina, Cinzia, Christine, Kathrin, Jiro, John, Mark,
Nora, Reetta, Ineke, Yao Wen, Yoyok, Martin, Sandra, Hauke, Vesela, Voula, Mirjana en niet
te vergeten alle studenten.
Verder wil ik Nees, Ria, Wim, Frits, Jannie, Ans, Renee en Francis bedanken. Zonder
hun hulp en gezelligheid is het niet mogelijk om bij Microbiologie te werken.
De collega's van het WCFS wil ik ook mijn dank betuigen. Van de werkbesprekingen
en discussies in de C-001 vergaderingen heb ik veel opgestoken. Daarnaast vormden de
algemene bijeenkomsten, de leuke uitjes, sportdagen en teambuilding-dagen leuke
afwisselingen van het dagelijkse werk in het lab. Bedankt allemaal voor jullie inzet, hulp en
gezelligheid.
Ik wil mijn vriendenkring hier, maar ook aan de andere kant van de Atlantische
Oceaan bedanken. Bedankt voor jullie steun, gezelligheid en alle leuke dingen die we
ondernomen hebben. Amigos y amigas de latinoamerica, muchas gracias por vuestro apoyo y
amistad. Mavi, muchas gracias por tu ayuda en el disefio de la portada de mi tesis.
Verder wil ik de personen die ik ten onrechte niet genoemd heb bedanken. Deze
onvermijdelijke vergeetachtigheid heeft dat meer met mijn geheugen te maken dan met hun
bijdragen. Mijn excuses hiervoor.
Tot slot wil ik mijn ouders en zusje bedanken. Pa, ma en Tessa, zonder jullie had dit
boekje louter uit bianco velletjes bestaan. Bedankt, voor alle steun die jullie me gegeven
hebben in de goede periodes, maar ook de voor ons rottige periodes, zoals met name die in het
jaar 2000.
0> 184
Curriculum Vitae
Erwin Gerard Zoetendal werd in Drachten geboren op 22 december 1971. Na zonder
bijzondere noemenswaardigheden de kleuterschool doorlopen te hebben, heeft hij zijn lagere
school opleiding eerst in Drachten en later in Joure gevolgd en met succes afgerond.
Daaropvolgend werd in 1990 het Atheneum diploma behaald aan het Nassau College te
Heerenveen. Daarna werd het wel eens tijd om de horizon voorbij de grenzen van Friesland te
gaan verkennen, en daarom is Erwin in datzelfde jaar Biologie aan de Rijksuniversiteit
Groningen in Haren gaan studeren. Geboeid door de vakken Microbiologie en Ecologie, heeft
hij besloten zijn afstudeervakken in de Microbiele Ecologie te kiezen. Als Microbieel Ecoloog
studeerde hij af in 1996. Op 1 Mei 1996, twee maanden voor zijn afstuderen, begon Erwin als
AIO bij het laboratorium voor Microbiologie aan de Wageningen Universiteit met zijn
promotie onderzoek, wat gericht was op het ontrafelen van de samenstelling van bacterien in
de menselijke darm. In 1998 werd hij als "adoptie AIO" aangenomen bij het Wageningen
Centre for Food Sciences (WCFS). Eind 2000 was nagenoeg al het praktisch werk afgerond
en werd een aanvang genomen met schrijven, wat heeft geresulteerd in dit proefschrift. Via
het WCFS zette hij vanaf oktober 2001 zijn onderzoek voort aan de Universiteit van Kuopio
in Finland.
185
The research described in this thesis was part of the research carried out in the scientific
program 'Processing and Functionality' of the Wageningen Centre of Food Sciences. Part was
financially supported by VTT Biotechnology and Food Research (Finland).
This Ph.D. study was part of the research program of the Graduate School VLAG (Food
Technology, Agrobiotechnology, Nutrition and Health Sciences).
Cover design: Mavi Pena Zambrano Jaimes and Erwin Zoetendal
Printing: Ponsen & Looijen