molecular conformations of crystalline l cysteine ...jz8/paper/molecular conformations of...
TRANSCRIPT
Molecular Conformations of Crystalline L‑Cysteine Determined withVibrational Cross Angle MeasurementsHailong Chen, Hongtao Bian, Jiebo Li, Xunmin Guo, Xiewen Wen, and Junrong Zheng*
Department of Chemistry, Rice University, Houston, Texas 77005, United States
*S Supporting Information
ABSTRACT: The molecular conformations of crystalline L-cysteine prepared inits orthorhombic form were determined by the vibrational cross anglemeasurements. Its major dihedral angles of chemical bonds determined by thismethod are consistent with the results from diffraction experiments. In addition,the relative orientations of the chemical bonds associated with the hydrogen atomsof the NH3
+ group and the thiol group are also determined. The resultsdemonstrate that the vibrational cross angle method based on the multiple-modeapproach can potentially become a structural tool for determining molecularconformations. The major challenges for the method to become a generalmolecular structural tool are discussed, and some approaches to address them areproposed.
1. INTRODUCTION
Conformational fluctuations of molecules play critical roles inmany chemical and biological processes, such as catalysis, cellsignaling, and the fusion of biological membranes.1−3 In liquids,conformations of many peptides or proteins can be determinedwith NMR, and in single crystals X-ray diffraction (XRD) is thebest tool for this purpose.4−11 So far, these two methods havebeen proved to be the most powerful nondestructive molecularstructural tools. Similar to many other things, at the currentstage, these two methods also have some limitations thatimpose difficulties for them to measure many molecularphenomena, e.g., some special requirements of the samplestates, the small XRD cross section of H atom, and thesensitivity to the molecular magnetic properties.12,13
The ultrafast multiple-dimensional vibrational spectroscopy,viewed as an optical analogue of multidimensional nuclearmagnetic resonance by many people,14,15 have been demon-strated to be able to provide some molecular information that isdifficult to be obtained from those traditional methods.16−26 Inprinciple, many intrinsic properties of the ultrafast nonlinearvibrational spectroscopy place it in a unique position to bepotentially able to resolve molecular structures in manysituations that current NMR or XRD techniques can havedifficulties to deal with. For instances, its ultrafast temporalresolution (∼100 fs) enables it to take “snapshots” of fastnuclear motions involved in many molecular conformationalchanges. The relative ease of manipulating the IR pulses allowsthe samples to be in almost any condensed phases, e.g., liquids,crystals, amorphous powder, gel, nanoparticles, or interfaces.The method is also immune to the problem of small crosssections of H atoms in XRD or the issue of molecular magneticproperties in NMR measurements. The relatively small amountof sample (ca. >10−8 gram, estimated from the sample volume
within the laser focus spot) required for a measurement is alsoan advantage (over NMR). Inspired by the seeminglypromising advantages of the method, in the past few years,we have been focused on developing a special version ofultrafast nonlinear vibrational spectroscopic technique into amolecular structural tool for determining molecular conforma-tions with vibrational cross angle measurements, moleculardistances with vibrational energy transfer measurements, andrelative intermolecular orientations with molecular heat trans-port measurements,26−35 seeking to understand the oppor-tunity and limitation of the method in resolving molecularstructures and conformations in condensed phases. Thetechnique we developed utilizes the synchronization of apicosecond (ps, 10−12 second) OPA (Optical ParametricAmplifier) pumped by a ps amplifier and a femtosecond (fs,10−15 second) OPA pumped by a fs amplifier to providesufficiently high excitation power and a very wide frequencytunability. Recently, we introduced a revised version of thetechnique with an ultrafast IR/THz super continuum pulse toreplace the regular ultrafast IR pulse from the fs OPA as thedetection beam.27,33 Such a revision simplifies the operation ofthe lasers. Because of the improvement, the determination ofmolecular conformations of relatively complex moleculesbecomes much more practical.27
In previous works, we demonstrated that the conformationsof molecules with one or two internal rotational degrees offreedom can be determined with the technique by measuring
Special Issue: Michael D. Fayer Festschrift
Received: June 24, 2013Revised: August 26, 2013Published: August 27, 2013
Article
pubs.acs.org/JPCB
© 2013 American Chemical Society 15614 dx.doi.org/10.1021/jp406232k | J. Phys. Chem. B 2013, 117, 15614−15624
the relative orientations of the transition dipole moments ofdifferent vibrational modes in liquids, solids and on the surfacesof nanoparticles.32−34 However, the conformation-mappingstrategy that calculates all possible conformations rotatingabout all single bonds of the molecule introduced in the worksis not practical for molecules with more internal rotationaldegrees of freedom, because there can be too manyconformations required to be calculated for a big molecule.For example, if a molecule has four major single bonds, thenumber of its possible conformations rotating about thesebonds for every 10° is 364 = 1679616. In this work, we use acrystalline amino acid, L-cysteine, which has four major singlebonds about which the rotation can generate many possiblemolecular conformations, as a model system to explore thepossibility to avoid such a straightforward and thorough butextremely time-consuming mapping strategy by combiningprior molecular knowledge into consideration to reduce thecalculation load. There are two more motivations to choose L-cysteine as the model system. One is that the conformations ofL-cysteine have been well characterized by the diffractionmethods,36−38 which can be used to benchmark the method.The other is to accumulate a database of nonlinear vibrationalproperties of amino acids prepared for resolving structures andconformations of peptides or even proteins in the future.
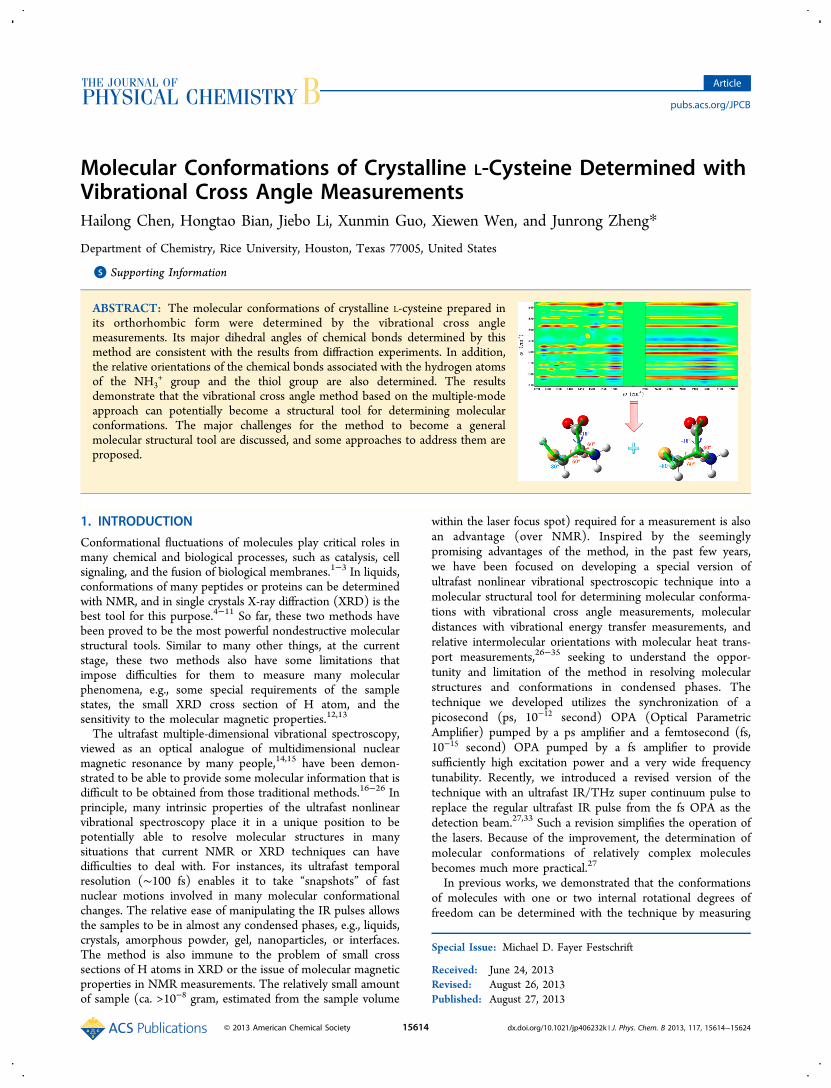
2. EXPERIMENTS AND METHODSMost of the data presented in the work were collected from asetup described previously.30 Some of the data were obtainedfrom the new IR/IR-T-Hz setup illustrated in Figure 1A.
Briefly, a ps amplifier and a fs amplifier are synchronized withthe same seed pulse. The ps amplifier pumps an OPA toproduce ∼0.8 ps (varying from 0.7−0.9 ps in differentfrequencies) mid-IR pulses with a bandwidth of 10−35 cm−1
in a tunable frequency range from 400 cm−1 to 4000 cm−1 withenergy of 1−40 μJ/pulse (1−10 μJ/pulse for 400 cm−1 to 900cm−1 and >10 μJ/pulse for higher frequencies) at 1 kHz. Lightfrom the fs amplifier is used to generate a high-intensity mid-IRand terahertz supercontinuum pulse by producing plasma inair.33,39−41 The collimated 800 nm beam from the fs amplifier isfrequency-doubled by passing through a Type-I 150-μm-thickBBO crystal cut at 29.2° to generate the 400 nm light. A dualwave plate is used to tune the relative polarizations of the 800and 400 nm pulses operating as a full-wave plate at 400 nm anda half-wave plate at 800 nm. Temporal walkoff between twobeams is compensated by inserting a 2-mm-thick BBO (cut at55°) between the doubling crystal and the wave plate, wherethe 800 and 400 nm pulses propagate at orthogonalpolarizations at different velocities in the delay plate. Thesupercontinuum pulse is generated by focusing the twocopropagating beams on air, with a pulse duration around110 fs in the frequency range from <20 cm−1 to >3500 cm−1 at1 kHz (see Figure 1B,C), and the shot to shot fluctuation forevery 1000 shots is less than 1% in most of the spectral region(>1000 cm−1. The stability below 1000 cm−1 has not beenmeasured).In the nonlinear IR experiments, the ps IR pulse is the
excitation beam (the excitation power is adjusted based onneed and the interaction spot varies from 100 to 500 μm). The
Figure 1. (A) Laser setup. The Mid-IR excitation pulse is generated from the ps OPA and ps DFG setup pumped by the ps amplifier. The mid-IRand terahertz supercontinuum pulse is generated from the optical setup shown in the dashed box, used as the ultrabroadband-probe pulse. (B)Spectrum of the supercontinuum pulse in the high frequency range measured with a liquid-nitrogen-cooled mercury−cadmium-telluride (MCT)array detector. The low-frequency cutoff is caused by the low efficiencies of the grating and the MCT detector. (C) Spectrum of the supercontinuumin the low frequency range measured with the air-breakdown-coherent-detection (ABCD) method.
The Journal of Physical Chemistry B Article
dx.doi.org/10.1021/jp406232k | J. Phys. Chem. B 2013, 117, 15614−1562415615
supercontinuum pulse is the detection beam frequency-resolvedby a spectrograph (resolution is 1−3 cm−1 dependent on thefrequency) yielding the detection axis of a 2D IR spectrum.Scanning the excitation frequency yields the other axis of thespectrum. Two polarizers are added into the detection beampath immediately behind the sample to selectively measure theparallel or perpendicular polarized signal relative to theexcitation beam. Vibrational lifetimes are obtained from Ilife =I∥ + 2 × I⊥, where I∥, I⊥ are parallel and perpendicular datarespectively, and the time dependent anisotropy is obtainedfrom R = (I∥ − I⊥)/(I∥ + 2 × I⊥). The setup including thefrequency tuning and polarization selection is computercontrolled. One of the advantages of the setup over thebroad-band pump/probe or 2D IR techniques, besides that ithas extreme high excitation power and very broad frequencytunability is that, in the cross peak or 1−2 transition peakmeasurements, the frequencies contained in the pump pulse donot overlap with those of the frequency-resolved signals.Therefore, the scattered light from the pump pulse does notaffect the 2D IR and pump/probe signals obtained from thistechnique.
L-Cysteine was purchased from Aldrich, and the crystallinesample was prepared by evaporating its aqueous solution onCaF2 window surface. The isotropic orientation of moleculeswithin the laser focus spot was verified by measuring thesamples with different orientations relative to the optical table.The XRD data of the sample is provided in the SupportingInformation, which indicates that the orthorhombic form of L-cysteine (L-cysteine-I) is mostly populated in the sample. Allmeasurements were carried out at room temperature (21 °C).DFT calculations were used to convert atomic coordinates
(relative atomic orientations) into vibrational coordinates(relative vibrational orientations). In this work, the DFTcalculations were carried out using Gaussian 09. The level andbasis set used was Becke’s 3-parameter hybrid functionalcombined with the Lee−Yang−Parr correction functional,abbreviated as B3LYP, and 6-311++G(d,p). The vibrationaltransition moment directions of L-cysteine were calculated witha high dielectric constant (of water) by using SCRF-CPCM tomaintain its zwitterion structure. The transition dipoledirections of a vibrational mode at the H-bonded state andthe free state are typically different because the direction is thatof the eigenvector of the sum result of intermolecular
interactions. However, the experimental cross peak intensityis mainly from the local vibrational coupling. In other words,intramolecular couplings dominate over intermolecular inter-actions. As measured in our previous work, the cross peakintensity from the intramolecular coupling between acombination band and the CN stretch of SCN− is muchstronger than that of the cross peak between the OD stretchand the CN stretch of SCN− in a KSCN/D2O solution whereSCN− is believed to form a H-bond with D2O.
33,42 Therefore,using the calculated delocalized transition dipole directionsfrom a H-bonded (or intermolecularly interacted) species toanalyze the experimental results will cause a big error, as wehave tested for the previous systems.27,32 To solve this problem,we have developed a procedure for the calculations:27,32 (1) tooptimize the structure of a H-bonded molecule with a H-bonded partner, and (2) to calculate the vibrational transitiondipole directions of this molecule with the H-bonded structurebut without the H-bonded partner. In the calculations, themolecular structure is H-bonded, but the transition dipoledirections are localized intramolecularly because the H-bondedpartner is not involved in the transition dipole calculations. Inthe previous systems,27,32 we found that results through thisprocedure are not very different from those by directlycalculating the isolated nonbonded molecule, probably becauseintermolecular interactions do not change the molecularstructure (in terms of bond lengths) significantly. In addition,as demonstrated, the calculated transition dipole directions ofrelatively localized modes with different calculation levels arevery similar.43 For cysteine, because it is known from diffractiondata that the molecule forms zwitterion structure, we took thezwitterion structure in the isolated state in a high dielectricconstant (of water) environment as input structure to calculatethe transition dipole directions. Each conformation is obtainedby rotating the molecule along different single bonds. The bondlengths are relaxed during calculations. For determining thedihedral angle for the SH group, we fixed the positions of allheavy atoms and allowed only the SH group to rotate.
3. RESULTS AND DISCUSSION3.1. Molecular Conformations of Orthorhombic L-
Cysteine. L-cysteine has two major crystal forms, anorthorhombic phase (L-cysteine-I) and a monoclinic phase (L-cysteine-II).36−38 L-Cysteine molecules in both phases adopt
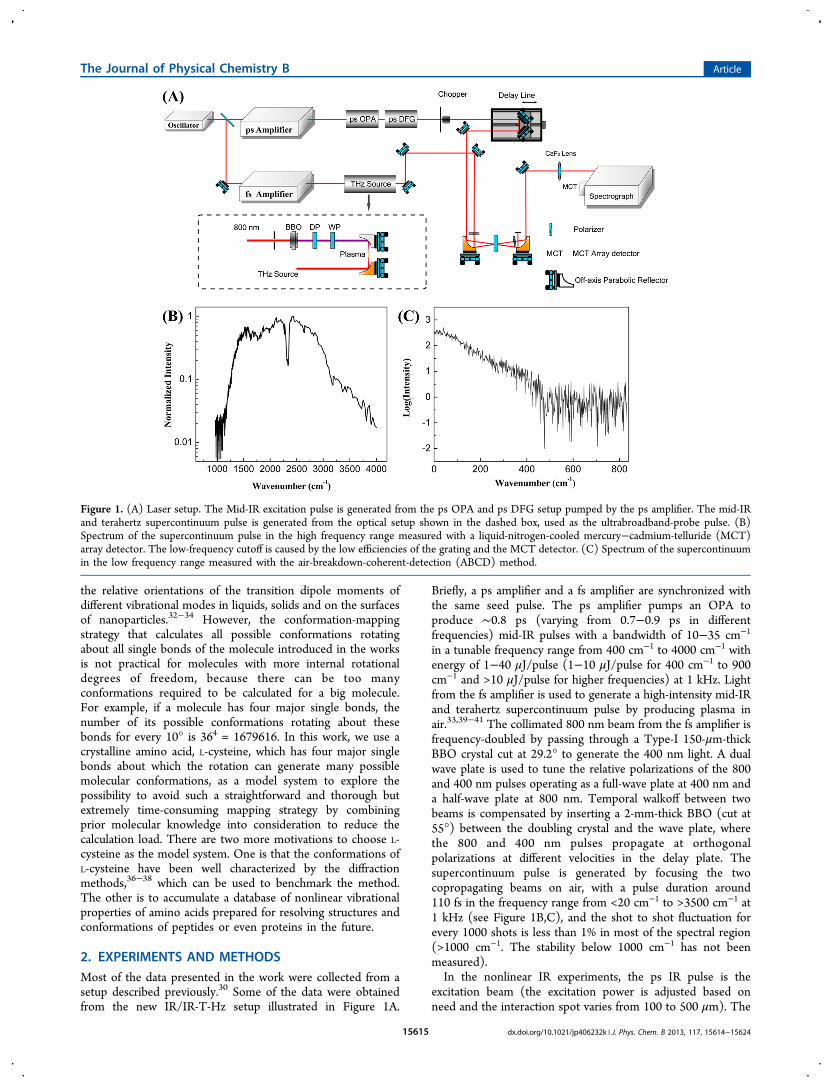
Figure 2. (A)The typical molecular conformation of L-cysteine in its zwitterionic form and the illustration of how the vibrational cross angle betweentwo modes is experimentally determined. (B) FTIR spectrum of the L-cysteine sample. The major peaks involved in the cross angle measurements:NH3 asymmetrical bending (δa NH3
+, 1608 cm−1), NH3 symmetrical bending (δs NH3+, 1511 cm−1), CH2 bending (δ CH2, 1424 cm−1), CC
stretching and CH bending (v CC and δ CH, 1396 cm−1), CH bending (δ CH, 1343 cm−1) and CH bending and CO2 symmetrical stretching (δ CHand vs COO
−, 1290 cm−1).
The Journal of Physical Chemistry B Article
dx.doi.org/10.1021/jp406232k | J. Phys. Chem. B 2013, 117, 15614−1562415616
the zwitterion structure, and the molecular conformations of L-cysteine in the crystals have been thoroughly characterizedthrough various methods.36−38 The sample in this study ismainly composed of the orthorhombic form, based on the XRDmeasurements (data are provided in the Supporting Informa-tion). A molecular conformation of L-cysteine in this crystal isillustrated in Figure 2A. The L-cysteine molecule has four majorsingle bonds (S(1)−C(2), C(2)−C(3), C(3)−C(4), and
C(3)−N(5)). The rotations about these four bonds cangenerate many different conformations defined by the fourdihedral angles: α (∠S(1)C(2)/C(3)N(5)), β (∠N(5)C(3)/C(4)O(7)), γ (∠C(4)C(3)/N(5)H(13), or γ′ (∠C(2)C(3)/N(5)H(14)), δ (∠H(8)S(1)/C(2)C(3)). According to dif-fraction measurements,36 the orthorhombic L-cysteine has twoconformations. Both conformations have the same dihedralangles β = −17° and γ = 64°. The α values are slightly different:
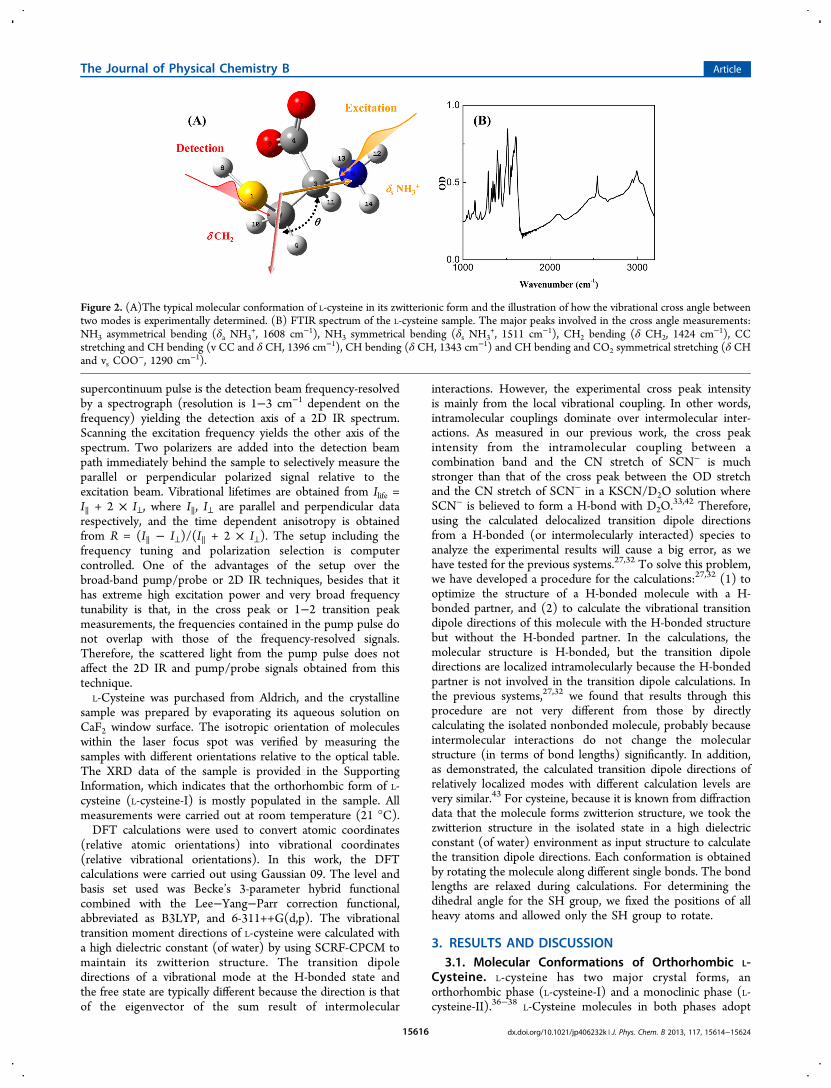
Figure 3. (A) Multiple-mode 2D-IR spectrum of the L-cysteine sample at waiting time 0.2 ps with the polarization of the detection beamperpendicular to that of the excitation beam. The relative intensities of peaks are adjusted to be comparably visible by multiplying the raw data withconstants, which are listed in the Supporting Information. (B) Enlarged 2D-IR spectrum for the cross peak pair of δ CH2 (ω1) and δ CH (ω3)(region a in panel A), and (C) enlarged 2D-IR spectrum for the cross peak pair between δ CH2 (ω1) and δ CH and vs COO
− (ω3) frequency range(region b in panel A). (D) A slice cut along ω1 = 1424 cm−1 of panel B with the polarization of the excitation both parallel (∥) and perpendicular(⊥) to the polarization of the detection beam and (E) a slice cut along ω1=1424 cm
−1 of panel C with the polarization of the excitation both parallel(∥) and perpendicular (⊥) to the polarization of the detection beam. The solid lines denote Gaussian peak fits. Because the vibrational cross anglesare different, the relative intensities of the parallel and perpendicular signals are very different in D and E.
The Journal of Physical Chemistry B Article
dx.doi.org/10.1021/jp406232k | J. Phys. Chem. B 2013, 117, 15614−1562415617
αA = 60° and αB = 69°, and the δ values are very different: δA =78° and δB = −85°. The different δ values are caused by thetorsion of SH group to form different H-bonds. The populationratio of these two conformations was estimated to be 1/1 fromthe diffraction measurements.3.2. Vibrational Cross Angle Measurements. To
determine the conformations of L-cysteine in the crystal, wefollowed the general procedure described in our previouswork:30,32,34 (1) experimentally measure the cross angles ofmany vibrational modes that are sensitive to the changes of thedihedral angles, and (2) convert these vibrational cross anglesinto chemical bond dihedral angles with the aid of ab initiocalculations. Figure 2A illustrates the basic concept ofmeasuring the cross angle between two different vibrationalmodes. A linearly polarized IR pulse excites a vibrational mode,e.g., the NH3 bending. After a very short period of time (0.1−0.2 ps, different from a typical all-fs setup,23 we rarely seecoherent artifacts that do not follow the anisotropy determinedby the excitation and detection modes at ∼ time zero for ourfs/ps setup. For example, at time ∼ 0, we see the initialanisotropy value close to 0.4 for the OD stretch in D2O, 0.4 forthe CN stretch in the KSCN solutions.26,42 The rotationaldynamics of both species are identical to those measured withthe all-fs setups.44,45) before the molecular rotation orconformational changes or intermolecular energy exchangehave occurred for a substantial extent, another linearly polarizedpulse of different frequencies detects a signal generated fromthe response of another vibrational mode, e.g. CH2 bending, tothe excitation of the NH3 bending. In general, the excitation ofone vibrational mode can lead to the vibrational frequency shiftof another mode because of the anharmonic coupling.46 Thecoupling produces a cross peak pair in the experimental 2Dspectrum similar to those in Figure 3B,C. In addition to thevibrational coupling, the thermal effects induced by therelaxation of vibrational excitation and the direct vibrationalenergy transfer between the excited and detected modes canalso produce cross peaks, which can have similar or differentfrequencies from those of cross peaks because of vibrationalcoupling in the 2D IR spectrum.30 At very short waiting timesbefore any rotational or conformational motion or intermo-lecular energy dissipation has occurred for a substantialamount,33 the signals from all the three contributions arewaiting-time dependent, the amplitudes of these cross peaks aredependent on the polarizations of the exciting and detectingbeams, and the cross angle θ between the transition dipolemoment directions of the excited and detected modes. For asample isotropically distributed within the laser focus spot, thevibrational cross angle θ can be straightforwardly determinedbased on the equation32,47
θθ
= −+
⊥II
2 cos1 2 cos
2
2(1)
where I∥, I⊥ are cross peak intensities with parallel andperpendicular excitation/detection polarizations as illustrated inFigure 3D,E, respectively. θ is the transition dipole momentcross angle between two coupled modes.Experimentally, the vibrational cross angle is determined in
the range between 0° and 90°. For a molecule rotating about abond from 0° to 360°, a measured vibrational cross angletypically corresponds to more than one chemical bond dihedralangles (an example is provided in Figure S4 in the SupportingInformation). Therefore, in order to obtain a single value for a
dihedral angle, more than one vibrational cross angles arerequired. In general, more vibrational cross angles give moreprecise results, not only because of the reason mentionedabove, but also because more measurements can reducerandom noise. Based on the reasoning, we scanned the 2DIR spectrum of the L-cysteine sample from ∼1250 cm−1 to∼3250 cm−1. The spectrum from the perpendicular polarizationconfiguration is shown in Figure 3A. Figure 3B,C showsenlarged spectra of the cross peak pairs between mode δ CH2and mode δ CH, and between mode δ CH2 and mode δ CHand vs COO
−, respectively. The peak assignments are based onthe literature48,49 and DFT calculations. In Figure 3B, theexcitation frequency ω1 = 1424 cm−1 is the CH2 bending 0−1transition frequency, indicating that the cross peak pair is fromthe CH2 bending excitation. The detection frequency (redpeak) ω3 = 1341 cm−1 is the CH bending 0−1 transitionfrequency, indicating that the cross peak pair is from the 0−1transition frequency shift of the CH bending from 1341 cm−1
(red peak) to 1333 cm−1 (blue peak) caused by the CH2excitation. Figure 3D is a slice cut along ω1 = 1424 cm−1 ofFigure 3B with the polarization of the excitation both parallel(∥) and perpendicular (⊥) to the polarization of the detectionbeam. The intensity peak ratio (I⊥/I∥) is ∼0.58. Based on eq 1and this ratio, the vibrational cross angle is determined to be∼36° between the two vibrational modes: δ CH2 (ω1) and δCH (ω3). The peak intensity ratio in Figure 3E is ∼1.4, whichgives a vibrational cross angle of ∼67° between the other pair ofmodes. Following the same procedure, we determined eightvibrational cross angles among eight pairs of vibrational modesto derive the different dihedral angles of the L-cysteine moleculein the sample. The measured cross angles are listed in Table 1.
The experimental data are provided in the SupportingInformation. The cross peaks involving the NH3 stretch, theCH stretch, and the SH stretch were not used in the analysis,because we found that the NH3 stretch peaks are extremelybroad (Figure 2B and Figure 3A), and they severely overlapwith the CH stretch and the SH stretch. The frequencyoverlaps impose great difficulties in properly deriving thevibrational cross angle for each pair of vibrations associatedwith these modes.
3.3. Convert Cross Angles into Dihedral Angles. Asdescribed in previous works,27,30,32,34 the measured vibrationalcross angles can be converted into chemical bond dihedralangles with the aid of ab initio calculations, despite the fact thatthe vector direction of the transition dipole moment of avibrational mode is typically different from the direction of thechemical bond that is mainly responsible for the vibration. Thegeneral procedure is to preset all possible molecular
Table 1. Vibrational Cross Angles between CoupledVibrational Modes of the L-Cysteine, All of Which AreDetermined from the Anisotropy Measurements
pair number coupled modes relative angle (degree)
1 δs NH3+/δa NH3
+ 322 δ CH2 /δa NH3
+ 733 v CC and δ CH /δa NH3
+ 604 δ CH and vs COO
−/δa NH3+ 43
5 δs NH3+/ δ CH2 53
6 v CC and δ CH /δs NH3+ 62
7 δ CH2 /δ CH and vs COO− 67
8 δ CH2/δ CH 36
The Journal of Physical Chemistry B Article
dx.doi.org/10.1021/jp406232k | J. Phys. Chem. B 2013, 117, 15614−1562415618
conformations by rotating the molecules about all internal
rotational degrees of freedom with the rotational step of several
degrees, which we typically set to be 10°, and then calculate the
vibrational cross angles of these preset conformations. The
calculated vibrational cross angles of each conformation are
compared to those experimentally measured. The preset
conformation(s) which has (have) calculated vibrational cross
angles closest to the experimental values is (are) considered as
the most probable conformation(s) determined by the method.
The similarity between the calculated and experimental cross
angles is defined by the average deviation Er:
=∑ | − |= A A
mEr i
mi i1C E
(2)
where AiC are the calculated vibrational cross angles of ith pair
of normal modes for a specific conformation. AiE are the
experimental values listed in Table 1. m is the number of thecoupling pairs (m = 8 in this work). We consider theconformation giving the minimum Er is the most probableconformation determined by the method.
3.3.1. Determining Dihedral Angles β and γ. As discussedabove, L-cysteine has four major single bonds. The rotationsabout these bonds for every 10° can produce enormousamounts of conformations that are too many to be practically
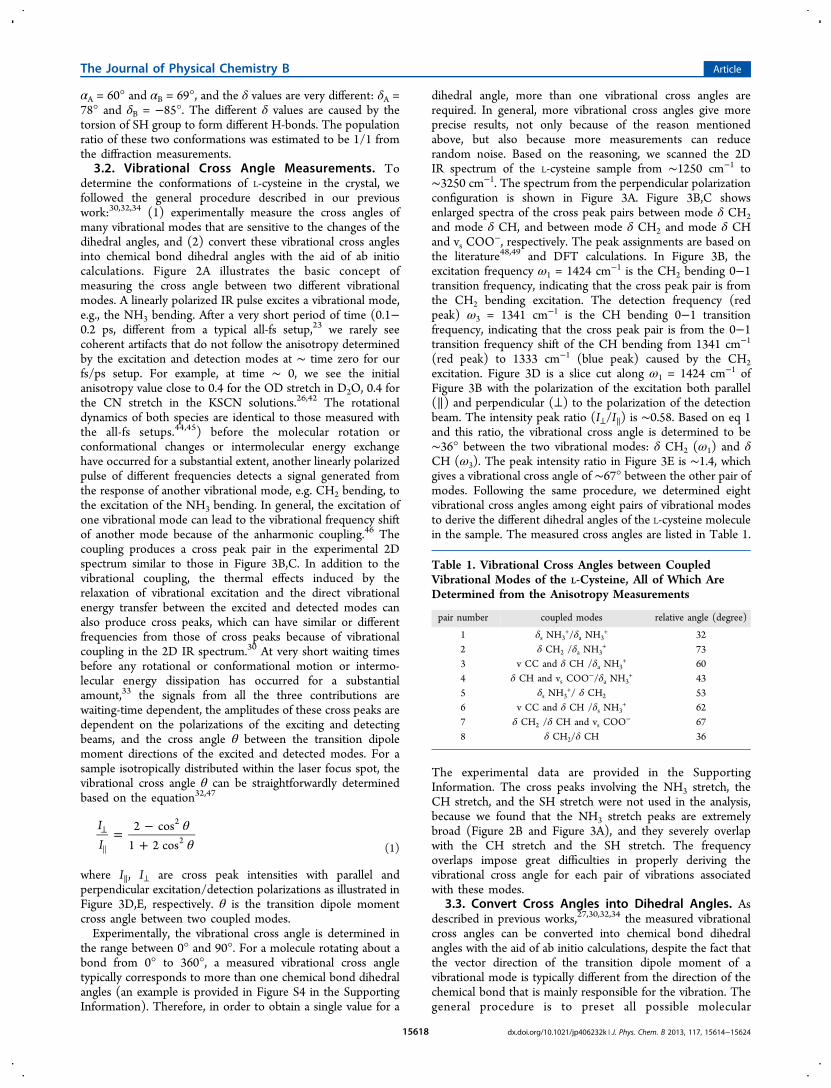
Figure 4. (A) The average difference Er between the experimental and calculated vibrational cross angles of the sample with different dihedral anglesβ and γ and fixed dihedral angle α = 60°. The z-axis is the amplitude of Er. The minimum Er value is labeled with white box. The red dot indicatesangles determined by neutron diffraction. (B) The derived most probable molecular conformation in the sample. (C) A slice cut along γ = 60° ofpanel A.
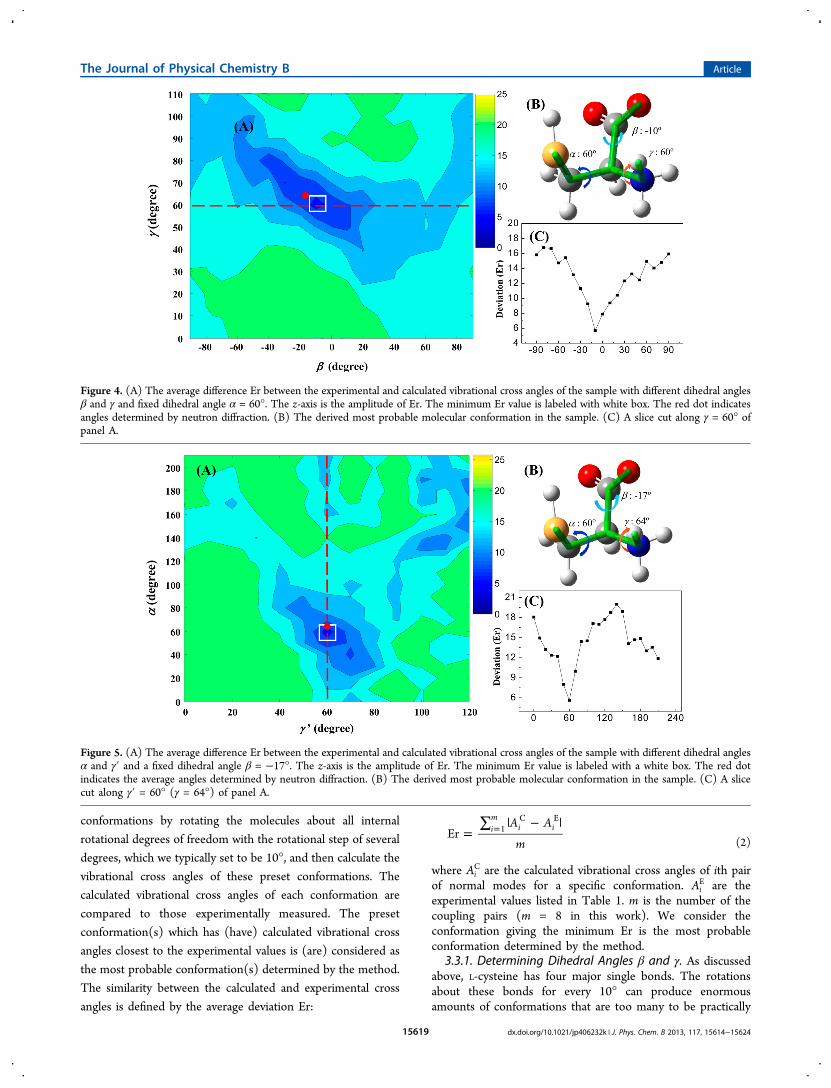
Figure 5. (A) The average difference Er between the experimental and calculated vibrational cross angles of the sample with different dihedral anglesα and γ′ and a fixed dihedral angle β = −17°. The z-axis is the amplitude of Er. The minimum Er value is labeled with a white box. The red dotindicates the average angles determined by neutron diffraction. (B) The derived most probable molecular conformation in the sample. (C) A slicecut along γ′ = 60° (γ = 64°) of panel A.
The Journal of Physical Chemistry B Article
dx.doi.org/10.1021/jp406232k | J. Phys. Chem. B 2013, 117, 15614−1562415619
calculated with high level ab initio calculations. To alleviate thedifficulty, we used some molecular knowledge about the sampleto reduce the calculation load. First of all, according to theliterature,50 the dihedral angle α is relatively rigid. It usuallyadopts values around 60° (the gauche+ conformer), −60° (thegauche− conformer) and 180° (trans) for a typical amino acid.The other dihedral angles β, γ, and δ are more flexible, andusually determined by intermolecular interactions, e.g., theformation of N−H···O hydrogen bonds, S−H···O, or S−H···Shydrogen bonds. In L-cysteine-I at ambient condition, only thegauche+ conformation exists,36 similar to the observation thatmost residues in peptides are in well-defined conformationswith a strong preference for the gauche+ conformation.50
Therefore, we can start calculations with a fixed dihedral angleα = 60° to find other different dihedral angles. After the otherangles are found, we can then come back to search for theoptimal value for α. Second, the vibrational modes associatedwith the vibrational cross angles used in the analysis do notcontain any significant contribution from the S atom. We cantherefore assume that the value of dihedral angle δ does notaffect these vibrational cross angles as much as the other threedihedral angles in the initial calculation and consider it as a freeparameter determined by the calculation based on the energyminimum criterion. Third, because of the symmetry of NH3
+
group and that of COO− group, the ranges of β and γ aresmaller than 360°. Based on the above considerations, in theinitial calculation to map the bond dihedral angles, we variedthe dihedral angle β from −90° to 90° and γ from 0° to 110°for every 10°, with a fixed α = 60° and a free δ. The calculatedvibrational cross angles from each of the conformations definedby these dihedral angles are compared to the experimentalresults, and the average deviation Er defined in eq 2 from thecomparison is plotted in Figure 4A. A global minimum of Er isclearly found at the dihedral angles: β = −10° and γ = 60°,which is labeled with a white box in Figure 4A. A slice cut alongγ = 60° of Figure 4A is plotted in Figure 4C. The minimum ofEr can clearly be seen at β = −10°. The molecularconformation defined by these angles is depicted in Figure4B. The two dihedral angles (β = −10° and γ = 60°)determined from the vibrational transition moment cross anglemethod are very close to those (β = −17° and γ = 64°)determined by the neutron diffraction method, which is at thelocation of the red dot in Figure 4A.36 Within experimentaluncertainty, which is estimated to be ∼10°, we consider the tworesults as identical.3.3.2. Determining Dihedral Angles α and γ′. We then
come back to search for the dihedral angle α by setting β =
−17° and varying dihedral angle γ′ (there is a one-to-onecorrespondence between γ′ and γ) from 0° to 120° and α from0° to 210° for every 10°. The average difference Er versus thetwo dihedral angles from the mapping is plotted in Figure 5A. Aglobal minimum of Er is found at the dihedral angles: α = 60°and γ′ = 60°, which corresponds to γ = 64°. The minimum islabeled with a white box in Figure 5A. The optimal value of αcan also be easily found from a slice cut along γ′ = 60° (Figure5C). The corresponding conformation is depicted in Figure 5B.Again, the determined dihedral angles are very close to those (α= 65° (average of 60° and 69°), γ = 64°) determined byneutron diffraction,36 the location of which is marked as red dotin Figure 5A. Setting β = −10° and γ = 60° (results from 3.3.1)to map the optimal value for α also gives α = 60° (Figure S4 inthe Supporting Information). The result confirms that the L-cysteine molecule in the sample adopts the gauche+
conformation (α = 60°), verifying the validity of choosing α= 60° as the initial input parameters to search for other dihedralangles. The result also shows that the sample is not L-cysteine-II, because about 50% of L-cysteine-II exists as the transconformation (α = 180°).37
3.3.3. Determine the Relative Positions of H Atoms ofNH3
+. As discussed above, different from the XRD method, thedihedral angles involving H atoms can be determined by thevibrational cross angle method relatively easily. To demonstratethis point, we use the H atoms of NH3
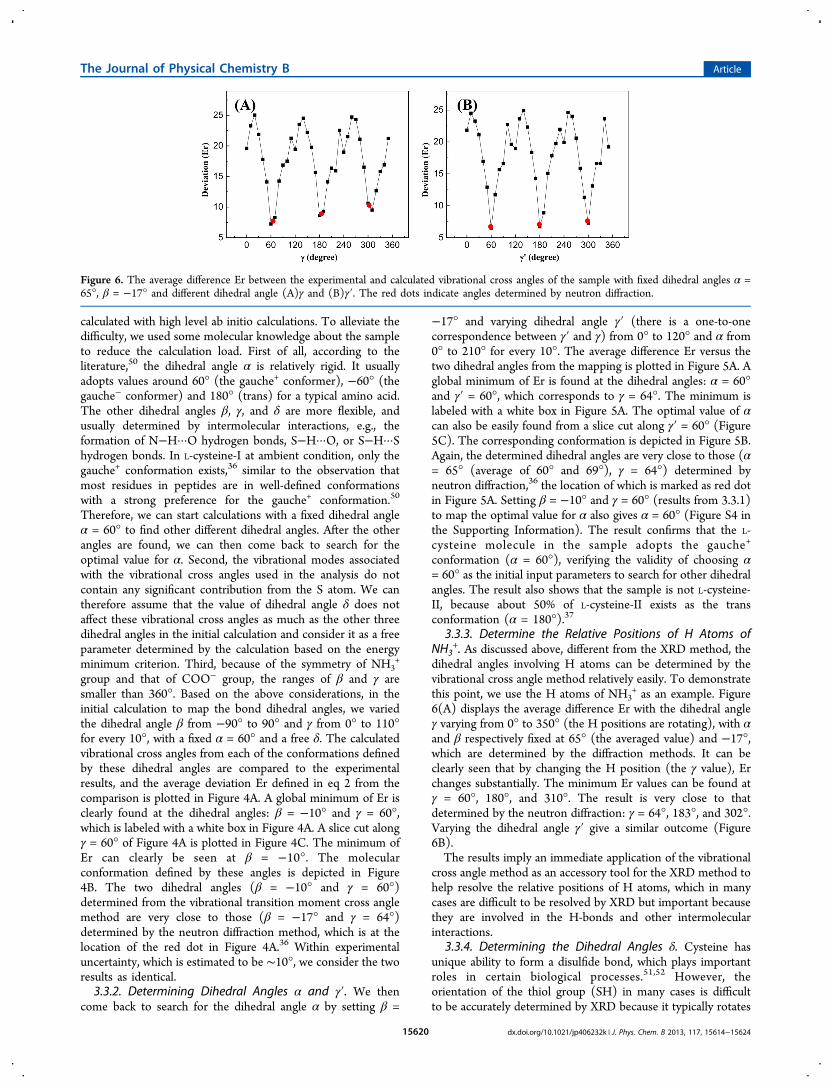
+ as an example. Figure6(A) displays the average difference Er with the dihedral angleγ varying from 0° to 350° (the H positions are rotating), with αand β respectively fixed at 65° (the averaged value) and −17°,which are determined by the diffraction methods. It can beclearly seen that by changing the H position (the γ value), Erchanges substantially. The minimum Er values can be found atγ = 60°, 180°, and 310°. The result is very close to thatdetermined by the neutron diffraction: γ = 64°, 183°, and 302°.Varying the dihedral angle γ′ give a similar outcome (Figure6B).The results imply an immediate application of the vibrational
cross angle method as an accessory tool for the XRD method tohelp resolve the relative positions of H atoms, which in manycases are difficult to be resolved by XRD but important becausethey are involved in the H-bonds and other intermolecularinteractions.
3.3.4. Determining the Dihedral Angles δ. Cysteine hasunique ability to form a disulfide bond, which plays importantroles in certain biological processes.51,52 However, theorientation of the thiol group (SH) in many cases is difficultto be accurately determined by XRD because it typically rotates
Figure 6. The average difference Er between the experimental and calculated vibrational cross angles of the sample with fixed dihedral angles α =65°, β = −17° and different dihedral angle (A)γ and (B)γ′. The red dots indicate angles determined by neutron diffraction.
The Journal of Physical Chemistry B Article
dx.doi.org/10.1021/jp406232k | J. Phys. Chem. B 2013, 117, 15614−1562415620
very fast at room temperature. According to the disorderedmodel,36 two preferred orientations of SH (denoted asconformations A and B) coexist in the L-cysteine-I crystalwith almost the same probability, leading to the formation ofS−H···O and S−H···S hydrogen bonds, respectively. Thecorresponding dihedral angles δ are suggested to be δA = 78°and δB = −85°, and the corresponding dihedral angles α are αA
= 60° and αB =69°.These two values of δ can also be determined by the
vibrational cross angle method. For this mixture case, thecalculated vibrational cross angles Ai
C in eq 2 must be replacedwith the weighted combination of two possible cross angles. In
a system containing different sets of molecules, according to theadditivity law of anisotropy, the total anisotropy is the weightedsum of the individual anisotropies:33,53
∑=R t f R t( ) ( )i
i i(3)
where Ri(t) is the anisotropy of each set and f i is the signalfraction of each set. The average vibrational cross angle θ isrelated to the total anisotropy by
θ= −R
3 cos 15
2
(4)
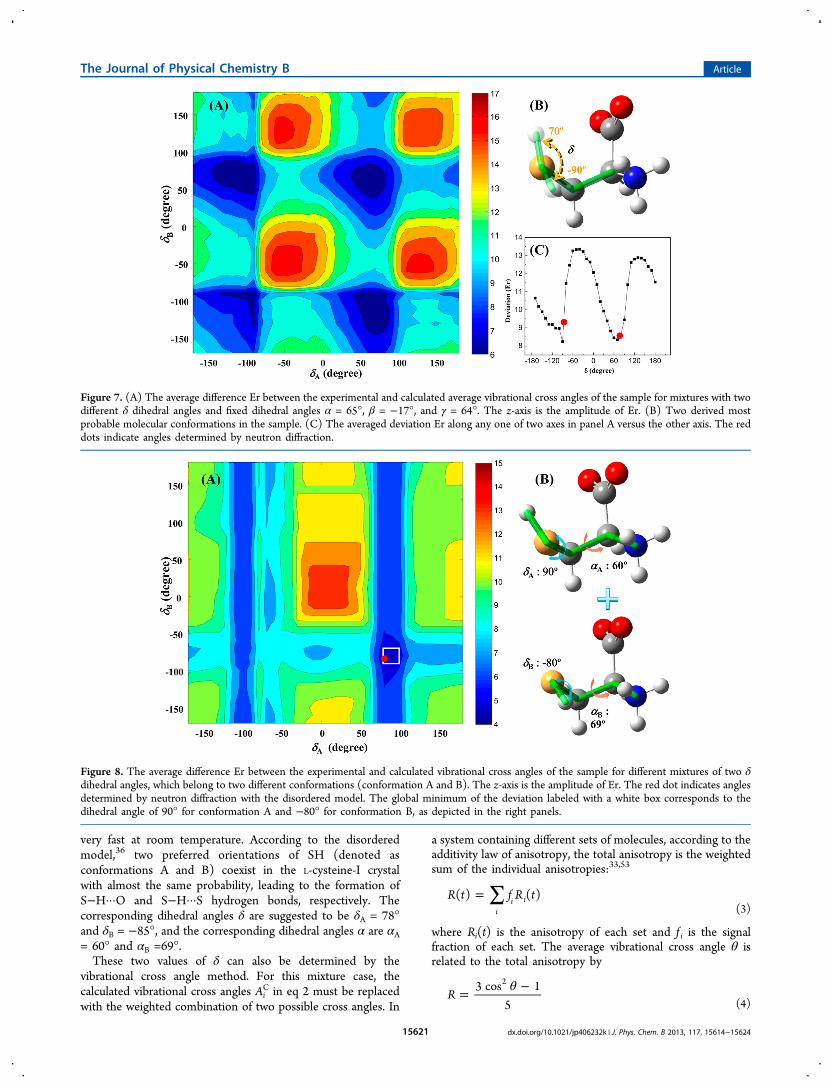
Figure 7. (A) The average difference Er between the experimental and calculated average vibrational cross angles of the sample for mixtures with twodifferent δ dihedral angles and fixed dihedral angles α = 65°, β = −17°, and γ = 64°. The z-axis is the amplitude of Er. (B) Two derived mostprobable molecular conformations in the sample. (C) The averaged deviation Er along any one of two axes in panel A versus the other axis. The reddots indicate angles determined by neutron diffraction.
Figure 8. The average difference Er between the experimental and calculated vibrational cross angles of the sample for different mixtures of two δdihedral angles, which belong to two different conformations (conformation A and B). The z-axis is the amplitude of Er. The red dot indicates anglesdetermined by neutron diffraction with the disordered model. The global minimum of the deviation labeled with a white box corresponds to thedihedral angle of 90° for conformation A and −80° for conformation B, as depicted in the right panels.
The Journal of Physical Chemistry B Article
dx.doi.org/10.1021/jp406232k | J. Phys. Chem. B 2013, 117, 15614−1562415621
Based on eqs 2, 3, and 4, the deviations Er for a mixture oftwo or more conformations can be calculated. Here one issueneeds to be emphasized. f i in eq 3 is the signal fraction. It is notnecessarily the same as the molecular fraction of each set ofconformation. As mentioned in our previous work,33 these twoquantities are identical only when the coupling responses arethe same in different conformations. This condition is probablyfulfilled for the current situation because the excitation anddetection modes in the two conformations are respectivelyidentical. We assume that the torsion angle of the SH groupdoes not change the coupling response that much because thevibrational modes measured have relatively small contributionsfrom the thiol group. Therefore, in calculating Er by varying δAand δB (Figure 7A), we took f i = 0.5 (the same as the molarratio), α = 65° (the averaged value of two conformations), β =−17° and γ = 64°. Four Er global minima reside in the locationsof δA, δB = −90°, 70°. Because one conformation can haveeither δA or δB, the results indicate that δ can only be either−90° or 70°. The dependence of the average deviation for eachconformation on the dihedral angle δ is plotted in Figure 7C.Two minima with δ = −90° and 70° are clearly visible. They arevery close to the neutron diffraction results marked as red dotsin Figure 7C. The corresponding conformations are depicted inFigure 7B.The above procedure is based on the preset percentage
(50%) for each conformation. Here we use one strategy to testthe reliability of the preset percentage. In the calculations forthe vibrational cross angles of each conformation by varying δAand δB, we fixed all the coordinates of atoms as thosedetermined from neutron diffraction method except the Hatom in thiol group, and corresponding dihedral angles are δ =−17°, γ = 64°, αA= 60°, and αB= 69°. In the calculations toobtain the average difference Er between calculated andexperimental cross angles, we left f i in eq 3 as a free parameterso that Er is a function of f i. For each complete set of dihedralangles δA = x, δB = y, β = −17°, γ = 64°, αA = 60°, and αB = 69°(x, y are arbitrary numbers between −180° to 180°), there is acorresponding minimum Er by varying f i. These minimum Ervalues versus δA and δB are plotted in Figure 8A. The smallestEr value in Figure 8A is located at δA = 90°, δB = −80°, labeledwith a white box. f i corresponding to this Er is 49% ofconformation A (Figure 8B). Both dihedral angles δA = 90°, δB= −80° are close to those (red dot in Figure 8A) from theneutron diffraction measurements: δA = 78° and δB = −85°. f i =49% is also close to the estimation that conformations A and Bare almost equally populated from the neutron diffractionmeasurements.In summary, the conformations in the L-cysteine-I sample
determined by the vibrational cross angle measurements are49% of conformation A with δA = 80° ± 10°, β = −10° ± 10°, γ= 60° ± 10°Z, αA = 60° ± 10°, and 51% of conformation Bwith δB = −80° ± 10°, β = −10° ± 10°, γ = 60° ± 10°Z, αB =60° ± 10°.3.4. Difficulties and Perspective. The results described
above demonstrate that the vibrational cross angle method hasthe potential to resolve conformations of relatively complexmolecules with the aid of some prior known molecularknowledge. At the same time, this work raises many problemsabout this method that were not met in our previous studies, asthe L-cysteine sample studied in this work is different fromprevious systems investigated with the same method.32−34 Firstof all, L-cysteine has four internal rotational degrees of freedomfrom which the calculation load is difficult to be dealt with by
ordinary personal computers equipped in a typical experimentallab. To save the computing time, the strategy used in this workto map all these four degrees of freedom is not a thoroughsearching scheme for the global minima. It is more like theapproach to guess a range that the global minima should bebased on some molecular knowledge and then search theminima in this range. There is always a risk that the initial guesscan actually be a local minimum rather than a global one. Amore statistically rigorous searching scheme that can balancebetween computational time and accuracy is needed in thefuture for resolving conformations of more complex molecules.Second, there can be more than two conformations each of
which is substantially populated in one sample. If these differentconformations have distinct frequencies for some vibrationalmodes within the excitation or detection frequency range, thevibrational cross angles associated with these modes can beused to resolve each individual conformation as demonstratedin our previous work.33 In the L-cysteine sample, there are noobvious frequency differences among the vibrational modes atfrequencies above 1200 cm−1 in the two conformations. If wedid not know that there are two conformations in the sample,we would only obtain a single δ = 80° value (Figure S5 in theSupporting Information) rather than two. This single value isnot the simple average of several values because the correlationbetween a bond dihedral angle and a vibrational cross angle isnot a straightforward function. The difficulty can be alleviatedby extending the detection down to far IR and T-Hz wheremore conformation-related vibrational modes of which thefrequencies are sensitive to the chemical bond dihedral anglesreside. This should be technically feasible as demonstrated inFigure 1 in which the far IR and T-Hz spectrum for the supercontinuum is successfully detected with a PMT. Our next stepis to assemble the detection scheme into the 2D IR system.Third, the vibrational peak assignment is another problem.
For many vibrational modes with frequencies below 1700 cm−1,their assignments are difficult because of at least two majorreasons: (1) Fermi resonances among normal modes andcombination bands or overtones, which generate new peaksthat are difficult to be theoretically predicted; and (2) thecalculated frequencies even with very high level calculations stillhave some noticeable uncertainties. Our general procedure toaddress this problem is to use the vibrational cross angles tohelp the assignments: find a few vibrational modes of which theassignments are well-defined, and then measure and calculatethe vibrational cross angles between these modes and thoseunassigned modes. The comparison between calculated andmeasured cross angles is generally very helpful in telling theorigins of the unknown peaks for relatively simple molecules ifthe candidate origins have very different transition dipolemoment directions. One of our future plans to improve thisapproach is to accumulate the database for each type ofmolecules to build a set of empirical criteria to assign peaks.Fourth, the frequency overlap among different modes is also
a very severe problem. Experimentally we measured many morethan the eight vibrational cross angles used in the analysis, butmost of them were not used either because the peakassignments are not clear or the frequency overlap is toosevere. In principle, this problem can be solved if thecompositions of a peak and the signal contributions of differentmodes to it are known. In practice, it is relatively easy to obtainthe compositions from calculations, but it is very difficult toknow about the detailed contribution of each mode to the totalsignal of the peak because the vibrational couplings can not be
The Journal of Physical Chemistry B Article
dx.doi.org/10.1021/jp406232k | J. Phys. Chem. B 2013, 117, 15614−1562415622
predicted very precisely by calculations.34At the current stage, itis probably more reliable to obtain the coupling strengthbetween any two modes by experiments rather than bycalculations. Again, a key step to alleviate the frequency overlapproblem is to accumulate a database to understand how twovibrational modes are coupled and how the coupling affects thesignal size.The four issues discussed above are the major challenges we
encounter in developing the vibrational cross angle methodinto a general molecular structural tool. They are practicallyvery difficult but are not principally impossible. Here only a fewvery superficial ideas are proposed to address them. We believethat many better approaches will be developed with theprogress of research in the future.
4. CONCLUDING REMARKSIn this work, the molecular conformations of crystalline L-cysteine prepared in its orthorhombic form were determined bythe vibrational cross angle measurements. Its major dihedralangles of chemical bonds determined by this method areconsistent with the results from diffraction experiments. Inaddition, we also demonstrate that the relative orientations ofthe chemical bonds associated with the hydrogen atoms of theNH3
+ group and the thiol group can also be determined by themethod. The results demonstrate that the vibrational crossangle method based on the multiple-mode approach canpotentially become a structural tool for determining molecularconformations, although we are still facing many challenges.
■ ASSOCIATED CONTENT*S Supporting InformationSupporting figures and data about XRD measurements, 2D-IRmeasurements, anisotropy measurements, and data analyses.This material is available free of charge via the Internet athttp://pubs.acs.org.
■ AUTHOR INFORMATIONCorresponding Author*Tel: 001-713-348-2048. E-mail: [email protected].
NotesThe authors declare no competing financial interest.
■ ACKNOWLEDGMENTSThis material is based upon work supported by the Welchfoundation under Award No. C-1752, and the Air Force Officeof Scientific Research under AFOSR Award No. FA9550-11-1-0070. J.Z. also thanks the David and Lucile Packard Foundationfor a Packard fellowship.
■ REFERENCES(1) Vangunsteren, W. F.; Berendsen, H. J. C. Computer-Simulationas a Tool for Tracing the Conformational Differences betweenProteins in Solution and in the Crystalline State. J. Mol. Biol. 1984,176, 559−564.(2) Skrynnikov, N. R.; Goto, N. K.; Yang, D. W.; Choy, W. Y.;Tolman, J. R.; Mueller, G. A.; Kay, L. E. Orienting domains in proteinsusing dipolar couplings measured by liquid-state NMR: Differences insolution and crystal forms of maltodextrin binding protein loaded withbeta-cyclodextrin. J. Mol. Biol. 2000, 295, 1265−1273.(3) Weissenhorn, W.; Dessen, A.; Calder, L. J.; Harrison, S. C.;Skehel, J. J.; Wiley, D. C. Structural basis for membrane fusion byenveloped viruses. Mol. Membr. Biol. 1999, 16, 3−9.
(4) Torii, K.; Iitaka, Y. Crystal Structure of L-Valine. Acta Crystallogr.,Sect. B: Struct. Crystallogr. Cryst. Chem. 1970, B 26, 1317.(5) Torii, K.; Iitaka, Y. Crystal Structure of L-Isoleucine. ActaCrystallogr., Sect. B: Struct. Crystallogr. Cryst. Chem. 1971, B 27, 2237.(6) Simpson, H. J.; Marsh, R. E. Crystal Structure of L-Alanine. ActaCrystallogr. 1966, 20, 550−.(7) Derissen, J. L.; Endeman, H. J.; Peerdema, Af. Crystal andMolecular Structure of L-Aspartic Acid. Acta Crystallogr., Sect. B: Struct.Crystallogr. Cryst. Chem. 1968, B 24, 1349.(8) Hirokawa, S. A New Modification of L-Glutamic Acid and ItsCrystal Structure. Acta Crystallogr. 1955, 8, 637−641.(9) Cochran, W.; Penfold, B. R. The Crystal Structure of L-Glutamine. Acta Crystallogr. 1952, 5, 644−653.(10) Tarakeshwar, P.; Manogaran, S. Vibrational Frequencies ofCysteine and Serine Zwitterions - an Ab-Initio Assignment. Spectroc.Acta Pt. A-Molec. Biomolec. Spectr. 1995, 51, 925−928.(11) Pawlukojc, A.; Leciejewicz, J.; Ramirez-Cuesta, A.; Nowicka-Scheibe, J. L-Cysteine: Neutron spectroscopy, Raman, IR and ab initiostudy. Spectrosc. Acta, Part A: Mol. Biomol. Spectrosc. 2005, 61, 2474−2481.(12) Ernst, R. R.; Bodenhausen, G.; Wokaun, A. Nuclear MagneticResonance in One and Two Dimensions; Oxford University Press:Oxford, 1987.(13) Bifulco, G.; Dambruoso, P.; Gomez-Paloma, L.; Riccio, R.Determination of relative configuration in organic compounds byNMR spectroscopy and computational methods. Chem. Rev. 2007,107, 3744−3779.(14) Jonas, D. M. Two-Dimensional Femtosecond Spectroscopy.Annu. Rev. Phys. Chem. 2003, 54, 425−463.(15) Dlott, D. D. Ultrafast Chemical Exchange Seen with 2DVibrational Echoes. Science 2005, 309, 1333−1334.(16) Khalil, M.; Demirdoven, N.; Tokmakoff, A. Coherent 2D IRSpectroscopy: Molecular Structure and Dynamics in Solution. J. Phys.Chem. A. 2003, 107, 5258−5279.(17) Bredenbeck, J.; Helbing, J.; Hamm, P. Labeling vibrations bylight: Ultrafast transient 2D-IR spectroscopy tracks vibrational modesduring photoinduced charge transfer. J. Am. Chem. Soc. 2004, 126,990−991.(18) Shim, S. H.; Strasfeld, D. B.; Ling, Y. L.; Zanni, M. T.Automated 2D IR spectroscopy using a mid-IR pulse shaper andapplication of this technology to the human islet amyloid polypeptide.Proc. Natl. Acad. Sci. U.S.A. 2007, 104, 14197−14202.(19) Nee, M. J.; Baiz, C. R.; Anna, J. M.; McCanne, R.; Kubarych, K.J. Multilevel vibrational coherence transfer and wavepacket dynamicsprobed with multidimensional IR spectroscopy. J. Chem. Phys. 2008,129, 11.(20) Naraharisetty, S. R. G.; Kasyanenko, V. M.; Rubtsov, I. V. Bondconnectivity measured via relaxation-assisted two-dimensional infraredspectroscopy. J. Chem. Phys. 2008, 128, 7.(21) Maekawa, H.; Formaggio, F.; Toniolo, C.; Ge, N. H. Onset of3(10)-helical secondary structure in Aib oligopeptides probed bycoherent 2D IR spectroscopy. J. Am. Chem. Soc. 2008, 130, 6556−6566.(22) Cowan, M. L.; Bruner, B. D.; Huse, N.; Dwyer, J. R.; Chugh, B.;Nibbering, E. T. J.; Elsaesser, T.; Miller, R. J. D. Ultrafast memory lossand energy redistribution in the hydrogen bond network of liquidH2O. Nature 2005, 434, 199−202.(23) Zheng, J.; Kwak, K.; Asbury, J. B.; Chen, X.; Piletic, I.; Fayer, M.D. Ultrafast Dynamics of Solute-Solvent Complexation Observed atThermal Equilibrium in Real Time. Science 2005, 309, 1338−1343.(24) Zheng, J.; Kwac, K.; Xie, J.; Fayer, M. D. Ultrafast Carbon-Carbon Single Bond Rotational Isomerization in Room TemperatureSolution. Science 2006, 313, 1951−1955.(25) Bredenbeck, J.; Ghosh, A.; Smits, M.; Bonn, M. Ultrafast twodimensional-infrared spectroscopy of a molecular monolayer. J. Am.Chem. Soc. 2008, 130, 2152−+.(26) Bian, H. T.; Wen, X. W.; Li, J. B.; Chen, H. L.; Han, S. Z.; Sun,X. Q.; Song, J. A.; Zhuang, W.; Zheng, J. R. Ion clustering in aqueous
The Journal of Physical Chemistry B Article
dx.doi.org/10.1021/jp406232k | J. Phys. Chem. B 2013, 117, 15614−1562415623
solutions probed with vibrational energy transfer. Proc. Natl. Acad. Sci.U.S.A. 2011, 108, 4737−4742.(27) Chen, H. L.; Zhang, Y. F.; Li, J. B.; Liu, H. J.; Jiang, D. E.;Zheng, J. R. Vibrational Cross Angles in Condensed Molecules: AStructural Tool. J. Phys. Chem. A 2013, DOI: 10.1021/jp406304c.(28) Li, J. B.; Bian, H. T.; Chen, H. L.; Hoang, B.; Zheng, J. R. IonAssociation in Aqueous Solutions Probed through Vibrational EnergyTransfers among Cation, Anion and Water Molecules. J. Phys. Chem. B2013, 117, 4274−4283.(29) Li, J. B.; Bian, H. T.; Wen, X. W.; Chen, H. L.; Yuan, K. J.;Zheng, J. R. Probing Ion/Molecule Interactions in Aqueous Solutionswith Vibrational Energy Transfer. J. Phys. Chem. B 2012, 116, 12284−12294.(30) Chen, H. L.; Bian, H. T.; Li, J. B.; Wen, X. W.; Zheng, J. R.Ultrafast multiple-mode multiple-dimensional vibrational spectrosco-py. Int. Rev. Phys. Chem. 2012, 31, 469−565.(31) Bian, H. T.; Li, J. B.; ZHang, Q.; Chen, H. L.; Zhuang, W.; Gao,Y. Q.; Zheng, J. R. Ion Segregation in Aqueous Solutions. J. Phys.Chem. B 2012, 116, 14426−14432.(32) Bian, H. T.; Li, J. B.; Chen, H. L.; Yuan, K. J.; Wen, X. W.; Li, Y.Q.; Sun, Z. G.; Zheng, J. R. Molecular Conformations and Dynamicson Surfaces of Gold Nanoparticles Probed with Multiple-ModeMultiple-Dimensional Infrared Spectroscopy. J. Phys. Chem. C 2012,116, 7913−7924.(33) Chen, H. L.; Bian, H. T.; Li, J. B.; Wen, X. W.; Zheng, J. R.Relative Intermolecular Orientation Probed via Molecular HeatTransport. J. Phys. Chem. A 2013, DOI: 10.1021/jp312604v.(34) Bian, H. T.; Li, J. B.; Wen, X. W.; Sun, Z. G.; Song, J. A.;Zhuang, W.; Zheng, J. R. Mapping Molecular Conformations withMultiple-Mode Two-Dimensional Infrared Spectroscopy. J. Phys Chem.A 2011, 115, 3357−3365.(35) Bian, H. T.; Chen, H. L.; Li, J. B.; Wen, X. W.; Zheng, J. R.Nonresonant and resonant mode-specific intermolecular vibrationalenergy transfers in electrolyte aqueous solutions. J. Phys. Chem. A.2011, 115, 11657−11664.(36) Kerr, K. A.; Ashmore, J. P.; Koetzle, T. F. Neutron-DiffractionStudy of L-Cysteine. Acta Crystallogr. Sect. B-Struct. Commun. 1975, 31,2022−2026.(37) Harding, M. M.; Long, H. A. Crystal and Molecular Structure of
L-Cysteine. Acta Crystallogr., Sect. B: Struct. Crystallogr. Cryst. Chem.1968, B 24, 1096.(38) Gorbitz, C. H.; Dalhus, B. L-Cysteine, monoclinic form,redetermination at 120 K. Acta Crystallogr., Sect. C: Cryst. Struct.Commun. 1996, 52, 1756−1759.(39) Dai, J.; Xie, X.; Zhang, X. C. Detection of broadband terahertzwaves with a laser-induced plasma in gases. Phys. Rev. Lett. 2006, 97, 4.(40) Petersen, P. B.; Tokmakoff, A. A source for ultrafast continuuminfrared and terahertz radiation. Opt. Lett. 2010, 35, 1962−1964.(41) Calabrese, C.; Stingel, A. M.; Shen, L.; Petersen, P. B. Ultrafastcontinuum mid-infrared spectroscopy: Probing the entire vibrationalspectrum in a single laser shot with femtosecond time resolution. Opt.Lett. 2012, 37, 2265−2267.(42) Bian, H. T.; Wen, X. W.; Li, J. B.; Zheng, J. R. Mode-specificintermolecular vibrational energy transfer. II. Deuterated water andpotassium selenocyanate mixture. J. Chem. Phys. 2010, 133, 034505.(43) Dong, F.; Miller, R. E. Vibrational transition moment angles inisolated biomolecules: A structural tool. Science 2002, 298, 1227−1230.(44) Rezus, Y. L. A.; Bakker, H. J. On the orientational relaxation ofHDO in liquid water. J. Chem. Phys. 2005, 123, 7.(45) Lenchenkov, V.; She, C. X.; Lian, T. Q. Vibrational relaxation ofCN stretch of pseudo-halide anions (OCN-, SCN-, and SeCN-) inpolar solvents. J. Phys. Chem. B 2006, 110, 19990−19997.(46) Ultrafast Infrared and Raman Spectroscopy; Fayer, M. D., Ed.;Marcel Dekker, Inc: New York/Basel, 2001; Vol. 26.(47) Lawkowicz, J. Principles of Fluorescence Spectroscopy, 3rd ed.;Springer: New York, 2006.
(48) Susi, H.; Byler, D. M.; Gerasimowicz, W. V. Vibrational Analysisof Amino-Acids - Cysteine, Serine, Beta-Chloroalanine. J. Mol. Struct.1983, 102, 63−79.(49) Barth, A. The infrared absorption of amino acid side chains.Prog. Biophys. Mol. Biol. 2000, 74, 141−173.(50) Gorbitz, C. H. Conformational Properties of the Amino-Acid-Residues L-Cysteine, L-Serine and L-Cystine. Acta Chem. Scand. 1990,44, 584−590.(51) Gregoret, L. M.; Rader, S. D.; Fletterick, R. J.; Cohen, F. E.Hydrogen-Bonds Involving Sulfur-Atoms in Proteins. Proteins: Struct.,Funct., Genet. 1991, 9, 99−107.(52) Zhou, P.; Tian, F. F.; Lv, F. L.; Shang, Z. C. Geometriccharacteristics of hydrogen bonds involving sulfur atoms in proteins.Proteins 2009, 76, 151−163.(53) Valeur, B. Molecular Fluorescence: Principles and Applications;Wiley-VCH: Weinheim, Germany, 2002.
The Journal of Physical Chemistry B Article
dx.doi.org/10.1021/jp406232k | J. Phys. Chem. B 2013, 117, 15614−1562415624
1
Supporting Information
Molecular Conformations of Crystalline L-Cysteine Determined with
Vibrational Cross Angle Measurements
Hailong Chen, Hongtao Bian, Jiebo Li, Xunmin Guo, Xiewen Wen, Junrong Zheng*
Department of Chemistry, Rice University, Houston, TX 77005, USA
* To whom correspondence should be addressed. Tel: 001-713-348-2048. E-mail:
2
10 20 30 40 50
Inte
nsity
2θθθθ (degree)
10 20 30 40 50
Inte
nsity
2θθθθ (degree)
Experimental data
L-cysteine-IExperimental data
L-cysteine-II
(B)(A)
10 20 30 40 50 60
Inte
nsi
ty
2θθθθ (degree)
(C)
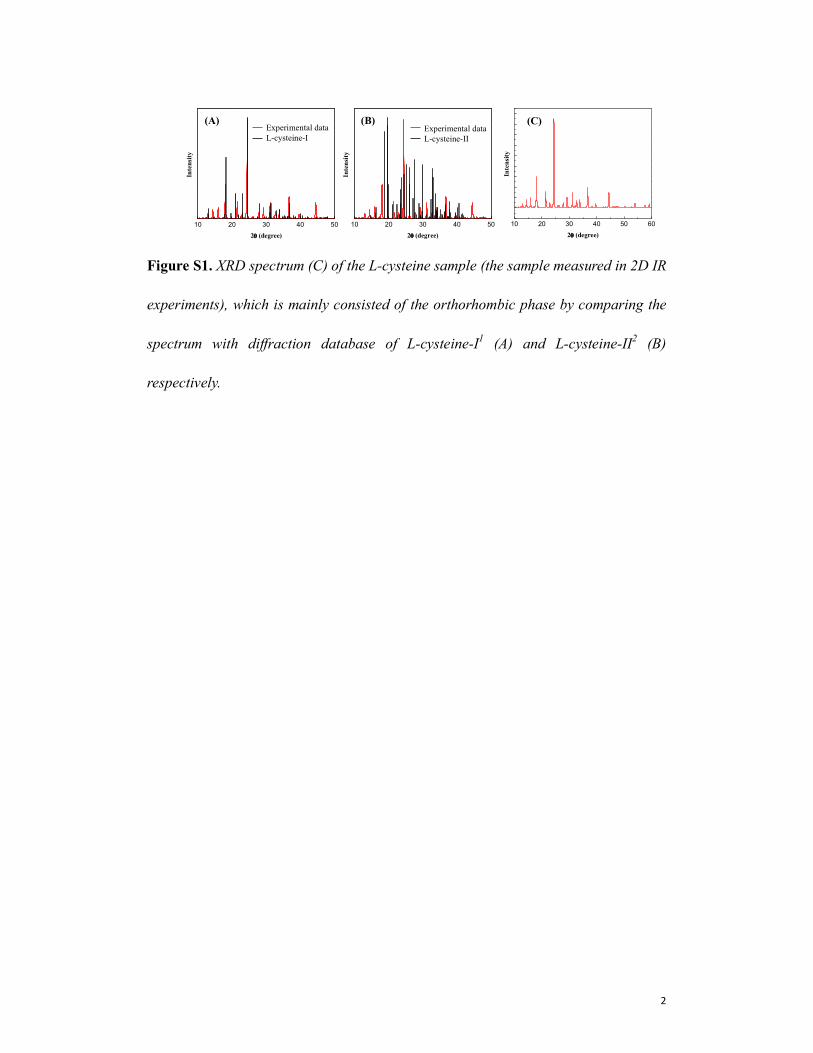
Figure S1. XRD spectrum (C) of the L-cysteine sample (the sample measured in 2D IR
experiments), which is mainly consisted of the orthorhombic phase by comparing the
spectrum with diffraction database of L-cysteine-I1 (A) and L-cysteine-II
2 (B)
respectively.
3
-5 0 5 10
0.000
0.003
0.006
-5 0 5 10
0.000
0.001
0.002
0.003
0.004
pump δs NH3+
probe δa NH3+
Pair 1
-5 0 5 10
0.000
0.001
0.002
0.003
0.004
-5 0 5 10
0.000
0.002
0.004
-5 0 5 10
0.000
0.002
0.004
-5 0 5 10
0.000
0.002
0.004
-5 0 5 10
0.000
0.002
0.004
-5 0 5 10
0.000
0.001
0.002
0.003
Pair 2 Pair 3 Pair 4
Pair 5 Pair 6 Pair 7 Pair 8
PP Signal
Time Delay (ps)
pump δ CH2probe δa NH3
+
pump v CC & δ CH
probe δa NH3+
pump δ CH & vs COO-
probe δa NH3+
pump δs NH3+
probe δ CH2
pump v CC & δ CH
probe δs NH3+
pump δ CH2probe δ CH & vs COO
-
pump δ CH2probe δ CH
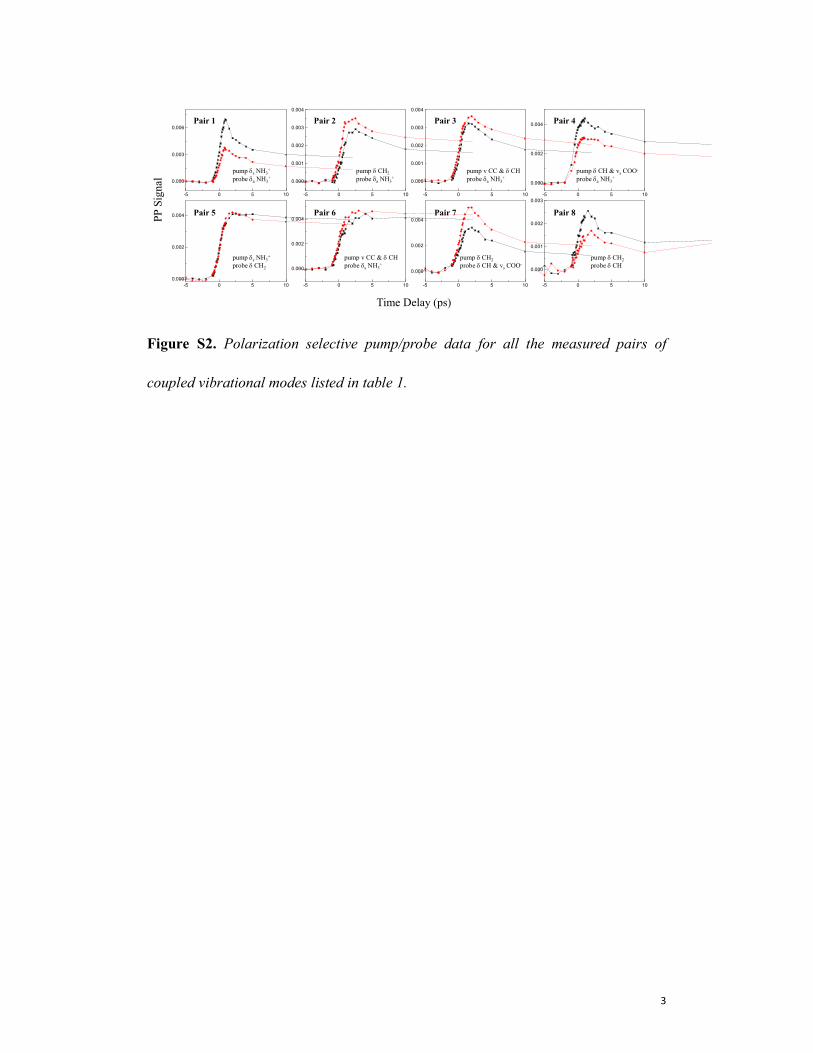
Figure S2. Polarization selective pump/probe data for all the measured pairs of
coupled vibrational modes listed in table 1.
4
0 1 2 3 4 5 60.00
0.05
0.10
0.15
0.20
0.25
0.30
Anis
otr
opy
Time Delay (ps)
0 1 2 3 4 50.00
0.03
0.06
0.09
0.12
0.15
Anis
otr
opy
Time Delay (ps)
Pair 1 Pair 4
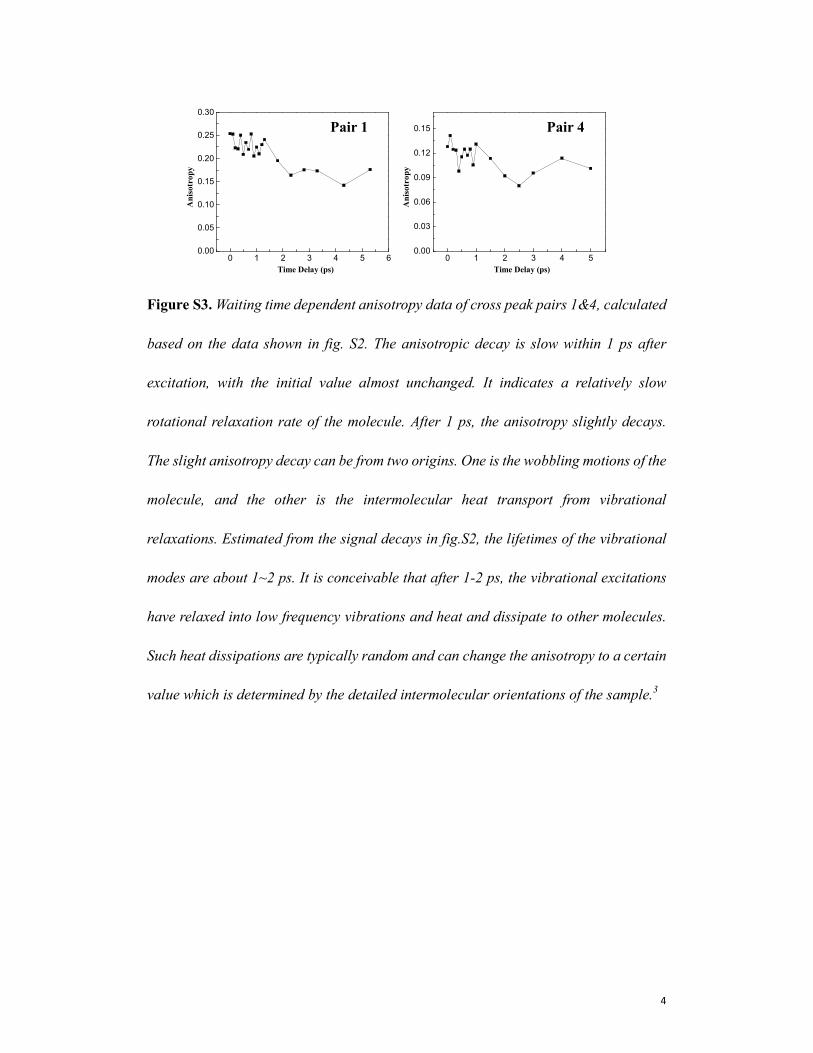
Figure S3. Waiting time dependent anisotropy data of cross peak pairs 1&4, calculated
based on the data shown in fig. S2. The anisotropic decay is slow within 1 ps after
excitation, with the initial value almost unchanged. It indicates a relatively slow
rotational relaxation rate of the molecule. After 1 ps, the anisotropy slightly decays.
The slight anisotropy decay can be from two origins. One is the wobbling motions of the
molecule, and the other is the intermolecular heat transport from vibrational
relaxations. Estimated from the signal decays in fig.S2, the lifetimes of the vibrational
modes are about 1~2 ps. It is conceivable that after 1-2 ps, the vibrational excitations
have relaxed into low frequency vibrations and heat and dissipate to other molecules.
Such heat dissipations are typically random and can change the anisotropy to a certain
value which is determined by the detailed intermolecular orientations of the sample.3
5
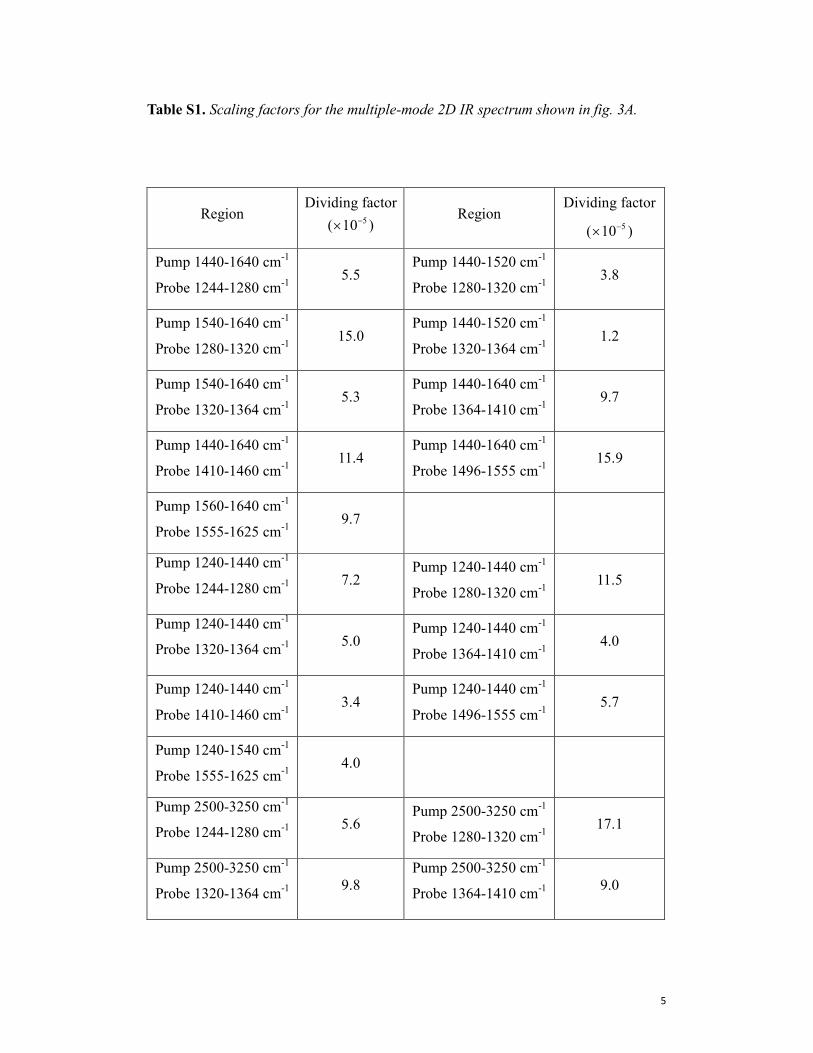
Table S1. Scaling factors for the multiple-mode 2D IR spectrum shown in fig. 3A.
Region Dividing factor
( 510−× ) Region
Dividing factor
( 510−× )
Pump 1440-1640 cm-1
Probe 1244-1280 cm-1
5.5 Pump 1440-1520 cm
-1
Probe 1280-1320 cm-1
3.8
Pump 1540-1640 cm-1
Probe 1280-1320 cm-1
15.0 Pump 1440-1520 cm
-1
Probe 1320-1364 cm-1
1.2
Pump 1540-1640 cm-1
Probe 1320-1364 cm-1
5.3 Pump 1440-1640 cm
-1
Probe 1364-1410 cm-1
9.7
Pump 1440-1640 cm-1
Probe 1410-1460 cm-1
11.4 Pump 1440-1640 cm
-1
Probe 1496-1555 cm-1
15.9
Pump 1560-1640 cm-1
Probe 1555-1625 cm-1
9.7
Pump 1240-1440 cm-1
Probe 1244-1280 cm-1
7.2 Pump 1240-1440 cm
-1
Probe 1280-1320 cm-1
11.5
Pump 1240-1440 cm-1
Probe 1320-1364 cm-1
5.0 Pump 1240-1440 cm
-1
Probe 1364-1410 cm-1
4.0
Pump 1240-1440 cm-1
Probe 1410-1460 cm-1
3.4 Pump 1240-1440 cm
-1
Probe 1496-1555 cm-1
5.7
Pump 1240-1540 cm-1
Probe 1555-1625 cm-1
4.0
Pump 2500-3250 cm-1
Probe 1244-1280 cm-1
5.6 Pump 2500-3250 cm
-1
Probe 1280-1320 cm-1
17.1
Pump 2500-3250 cm-1
Probe 1320-1364 cm-1
9.8
Pump 2500-3250 cm-1
Probe 1364-1410 cm-1
9.0
6
Pump 2500-3250 cm-1
Probe 1410-1460 cm-1
14.3 Pump 2500-3250 cm
-1
Probe 1496-1555 cm-1
38.3
Pump 2500-3250 cm-1
Probe 1555-1625 cm-1
20.0
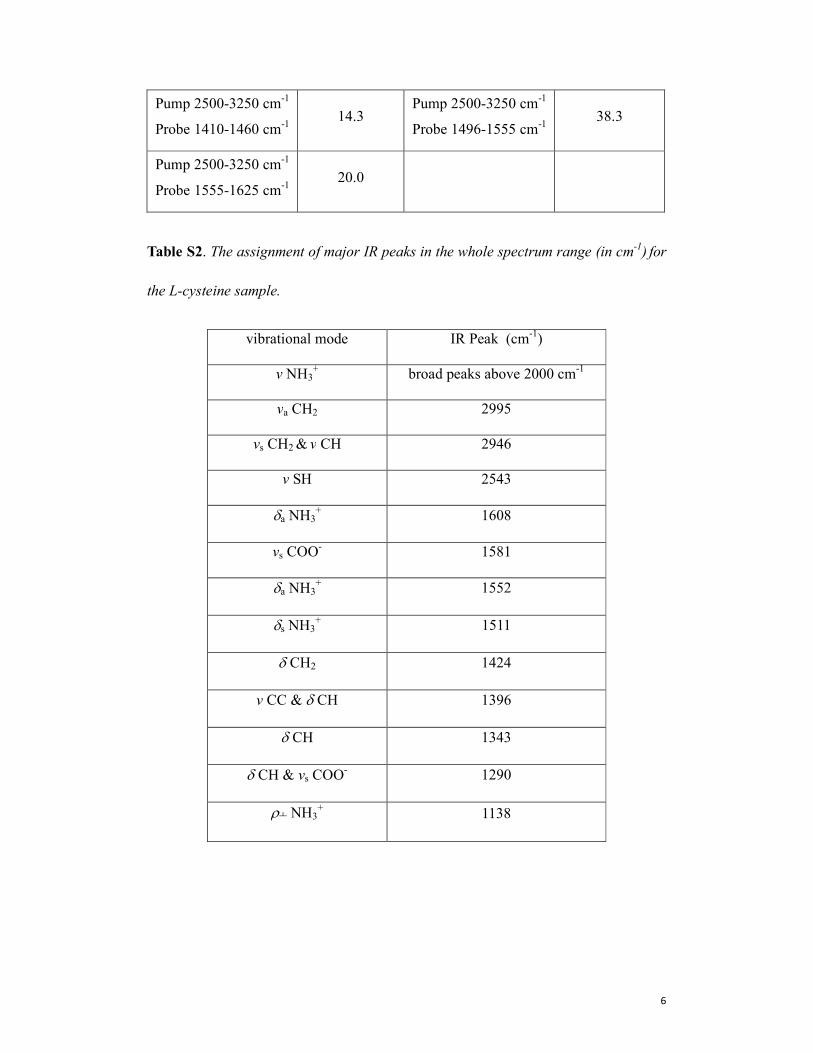
Table S2. The assignment of major IR peaks in the whole spectrum range (in cm-1) for
the L-cysteine sample.
vibrational mode IR Peak (cm-1)
v NH3+ broad peaks above 2000 cm
-1
va CH2 2995
vs CH2 & v CH 2946
v SH 2543
δa NH3+ 1608
vs COO- 1581
δa NH3+ 1552
δs NH3+ 1511
δ CH2 1424
v CC & δ CH 1396
δ CH 1343
δ CH & vs COO- 1290
ρ┴ NH3+ 1138
7
0 60 120 180 240 300 360
20
30
40
50
60
70
80
90
Cro
ss A
ngle
(degre
e)
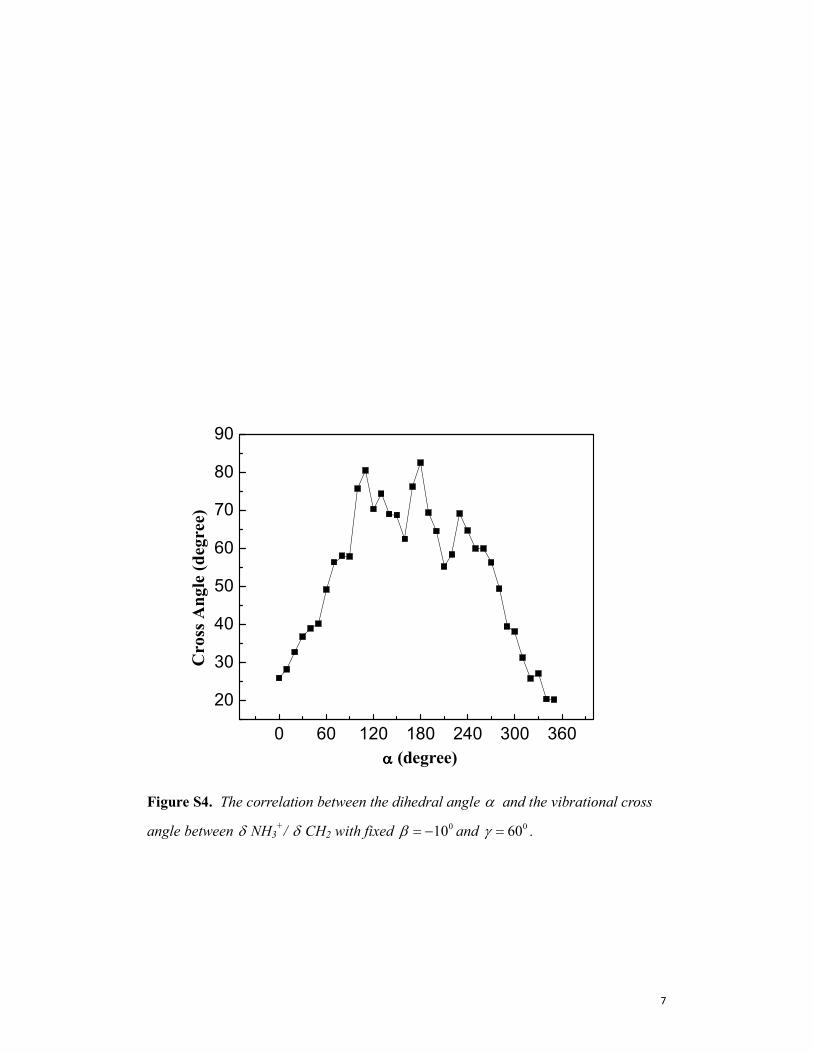
αααα (degree)
Figure S4. The correlation between the dihedral angle α and the vibrational cross
angle between δ NH3+/ δ CH2 with fixed
010β = − and 060γ = .
8
0 60 120 180 240 300 360
5
10
15
20
25
Dev
iation (E
r)
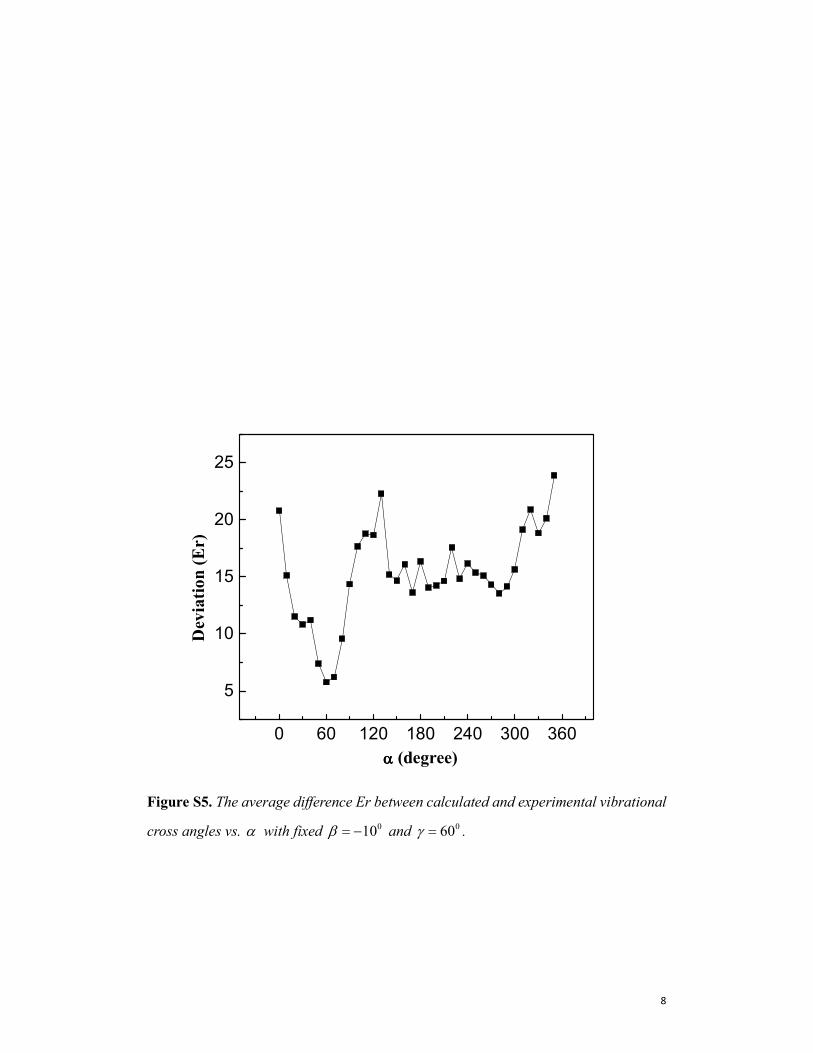
α α α α (degree)
Figure S5. The average difference Er between calculated and experimental vibrational
cross angles vs. α with fixed 010β = − and 060γ = .
9
-180 -120 -60 0 60 120 1804
6
8
10
12
14
16
18
Devia
tion (E
r)
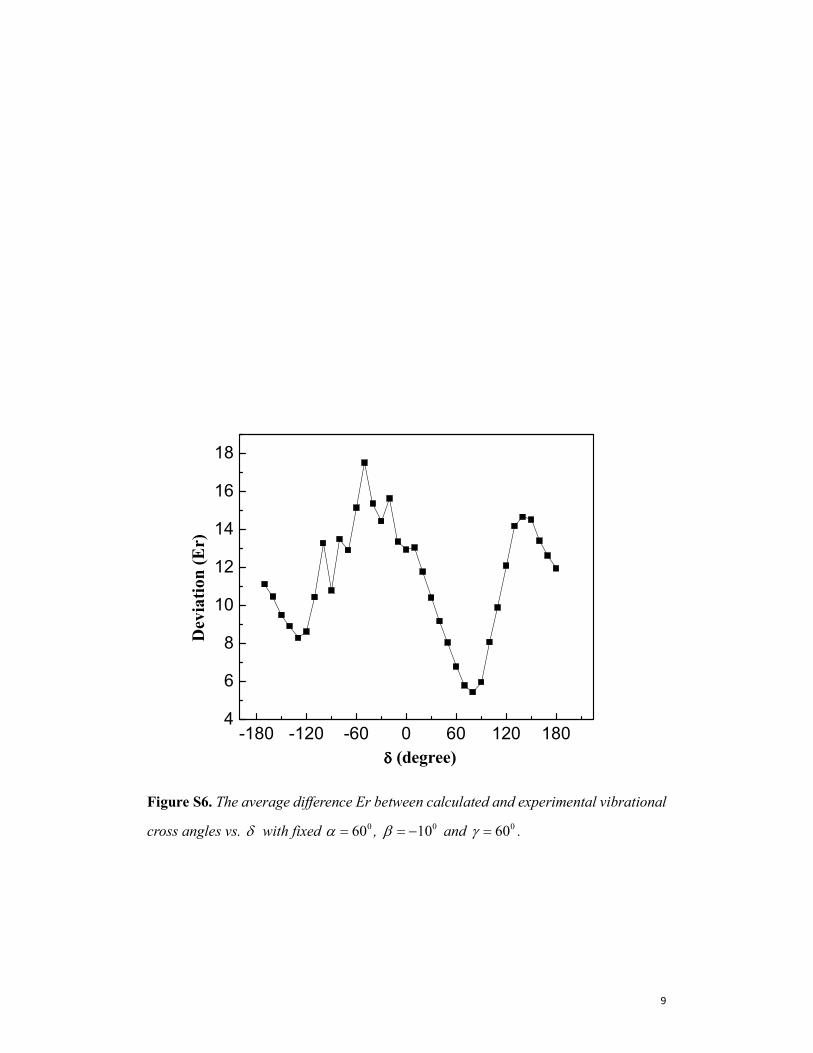
δ δ δ δ (degree)
Figure S6. The average difference Er between calculated and experimental vibrational
cross angles vs. δ with fixed 060α = , 010β = − and 060γ = .
10
References
(1) Powder Diffraction File, Card No. 00-032-1636, International Centre for
Diffraction Data, Newtown Square, PA
(2) Powder Diffraction File, Card No. 00-024-1928, International Centre for
Diffraction Data, Newtown Square, PA
(3) Chen, H. L.; Bian, H. T.; Li, J. B.; Wen, X. W.; Zheng, J. R. Relative
intermolecular orientation probed via molecular heat transport. J. Phys. Chem.
A. 2013, 117, pp.6052-6065.