molecular dynamics simulation of the kinetic reaction of
TRANSCRIPT

Molecular Dynamics Simulation of the Kinetic Reaction of
Nickel and Aluminum Nanoparticles
by Brian J. Henz, Takumi Hawa, and Michael Zachariah
ARL-TR-5134 March 2010
Approved for public release; distribution unlimited.

NOTICES
Disclaimers The findings in this report are not to be construed as an official Department of the Army position unless so designated by other authorized documents. Citation of manufacturer’s or trade names does not constitute an official endorsement or approval of the use thereof. Destroy this report when it is no longer needed. Do not return it to the originator.

Army Research Laboratory Aberdeen Proving Ground, MD 21005
ARL-TR-5134 March 2010
Molecular Dynamics Simulation of the Kinetic Reaction of Nickel and Aluminum Nanoparticles
Brian J. Henz
Computational and Information Sciences Directorate, ARL
and
Takumi Hawa National Institute of Standards and Technology, Gaithersburg, MD
and
Michael Zachariah
Department of Mechanical Engineering and the Department of Chemistry and Biochemistry, University of Maryland, College Park, MD
Approved for public release; distribution unlimited.

ii
REPORT DOCUMENTATION PAGE Form Approved OMB No. 0704-0188
Public reporting burden for this collection of information is estimated to average 1 hour per response, including the time for reviewing instructions, searching existing data sources, gathering and maintaining the data needed, and completing and reviewing the collection information. Send comments regarding this burden estimate or any other aspect of this collection of information, including suggestions for reducing the burden, to Department of Defense, Washington Headquarters Services, Directorate for Information Operations and Reports (0704-0188), 1215 Jefferson Davis Highway, Suite 1204, Arlington, VA 22202-4302. Respondents should be aware that notwithstanding any other provision of law, no person shall be subject to any penalty for failing to comply with a collection of information if it does not display a currently valid OMB control number. PLEASE DO NOT RETURN YOUR FORM TO THE ABOVE ADDRESS.
1. REPORT DATE (DD-MM-YYYY)
March 2010 2. REPORT TYPE
Final 3. DATES COVERED (From - To)
October 2007 to June 2008 4. TITLE AND SUBTITLE
Molecular Dynamics Simulation of the Kinetic Reaction of Nickel and Aluminum Nanoparticles
5a. CONTRACT NUMBER
5b. GRANT NUMBER
5c. PROGRAM ELEMENT NUMBER
6. AUTHOR(S)
Brian J. Henz, Takumi Hawa, and Michael Zachariah 5d. PROJECT NUMBER
5e. TASK NUMBER
5f. WORK UNIT NUMBER
7. PERFORMING ORGANIZATION NAME(S) AND ADDRESS(ES)
U.S. Army Research Laboratory ATTN: RDRL-CIH-C Aberdeen Proving Ground, MD 21005
8. PERFORMING ORGANIZATION REPORT NUMBER
ARL-TR-5134
9. SPONSORING/MONITORING AGENCY NAME(S) AND ADDRESS(ES)
10. SPONSOR/MONITOR'S ACRONYM(S)
11. SPONSOR/MONITOR'S REPORT NUMBER(S)
12. DISTRIBUTION/AVAILABILITY STATEMENT
Approved for public release; distribution unlimited.
13. SUPPLEMENTARY NOTES
14. ABSTRACT
Molecular dynamics simulations are used to simulate the kinetic reaction of nickel (Ni) and aluminum (Al) particles at the nanometer scale. The effect of particle size on reaction time and temperature for separate nanoparticles is considered as a model system for a powder metallurgy system. Coated nanoparticles in the form of Ni-coated Al nanoparticles and Al-coated Ni nanoparticles are also analyzed as a model for nanoparticles embedded within a matrix. The differences in melting temperature and phase change behavior, e.g., the volumetric expansion of Al between Al and Ni is expected to produce differing results for the coated nanoparticle systems. For instance, the volumetric expansion of Al upon melting is expected to produce large tensile stresses and possibly rupture in the Ni shell for Ni-coated Al. Simulation results showed that the sintering time for separate and coated nanoparticles was nearly linearly dependent upon the number of atoms or volume of the sintering nanoparticles. We also found that nanoparticle size and surface energy was an important factor in determining the adiabatic reaction temperature for both systems at nanoparticle sizes of less than 10 nm in diameter.
15. SUBJECT TERMS
Molecular dynamics, self-sustaining high temperature synthesis, nanoparticle
16. SECURITY CLASSIFICATION OF: 17. LIMITATION
OF ABSTRACT
UU
18. NUMBER OF
PAGES
36
19a. NAME OF RESPONSIBLE PERSON
Brian Henz a. REPORT
Unclassified b. ABSTRACT
Unclassified c. THIS PAGE
Unclassified 19b. TELEPHONE NUMBER (Include area code)
(410) 278-6531
Standard Form 298 (Rev. 8/98)
Prescribed by ANSI Std. Z39.18

iii
Contents
List of Figures iv
List of Tables v
Acknowledgments vi
1. Introduction 1
2. Simulation Approach 2
3. Thermodynamic Analysis of Separate Nanoparticles 2
4. The Coalescence Processes 5
5. Phenomenological Model of Nanoparticle Reactive Sintering 6
6. MD Simulation Results of Separate Nanoparticle Reactivity 12
7. Reactive Sintering of Core-Shell Nanoparticles 14
7.1 Aluminum-coated Nickel ..............................................................................................14
7.2 Nickel-coated Aluminum ..............................................................................................17
7.3 Analysis of Alloy Formation .........................................................................................19
8. Conclusions 21
9. References 23
List of Symbols, Abbreviations and Acronyms 26
Distribution List 27

iv
List of Figures
Figure 1. Illustration of sintering process showing liquid Al nanoparticle first coating the solid Ni nanoparticle and then complete alloying after the Ni nanoparticle has melted. ..........5
Figure 2. Illustration of parameters used in analytical model of reactive coalescence of Ni and Al nanoparticles. .................................................................................................................7
Figure 3. (a) Plot of exposed Ni and Al nanoparticle surface area as a function of distance between nanoparticle centers and (b) a plot of total exposed surface area as a function of distance between nanoparticle centers. These results assume a Ni nanoparticle of radius 4.53 nm and an Al nanoparticle of 5.23 nm. Notice that the total exposed surface area is monotonically decreasing, indicating that the surface energy is also decreasing monotonically ............................................................................................................................7
Figure 4. Contact or interface area as a function of center-to-center distance. The contact area is increasing as the nanoparticles move closer together (right to left on x-axis). .............9
Figure 5. Total system surface area versus time from mathematical model and MD simulations for the sintering of 10-nm-diameter nanoparticles, where the final surface area of the NiAl nanoparticle is approximately 480 nm2. ........................................................10
Figure 6. Cross-sectional view from MD simulations of Ni/Al nanoparticle sintering process showing the start of the second stage of coalescence where diffusion is the driving force as opposed to contact area maximization. Al atoms are blue and Ni atoms are red. ...............11
Figure 7. Time vs. temperature plot for sintering of separate 10-nm-diameter Al and Ni nanoparticles. The various stages if the coalescence processes are denoted on the curve, including the final completion stage that occurs after the Ni nanoparticle has melted. .........12
Figure 8. Temperature vs. time in the sintering of nanoparticles with an Ni:Al ratio of 1:1. ......13
Figure 9. Reaction time versus (a) Al nanoparticle diameter, (b) Al nanoparticle surface area, and (c) number of Al atoms. Note the nearly linear relationship (dashed line) of reaction time between number of atoms (volume) and surface area. ....................................................14
Figure 10. Temperature vs. time in the sintering of Al-coated Ni nanoparticles with an Ni:Al ratio of 1:1. ...............................................................................................................................15
Figure 11. Comparison of thermodynamically determined adiabatic temperature for Al-coated Ni nanoparticle and results from MD simulation. .......................................................16
Figure 12. Reaction time versus number of Al atoms in the Al-coated Ni nanoparticle system. .....................................................................................................................................17
Figure 13. Comparison of combustion temperature for Ni-coated Al nanoparticle versus Al-coated Ni nanoparticle. ............................................................................................................18
Figure 14. Cross sections of the Ni-coated Al nanoparticle simulation model just after melting of the Al core for the (a) 1-nm-thick and (b) 2-nm-thick Ni shells. ...........................19
Figure 15. The results here show the fraction of Ni in each alloy versus fraction of all atoms in each alloy, i.e., a data point at (0.25, 0.1) corresponds to 10% of all atoms in the system belong to Al3Ni. ..........................................................................................................20
v
Figure 16. Plot showing spatial distribution of Ni fractions during stages 1 and 2 of the sintering process. ......................................................................................................................20
Figure 17. Plot showing spatial distribution of Ni fractions during stage 3 of the sintering process......................................................................................................................................21
List of Tables
Table 1. Change in surface energy versus nanoparticle size. .........................................................4
Table 2. Computed adiabatic temperature versus nanoparticle radius, including contact of flat surfaces or infinitely sized spheres. .....................................................................................4

vi
Acknowledgments
We would like to acknowledge the support received by the Department of Defense (DoD) Supercomputing Resource Center (DSRC) at the Aberdeen Proving Ground, MD. Additional support was provided by the National Institute for Standards Technology (NIST) and the U.S. Army Research Office (ARO).

1
1. Introduction
Nanoparticles have interesting physical properties that often vary from the bulk material. Some of these properties, including increased reactivity (1), are due to the high surface area to volume ratio of nanoparticles. With that in mind, nanoparticles may provide enhanced energy release rates for explosive and propellant reactions (2).
There is considerable interest in the self-propagating high-temperature synthesis (SHS) reactions of intermetallic compounds because of the associated energy release that takes place (3) during the alloying reaction. In addition to the energetic reaction observed in these materials, it is possible to produce structural materials that contain this energy release property. Once ignited, the SHS reaction releases a large amount of energy in a short period of time. One significant difference between SHS and typical combustion processes is that the reactants and products are confined to the condensed state (4). The SHS process has many potential applications where heat generation is required and oxygen is not available or gaseous products are not desirable. These include alloy formation, net-shape processing, propellants, and use as initiators. One of the compounds formed from the SHS reaction, and studied here, is nickel aluminide (NiAl). NiAl is an important alloy because of its desirable high temperature strength and oxidation resistance (5) and the high energy of formation (6). Recently Weihs and coworkers have also used NiAl nanolaminate systems in applications of reactive welding (7).
Not surprisingly since the reaction involves solid starting materials, particle size has a significant effect on the properties of the reaction product and the SHS reaction itself (8). The simulation and analysis of nanoparticle coalescence without the SHS reaction for like materials is extensive (9–14) and involves surface passivation (10), size differences (9, 11), and phase change (9) considerations. The analysis here includes all of the previously listed concerns with an additional energy release term from the heat of formation.
The focus of this report is to use atomistic simulation to model the reactive behavior of Ni-Al nanoparticles in various configurations. Fortunately, there have been numerous efforts to determine accurate empirical potentials for simulating the Ni-Al material system (15). Prior simulations using these potentials have investigated the diffusion of Ni and Al atoms (15), point-defect concentrations in NiAl (16), and plasticity (17), in addition to many other mechanical and chemical properties. These efforts have primarily focused on bulk materials rather than nanoparticle systems (18), even though there are many manufacturing processes that produce nanometer-sized powders for SHS reactions (19). For this simulation effort we have chosen a set of embedded atom method (EAM) parameters that reproduce reasonably well the properties of Ni, Al, and NiAl in the temperature range of interest.

2
2. Simulation Approach
In this work we employ classical molecular dynamics (MD) with an EAM interatomic potential to study the SHS reaction. The EAM is used because of its accuracy and capability to scale up to material systems with over 106 atoms. The MD simulations are compared with thermodynamic analyses in order to provide validation of the simulation results and assess the expected energy release.
The MD simulation was conducted using the Large-scale Atomic/Molecular Massively Parallel Simulator (LAMMPS) software package (20). For the Ni-Al interactions, the Finnis-Sinclair EAM potential (21) from Angelo et al. (22) was used. The Finnis-Sinclair EAM potential allows for non-symmetric embedding potential terms, potentially providing improved accuracy for metallic alloys (23). In addition to the parameters for NiAl from Angelo et al., other authors have developed parameters for the Ni-Al system (16) that may be described by using the Finnis-Sinclair EAM.
The three primary nanoparticle sizes that were considered in this work from smallest to largest were nanoparticles with 1289, 5635, and 36523 atoms each, which correspond approximately to 3 , 5, and 10 nm, respectively. The range of sizes was chosen because it represents nanoparticles that may be produced in the laboratory and that offer reasonable computational time to conduct parametric studies. For the largest system studied, the 10-nm-diameter nanoparticle kinetic reaction simulation requires approximately 2 days and 64 processor cores to complete a few nanoseconds of simulated time on 3.0 GHz Intel Woodcrest processors.
3. Thermodynamic Analysis of Separate Nanoparticles
The separate nanoparticle system is used as a model for powder metallurgy systems where Ni and Al particles are compressed into a structural component. In addition to mechanical properties, the structural component will contain stored energy for future release through a SHS reaction. A thermodynamic analysis of the SHS reaction for the separate Ni and Al nanoparticle system is used here to determine the expected trends and data points for simulation validation. In the thermodynamic analysis, we are interested in determining the system parameters of the Ni-Al nanoparticle system that contribute to the combustion temperature and reaction time. Here we have assumed an adiabatic process so that energy released to the surroundings can be ignored. This is a good approximation since the reaction occurs on relatively short timescales and the nanoparticles are expected to be included in a much larger system where the overall surface to volume ratio is small, limiting convective and radiative heat loss. The validity of this assumption is explored in a later section. The SHS reaction of an equimolar Ni and Al mixture is written as

3
5.05.05.05.0 AlNiAlNi . (1)
In order to compute the adiabatic temperature for the synthesis reaction, the enthalpy of the products and reactants must be equal:
0THTH reacadprod . (2)
Assuming that the reaction begins with the reactants at 600 K, above the simulated melting temperature of the Al nanoparticles, the enthalpy of the reactants is computed as
, ,600 ,6000.5 0.5 11.85 kJmolreac Al fusion Al K Ni KH H H H . (3a)
This enthalpy result includes the enthalpy of solid Ni and liquid Al (6). The Al nanoparticle is assumed to be liquid because for small nanoparticles the melting temperature is known to be appreciably below the bulk melting temperature (24). Additionally, for the EAM potential used here (22), the aluminum is liquid for these nanoparticle sizes at 600 K. The choice of initial temperature will have a nearly linear effect on the adiabatic temperature as long as the temperature is between the melting temperature of the Al and Ni nanoparticles. This linear effect has been observed in experiments (25) and is a reasonable assumption so long as the heat capacities of the solid phases of Ni and NiAl are relatively insensitive to temperature in the ranges studied.
For the products of the SHS process, the enthalpy calculation must take into account contributions from the melting of the Ni and the NiAl nanoparticle, enthalpy of formation for the NiAl alloy, and changes in surface energy. The first of these, the enthalpies of melting for Ni and NiAl, was experimentally determined to be mol
kJ2.17 and molkJ4.31 , respectively. The enthalpy
of mixing for Ni and Al has garnered close scrutiny in the experimental community with a wide range of reported values. The enthalpy of formation that is used here was approximately in the middle of the reported values at about mol
kJ65 (6, 26, 27).
The last contribution to the enthalpy of the products results from the change in surface energy due to the reduced total surface area of the combined nanoparticle (28). The contribution to the change in system energy from the change in surface area is given as equation 4:
AlAlNiNiNiAlNiAlsurf aaaE . (4)
In equation 4, NiAla , Nia , and Ala are the surface area of the NiAl, Ni, and Al nanoparticles,
respectively. For the 3-, 5-, and 10-nm Al nanoparticles the reactant surface area is computed from the Gibbs surface (29) as 36.32, 98.17, and 343.7 nm2, respectively. For the associated Ni nanoparticles, the surface area is 27.15, 73.59, and 257.87 nm2, respectively. The surface energy is approximately 21115
mmJ for Al and 22573
mmJ for Ni at 600 K (30). The surface area of the
sintered NiAl nanoparticles is 50.77, 137.18, and 480.25 nm2 for the 3-, 5-, and 10-nm nanoparticle cases, respectively. In experimental analysis of the free surface energy of NiAl near

4
its melting point, the free surface energy has been reported as 21400m
mJ (31). The approximate
change in energy versus nanoparticle size is tabulated in table 1. In table 1, the trend is for a lower surface energy contribution to the reaction as the nanoparticle size increases. Intuitively, one may expect this because the surface area to volume ratio is also decreasing with increasing particle size, and therefore has less influence on the sintering process. With the enthalpy of formation for NiAl around mol
kJ65 , the surface energy contribution to the change in enthalpy
for coalescence of 10-nm-diameter nanoparticles is less than 10% of the total enthalpy change. This means that, even at relatively small nanoparticle sizes, e.g., 10 nm, the effect of nanoparticle size on energy release is minimal.
Table 1. Change in surface energy versus nanoparticle size.
Nanoparticle Radius (nm)
ΔEsurf (kJ/mol)
3 –18.35 5 –11.41
10 –6.17 With the preceding discussion, it is possible to take into account many of the sources of enthalpy change in the reaction products including phase and surface area changes. The enthalpy of the products is now estimated as
Nimelt
T
K
NiAlpsurfNiAlformprod HdTTCHHHad
,
298
,, . (6)
The heat capacity for solid and liquid NiAl is given in Kubaschewski et al. (21). For the 3-nm case, assuming the NiAl nanoparticle melting temperature to be about 1350 K, or the melting point of a similarly sized Ni nanoparticle, it is possible to compute the adiabatic reaction temperature (table 2). Notice in table 2 that if no surface energy contribution is considered, i.e., infinitely large spheres, the final adiabatic temperature is computed to be 1599 K. In section 6, we will observe that these results are reasonable and accurately predict the simulated increase in temperature attributable to the contribution from the surface energy.
Table 2. Computed adiabatic temperature versus nanoparticle radius, including contact of flat surfaces or infinitely sized spheres.
Nanoparticle Radius (nm)
Tad (K)
3 2115 5 1920
10 1772 ∞ 1599

5
4. The Coalescence Processes
For Ni and Al nanoparticles, the SHS reaction consists of two processes, namely, coalescence and alloying. In this work, we have considered the coalescence of a two nanoparticle system with an Al and a Ni nanoparticle with an atomic ratio of unity. A complete SHS reaction of this system will result in a single NiAl nanoparticle. The MD simulations used to work model adiabatic conditions with constant number of atoms and total system energy. The purpose of these simulations is to analyze the effect of nanoparticle size on sintering time and adiabatic combustion temperature, and to visualize the process. The assumed process is illustrated in figure 1. In figure 1, the nanoparticles are initially in contact at a point (a) and the Al nanoparticle is larger than the Ni nanoparticle because of the longer Al-Al bond length. The simulations are initialized at 600 K so that the Al nanoparticle is liquid and the Ni nanoparticle is solid. In figure 1, the sintering process proceeds with the liquid Al nanoparticle initially coating the solid Ni nanoparticle while forming some Ni-Al bonds on the surface (b-d). Next, the alloying process proceeds with the Ni nanoparticle being heated above its melting point and becoming liquid so that mixing may occur (e). The formation of Ni-Al bonds beyond the interfacial surface requires diffusion of Al into the Ni nanoparticle or Ni into the liquid Al. Either of these processes is possible but since diffusion is a relatively slow process in solid materials it is expected that the Ni nanoparticle must melt before the coalescence process proceeds appreciably.
(a) (b) (c) (d) (e)
Figure 1. Illustration of sintering process showing liquid Al nanoparticle first coating the solid Ni nanoparticle and then complete alloying after the Ni nanoparticle has melted.
The nanoparticle sintering process is driven by two sources of energy as previously discussed. The first of these is a decrease in surface area that lowers the total surface energy of the system. This energy release mechanism is also observed in the sintering of homogeneous material systems such as silicon nanoparticles (28, 32). The second source of energy is from the reactive synthesis that occurs initially at the interface between the nanoparticles and later throughout the entire system. The energy release from the surface sintering is proportional to the surface area of the Ni nanoparticle that is coated by Al and in the whole system to the total number of Ni and Al atoms. Additionally, with the temperature increase there is a decrease in the viscosity of the liquid Al that will affect the predicted coalescence time.
Ni Al Ni-Al

6
The coalescence of nanoparticles in the liquid and solid phases has been examined extensively (9–11). These studies are primarily concerned with the coalescence of two liquid or two solid nanoparticles. The analysis for the Ni-Al system requires considering the coalescence of a liquid Al nanoparticle and a solid Ni nanoparticle. Lewis et al. (9) considered the coalescence of a liquid and a solid gold nanoparticle; this is similar to the situation here except that the material system considered was homogeneous.
In Lewis et al. (9), the author was able to simulate two phases occurring simultaneously for a single material by choosing the size of each nanoparticle such that at a specific temperature the phase of the nanoparticles was different. Lewis found that coalescence proceeded in two stages: first, the contact area was maximized; and second, “sphericization” took place driven by surface diffusion. The first stage is much faster than the second and is very similar to the process observed here, where the Al nanoparticle maximizes the contact area and partially coats the Ni nanoparticle. In this case, there is an added driving force other than the surface energy, specifically the energy release on forming of Ni-Al bonds as compared to the Al-Al and Ni-Ni bonds. During the second stage, the atoms in the two nanoparticles diffuse and rearrange until the system becomes a single spherical nanoparticle. This stage is driven strongly by the formation of Ni-Al bonds and is expected to occur on a much shorter timescale than for two nanoparticles of the same material. The analytical model and MD simulation results shown in sections 5 and 6 explore this assumption.
5. Phenomenological Model of Nanoparticle Reactive Sintering
To gain further insight, we have developed a phenomenological model for the reactive sintering of Ni and Al nanoparticles. The model includes energy release from surface energy, bond formation, and viscous dissipation through deformation. Frenkel (33) has developed a model for the coalescence of two homogeneous nanoparticles; however, his model did not account for any phase change, kinetic sintering, or heterogeneous materials. Here we extended Frenkel’s model to consider the coalescence of two liquid drops to take into account the coalescence of a liquid and a solid drop with reactive synthesis.
The analytical model is initialized with the Al and Ni nanoparticles in contact at a point. The distance from nanoparticle center to center is equal to the sum of the respective radii, denoted as D in figure 2. The sintering process initially proceeds by the liquid Al nanoparticle coating the solid Ni nanoparticle, as illustrated in figure 1. During this phase of the sintering process, two sources of energy release are occurring; the first of these is related to the decrease in surface area and is proportional to the respective surface tension values. The second source of energy release is from the formation of Ni-Al bonds at the interfacial region. Figure 3 is an illustration of the parameters used to model the coalescence time.

7
rNi
rAl
D
Al
vvAl
Ni
2a
θ Ni
Figure 2. Illustration of parameters used in analytical model of reactive coalescence of Ni and Al nanoparticles.
(a) Center to Center Distance (nm)
Exp
osed
Sur
face
Are
a(n
m2)
0 2 4 6 8 100
100
200
300
400
500 NickelAluminum
(b) Center to Center Distance (nm)
Exp
osed
Sur
face
Are
a(n
m2 )
0 2 4 6 8 10450
500
550
600
650
Figure 3. (a) Plot of exposed Ni and Al nanoparticle surface area as a function of distance between nanoparticle centers and (b) a plot of total exposed surface area as a function of distance between nanoparticle centers. These results assume a Ni nanoparticle of radius 4.53 nm and an Al nanoparticle of 5.23 nm. Notice that the total exposed surface area is monotonically decreasing, indicating that the surface energy is also decreasing monotonically
In figure 2, 2a is the diameter of a circle circumscribed by the contact circumference of the two nanoparticles. vAl and vNi are the distance from the Al and Ni nanoparticle surface to the surface of the contact circle, respectively. θ is the contact angle as measured from the center of the Ni nanoparticle and ranges from 0 to π radians. In order to model the change in energy of the coalescing nanoparticle system, three energy change mechanisms must be considered. These mechanisms are energy release due to change in surface area, energy release due to kinetic reactions at the interface, and energy loss due to viscous dissipation. The rate of energy change due to all three must balance at all times.
The first energy term considered, namely, the surface energy of the nanoparticle system, is simply the surface tension times the total exposed surface area. This energy term is written as a sum of the Al and Ni nanoparticle contributions:
8
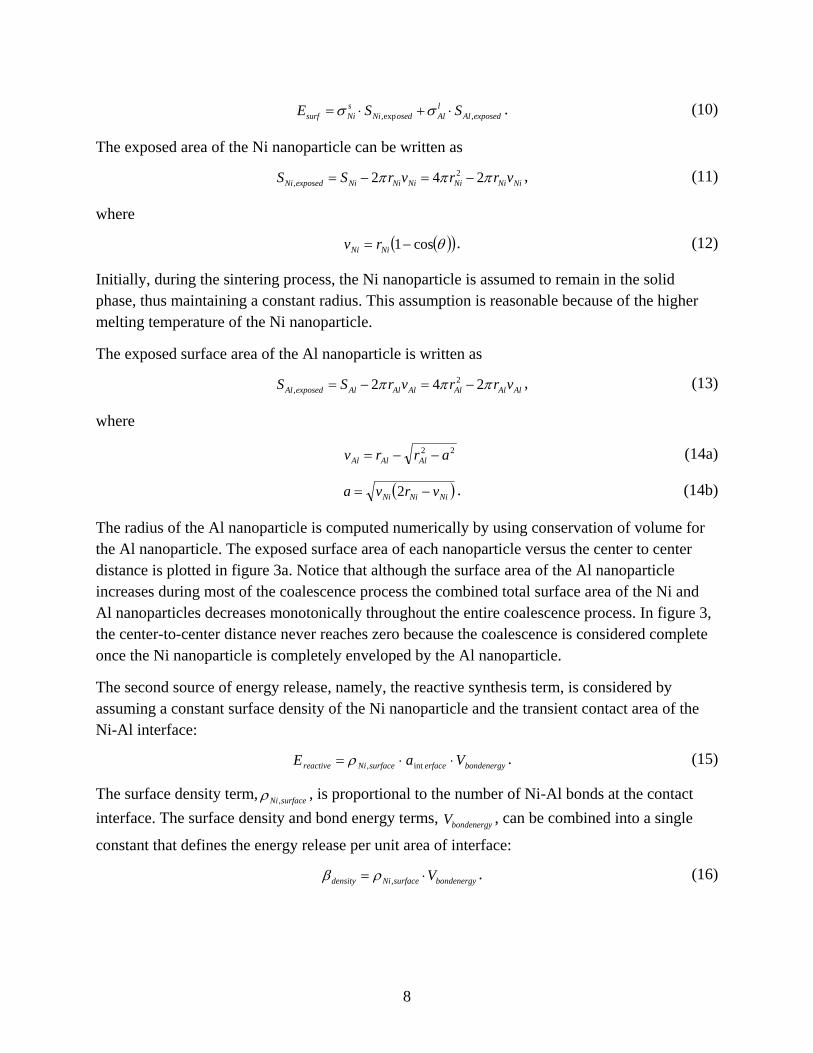
,exp ,s l
surf Ni Ni osed Al Al exposedE S S . (10)
The exposed area of the Ni nanoparticle can be written as
2, 2 4 2Ni exposed Ni Ni Ni Ni Ni NiS S r v r r v , (11)
where
cos1 NiNi rv . (12)
Initially, during the sintering process, the Ni nanoparticle is assumed to remain in the solid phase, thus maintaining a constant radius. This assumption is reasonable because of the higher melting temperature of the Ni nanoparticle.
The exposed surface area of the Al nanoparticle is written as
2, 2 4 2Al exposed Al Al Al Al Al AlS S r v r r v , (13)
where
22 arrv AlAlAl (14a)
NiNiNi vrva 2 . (14b)
The radius of the Al nanoparticle is computed numerically by using conservation of volume for the Al nanoparticle. The exposed surface area of each nanoparticle versus the center to center distance is plotted in figure 3a. Notice that although the surface area of the Al nanoparticle increases during most of the coalescence process the combined total surface area of the Ni and Al nanoparticles decreases monotonically throughout the entire coalescence process. In figure 3, the center-to-center distance never reaches zero because the coalescence is considered complete once the Ni nanoparticle is completely enveloped by the Al nanoparticle.
The second source of energy release, namely, the reactive synthesis term, is considered by assuming a constant surface density of the Ni nanoparticle and the transient contact area of the Ni-Al interface:
bondenergyerfacesurfaceNireactive VaE int, . (15)
The surface density term, surfaceNi, , is proportional to the number of Ni-Al bonds at the contact
interface. The surface density and bond energy terms, bondenergyV , can be combined into a single
constant that defines the energy release per unit area of interface:
bondenergysurfaceNidensity V , . (16)

9
The interfacial contact area is a function of the distance between nanoparticle centers (figure 4). The interfacial area increases monotonically until the Ni nanoparticle surface is completely covered. This result is expected since the reactive energy term is negative, or releases energy during the entire process, in addition to the minimization of surface energy that is driven by the surface tension of Ni and Al. The interfacial area is written as
NiNierface rva 2int , (17)
where Niv is a function of as given in equation 12.
Center to Center Distance (nm)
Co
ntac
tAre
a(n
m2)
0 2 4 6 8 100
50
100
150
200
250
300
Figure 4. Contact or interface area as a function of center-to-center distance. The contact area is increasing as the nanoparticles move closer together (right to left on x-axis).
The third energy term represents the viscous dissipation due to deformation of the Al nanoparticle. This viscous dissipation is a function of the viscosity in the liquid Al nanoparticle and the rate of deformation. The extent of the viscous flow can be specified by the decrease in distance between the center of each drop, and the surface of contact with the Ni nanoparticle. A velocity gradient, , can be defined as Aldt
d rD / . The energy dissipated in the whole body per unit
time is, therefore, approximately
2
30,3
8
0
220,
42
dt
dDrdrr
dt
dEAl
r
viscousAl
, (18)
where is the viscosity of liquid Al and 0,Alr is the initial radius of the Al nanoparticle.
By conservation of energy, the rate of coalescence can now be computed:

10
dt
dE
dt
dE
dt
dE reactivesurfviscous (19a)
NiNiosedAllAlosedNi
sNiAl rv
dt
dSS
dt
d
dt
dDr 2exp,exp,
23
0,38
(19b)
After writing equation 19b in terms of d/dt and simplifying the right and left hand sides, we find that equation 19b is only linearly dependent on d/dt. Even with this simplification, equation 19 is most easily solved numerically using an iterative solver. In order to solve equation 19b, we need some physical properties of Al, Ni, and NiAl. The dynamic viscosity of bulk molten Al at the melting temperature is about sPa 3103.1 (34). Based upon a comparison of
the configurational energy in MD simulations of separate nanoparticles and Al-coated Ni nanoparticles, the energy release per unit area, density , is estimated to be 27.20
nmeV . This number
is computed by subtracting the system energy of an Al-coated Ni nanoparticle system from the energy of a system with separate nanoparticles and dividing by the interfacial surface area. This method results in the net change in energy during coating of the Ni surface with Al since some Al-Al bonds are lost during the coating process while some Ni-Al bonds are formed at the interface. By numerically solving equation 19b, we are able to compute the contact angle, , as a function of time and relate this to total exposed surface area of the coalescing nanoparticles. This result is presented in figure 5 along with a comparison to the MD simulation results.
Time (ps)
Su
rfac
eA
rea
(nm
2)
0 20 40 60 80480
500
520
540
560
580
600
620
Surf. Area, MDSurf. Area, Model
Figure 5. Total system surface area versus time from mathematical model and MD simulations for the sintering of 10-nm-diameter nanoparticles, where the final surface area of the NiAl nanoparticle is approximately 480 nm2.

11
Although qualitatively the results in figure 5 show similar trends, the absolute rate of coalescence is slightly under predicted by the model. This difference can be attributed to the obvious simplicity of the model and more specifically to the difficulty in obtaining accurate material parameters. For instance, it is difficult to compare the viscosity of a nanoparticle to the bulk material (12), and since the coalescence time is linearly dependent upon the viscosity a change in viscosity is directly proportional to a change in modeled coalescence time. Additionally, the energy release per unit area term assumes that the net change in energy due to the addition of Ni-Al bonds at the interface is a constant value. This is likely not completely accurate since fewer Al bonds must be broken to form new Ni-Al bonds during the initial contact of the nanoparticles. However, the deviation in this energy release term is likely to be minimal. The deviation of the model time from the simulation results at about 50 ps is due to the switch from stage 1 to stage 2 in the kinetic coalescence process as described by Lewis et al. (9). As described by Lewis, during stage 2, surface diffusion is the predominant factor in continued coalescence and is a much slower process than contact area maximization. The actual simulation results, as compared with the illustration in figure 1, of the observed coalescence process are given in figure 6.
Initial Stage 1 Stage 2 Completed Fast (50 ps) Slow (450 ps) Slow (400+ ps)
Figure 6. Cross-sectional view from MD simulations of Ni/Al nanoparticle sintering process showing the start of the second stage of coalescence where diffusion is the driving force as opposed to contact area maximization. Al atoms are blue and Ni atoms are red.
In figure 6, each of the steps in the coalescence process is shown with plots from an MD simulation of the coalescence of 10-nm-diameter Al and Ni nanoparticles. The correlation of the sintering stages to the reaction temperature and time is illustrated in figure 7 for the sintering of separate 10-nm-diameter nanoparticles. In the initial step, the liquid Al nanoparticle (the blue atoms in figure 6) has melted and is spherical in shape. The solid Ni nanoparticle (the red atoms) has large faceted sides and is a single crystal, a typical configuration for a crystalline nanoparticle at low temperatures. During stage 1, the Al nanoparticle is attracted to the Ni surface because of the dual driving forces of surface energy minimization and Ni-Al bond formation. This period lasts about 50 ps in this simulation as noted in figures 6 and 7. Between stages 1 and 2, the driving forces associated with the surface energy are counteracted by a resistance to flow in the Al nanoparticle, causing the coalescence process to slow down dramatically. During stage 2, lasting about 450 ps, the surface area is not changing so that energy

12
release from the surface energy terms has ceased to contribute to the change in system potential energy. The subsequent energy release is entirely attributable to the formation of Ni-Al bonds. This stage lasts a much longer time than the initial nanoparticle coalescence stage and is governed by the material diffusion coefficients. Initially, at stage 2, the Ni nanoparticle is still solid and the formation of Ni-Al bonds is only possible by Al diffusing into the Ni core or Ni on the surface of the core melting and diffusing away from the interface. This process proceeds until the Ni core has reached its melting point and mixing of the remaining Ni and Al atoms occurs more rapidly, driven by the enthalpy of formation of NiAl. From stage 2 until complete alloying has occurred, taking approximately 400 ps, diffusion and mixing of Ni and Al atoms is the primary driving force.
Time (ps)
Tem
pera
ture
(K)
0 200 400 600 800 1000400
600
800
1000
1200
1400
1600
1800
Stage 1 (0-50ps)
Stage 2 (50ps-500ps)
Completion (500ps+)
Figure 7. Time vs. temperature plot for sintering of separate 10-nm-diameter Al and Ni nanoparticles. The various stages if the coalescence processes are denoted on the curve, including the final completion stage that occurs after the Ni nanoparticle has melted.
6. MD Simulation Results of Separate Nanoparticle Reactivity
We have previously predicted the adiabatic temperature and sintering time for the reactive sintering process of separate equimolar nanoparticles of Al and Ni. In figure 8, the MD simulation results for the equimolar nanoparticles are plotted along with the computed adiabatic temperature for each considered particle size.

13
Time (ps)
Tem
pera
ture
(K)
0 500 1000 1500400
600
800
1000
1200
1400
1600
1800
2000
2200
2400
Al1289, Ni1289
Al5635, Ni5635
Al36523, Ni36523
Predicted Tad
Figure 8. Temperature vs. time in the sintering of nanoparticles with an Ni:Al ratio of 1:1.
Note: The subscripts in the legend refer to the number of atoms of each material and correspond to nanoparticles of diameter approximately 3, 5, and 10 nm. The color-coded dashed lines are the computed adiabatic temperature from the thermodynamic analysis. The black dashed line is the predicted temperature for coalescence of bulk Al and Ni.
From figure 8, it is apparent that the predicted adiabatic temperature is in close agreement with the simulated temperature. Variability of the computed temperature arises from the wide range of experimental results for the surface tension for liquid Al and solid Ni, the reported enthalpy of formation for NiAl, and the assumed melting temperature for the Ni and NiAl materials at this scale. Each of these experimental data points is used in the thermodynamic analysis and contributes to the small inaccuracies in the predicted temperature.
The characteristic time for reactive synthesis that we use here is defined by Zhao et al. (35) as t when
010 8.0 TTTtT , (20)
where 0T is the initial temperature, 1T is the maximum size dependent temperature reached, and
tT is the transient temperature. The computed reaction times are given in figure 9 and illustrate
that the time required for separate nanoparticles to react has a power law relationship between nanoparticle volume (3) and surface area (2). This implies that not only will the reaction temperature be higher, but it will occur more rapidly with decreases in particle size, to a power of about 2.5. This is important because a high rate of energy release is desirable for many applications.

14
(a) Particle Diameter (nm)
Rea
ctio
nT
ime
(ps)
2 3 4 5 6 7 8 9 10 110
100
200
300
400
500
600
700
Al Particle Size
(b) Surface Area (nm2)
Rea
ctio
nT
ime
(ps)
0 100 200 300 4000
100
200
300
400
500
600
700
Al Particle SA
(c) No. Al Atoms
Rea
ctio
nT
ime
(ps)
0 10000 20000 30000 400000
100
200
300
400
500
600
700
No. Al Atoms
Figure 9. Reaction time versus (a) Al nanoparticle diameter, (b) Al nanoparticle surface area, and (c) number of Al atoms. Note the nearly linear relationship (dashed line) of reaction time between number of atoms (volume) and surface area.
By observing the MD simulations and analyzing the shape of the curves in figure 8 for temperature versus time, we have surmised that there are two reaction rates to consider. The first is during the coalescence process (called the growth rate [see 0 to 500 ps for Al36523 curve in figure 8]) and Ni nanoparticle melting, and the second is the rapid formation of the NiAl alloy from liquid Al and Ni (convergence rate [see 500 ps and later for the Al36523 curve in figure 8]). The temperature at which the transition occurs is size dependent because the melting temperature of the Ni nanoparticle is also size dependent. If the process is not perfectly adiabatic, and some heat is lost to the surroundings, it is also possible that the first process would not proceed far enough for the Ni nanoparticle to melt, and thus the reaction would halt. This would only occur with larger nanoparticles that require longer reaction times during which some energy loss to the surroundings is likely. This is an important consideration in real-world applications that are not perfectly adiabatic, but when complete alloying is desired. One reason for this observed increase in reaction rate is because the heat generated from the formation of Ni-Al bonds will conduct into the core nanoparticle so that when the reaction front reaches the inner atoms they will have a higher diffusion coefficient, which in turn increases the reaction rate.
7. Reactive Sintering of Core-Shell Nanoparticles
7.1 Aluminum-coated Nickel
In this section, we discuss the sintering process for an Al-coated Ni nanoparticle followed by a discussion of a Ni-coated Al nanoparticle. Both of these systems can be used as a model for highly compacted Ni and Al nanoparticles or one material serving as a matrix for nanoparticles of the other. In the first model system, we assume that a Ni nanoparticle has been coated with Al and equilibrated without the Ni melting or any further reaction occurring. Results for the reaction time and temperature are presented and a comparison with the separate nanoparticle case is given. Here again, we have considered three system sizes with 1289, 5635, and 36523 atoms each of Al and Ni.

15
An initial estimate is that the coalescence process for the fully coated nanoparticle system will be a truncated version of the separate nanoparticle case. In the coated nanoparticle system, we do not have the first stage of coalescence occurring and only observe the second stage, namely, diffusion of Ni and Al atoms to form Ni-Al bonds. The sintering temperature versus time plot is given in figure 10 and shows an interesting result. Whereas the maximum temperature reached increases with decreasing nanoparticle size for coalescence of separate nanoparticles, the opposite is true here: the temperature decreases with decreasing nanoparticle size.
Time (ps)
Tem
pera
ture
(K)
0 500 1000 1500 2000500
600
700
800
900
1000
1100
1200
1300
1400
1500
1600
Al1289, Ni1289
Al5635, Ni5635
Al36523, Ni36523
Figure 10. Temperature vs. time in the sintering of Al-coated Ni nanoparticles with an Ni:Al ratio of 1:1.
In figure 10, the observed decrease in adiabatic temperature is due to the fact that the ratio of atoms near the interfacial region to the atoms in the bulk nanoparticle decreases as the nanoparticle size increases. Atoms in the interfacial region have already formed Ni-Al bonds and are, therefore, already at a lower configurational energy than if they were contained in a homogeneous nanoparticle of either pure Al or Ni. If we extend the adiabatic temperature relationship to infinitely large particles, we would approach the result obtained from the analysis of separate nanoparticle as they increase in size. The thermodynamic analysis is similar except that the surface energy term is zero and the enthalpy of formation is lowered by a factor proportional to the ratio of surface area to volume. The enthalpy of the products, equation 6, modified for coated nanoparticles becomes
Nimelt
T
K
NiAlpNiAlformsurface
prod HdTTCHV
AtH
ad
,
298
,,1
, (21)
where t is a computed thickness value for the interfacial layer, surfaceA is the area of the interfacial
region, and V is the volume of the Ni core. In order to determine the correct empirical thickness value, t , for equation 21 we have used the adiabatic temperature computed in the MD simulation
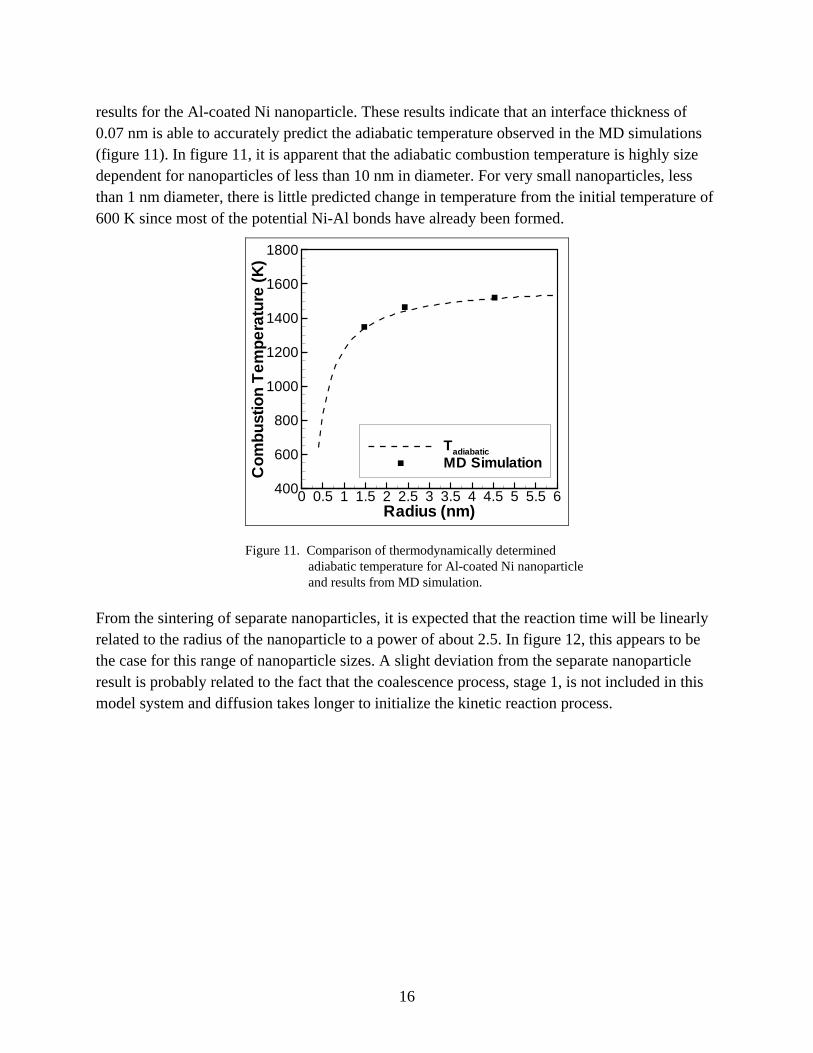
16
results for the Al-coated Ni nanoparticle. These results indicate that an interface thickness of 0.07 nm is able to accurately predict the adiabatic temperature observed in the MD simulations (figure 11). In figure 11, it is apparent that the adiabatic combustion temperature is highly size dependent for nanoparticles of less than 10 nm in diameter. For very small nanoparticles, less than 1 nm diameter, there is little predicted change in temperature from the initial temperature of 600 K since most of the potential Ni-Al bonds have already been formed.
Radius (nm)
Co
mbu
stio
nT
emp
erat
ure
(K)
0 0.5 1 1.5 2 2.5 3 3.5 4 4.5 5 5.5 6400
600
800
1000
1200
1400
1600
1800
Tadiabatic
MD Simulation
Figure 11. Comparison of thermodynamically determined adiabatic temperature for Al-coated Ni nanoparticle and results from MD simulation.
From the sintering of separate nanoparticles, it is expected that the reaction time will be linearly related to the radius of the nanoparticle to a power of about 2.5. In figure 12, this appears to be the case for this range of nanoparticle sizes. A slight deviation from the separate nanoparticle result is probably related to the fact that the coalescence process, stage 1, is not included in this model system and diffusion takes longer to initialize the kinetic reaction process.

17
Radius (nm)
Rea
ctio
nT
ime
(ps)
1 2 3 4 5 60
200
400
600
800
1000
1200
Figure 12. Reaction time versus number of Al atoms in the Al-coated Ni nanoparticle system.
The results for the Al-coated Ni nanoparticle indicate the trends that one might expect from a material system that included an Al matrix with embedded Ni nanoparticles. From the results in figures 11 and 12, there are two competing reaction results, namely, reaction time and maximum temperature. In figure 12, we see that as the Ni nanoparticle size decreases the reaction time decreases, causing the energy release rate to increase. A second observation that can be made from figure 11 is that the reaction temperature decreases with decreasing Ni nanoparticle size, potentially minimizing the effect of the rapid energy release.
Looking more closely at the reaction time versus number of atoms for the separate nanoparticle and Al-coated Ni nanoparticle cases, we observe a similar relationship of reaction time to nanoparticle size as that found in separate nanoparticles. In both cases, the reaction time appears to have a power law relationship with radius, with an exponent of 2.5. The accelerated temperature increase in figure 10 after about 900 ps for the Al36523 curve is the convergence rate discussed previously.
7.2 Nickel-coated Aluminum
The Ni-coated Al nanoparticle system has garnered some interest because when Al melts there is an experimentally observed increase in volume of about 6.5%. This increase in volume creates a large stress in the Ni coating and may result in catastrophic failure and fragmentation of the nanoparticle (18). In the work by Delogu (18), the fragmentation is only observed for a specific set of conditions including Ni shell thickness. In this work, even with the appropriate Ni shell thickness, fragmentation of the nanoparticle is not observed. With the empirical potentials and parameters considered here, the kinetic alloying reaction is fast and results in a liquid NiAl nanoparticle without fragmentation.

18
In the first set of analyses, the Ni shell contains the same number of atoms as the Al core. This results in an Al core with a radius of 2.8 nm and a Ni shell of about 0.7 nm. Since the bond length of Ni is less than Al, the shell is thinner and the contact area is initially greater than observed in similarly sized Al-coated Ni nanoparticles. As with the nanoparticle coalescence simulations, the temperature of the system is raised to 600 K, at which time a constant energy simulation is used to analyze the energy conversion rate and the adiabatic temperature rise of the system.
In the initial simulations with an atomic ratio of unity, there are more Ni-Al bonds in the Ni-coated nanoparticle than the Al-coated nanoparticle. It may, therefore, be expected that the total system energy would initially be lower in the Ni-coated Al nanoparticle system than the Al-coated Ni system. In fact, the opposite is true, because although there are more Ni-Al bonds in the Ni-coated system there are fewer Ni-Ni bonds than in the Al-coated nanoparticle. Since Ni-Ni bonds are stronger than Al-Al bonds, the total initial energy is lower in the Al-coated Ni nanoparticle system. Since the final configuration of both systems is a completely alloyed NiAl nanoparticle, the system energy change for the Ni-coated nanoparticle is greater than the Al-coated system. This greater change in potential energy results in the computed adiabatic temperature for the Ni-coated Al nanoparticle being higher than the Al-coated nanoparticle (figure 13), although the difference is not large.
Time (ps)
Tem
pera
ture
(K)
0 100 200 300 400 500500
600
700
800
900
1000
1100
1200
1300
1400
1500
1600
Al5635, Ni5635, Ni-Coated AlAl5635, Ni5635, Al-Coated Ni
Figure 13. Comparison of combustion temperature for Ni-coated Al nanoparticle versus Al-coated Ni nanoparticle.
In the two following simulations, we simulated an approximately 5-nm-diameter Al nanoparticle coated with either a 1- or 2-nm-thick Ni coating. For these simulations the temperature was controlled using an NVT ensemble. This temperature control was used in order to rapidly increase the temperature from about 300 K to above the melting point of the Al nanoparticle at a

19
rate of 0.1 K/ps. When the Al nanoparticle melts and expands, a large sudden increase of stress in the Ni coating is observed. For the 2-nm-thick Ni coating, the increase in stress is not high enough to cause failure of the coating. In this case, the outer shell expands slightly but does not crack. For the 1-nm-thick case, the stress in the Ni shell is high enough to cause failure. When the shell fails, the Al begins to leak out onto the surface of the nanoparticle but no fragmentation is observed. If the nanoparticle were surrounded by oxygen, this may initiate the Al oxidation reaction, releasing additional energy as Al oxides are formed.
The cracking and leaking of Al onto the surface of the Ni shell (figure 14) is very different from what Delogu (18) observed using a semi-empirical tight-binding (TB) potential. Another difference from the work by Delogu is the choice of Al core radius. For both of the shell cases here, the core has a radius of 2.8 nm, this is in contrast to the core radius of 3.0 and 2.0 nm for the 1.0- and 2.0-nm shell cases, respectively, used by Delogu (18). Since the 1-nm shell case is the most interesting and the radii are very close (2.8 vs. 3.0 nm), the choice of core size is not expected to have had an appreciable effect on the results for this case.
(a) (b)
Figure 14. Cross sections of the Ni-coated Al nanoparticle simulation model just after melting of the Al core for the (a) 1-nm-thick and (b) 2-nm-thick Ni shells.
7.3 Analysis of Alloy Formation
During the sintering of Ni and Al nanoparticles, numerous local atomic ratios may be identified from the Ni-Al binary system (32–34). The data presented here are computed from the simulation results by calculating the local atomic ratios. These ratios are computed in order to analyze the spatial and temporal distribution of alloys in the simulation. The most commonly observed alloys for the Ni-Al binary system include Al9Ni2, Al3Ni, Al3Ni2, NiAl, Ni5Al3, and Ni3Al (33) corresponding to Ni fractions of 0.18, 0.25, 0.40, 0.50, 0.625, and 0.75, respectively. A comprehensive analysis of the measured atomic ratios in solution during sintering of separate nanoparticles is summarized here. Figures 15a and 15b show the normalized amount of computed solution ratios by Ni fraction through stage 2 and during stage 3, respectively.

20
(a) (b)
Figure 15. The results here show the fraction of Ni in each alloy at stages (a) 1 and (b) 2 versus fraction of all atoms in each alloy, i.e., a data point at (0.25, 0.1) corresponds to 10% of all atoms in the system belong to Al3Ni.
During stage 1, from 0 to 50 ps for sintering of 10-nm-diameter particles, most of the atoms remain in the pure metal phase, with only a small fraction of atoms, less than 5%, forming Ni rich solutions such as Ni3Al. In figure 6a, at 50 ps, an observed peak at 0.75 fraction Ni (Ni3Al) is likely due to the shorter bond length of Ni-Ni, such that near the contact interface each Al atom will bond with multiple Ni atoms. During stage 2, the formation of Al rich liquid solutions occurs at a rapid rate, quickly depleting the atomic fraction of pure Al in the system by the end of stage 2 (500 ps). In figure 16a, at 500 ps, a small peak between 0.2 and 0.3 fraction Ni is observed, corresponding to Al3Ni. At the end of stage 2, the largest portion of any material is still pure Ni (figure 16b). The initial formation of Al rich solutions is supported by experimental observations (32, 34). The reaction process that produces these alloys is likely explained by Ni atoms diffusing into the liquid Al region forming Al rich clusters of Al3Ni. These clusters then diffuse through the Al melt, eventually forming the eutectic mixture. Figure 16b supports this process, because small clusters of Al rich alloys are clearly evident in the liquid Al, with some initial coalescence of clusters to obtain the eutectic atomic ratio.
(a) 50 ps
(b) 500 ps
Figure 16. Plot showing spatial distribution of Ni fractions during stages (a) 1 and (b) 2 of the sintering process.

21
The lines in figure 17b for stage 3 indicate a rapid reduction in the amount of pure Ni and the corresponding formation of NiAl. During stages 1 and 2, as observed in figure 3, the temperature of the system is rising monotonically. Near the start of stage 3, the system temperature has reached the melting point of Ni. At 700 ps, shortly after the Ni nanoparticle has completely melted, two peaks are present in figure 17a near 40% Ni and 50% Ni, corresponding to Al3Ni2 and NiAl. In figure 17a, shortly after melting of the Ni nanoparticle, there is a Ni rich region visible. This region quickly disappears as the SHS reaction proceeds rapidly to form the eutectic alloy. After nearly complete sintering at 950 ps, the majority of atoms are in a NiAl liquid solution with some temporal formation of other alloys. This brief analysis has demonstrated that the various solution ratios are an interesting problem that warrants closer thermodynamic analysis.
(a) 700 ps
(b) 950 ps
Figure 17. Plot showing spatial distribution of Ni fractions at the (a) beginning and (b) end of stage 3 of the sintering process.
8. Conclusions
We have analyzed two model systems for the energetic reaction of Ni and Al. In the first case, we considered the coalescing and sintering of separate nanoparticles and found that the energy release from the change in surface area was only significant for small, less that 10-nm-diameter, nanoparticles. These separated nanoparticle reaction simulations and thermodynamic analyses showed that the reaction time decreased and the adiabatic reaction temperature increased with decreasing nanoparticle sizes. This may be important for applications where high energy release rates are desired. The simulation data closely matched a classical thermodynamic analysis.
In the second part of this work, we considered the sintering of Al-coated Ni nanoparticles and Ni-coated Al nanoparticles as a model material system for nanoparticles embedded in a matrix of the other metal. This work revealed that the reaction time was again inversely related to nanoparticle size, but the adiabatic temperature decreased with decreasing nanoparticle size.

22
Mechanically, the Al-coated Ni nanoparticle system was a model system for a lightweight Al matrix with embedded Ni nanoparticles, a system with relatively high strength compared to a loosely bonded powder of Al and Ni nanoparticles. This Al matrix system could be used in systems where mechanical strength is important in addition to energy release from kinetic sintering of the Ni and Al atoms. In the Ni-coated Al nanoparticle system, we investigated possible rupture and fragmentation of the Ni shell but were unable to observe any fragmentation.

23
9. References
1. Phung, X.; Groza, J.; Stach, E. A.; Williams, L. N.; Ritchey, S. B. Surface Characterization of Metal Nanoparticles. Materials Science and Engineering A 2003, 359, 261–268.
2. Rai, A.; Lee, D.; Park, K.; Zachariah, M. R. Importance of Phase Change of Aluminum in Oxidation of Aluminum Nanoparticles. J. of Physical Chemistry B 2004, 108, 14793–14795.
3. Li, H. P. Influence of Ignition Parameters on Micropyretic Synthesis of NiAl Compound. Materials Science & Engineering A 2005, 404, 146–152.
4. Gennari, S.; Tamburini, U. A.; Maglia, F.; Spinolo, G.; Munir, Z. A. A New Approach to the Modeling of SHS Reactions: Combustion Synthesis of Transition Metal Aluminides. Acta Materialia 2006, 54, 2343–2351.
5. Nash, P.; Kleppa, O. Composition Dependence of the Enthalpies of Formation of NiAl. J. of Alloys and Compounds 2001, 321, 228–231.
6. Hu, R.; Nash, P. The Enthalpy of Formation of NiAl. Journal of Materials Science 2005, 40, 1067–1069.
7. Trenkle, J. C.; Weihs, T. P.; Hufnagel, T. C. Fracture Toughness of Bulk Metallic Glass Welds Made using Nanostructured Reactive Multilayer Foils. Scripta Materialia 2008, 58, 315–318.
8. Dong, S.; Hou, P.; Cheng, H.; Yang, H.; Zou, G. Fabrication of Intermetallic NiAl by Self-propagating High-temperature Synthesis Reaction using aluminum nanopowder under high pressure. J. of Physics: Condensed Matter 2002, 14, 11023–11030.
9. Lewis, L. J.; Jensen, P.; Barrat, J.-L. Melting, Freezing, and Coalescence of Gold Nanoparticles. Physical Review B 1997, 56 (4), 2248–2257.
10. Hawa, T.; Zachariah, M. R. Coalescence Kinetics of Bare and Hydrogen-coated Silicon Nanoparticles: A Molecular Dynamics Study. Physical Review B 2005, 71, 165434.
11. Hawa, T.; Zachariah, M. R. Coalescence Kinetics of Unequal Sized Nanoparticles. Aerosol Science 2006, 37, 1–15.
12. Zachariah, M. R.; Carrier, M. J. Molecular Dynamics Computation of Gas-Phase Nanoparticle Sintering: A Comparison with Phenomenological Models. J. of Aerosol Science 1999, 30 (9), 1139–1151.
13. Ehrman, S. H. Effect of Particle Size on Rate of Coalescence of Silica Nanoparticles. Journal of Colloid and Interface Science 1999, 213, 258–261.

24
14. Arcidiacono, S.; Bieri, N. R.; Poulikakos, D.; Grigoropoulos, C. P. On the Coalescence of Gold Nanoparticles. International J. of Multiphase Flow 2004, 30, 979–994.
15. Yu, S.; Wang, C.-Y.; Yu, T.; Cai, J. Self-diffusion in the Intermetallic Compounds NiAl and Ni3Al: An Embedded Atom Method Study. Physica B 2007, 396, 138–144.
16. Mishin, Y.; Mehl, M. J.; Papaconstantopoulos, D. A. Embedded-atom Potential for B2-NiAl. Physical Review B 2002, 65, 224114.
17. Mei, J.; Cooper, B. R.; Lim, S. P. Many-body Atomistic Model Potential for Intermetallic Compounds and Alloys and its Application to NiAl. Physical Review B 1996, 54 (1), 178–183.
18. Delogu, F. Numerical simulation of the thermal response of Al core/Ni Shell Nanometer-sized Particles. Nanotechnology 2007, 18, 505702.
19. Zhu, H. X.; Abbaschian, R. Reactive Processing of Nickel-aluminide Intermetallic Compounds. J. of Materials Science 2003, 38, 3861–3870.
20. Plimpton, S. J. Fast Parallel Algorithms for Short-Range Molecular Dynamics. Journal of Computational Physics 1995, 117, 1–19.
21. Finnis, M. W.; Sinclair, J. E. A Simple Empirical N-body Potential for Transition Metals. Philosophical Magazine A 1984, 50, 45–55.
22. Angelo, J. E.; Moody, N. R.; Baskes, M. I. Trapping of Hydrogen to Lattice Defects in Nickel. Modelling Simul. Mater. Sci. Eng. 1995, 3, 289–307.
23. Ackland, G. J.; Vitek, V. Many-body Potentials and Atomic-scale Relaxations in Noble-metal Alloys. Physical Review B 1990, 41 (15), 10324–10333.
24. Pawlow, P. Z Phys. Chem. 1909, 65, 545.
25. Zhu, P.; Li, J.C.M.; Liu, C. T. Adiabatic Temperature of Combustion Synthesis of Al-Ni Systems. Materials Science and Engineering A 2003, 357, 248–257.
26. Arroyave, R.; Shin, D.; Liu, Z.-K. Ab Initio Thermodynamic Properties of Stoichiometric Phases in the Ni–Al System. Acta Materialia 2005, 53, 1809–1819.
27. Chrifi-Alaoui, F. Z.; Nassik, M.; Mahdouk, K.; Gachon, J. C. Enthalpies of Formation of the Ni–Al Intermetallic Compounds. J. of Alloys and Compounds 2004, 364, 121–126.
28. Zachariah, M. R.; Carrier, M. J.; Blasiten-Barojas, E. J. Phys. Chem. 1996, 100, 14856.
29. Allen, M. P.; Tildesley, D. J. Computer Simulation of Liquids; New York: Oxford, 1996.

25
30. Nizhenko, V. I. Free Surface Energy as a Criterion for the Sequence of Intermetallic Layer Formation in Reaction Couples. Powder Metallurgy and Metal Ceramics 2004, 43 (5–6), 273–279.
31. Lozovoi, A. Y.; Alavi, A.; Finnis, M. W. Surface Stoichiometry and the Initial Oxidation of NiAl(110). Physical Review Letters 2000, 85 (3), 610–613.
32. Mukherjee, D.; Sonwane, C. G.; Zachariah, M. R. Kinetic Monte-Carlo Simulation of the Effect of Coalescence Energy Release on the Size and Shape Evolution of Nanoparticles Grown as an Aerosol. J. of Chemical Physics 2003, 119, 3391.
33. Frenkel, J. J. Phys. 1945, 9, 385.
34. Assael, M. A.; Kakosimos, K.; Banish, R. M.; Brillo, J.; Egry, I.; Brooks, R.; Quested, P. N.; Mills, K. C.; Nagashima, A.; Sato, Y.; Wakeham, W. A. Reference Data for the Density and Viscosity of Liquid Aluminum and Liquid Iron. J. Phys. Chem. Ref. Data 2006, 35 (1), 285–300.
35. Zhao, S.; Germann, T. C.; Strachan, A. Atomistic Simulations of Shock-induced Alloying Reactions in Ni/Al Nanolaminates. J. of Chemical Physics 2006, 125, 164707.
36. Zhang, Q.; Çağın, T.; van Duin, A.; Goddard III, W. A.; Qi, Y.; Hector, Jr. L. G. Adhesion and Nonwetting-Wetting Transition in the Al/α-Al2O3 Interface. Physical Review B 2004, 69, 045423.
37. Streitz, F. H.; Mintmire, J. W. Electrostatic Potentials for Metal-Oxide Surface and Interfaces. Physical Review B 1994, 50 (16), 11996–12003.

26
List of Symbols, Abbreviations and Acronyms
Al aluminum
ARO U.S. Army Research Office
EAM embedded atom method
LAMMPS Large-scale Atomic/Molecular Massively Parallel Simulator
MD molecular dynamics
MSRC U.S. Army Major Shared Resource Center
Ni nickel
NiAl nickel aluminide
NIST National Institute for Standards Technology
SHS self-propagating high-temperature synthesis
TB tight-binding

27
No. of Copies Organization 1 ADMNSTR ELEC DEFNS TECHL INFO CTR ATTN DTIC OCP 8725 JOHN J KINGMAN RD STE 0944 FT BELVOIR VA 22060-6218 1 CD OFC OF THE SECY OF DEFNS ATTN ODDRE (R&AT) THE PENTAGON WASHINGTON DC 20301-3080 1 US ARMY RSRCH DEV AND ENGRG CMND ARMAMENT RSRCH DEV & ENGRG CTR ARMAMENT ENGRG & TECHNLGY CTR ATTN AMSRD AAR AEF T J MATTS BLDG 305 ABERDEEN PROVING GROUND MD 21005-5001 1 PM TIMS, PROFILER (MMS-P) AN/TMQ-52 ATTN B GRIFFIES BUILDING 563 FT MONMOUTH NJ 07703 1 US ARMY INFO SYS ENGRG CMND ATTN AMSEL IE TD A RIVERA FT HUACHUCA AZ 85613-5300 1 COMMANDER US ARMY RDECOM ATTN AMSRD AMR W C MCCORKLE 5400 FOWLER RD REDSTONE ARSENAL AL 35898-5000 1 US GOVERNMENT PRINT OFF DEPOSITORY RECEIVING SECTION ATTN MAIL STOP IDAD J TATE 732 NORTH CAPITOL ST NW WASHINGTON DC 20402 1 UNIV OF MARYLAND DEPT OF MECHANICAL ENGINEERING AND THE DEPT OF CHEMISTRY AND BIOCHEMISTRY ATTN M ZACHARIAH 2125 GLENN L. MARTIN HALL COLLEGE PARK MD 20742
No. of Copies Organization 1 TAKHUMI HAWA 218 FELGAR HALL 865 ASP AVENUE NORMAN OK 73019-1052 1 US ARMY RSRCH LAB ATTN RDRL CIH C B HENZ ABERDEEN PROVING GROUND MD 21005 1 US ARMY RSRCH LAB ATTN RDRL CIM G T LANDFRIED BLDG 4600 ABERDEEN PROVING GROUND MD 21005-5066 3 US ARMY RSRCH LAB ATTN IMNE ALC HRR MAIL & RECORDS MGMT ATTN RDRL CIM L TECHL LIB ATTN RDRL CIM P TECHL PUB ADELPHI MD 20783-1197 TOTAL: 14 (1 ELEC, 1 CD, 12 HCS)

28
INTENTIONALLY LEFT BLANK.