molecular ionization-desorption analysis source (midas ... · pdf filemolecular...
TRANSCRIPT
B American Society for Mass Spectrometry, 2015DOI: 10.1007/s13361-015-1289-5
J. Am. Soc. Mass Spectrom. (2016) 27:352Y358
RESEARCH ARTICLE
Molecular Ionization-Desorption Analysis Source (MIDAS)for Mass Spectrometry: Thin-Layer Chromatography
Gregory T. Winter, Joshua A. Wilhide, William R. LaCourseUniversity of Maryland, Baltimore County, Baltimore, MD 21250, USA
Abstract. Molecular ionization-desorption analysis source (MIDAS), which is a de-sorption atmospheric pressure chemical ionization (DAPCI) type source, for massspectrometry has been developed as a multi-functional platform for the direct sam-pling of surfaces. In this article, its utility for the analysis of thin-layer chromatography(TLC) plates is highlighted. Amino acids, which are difficult to visualize withoutstaining reagents or charring, were detected and identified directly from a TLC plate.To demonstrate the full potential of MIDAS, all active ingredients from an analgesictablet, separated on a TLC plate, were successfully detected using both positive andnegative ion modes. The identity of each of the compounds was confirmed from theirmass spectra and compared against standards. Post separation, the chemical signal
(blue permanent marker) as reference marks placed at the origin and solvent front were used to calculateretention factor (Rf) values from the resulting ion chromatogram. The quantitative capabilities of the device wereexhibited by scanning caffeine spots on a TLC plate of increasing sample amount. A linear curve based on peakare, R2 = 0.994, was generated for seven spots ranging from 50 to 1000 ng of caffeine per spot.Keywords: Thin-layer chromatography, TLC desorption atmospheric chemical ionization, DAPCI, Ambientionization, Ambient mass spectrometry
Received: 27 August 2015/Revised: 30 September 2015/Accepted: 3 October 2015/Published Online: 15 October 2015
Introduction
Thin-layer chromatography (TLC) can be found in a varietyof fields such as agriculture, food, pharmaceutical, clinical,
government, and academic research; applications within theseand other fields to which TLC is suited are numerous [1].Detection of compounds on TLC plates comes in many forms,including visual or photometric observations of absorbance orfluorescence as well as through staining using a variety ofdifferent chemical reagents [1]. Instrumental identification ofcompounds can be achieved using ultra-violet/visible, FTIR,and Raman spectroscopy as well as mass spectrometry [1].
Interfacing TLC plate analysis with mass spectrometry hasbeen achieved through direct coupling using sampling probeswith solvent elution [2], through direct electrospray ionizationfrom physically modified plates [3], as well as through othercommercially available ambient mass spectrometry techniquessuch as desorption electrospray ionization (DESI) [4–6] and
direct analysis in real time (DART) [7–9]. A more completepicture of this landscape can be found in these reviews [10–13].
MIDAS consists of a desorption atmospheric pressurechemical ionization (DAPCI) source, which provides the nitro-gen gas and reagent ions required for analyte desorption/ioni-zation, and a sampling platform, which uses a system of inter-changeable plates to preform different types of analyses.
DAPCI type sources are based around a high voltage coronadischarge electrode [14–16]. Reagent or solvent molecules nearthe electrode are ionized and directed at the sample surface. Asheath gas can be used to promote ionization through theintroduction of solvents/reagents or, if the gas is heated,through thermal desorption [14, 17–19]. Additional DAPCIsource descriptions and parameters can be found in a varietyof articles [13–27]. Examples of applications where DAPCItype sources have been used include hydrocarbons [28], explo-sives detection [21, 29, 30], pharmaceuticals [17, 24], imaging[31], and natural products [20, 23].
The development of MIDAS stems from our previous workstudying the direct sample analysis (DSA) platform [32]. TheDSA is a combined source and sampling platform. The roboticsampler can introduce samples from a 13-spot mesh screen orcapillary tube sample holder. The source consists of gas and
Electronic supplementary material The online version of this article (doi:10.1007/s13361-015-1289-5) contains supplementary material, which is availableto authorized users.
Correspondence to: William R. LaCourse; e-mail: [email protected]
reagent inlets, a heating element, a wire-in-cylinder coronadischarge electrode, and a nozzle. The source is aligned coax-ially with the inlet of the mass spectrometer. Schlieren photo-graphs taken of the heated nitrogen gas flow from the DSArevealed that the gas flow profile widened as it left the nozzle[32]. By adapting nozzles of smaller internal diameter, moreuniform gas flow was achieved [32]. These observations aswell as a desire to make a device capable of analyzing planarand/or irregular surfaces (currently a limitation of the DSA)spurred the development of MIDAS.
ExperimentalMaterials
Silica gel 60 thin-layer chromatography (TLC) plates (2.5 × 7.5cm, 250 μm thickness) with F254 fluorescent indicator wereused (EMD Millipore, Billerica, MA, USA). Standards ofcaffeine, acetaminophen, salicylamide, acetylsalicylic acid, ar-ginine, leucine, lysine, methionine, and proline as well as theninhydrin reagent were obtained from Sigma-Aldrich (St. Lou-is, MO, USA). Mass spectrometry grade solvents and reagentsincluding ethyl acetate, acetic acid, ethanol, n-hexane, metha-nol, and water were purchased from Fisher Scientific (Pitts-burgh, PA, USA). Analgesic tablets containing caffeine, acet-aminophen, salicylamide and acetylsalicylic acid were obtain-ed locally.
TLC Plate Preparation
Individual solutions of five amino acids (arginine, leucine,lysine, methionine, and proline) were prepared in water to aconcentration of 5000 ppm. For analysis, 5.0 μL of eachsolution was spotted onto a TLC plate. The plate was notdeveloped. After analysis with MIDAS, the plate was sprayedwith a 0.2% (w:v) ninhydrin solution in ethanol in order to stainthe amino acids for visualization.
A standard mixture of caffeine, acetaminophen,salicylamide, and acetylsalicylic acid was prepared at a con-centration of 2000 ppm in methanol. One analgesic tabletcontaining 32 mg of caffeine, 110 mg of acetaminophen,152 mg of salicylamide, and 162 mg of acetylsalicylic acid,as stated on the packaging, was dissolved in 25.0 mL ofmethanol. A further 1:1 (v:v) dilution of this sample was madeinmethanol. For analysis, 1 μL of the final sample and standardwere spotted onto a TLC plate and developed in a mixture ofacetic acid and ethylacetate, 5:95 (v:v). The plates were dried inan oven at 70°C for 30 min prior to analysis.
TLC Quantitation
Serial dilutions from a 1000 ppm caffeine solution were madein methanol at concentrations of 500, 400, 300, 200, 100, and50 ppm. One microliter of each solution was manually spottedonto a TLC plate that had been prewashed with methanol. Thespots were focused by developing the plate across the short axiswith a mixture of methanol, ethylacetate, and n-hexane
10:45:45 (v:v). After focusing, the plate was dried in an ovenat 100°C for 30 min.
Mass Spectrometer
All analyses were performed using a Perkin Elmer AxIonTime-of-Flight mass spectrometer running TOF MS Driversoftware ver. 4.2 (Waltham, MA, USA). The mass spectrom-eter was tuned and calibrated with Agilent APCI/APPI tuningmix (Santa Clara, CA, USA) prior to use. Spectra from theamino acid TLC plate were acquired at 1.0 spectra·s–1 inpositive mode only. Spectra from the analgesic TLC plate wereacquired at 5.0 and 2.5 spectra·s–1 in positive and negativemode, respectively. For quantitative TLC plate and rapidqualitative sample analysis, spectra were acquired at 2.0spectra·s–1. No curtain gas was used at any time. Cylin-der, endplate, and capillary entrance voltages were set to0 V for experiments in each polarity. Additional positivemode instrument parameters include capillary exit, skimmer,radio frequency (rf) and offset voltages of 175, 18, 470, and 12V, respectively. Additional negative mode instrument parame-ters include capillary exit, skimmer, rf, and offset voltages of –100, –20, –450, and –10.3 V, respectively.
MIDAS Parameters
The heater was set to supply nitrogen gas at a temperature of180°C as measured using a thermocouple (Fluke, Wilmington,NC, USA). Incident nozzle angle was set at 50°, nozzle tosample distance was 2.0 mm, and source to inlet distance was5.0 mm. Inlet nitrogen gas pressure was set at 40 pounds persquare inch resulting in a linear velocity of 3.0 m·s–1 exiting thenozzle as measured using an anemometer (Extech, Nashua,NH, USA). Nitrogen gas was supplied from an in-house nitro-gen generation system (Parker, Cleveland, OH, USA) at >99%purity. In positive mode, the corona electrode was operated at+3.0 kV and 6.0 μA, in negative mode –2.5 kV and 6.0 μA. Noadditional reagents or solvents were added to the systemduring TLC plate analysis. Atmospheric relative humidityduring testing was 28%–50% as measured by a digitalsling psycrometer (General, New York, NY, USA). Forall TLC plate analyses the plate was moved through thesampling region at a rate of 1.6 mm·s–1.
Results and DiscussionMIDAS: Source
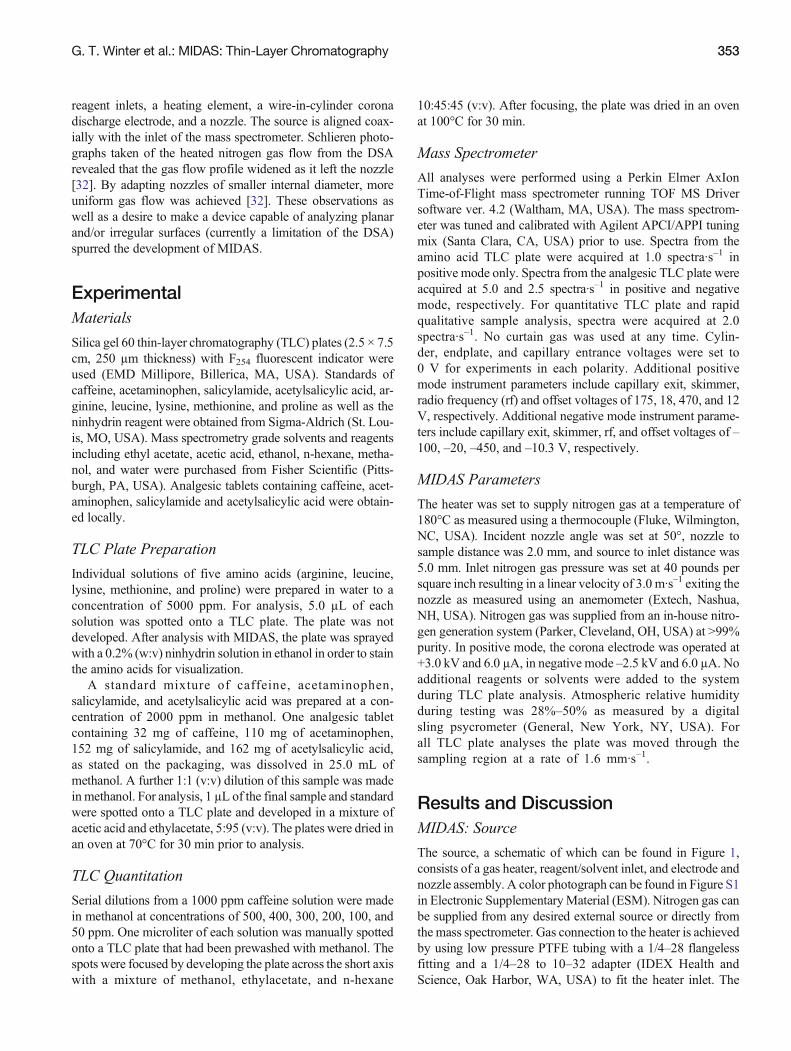
The source, a schematic of which can be found in Figure 1,consists of a gas heater, reagent/solvent inlet, and electrode andnozzle assembly. A color photograph can be found in Figure S1in Electronic SupplementaryMaterial (ESM). Nitrogen gas canbe supplied from any desired external source or directly fromthe mass spectrometer. Gas connection to the heater is achievedby using low pressure PTFE tubing with a 1/4–28 flangelessfitting and a 1/4–28 to 10–32 adapter (IDEX Health andScience, Oak Harbor, WA, USA) to fit the heater inlet. The
G. T. Winter et al.: MIDAS: Thin-Layer Chromatography 353
heater is made of a 190-mm long stainless steel tube with outerand inner diameters (o.d., i.d.) of 6.3 mm and 2.1 mm, respec-tively. To improve heat transfer to the nitrogen gas, the tube isfilled with 1/16′′ stainless steel ball bearings (McMaster-Carr,Robbinsville, NJ, USA). Heating of the source is provided by a1/2′′ heating tape (HTS/Amptex Co., Stafford, TX, USA),which is wrapped helically around the tube. The tape is con-nected to a variable power supply (HTS/Amptex Co.), which isused to control the temperature. The heater tube connects to thecorona discharge electrode using a 3/8′′ national pipe threadfitting. Nitrogen gas is fed through the heater and over thecorona discharge electrode. The electrode is arranged in thewire-in-cylinder configuration. The cylinder has externalthreads and serves as the base to attach the nozzle.
The nozzle consists of a tapered glass pipette (Fisher Scien-tific, Pittsburgh, PA, USA) that has been cut and fit through astainless steel ferrule and secured to the cylinder with a gasfitting. When installed, the glass nozzle is 15 mm long with ani.d at its exit of approximately 1.5 mm. A high voltage powersupply (Spellman, Hauppauge, NY, USA) is used to generatethe corona discharge. Using this electrode and nozzle system,the corona discharge occurs in an enclosed region, away fromthe sample surface. Charged reagent gas is directed at thesample surface through the glass nozzle, which is positioned
within a few millimeters of the sample surface. If desired,calibrant or other reagents/solvents can be added through a0.25 mm i.d stainless steel tube (IDEX Health and Science,Oak Harbor, WA, USA), which is connected just after the exitof the heater but before the corona discharge electrode.
MIDAS: Sampler
The base for the sampling platform is an aluminum platesupporting a motorized x-y stage. Power for the motor assem-blies comes from a 24 V DC power supply. The stage can bemoved automatically using two stepper motors, model PK243-01AA (Oriental Motor, Torrance, CA, USA). Each steppermotor has its own SCX11 Universal Stepper Motor Controllerand 24 V Microstep Driver, CMD2109P, with computer con-trol provided through the Immediate Motion Creator softwarever. 2.11 (Oriental Motor). The stage, which is 127 mm × 85mm, can travel 70 mm in the x direction and 155 mm in the ydirection.
The source is mounted to an adjustment bracket above thesample stage. Adjustment screws on the bracket allow formanual xyz adjustment, up to 15.0 mm of travel on each axis,of the entire source. The pitch of the source is also variable,which enables adjustment of the incident angle to between 40°
Figure 1. Schematic representation of MIDAS
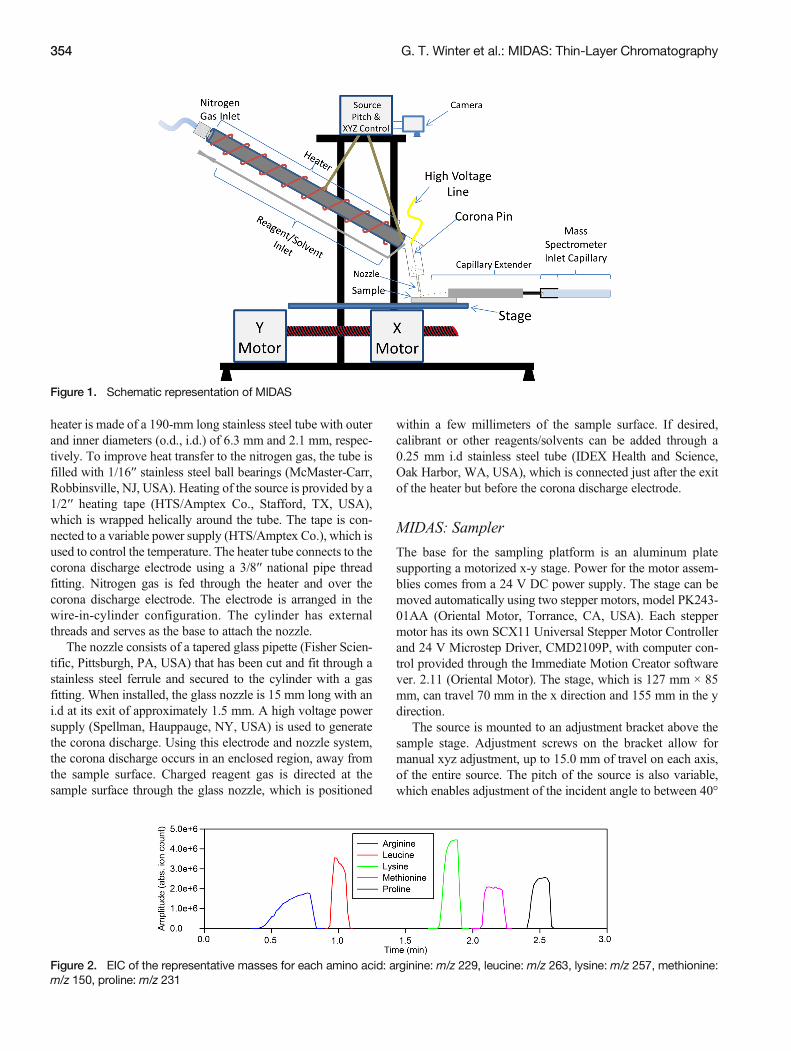
Figure 2. EIC of the representative masses for each amino acid: arginine: m/z 229, leucine: m/z 263, lysine: m/z 257, methionine:m/z 150, proline: m/z 231
354 G. T. Winter et al.: MIDAS: Thin-Layer Chromatography
and 55°. Mounted to the source adjustment bracket, directed atthe sampling region, is a small high-definition camera, modeluEye XS (IDS Imaging Development Systems Inc., Woburn,MA, USA). The camera allows for remote operation and accu-rate positioning of the sample under the nozzle. Additionally,using the supplied software, uEye Cockpit (IDS Imaging De-velopment Systems Inc.), still photographs and video of thesample/sampling process can be taken.
Mass Spectrometer Interface
MIDAS requires the use of a stainless steel capillary extensionfor the mass spectrometer. Desorbed ions are transferred to themass spectrometer through the extension, which fits over thecapillary of the mass spectrometer. The extension measures160 mm in length with an i.d. of 5 mm, reducing to 2 mmwhenit reaches the inlet capillary.
TLC Plate Analysis
Compounds separated on a TLC plate may be invisible to thenaked eye. The use of TLC plates with a fluorescent indicatoroften makes the visualization of spots easy; however, not allcompounds contain functional groups that can take advantageof this feature. As a result, other methods such as staining orcharring must be used in order to detect the presence of asample. A drawback, however, is that once staining or charringis complete, the sample is destroyed and unusable for furtheranalysis by mass spectrometry. Advantageously, MIDAS canbe used to detect compounds on a TLC plate without the needto visualize the spots.
To simulate a separation in which no compounds are visibleunder white or UV light, five different amino acids werespotted individually on a TLC plate. These amino acids donot contain functional groups amenable to detection using thefluorescent indicator compound on the TLC plate. Figure 2
contains positive mode extracted ion chromatograms (EICs)recorded for the neat amino acids spotted onto a TLC plate.EICs were generated based on the most intense peak observedfor each amino acid. Themass spectra, obtained for each aminoacid, are available in EMS Figure S2. At the high concentrationused, dimerization is readily observed. EMSFigure S3 containsphotographs of the plate under white light before and afterstaining with ninhydrin, a common staining reagent for aminoacids [1], as well as under ultraviolet light. Without the stain,the five amino acids analyzed were not visible; however, eachone was detected by scanning the plate using MIDAS. Theposition of each spotted sample was confirmed after stainingwith ninhydrin. The distorted peak shape for arginine is a resultof the initial sample placement under the source before hori-zontal movement commenced. A brief pause was taken afterthe leucine spot to ensure proper sample movement.
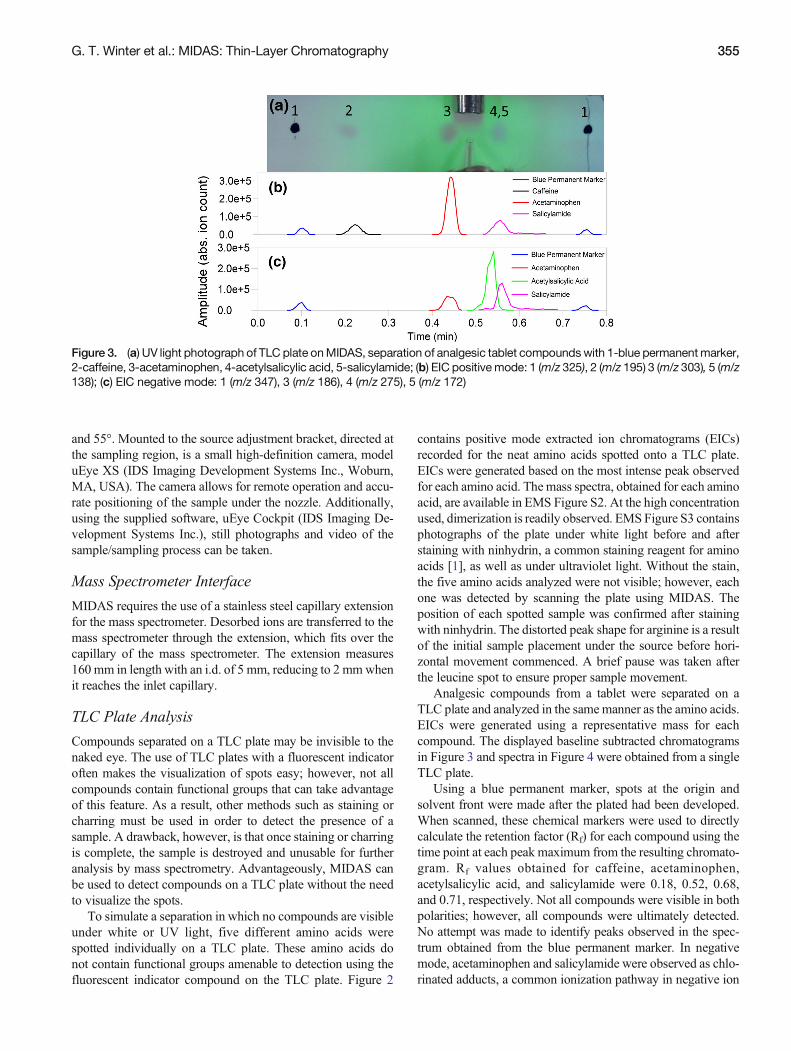
Analgesic compounds from a tablet were separated on aTLC plate and analyzed in the samemanner as the amino acids.EICs were generated using a representative mass for eachcompound. The displayed baseline subtracted chromatogramsin Figure 3 and spectra in Figure 4 were obtained from a singleTLC plate.
Using a blue permanent marker, spots at the origin andsolvent front were made after the plated had been developed.When scanned, these chemical markers were used to directlycalculate the retention factor (Rf) for each compound using thetime point at each peak maximum from the resulting chromato-gram. Rf values obtained for caffeine, acetaminophen,acetylsalicylic acid, and salicylamide were 0.18, 0.52, 0.68,and 0.71, respectively. Not all compounds were visible in bothpolarities; however, all compounds were ultimately detected.No attempt was made to identify peaks observed in the spec-trum obtained from the blue permanent marker. In negativemode, acetaminophen and salicylamide were observed as chlo-rinated adducts, a common ionization pathway in negative ion
Figure 3. (a) UV light photograph of TLC plate onMIDAS, separation of analgesic tablet compoundswith 1-blue permanentmarker,2-caffeine, 3-acetaminophen, 4-acetylsalicylic acid, 5-salicylamide; (b) EIC positive mode: 1 (m/z 325), 2 (m/z 195) 3 (m/z 303), 5 (m/z138); (c) EIC negative mode: 1 (m/z 347), 3 (m/z 186), 4 (m/z 275), 5 (m/z 172)
G. T. Winter et al.: MIDAS: Thin-Layer Chromatography 355
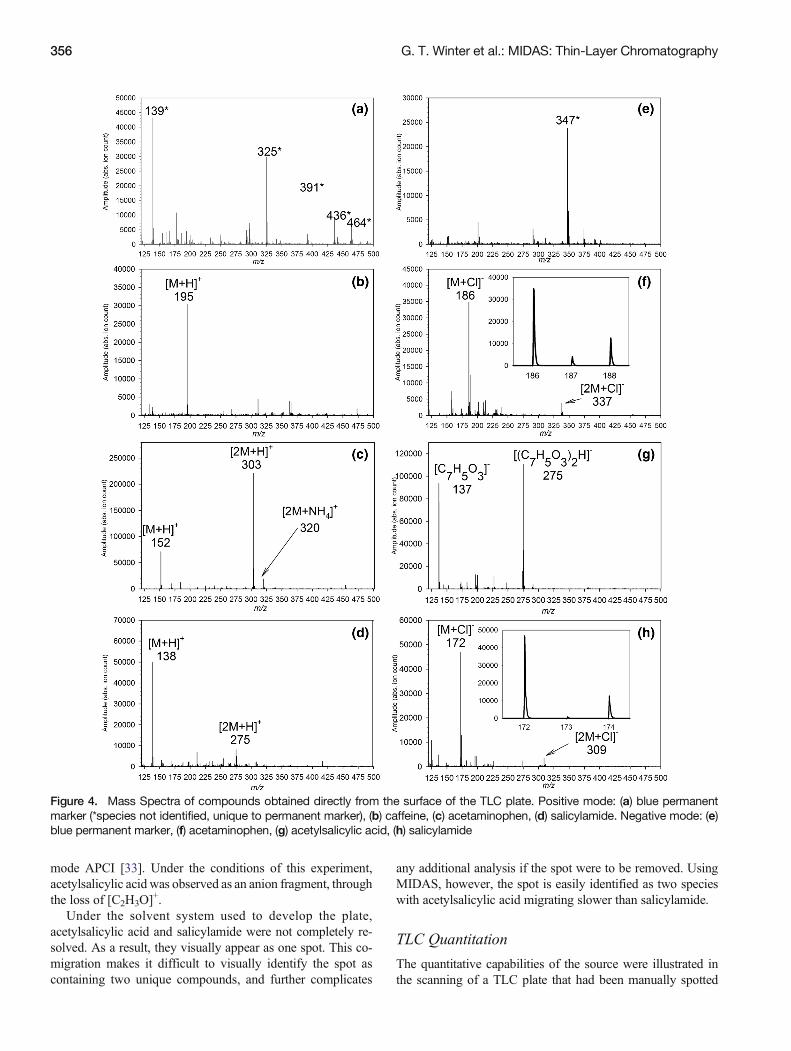
mode APCI [33]. Under the conditions of this experiment,acetylsalicylic acid was observed as an anion fragment, throughthe loss of [C2H3O]
+.Under the solvent system used to develop the plate,
acetylsalicylic acid and salicylamide were not completely re-solved. As a result, they visually appear as one spot. This co-migration makes it difficult to visually identify the spot ascontaining two unique compounds, and further complicates
any additional analysis if the spot were to be removed. UsingMIDAS, however, the spot is easily identified as two specieswith acetylsalicylic acid migrating slower than salicylamide.
TLC Quantitation
The quantitative capabilities of the source were illustrated inthe scanning of a TLC plate that had been manually spotted
Figure 4. Mass Spectra of compounds obtained directly from the surface of the TLC plate. Positive mode: (a) blue permanentmarker (*species not identified, unique to permanent marker), (b) caffeine, (c) acetaminophen, (d) salicylamide. Negative mode: (e)blue permanent marker, (f) acetaminophen, (g) acetylsalicylic acid, (h) salicylamide
356 G. T. Winter et al.: MIDAS: Thin-Layer Chromatography
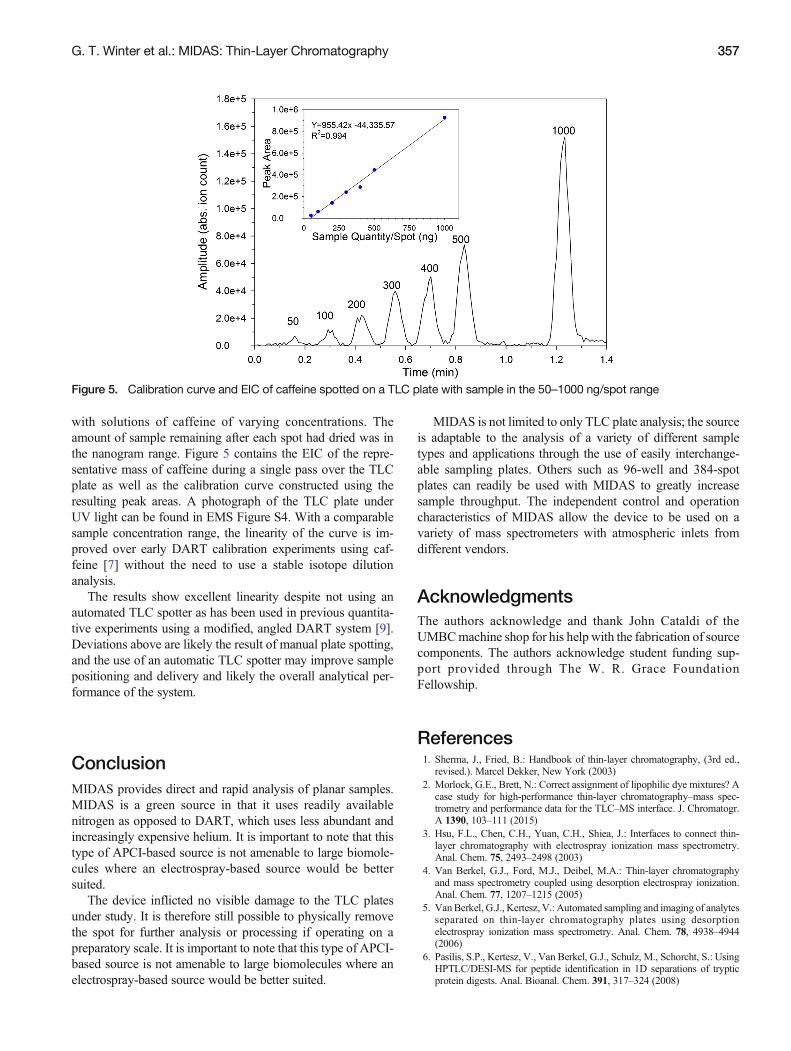
with solutions of caffeine of varying concentrations. Theamount of sample remaining after each spot had dried was inthe nanogram range. Figure 5 contains the EIC of the repre-sentative mass of caffeine during a single pass over the TLCplate as well as the calibration curve constructed using theresulting peak areas. A photograph of the TLC plate underUV light can be found in EMS Figure S4. With a comparablesample concentration range, the linearity of the curve is im-proved over early DART calibration experiments using caf-feine [7] without the need to use a stable isotope dilutionanalysis.
The results show excellent linearity despite not using anautomated TLC spotter as has been used in previous quantita-tive experiments using a modified, angled DART system [9].Deviations above are likely the result of manual plate spotting,and the use of an automatic TLC spotter may improve samplepositioning and delivery and likely the overall analytical per-formance of the system.
ConclusionMIDAS provides direct and rapid analysis of planar samples.MIDAS is a green source in that it uses readily availablenitrogen as opposed to DART, which uses less abundant andincreasingly expensive helium. It is important to note that thistype of APCI-based source is not amenable to large biomole-cules where an electrospray-based source would be bettersuited.
The device inflicted no visible damage to the TLC platesunder study. It is therefore still possible to physically removethe spot for further analysis or processing if operating on apreparatory scale. It is important to note that this type of APCI-based source is not amenable to large biomolecules where anelectrospray-based source would be better suited.
MIDAS is not limited to only TLC plate analysis; the sourceis adaptable to the analysis of a variety of different sampletypes and applications through the use of easily interchange-able sampling plates. Others such as 96-well and 384-spotplates can readily be used with MIDAS to greatly increasesample throughput. The independent control and operationcharacteristics of MIDAS allow the device to be used on avariety of mass spectrometers with atmospheric inlets fromdifferent vendors.
AcknowledgmentsThe authors acknowledge and thank John Cataldi of theUMBCmachine shop for his help with the fabrication of sourcecomponents. The authors acknowledge student funding sup-port provided through The W. R. Grace FoundationFellowship.
References1. Sherma, J., Fried, B.: Handbook of thin-layer chromatography, (3rd ed.,
revised.). Marcel Dekker, New York (2003)2. Morlock, G.E., Brett, N.: Correct assignment of lipophilic dye mixtures? A
case study for high-performance thin-layer chromatography–mass spec-trometry and performance data for the TLC–MS interface. J. Chromatogr.A 1390, 103–111 (2015)
3. Hsu, F.L., Chen, C.H., Yuan, C.H., Shiea, J.: Interfaces to connect thin-layer chromatography with electrospray ionization mass spectrometry.Anal. Chem. 75, 2493–2498 (2003)
4. Van Berkel, G.J., Ford, M.J., Deibel, M.A.: Thin-layer chromatographyand mass spectrometry coupled using desorption electrospray ionization.Anal. Chem. 77, 1207–1215 (2005)
5. VanBerkel, G.J., Kertesz, V.: Automated sampling and imaging of analytesseparated on thin-layer chromatography plates using desorptionelectrospray ionization mass spectrometry. Anal. Chem. 78, 4938–4944(2006)
6. Pasilis, S.P., Kertesz, V., Van Berkel, G.J., Schulz, M., Schorcht, S.: UsingHPTLC/DESI-MS for peptide identification in 1D separations of trypticprotein digests. Anal. Bioanal. Chem. 391, 317–324 (2008)
Figure 5. Calibration curve and EIC of caffeine spotted on a TLC plate with sample in the 50–1000 ng/spot range
G. T. Winter et al.: MIDAS: Thin-Layer Chromatography 357
7. Morlock, G., Ueda, Y.: New coupling of planar chromatographywith directanalysis in real time mass spectrometry. J. Chromatogr. A 1143, 243–251(2007)
8. Chernetsova, E.S., Revelsky, A.I., Morlock, G.E.: Some new features ofdirect analysis in real time mass spectrometry utilizing the desorption at anangle option. Rapid Commun. Mass Spectrom. 25, 2275–2282 (2011)
9. Häbe, T.T., Morlock, G.E.: Quantitative surface scanning by direct analysisin real time mass spectrometry: quantitative surface scanning by DART-MS. Rapid Commun. Mass Spectrom. 29, 474–484 (2015)
10. Pasilis, S.P., Van Berkel, G.J.: Atmospheric pressure surface sampling/ionization techniques for direct coupling of planar separations with massspectrometry. J. Chromatogr. A 1217, 3955–3965 (2010)
11. Morlock, G., Schwack, W.: Coupling of planar chromatography to massspectrometry. Trends Anal. Chem. 29, 1157–1171 (2010)
12. Cheng, S.C., Huang, M.Z., Shiea, J.: Thin-layer chromatography/massspectrometry. J. Chromatogr. A 1218, 2700–2711 (2011)
13. Tuzimski, T.: Application of different modes of thin-layer chromatographyand mass spectrometry for the separation and detection of large and smallbiomolecules. J. Chromatogr. A 1218, 8799–8812 (2011)
14. Chen, H., Zheng, J., Zhang, X., Luo, M., Wang, Z., Qiao, X.: Surfacedesorption atmospheric pressure chemical ionization mass spectrometry fordirect ambient sample analysis without toxic chemical contamination. J.Mass Spectrom. 42, 1045–1056 (2007)
15. Chen, H.W., Lai, J.H., Zhou, Y.F., Huan, Y.F., Li, J.Q., Xie, Z., Wang,Z.C., Luo,M.B.: Instrumentation and characterization of surface desorptionatmospheric pressure chemical ionizationmass spectrometry. Chin. J. Anal.Chem. 35, 1233–1240
16. Cooks, R.G., Gologan, B., Takáts, Z., Wiseman, J.M., Cotte-Rodriguez, I.:Method and System for Desorption Atmospheric Pressure Chemical Ioni-zation. US 7544933 B2, June 9 (2009)
17. Williams, J.P., Patel, V.J., Holland, R., Scrivens, J.H.: The use of recentlydescribed ionization techniques for the rapid analysis of some commondrugs and samples of biological origin. Rapid Commun. Mass Spectrom.20, 1447–1456 (2006)
18. Yang, S., Ding, J., Zheng, J., Hu, B., Li, J., Chen, H., Zhou, Z., Qiao, X.:Detection of melamine in milk products by surface desorption atmosphericpressure chemical ionization mass spectrometry. Anal. Chem. 81, 2426–2436 (2009)
19. Yang, S.P., Chen, H.W., Yang, Y.L., Hu, B., Zhang, X., Zhou, Y.F.,Zhang, L.L., Gu, H.W.: Imaging melamine in egg samples by surfacedesorption atmospheric pressure chemical ionization mass spectrometry.Chin. J. Anal. Chem. 37, 315–318 (2009)
20. Chen, H., Liang, H., Ding, J., Lai, J., Huan, Y., Qiao, X.: Rapid differen-tiation of tea products by surface desorption atmospheric pressure chemicalionization mass spectrometry. J. Agric. Food Chem. 55, 10093–10100(2007)
21. Cotte-Rodríguez, I., Takáts, Z., Talaty, N., Chen, H., Cooks, R.G.: Desorp-tion electrospray ionization of explosives on surfaces: Sensitivity and
selectivity enhancement by reactive desorption electrospray ionization.Anal. Chem. 77, 6755–6764 (2005)
22. Song, Y., Cooks, R.G.: Atmospheric pressure ion/molecule reactions forthe selective detection of nitroaromatic explosives using acetonitrile and airas reagents. Rapid Commun. Mass Spectrom. 20, 3130–3138 (2006)
23. Wu, Z., Chen, H., Wang,W., Jia, B., Yang, T., Zhao, Z., Ding, J., Xiao, X.:Differentiation of dried sea cucumber products from different geographicalareas by surface desorption atmospheric pressure chemical ionization massspectrometry. J. Agric. Food Chem. 57, 9356–9364 (2006)
24. Zhang, X., Jia, B., Huang, K., Hu, B., Chen, R., Chen, H.: Tracing originsof complex pharmaceutical preparations using surface desorption atmo-spheric pressure chemical ionization mass spectrometry. Anal. Chem. 82,8060–8070 (2010)
25. Wang, J., Yang, S.P., Yan, F.Y., Liu, Y., Li, M., Song, Y.H., Zhan, Y.B.,Chen, H.W.: Rapid determination of dimethoate in nanoliter of juice usingsurface desorption atmospheric pressure chemical ionization mass spec-trometry. Chin. J. Anal. Chem. 38, 453–457 (2010)
26. Huang, D., Luo, L., Jiang, C., Han, J., Wang, J., Zhang, T., Jiang, J., Zhou,Z., Chen, H.: Sinapine detection in radish taproot using surface desorptionatmospheric pressure chemical ionization mass spectrometry. J. Agric.Food Chem. 59, 2148–2156 (2011)
27. Pi, Z., Yue, H., Ma, L., Ding, L., Liu, Z., Liu, S.: Differentiation of variouskinds of fructus schisandrae by surface desorption atmospheric pressurechemical ionizationmass spectrometry combinedwith principal componentanalysis. Anal. Chim. Acta 706, 285–290 (2011)
28. Jjunju, F.P.M., Badu-Tawiah, A.K., Li, A., Soparawalla, S., Roqan, I.S.,Cooks, R.G.: Hydrocarbon analysis using desorption atmospheric pressurechemical ionization. Int. J. Mass Spectrom. 345/347, 80–88 (2013)
29. Takáts, Z., Cotte-Rodriguez, I., Talaty, N., Chen, H., Cooks, R.G.: Direct,trace level detection of explosives on ambient surfaces by desorptionelectrospray ionization mass spectrometry. Chem. Commun. 15, 1950–1952 (2005)
30. Cotte-Rodríguez, I., Hernández-Soto, H., Chen, H., Cooks, R.G.: In situtrace detection of peroxide explosives by desorption electrospray ionizationand desorption atmospheric pressure chemical ionization. Anal. Chem. 80,1512–1519 (2008)
31. Li, M., Jia, B., Ding, L., Hong, F., Ouyang, Y., Chen, R., Zhou, S., Chen,H., Fang, X.: Document authentication at molecular levels using desorptionatmospheric pressure chemical ionization mass spectrometry imaging:Document authentication by DAPCI-MS. J. Mass Spectrom. 48, 1042–1049 (2013)
32. Winter, G.T., Wilhide, J.A., LaCourse, W.R.: Characterization of a directsample analysis (DSA) ambient ionization source. J. Am. Soc. MassSpectrom. 26, 1502–1507 (2015)
33. McEwen, C.N., Larsen, B.S.: Ionization mechanisms related to negativeIon APPI, APCI, and DART. J. Am. Soc. Mass Spectrom. 20, 1518–1521(2009)
358 G. T. Winter et al.: MIDAS: Thin-Layer Chromatography