molecular markers of biomass burning, fungal spores … et al...molecular markers of biomass...
TRANSCRIPT
lable at ScienceDirect
Atmospheric Environment 130 (2016) 64e73
Contents lists avai
Atmospheric Environment
journal homepage: www.elsevier .com/locate/atmosenv
Molecular markers of biomass burning, fungal spores and biogenicSOA in the Taklimakan desert aerosols
Pingqing Fu a, g, *, Guoshun Zhuang b, Yele Sun a, Qiongzhen Wang b, e, Jing Chen d,Lujie Ren a, Fan Yang a, Zifa Wang a, Xiaole Pan f, Xiangdong Li g, Kimitaka Kawamura c, **
a LAPC, Institute of Atmospheric Physics, Chinese Academy of Sciences, Beijing 100029, Chinab Center for Atmospheric Chemistry Study, Department of Environmental Science & Engineering, Fudan University, Shanghai 200433, Chinac Institute of Low Temperature Science, Hokkaido University, Sapporo 060-0819, Japand Institute of Geographic Sciences and Natural Resources Research, Chinese Academy of Sciences, Beijing 100101, Chinae Zhejiang Environmental Science & Design Institute, Hangzhou 310007, Chinaf Research Institute for Applied Mechanics, Kyushu University, Fukuoka, Japang Department of Civil and Environmental Engineering, The Hong Kong Polytechnic University, Hung Hom, Kowloon, Hong Kong, China
h i g h l i g h t s
� Biogenic POA and SOA tracers were measured in the Taklimakan desert aerosols.� Higher levels of levoglucosan were found in south rim than in the central region of the desert.� Fungal spore tracers were identified in the Taklimakan desert aerosols.� The predominance of 2-MGA over 2-methyltetrols was found in the Taklimakan aerosols.
a r t i c l e i n f o
Article history:Received 19 June 2015Received in revised form27 October 2015Accepted 29 October 2015Available online 2 November 2015
Keywords:Biomass burningFungal spore2-MethyltetrolsAsian dustTaklimakan desert
* Corresponding author. LAPC, Institute of Atmospemy of Sciences, Beijing 100029, China.** Corresponding author.
E-mail addresses: [email protected] (Phokudai.ac.jp (K. Kawamura).
http://dx.doi.org/10.1016/j.atmosenv.2015.10.0871352-2310/© 2015 Elsevier Ltd. All rights reserved.
a b s t r a c t
Biogenic primary organic aerosols (POA) and secondary organic aerosols (SOA) are important organicconstituents of atmospheric particulate matter (PM). In order to better understand the atmosphericabundances, molecular compositions and sources of the desert aerosols, biomass-burning tracers (e.g.levoglucosan), primary saccharides including fungal spore tracers, and SOA tracers from the oxidation ofbiogenic volatile organic compounds (e.g. isoprene, monoterpenes and sesquiterpene) have been studiedin ambient aerosols from the Taklimakan desert, using gas chromatography-mass spectrometry. Resultsshowed that the total concentrations of biomass-burning tracers at Hetian (177e359 ng m�3, mean233 ng m�3 in PM2.5) in the south rim of the desert were much higher than those at Tazhong (1.9e8.8 ng m�3 in PM2.5 and 5.9e32 ng m�3 in TSP) in the central Taklimakan desert. Molecular markers offungal spores were also detected in all the desert aerosols, highlighting the importance of primarybioaerosols in the Asian dust particles. A specific pattern of the dominance of 2-methylglyceric acid over2-methyltetrols and C5-alkene triols was found in the Taklimakan desert aerosols, especially during thedust storm events, which is different from the 2-methyltetrols-dominated pattern in other ambientaerosols. Our results provide direct evidence on the biogenic POA and SOA tracers in the Taklimakandesert region, which help to better understand their impact on the aerosol chemistry in the down-windregions.
© 2015 Elsevier Ltd. All rights reserved.
heric Physics, Chinese Acad-
. Fu), kawamura@lowtem.
1. Introduction
Atmospheric aerosols play important roles on global climate byradiative forcing, and have serious negative impacts on humanhealth (P€oschl, 2005; Pope et al., 2009). Organic aerosols, typically alarge fraction of aerosol particles, are ubiquitous in the Earth's at-mosphere (de Gouw and Jimenez, 2009). They originate from a

P. Fu et al. / Atmospheric Environment 130 (2016) 64e73 65
variety of sources and atmospheric processes. For example, primaryorganic aerosols (POA) are directly emitted from both naturalsources (e.g. plant emission, soil and dust suspension, and seaspray) and anthropogenic sources (e.g. industrial emission, trafficemission and biomass burning) (Viana et al., 2013; Escudero et al.,2015). Secondary organic aerosols (SOA) are those originating fromhomogenous and heterogeneous reactions of volatile organiccompounds (VOCs) in the atmosphere from biogenic and anthro-pogenic emissions (Claeys et al., 2004; Hallquist et al., 2009;Escudero et al., 2015).
Both POA and SOA are important components of carbonaceousaerosols in the Earth's atmosphere. However, their abundancesvary among different locations. de Gouw and Jimenez (2009) re-ported that biomass burning and biogenic SOA formation are majorsources of organic aerosols globally, especially in the tropical re-gions, whereas anthropogenic emissions are mostly located atnorthern midlatitudes. In addition to biomass-burning emissionand biogenic SOA formation, mineral dust is one of the largestcontributors to atmospheric aerosols with an estimated emissionflux of 1000e3000 Tg yr�1 (Ginoux et al., 2001; Dentener et al.,2006; Ginoux et al., 2012). This is especially true in the “DustBelt” of the Northern Hemisphere, which is the largest and mostpersistent source of dust in the world (Wu et al., 2009). In East Asia,the Gobi desert in northern China and Mongolia and the Takli-makan Desert in western China are the main source regions of theAsian dust aerosols (Ginoux et al., 2001; Sun et al., 2005). On ahemispheric to global scale, Asian dust aerosols have been shownto be the main source of dust deposited in the North Pacific and theGreenland ice sheet (Duce et al., 1980; Wu et al., 2009).
During the past decade, significant efforts have been made tounderstand the molecular compositions of organic aerosols in ur-ban, rural, marine, and even the Polar Regions (Graham et al., 2003;Wang et al., 2006; Fu et al., 2011, 2013; Hu et al., 2013; Ding et al.,2014). Asian dust aerosols are generally considered to be primarilycomposed of mixtures of quartz, clays, micas, feldspars, carbonatesand other minor minerals (Sullivan et al., 2007), and have beenextensively investigated in terms of their roles in atmosphericchemistry (Falkovich et al., 2004; Sullivan et al., 2007, 2010; Wanget al., 2015), cloud condensation nuclei (CCN) activities (Shi et al.,2008), radiative properties and thus environment and climate ef-fects (Buseck and Posfai, 1999; Seinfeld et al., 2004; Ginoux et al.,2012; Huang et al., 2014; DeMott et al., 2015). Mineral dust aero-sols can internally mix with anthropogenic inorganic and organicaerosols via heterogeneous reaction and/or adsorption during long-range transport (Seinfeld et al., 2004). It is important to understandthe organic aerosol composition at a molecular level in relation tophotochemical oxidation, long-range atmospheric transport, andcoating processes on the surface ofmineral dust particles (Robinsonet al., 2006; Rudich et al., 2007).
Asian dust aerosols have also been reported to contain biologicalparticles, such as fungal spores, bacteria and viruses (Wu et al.,2004; Maki et al., 2014), which are relevant to the occurrence ofhuman diseases and public health problems associated with acutetoxic effects, allergies, and asthma (Bush and Portnoy, 2001; P€oschl,2005). Thus it would be interesting to investigate the atmosphericabundances of arabitol and mannitol, the marker compounds ofairborne fungal spores (Bauer et al., 2008), in dust aerosol particlesin their source regions. Furthermore, to date, there is still a lack ofknowledge about important biogenic SOA tracers, such as 2-methyltetrols from the photooxidation of isoprene (Claeys et al.,2004) in the desert aerosols.
The objective of the present study is to investigate the atmo-spheric levels of molecular markers for biomass burning, fungalspores, and biogenic SOA in the Taklimakan desert aerosols.Although a small number of aerosol samples were collected in April
when the dust episodes prevail over the East Asia, such a pre-liminary study can help elucidate the organic molecular composi-tion of the desert aerosols, their contributions to organic aerosolloadings in the source regions and in the downwind regions vialong-range atmospheric transport.
2. Experimental section
2.1. Sample collection
The Taklimakan desert is the second largest shifting sand desertin the world, located in the Tarim Basin with an area of337,000 km2. As much as 85% of the desert consists of shifting sanddunes (Sun and Liu, 2006). Aerosol sampling was conducted in anintensive ground-monitoring network at Tazhong (TZ, 83.67�E,39.00�N, 1090 m a.s.l.) and Hetian (HT, 79.92�E, 37.12�N,1450 m a.s.l.) (Fig. 1) during April 16e21, 2008. Tazhong is a smallisolated town (about 1200 residents) located in the central Takli-makan desert, while Hetian is a city (population 320,000) located inthe southwestern rim of the Taklimakan desert. Aerosol sampleswere collected for 24 h (normally from 8:00 a.m. to 8:00 a.m. thenext day, local time) on Whatman 41 filters (Whatman Inc.,Maidstone, UK) using medium-volume samplers (Mode TSP/PM10/PM2.5-II, Dike, Beijing) at a flow rate of 77.6 L min�1. The samplerswere set up at the rooftop of a building about 10 m above theground. Both PM2.5 (n ¼ 5) and TSP (n ¼ 5) samples were collectedsimultaneously at the Tazhong site, while only PM2.5 samples(n ¼ 4) were available at Hetian in the present study. According tothe guidelines on dust observation of the Meteorological Obser-vation Criteria issued by the National Weather Bureau of China, thesampling period at Tazhong was divided into non-dust period (ND:April 16e17), floating dust period (FD: April 18) and dust stormperiod (DS: April 19e21). While at Hetian, the sampling period wasdivided into ND (April 17e18) and FD (April 19e20). The dust ep-isodes were also revealed by the CALIOP satellite data that wereavailable from the Atmospheric Science Data Center. Fig. 2 showsthe dust aerosols prevailed over the Taklimakan desert during April18e20, 2008. The samples were kept in polyethylene plastic bagsimmediately after sampling and then reserved in a refrigeratorat �18 �C.
2.2. Chemical measurements
Filter aliquots of the aerosol samples were analyzed for inor-ganic ions using ion chromatography and heavy metals using ICP-AES. Detailed information on the analytical procedures can befound in a previous study (Wang et al., 2011).
Another filter cut of the aerosol samples was extracted threetimes with dichloromethane/methanol (2:1; v/v) under ultra-sonication for 10 min. The solvent extracts were filtered throughquartz wool packed in a Pasteur pipette, concentrated using a ro-tary evaporator under vacuum, and then blown down to neardryness with pure nitrogen gas. The extracts were reacted with50 ml of N, O-bis-(trimethylsilyl)trifluoroacetamide (BSTFA, pur-chased from SigmaeAldrich) containing 1% trimethylsilyl chlorideand 10 ml of pyridine at 70 �C for 3 h. After the reaction, derivativeswere diluted by the addition of 140 ml of n-hexane containing1.43 ng ml�1 of the internal standard (C13 n-alkane) prior to analysisby gas chromatography/mass spectrometry (GC/MS).
GC/MS analyses were performed on a HewlettePackard model6890 GC coupled to HewlettePackard model 5973 MSD. The GCseparation was achieved on a DB-5 fused silica capillary column(30 m � 0.25 mm i.d., 0.25 mm film thickness) with the GC oventemperature programmed from 50 �C (2 min) to 120 �C at15 �C min�1 and then to 300 �C at 5 �C min�1 with a final isotherm

Fig. 1. A map showing the sampling sites of Tazhong (TZ) and Hetian (HT) in the Taklimakan Desert, China.
P. Fu et al. / Atmospheric Environment 130 (2016) 64e7366
hold at 300 �C for 16 min. Helium was used as the carrier gas at aconstant flow rate of 1.0 ml min�1. The GC injector and MS ionsource temperatures were maintained at 280 �C and 230 �C,respectively. The mass spectrometer was operated in the electronimpact (EI) mode at 70 eV and scanned over the range of50e650 Da. Individual compounds (TMS derivatives) were identi-fied by comparison of mass spectra with those of authentic stan-dards or literature data (Claeys et al., 2004; Jaoui et al., 2007; Huet al., 2008; Lin et al., 2012). Following fragment ions were usedfor quantifications: m/z 217 and 204 for sugar compounds, m/z 193for 4-hydroxybenzoic acid,m/z 194 for vanillin,m/z 297 and 312 forvanillic acid, m/z 327 for syringic acid, m/z 239 for dehydroabieticacid,m/z 219 and 203 for 2-methylglyceric acid,m/z 219 and 277 for2-methyltetrols, m/z 231 for C5-alkene triols, m/z 171 for pinonicand pinic acids, m/z 349 for 3-hydroxyglutaric acid, m/z 405 for 3-methyl-1, 2, 3-butanetricarboxylic acid (MBTCA), and m/z 383 forb-caryophyllinic acid. Most of the GC/MS response factors weredetermined using authentic standards. Because of the lack ofauthentic standards for some SOA tracers, 2-methylglyceric acid, 3-methyl-1, 2, 3-butanetricarboxylic acid and b-caryophyllinic acidwere estimated using glyceric acid, malic acid and pinic acid assurrogate standards, respectively. Blank filters were analyzed bythe procedure used for the real samples. The results showed nocontamination for any target compound. Recoveries for the stan-dards were generally better than 80%. Relative standard deviationof the concentrations based on duplicate analysis was generally<10% (Fu et al., 2011).
3. Results and discussion
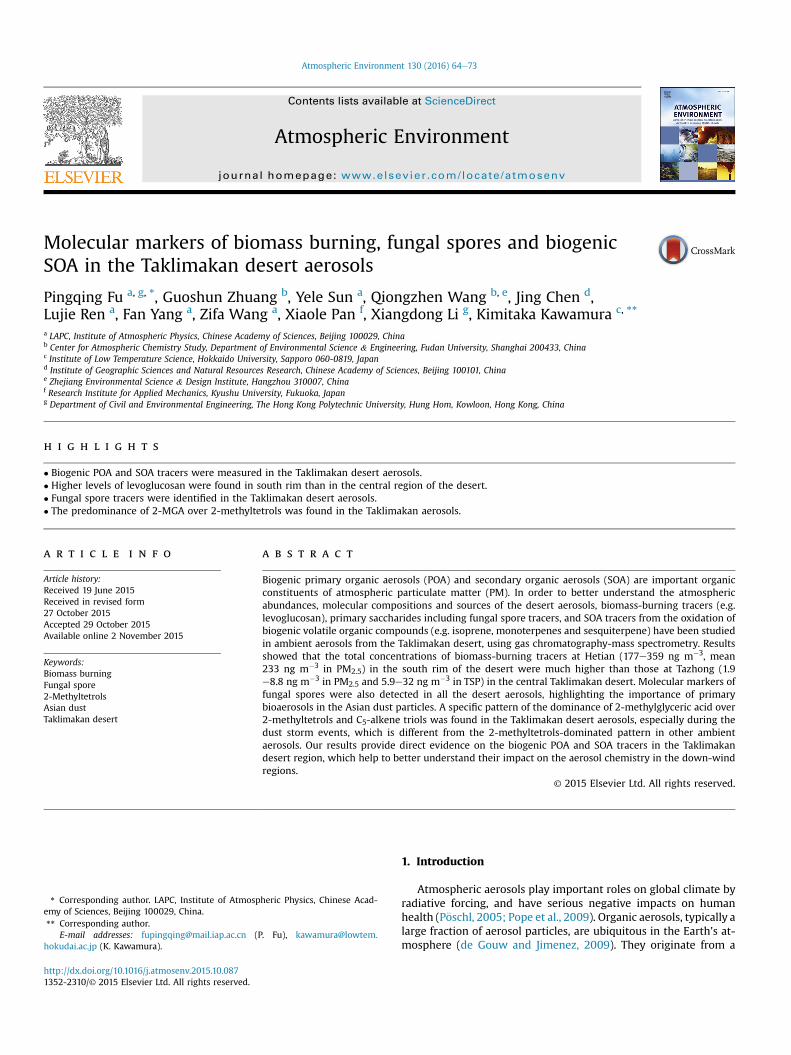
Table S1 presents the concentrations of organic marker com-pounds, together with some water-soluble inorganic ionsmeasured in the Taklimakan aerosols. Fig. 3 shows the abundancesof organic compound classes in different aerosol types. In general,the total concentrations of biomass-burning tracers in PM2.5 sam-ples were roughly two orders of magnitude higher at Hetian(177e359 ng m�3) than those at Tazhong (1.9e8.8 ng m�3),
indicating that biomass burning is more significant in the south rim(the Hetian site) than the central region (the Tazhong site) of theTaklimakan desert. Sugars/sugar alcohols, monoterpene SOAtracers and the sesquiterpene-SOA tracer were also more abundantat Hetian than those at Tazhong. However, the concentrations ofisoprene SOA tracers in fine samples (PM2.5) at Tazhong werehigher than those at Hetian. Total water-soluble inorganic ions inPM2.5 samples at Tazhong were double those at Hetian (Table 1),while the concentrations of NH4
þ and NO3e were higher at Hetian
than those at Tazhong, probably due to the higher anthropogenicemissions (e.g., traffic emission and agricultural emission) at theurban site of Hetian.
3.1. Biomass burning tracers
Levoglucosan (1,6-anhydro-b-D-glucopyranose), a specificbiomass-burning tracer formed by the pyrolysis of cellulose andhemicellulose (Simoneit et al., 1999; Simoneit, 2002), is consideredas the largest source of primary, fine organic aerosols in the atmo-sphere (Bond et al., 2004). It is water-soluble and thus contributes towater-soluble organic carbon (WSOC) contained in aerosol particles.During the study period, the concentrations of levoglucosan in PM2.5samples ranged from 148 to 313 ng m�3 with an average of198 ng m�3 at Hetian, which were consistent with those reported infourteen Chinese megacities (Wang et al., 2006). Such a high level oflevoglucosan at Hetian indicates that biomass-burning emissionshould be a significant source of organic aerosols in the south rim ofthe Taklimakan desert. Another possible source is the long-rangetransport of atmospheric aerosols from the regions in the MiddleEast and South Asia (Fig. S1) to Hetian. A recent study reported thatbiomass burning aerosols in these regions can even penetrate theHimalayas to its north slope (Cong et al., 2015). In the central region(Tazhong) of the Taklimakan desert, however, the concentrations oflevoglucosan in PM2.5 samples were only 0.99e5.3 ng m�3 (mean2.6 ng m�3) (Tables 1 and 3). During the same sampling period, thelevels of levoglucosan in TSP were 3.0e14 ng m�3 (5.9 ng m�3). Theatmospheric levels of levoglucosan in the central regions of the

Fig. 2. CALIOP lidar transects across the Taklimakan desert during the sampling period (on 16 April, 18 April, and 20 April 2008, respectively) show the main aerosol types derivedfrom the CALIOP observation. The inner panels in the figures show the orbit tracks across the sampling region and adjacent areas.
P. Fu et al. / Atmospheric Environment 130 (2016) 64e73 67
Taklimakan desert are comparable with those reported in remotecontinental and marine regions, and one order of magnitude higherthan those in the polar regions (Table 2).
Galactosan and mannosan, the isomers of levoglucosan, wereidentified in all the desert samples (Table S1). They are thermaldecomposition products of hemicellulose, whereas levoglucosan isa thermal decomposition product of cellulose (Simoneit, 2002).Hard wood contains higher amount of cellulose than hemicellulose.Thus, the concentration ratio of levoglucosan to mannosan (L/M)can be used to differentiate hard wood (angiosperm) and soft wood(gymnosperm) burning (Simoneit, 2002; Schmidl et al., 2008;Verma et al., 2015). Previous studies have reported that L/M ra-tios from crop-residue burning are generally >40; L/M ratios fromhardwood burning are in a range of 15e25 and those of softwoodare 3e10 (Schmidl et al., 2008; Engling et al., 2009; Fu et al., 2012a;Mkoma et al., 2013). For example, high L/M ratios were reported forsmoke aerosols from chamber burning of rice straw (40e42)(Engling et al., 2009) and high mountain aerosols affected by thesevere field burning of wheat straw (40e46) in the North ChinaPlain (Fu et al., 2012a). At the Hetian site, the L/M ratios ranged from25 to 35, which were similar between FD and ND periods. At the
Tazhong site, the L/M ratios varied from 23 to 59 and 33 to 60 inPM2.5 and TSP samples, respectively. Thus, high L/M ratios (23e60)found in the present study suggest that crop residues, herbaceousplants and hardwood are the dominant types of fuels burned in theTaklimakan region.
Phenolic compounds produced from lignin combustion werealso measured in the Taklimakan aerosols, including vanillin,vanillic acid, syringic acid and dehydroabietic acid (Table S1). Theburning products of hardwood lignin are enriched in vanillic acid,vanillin, and syringic acid; the burning of softwood generally pro-duces vanillin, homovanillic acid, vanillic acid and so on; and theburning of grasses mainly produces syringic acid, vanillin andvanillic acid (Oros and Simoneit, 2001b, a; Oros et al., 2006). 4-Hydroxybenzoic acid is produced by the burning of grasses andother non-woody vegetation (Simoneit, 2002); its concentrationsin the PM2.5 samples in Hetian (6.4e9.9 ngm�3) were about twentytimes higher than those (0.11e0.57 ng m�3) in Tazhong. Dehy-droabietic acid, a more specific biomass-burning tracer of coniferresin, was also detected in all the desert aerosol samples withhigher levels at Hetian than at Tazhong (Table S1). However, ratiosof vanillin to dehydroabietic acid (Vani/Dehy) in the Hetian PM2.5
0.01
0.1
1
10
100
1000 1
2
3
Con
cent
ratio
n (n
g m
)Biom
ass-b
urnin
g tra
cers
Sugar
s & su
gar a
lcoho
ls
Isopr
ene S
OA tra
cers
Monote
rpen
e SOA
trace
rs
Sesqu
iterp
ene S
OA tra
cers
Tazhong TSP
Tazhong PM2.5
Hetian PM2.5
Fig. 3. Concentrations of organic compound classes measured in the Taklimakandesert aerosols.
ditions.
Ca
Al
Ca/Al
[SO42�
]/[M
](%)
[SO42�
]/[A
l][SO42�
]/[Fe]
[NO3�]/[Fe]
[SO42�
]/[N
O3�]
549
3e10
7027
2e66
91.6e
1.8
3.3e
3.8
0.56
e1.3
1.1e
2.4
0.02
e0.04
56e62
.317
8e18
511
0e14
71.2e
1.7
0.94
e1.1
0.32
e0.33
0.40
e0.75
0.01
0e0.01
441
e53
93.3
67.9
1.4
2.5
0.75
1.5
0.07
2455
.643
.11.3
0.87
0.13
0.19
0.03
35.6
311
.6e32
.57.2e
22.1
1.5e
1.6
4.1e
5.8
0.48
e0.87
0.87
e1.3
0.12
e0.29
4.4e
7.4
8.7e
13.4
5.4e
9.6
1.4e
1.6
3.3e
4.0
0.23
e0.40
0.28
e0.49
0.01
0e0.01
425
e29
65.1e
20.3
3.9e
17.1
1.2e
1.3
4.9e
7.2
1.1e
1.6
1.6e
2.0
0.10
e0.26
7.7e
164.5e
12.5
3.5e
9.9
1.2e
1.3
4.3e
6.3
0.87
e1.4
1.1e
1.8
0.28
e0.55
3.3e
4.1
P. Fu et al. / Atmospheric Environment 130 (2016) 64e7368
aerosols (1.2e3.1) are similar to those (1.1e2.6) in Tazhong PM2.5aerosols, suggesting that similar types of biofuels arewidely used inthe Taklimakan region.
Table
1Con
centrations( mgm
�3)of
aerosolmass[M
]an
dinorga
nic
ionsan
dhea
vymetalsduringdifferentdust
con
Location
Period
aSa
mple
[M]
SO42�
NO3�
Cle
Naþ
Fe
Tazh
ong
DS
TSP(n
¼2)
9120
e11
,300
348e
372
6.0e
6.2
395e
405
297e
370
143e
31PM
2.5(n
¼2)
3760
e42
3035
.5e48
.50.86
e0.90
26.0e40
.017
.9e36
.264
.4e89
FDTS
P(n
¼1)
2040
50.8
2.2
36.6
24.7
33.0
PM2.5(n
¼1)
664
5.8
1.0
4.6
3.6
30.9
ND
TSP(n
¼2)
108e
260
6.3e
10.7
1.4e
1.4
4.1e
8.9
3.5e
5.9
4.9e
12.
PM2.5(n
¼2)
53.8e65
.52.1e
2.2
0.07
e0.09
1.6e
1.9
1.4e
1.6
5.4e
7.8
Hetian
FDPM
2.5(n
¼2)
132e
263
6.4e
19.0
0.84
e1.2
4.0e
8.2
3.6e
8.9
3.2e
11.
ND
PM2.5(n
¼2)
79.9e20
35.1e
8.6
1.5e
2.1
3.9e
4.8
3.3e
4.7
2.8e
7.6
aDS¼
dust
storm
period;FD
¼floa
tingdust
period;ND
¼non
-dust
period.
3.2. Sugars and sugar alcohols
Primary saccharides consisting of arabinose, fructose, glucose,sucrose, and trehalose, as well as some sugar polyols includingarabitol, mannitol, and inositol were detected in the Taklimakanaerosols (Table S1). Sucrose was the dominant sugar compoundfound in the samples, followed by glucose and fructose (Fig. 4).Fructose and glucose originate from numerous primary biogenicsources, such as terrestrial plant pollen, fruits and detritus(Speranza et al., 1997). Sucrose is the dominant component ofairborne pollen grains (Pacini, 2000; Fu et al., 2012b); it plays a keyrole in plant flowering processes. Furthermore, their concentra-tions were much higher in the TSP samples than those in the fineaerosol particles (Fig. 4). In a previous study at the Gosan site, JejuIsland, Fu et al. (2012b) reported that sucrose is the dominantspecies among the detected saccharides with a maximum con-centration up to 1390 ng m�3 in April. The high abundance of su-crose, together with fructose and glucose observed in TSP atTazhong, suggests a significant contribution of airborne pollengrains to aerosol loadings in the Taklimakan desert in April.
Arabitol and mannitol are tracers for airborne fungal spores(Bauer et al., 2008). Their concentrations were higher at Hetianthan those at Tazhong (Fig. 4), suggesting that primary bioaerosolssuch as fungal spores are relatively minor in the central Taklimakanregion. By comparison with those reported in previous studies, theatmospheric levels of arabitol and mannitol in the Taklimakan re-gion were similar to those in remote marine aerosols (Table 2),representing the background level of fungal spores in the Earth'satmosphere. Interestingly, higher concentrations of arabitol thanmannitol were observed in the present study; such a pattern was
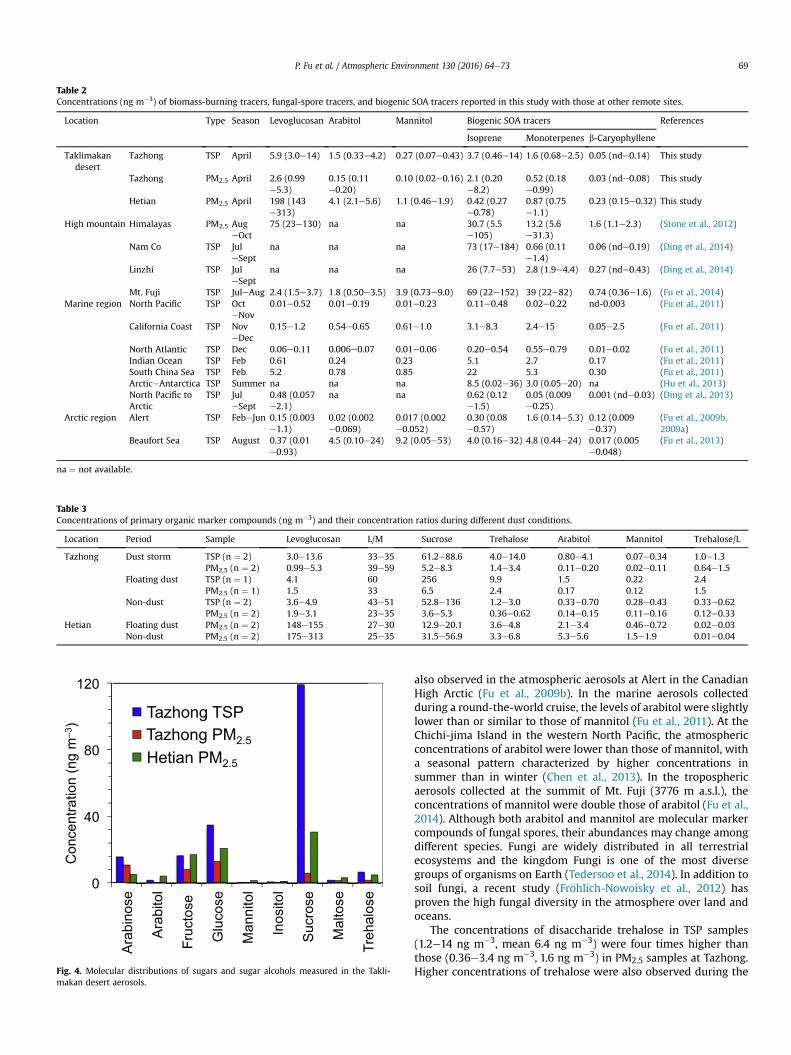
Table 2Concentrations (ng m�3) of biomass-burning tracers, fungal-spore tracers, and biogenic SOA tracers reported in this study with those at other remote sites.
Location Type Season Levoglucosan Arabitol Mannitol Biogenic SOA tracers References
Isoprene Monoterpenes b-Caryophyllene
Taklimakandesert
Tazhong TSP April 5.9 (3.0e14) 1.5 (0.33e4.2) 0.27 (0.07e0.43) 3.7 (0.46e14) 1.6 (0.68e2.5) 0.05 (nde0.14) This study
Tazhong PM2.5 April 2.6 (0.99e5.3)
0.15 (0.11e0.20)
0.10 (0.02e0.16) 2.1 (0.20e8.2)
0.52 (0.18e0.99)
0.03 (nde0.08) This study
Hetian PM2.5 April 198 (143e313)
4.1 (2.1e5.6) 1.1 (0.46e1.9) 0.42 (0.27e0.78)
0.87 (0.75e1.1)
0.23 (0.15e0.32) This study
High mountain Himalayas PM2.5 AugeOct
75 (23e130) na na 30.7 (5.5e105)
13.2 (5.6e31.3)
1.6 (1.1e2.3) (Stone et al., 2012)
Nam Co TSP JuleSept
na na na 73 (17e184) 0.66 (0.11e1.4)
0.06 (nde0.19) (Ding et al., 2014)
Linzhi TSP JuleSept
na na na 26 (7.7e53) 2.8 (1.9e4.4) 0.27 (nde0.43) (Ding et al., 2014)
Mt. Fuji TSP JuleAug 2.4 (1.5e3.7) 1.8 (0.50e3.5) 3.9 (0.73e9.0) 69 (22e152) 39 (22e82) 0.74 (0.36e1.6) (Fu et al., 2014)Marine region North Pacific TSP Oct
eNov0.01e0.52 0.01e0.19 0.01e0.23 0.11e0.48 0.02e0.22 nd-0.003 (Fu et al., 2011)
California Coast TSP NoveDec
0.15e1.2 0.54e0.65 0.61e1.0 3.1e8.3 2.4e15 0.05e2.5 (Fu et al., 2011)
North Atlantic TSP Dec 0.06e0.11 0.006e0.07 0.01e0.06 0.20e0.54 0.55e0.79 0.01e0.02 (Fu et al., 2011)Indian Ocean TSP Feb 0.61 0.24 0.23 5.1 2.7 0.17 (Fu et al., 2011)South China Sea TSP Feb 5.2 0.78 0.85 22 5.3 0.30 (Fu et al., 2011)ArcticeAntarctica TSP Summer na na na 8.5 (0.02e36) 3.0 (0.05e20) na (Hu et al., 2013)North Pacific toArctic
TSP JuleSept
0.48 (0.057e2.1)
na na 0.62 (0.12e1.5)
0.05 (0.009e0.25)
0.001 (nde0.03) (Ding et al., 2013)
Arctic region Alert TSP FebeJun 0.15 (0.003e1.1)
0.02 (0.002e0.069)
0.017 (0.002e0.052)
0.30 (0.08e0.57)
1.6 (0.14e5.3) 0.12 (0.009e0.37)
(Fu et al., 2009b,2009a)
Beaufort Sea TSP August 0.37 (0.01e0.93)
4.5 (0.10e24) 9.2 (0.05e53) 4.0 (0.16e32) 4.8 (0.44e24) 0.017 (0.005e0.048)
(Fu et al., 2013)
na ¼ not available.
Table 3Concentrations of primary organic marker compounds (ng m�3) and their concentration ratios during different dust conditions.
Location Period Sample Levoglucosan L/M Sucrose Trehalose Arabitol Mannitol Trehalose/L
Tazhong Dust storm TSP (n ¼ 2) 3.0e13.6 33e35 61.2e88.6 4.0e14.0 0.80e4.1 0.07e0.34 1.0e1.3PM2.5 (n ¼ 2) 0.99e5.3 39e59 5.2e8.3 1.4e3.4 0.11e0.20 0.02e0.11 0.64e1.5
Floating dust TSP (n ¼ 1) 4.1 60 256 9.9 1.5 0.22 2.4PM2.5 (n ¼ 1) 1.5 33 6.5 2.4 0.17 0.12 1.5
Non-dust TSP (n ¼ 2) 3.6e4.9 43e51 52.8e136 1.2e3.0 0.33e0.70 0.28e0.43 0.33e0.62PM2.5 (n ¼ 2) 1.9e3.1 23e35 3.6e5.3 0.36e0.62 0.14e0.15 0.11e0.16 0.12e0.33
Hetian Floating dust PM2.5 (n ¼ 2) 148e155 27e30 12.9e20.1 3.6e4.8 2.1e3.4 0.46e0.72 0.02e0.03Non-dust PM2.5 (n ¼ 2) 175e313 25e35 31.5e56.9 3.3e6.8 5.3e5.6 1.5e1.9 0.01e0.04
0
40
80
120
Ara
bino
se
Ara
bito
l
Fruc
tose
Glu
cose
Man
nito
l
Inos
itol
Suc
rose
Mal
tose
Treh
alos
e
1 2 3
Tazhong TSPTazhong PM2.5
Hetian PM2.5
Con
cent
ratio
n (n
g m
)
Fig. 4. Molecular distributions of sugars and sugar alcohols measured in the Takli-makan desert aerosols.
P. Fu et al. / Atmospheric Environment 130 (2016) 64e73 69
also observed in the atmospheric aerosols at Alert in the CanadianHigh Arctic (Fu et al., 2009b). In the marine aerosols collectedduring a round-the-world cruise, the levels of arabitol were slightlylower than or similar to those of mannitol (Fu et al., 2011). At theChichi-jima Island in the western North Pacific, the atmosphericconcentrations of arabitol were lower than those of mannitol, witha seasonal pattern characterized by higher concentrations insummer than in winter (Chen et al., 2013). In the troposphericaerosols collected at the summit of Mt. Fuji (3776 m a.s.l.), theconcentrations of mannitol were double those of arabitol (Fu et al.,2014). Although both arabitol and mannitol are molecular markercompounds of fungal spores, their abundances may change amongdifferent species. Fungi are widely distributed in all terrestrialecosystems and the kingdom Fungi is one of the most diversegroups of organisms on Earth (Tedersoo et al., 2014). In addition tosoil fungi, a recent study (Fr€ohlich-Nowoisky et al., 2012) hasproven the high fungal diversity in the atmosphere over land andoceans.
The concentrations of disaccharide trehalose in TSP samples(1.2e14 ng m�3, mean 6.4 ng m�3) were four times higher thanthose (0.36e3.4 ng m�3, 1.6 ng m�3) in PM2.5 samples at Tazhong.Higher concentrations of trehalose were also observed during the
P. Fu et al. / Atmospheric Environment 130 (2016) 64e7370
DS period than FD and ND periods (Table 3). Trehalose is present ina variety of microorganisms (fungi, bacteria and yeast), and a fewspecies of higher plants and invertebrates (Medeiros et al., 2006).As a fungal metabolite, the enrichment of trehalose in aerosolparticles is frequently accompanied by the resuspension of soilparticles (Simoneit et al., 2004; Feng and Simpson, 2007) and un-paved road dust (Simoneit et al., 2004). High abundance of treha-lose in marine aerosols observed at the Gosan site in MarcheAprilwas related to the Asian dust events (Fu et al., 2012b), indicating theimportance of soil resuspension/dust aerosols as the source.
The biogeographic distribution of primary biological aerosolsare relevant for the Earth system, climate, and pubic health on local,regional and global scales (Fr€ohlich-Nowoisky et al., 2012). Here,the atmospheric concentrations of molecular markers for primarybioaerosols over the Taklimakan desert are comparable to thoseover marine regions, which highlights their importance in theprocess of cloud formation and precipitation over the desert regionbecause fungal spores and other bioaerosols are considered to berelevant as ice nuclei or giant cloud condensation nuclei (Christneret al., 2008; Pratt et al., 2009). Furthermore, dust aerosols con-taining biological particles such as pollen could be recorded in icecores of inland glaciers via the long-range atmospheric transportand deposition, which provides useful information on the dustevents together with the regional biological diversity in the history.
3.3. Biogenic SOA tracers
Went (1960) reported that the oxidation of VOCs emitted fromforests could lead to the formation of organic aerosols. Since then,considerable efforts have been devoted to understanding the for-mation processes of SOA from biogenic VOCs, including isoprene,monoterpenes, sesquiterpenes, and oxygenated hydrocarbons (e.g.alcohols, aldehydes and ketones) through field observations andchamber and modeling studies (Hallquist et al., 2009 and refer-ences therein). Despite its large flux, isoprene had not beengenerally considered to be an SOA precursor due to the high vola-tility of its known reaction products. Claeys et al. (2004) firstidentified two diastereoisomeric 2-methyltetrols as oxidationproducts of isoprene in the Amazonian rain forest aerosols. Sincethen, these compounds have been detected in ambient aerosolsamples from different geographical locations in the world(Kleindienst et al., 2007; Hu et al., 2008; Fu et al., 2009a; Hallquistet al., 2009; Kourtchev et al., 2009; Hu et al., 2013). However todate, little is known about the biogenic SOA tracers includingisoprene oxidation products in desert regions.
Six compounds were identified as isoprene SOA tracers in theTaklimakan desert aerosols, i.e., 2-methylglyceric acid, three C5-alkene triols, and two 2-methyltetrols (2-methylthreitol and 2-methylerythritol). 3-Methyltetrahydrofuran-3, 4-diols, which havebeen proposed to be formed through the acid-catalyzed intra-molecular rearrangement of isoprene epoxydiols under low-NOxconditions (Lin et al., 2012), were not detectable in these samples.The concentrations of 2-methylthreitol and 2-methylerythritolwere very low in the PM2.5 samples at Tazhong, ranging from0.005 to 0.017 ng m�3 (mean 0.009 ng m�3) and0.007e0.036 ngm�3 (0.017 ngm�3), respectively. This is reasonablebecause the Taklimakan desert is located in the hinterland of theAsian continent and has little water; very few oasis towns arelocated in the north, east and south regions of the desert includingHetian, where the concentrations of 2-methyltetrols (the sum of 2-methylthreitol and 2-methylerythritol, 0.22 ng m�3) were aboutten times higher than those at Tazhong (0.025 ng m�3) in thecentral Taklimakan desert. In addition, relatively high concentra-tions of 2-methylthreitol and 2-methylerythritol were found atHetian with average concentrations of 0.078 ng m�3 and
0.15 ngm�3, respectively. The concentrations of 2-methyltetrols aresimilar to those (mean 0.074 ng m�3) reported in Canadian HighArctic aerosols collected at Alert during winter and spring (Fu et al.,2009a), and are 1e3 orders of magnitude lower than those reportedin urban and forest aerosols in low-to mid-latitudes (Wang et al.,2005; Kleindienst et al., 2007; Ding et al., 2014).
C5-alkene triols, which are reported as photooxidation productsof isoprene (Wang et al., 2005), were detected in all the sampleswith the concentration range of 0.003e0.071 ng m�3 (Table S1). 2-Methylglyceric acid (2-MGA) is possibly formed by further oxida-tion of methacrolein and methacrylic acid. The concentrations of 2-MGA in the desert aerosols were much higher at Tazhong than atHetian (Table S1).
The detected monoterpene oxidation products include pinonicacid, pinic acid, 3-hydroxyglutaric acid (3-HGA), and 3-methyl-1, 2,3-butanetricarboxylic acid (MBTCA). Total concentrations ofmonoterpene SOA tracers in PM2.5 samples ranged from 0.18 to0.99 ng m�3 (0.52 ng m�3) at Tazhong versus 0.75e1.1 ng m�3
(0.87 ng m�3) at Hetian. The formation of MBTCA can be explainedby further reaction of cis-pinonic acid with OH radical (Szmigielskiet al., 2007), thus it has been considered as a higher-generationproduct. However, MBTCA (mean 0.001 ng m�3) was only detect-able at a trace level among the TSP samples at Tazhong. In remotemarine aerosols over the Pacific and Atlantic Oceans, MBTCA wasfound to be less significant than those in the coastal aerosols (Fuet al., 2011), which suggests that MBTCA is not a dominant spe-cies in the pristine environments.
The emission of b-caryophyllene, one of the dominant sesqui-terpenes, varies significantly between vegetation species (Duhlet al., 2008). Concentrations of b-caryophyllinic acid, formedeither by ozonolysis or photo-oxidation of b-caryophyllene rapidlyin the atmosphere, were found to be up to 0.32 ng m�3 at Hetian,which are several times higher than those at Tazhong, being similarto the results of other biogenic SOA tracers. Such a temporal patterncan be explained by the stronger influence of biogenic VOCsemitted from vegetation near Hetian rather than Tazhong. Thethree-day back trajectories also showed that the air masses mainlyoriginated from the southwest via mountain regions to the Hetiansite (Fig. S1).
3.4. Specific distribution patterns of isoprene SOA tracers in theTaklimakan aerosols
Previous field measurements have often shown the predomi-nance of 2-methyltetrols among the isoprene SOA tracers. Forexample, in a recent study on the spatial distributions of biogenicSOA tracers over China in summer, Ding et al. (2014) reported a 2-methyltetrols-dominated pattern with the ratios of 2-methylglyceric acid to 2-methyltetrols (2-MGA/2-MTs) to belower than 1, which is consistent with field observations in otherplaces (Kleindienst et al., 2007; Kourtchev et al., 2009). However,Fig. 5 clearly shows that 2-MGAwas by far the dominant species inthe Tazhong aerosol samples, followed by 2-methyltetrols and C5-alkene triols. Furthermore, the relative abundance of 2-MGA waseven enhanced during DS; the contribution of 2-methylglycericacid to the sum of isoprene SOA tracers was up to 99% during DS.By contrast, the pattern of relative abundance at Hetian in the southrim of the desert differ from that at Tazhong during ND, where 2-methyltetrols are the dominant species, followed by 2-MGA andC5-alkene triols, being similar to those in marine aerosols collectedduring a round-the-world cruise (Fu et al., 2011). In addition, therelative abundance of 2-MGAwas also strongly enhanced at Hetianduring FD (Fig. 5).
The predominance of 2-MGA in the Taklimakan desert region,especially during FD and DS periods, suggests that its formation
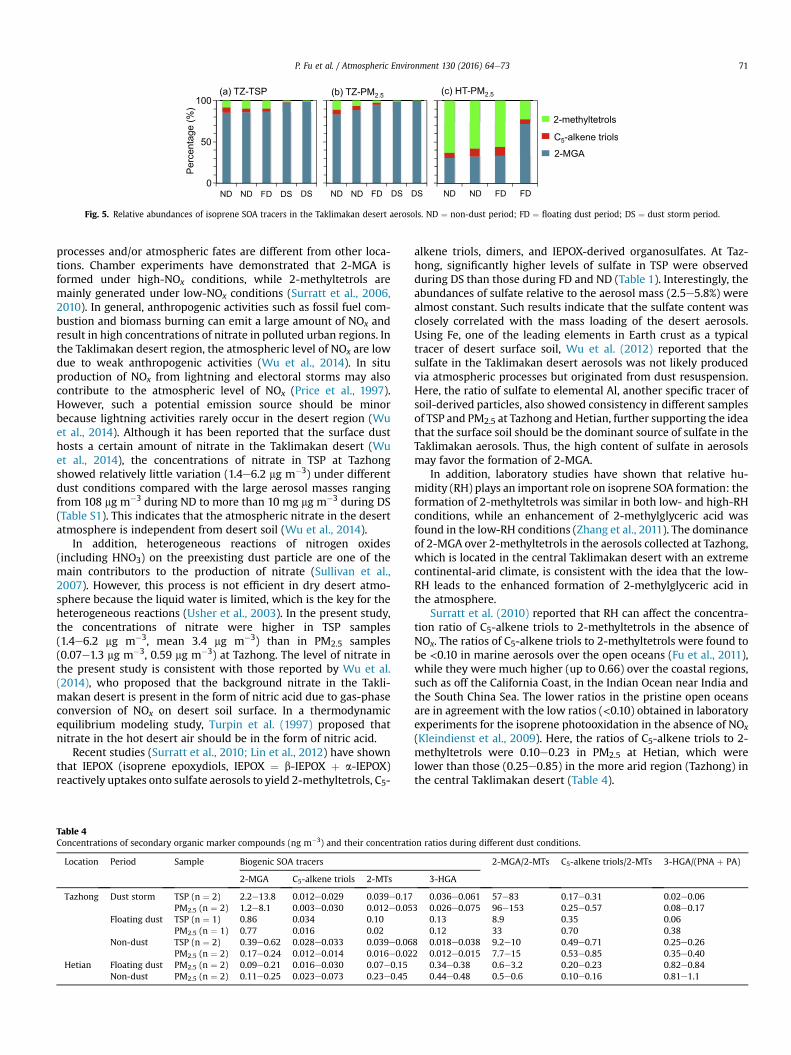
Fig. 5. Relative abundances of isoprene SOA tracers in the Taklimakan desert aerosols. ND ¼ non-dust period; FD ¼ floating dust period; DS ¼ dust storm period.
P. Fu et al. / Atmospheric Environment 130 (2016) 64e73 71
processes and/or atmospheric fates are different from other loca-tions. Chamber experiments have demonstrated that 2-MGA isformed under high-NOx conditions, while 2-methyltetrols aremainly generated under low-NOx conditions (Surratt et al., 2006,2010). In general, anthropogenic activities such as fossil fuel com-bustion and biomass burning can emit a large amount of NOx andresult in high concentrations of nitrate in polluted urban regions. Inthe Taklimakan desert region, the atmospheric level of NOx are lowdue to weak anthropogenic activities (Wu et al., 2014). In situproduction of NOx from lightning and electoral storms may alsocontribute to the atmospheric level of NOx (Price et al., 1997).However, such a potential emission source should be minorbecause lightning activities rarely occur in the desert region (Wuet al., 2014). Although it has been reported that the surface dusthosts a certain amount of nitrate in the Taklimakan desert (Wuet al., 2014), the concentrations of nitrate in TSP at Tazhongshowed relatively little variation (1.4e6.2 mg m�3) under differentdust conditions compared with the large aerosol masses rangingfrom 108 mg m�3 during ND to more than 10 mg mg m�3 during DS(Table S1). This indicates that the atmospheric nitrate in the desertatmosphere is independent from desert soil (Wu et al., 2014).
In addition, heterogeneous reactions of nitrogen oxides(including HNO3) on the preexisting dust particle are one of themain contributors to the production of nitrate (Sullivan et al.,2007). However, this process is not efficient in dry desert atmo-sphere because the liquid water is limited, which is the key for theheterogeneous reactions (Usher et al., 2003). In the present study,the concentrations of nitrate were higher in TSP samples(1.4e6.2 mg m�3, mean 3.4 mg m�3) than in PM2.5 samples(0.07e1.3 mg m�3, 0.59 mg m�3) at Tazhong. The level of nitrate inthe present study is consistent with those reported by Wu et al.(2014), who proposed that the background nitrate in the Takli-makan desert is present in the form of nitric acid due to gas-phaseconversion of NOx on desert soil surface. In a thermodynamicequilibrium modeling study, Turpin et al. (1997) proposed thatnitrate in the hot desert air should be in the form of nitric acid.
Recent studies (Surratt et al., 2010; Lin et al., 2012) have shownthat IEPOX (isoprene epoxydiols, IEPOX ¼ b-IEPOX þ a-IEPOX)reactively uptakes onto sulfate aerosols to yield 2-methyltetrols, C5-
Table 4Concentrations of secondary organic marker compounds (ng m�3) and their concentrati
Location Period Sample Biogenic SOA tracers
2-MGA C5-alkene triols 2-MTs
Tazhong Dust storm TSP (n ¼ 2) 2.2e13.8 0.012e0.029 0.039e0.17PM2.5 (n ¼ 2) 1.2e8.1 0.003e0.030 0.012e0.05
Floating dust TSP (n ¼ 1) 0.86 0.034 0.10PM2.5 (n ¼ 1) 0.77 0.016 0.02
Non-dust TSP (n ¼ 2) 0.39e0.62 0.028e0.033 0.039e0.06PM2.5 (n ¼ 2) 0.17e0.24 0.012e0.014 0.016e0.02
Hetian Floating dust PM2.5 (n ¼ 2) 0.09e0.21 0.016e0.030 0.07e0.15Non-dust PM2.5 (n ¼ 2) 0.11e0.25 0.023e0.073 0.23e0.45
alkene triols, dimers, and IEPOX-derived organosulfates. At Taz-hong, significantly higher levels of sulfate in TSP were observedduring DS than those during FD and ND (Table 1). Interestingly, theabundances of sulfate relative to the aerosol mass (2.5e5.8%) werealmost constant. Such results indicate that the sulfate content wasclosely correlated with the mass loading of the desert aerosols.Using Fe, one of the leading elements in Earth crust as a typicaltracer of desert surface soil, Wu et al. (2012) reported that thesulfate in the Taklimakan desert aerosols was not likely producedvia atmospheric processes but originated from dust resuspension.Here, the ratio of sulfate to elemental Al, another specific tracer ofsoil-derived particles, also showed consistency in different samplesof TSP and PM2.5 at Tazhong and Hetian, further supporting the ideathat the surface soil should be the dominant source of sulfate in theTaklimakan aerosols. Thus, the high content of sulfate in aerosolsmay favor the formation of 2-MGA.
In addition, laboratory studies have shown that relative hu-midity (RH) plays an important role on isoprene SOA formation: theformation of 2-methyltetrols was similar in both low- and high-RHconditions, while an enhancement of 2-methylglyceric acid wasfound in the low-RH conditions (Zhang et al., 2011). The dominanceof 2-MGA over 2-methyltetrols in the aerosols collected at Tazhong,which is located in the central Taklimakan desert with an extremecontinental-arid climate, is consistent with the idea that the low-RH leads to the enhanced formation of 2-methylglyceric acid inthe atmosphere.
Surratt et al. (2010) reported that RH can affect the concentra-tion ratio of C5-alkene triols to 2-methyltetrols in the absence ofNOx. The ratios of C5-alkene triols to 2-methyltetrols were found tobe <0.10 in marine aerosols over the open oceans (Fu et al., 2011),while they were much higher (up to 0.66) over the coastal regions,such as off the California Coast, in the Indian Ocean near India andthe South China Sea. The lower ratios in the pristine open oceansare in agreement with the low ratios (<0.10) obtained in laboratoryexperiments for the isoprene photooxidation in the absence of NOx
(Kleindienst et al., 2009). Here, the ratios of C5-alkene triols to 2-methyltetrols were 0.10e0.23 in PM2.5 at Hetian, which werelower than those (0.25e0.85) in the more arid region (Tazhong) inthe central Taklimakan desert (Table 4).
on ratios during different dust conditions.
2-MGA/2-MTs C5-alkene triols/2-MTs 3-HGA/(PNA þ PA)
3-HGA
0.036e0.061 57e83 0.17e0.31 0.02e0.063 0.026e0.075 96e153 0.25e0.57 0.08e0.17
0.13 8.9 0.35 0.060.12 33 0.70 0.38
8 0.018e0.038 9.2e10 0.49e0.71 0.25e0.262 0.012e0.015 7.7e15 0.53e0.85 0.35e0.40
0.34e0.38 0.6e3.2 0.20e0.23 0.82e0.840.44e0.48 0.5e0.6 0.10e0.16 0.81e1.1

P. Fu et al. / Atmospheric Environment 130 (2016) 64e7372
4. Conclusions
Molecular markers of biomass burning, fungal spores, andbiogenic secondary organic aerosols were studied for aerosolsamples collected at Tazhong (TSP and PM2.5) and Hetian (PM2.5) inthe Taklimakan desert in April 2008. Total concentrations ofbiomass-burning tracers at Hetian (177e359 ng m�3, mean233 ng m�3) in the south rim of the desert were much higher thanthose (1.9e8.8 ng m�3 in PM2.5 versus 5.9e32 ng m�3 in TSP) atTazhong in the central Taklimakan desert. This study demonstratedthat biomass-burning activities in the Asian arid region are on abackground level. The concentrations of molecular markers forprimary bioaerosols such as fungal spores in the Taklimakan desertaerosols are lower than or similar to those reported in remotemarine regions. Total concentrations of biogenic SOA tracers in thePM2.5 samples fromHetian (1.2e2.1 ngm�3, mean 1.5 ngm�3) werelower than those (0.71e9.2 ng m�3, 2.7 ng m�3) at Tazhong. Amongthe isoprene SOA tracers, the concentrations of 2-methylglycericacid were more abundant than those of 2-methyltetrols and C5-alkene triols in the Taklimakan desert aerosols. Such a predomi-nance of 2-methylglyceric acid in the desert aerosols was differentfrom the 2-methyltetrols-dominated pattern in ambient aerosolscollected from other geographical locations. Furthermore, theabundance of 2-methylglyceric acid relative to 2-methyltetrols wasenhanced during the dust storm period. Our results strongly sug-gest the unique formation processes of isoprene SOA tracers in thedesert region.
Acknowledgments
This study was partly supported by the Strategic PriorityResearch Program (B) of Chinese Academy of Sciences(XDB05030306), Chinese National Natural Science Foundation(41175106, 41475117, and 21277030) and the “One Hundred Tal-ents” program (P. Q. Fu) of the Chinese Academy of Sciences. Wealso appreciate the financial support from the Japan Society for thePromotion of Science through a grant-in-aid No. 24221001. TheCALIOP data were available from the Atmospheric Science DataCenter. We are grateful to two anonymous reviewers whose helpfulcomments and suggestions improved the manuscript.
Appendix A. Supplementary data
Supplementary data related to this article can be found at http://dx.doi.org/10.1016/j.atmosenv.2015.10.087.
References
Bauer, H., Claeys, M., Vermeylen, R., Schueller, E., Weinke, G., Berger, A.,Puxbaum, H., 2008. Arabitol and mannitol as tracers for the quantification ofairborne fungal spores. Atmos. Environ. 42, 588e593.
Bond, T.C., Streets, D.G., Yarber, K.F., Nelson, S.M., Woo, J.H., Klimont, Z., 2004.A technology-based global inventory of black and organic carbon emissionsfrom combustion. J. Geophys. Res. Atmos. 109 http://dx.doi.org/10.1029/2003JD003697.
Buseck, P., Posfai, M., 1999. Airborne minerals and related aerosol particles: effectson climate and the environment. Proc. Natl. Acad. Sci. U. S. A. 96, 3372e3379.
Bush, R.K., Portnoy, J.M., 2001. The role and abatement of fungal allergens in allergicdisease. J. Allergy Clin. Immunol. 107, S430eS440.
Chen, J., Kawamura, K., Liu, C.-Q., Fu, P.Q., 2013. Long-term observations of sac-charides in remote marine aerosols from the western North Pacific: a com-parison between 1990e1993 and 2006e2009 periods. Atmos. Environ. 67,448e458.
Christner, B.C., Morris, C.E., Foreman, C.M., Cai, R.M., Sands, D.C., 2008. Ubiquity ofbiological ice nucleators in snowfall. Science 319, 1214e1214.
Claeys, M., Graham, B., Vas, G., Wang, W., Vermeylen, R., Pashynska, V., Cafmeyer, J.,Guyon, P., Andreae, M.O., Artaxo, P., Maenhaut, W., 2004. Formation of sec-ondary organic aerosols through photooxidation of isoprene. Science 303,1173e1176.
Cong, Z.Y., Kawamura, K., Kang, S.C., Fu, P.Q., 2015. Penetration of biomass-burning
emissions from South Asia through the Himalayas: new insights from atmo-spheric organic acids. Sci. Rep. 5, 9580. http://dx.doi.org/10.9510.1038/srep09580.
de Gouw, J., Jimenez, J.L., 2009. Organic aerosols in the Earth's atmosphere. Environ.Sci. Technol. 43, 7614e7618.
DeMott, P.J., Prenni, A.J., McMeeking, G.R., Sullivan, R.C., Petters, M.D., Tobo, Y.,Niemand, M., Mohler, O., Snider, J.R., Wang, Z., Kreidenweis, S.M., 2015. Inte-grating laboratory and field data to quantify the immersion freezing icenucleation activity of mineral dust particles. Atmos. Chem. Phys. 15, 393e409.
Dentener, F., Kinne, S., Bond, T., et al., 2006. Emissions of primary aerosol andprecursor gases in the years 2000 and 1750 prescribed data-sets for AeroCom.Atmos. Chem. Phys. 6, 4321e4344.
Ding, X., Wang, X.M., Xie, Z.Q., Zhang, Z., Sun, L.G., 2013. Impacts of Siberian biomassburning on organic aerosols over the North Pacific Ocean and the Arctic: pri-mary and secondary organic tracers. Environ. Sci. Technol. 47, 3149e3157.
Ding, X., He, Q.-F., Shen, R.-Q., Yu, Q.-Q., Wang, X.-M., 2014. Spatial distributions ofsecondary organic aerosols from isoprene, monoterpenes, b-caryophyllene, andaromatics over China during summer. J. Geophys. Res. Atmos. 119, 11877e11891.http://dx.doi.org/10.1002/2014JD21748.
Duce, R.A., Unni, C.K., Ray, B.J., Prospero, J.M., Merrill, J.T., 1980. Long-range atmo-spheric transport of soil dust from Asia to the tropical North Pacific: temporalvariability. Science 209, 1522e1524.
Duhl, T.R., Helmig, D., Guenther, A., 2008. Sesquiterpene emissions from vegetation:a review. Biogeosciences 5, 761e777.
Engling, G., Lee, J.J., Tsai, Y.-W., Lung, S.-C.C., Chou, C.C.-K., Chan, C.-Y., 2009. Size-resolved anhydrosugar composition in smoke aerosol from controlled fieldburning of rice straw. Aerosol Sci. Technol. 43, 662e672.
Escudero, M., Viana, M., Querol, X., Alastuey, A., Díez Hern�andez, P., García DosSantos, S., Anzano, J., 2015. Industrial sources of primary and secondary organicaerosols in two urban environments in Spain. Environ. Sci. Pollut. Res. 22,10413e10424.
Falkovich, A.H., Schkolnik, G., Ganor, E., Rudich, Y., 2004. Adsorption of organiccompounds pertinent to urban environments onto mineral dust particles.J. Geophys. Res. Atmos. 109.
Feng, X.J., Simpson, M.J., 2007. The distribution and degradation of biomarkers inAlberta grassland soil profiles. Org. Geochem. 38, 1558e1570.
Fr€ohlich-Nowoisky, J., Burrows, S.M., Xie, Z., Engling, G., Solomon, P.A., Fraser, M.P.,Mayol-Bracero, O.L., Artaxo, P., Begerow, D., Conrad, R., Andreae, M.O.,Despr�es, V.R., P€oschl, U., 2012. Biogeopraphy in the air: fungal diversity overland and oceans. Biogeosciences 9, 1125e1136.
Fu, P.Q., Kawamura, K., Chen, J., Barrie, L.A., 2009a. Isoprene, monoterpene, andsesquiterpene oxidation products in the high Arctic aerosols during late winterto early summer. Environ. Sci. Technol. 43, 4022e4028.
Fu, P.Q., Kawamura, K., Barrie, L.A., 2009b. Photochemical and other sources oforganic compounds in the Canadian high Arctic aerosol pollution duringwinter-spring. Environ. Sci. Technol. 43, 286e292.
Fu, P.Q., Kawamura, K., Miura, K., 2011. Molecular characterization of marine organicaerosols collected during a round-the-world cruise. J. Geophys. Res. Atmos. 116,D13302. http://dx.doi.org/10.1029/2011JD015604.
Fu, P.Q., Kawamura, K., Chen, J., Li, J., Sun, Y.L., Liu, Y., Tachibana, E., Aggarwal, S.G.,Okuzawa, K., Tanimoto, H., Kanaya, Y., Wang, Z.F., 2012a. Diurnal variations oforganic molecular tracers and stable carbon isotopic composition in atmo-spheric aerosols over Mt. Tai in the North China Plain: an influence of biomassburning. Atmos. Chem. Phys. 12, 8359e8375.
Fu, P.Q., Kawamura, K., Kobayashi, M., Simoneit, B.R.T., 2012b. Seasonal variations ofsugars in atmospheric particulate matter from Gosan, Jeju Island: significantcontributions of airborne pollen and Asian dust in spring. Atmos. Environ. 55,234e239.
Fu, P.Q., Kawamura, K., Chen, J., Charri�ere, B., Semp�er�e, R., 2013. Organic molecularcomposition of marine aerosols over the Arctic Ocean in summer: contributionsof primary emission and secondary aerosol formation. Biogeosciences 10,653e667.
Fu, P.Q., Kawamura, K., Chen, J., Miyazaki, Y., 2014. Secondary production of organicaerosols from biogenic VOCs over Mt. Fuji, Japan. Environ. Sci. Technol. 48,8491e8497.
Ginoux, P., Chin, M., Tegen, I., Prospero, J.M., Holben, B., Dubovik, O., Lin, S.J., 2001.Sources and distributions of dust aerosols simulated with the GOCART model.J. Geophys. Res. Atmos. 106, 20255e20273.
Ginoux, P., Prospero, J.M., Gill, T.E., Hsu, N.C., Zhao, M., 2012. Global-scale attributionof anthropogenic and natural dust sources and their emission rates based onMODIS deep blue aerosol products. Rev. Geophys. 50, RG3005. http://dx.doi.org/10.1029/2012RG000388.
Graham, B., Guyon, P., Taylor, P.E., Artaxo, P., Maenhaut, W., Glovsky, M.M.,Flagan, R.C., Andreae, M.O., 2003. Organic compounds present in the naturalAmazonian aerosol: characterization by gas chromatography-mass spectrom-etry. J. Geophys. Res. Atmos. 108, D24. http://dx.doi.org/10.1029/2003JD003990.
Hallquist, M., Wenger, J.C., Baltensperger, U., et al., 2009. The formation, propertiesand impact of secondary organic aerosol: current and emerging issues. Atmos.Chem. Phys. 9, 5155e5235.
Hu, D., Bian, Q., Li, T.W.Y., Lau, A.K.H., Yu, J.Z., 2008. Contributions of isoprene,monoterpenes, b-caryophyllene, and toluene to secondary organic aerosols inHong Kong during the summer of 2006. J. Geophys. Res. Atmos. 113, D22206.http://dx.doi.org/10.1029/2008JD010437.
Hu, Q.-H., Xie, Z.-Q., Wang, X.-M., Kang, H., He, Q.-F., Zhang, P.F., 2013. Secondaryorganic aerosols over oceans via oxidation of isoprene and monoterpenes from

P. Fu et al. / Atmospheric Environment 130 (2016) 64e73 73
Arctic to Antarctic. Sci. Rep. 3, 2280e2286.Huang, J.P., Wang, T.H., Wang, W.C., Li, Z.Q., Yan, H.R., 2014. Climate effects of dust
aerosols over east Asian arid and semiarid regions. J. Geophys. Res. Atmos. 119,11398e11416.
Jaoui, M., Lewandowski, M., Kleindienst, T.E., Offenberg, J.H., Edney, E.O., 2007. b-Caryophyllinic acid: an atmospheric tracer for b-caryophyllene secondaryorganic aerosol. Geophys. Res. Lett. 34, L05816. http://dx.doi.org/10.1029/2006GL028827.
Kleindienst, T.E., Jaoui, M., Lewandowski, M., Offenberg, J.H., Lewis, C.W., Bhave, P.V.,Edney, E.O., 2007. Estimates of the contributions of biogenic and anthropogenichydrocarbons to secondary organic aerosol at a southeastern US location.Atmos. Environ. 41, 8288e8300.
Kleindienst, T.E., Lewandowski, M., Offenberg, J.H., Jaoui, M., Edney, E.O., 2009. Theformation of secondary organic aerosol from the isoprene þ OH reaction in theabsence of NOx. Atmos. Chem. Phys. 9, 6541e6558.
Kourtchev, I., Copolovici, L., Claeys, M., Maenhaut, W., 2009. Characterization ofatmospheric aerosols at a forested site in Central Europe. Environ. Sci. Technol.43, 4665e4671.
Lin, Y.-H., Zhang, Z., Docherty, K.S., Zhang, H., Budisulistiorini, S.H., Rubitschun, C.L.,Shaw, S.L., Knipping, E.M., Edgerton, E.S., Kleindienst, T.E., Gold, A., Surratt, J.D.,2012. Isoprene epoxydiols as precursors to secondary organic aerosol forma-tion: acid-catalyzed reactive uptake studies with authentic compounds. Envi-ron. Sci. Technol. 46, 250e258.
Maki, T., Puspitasari, F., Hara, K., Yamada, M., Kobayashi, F., Hasegawa, H.,Iwasaka, Y., 2014. Variations in the structure of airborne bacterial communitiesin a downwind area during an Asian dust (Kosa) event. Sci. Tot. Environ. 488,75e84.
Medeiros, P.M., Conte, M.H., Weber, J.C., Simoneit, B.R.T., 2006. Sugars as sourceindicators of biogenic organic carbon in aerosols collected above the Howlandexperimental forest, Maine. Atmos. Environ. 40, 1694e1705.
Mkoma, S.L., Kawamura, K., Fu, P.Q., 2013. Contributions of biomass/biofuel burningto organic aerosols and particulate matter in Tanzania, east Africa, based onanalyses of ionic species, organic and elemental carbon, levoglucosan andmannosan. Atmos. Chem. Phys. 13, 10325e10338.
Oros, D.R., Simoneit, B.R.T., 2001a. Identification and emission factors of moleculartracers in organic aerosols from biomass burning part 2. Deciduous trees. Appl.Geochem. 16, 1545e1565.
Oros, D.R., Simoneit, B.R.T., 2001b. Identification and emission factors of moleculartracers in organic aerosols from biomass burning part 1. Temperate climateconifers. Appl. Geochem. 16, 1513e1544.
Oros, D.R., Abas, M.R.B., Omar, N.Y.M.J., Rahman, N.A., Simoneit, B.R.T., 2006. Iden-tification and emission factors of molecular tracers in organic aerosols frombiomass burning: part 3. Grasses. Appl. Geochem. 21, 919e940.
Pacini, E., 2000. From anther and pollen ripening to pollen presentation. Plant Sys.Evol. 222, 19e43.
Pope, C.A., Ezzati, M., Dockery, D.W., 2009. Fine-particulate air pollution and lifeexpectancy in the United States. N. Engl. J. Med. 360, 376e386.
P€oschl, U., 2005. Atmospheric aerosols: composition, transformation, climate andhealth effects. Angew. Chem. Int. Ed. 44, 7520e7540.
Pratt, K.A., DeMott, P.J., French, J.R., Wang, Z., Westphal, D.L., Heymsfield, A.J.,Twohy, C.H., Prenni, A.J., Prather, K.A., 2009. In situ detection of biologicalparticles in cloud ice-crystals. Nat. Geosci. 2, 397e400.
Price, C., Penner, J., Prather, M., 1997. NOx from lightning: 1. Global distributionbased on lightning physics. J. Geophys. Res. Atmos. 102, 5929e5941.
Robinson, A.L., Donahue, N.M., Rogge, W.F., 2006. Photochemical oxidation andchanges in molecular composition of organic aerosol in the regional context.J. Geophys. Res. Atmos. 111, D03302. http://dx.doi.org/10.1029/2005JD006265.
Rudich, Y., Donahue, N.M., Mentel, T.F., 2007. Aging of organic aerosol: bridging thegap between laboratory and field studies. Annu. Rev. Phys. Chem. 58, 321e352.
Schmidl, C., Marr, I.L., Caseiro, A., Kotianova, P., Berner, A., Bauer, H., Kasper-Giebl, A.,Puxbaum, H., 2008. Chemical characterisation of fine particle emissions fromwood stove combustion of common woods growing in mid-European Alpineregions. Atmos. Environ. 42, 126e141.
Seinfeld, J.H., Carmichael, G.R., Arimoto, R., et al., 2004. ACE-ASIA e regional cli-matic and atmospheric chemical effects of Asian dust and pollution. Bull. Am.Meteorol. Soc. 85, 367e380.
Shi, Z., Zhang, D., Hayashi, M., Ogata, H., Ji, H., Fujiie, W., 2008. Influences of sulfateand nitrate on the hygroscopic behaviour of coarse dust particles. Atmos. En-viron. 42, 822e827.
Simoneit, B.R.T., Schauer, J.J., Nolte, C.G., Oros, D.R., Elias, V.O., Fraser, M.P.,Rogge, W.F., Cass, G.R., 1999. Levoglucosan, a tracer for cellulose in biomassburning and atmospheric particles. Atmos. Environ. 33, 173e182.
Simoneit, B.R.T., 2002. Biomass burning-a review of organic tracers for smoke fromincomplete combustion. Appl. Geochem. 17, 129e162.
Simoneit, B.R.T., Elias, V.O., Kobayashi, M., Kawamura, K., Rushdi, A.I.,Medeiros, P.M., Rogge, W.F., Didyk, B.M., 2004. Sugars-dominant water-soluble
organic compounds in soils and characterization as tracers in atmosphericparticulate matter. Environ. Sci. Technol. 38, 5939e5949.
Speranza, A., Calzoni, G.L., Pacini, E., 1997. Occurrence of mono- or disaccharidesand polysaccharide reserves in mature pollen grains. Sex. Plant Reprod. 10,110e115.
Stone, E.A., Nguyen, T.T., Pradhan, B.B., Dangol, P.M., 2012. Assessment of biogenicsecondary organic aerosol in the Himalayas. Environ. Chem. 9, 263e272.
Sullivan, R.C., Guazzotti, S.A., Sodeman, D.A., Prather, K.A., 2007. Direct observationsof the atmospheric processing of Asian mineral dust. Atmos. Chem. Phys. 7,1213e1236.
Sullivan, R.C., Minambres, L., DeMott, P.J., Prenni, A.J., Carrico, C.M., Levin, E.J.T.,Kreidenweis, S.M., 2010. Chemical processing does not always impair hetero-geneous ice nucleation of mineral dust particles. Geophys. Res. Lett. 37.
Sun, J.M., Liu, T.S., 2006. The age of the Taklimakan Desert. Science 312, 1621.Sun, Y.L., Zhuang, G.S., Wang, Y., Zhao, X.J., Li, J., Wang, Z.F., An, Z.S., 2005. Chemical
composition of dust storms in Beijing and implications for the mixing of min-eral aerosol with pollution aerosol on the pathway. J. Geophys. Res. Atmos. 110(D24) http://dx.doi.org/10.1029/2005jd006054.
Surratt, J.D., Murphy, S.M., Kroll, J.H., Ng, N.L., Hildebrandt, L., Sorooshian, A.,Szmigielski, R., Vermeylen, R., Maenhaut, W., Claeys, M., Flagan, R.C.,Seinfeld, J.H., 2006. Chemical composition of secondary organic aerosol formedfrom the photooxidation of isoprene. J. Phys. Chem. A 110, 9665e9690.
Surratt, J.D., Chan, A.W.H., Eddingsaas, N.C., Chan, M.N., Loza, C.L., Kwan, A.J.,Hersey, S.P., Flagan, R.C., Wennberg, P.O., Seinfeld, J.H., 2010. Reactive in-termediates revealed in secondary organic aerosol formation from isoprene.Proc. Natl. Acad. Sci. U. S. A. 107, 6640e6645.
Szmigielski, R., Surratt, J.D., G�omez-Gonz�alez, G., et al., 2007. 3-Methyl-1,2,3-butanetricarboxylic acid: an atmospheric tracer for terpene secondary organicaerosol. Geophys. Res. Lett. 34, L24811. http://dx.doi.org/10.1029/2007GL031338.
Tedersoo, L., Bahram, M., Polme, S., et al., 2014. Global diversity and geography ofsoil fungi. Science 346, 1078.
Turpin, B.J., Saxena, P., Allen, G., Koutrakis, P., McMurry, P., Hildemann, L., 1997.Characterization of the southwestern desert aerosol, Meadview, AZ. J. Air WasteManag. Assoc. 47, 344e356.
Usher, C.R., Michel, A.E., Grassian, V.H., 2003. Reactions on mineral dust. Chem. Rev.103, 4883e4939.
Verma, S.K., Kawamura, K., Chen, J., Fu, P.Q., Zhu, C.M., 2015. Thirteen years of ob-servations on biomass burning organic tracers over Chichijima Island in thewestern North Pacific: an outflow region of Asian aerosols. J. Geophys. Res.Atmos. 120, 4155e4168. http://dx.doi.org/10.1002/2014JD022224.
Viana, M., Reche, C., Amato, F., Alastuey, A., Querol, X., Moreno, T., Lucarelli, F.,Nava, S., Cazolai, G., Chiari, M., Rico, M., 2013. Evidence of biomass burningaerosols in the Barcelona urban environment during winter time. Atmos. En-viron. 72, 81e88.
Wang, G.H., Kawamura, K., Lee, S., Ho, K.F., Cao, J.J., 2006. Molecular, seasonal, andspatial distributions of organic aerosols from fourteen Chinese cities. Environ.Sci. Technol. 40, 4619e4625.
Wang, G.H., Cheng, C.L., Meng, J.J., Huang, Y., Li, J.J., Ren, Y.Q., 2015. Field observationon secondary organic aerosols during Asian dust storm periods: formationmechanism of oxalic acid and related compounds on dust surface. Atmos. En-viron. 113, 169e176.
Wang, Q.Z., Zhuang, G.S., Li, J.A., Huang, K., Zhang, R., Jiang, Y.L., Lin, Y.F., Fu, J.S., 2011.Mixing of dust with pollution on the transport path of Asian dust e revealedfrom the aerosol over Yulin, the north edge of Loess Plateau. Sci. Tot. Environ.409, 573e581.
Wang, W., Kourtchev, I., Graham, B., Cafmeyer, J., Maenhaut, W., Claeys, M., 2005.Characterization of oxygenated derivatives of isoprene related to 2-methyltetrols in Amazonian aerosols using trimethylsilylation and gas chro-matography/ion trap mass spectrometry. Rapid Commu. Mass Spectrom. 19,1343e1351.
Went, F.W., 1960. Blue hazes in the atmosphere. Nature 187, 641e643.Wu, F., Zhang, D.Z., Cao, J.J., Xu, H.M., An, Z.S., 2012. Soil-derived sulfate in atmo-
spheric dust particles at Taklimakan desert. Geophys. Res. Lett. 39.Wu, F., Zhang, D.Z., Cao, J.J., Zhang, T., An, Z.S., 2014. Background-like nitrate in
desert air. Atmos. Environ. 84, 39e43.Wu, G.J., Xu, B.Q., Zhang, C.L., Gao, S.P., Yao, T.D., 2009. Geochemistry of dust aerosol
over the eastern Pamirs. Geochim. Cosmochim. Acta 73, 977e989.Wu, P.C., Tsai, J.C., Li, F.C., Lung, S.C., Su, H.J., 2004. Increased levels of ambient fungal
spores in Taiwan are associated with dust events from China. Atmos. Environ.38, 4879e4886.
Zhang, H., Surratt, J.D., Lin, Y.H., Bapat, J., Kamens, R.M., 2011. Effect of relativehumidity on SOA formation from isoprene/NO photooxidation: enhancement of2-methylglyceric acid and its corresponding oligoesters under dry conditions.Atmos. Chem. Phys. 11, 6411e6424.