molecular mechanisms of serotonergic signaling: role in
TRANSCRIPT

Molecular Mechanisms of Serotonergic Signaling:
Role in Neuronal Outgrowth and Receptor Oligomerization
Dissertation
zur Erlangung des mathematisch-naturwissenschaftlichen Doktorgrades
"Doctor rerum naturalium"
der Georg-August-Universität Göttingen
vorgelegt von Fritz Kobe
aus Dresden
Göttingen 2010

II
This thesis has been written independently and with no other aids and sources than
quoted.
Fritz Kobe
Göttingen, March 2010

III
Referent: Prof. Dr. Michael Hörner
Koreferent: Prof. Dr. Erwin Neher
Tag der mündlichen Prüfung: 30.04.2010

IV
Contents
1 INTRODUCTION.......................................................................................................1
1.1 G-Protein coupled receptors...................................................................................1
1.2 G-protein mediated signaling..................................................................................4
1.3 Post-translational modifications of the receptors ....................................................6
1.4 Serotonin (5-Hydroxytryptamine) receptors............................................................7
1.5 Oligomerization of G-protein coupled receptors ...................................................12
1.6 Aims of the study ..................................................................................................14
2 EXPERIMENTAL PROCEDURES..........................................................................16
2.1 Materials ...............................................................................................................16
2.1.1 Chemicals ..........................................................................................................16
2.1.2 Vectors ...............................................................................................................17
2.1.3 Buffers and Solutions .........................................................................................17
2.1.4 Antibodies ..........................................................................................................18
2.2 Methods................................................................................................................19
2.2.1 Protein Analysis .................................................................................................19
2.2.2 Cell culture and transfection...............................................................................21
2.2.3 Electrophysiology ...............................................................................................24
2.2.4 Behavioral tests..................................................................................................26
2.2.5 Confocal imaging and FRET analysis ................................................................30
3 RESULTS................................................................................................................36
3.1 Functional role of 5-HT7/G12 signaling ................................................................36
3.1.1 5-HT7 Receptor activation induces formation of dendritic filopodia and new synapses ............................................................................................................36
3.1.2 Morpho- and synaptogenic effects of the 5-HT7 receptor are mediated by the G12 Protein......................................................................................................39
3.1.3 Effect of 5-HT7/G12 signaling on EPSCs and spike frequency .........................41
3.1.4 Effects of 5-HT7R/G12 signaling on neuronal morphology in organotypic cultures 43
3.1.5 5-HT7R/G12 signaling leads to changes in miniature postsynaptic currents (mPSCs) in organotypic hippocampal slices......................................................45
3.1.6 5-HT7R/G12 Signaling modulates neuronal excitability and LTP in organotypic cultures...............................................................................................................46
3.1.7 In vivo effects of treatment with 5-HT7 receptor antagonist ...............................50
3.1.8 Expression of 5-HT7 and G12 proteins is decreased during postnatal development.......................................................................................................55
3.2 Oligomerization of the 5-HT1A receptor ...............................................................57
3.2.1 Biochemical analysis of 5-HT1A receptor oligomerization. ................................57
3.2.2 Acceptor photobleaching analysis of 5-HT1A receptor oligomerization. ............59

V
3.2.3 Analysis of receptor oligomerization by fluorescence lifetime FRET measurements. ..................................................................................................63
3.2.4 Spectrometric detection of FRET between 5-HT1A receptors in living cells. .....64
3.2.5 Specificity of 5-HT1A receptor oligomerization. .................................................65
3.2.6 Quantitative analysis of oligomerization dynamics in living cells........................67
3.2.7 Agonist stimulation and lipid rafts localization of the 5-HT1A receptor. .............73
4 DISCUSSION..........................................................................................................75
4.1 Role of 5-HT7/G12 signaling in morpho- and synaptogenesis .............................75
4.1.1 Early structural and functional changes are modulated via the 5-HT/G12 pathway 75
4.1.2 Possible function of 5-HT7/G12 signaling during early postnatal development .78
4.2 Oligomerization of 5-HT1 receptor........................................................................80
4.2.1 Verification of oligomerization specificity by a novel FRET-based approach.....81
4.2.2 Regulation of oligomerization by agonist; role of lipid rafts and receptor palmitoylation .....................................................................................................83
5 SUMMARY..............................................................................................................86
6 REFERENCES........................................................................................................88
7 APPENDIX............................................................................................................100
7.1 Abbreviations ......................................................................................................100
7.2 Curriculum vitae..................................................................................................102

VI
Acknowledgements
This work would not have been possible with the help and support of many people, teachers,
colleagues, friends and family - I owe them a great debt of gratitude.
Foremost I would like to thank my supervisor Professor Evgeni Ponimaskin, who introduced
me to the “serotonergic world” and gave me the opportunity to work in this department. He
patiently supported, guided and encouraged me throughout the past couple of years. I would
also like to take the opportunity to thank Professor Michael Hörner and Professor Erwin
Neher who, as members of my thesis committee, provided valuable input and reflections on
the progress of my work. I am also grateful to Professor Diethelm W. Richter for having given
me the opportunity to continue my work at this institute.
I am indebted to all my collaborators in the department for their invaluable contributions to
this work, special thanks go to Dietmar Hess, Lucian Medrihan, Mingyue Zhang, Ute Renner,
Andrew Woehler, Jakub Wlodarczyk, Peter Salonikidis, Bao Guobin, Konstantin Glebov,
Katja Papoucheva, Michael Müller and Weiqi Zhang. I also would like to thank my external
collaborators Konstantin Radyushkin and Ahmed El-Khordi and Hannelore Ehrenreich as
well as Sören Westerholz.
Scientific work requires also a big team of people in the background helping to provide the
basics to carry out research. We often take this for granted but here I take the opportunity to
thank them all for their indispensable work. I thank Gaby Klaehn, Dagmar Crzan, Regina
Sommer-Kluß, Peter Funk, Wayne Sidio, and especially the people from the animal facility,
Axel, Uwe and Susi.
Very special thanks go to Peter Salonikidis, Andrew Woehler, Bao Guobin, Jakub
Wlodarczyk, Ivan Manzini, André Zeug and Matthew Holt who I not only call colleagues but
friends and who made lab and life often nicely indistinguishable.
Most of all, I am deeply grateful to my parents, Jutta-Maria and Eberhard, my brother Martin
and my sister Katharina for their encouraging and loving support during all this time.

1
1 INTRODUCTION
One of the most striking phenomena of life is the ability of all organisms to communicate
internally as well as externally giving them the opportunity to respond to their environment.
This is mostly achieved by cellular receptors, which detect, transduce and signal inside the
organism as well as between other cells. These processes are very complex, highly
regulated and function in a well-orchestrated manner in order to exert their function.
Generally, receptors are classified in five distinct classes (Bockaert and Pin, 1999). The first
class combines receptors responsible for the interaction between cells (tyrosine receptors).
Communication between cells and the extracellular matrix (e.g. integrine receptors) is
realized by second class receptors. The third class comprises tyrosine kinase receptors used
as receptors for growth factors. Class four contains the ligand gated ion channels and their
task relies on transporting ions across the plasma membrane. However, the most common
class of receptors are G-protein coupled receptors (GPCRs). They are the largest family of
signaling proteins and represent the best-studied class of receptors due to their importance
as a target for the development of therapeutic drugs. GPCRs mediate a wide range of
responses predominantly via their interaction with the heterotrimeric guanine nucleotide-
binding regulatory protein, termed G-protein. G-proteins exert their action through the
modulation of activity of diverse second messengers.
1.1 G-Protein coupled receptors
GPCRs are the largest family of membrane proteins (Lander et al., 2001) and mediate most
cellular responses to a variety of ligands, including hormones and neurotransmitters, many
other proteins and peptides as well as mechanical stimuli and light. They also play a major
role for vision, olfaction and taste (Lindemann, 1996; Hoon et al., 1999; Nelson et al., 2001;
Filipek et al., 2003). At the most basic level, all GPCRs are characterized by the presence of
seven membrane spanning -helical segments separated by alternating intracellular and

2
extracellular loop regions. Both physiological and structural features have been used to
classify GPCRs. The most frequently used classication system is based on differences in
sequence and divides GPCRs, into four distinct sub-classes: A, B, C and F/S (Horn et al.,
1998; Horn et al., 2003). Despite many similarities, individual GPCRs have unique
combinations of signal-transduction activities involving multiple G-protein subtypes, as well
as G-protein-independent signaling pathways and complex regulatory processes. Hence, it
would be more correct to term this super-family “seven transmembrane (TM) receptors,” but
the GPCR terminology is more established (Pierce et al., 2002).
The A-family (rhodopsin-like receptors) is the largest and most diverse GPCR family, and
its members are characterized by conserved sequence motifs that imply shared structural
features and activation mechanisms (Bockaert and Pin, 1999). The common features of this
family include the NSxxNPxxY motif in transmembrane domain 7, the DRY motif or D(E)-R-
Y(F) at the border between TM3 and intra cellular loop (IL) 2. The structures of the rhodopsin
receptors differ from those of adhesion, secretin, frizzled, and glutamate receptors as they
have generally a short N-terminus. Now it is widely accepted that receptor ligands bind in a
cavity between the TM regions, in contrast to receptors from the other families, where the N-
terminus has a key role for the involved ligand binding. However, in several glycoprotein
binding receptors (i.e. LH, FSH, TSH, and LG), the ligand- binding domain is localized at the
N-terminus. The A family can be divided into four subgroups (Fredriksson et al., 2003) which
are named ,, and . The -group includes the amine binding GPCRs, several peptide
binding and prostaglandin receptors. The -group includes the receptors that bind peptides
as ligands. The -group contains many peptide-binding receptors, such as the chemokine
receptors, some receptors that bind neuropeptides such as somatostatins, galanin, and
opioids. The -group includes the olfactory receptors, purin receptors and glycoprotein
receptors.
The receptors of the B-family (secretin) have a long N-terminus, which comprises 60-80
amino acids and contains conserved cysteine bridges. The N-terminus is important for the
binding of the ligand to these receptors. The secretin receptors bind large peptide ligands
that act in a paracrine manner. There are 15 such receptors in the human genome and it

3
appears that receptors from this family are found in considerable numbers in all vertebrates.
Prominent examples of the B type family are secretin, calcitonin, parathyroid
hormone/parathyroid hormone-related peptides and vasoactive intestinal peptide receptors,
they all activate adenylyl cyclase and the phosphatidyl-inositol-calcium pathway (Gether,
2000).
The C family is composed of eight metabotropic glutamate (mGlu1-8) receptors, two
heterodimeric -aminobutyric acid B (GABAB) receptors, a calcium-sensing receptor (CaR),
three taste (T1R) receptors, a promiscuous L--amino acid receptor (GPRC6A), and five
orphan receptors (Bräuner-Osborne et al., 2007). All these receptors, apart from the orphan
receptors are characterized by a large amino-terminal domain, which binds the ligands. The
eight mGlu receptor subtypes identified to date are divided into three subgroups based on
amino acid sequence similarity, agonist pharmacology and G-protein coupling property. Two
GABAB receptors are cloned to date, one is the GABAB1 and the other the GABAB2. The C
family of GPCRs plays an important role in to the overall synaptic transmission of the major
excitatory and inhibitory neurotransmitters in the body. The mGlu receptors are localized
almost exclusively in the CNS, whereas the other C family receptors can be found both
centrally and in peripheral tissues (Bräuner-Osborne et al., 2007).
The F Family (frizzled/taste 2 receptors) is a more recently identified group of GPCRs. The
frizzled receptors control cell fate, proliferation, and polarity during metazoan development by
mediating signals from the secreted glycoproteins Wnt. The frizzled receptors have about
200 amino acid long N-termini with conserved cysteins that are likely to participate in Wnt
binding. The role and function of the taste 2 (TAS2) receptors is not very well understood, but
it is known that they are expressed in the tongue and palate epithelium and they are likely to
function as bitter taste receptors (Chandrashekar et al., 2000)
In vertebrates, GPCRs plays a wide and pivotal role in organism functioning and are often
involved in many disorders such as allergies, depression, cancer, obesity, pain, diabetes and
many others (Lundstrom, 2005; Tang and Insel, 2005; Thompson et al., 2005). Therefore,
they serve as major pharmacological targets to treat pathophysiological conditions (Bockaert
and Pin, 1999; Angers et al., 2001; McCudden et al., 2005; Thompson et al., 2005). Three

4
quarters of therapeutic drugs on the market target GPCRs and have therefore an enormous
importance and economic potential for the pharmaceutical industry (Lundstrom, 2005).
1.2 G-protein mediated signaling
Heterotrimeric G proteins play an important role as molecular switches in signal transduction
pathways mediated by GPCRs. Heterotrimeric G proteins are composed of three subunits, ,
and . The G are divided into four main classes based on the similarity of the primary
sequence: Gs, Gi, Gq and G12. The molecular weight of G subunits varies between
39 and 45 kDa. All G subunits, excluding the Gt or transducin, also contain palmitate,
which is reversibly attached to a cysteine at the N-terminus. Fatty acid modifications are
essential for G subunit membrane localization (Peitzsch and McLaughlin, 1993). Depending
on their subunits, G-proteins activate different second messenger cascades.
The switching function of heterotrimeric G proteins depends on the ability of the G protein -
subunit (G) to cycle between an inactive GDP-bound conformation that is set for interaction
with an activated receptor, and an active GTP-bound conformation that can modulate the
activity of downstream effector proteins. In practical terms, after ligand binding, the receptor
undergoes conformational change. This promotes the coupling with heterotrimeric G proteins
(G) and catalyzes the exchange of GDP by GTP on the -subunit, leading to
dissociational and conformational changes between - and -subunits. Now the GTP-bound
G-subunit and the G-dimer can modulate the activity of various effectors.
Gs-proteins activate adenylyl cyclase, which then produces cAMP, which further activates
cAMP-dependent protein kinases (Sutherland and Rall, 1958).
Gi-proteins inhibit adenylyl cyclase, leading to a decrease in intracellular cAMP levels
(Emerit et al., 1990; Barnes and Sharp, 1999).
Gαq-proteins activate phospholipase C (PLC) (Blank et al., 1991). PLCs hydrolyze the
phosphoester bond of the plasma membrane lipid phosphatidylinositol 4,5-bisphosphate,
generating the ubiquitous second messengers inositol 1,4,5-trisphosphate (Ins(1,4,5)P3) and
diacylglycerol (DAG).

5
Gα12/13 proteins. The G12-protein family consists of the ubiquitously expressed G12 and
G13 subunits (Strathmann and Simon, 1991). Prominent downstream effectors in G12-
mediated signaling are the members of the Rho family of small GTPases (Rho, Rac, and
Cdc42), which regulate a variety of cellular activities by controlling the actin cytoskeleton or
gene expression (Hall, 1998). In this study we have analyzed effects modulated by G12/13
proteins. Previous research being done in our lab demonstrated that the serotonin receptor
5-HT7 can activate heterotrimeric G12 protein, leading to the selective activation of small
GTPases RhoA and Cdc42 changing morphology and cytoarchitecture of the cells
(Kvachnina et al., 2005; Ponimaskin et al., 2007).
-subunits: So far more than 5 different and 12 subunits have been described,
(McCudden et al., 2005). The variation of the G/ subunits is wider than in G, ensuring a
higher number of potential combinations of G/ dimers. It is known that all subunits are
post-translationally modified by prenylation of the C-terminus (Wedegaertner et al., 1995),
acting as a membrane anchor attached to the cell membrane. Previously, it has been
suggested that G/ dimers serve as adaptors to promote coupling of G-protein heterotrimers
to GPCRs, in addition to its function as G inhibitor. The role of G/ dimers as adaptors is
well documented but they can also directly activate many effectors. One of the first described
partner for the G/ dimer was the G-protein regulated inward rectifier K+ channels (GIRK)
(Logothetis et al., 1987) and until now there is evidence that G/ dimers regulate Ca2+
channels, PLC, p38 mitogen activated protein kinases (MAPKs), MAPK scaffold proteins,
as well as involvement in membrane attachment of the small GTPases Rho and Rac. It has
also been shown that adenylyl cyclases are not only governed by G, but also by G/
heterodimer (Faure et al., 1994; Coso et al., 1996; Harhammer et al., 1996; Akgoz et al.,
2002; Sunahara and Taussig, 2002; Woehler and Ponimaskin, 2009).

6
1.3 Post-translational modifications of the receptors
Like many proteins, GPCRs are subject to a variety of post-translational modifications that
are an essential part in regulating their activities. These post-translational modifications
include:
glycosylation, is the addition and processing of an oligosaccharide to either asparagine,
hydroxylysine, serine, or threonine, resulting in a glycoprotein. This is an important
prerequisite for proteins to fold correctly.
phosphorylation, describes the reversible process of adding a phosphate group to protein,
usually to serine, tyrosine, threonine or histidine residues within the cytoplasmic receptor
domains. Phoshorylation is a key mechanism leading to conformational changes of proteins
turning receptors from an activated into an inactivated state.
methylation, this is a process where a methyl group is added to lysine or arginine residues.
Methylation plays a role in the regulation of gene expression, regulation of protein function
and RNA metabolism.
palmitoylation, is the addition of palmitate through a thioester linkage to cysteine located
within the receptor terminus (Towler et al., 1988). Most commonly palmitoylation is linked to
membrane association of otherwise soluble proteins (Smotrys and Linder, 2004). However,
the function of palmitoylation ranges far beyond that of membrane anchoring. Palmitoylation
together with other lipid modifications and protein motifs also facilitate protein targeting to
appropriate cellular destinations (Brown and London, 1998). Interestingly, palmitoylation is
the only reversible lipid modification, suggesting that palmitoylation and depalmitoylation of
proteins could have important functional consequences for signaling (Linder and Deschenes,
2003; Smotrys and Linder, 2004). In G-proteins coupled receptors (GPCRs) palmitoylation
plays an important role in processes ranging from coupling to G-proteins and regulated
endocytosis to receptor phosphorylation and desensitization (Ross, 1995; Mumby, 1997;
Dunphy and Linder, 1998). Moreover, palmitoylation of several GPCRs has been shown to
play a central role in the regulation of receptor function. Recent studies on rhodopsin indicate
that its depalmitoylation enhances light-dependent GTPase activity of Gt and strongly
decreases the light-independent activity of opsin (Mulheron et al., 1994; Garnovskaya et al.,

7
1996). The functional characterization of non-palmitoylated 2-adrenergic and endothelin-B
(ETB) receptors has revealed that palmitoylation is essential for agonist- stimulated coupling
to GS and to both Gq- and Gi proteins, respectively. Analysis of the non-palmitoylated ETA
receptor mutant demonstrated that ligand-induced stimulation of GS was unaffected by the
lack of palmitoylation, whereas signaling through Gq was prevented. Recent data on
chemokine CCR5 and prostacyclin receptors also demonstrated that receptor palmitoylation
is involved in the activation of intracellular signaling pathways.
1.4 Serotonin (5-Hydroxytryptamine) receptors
Serotonin (5-hydroxytryptamine; 5-HT) is a neurotransmitter acting via membrane receptors
in the central nervous (CNS) and the peripheral nervous system (PNS), as well as in non-
neuronal tissues (e.g. blood, gastro-intestinal, endocrine, sensory and cardiovascular
systems). 5-HT is one of the oldest neurotransmitter in evolution, and its receptors are
estimated to have appeared 700–800 million years ago in eukaryotes (Hoyer et al., 2002).
The major classes of 5-HT receptors must have diverged about 750 millions years ago, long
before cholinergic, adrenergic or dopaminergic receptors (Hoyer et al., 2002).
Serotonin was first described as enteramine and was isolated from the gut in the 1930s by
Erspamer et al. (Erspamer and Asero, 1952) and showed to cause contraction of the uterus.
5-HT was rediscovered in the 1940s by Irvin Page’s group in the circulation and called
serotonin, based on its vasoconstrictor features (Rapport et al., 1948). Maurice Rapport
purified, crystallized and characterized the molecule from blood. Rapport also found that
enteramine and serotonin were in fact the same, namely 5-hydroxytryptamine (Rapport et al.,
1948).
Serotonin acts via specific receptors which belong, with the exception of the 5-HT3 receptors
(ligand gated ion channels), to the GPCR superfamily. Serotonin receptors are classified into
7 classes and are then further subdivided into 14 subtypes based on their pharmacology,
transduction, sequence and structure (Kroeze et al., 2002; Kroeze et al., 2003; Meneses,
2008; Kamiyama and Chiba, 2009).

8
Fig. 1 Classification of serotonin receptors.
With the exception of the 5-HT3 receptor all other 5-HT receptors belong to the superfamily of 7 transmembrane receptors. The 5-HT3 receptor is a ligand-gated Na+/K+ channel. The receptors modulate different signaling pathways. One important focus of this study is the 5-HT7 receptor which activates GS. An important alternative pathway acts via the G12 protein.
The 5-HT1 receptor class is to date the best characterized 5-HT receptor which consists of
five receptors isoforms (5-HT1A, 5-HT1B, 5-HT1D, 5-HT1 and 5-HT1F). They share 40-63 %
overall sequence identity in humans and preferentially couple to Gi/o to inhibit the formation of
cAMP. It has been shown that the 5-HT1 receptor plays a major role in the pathophysiology
of anxiety and depression (Delgado et al., 2005; Fricker et al., 2005; Dawson et al., 2006).
There are 3 types of 5-HT2 receptors, 5-HT2A, 5-HT2B and 5-HT2C receptors. These
receptors couple preferentially to Gq/11 proteins and modulate intracellular inositol phosphates
and Ca2+ concentrations (Canton et al., 1996), 1996). They are best known for their role in
muscle contraction and temperature control (Barnes and Sharp, 1999).
The 5-HT3 receptor belongs to the ligand-gated gated ion channel superfamily, similarly to
the nicotinic acteylcholine, glycine or GABA-A receptors. The receptor is located on central
and peripheral neurons and triggers rapid depolarization due to opening of non-selective
cation channels (Na+, Ca2+ influx, K+ eflux (Blier and Bouchard, 1993). The 5-HT3 receptors
can be found in different brain regions, such as the CA1 pyramidal cell layer in the
hippocampus, the dorsal motor nucleus of the solitary tract and the area postrema (Laporte

9
et al., 1992). Peripherally, they have also been identified on pre- and postganglionic
autonomic neurones and on neurones of the sensory nervous system. Additionally 5-HT3
receptor activation throughout the GI tract regulates both motility and intestinal secretion (De
Ponti and Tonini, 2001).
The 5-HT4 receptors are preferentially coupled to GS and promote cAMP formation by
activation of various isoforms of adenylyl cyclases. For the 5-HT4 receptor, at least 8 splice
variant are known. In addition to coupling to the GS, the 5-HT4(b) receptor is also associated
with the Gi/o protein. The 5-HT4(a) receptor is also known to activate G13 signaling pathway
leading to activation of the RhoA small GTPase (Ponimaskin et al., 2002a). In the CNS, 5-
HT4 receptors modulate neurotransmitter (acetylcholine, dopamine, serotonin and GABA)
release and enhance synaptic transmission, whereas in the GI tract the receptor acts as
modulator on motility. Furthermore the 5-HT4 receptor is also involved in mediating secretory
responses to 5-HT in intestinal mucosa. The 5-HT4 receptor plays a role in learning and
memory as well as in the respiratory cycle (Barnes and Sharp, 1999; Manzke et al., 2003;
King et al., 2008).
The function of the 5-HT5 receptor remains unclear. Within the CNS the 5-HT5A receptor
shows a relatively broad distribution, while the 5-HT5B receptor has a very restricted
distribution. The 5-HT5A receptor has been demonstrated to couple to G proteins, and the
primary coupling appears to be through Gi/o inhibiting adenylyl cyclase activity. The 5-HT5B
receptor is expressed in mice and rats, but not humans, where the coding sequence is
interrupted by stop codons.
The 5-HT6 receptor is positively coupled to adenylyl cyclase via the Gs protein. It is located
in the striatum, amygdala, nucleus accumbens, cortex and the olfactory tubercle. However, it
can also be found in the stomach and in the adrenal glands. Functionally the 5-HT6 receptor
is involved in regulating cognition (Barnes and Sharp, 1999; Ballaz et al., 2007;
Svenningsson et al., 2007; Wesołowska and Nikiforuk, 2007).
The 5-HT7 receptor consists of at least four splice variants (5-HT7(a), 5-HT7(b), 5-HT7(c),
5-HT7(d)). All these 5-HT7 receptor isoforms are known to couple to adenylyl cyclase via the
heterotrimeric Gs protein leading to an increase of intracellular cAMP levels (Adham et al.,

10
1998; Heidmann et al., 1998). Recently it was shown that G12 can also be activated by the
5-HT7 receptor, leading to the activation of small GTPases of the RhoA family changing the
morphology and cytoarchitecture of neuronal cells (Kvachnina et al., 2005; Ponimaskin et al.,
2007). The 5-HT7 receptors can be found in the central nervous system, the thalamus, the
hippocampus, the hypothalamus and the cortex of the brain. However, the receptors are also
present at the periphery, especially in smooth muscles of blood vessels and in the gastro-
intestinal tract. Functionally, the 5-HT7 receptor has been associated with a number of
physiological and pathophysiological phenomena, such as 5-HT-induced phase shifting of
the circadian rhythm or age-dependent changes in circadian timing (Lovenberg et al., 1993;
Duncan et al., 2004). A large amount of experimental data suggests that 5-HT7 receptors are
involved in the induction of sleep and the development of hypothermia (Hedlund et al., 2003;
Thomas et al., 2003).
Serotonin and the regulation of neuronal morphology. In addition to their well-
established role in neuronal communication, serotonin has been shown to be involved in
many aspects of neural development, such as neurite outgrowth, regulation of neuronal
morphology, growth cone motility and dendritic spine shape and density, (Azmitia, 2001;
Kvachnina et al., 2005; Udo et al., 2005; Ponimaskin et al., 2007; Manzke et al., 2009).
Although several serotonin receptors, including 5-HT1A, 5-HT2 and 5-HT4 have been
proposed to modulate morphogenic events elicited by 5-HT (Fiorica-Howells et al., 2000;
Azmitia, 2001), the molecular downstream mechanisms remain poorly understood.
Reorganization of the actin cytoskeleton is one of the critical steps in regulation of neuronal
morphology and activity-dependent synaptic modification (Jontes and Smith, 2000). Dynamic
changes of the actin cytoskeleton in many cell types are under control of small GTPases of
the Rho family, including RhoA, Rac1 and Cdc42 (Hall, 1998). Over the past years it has
become evident that members of the Rho family are widely expressed in multiple neural
tissues and appear to function as key mediators that link the extracellular signals to
cytoskeletal rearrangements (Yamamoto et al., 1989; Olenik et al., 1999). Marked changes in
morphology, motility and guidance of axons have been observed in response to activation of
Rho family GTPases both in vitro and in vivo (Zipkin et al., 1997; Ng et al., 2002). The

11
combined studies suggest that Rac1 and Cdc42 are positive regulators promoting neurite
extension and growth cone protrusion. Conversely, activation of RhoA induces stress fiber
formation, leading to growth cone collapse and neurite retraction (Lee et al., 2000; Li et al.,
2000). As key regulators of both actin and microtubule cytoskeleton, the Rho GTPases have
also emerged as important regulators of dendrite and spine structural plasticity (Newey et al.,
2005), and appear to be a part of the initial molecular cascade required for the growth of new
synapses associated with long-term memory (Udo et al., 2005). Although the importance of
Rho GTPases in neuronal morphogenesis is widely accepted, the upstream signaling
components including extracellular ligands and receptors involved in regulation Rho-
mediated pathways through the lifetime of a neuron are not fully characterized.
Fig. 2 Molecular model of 5-HT7 receptor mediated signaling
5-HT7 receptor couples predominantly to the GS protein and transduces signal via the GS-AC-cAMP-PKA signaling pathway which may activate Src. Alternatively the 5-HT7 receptor can act through coupling to the G12 protein leading to activation of small GTPases such as RhoA and Cdc42. Furthermore it may activate the ezrin/radixin/moesin (ERM) family. It has also been demonstrated that the 5-HT7 receptor transduces signals via the established G pathways, including the activation of GIRK channels, phospholipase C (PLC) and PLA2. Some evidence suggests that the receptor may form homo- and hetero-oligomeric structures with consequences for signaling and downstream effects.
We have recently demonstrated that the serotonin receptor 5-HT7 is coupled to the
heterotrimeric G12 protein, which in turn selectively activates small GTPases RhoA and

12
Cdc42 (Kvachnina et al., 2005). Agonist-dependent activation of the 5-HT7 receptor induced
pronounced filopodia formation via a Cdc42-mediated pathway paralleled by RhoA-
dependent cell rounding in neuroblastoma cells. Stimulation of 5-HT7 receptor in
hippocampal neurons resulted in marked extension of neurite length. In the present study,
using cultured hippocampal neurons, we found that activation of the 5-HT7R/G12 signaling
pathway promotes both dendritic branching and synaptogenesis, leading to the enhancement
of spontaneous synaptic activity. By establishing and analysis of organotypic preparations
from the hippocampus of juvenile mice, we demonstrated that 5-HT7R/G12 signaling
potentiated the formation of dendritic spines, increased the basal neuronal excitability and
lead to robust changes in long-term potentiation (LTP). While prominent in neuronal
preparations from juvenile mice, the effects of 5-HT7/G12 signaling on synaptic plasticity in
adult mice were abolished. Accordingly, the behavior of adult animals was also not
significantly influenced upon chronical 5-HT7 receptor inhibition. Such discrepancies in the
effects of 5-HT7R/G12 signaling obtained in juvenile and adult animals may be explained by
the fact that expression of both 5-HT7 receptor and G12 protein was significantly reduced
during development. Thus, regulated expression of both 5-HT7 receptor and G12 protein
may represent a molecular mechanisms by which serotonin differentially regulates neuronal
morphology and function during development.
1.5 Oligomerization of G-protein coupled receptors
“Until recently, G-protein coupled receptors were assumed to exist and function as
monomeric entities that interact with the corresponding G-protein at a 1:1 stoichiometry.
However, biochemical, structural and functional evidence obtained in the last decade
suggests that some GPCRs can form homo- and hetero-oligomers (Devi, 2001). Initial clues
for the existence of receptor dimers and oligomers came from the appearance of high
molecular weight SDS-resistant complexes on SDS-PAGE (Javitch, 2004). In addition, trans-
complementation assays not only confirmed the existence of receptor–receptor interactions
but also specified their functional implications. In these experiments, it was demonstrated
that co-expression of two mutant receptors, which were not able to transduce signals

13
individually, restored signal transduction (Maggio et al., 1993; Monnot et al., 1996). Recently,
GPCR dimers were directly visualized under physiological conditions when rhodopsin dimers
in murine rod outer segments were imaged by atomic force microscopy (Liang et al., 2003).
Dimers were also found in crystal structure of rhodopsin (Salom et al., 2006).
Although there is evidence suggesting that oligomeric complexes may represent the
preferred state of GPCRs (Chabre and le Maire, 2005), no general principle defining the
regulation of oligomerization has been elucidated. There are two general models describing
the mechanisms of GPCR oligomerization. One model proposes that GPCR oligomers are
formed early after receptor synthesis and that oligomeric state does not change upon ligand
treatment (Bulenger et al., 2005). A well-known example of such constitutive oligomerization
is the GABAB receptor, for which oligomerization between GABABR1 and GABABR2 has been
shown to be necessary for the proper trafficking and functioning at the cell surface (Malgaroli
and Tsien, 1992; Jones et al., 1998; Kaupmann et al., 1998; White et al., 1998). The other
model, which has been documented for several GPCRs by using biochemical as well as
biophysical approaches, describes receptor oligomerization as a ligand-dependent process
(Angers et al., 2002; Pfleger and Eidne, 2005; Yamazaki et al., 2005).
In the second part of this study, we examined the oligomerization state of the serotonin 5-
HT1A receptor and analyzed its dynamics in living cells. As mentioned before the 5-HT1A
receptor can couple to a variety of effectors via the pertussis-toxin sensitive heterotrimeric G-
proteins of the Gi/o families and is the most extensively characterized member of the
serotonin receptor family. Activation of the 5-HT1A receptor results in the inhibition of
adenylyl cyclase and subsequent decrease of intracellular cAMP levels. In addition to the
effects mediated by the Gi/o subunit, activation of the 5-HT1A receptor leads to a G-
mediated activation of a K+ current, inhibition of a Ca2+ current, stimulation of the
phospholipase C, as well as an activation of the mitogen-activated protein kinase Erk2
(Andrade et al., 1986; Fargin et al., 1989; Clarke et al., 1996; Garnovskaya et al., 1996). With
respect to its physiological functions, it is noteworthy that the 5-HT1A receptor is involved in
manifold processes including the regulation of neurogenesis (Radley and Jacobs, 2002),
respiratory control (Manzke et al., 2003; Richter et al., 2003) cardiovascular control (Saxena

14
and Villalón, 1990), neuroendocrine regulation (Burnet et al., 1996), temperature control
(Overstreet, 2002) and regulation of sleep (Bjorvatn and Ursin, 1998) . Considerable interest
in this receptor has been raised due to its involvement in regulation of depression and
anxiety states (Parks et al., 1998; Overstreet, 2002; Gordon and Hen, 2004). Previously, we
have demonstrated that the 5-HT1A receptor is stably palmitoylated at its C-terminal cysteine
residues Cys417 and Cys420. Characterization of acylation-deficient 5-HT1A mutants
revealed that palmitoylation of the 5-HT1A receptor is critical for Gi protein coupling and
effector signaling as well as for the localization in lipid rafts (Papoucheva et al., 2004).
Therefore in addition to providing evidence for oligomerization of wild-type 5-HT1A receptors,
we investigate whether a palmitoylation state of 5-HT1A receptor may affect its
oligomerization (Kobe et al, 2008).
1.6 Aims of the study
This work attempts to analyze the molecular mechanisms and functional consequences of
serotonergic signaling mediated by two physiological important receptors, the 5-HT1A and
the 5-HT7 receptor.
The first part the study is based on the current knowledge that the neurotransmitter serotonin
(5-hydroxytryptamine) modulates different aspects of early neuronal differentiation, such as
neurite outgrowth and synaptogenesis. However, it remains unclear by what mechanisms
these actions are achieved by the 5-HT receptors. This part will focus on the 5-HT7/G12
pathway in respect to the regulation of morphology and synaptogenesis as well as functional
consequences (e.g. synaptic plasticity).
The second part is building on the recent evidence that GPCRs can form homo- and hetero-
oligomers. The goal of the study was to determine the oligomerization state and the
oligomerization dynamics of the serotonin 5-HT1A receptor in living cells as well as the role
of receptor palmitoylation in this process.

15

16
2 EXPERIMENTAL PROCEDURES
2.1 Materials
2.1.1 Chemicals
Applied
Biosystems
GeneAmp Gold RNA PCR Reagent Kit, TaqMan Universal PCR Master Mix,
Gene Expression Assays
Calbiochem transferrin
Invitrogen gentamicin, Lipofectamine2000 Reagent, glutamax I, L-glutamine, b-FGF,
B-27 supplement, Neurobasal-A-Medium, TRIzol Reagent, PureLink Micro-
to-Midi Total RNA Purification System
Millipore 0.4 μm Millicell-CM
Nunc cell culture plastic
Peqlab AceGlow detection kit
Pierce 1,11-bis-maleimidotriethyleneglycol (BM[PEO]3
Qiagen Plasmid DNA purification Maxi Kit
Roche laminin
Roth HCl, Aceton, NaHCO3, NaCl, KCl, Na2HPO4, ampicillin, TEMED,
acrylamide, bis-acrylamide, 2-mercaptoethanol, glycine, kanamycin,
bromphenole blue
Sigma poly-L-lysine, Hanks balanced salt solution, HEPES, glucose, bovine
albumin, MgSO4, trypsin, DNAse, typsin inhibitor, MEM Earle´s, insulin,
Dulbeccos´s modified Eagle´s medium (DMEM), horse serum, cytosine
arabinoide, 5-hydroxytryptamine, ethidiumbromide, penicillin/streptomycin
solution, PMSF, Optiprep™ gradient medium, protein A-sepharose,
Smith Kline
Beecham
SB656104-A
Tocris WAY 100135, SB 269970. 5-carboxamidotryptamine maleate

17
2.1.2 Vectors
Plasmids encoding for Gi2, G1 and G2 subunits of heterotrimeric G-protein from mice
were kindly provided by Dr. Tatyana Voyno-Yasenetskaya (University of Illinois, Chicago).
To visualize the dendritic structures we used a plasmid encoding for cytosolic GFP (pEGFP
from Clontech). Plasmids previously constructed in the lab (Papoucheva et al., 2004; Renner
et al., 2007) were used: HA-tagged 5-HT1A and 5-HT1A receptors fused to different spectral
variants of the green fluorescence (CFP/ YFP) proteins as well as their palmitoylation-
deficient counterparts.
2.1.3 Buffers and Solutions
1x TE buffer: 0.01 M Tris-HCl, pH 8.0, 7.6 or 7.4, 1 mM Na2EDTA (pH 8.0)
50x TAE-buffer: 2 M Tris-HCl, 0.05 M Na2EDTA (pH 8.0), 1 M glacial acetic
acid
Antibody incubation
buffer:
PBS / 0.05% Tween
Artificial cerebrospinal
fluid (ACSF):
130 mM NaCl, 3.5 mM KCl, 1.25 mM NaH2PO4, 24 mM
NaHCO3, 1.2 mM CaCl2, 1.2 mM MgSO4, and 10 mM
dextrose; aerated with 95%O2, 5% CO2 to adjust pH to 7.4
Blocking solution: 5% (w/v) ECL blocking reagent in PBS-Tween
Blot buffer: 25 mM Tris/HCl, pH 8.3, 192 mM glycine, 20% (v/v)
methanol
Digestion solution: 137 mM NaCl, 5 mM KCl, 7 mM Na2HPO4, 4.2 mM NaHCO3,
pH 7.4
Extracellular solution: 118 mM NaCl, 2 mM KCl, 10 mM glucose, 10 mM HEPES, 2
mM CaCl2, 1 mM MgCl2
Fixation solution: 4.0% w/v formaldehyde in PBS
Hanks balanced salt
solution with supplements:
4.2 mM NaHCO3, 10 mM HEPES, 30 mM glucose, albumine
bovine (0.72 g/l), 12 mM MgSO4, gentamicin (0.5 µl/ml)
Intracellular solution: 1 mM NaCl, 125 mM K-gluconate, 10 mM HEPES, 0.5 mM
CaCl2, 1 mM MgCl2, 11 mM EGTA, 1 mM ATP, 0.3 mM GTP,
pH adjusted to 7.4 using KOH
PBS: 150 mM NaCl, 20 mM NaH2PO4, pH 7.4
18
Permeabilization solution: 0.5% v/v Triton-X-100, 0.5 M NaCl, 50 mM PBS, pH 7.4
Protein-loading-gel buffer
(3x):
93.7 mM Tris/HCl (pH 6.8), 30% Glycerin, 9% SDS, 1.5 %
bromphenolblue.
RIPA-buffer: 20 mM Tris/HCl pH 7.4, 150 mM NaCl, 10 mM EDTA, 10 mM
iodacetamide, 1% Triton X-100, 1% deoxycholic acid, 0.1%
SDS, 1 mM PMSF, 5 µg/ml aprotinin, 2 µg/ml leupeptin.
SDS-Gel electrophoresis
buffer:
25 mM Tris/HCl (pH 8.3-8.5), 192 mM Glycin, 0.1% SDS.
TNE buffer: 25 mM Tris/HCl, pH7.4, 150 mM NaCl, 5 mM EDTA, 1 mM
DTT, 10% sucrose, 1% Triton X-100, 1 mM PMSF, 10 µM
Leupeptin, 2 µg/ml Aprotinin
NaHCO3, 1 mM NaH2PO4, 5 mM glucose, pH 7.4
Tris-HCl/SDS buffer for
protein gel electrophoresis
(4x):
0.5 M Tris-HCl, pH 6.8, 14 mM SDS.
Tris-HCl/SDS buffer for
protein gel electrophoresis
(4x):
1.5 M Tris-HCl, pH 8.8, 140 mM SDS
2.1.4 Antibodies
Abcam: anti-GFP antibody
Eusera: anti-GFP
Invitrogen: Alexa Fluor® 488 rabbit anti-goat IgG (H+L),
rabbit anti-HA antibody
Jackson ImmunoResearch: Cy™3-conjugated AffiniPure goat anti-mouse IgG
Santa Cruz: PSD-95, mouse monoclonal anti-HA-tag
Sigma: synaptophysin, mouse monoclonal

19
2.2 Methods
2.2.1 Protein Analysis
2.2.1.1 SDS-polyacrylamide gel electrophoresis
Proteins can be separated by their molecular weight by applying an electrical field within the
continuous, cross-linked polymer matrix (SDS-PAGE). For this proteins need to be
solubilized in sample buffer and loaded onto a gel together with a molecular weight marker in
order to define the size of the protein.
2.2.1.2 Immunoprecipitation and immunoblotting
“Twenty-four hours post-transfection cells were washed in PBS and lysed in 500 µl RIPA-
buffer for 30 min on ice. The lysate was cleared by centrifugation at 13.000 rpm for 20 min at
4°C. The receptors were immunoprecipitated from the supernatant by incubation with rabbit
anti-HA antibody (Santa Cruz) or anti-GFP antibody (Abcam) for 4 h at 4°C, followed by
incubation of lysates with protein A-sepharose (Sigma) for 2 h. The immunoprecipitation-
sepharose complexes were washed with RIPA buffer, eluted with 40 µl Laemmli loading
buffer, and 15 µl of each sample were separated by 10% SDS-PAGE under reducing
conditions. Proteins were transferred to Hybond nitrocellulose membrane (Amersham) and
probed either with antibodies against HA-tag (Santa Cruz; 1:5000 diluted in PBS/Tween20)
or against GFP (Eusera; diluted 1:20.000 in PBS/Tween20). Proteins were detected using
AceGlow detection reagents (Peqlab).
2.2.1.3 Chemical cross-linking
Transiently transfected cells were resuspended in PBS and mixed with the indicated
concentrations of cross-linker 1,11-bis-maleimidotriethyleneglycol (BM[PEO]3,) diluted in PBS
for 10 min at room temperature. The reaction was stopped by addition of dithiothreitol to a
final concentration of 10 mM followed by incubation on ice for 10 min. After two washes with
PBS, cells were lysed and proteins were immunoprecipitated and subjected to the SDS-
PAGE and immunoblot analysis.
20
2.2.1.4 Gradient centrifugation
Separation of detergent-resistant membranes derived from transfected N1E-115 cells (1x10⁶)
growing on 35 mm dishes was performed as recently described (Harder et al., 1998). Cells
were lysed in TNE buffer and lysates (1.2 mg protein/ml) were mixed with the double volume
of 60% OptiprepTM gradient medium. The resulting 40% OptiprepTM mixture was transferred
into the ultracentrifuge tube and overlaid with steps of each 35%, 30%, 25%, 20% and 0%
OptiprepTM in TNE. The gradients were centrifuged for 5 h at 50.000 rpm in the TLS-55 rotor
of the ultracentrifuge TL-100 (Beckman). Six fractions were collected from the top of the
gradient and TCA-precipitated. The protein pellets were analyzed by SDS-PAGE followed by
immunoblot analysis with appropriate antibodies. In several experiments chemical cross-
linking with BM[PEO]3 together with 5-HT treatment (10 µM) was performed before
ultracentrifugation.
2.2.1.5 RT-PCR for receptor and G-protein mRNA expression
RNA Isolation: Immediately following the preparation of hippocampus total RNA was
isolated using TRIzol Reagent. Briefly, 0,5 ml TRIzol was used to prepare homogenates from
50-100 mg brain tissue. After homogenization, 100 µl of chloroform were added and the
tubes were shaken vigorously by hand for 15 seconds. Emulsions were centrifuged at 12,000
rpm/4°C/15 min. The aqueous phase containing the RNA was transferred into a fresh tube
and mixed with an equal volume of 70% ethanol. RNA was purified from the samples using
PureLink Micro-to-Midi Total RNA Purification System according to the manufacturers´
instructions. RNA was bound to a silica-based membrane in the spin-cartridge and impurities
were removed by washing. Potential contaminating DNA was removed by treatment with
DNAseI. The purified RNA was eluted in water and stored at -80°C.
Reverse transcription of mRNA: Reverse transcription was carried out using the GeneAmp
Gold RNA PCR Reagent Kit (Applied Biosystems). Concentration of RNA was determined in
a photometer at 260 nm. A measure of 5 µg of total RNA was subjected to first strand cDNA
synthesis using random hexamer primers. The obtained cDNAs were stored at -20°C.
Quantitative real time PCR: The amplification was carried out on a ABI PRISM7000
Sequence Detector (Applied Biosystems) using TaqMan Universal PCR Master Mix (Applied

21
Biosystems). For the detection of 5-HT1A-, 5-HT7-, Gs- and G12-mRNA the
corresponding Gene Expression Assays (Applied Biosystems) containing gene-specific
primers and FAM-probes were used. For normalization, Eukaryotic 18S RNA was also
quantified (Kobe et al, 2008).
2.2.2 Cell culture and transfection
Cells lines
N1E-115 neuronal cells from mouse neuroblastoma
Animals
Naval Medical Research Institute mice
C57BL/6NCrl (Charles River Laboratories, Sulzfeld, Germany)
2.2.2.1 Adherent cell culture and transfection
Mouse N1E-115 neuroblastoma cells from the American Type Culture collection (ATCC)
were grown in Dulbecco's modified Eagle's medium (DMEM) containing 10% fetal calf serum
(FCS) and 1% penicillin/streptomycin at 37 °C under 5% CO2. For transient transfection, cells
were seeded at low-density in 60-mm dishes (1 × 10⁶) or on 10-mm cover-slips (5 × 10⁵) and
transfected with appropriate vectors using Lipofectamine2000 Reagent according to
manufacturer's instruction. Four hours after transfection, cells were serum starved over night
before analysis.
2.2.2.2 Culture of primary hippocampal neurons
Preparation of cultures was performed according to standard procedures (Malgaroli and
Tsien, 1992; Reuter, 1995) and optimized for mouse hippocampal neurons (Dityatev et al.,
2000). Briefly, hippocampi of 1 - to 2 day old Naval Medical Research Institute mice were
were isolated, cut into small pieces in ice-cold Ca2+ and Mg2+ free Hanks balanced salt
solution with supplements and then treated with trypsin (3 mg/ml) and DNase (0.75 mg/2ml)
in digestion solution. After incubation in trypsin inhibitor for 10 minutes the tissue was kept in
dissection medium containing horse serum for 10 minutes to allow recovery from stress. The

22
cells were then dissociated by pipetting up and down with three fire-polished Pasteur pipettes
with sequentially smaller diameters and centrifuged at 80 x g. After counting the cells in a
Neubauer counting chamber were plated on cleaned and sterilized 13 mm cover slips coated
with poly-L-lysine (100 µg/ml) and laminin (40 µg/ml) at a density of 25000 – 30000 cells per
cover slip.
The culturing day was defined days in vitro 1 (DIV 1). For the next three days the cells were
incubated in culture medium (MEM eagle medium containing glucose (25.2 mM), transferrin
(1.3 mM), insulin (25 µg/ml), Glutamax I (2 mM), gentamicin (0.5 µl/ml), horse serum (0.1
ml/ml)) at 37° C and 5% CO2. Thereafter, at DIV 4, and every second day half of the medium
was replaced by Neurobasal-A-Medium containing L-glutamine (0.5 mM), b-FGF (125 ng/ml),
B-27 supplement (20 µl/ml), penicillin/streptomycin (10 µl/ml) and cytosine arabinoide (5 µM)
to feed the cells and to terminate glial mitosis. During the first week cells on the cover slip
established a cellular bilayer structure with a glia monolayer on the bottom and a neuronal
layer on the top. Neurons could be easily determined by their typical structure with a quite
round cell body and distinct neurites and by their ability to generate action potential when
recorded.
2.2.2.3 Culture of hippocampal slices (interface method)
Organotypic hippocampal slice cultures were prepared and maintained on the method for
rats (Stoppini et al., 1991) but adapted for mice. In brief, 6-day-old Naval Medical Research
Institute mice were decapitated. Hippocampi were removed and cut in slices (350 μm) under
sterile conditions in gassed (95% O2, 5% CO2), ice-cold minimal essential medium (MEM) at
pH 7.35. Slices were maintained on a biomembrane surface (0.4 μm, Millicell-CM, Millipore,
Eschborn, Germany) between culture medium (50% MEM, 25% Hanks’ balanced salt
solution, 25% horse serum and 2- mM -glutamine at pH 7.3) and humidified atmosphere (5%
CO2, 36.5 °C) in an incubator (Heraeus, Hanau, Germany). Culture medium was completely
replaced in the first 2 days and thereafter twice a week. Slices were used for experiments
after 7–10 days in vitro.

23
Fig. 3 Organotypic hippocampal slice
Organotypic hippocampal slices were prepared from P5 old mice and cultivated on a membrane for up to 10 days before analysis. The typical structures of the hippocampus, including the dentate gyrus, the CA1 and the CA3 regions are well preserved.
2.2.2.4 Slice culture preparation (rollertubes)
In brief, the hippocampi were dissected from 6 day-old Naval Medical Research Institute
mice pups killed by decapitation, and 350 µm-thick transverse slices were cut and attached
to glass coverslips with clotted chicken plasma. The coverslip and slice were placed in
individual sealed test-tubes containing semi-synthetic medium and maintained on a roller
drum in an incubator at 36°C for 2-4 weeks. The culture medium consisted of 50 % Eagle's
basal medium, 25 % balanced salt solution with either Hanks' or Earle's salts, 25 % heat-
inactivated horse serum, 33.3 mM D-glucose and 0·1 mM glutamine.
Transfections were carried out at DIV4 (primary culture) and at DIV2 (organotypic culture)
with a vector encoding for GFP using 1 g DNA for one coverslip and Lipofectamine2000
Reagent (Invitrogen) according to the manufacturer’s instruction.
All animals were housed, cared and killed in accordance with the recommendations of the
European Commission.

24
2.2.3 Electrophysiology
2.2.3.1 Patch clamp recording
The cover slips with the plated neurons were placed in the experimental chamber which was
perfused at a rate of 3.4 ml/min with room tempered extracellular solution using a perfusion
pump 505 S (Watson Marlow, Falmouth, UK). The extracellular solution was pH adjusted to
7.4 using NaOH and the osmolarity was calibrated to the actual values of the culture medium
of the neurons intended to use. The osmolarity of the culture medium ranged between 265
and 280 mOsm.
Neurons were patch clamped at the soma with a patch clamp amplifier EPC-9 using Pulse
software (HEKA, Lambrecht, Germany) in the whole cell configuration. Patch electrodes with
an electrode resistance of 8-10 MOhm were pulled from borosilicate capillaries (Hilgenberg,
Malsfeld, Germany) using a P-97 Puller (Sutter, Novato, USA) and filled with intracellular
solution, the osmolarity was calibrated to a value 15 mOsm less than the extracellular
solution. The recordings were filtered at 10 kHz (four pole Bessel filter) and collected at 10
kHz.
From DIV 9 on the neurons establish functional synapses that correlate with spontaneous
synaptic activity, sufficient to induce postsynaptic action potentials (Bartrup et al., 1997). In
following days the frequency of EPSPs and IPSPs increased, became associated and
established a burst-like activity. Neurons were recorded at DIV 11, just in the rising phase of
the increase of the synaptic activity to observe the clearest effects. 4-6 neurons per drug
incubation per experiment were chosen randomly and recorded in the current clamp mode at
least for 5 minutes. The membrane potential was held at rest or slightly hyperpolarized to -60
mV to establish comparable conditions. The frequency of single EPSPs and action potential
was obtained by counting them each second. The number of EPSPs during burst-like activity
could not be counted and were excluded from analysis as well as the IPSPs.
All data recordings were transferred to a PC-readable format and analysed by Clampfit 8
(Axon Instruments, USA) and PlotIT (Scientific Programming Enterprises, Haslett, USA).
Values are presented as mean ± SEM, N giving the number of experiments and n the
number of recorded neurons. Significance of effects was determined by unpaired t-tests

25
2.2.3.2 Miniature PSCs
Whole cell patch clamp recordings were performed in CA3 hippocampal neurons from
organotypic slices from mice. The extracellular solution in all experiments was aerated with
95% O2 and 5% CO2 and kept at 32ºC. Miniature PSCs (mPSCs) were recorded in the
presence of 0.5 µM tetrodotoxin (TTX). Signals with amplitudes of at least 2 times above the
background noise were selected. In all tested animals, there were no significant differences
in the noise levels between different genotypes. Patches with a serial resistance of >20 MΩ,
a membrane resistance of < 0.2 GΩ, or leak currents of > 300 pA were excluded. The
membrane currents were filtered by a four-pole Bessel filter at a corner frequency of 2 kHz,
and digitized at a sampling rate of 5 kHz using the DigiData 1322A interface (Molecular
Devices, Sunnyvale, CA). All data are expressed as mean ± standard error of the mean. P-
values represent the results of two-tailed unpaired Student's t tests, with or without Welch’s
correction, depending on the distribution of the data (tested with a Kolmogorov-Smirnov test).
Data acquisition and analysis was done using commercially available software: pClamp 9.2
and AxoGraph 4.6 (Molecular Devices, Sunnyvale, CA), MiniAnalysis (SynaptoSoft, Decatur,
GA) and Prism 4 (GraphPad Software, San Diego, CA)
2.2.3.3 Long Term Potentiation measurements
Animals were treated for 3 weeks twice daily with 5-HT7 antagonist SB 656104-A.
Hippocampal tissue slices were placed in an interface recording chamber of the Oslo style,
containing artificial cerebrospinal fluid (ACSF) and left undisturbed for at least 90 min. The
chamber was kept at 35-36 C°, aerated with 95% O2 - 5% CO2 (400 ml/min), and perfused
with oxygenated ACSF (3-4 ml/min).
The single barreled glass microelectrodes for extracellular recordings were pulled from thin-
walled borosilicate glass (GC150TF-10, Harvard Apparatus) using a horizontal puller (P-97,
Sutter Instruments).
Extracellular recordings of hippocampal slices were conducted in the following manner.
Evoked responses were elicited by 0.1 ms unipolar stimuli (Grass S88 stimulator with PSIU6
photoelectric stimulus isolation units, Grass Instruments) delivered via microwire electrodes

26
made from bare stainless steel wire (50 µm diameter, AM-Systems) and recorded as
described earlier (Müller and Somjen, 1998). Orthodromic responses were elicited by
stimulation of Schaffer collaterals and recorded in st. radiatum of the CA1 region, using a
locally constructed extracellular DC potential amplifier. Data were digitized by a DigiData
1322A (Molecular Devices, Sunnyvale, CA, USA). Data analysis was performed in Clampfit
9.0 (Molecular Devices, Sunnyvale, CA, USA). We evoked excitatory postsynaptic potentials
(fEPSPs) by placing the stimulation electrode in the stratum radiatum at CA3/CA1 junction
for the activation of Schaffer collaterals. In turn the recording electrode was placed in the
stratum radiatum of the CA1 region. We measured the magnitude of fEPSPs as amplitude
(baseline to peak) and slope (20-80% level of the falling phase). For input-output
relationship, fEPSPs were evoked with 0.1ms stimuli at 0.25Hz and an average of 4
consecutive responses was taken. fEPSP amplitudes and slopes were plotted against the
stimulus intensity (10 to 150µA). For paired-pulse facilitation (PPF) different inter-stimulus
intervals (25, 50, 75, 100, 125, 150, 175 and 200ms) were measured as the ratio of the
second fEPSP to the first fEPSP. The paired stimuli were set at 0.25Hz and an average of 4
consecutive responses was obtained. For long-term potentiation (LTP), baseline responses
were evoked every 20s for 5 min and LTP was induced by 1 train consisting of 100Hz
stimulation for 1s. The post-train responses were then measured every 20s for 60min and an
average of 4 consecutive responses was taken.
2.2.4 Behavioral tests
Animals: All experiments were permitted by the local Animal Care and Use Committee.
Behavioral tests were performed on C57BL/6NCrl (Charles River Laboratories, Sulzfeld,
Germany) mouse strain and employed 39 age-matched males. Mice were housed at 4–5 per
cage in a room with 12h light-dark cycle (lights on at 08:00h) and ad libitum access to
food/water. The order of testing was as follows: Elevated plus maze, open field, rotarod, hole
board, Morris water maze, cued and contextual fear conditioning. All mice were used for all
behavioral tests. The order of testing was designed according to increasing invasiveness to
minimize a possible influence of experimental history (McIlwain et al., 2001). Age of mice at

27
the beginning of testing was 11 weeks. Inter-test interval was at least 1-2 days. Behavioral
tests were performed in a blind fashion during the light phase of the day from 10:00 until
17:00h.
Injections: SB656104-A was dissolved in captisol and administrated intraperitonealy (IP) at
the dose 20 mg/kg twice a day (8:00 and 20:00h) during 3 weeks (number of animals, n=20).
Freshly made solution was used each day. The volume of injection was 0.01 ml/g of mouse
body weight. Control animals (n=19) were identically treated with the corresponding volume
of captisol vehicle solution. SB656104-A behavioral experiments were started next day after
the last injection.
Fig. 4 Time line of experimental design of the in vivo studies.
2.2.4.1 Behavior: experimental setup
Elevated plus maze: In this test of anxiety, mice were placed in the central platform, facing
an open arm of the plus-maze (made of grey plastic with a 5x5cm central platform, 30 x 5cm
open arms and 30 x 5 x 15cm closed arms; illumination 120 lx). The behavior was recorded
for 5 min by an overhead video camera and a PC equipped with “Viewer 2” software
(Biobserve GmbH, Bonn, Germany) to calculate the time spent in center, open and closed
arms, number of arm visits, and velocity. The time spent in open arms was used to estimate
open arm aversion (fear equivalent).

28
Open field: Spontaneous activity in the open field was tested in a grey Perspex arena (120
cm in diameter, 25 cm high; illumination 120 lx). Mice were placed in the center and allowed
to explore the open field for 7 min. The behavior was recorded by a PC-linked overhead
video camera. “Viewer 2” software was used to calculate velocity, time spent in central or
peripheral zones, and the number of the central zone visits in the open field.
Rotarod: The rotarod test examines motor function, balance, and coordination. It comprised
a rotating drum (Ugo Basile, Comerio, Varese, Italy), which was accelerated from 4 to 40rpm
over 5min. Mice were placed individually on the drum and the latency of falling off the drum
was recorded using a stop-watch. To assess motor learning, the rotarod test was repeated
24h later.
Hole board: The hole board test for exploratory activity was performed in a 21 x 21 x 36 cm
transparent Perspex chamber with a non-transparent floor raised 5 cm above the bottom of
the chamber, with 12 equally spaced holes, 2 cm in diameter. Mice were allowed to explore
the chamber for 3 min and the number of explored holes (head dips) was scored by a trained
experimenter.
Spatial learning and memory was assessed in a water maze (Morris, 1984). A large
circular tank (diameter 1.2 m, depth 0.4 m) was filled with opaque water (25±1˚C, depth 0.3
m) and the escape platform (10x10 cm) was submerged 1 cm below the surface. The
swimming patterns were monitored by a computer and the video-tracking system “Viewer 2”.
The escape latency, swim speed, path length, and trajectory of swimming were recorded for
each mouse. During the first 2 days, mice were trained to swim to a clearly visible platform
(visible platform task) that was marked with a 15 cm high black flag and placed pseudo-
randomly in different locations across trials (non-spatial training). The extra-maze cues were
hidden during these trials. After 2 days of visible platform training, hidden platform training
(spatial training) was performed. For 8 days, mice were trained to find a hidden platform (i.e.
the flag was removed) that was located at the center of one of the 4 quadrants of the pool.
The location of the platform was fixed throughout testing. Mice had to navigate using extra-
maze cues that were placed on the walls of the testing room. Every day, mice went through 4
trials with an inter-trial interval of 5 min. The mice were placed into the pool facing the side

29
wall randomly at 1 of 4 start locations and allowed to swim until they found the platform, or
for a maximum of 90 s. Any mouse that failed to find the platform within 90 s was guided to
the platform. The animal then remained on the platform for 20 s before being removed from
the pool. The next day after completion of the hidden platform training, a probe trial was
conducted in order to determine whether mice used a spatial strategy to find the platform or
not. The platform was removed from the pool and the mice were allowed to swim freely for
90 s. The percentage of time spent in each quadrant of the pool as well as the number of
times the mice crossed the former position of the hidden platform were recorded.
Cued and contextual fear conditioning: The fear conditioning test was performed as
described by Radyushkin et al. (Radyushkin et al., 2005). Mice were trained within the same
session for both contextual and cued fear conditioning. Training consisted of exposing mice
for 120 s to the context to assess the baseline level of activity. This period was followed by a
10 s, 5 kHz, 85 dB tone (conditioned stimulus, CS). Immediately after the tone, a 2 s, 0.4 mA
foot shock (unconditioned stimulus, US) was applied. This CS-US pairing was repeated 13 s
later. All mice remained in the conditioning chambers for an additional 23 s following the
second CS–US pairing. The contextual memory test was performed 24 h after this training.
Mice were monitored over 2 min for freezing in the same context as used for training. The
cued memory test was performed 27 h after training in a new chamber. First, mice were
monitored for freezing over a 2 min pre-cue period with no tone to assess freezing in the new
context. Next, a 2 min cue period followed in which the tone was presented. Duration of
freezing behavior, defined as the absolute lack of movement (excluding respiratory
movements), was recorded by a video camera and a PC equipped with ‘Video freeze’
software (MED Associates, St. Albans, Vermont, USA).
Statistical analysis: Unless stated otherwise, the data given in figures and text are expressed
as mean ± SEM. Data were compared by either 2-way ANOVA for repeated measures or by
non-parametric Mann-Whitney U-test where appropriate. For analysis, SPSS v.14 software
(SPSS Inc., Chicago, IL, USA) was used. A p-value below 0.05 was considered to be
significant.

30
2.2.5 Confocal imaging and FRET analysis
2.2.5.1 Immunocytochemisty and Dendrite Morphology Analysis
For immunostaining neurons were fixed by using 4% paraformaldehyde in PBS at 4 ºC for 20
min followed by quenching of free formaldehyde with 50 mM glycine for 15 min. Cell
permeabilization was achieved with 0.2% Triton X-100 in PBS for 10 min. After incubation in
blocking solution (10% BSA in PBS), primary antibodies against Synaptophysin (1:200,
Sigma) and PSD-95 (1:200, Santa Cruz) were applied overnight followed by rinses in PBS
and staining with secondary antibodies Alexa Fluor 488 (1:500, Invitrogen) and Cy3 (1:1000,
Jackson ImmunoResearch) at room temperature. Coverslips were mounted in fluorescent
mounting medium (Dako) and for dendritic morphology analysis.
Images were acquired on a Zeiss LSM 510 laser-scanning confocal microscope with a 40x
oil-immersion Plan-Neofluor objective. Short protrusions were defined by a length > 3 m
and long protrusions were identified by a length of 10-30 m, synaptic clusters were
identified by synaptophysin puncta. 30 randomly collected images were used and counting
was performed manually on 50 m long dendrites.
Three dimensional analysis of dendritic spines was performed using a 3D reconstruction
software developed by Herzog et al. (Herzog et al., 2006) which allowed to measure the
geometric parameters of dendritic spines from confocal microscopic image stacks. Data are
presented as mean ± SEM. Statistical comparisons were assessed with paired t-test; p <
0.05 was taken as significant.
2.2.5.2 Confocal imaging and single-cell acceptor photobleaching FRET
analysis
“Images of N1E-115 cells expressing 5-HT1A-CFP and 5-HT1A-YFP fusion proteins were
acquired with an LSM510-Meta confocal microscope (Carl Zeiss Jena) equipped with a
40x/1.3 NA oil-immersion objective at 512 x 512 pixels. The 458 nm line of a 40 mW argon
laser was used at 15% power. Fluorescence emission was acquired from individual cells

31
over fourteen lambda channels, at 10.7 nm steps, ranging from 475 to 625 nm. For each
measurement a series of 8 images was acquired over a duration of 124 seconds. After the
4th image acquisition, bleaching of the acceptor (YFP) was performed in a selected 20 x 20
pixel region of interest in the plasma membrane. For that the 514 nm line of the Argon laser
set at 50% power and 100% transmission for 300 scanning interactions using a
458nm/514nm dual dichroic mirror was used. Linear unmixing was performed by the Zeiss
AIM software package using CFP and YFP reference spectra obtained from images of cells
expressing only 5-HT1A-CFP or 5-HT1A-YFP acquired with acquisition settings mentioned
above. Apparent FRET efficiency was calculated offline using the equation,
1)
where fD is the fraction of donor participating in the FRET complex (i.e. ratio of FRET
complexes over a total donor concentration, DA / Dt , FDA and FD are the background
subtracted and acquisition bleaching corrected pre- and post-bleach CFP fluorescence
intensities, respectively. The acquisition bleaching corrected post-bleach CFP intensities
were calculated as
2)
where and refer to CFP intensities of the bleach and reference region of interest, and
pre and post refer to pre-bleach and post-bleach measurements.
FDB FD
R
2.2.5.3 Spectral FRET analysis in living cells
Mouse N1E-115 neuroblastoma cells were co-transfected with plasmid DNAs encoding for
wild-type and/or acylation-deficient 5-HT1A receptors fused with CFP and YFP. Sixteen
hours after transfection, cells were resuspended in PBS. All measurements were performed

32
in 5 mm pathway quartz cuvettes using a spectrofluorometer (Fluorolog, Horiba JobinYvon)
equipped with xenon lamp (450 W, 950V). The cell suspension was stirred with a magnetic
stirrer while the temperature was maintained at 37°C during the experiment.
For calibration measurements, cells were co-transfected with plasmid encoding a single
fluorophore-tagged 5-HT1A receptor together with an equal amount of plasmid encoding HA-
tagged 5-HT1A receptor. During the time-course experiments, two emission spectra were
obtained for each time point by exciting at 458 nm and 488 nm with 5 nm spectral resolution
for excitation and emission and 0.5 second integration time. The spectral contributions due to
light scattering and non-specific fluorescence of the cells were taken into account by
subtracting the emission spectra of non-transfected cells (background) from each measured
spectra. Before each measurement, the spectrofluorometer was calibrated for the xenon-
lamp spectrum and Raman scattering peak position.
Stimulation of 5-HT1A receptors was carried out using serotonin (Sigma) at a final
concentration of 10 µM. For antagonist treatment, WAY 100135 (Tocris) at a final
concentration of 1 µM was used. Cholesterol depletion was carried out by treating cells with
2% methyl-ß-cyclodextrin (MßCD) in serum-free DMEM for 45 min at 37°C.
2.2.5.4 Apparent FRET efficiency calculations
To determine changes in apparent FRET efficiency due to 5-HT1A receptor activation by
serotonin we used a recently developed method described in detail by Wlodarczyk et al.
(Wlodarczyk et al., 2008). Calibration measurements were carried out with cells expressing
only donor Dref (5-HT1A-CFP) or acceptor Aref (5-HT1A-YFP) using two excitation
wavelengths (i=1,2) as described in the previous section. Calibration measurements
allowed us to obtain the concentration related extinction coefficient ratio
r i Di Dref / ArefA
i . This was done by fitting the curve resulting from acceptor reference
spectra multiplied by the quantum yield and emission characteristics of the donor (i.e.
emission spectra normalized to unit area) to that of donor reference spectra multiplied by the
quantum yield, and emission characteristics of the acceptor (Wlodarczyk et al., 2008).

33
We also performed reference measurements with cells co-expressing 5-HT1A-CFP and 5-
HT1A-YFP receptors. Combinations of the acceptor and donor reference spectra were fitted
to the measured spectra of cells co-expressing 5-HT1A-CFP and 5-HT1A-YFP and the
apparent relative acceptor and donor concentrations and , respectively, were obtained
as the weights of those fits.
The quantities , obtained together with two scaling factors ( ) reflecting the excitation
ratios of two fluorophores at a given excitation wavelength , allow for a calculation of the
total concentration ratio At / Dt of donor and acceptor as well as the apparent FRET
efficiencies EfA and EfD, where fA and fD are the fractions of acceptors and donors in
complexes.
3)
and
4)
where is a concentration ratio calculated as,
5)
with the definitions and . Where and
representing the fractions of donor and acceptor participating in complexes.

34
2.2.5.5 Analysis of specific vs. random receptor-receptor interactions
In order to distinguish between receptors interacting randomly from those with specific
interaction, apparent FRET efficiencies were obtained for various acceptor to donor ratios by
keeping the total concentration of fluorophores constant. It has been proposed that the
dependency of EfD on At / Dt for dimers differs from that of EfD resulting from random
interaction (Veatch and Stryer, 1977). The apparent FRET efficiency EfD obtained from our
experimental data was plotted as a function of the total acceptor to donor ratio
and fitted by least square minimization to the following equation, as proposed previously by
Veatch and Stryer (Veatch and Stryer, 1977) and later modified by James et al (James et al.,
2006) to the form
6)
,
where E is the characteristic FRET efficiency. It is also notable, that the above equation was
derived for the case of high-affinity dimerization reaction (Veatch and Stryer, 1977).
2.2.5.6 Fluorescence lifetime FRET measurements
Fluorescence intensity decays were obtained by time-correlated single photon-counting
measurements of fluorescence using a Fluorolog-3 spectrofluorometer (Horiba Jobin Yvon,
München, Germany). Samples were placed in 10-mm pathway quartz cuvettes (1010 mm2)
and continuously stirred with a magnetic stirrer. Emission was collected in right angle
geometry. Excitation was performed with a 460 nm nanoLED with a 440/40 nm transmission
filter (Semrock, Tubingen, Germany). Fluorescence intensity was measured in the
wavelength band from 468 nm to 482 nm to avoid acceptor fluorescence. Typical
fluorescence decays were fitted with the resulting sum of one, two, or three exponentials,
interatively convolved with the instrument response function using the standard DataStation
analysis software provided by Horiba Jobin Yvon and CFS LS software (available from

35
Center for Fluorescence Spectroscopy at http://cfs.umbi.umd.edu/cfs/software/). The quality
of the fits was evaluated by the structure observed in the plots of residuals and by the
reduced chi-square values. The mean fluorescence lifetimes were calculated as the
amplitude-weighted lifetimes. In several experiments cholesterol depletion was carried out by
treating cells with 2% methyl-ß-cyclodextrin (MßCD) in serum-free DMEM for 45 min at 37°C
before the analysis (Kobe et al, 2008).

36
3 RESULTS
3.1 Functional role of 5-HT7/G12 signaling
3.1.1 5-HT7 Receptor activation induces formation of dendritic filopodia and
new synapses
Our recent studies demonstrated that the 5-HT7 receptor is coupled to heterotrimeric G12
proteins, and that receptor stimulation results in G12-mediated activation of Cdc42 small
GTPase, which is known as a positive regulator promoting neurite extension (Kvachnina et
al., 2005). To investigate the role of the 5-HT7R/G12 signaling pathway in dendritic
morphogenesis, we used primary cultures of hippocampal neurons, which allowed for better
visualization of morphological events as well as for functional analysis. We selected a time
point (10 to 12 days in vitro incubation of culture, prepared at postnatal day 1) at which
dendritic morphology is subject to change and well defined synapses are formed (Bartrup et
al., 1997) (Figure 6). To be able to evaluate receptor-mediated morphological changes,
neurons were incubated with low concentration of 5-HT7 receptor agonist 5-CT (100 nM)
during the last 4 days before analysis. Neurons were also transfected with GFP, to visualize
the morphology of single cells. Post-fixation, dendritic morphology of the neurons was
imaged using confocal microscopy. We used single-factor ANOVA analysis to quantify this
and all other data sets and to determine the statistical significance of the differences between
experimental groups. Agonist treatment resulted in dramatic overall increase in the number
of dendritic protrusions in comparison to non-treated control (Figure 5 D, E, number of short
dendritic protrusions (SP) per 50 µm of dendritic length 4.4 ± 0.45 in control vs. 11.3 ±1.27
after 5-CT treatment, number of long (over 10 µm) dendritic protrusions (LP) 0.4 ± 0.16 in
control vs. 3.1 ± 0.5 after 5-CT treatment, n = 30, p <0,0001). These morphogenic effects
were receptor-specific because they were inhibited by an antagonist of the 5-HT7 receptor,
SB-269970 (Figure 5).

37
Fig. 5 Synaptic clusters and morphological changes in dendrites after stimulation of the 5-HT7 receptor
(A) Synaptophysin puncta in dendrites of control, 5-CT and 5-CT + SB-269970 treated neurons. (B) Dendrite morphology of control, 5-CT (100 nM) and 5-CT + SB-269970 (1μM) treated neurons. The number of short (< 3m) (D) and long dendritic protrusions (>10 m) (E) were increased in 5-CT treated neurons as compared to control neurons. (C) Quantification of synaptophysin puncta in control and in 5-CT treated neurons shows an increase of puncta in the 5-CT treated neurons. Protrusions and puncta were counted on 50 m long dendrites. n = 30, Values represent means ± SE, p < 0.0001.

38
To address the question whether the 5-HT7R-mediated signaling affects synaptic density, we
quantified the number of synapses by labeling of GFP transfected neurons with the
presynaptic structural synaptic marker synaptophysin (De Paola et al., 2003). Prolonged
treatment of neurons with 5-CT increased the density of synaptophysin puncta from 6.2 ±
0.49 (n = 30) to 17.4 ± 1.46 (n = 30) per 50 µm of dendrite (Figure 5C). The synapses formed
in both 5-CT treated and in control neurons appear to be structurally intact, as defined by
colocalization of postsynaptic density protein PSD95 and synaptophysin puncta with respect
to each other (Figure 6). Similarly to the effects on formation of dendritic protrusions, the
synaptogenic effects of 5-CT were abolished upon treatment with 5-HT7 receptor antagonist
(Figure 5).
Fig. 6 Structurally intact synapses
The synapses formed in both 5-CT treated and in control neurons appear to be structurally intact, as defined by colocalization of two synaptic markers: the postsynaptic density protein PSD95 and synaptophysin puncta.

39
3.1.2 Morpho- and synaptogenic effects of the 5-HT7 receptor are mediated by
the G12 Protein
In addition to coupling to the heterotrimeric G12 protein, the 5-HT7 receptor can stimulate
cAMP formation by activating adenylyl cyclases via a stimulatory GS-protein. The GS-
mediated signaling is also known to regulate the cellular morphology either by modulating
cAMP concentration (Corset et al., 2000) or by direct binding of GS to the cytoskeleton (Yu
et al., 2009). To investigate whether the morphogenic effects of 5-HT7 receptor include the
GS-mediated component, we analyzed the primary hippocampal neurons prepared from
G12 deficient mice. Initial studies of the G12-knockout mice have demonstrated that these
animals are alive and show no apparent phenotype (Gu et al., 2002). Analysis of dendritic
morphology revealed that even without any treatment the number of dendritic protrusions in
G12-knockout neurons was significantly reduced in comparison to the neurons from the
wild type mice (SP to 72.5 ± 3.7%, LP to 68. 2 ± 11.8%, n=30, p<0.001 Figure 7 D, E).
Additionally the density of synapses assessed by the analysis of synaptophysin puncta was
diminished to 88.5 ± 3.2% (Figure 7C), suggesting that basal G12-mediated activity may be
involved in neuronal morpho- and synaptogenesis. Prolonged treatment of G12 deficient
neurons with 5-HT7 receptor agonist 5-CT had no effect on neuronal morphology. (Figure 7).
Statistical analysis revealed that both the number of dendritic protrusions as well as the
density of synaptophysin puncta in treated and non-treated neurons isolated from G12 -
knockout were similar and statistically indistinguishable (5-CT, SP, 81 ± 5.9%, LP, 65.9 ±
10.6%, synaptic cluster density, 86.9 ± 2.9%, Figure 7). In contrast, these parameters were
significantly increased after agonist treatment of neurons prepared form the wild-type
animals (5-CT, SP, 169.3± 10.4%, LP, 245.5 ± 28.8.6%, synaptic cluster density, 179.2 ±
2.9%, Figure 7), demonstrating that receptor-mediated activation of G12 protein is
necessary for the morpho- and synaptogenic effects obtained upon stimulation of the 5-HT7
receptor.

40
Fig. 7 Synaptogenesis and morphological changes in dendrites are mediated by the G12 protein
Synaptophysin puncta, short and long protrusions in dendrites of wild-type and G12 knockout mice after treatment with vehicle, 5-CT and 5-CT + SB-269970. Cells were treated with 100 nM 5-CT and 1μM SB-269970 up to 4 days. (A) shows changes in morphology of dendrites in G12 knockout mice compared to wild-type mice whereas (B) represents changes in morphology after 5-CT treatment. (scale bars: 10m) (C) shows a significant decrease (in %) in the number of synapses of dendrites of G12 knockout mice compared to wild-type; after treatment with 5-CT the number of synapses become significantly increased in wild-type mice but remain almost unchanged in G12 knockout mice. (D) demonstrates a significant decrease (%) in the number of short protrusions in neurons of G12 knockout mice compared to wild-type mice, again after treatment with 5-CT a significant increase in the number of short protrusions in wild-type neurons can be observed while the number of short protrusions in G12 knockout mice are not significantly changed. (E) indicates that there is also a significant decrease in the number of long protrusions between in neurons of G12 knockout mice compared to wild-type mice, and similiarly treatment with 5-CT leads only in neuron of wild-type mice to an increase of long protrusions. All experiments were carried out on 50 m long dendrites. n = 30, Values represent means ± SE, p < 0.0001.

41
3.1.3 Effect of 5-HT7/G12 signaling on EPSCs and spike frequency
Having demonstrated that 5-HT7 receptor-mediated activation of the G12 increases
dendritic arborisation and stimulates formation of new synapses, we tested whether the
synaptic properties of these neurons become changed. Spontaneous excitatory postsynaptic
synaptic currents (EPSCs) as well as spontaneous firing activity were monitored by whole-
cell recording from neurons cultured from P2 mouse hippocampus after 10 days in culture
(DIV10, Figure 8A). At this time point neurons form synaptic connections and both
spontaneous EPSCs and spikes are measurable. Under control conditions, the EPSP
frequency ranged from 0.03 to 2.4 Hz with a mean of 0.69 ± 0.11 Hz (Figure 8 B, C, D; n=29;
mean ± SEM). The values were similar between different preparation, indicating comparable
culturing and developmental conditions. In neurons incubated with 5-CT (100 nM) during the
last 4 days before recording, the EPSP frequency was significantly increased (Figure 8, D, E,
mean of 4.85 ± 0.53 Hz, n=29; P<0.0000001). The similar effect of prolonged 5-CT treatment
was also obtained, when the spike frequency was statistically evaluated (0.06 ± 0.03 Hz in
control vs. 0.62 ± 0.15 Hz in 5-CT treated neurons, n=29; P<0.001). It is known that 5-CT is a
partial agonist for other serotonin receptors, including 5-HT1 and 5-HT5 (Beer et al., 1992;
Wood et al., 2000). To prove that synaptic effects obtained after prolonged 5-CT treatment
were mediated only by the 5-HT7 receptor, neurons were treated with the selective 5-HT7
receptor antagonist SB269970 (1 µM) along with 5-CT. Statistical analysis revealed that the
antagonist treatment reduced both EPSC as well as spike frequency to the control level
(EPSC, 1.14 ± 0.17, N=3, n=16; spike frequency, 0.02 ± 0.01 Hz, N=2, n=11). These results
demonstrate that prolonged activation of the 5-HT7/G12 signaling pathway may result not
only in structural, but also in functional changes of neuronal properties. Experiments were
carried out in collaboration with Dietmar Hess.
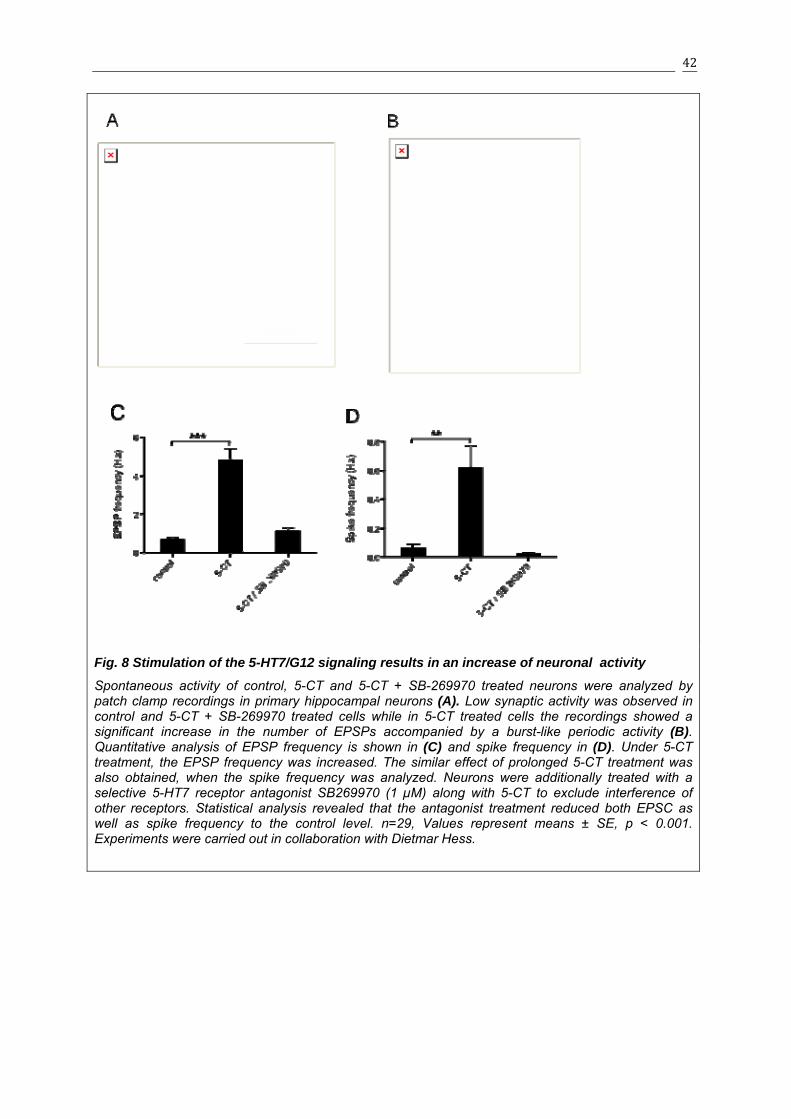
42
Fig. 8 Stimulation of the 5-HT7/G12 signaling results in an increase of neuronal activity
Spontaneous activity of control, 5-CT and 5-CT + SB-269970 treated neurons were analyzed by patch clamp recordings in primary hippocampal neurons (A). Low synaptic activity was observed in control and 5-CT + SB-269970 treated cells while in 5-CT treated cells the recordings showed a significant increase in the number of EPSPs accompanied by a burst-like periodic activity (B). Quantitative analysis of EPSP frequency is shown in (C) and spike frequency in (D). Under 5-CT treatment, the EPSP frequency was increased. The similar effect of prolonged 5-CT treatment was also obtained, when the spike frequency was analyzed. Neurons were additionally treated with a selective 5-HT7 receptor antagonist SB269970 (1 µM) along with 5-CT to exclude interference of other receptors. Statistical analysis revealed that the antagonist treatment reduced both EPSC as well as spike frequency to the control level. n=29, Values represent means ± SE, p < 0.001. Experiments were carried out in collaboration with Dietmar Hess.

43
3.1.4 Effects of 5-HT7R/G12 signaling on neuronal morphology in organotypic
cultures
The critical question for any results obtained in dissociated neuronal cultures is whether they
can be reproduced in vivo. To analyze the role of 5-HT7R/G12 signaling under in vivo-like
conditions, we established organotypic slice cultures from the hippocampus of the mouse. In
such preparations the main characteristic morphological organization of the hippocampus is
well-preserved (Figure 3), and the maturation of different cell types, synaptic contacts, and
receptor expression resembles that seen in vivo (Gähwiler et al., 1997; Gogolla et al., 2006).
Organotypic slices were prepared from P5 mice and maintained for 5 to 6 days in vitro before
analysis. The day after preparation, slices were transfected with GFP to visualize the
morphology of single neurons. During the last 4 days, 5-HT7 receptor agonist 5-CT (either
alone or in combination with the antagonist SB269970) was added to the cell culture
medium. Post-fixation, dendritic morphology of GFP-positive neurons was imaged by
confocal microscopy and 3D reconstructed (Figure 9 A,) (Herzog et al., 2006). We observed
that 5-CT treatment resulted in dramatic spine morphogenesis. This structural plasticity
appeared as an increase in the number of spines, while the spine morphology was not
affected. Morphological effects were mediated by the 5-HT7 receptor, because they were
reduced by the selective receptor antagonist SB269970 (Figure 9B). In treated neurons the
spine density (2.06 ± 0.11 spines/10 µm versus 5.92 ± 0.09 spines/10 µm, p, < 0,0001,
agonist + antagonist, 3.45 ± 0.16 spines/10 µm) was markedly increased as compared to
control preparations (Figure 8B). In contrast the surface area (0.67 ± 0,11 µm2 versus 0.83 ±
0,04 µm2), length (2.85 ± 0,17 µm versus 2.75 ± 0.09 µm), diameter (0.20 ± 0.02 µm versus
0.20 ± 0.01 µm) and volume (0.039 ± 0.04 µm3 versus 0.042 ± 0.004 µm3) of spines in
neurons from treated preparations were similar to the control values (Figure 8B), suggesting
a critical role of the 5-HT7/G12 signaling in formation of the new spines. 3D reconstructions
were carried out in collaboration with Sören Westerholz.

44
Fig. 9 Confocal images and 3D reconstructions of neurons in hippocampal slices
(A) Organotypic hippocampal slices were prepared as described in Material and Methods, Z-stacks of confocal images of dendrites were taken of control, 5-CT and 5-CT + SB-269970 treated preparations. From these data 3D images were reconstructed and analyzed according to the method described in Material and Methods. (B) Quantitative morphological analysis of reconstructed 3D images of dendrites in hippocampal slices. In treated neurons the spine density was markedly increased as compared to control preparations, p < 0.001. In contrast the surface area, diameter and volume of spines in neurons from treated preparations were similar to the control values. n=30, values represent means ± SE. Experiments were carried out in collaboration with Sören Westerholz.

45
3.1.5 5-HT7R/G12 signaling leads to changes in miniature postsynaptic
currents (mPSCs) in organotypic hippocampal slices
To investigate whether the elevated spinogenesis obtained upon stimulation of 5-HT7/G12
signaling pathway can modulate synaptic strength, we measured the basal synaptic
properties of the CA3 neurons from organotypic hippocampal slices by recording miniature
postsynaptic currents (mPSCs) using whole-cell patch-clamp recordings in the presence of
TTX (0.5 µM) (Figure 10A). The treatment of organotypic slices for 4 days with 5-CT (100
nM) increased amplitudes (52.19 0.3 pA in treated neurons, n = 9; 43.37 0.22 pA in
control neurons, n= 9; p < 0.01) (Figure 10B), without significantly affecting mPSCs
frequency (Figure 10C).
These results suggest that in addition to morphological effects (formation of new spines),
activation of 5-HT7/G12 signaling results in an increase of total synaptic strength. To
analyze, whether the changes in mean mPSCs amplitude take place in proportional manner
and therefore reflect a synaptic scaling (Turrigiano and Nelson, 2004), we plotted mPSC
amplitude as a cumulative probability histogram (Figure 10D). As expected from the changes
in mPSC amplitudes, the graph from neurons chronically treated with 5-CT was shifted to the
right, when compared to the control cultures. Transforming of experimental graphs by
multiplying each value by the same factor derived from the best-fit equation (Turrigiano et al.,
1998) results in the left shifting and essential overlay of the graphs with the control
distribution. These results suggest that by changing the number of functional synapses, the
activation of 5-HT7/G12 signaling pathway can trigger the synaptic scaling. Measurements
were carried out in collaboration with Lucian Medrihan.

46
Fig. 10 Treatment with 5-CT increase the amplitude of miniature PSCs in CA3 hippocampal neurons from organotypic slices
(A) Representative recordings of pharmacologically isolated miniature postsynaptic currents (mPSCs) in CA3 hippocampal neurons from organotypic slices in the presence of TTX (0.5 µM). Averaged amplitude (B) and frequencies (C) of miniature PSCs in control and treated neurons.(D) plot of mPSC amplitude as a cumulative probability histogram, n=9, values represent means ± SEM, p < 0.001 Experiments were carried out in collaboration with Lucian Medrihan.
3.1.6 5-HT7R/G12 Signaling modulates neuronal excitability and LTP in
organotypic cultures
Having demonstrated that stimulation of the 5-HT7 receptor results in pronounced structural
change of hippocampal neurons, we asked whether it can influence the functional properties
of neurons and thus modulate hippocampal networks. For that, we performed
electrophysiological recordings in organotypic slices prepared from P5 mice at DIV7, after 4
days in vitro incubation with low concentration of 5-HT7 agonist 5-CT (100 nM). To
investigate the effect of 5-HT7/G12 signaling on synaptic transmission, we performed extra-
cellular recordings of field excitatory postsynaptic potentials (fEPSPs) by measurement of

47
evoked responses from the stratum radiatum at the CA1 region after stimulation of Schaffer
collaterals. First, input-output curves were generated by plotting the stimulation intensity
versus the amplitude of fEPSP (Figure 11A). While the maximal responses obtained at the
higher stimulation intensity (100 µA to 150 µA) in the 5-CT treated (n = 12) and in control (n =
15) slices were quite similar, the average fEPSP amplitudes at the low stimulation strength
(10 µA to 40 µA) were significantly increased in treated preparations (Figure 11A,C). The
shift of the input-output curve to the left means that in the 5-CT treated slices the same
presynaptic stimulus elicited a larger postsynaptic response, indicating an increase in basal
excitability, which results in a decrease in threshold for the generation of evoked population
spikes.
Fig. 11 Stimulation of 5-HT7/G12 signaling increases basal neuronal excitability
(A) Input-output curve as a measure of baseline excitatory synaptic transmission, here the fEPSP amplitude is plotted against the stimulation strength. The maximal responses obtained at high stimulation intensities (100 µA to 150 µA) in the 5-CT treated (n = 12) and in control (n = 15) slices are similar, but the averages fEPSP amplitudes at the low stimulation strength (10 µA to 40 µA) were significantly increased in treated 5-CT preparations, indicating an increased basal activity in 5-CT treated slices. (B) Paired pulse facilitation is not altered in 5-CT treated slices. (C) Sample recordings for the input-output curve at 50% of maximal response (average of four traces) are shown for control and 5-CT-treated mice.

48
This finding raises the question whether the 5-CT mediated enhancement of the fEPSP
amplitudes occurs pre- or post-synaptically. To test this we investigated the differences in
paired-pulse facilitation (PPF), which is measure of use-dependent changes in synaptic
efficacy and is considered to be a pre-synaptic form of short-term plasticity (Turrigiano et al.,
1998; Thompson, 2000; Zucker and Regehr, 2002). Analysis of the ratio of PPF evoked
using inter-stimulus intervals between 25 and 200 ms does not reveal any significant
differences between control and 5-CT treated slices (Figure 6), suggesting a postsynaptic
mechanisms of the 5-HT7 receptor-mediated enhancement of neuronal excitability.
The reduction of threshold for generation of evoked population spikes in 5-CT treated slices
prompted us to investigate whether the induction of activity-dependent synaptic plasticity is
also affected upon stimulation of 5-HT7R/G12 signaling. Long-term potentiation (LTP) was
induced by theta-burst stimulation (TBS) of Schaffer collaterals at 100 Hz. In these
experiments we reproducibly found that 5-CT treatment markedly changed induction of LTP
in organotypic cultures (Figure 7). Already the initial increase in the fEPSP slope (0 - 5 min)
was significantly lower in 5-CT treated (1,624 ± 0,01591 SEM n=13) than in control cultures
(1,773 ± 0,01853 SEM, n=16, p<0.001, Figure7). One hour after the LTP-inducing, the
potentiation remained significantly decreased in 5-CT treated cultures (50–60 min: 1,622 ±
0,02009 SEM, n=16) as compared to control preparation (2,016 ± 0,008221 SEM, n=13,
p<0.001, Figure 7). In combination with results obtained by measurement of evoked fEPSPs
(Figure 6) and mEPSC (Figure5) this data suggest that increased basal neuronal excitability
mediated by the stimulation of 5-HT7/G12 signaling pathway may result in pre-potentiation of
synaptic transmission leading to quick LTP saturation, which prevents further potentiation.
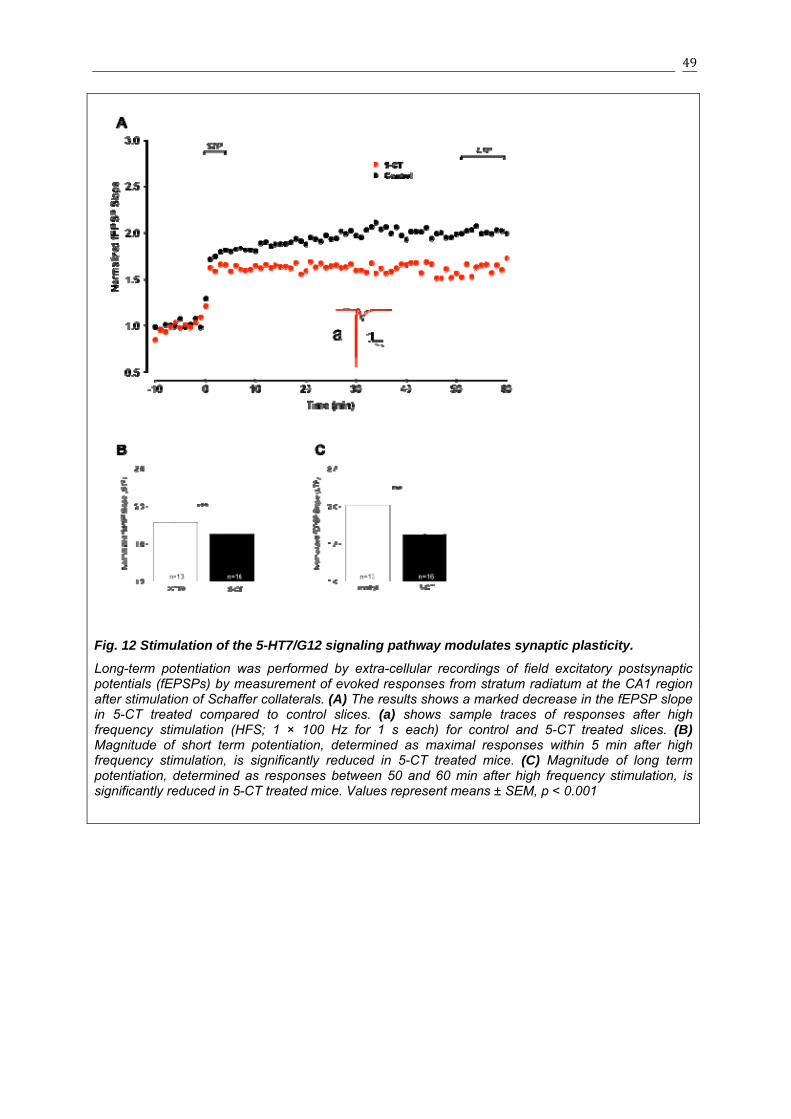
49
Fig. 12 Stimulation of the 5-HT7/G12 signaling pathway modulates synaptic plasticity.
Long-term potentiation was performed by extra-cellular recordings of field excitatory postsynaptic potentials (fEPSPs) by measurement of evoked responses from stratum radiatum at the CA1 region after stimulation of Schaffer collaterals. (A) The results shows a marked decrease in the fEPSP slope in 5-CT treated compared to control slices. (a) shows sample traces of responses after high frequency stimulation (HFS; 1 × 100 Hz for 1 s each) for control and 5-CT treated slices. (B) Magnitude of short term potentiation, determined as maximal responses within 5 min after high frequency stimulation, is significantly reduced in 5-CT treated mice. (C) Magnitude of long term potentiation, determined as responses between 50 and 60 min after high frequency stimulation, is significantly reduced in 5-CT treated mice. Values represent means ± SEM, p < 0.001

50
3.1.7 In vivo effects of treatment with 5-HT7 receptor antagonist
Experiments performed in organotypic slices from young (P5) mice showed apparent
changes in neuronal morphology and synaptic plasticity upon 5-HT7 receptor activation. To
test for the possible functional role of 5-HT7/G12 signaling upon in vivo conditions,
behavioral and electrophysiological studies were performed by using 10 weeks old male
mice chronically treated with the highly selective 5-HT7 receptor antagonist SB656104. This
antagonist penetrates the blood brain barrier, and its pharmaco-kinetic properties are well
known (Forbes et al., 2002). Animals were treated for 3 weeks twice daily by IP injection of
20mg compound per kg/bodyweight. Analysis of different behavior aspects including anxiety,
general activity, motor balance / coordination and exploratory activity demonstrated no
significant changes between treated and control groups, although the motor learning and
exploration behavior were negatively affected by the treatment with antagonist (Figure 13).
Also no effects of chronic treated with SB656104 were found on both hippocampus
dependent and independent learning and memory, which were analyzed by Morris water
maze and fear conditioning tasks, respectively (Figure 14). Behavioral studies were
performed in collaboration with Konstantin Radyushkin and Ahmed El-Khordi. Analysis of the
basal neuronal excitibility and synaptic plasticity in acute slices obtained from antagonist-
treated mice revealed the opposite to 5-CT effects (decrease of basal excitibility (Figure 15)
and increase of LTP Figure 15)), although the extent of changes were moderate. The fEPSP
slope (0 - 5 min) was almost unchanged in SB656104 treated (1,566 ± 0,009372 SEM, n=8)
compared to control cultures (1,573 ± 0,01243 SEM, n=7, n.s., (Figure 15 B). One hour after
the induction of LTP a slight but significant potentiation was observed in SB656104 treated
cultures (50–60 min: 1,302 ± 0,002023 SEM n=8) as compared to the control preparation
(1,231 ± 0,004910 SEM n=7, p<0.001, Figure 15 C).

51
Fig. 13 Treatment of adult mice with SB656104-A does not change basic behavior
A-C. Elevated plus maze. D-E. Open field test. G. Rotarod. H. Hole board test. Abbreviations: Veh - vehicle treated group; SB - SB656104-A treated group. No statistically significant differences were detected. Experiments were carried out in collaboration with Konstantin Radyushkin and Ahmed El-Khordi.

52
Fig. 14. Chronic treatment of adult mice with SB656104-A does not change learning and memory in Morris water maze and fear conditioning
Water maze: A – visible platform task; B – hidden platform task; C – time spent in quadrants during probe trial; D – visits of the former target location during probe trial; E – probe trial swimming velocity. F – cued and contextual fear conditioning. Abbreviations: Veh – vehicle treated group; SB - SB656104-A treated group. No statistically significant differences detected. Experiments were carried out in collaboration with Konstantin Radyushkin and Ahmed El-Khordi.

53
Fig. 15. Inhibition of 5-HT7/G12 signaling slightly decreases basal neuronal excitability
(A) Input-output curve as a measure of baseline excitatory synaptic transmission, here the fEPSP amplitude is plotted against the stimulation strength. The maximal responses obtained at high stimulation intensities (100 µA to 150 µA) in the SB-656104 treated (n = 8) and in control (n = 7) slices are similar, but the averages fEPSP amplitudes at the low stimulation strength (10 µA to 40 µA) were significantly decreased in treated SB-656104 preparations, indicating an reduced basal activity in SB-656104 treated slices. (B) Paired pulse facilitation is not significantly altered in SB-656104 treated slices. (C) Sample recordings for the input-output curve at 50% of maximal response (average of four traces) are shown for control and 5-CT treated mice.

54
Fig. 16. Inhibition of the 5-HT7/G12 signaling pathway modulates synaptic plasticity.
Long-term potentiation was performed by extra-cellular recordings of field excitatory postsynaptic potentials (fEPSPs) by measurement of evoked responses from stratum radiatum at the CA1 region after stimulation of Schaffer collaterals. (A) The results shows a slight increase in the fEPSP slope in SB-656104 treated compared to control slice. (a) shows sample traces of responses after high frequency stimulation (HFS; 1 × 100 Hz for 1 s each) for control and SB-656104 treated slices. (B) Magnitude of short term potentiation, determined as maximal responses within 5 min after high frequency stimulation, is not significantly reduced in SB-656104 treated mice. (C) Magnitude of long term potentiation, determined as responses between 50 and 60 min after high frequency stimulation, is significantly increased in SB-656104 treated mice. Values represent means ± SEM, p < 0.001

55
3.1.8 Expression of 5-HT7 and G12 proteins is decreased during postnatal
development
While the experiments performed in dissociated and organotypic hippocampal preparations
clearly demonstrated the importance of 5-HT7/G12 signaling for modulation of neuronal
morphology and functions, only moderate behavioral and electrophysiological effects were
obtained in vivo. One possible explanation for such discrepancies may be developmental
changes in the expression level of protein(s) involved in the 5-HT7/G12 signaling pathway.
Therefore, we determined the expression profile for both 5-HT7 receptor and G12 protein in
the mice hippocampus during different stages of postnatal development using real-time PCR.
The 5-HT7 receptor transcripts were strongly expressed at early postnatal stages (P2 and
P6) and down-regulated (up to 9 fold) during later development (Fig. 9). Similar expression
profiles were obtained for the G12 protein. Contrary to that, expression level of the Gs
protein, which can also be activated by the 5-HT7 receptor, was not significantly modulated
during development (Fig. 9). Furthermore, expression analysis of other Gs- and G12/13-
coupled serotonin receptor, 5-HT4, (Ponimaskin et al., 2002b) revealed that the amount of
receptor mRNA does not undergo strong variation during development. Thus 5-HT7 and
G12 proteins display dynamic expression patterns characterized by the strong and transient
expression during early postnatal stages of the hippocampal development. Such changes in
the expression level may also explain the diminished functional effects obtained upon
modulation of 5-HT7/G12 signaling pathway in adult mice.
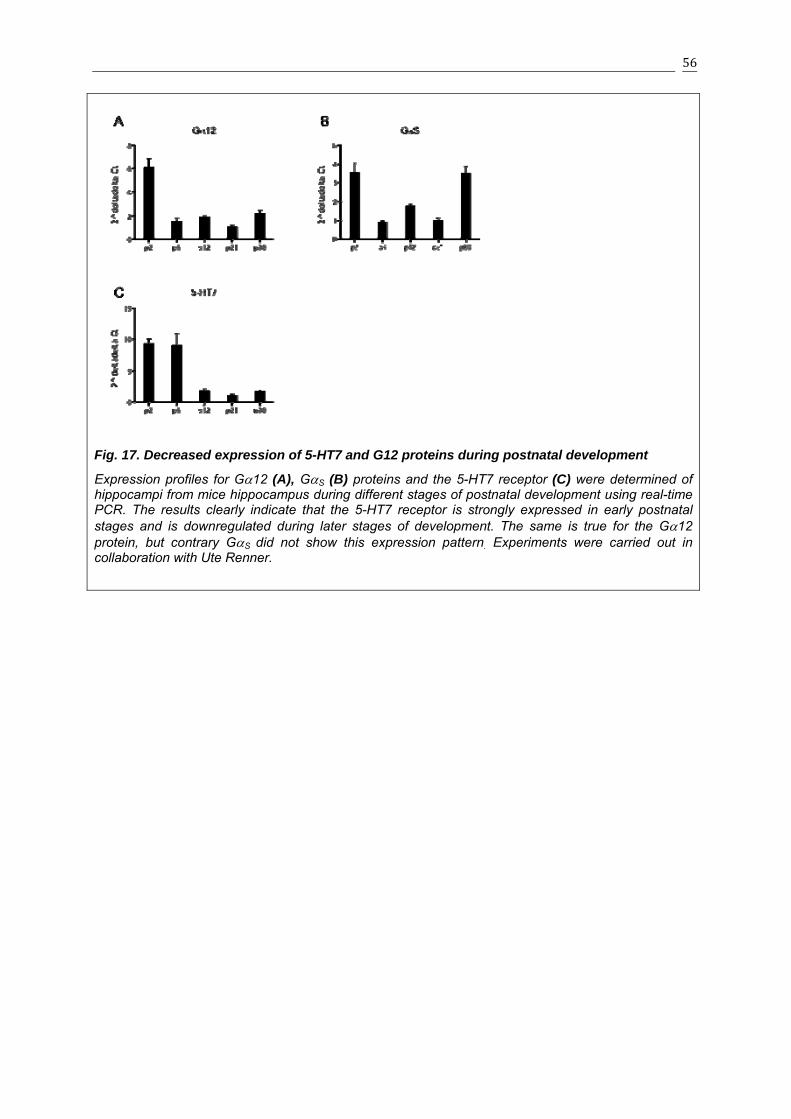
56
Fig. 17. Decreased expression of 5-HT7 and G12 proteins during postnatal development
Expression profiles for G12 (A), GS (B) proteins and the 5-HT7 receptor (C) were determined of hippocampi from mice hippocampus during different stages of postnatal development using real-time PCR. The results clearly indicate that the 5-HT7 receptor is strongly expressed in early postnatal stages and is downregulated during later stages of development. The same is true for the G12 protein, but contrary GS did not show this expression pattern. Experiments were carried out in collaboration with Ute Renner.

57
3.2 Oligomerization of the 5-HT1A receptor
3.2.1 Biochemical analysis of 5-HT1A receptor oligomerization.
“In order to determine whether the 5-HT1A receptor undergoes oligomerization, we applied
a co-immunoprecipitation assay to N1E-115 mouse neuroblastoma cells co-expressing HA-
and YFP-tagged receptors. The HA-tagged 5-HT1A receptor has a molecular weight of
approximately 48 kDa (Fig. 18, upper panel), while the molecular weight of YFP-tagged
receptors is shifted to 74 kDa (Fig. 18, lower panel). Figure 1A also shows that after
immunoprecipitation with an antibody against HA-tag, YFP-immunoreactive receptor bands
were identified only in samples derived from cells co-expressing both HA- and YFP-tagged
receptors. Equal results were obtained after initial immunoprecipitation of cell lysates with an
anti-YFP antibody followed by immunoblotting with an anti-HA-tag antibody (Fig. 18A). To
exclude the possibility that the identified bands represent artificial protein aggregates, cells
expressing only one type of receptor (HA- or YFP-tagged) were mixed prior to lysis and
analyzed in parallel as a control. As shown in Figure 18, individual receptors can be
precipitated and detected by the same antibody, whereas co-immunoprecipitation did not
occur, supporting specificity of 5-HT1A receptor oligomerization.
We have recently shown that the 5-HT1A receptor is modified by covalently attached
palmitate (Papoucheva et al., 2004). Therefore, we analyzed the impact of palmitoylation on
receptor oligomerization. Figure 18B und 18C demonstrate that differently tagged 5-HT1A
receptors were efficiently co-immunoprecipitated independently of their acylation state.
To investigate 5-HT1A receptor oligomerization in a physiological environment, N1E-115
cells expressing either wild-type or acylation-deficient HA-tagged receptors were treated with
chemical cross-linker BM[PEO]3. This homobifunctional cross-linker interacts with sulfhydryl
groups on polypeptides to form stable thioether linkages that induces an irreversible cross-
linking of proteins located within close proximity (app. 15 Å) of each other. It is notable that
the plasma membrane is impermeable for BM[PEO]3, allowing oligomerization analysis of the
receptors localized on the cell surface of intact cells. Immunoblotting analysis of N1E-115
cells expressing the wild-type or the palmitoylation-deficient receptors revealed that, in the

58
absence of cross-linker, the majority of 5-HT1A receptors is detectable as monomers, while
only a minor fraction migrating as a band with molecular weight of app. 95 kDa, which is the
molecular weight predicted for a dimer (Fig. 19A). Treatment of intact cells with increasing
concentrations of cross-linker leads to a decline of the amount of monomers that is
accompanied by an increase in the dimer population. Similar results were also obtained for
the acylation-deficient mutant (Fig. 19B).
Fig. 18. Analysis of 5-HT1A receptor oligomerization by co-immunoprecipitation.
Interactions between HA- and YFP-tagged wild-type receptors (A), palmitoylation-deficient mutants (B) as well as YFP-tagged wild-type and HA-tagged palmitoylation-deficient receptors (C) were analyzed. Neuroblastoma N1E-115 cells co-expressing HA- and YFP-tagged receptors (co-transf.), a mixture of cells expressing each receptor individually (Mix) or non-transfected cells (Mock) were subjected to SDS/PAGE (10%) followed by immunoprecipitation and immunoblot. IP refers to the antibodies used for immunoprecipitation, while IB defines the antibody used for immunoblot. The immunoblots shown are representative of at least 4 independent experiments. Experiments were carried out in collaboration with Ute Renner

59
Fig. 19. Chemical cross-linking of wild-type and acylation-deficient 5-HT1A receptors.
Intact N1E-115 cells expressing either HA-tagged wild-type (A) or mutant 5-HT1A receptors (B) were treated with increasing concentrations of cross-linker BM[PEO]3 and subjected to SDS/PAGE followed by immunoprecipitation and immunoblot analysis with anti-HA antibody. Apart from the receptor monomers, species migrating with the expected size of a dimer are visible. The immunoblots shown are representative of at least 4 independent experiments. Experiments were carried out in collaboration with Ute Renner
To analyze effect of agonist stimulation on receptor oligomerization, N1E-115 cells
expressing wild-type or acylation-deficient 5-HT1A receptors were treated with 5-HT at 10
µM concentration followed by co-immunoprecipitation or cross-linking analysis. Figure 3A
demonstrates that stimulation of either wild type or non-palmitoylated receptors with agonist
does not change amount of co-immunoprecipitated receptors. Similar results were also
obtained after application of cross-linker BM[PEO]3 to the simulated and non-stimulated cells
(Fig. 20B), demonstrating that the oligomerization state of 5-HT1A receptor is not modulated
upon agonist stimulation. Experiments were carried out in collaboration with Ute Renner.
3.2.2 Acceptor photobleaching analysis of 5-HT1A receptor oligomerization.
Förster Resonance Energy Transfer (FRET) is a powerful biophysical approach for the
quantitative analysis of protein-protein interactions (Lakowicz, 2006). To determine whether
FRET could be measured in the plasma membrane of living cells co-expressing 5-HT1A-CFP
and 5-HT1A-YFP fusion proteins, a confocal microscopy-based acceptor photobleaching

60
method was applied to transfected N1E-115 cells. To avoid artefacts resulting from
overexpression, we adjusted the total expression level for the CFP- and YFP-tagged receptor
to 1.000 - 1.200 fmol/mg proteins in all following FRET experiments, which allows for
Fig.20. Agonist stimulation does not change amount of 5-HT1A oligomers.
(A) Neuroblastoma N1E-115 cells co-expressing HA- and YFP-tagged receptors were treated with 5-HT (10 μM) or with vehicle (H2O) for 15 min and then subjected to co- immunoprecipitation. The intensity of protein bands was assessed by densitometry of immunoblots. The value for vehicle PBS treated cells was set to 100%. Bars represent means + S.E.M. (n = 3; top). The representative immunoblot is shown where IP refers to the antibodies used for immunoprecipitation, while IB defines the antibody used for immunoblot (bottom). WT, wild-type 5-HT1A receptor; Mut, acylation-deficient mutant. (B) N1E-115 cells expressing either HA-tagged wild-type or non-palmitoylated 5-HT1A receptors were treated with 5-HT (10 μµM) or with vehicle (H2O) for 15 min with cross-linker BM[PEO]3 (5 µM) and then subjected to SDS/PAGE followed by immunoprecipitation and immunoblot analysis with anti-HA antibody. The intensity of protein bands corresponding to dimers was assessed by densitometry of immunoblots. The value for vehicle PBS and BM[PEO]3 treated cells was set to 100%. Bars represent means + S.E.M. (n = 3; top). A representative immunoblot is shown (bottom). Experiments were carried out in collaboration with Ute Renner
quantitative analysis of results obtained in different experiments. Moreover, similiar amounts
of endogenous 5-HT1A receptors has been obtained in hippocampus under physiological
conditions (Pazos and Palacios, 1985; Hoyer et al., 1986).
CFP and YFP were excited simultaneously with a 458 nm laser line. Fluorescence emission
was acquired at multiple wavelengths using the LSM510-Meta detector allowing for the linear

61
unmixing of the CFP and YFP emission spectra. Confocal microscopy performed after the
transfection of N1E-115 cells revealed that the majority of YFP and CFP tagged 5-HT1A
receptors were localized in the plasma membranes with only a minor fraction existing in the
intracellular compartments (Fig. 21A).
To perform acceptor photobleaching, a defined region of plasma membrane was selectively
illuminated using a 514 nm laser line. A 458/514 nm dual dichroic mirror was used to allow
rapid image acquisition before and immediately after photobleaching. Figure 21A shows the
bleached region of interest with a loss of YFP intensity as well as a reference region of
interest from which the acquisition bleaching rate was determined for correct FRET
calculation. Figure 21B illustrates the changes in emission intensities of donor and acceptor
fluorescence in the bleached region of interest demonstrating that with the loss of acceptor
fluorescence there is a corresponding increase of donor emission intensity that is
characteristic of FRET. In contrast, intensities of both CFP and YFP fluorescence of non-
bleached regions undergo only minor decrease, reflecting acquisition bleaching (Fig. 21C).
Finally, apparent FRET efficiency EfD was calculated according to Eq.1, where FDA is the pre-
bleach and FD is the corrected post-bleach donor fluorescence according to Eq. 2. Data were
background subtracted and corrected for acquisition bleaching using the measurements from
the reference region of the plasma membrane (Fig. 21D). The wild-type receptor fusion
proteins from cells with similar donor to acceptor ratios were found to have a mean apparent
FRET efficiency of 16.4 % ± 0.7 %. For the negative controls obtained after co-transfection of
receptor-YFP and cytosolic CFP an apparent FRET efficiency was 5.5 % ± 3.8%. To
examine whether oligomerization may depend on palmitoylation state of the receptor, we
made acceptor photobleaching trials in cells expressing non-palmitoylated mutants. The
palmitoylation-deficient 5-HT1A receptors exhibited apparent FRET efficiency with a mean
EfD of 23.6 % ± 2.9 %. In addition, we analyzed the interaction between wild-type receptors
coupled to YFP and mutant receptors coupled to CFP. In this case a mean EfD value of
29.8 % ± 5.6 % was estimated. These results indicate that 5-HT1A forms oligomers and that
the extent of oligomerization depends on the palmitoylation status of the complex-forming
units. Experiments were carried out in collaboration with Andrew Woehler.

62
Fig. 21. Acceptor photobleaching FRET analysis of 5-HT1A oligomerization.
(A) Confocal microscopy was used to visualize 5-HT1A-CFP and 5-HT1A-YFP coexpressed in the plasma membrane of N1E-115 cells. Fluorescence spectra were collected from a 2 µm optical slice and unmixed to CFP and YFP components using the Zeiss LSM510-Meta detector. The fluorescence image of the CFP channel (green), the YFP channel (red) and composite channel before and after bleaching are shown. The box 1 corresponds to the bleached regions of interest, while the box 2 corresponds to the non-bleached region of interest. Scale bar, 10 µm. (B) Enlargement of the box 1 is shown on the left. The 12-bit grayscale intensities of YFP and CFP during the whole trial are plotted for the bleached region of interest (right). (C) Enlargement of the box 2 is shown on the left. The 12-bit grayscale intensities of YFP and CFP during the whole trial are plotted for the non-bleached region of interest (right). (D) Apparent FRET efficiency EfD was calculated according to Eq. 1 and 2. Data represent the means ± S.E.M. from at least five independent experiments. Cells co-expressing cytosolic CFP and YFP were used as a negative control. A statistically significant difference between the FRET values obtained in cell co-expressing WT-CFP/WT-YFP and Mut-CFP/Mut-YFP or Mut-CFP/WT-YFP are indicated (**, p < 0.01). Mut, acylation-deficient 5-HT1A mutant. Experiments were carried out in collaboration with Andrew Woehler.

63
3.2.3 Analysis of receptor oligomerization by fluorescence lifetime FRET
measurements.
In addition to acceptor photobleaching, we quantified the FRET efficiency ( ) in living cells
by measuring fluorescence lifetime of tagged 5-HT1A receptors. N1E-115 cells were
transfected either with 5-HT1A receptor fused to CFP or co-transfected with wild-type (WT)
and acylation-deficient (Mut) receptors fused to CFP and YFP to create appropriate
donor/acceptor pair at the ratio 1:1 in following combinations: WT-YFP/WT-CFP, Mut-
CFP/Mut-YFP and WT-CFP/Mut-YFP. The fluorescence decays of donor fusion proteins
were measured by time-correlated single photon counting as described in Experimental
Procedures. Experimental decay curves were analyzed and mean value of fluorescence
lifetime was calculated. The averaged fluorescence lifetime value calculated for CFP fused
with receptor was found to be tD = 2.01 ± 0.05 ns. The decay kinetic of CFP in the cells
expressing different receptor combinations was strongly affected by the presence of acceptor
(YFP) leading to a shortening of the lifetime. Fluorescence lifetimes were found to be t =
1.67± 0.11 ns, t = 1.56 ± 0.16 ns and t = 1.57 ± 0.2 ns for WT-CFP/WT-YFP, Mut-CFP/Mut-
YFP and WT-CFP/Mut-YFP, respectively. FRET efficiency was calculated from these
average lifetimes using the equation and was determined to be E = 0.17 ±
0.04 for WT-CFP/WT-YFP, E = 0.22 ± 0.06 for Mut-CFP/Mut-YFP, E = 0.22 ± 0.05 for WT-
CFP/Mut-YFP (Fig. 22). This confirms acceptor-photobleaching data and demonstrates that
FRET efficiency for oligomers composed by acylation-deficent mutants as well as for mixed
oligomers (i.e. combined by wild-type and mutant) is increased in comparison to the wild-type
oligomers.
We have recently shown that a significant fraction of the 5-HT1A receptor resides in
membrane rafts, while the yield of the palmitoylation-deficient receptor in these membrane
microdomains is considerably reduced (Renner et al., 2007). To analyze the role of lipid raft
localization of 5-HT1A receptor for its oligomerization we measured the fluorescence lifetime
after treatment of transfected cells with methyl--cyclodextrin (MCD). The cholesterol-
binding reagent MCD was previously shown to disrupt the cholesterol-enriched membrane
subdomains by depletion of cholesterol from the plasma membrane (Harder et al., 1998).

64
Destroying of lipid rafts resulted in shortening of fluorescence lifetime only in case of WT-
CFP/WT-YFP (t = 1.33± 0.05 ns), leading to significant increase of FRET value to E = 0.34 ±
0.02 (Fig. 5). In contrast, FRET efficiency calculated for Mut-CFP/Mut-YFP and WT-
CFP/Mut-YFP was not affected by cholesterol depletion and was determined to be E = 0.22
± 0.02 (t = 1.56 ± 0.06 ns) and E = 0.16 ± 0.03 (t = 1.68 ± 0.1 ns), respectively (Fig. 22).
Experiments were carried out in collaboration with Fehler! Verweisquelle konnte nicht
gefunden werden..
Fig. 22. Analysis of 5-HT1A oligomerization by fluorescence lifetime measurements.
N1E-115 cells were co-transfected with wild-type (WT) and acylation-deficient (Mut) receptors fused to CFP and YFP in following combinations: WT-YFP/WT-CFP, WT-CFP/Mut-YFP and Mut-CFP/Mut-YFP. The co-transfected cells were treated with 10 mM MßCD for 45 min or were left untreated, and the averaged FRET efficiency values were calculated after fluorescence lifetime analysis as described in “Methods” section. Data represent the means ± S.E.M. (n = 3). A statistically significant difference between the FRET efficiency obtained in cell co-expressing WT-CFP/WT-YFP before and after cholesterol depletion is shown (**, p < 0.01). Experiments were carried out in collaboration with Fehler! Verweisquelle konnte nicht gefunden werden..
3.2.4 Spectrometric detection of FRET between 5-HT1A receptors in living
cells.
We further examined FRET occurrence between fluorophore-labeled 5-HT1A receptors in
living cells by analysis of emission spectra collected with a spectrofluorometer. Figure 23
shows the typical fluorescence emission spectra at 420 nm excitation obtained in N1E-115

65
cells expressing WT-CFP, WT-YFP or co-expressing WT-CFP and WT-YFP as a FRET pair.
The spectral contaminations due to light scattering and nonspecific fluorescence of cells
were taken into account by subtracting the emission spectra of HA-tagged receptor cells
(background) from each measured spectra. When cells were transfected with only CFP-
fused receptor, the typical emission spectrum of CFP with emission peaks at 475 nm and
500 nm was obtained (Fig. 23A). The emission spectrum obtained for cells expressing only
YFP-fused receptor was similar to that obtained in HA-tagged receptor cells with only a very
weak peak at 525 nm. In contrast, cells co-expressing WT-CFP and WT-YFP receptors
demonstrated a significantly larger emission peak at 525 nm concomitant with a smaller CFP
emission, which demonstrates the energy transfer from CFP to YFP (Fig. 23A). Similar
results were also obtained when cells were co-transfected with acylation-deficient 5-HT1A
mutant (Fig. 23B). This data confirms the oligomerization of 5-HT1A receptors in living cells.
3.2.5 Specificity of 5-HT1A receptor oligomerization.
The apparent FRET efficiency, EfD, measured by acceptor photobleaching is inherently
dependent on fD, the fraction of donor participating in FRET complexes. This is in turn
dependent upon the ratio of intact donor concentration to intact acceptor concentration
present in the sample. It has been therefore suggested that the dependence of EfD on
[At]/[Dt] may be useful in differentiating FRET resulting from specific vs. random interactions
(Hagan et al., 2000; Herrick-Davis et al., 2004; Herrick-Davis et al., 2005; James et al.,
2006). In the case of random interaction, EfD has been predicted to be independent of the
total donor to acceptor ratio at a fixed surface density above a certain ratio. For receptor
dimers, EfD values are expected to be dependent on the relative donor concentration at a
higher [At]/[Dt] threshold, resulting in a higher asymptotic EfD value.
To analyze whether the measured apparent FRET efficiency reflects specific receptor-
receptor interaction or resulted from random molecular interaction, EfD values were
measured over a range of acceptor to donor ratios, wherein the combined concentration of
plasmids encoding for donor and acceptor was held constant. Figure 24A shows EfD values
obtained for wild-type 5-HT1A receptors plotted against the [At]/[Dt] ratio. As a negative

66
control we used co-transfections of non-interacting cytosolic CFP and YFP proteins. EfD
values obtained for cytosolic CFP and YFP and the corresponding [At]/[Dt] ratio were fitted
according to the equation 6. Evaluation of the fit quality clearly shows that data obtained from
the co-transfected cytosolic CFP/YFP (R2 = 0.37) cannot be properly characterized by a
model assuming specific oligomerization. This demonstrates that detected FRET resulted
from non-specific, random interactions. Using this as a negative control for oligomerization,
we analyzed the data collected for the cells co-transfected with 5-HT1A-CFP and 5-HT1A-
YFP receptors. In this case, we found that EfD values were substantially higher (Fig. 24A),
and Eq. 6 provides a very good fit quality of EfD data (R2 = 0.90). Furthermore, in a proper fit
to the proposed model, experimentally measured EfD value at a donor/acceptor ratio of 1:1
should represent half of the asymptotic value for EfD. In the case of receptor we found that
the EfD values at a ratio of 1:1 was approximately 0.12, which corresponds to the obtained
asymptotic value for the fit of approximately EfD = 0.24 (Fig. 24A). In contrast, the EfD value
measured for co-transfected CFP and YFP at a ratio of 1:1 was equal to 0.025, which is a
clear underestimate when compared to the fitted curve (Fig. 24A). Similar results were also
obtained after analysis of EfA values (Fig. 25) and for cells co-transfected with Mut-CFP/WT-
YFP and Mut-CFP/Mut-YFP combinations (data not shown).
Fig. 23. Spectral analysis of living N1E-115 cells co-expressing CFP- and YFP-tagged 5-HT1A receptors.
Fluorescence emission spectra of N1E-115 cells transfected with wild-type (A) or acylation-deficient (B) 5-HT1A receptors are shown. In both cases cells were transfected either with only CFP- (dashed line) or only with YFP-tagged (doted line) receptors or were co-transfected with both YFP- and CFP-tagged receptors (solid line). Emission spectra were collected at excitation wavelength λexc= 420 nm. Spectra were normalized to that obtained in cells transfected HA-tagged 5HT1A receptor. The data shown are representative of at least 3 independent experiments

67
Interaction specificity may also be analyzed by plotting energy transfer efficiency as a
function of expression level at fixed donor/acceptor ratio (James et al., 2006). In the case of
random interaction, the energy transfer between two fluorophores is linearly dependent on
expression level and will diminish to zero at very low concentration of fluorophores. In the
case of completely non-random interaction, the apparent FRET efficiency should be
independent on concentration with an EfD intercept greater than zero. Fig. 24B shows EfD
values measured in cells co-expressing WT-CFP/WT-YFP receptors and plotted as a
function of estimated total concentration. The analysis revealed that a linear fit resulted in an
EfD intercept at 0.13, confirming non-random interactions between the receptors. The fit also
shows a slightly positive slope suggesting that in addition to the specific interactions, there is
some contribution of random interaction to the measured EfD. Finally, two different types of
analysis applied here confirm the specificity of 5-HT1A receptor oligomerization.
3.2.6 Quantitative analysis of oligomerization dynamics in living cells.
To investigate the effect of receptor activation on 5-HT1A oligomerization, we applied a novel
FRET approach named lux-FRET (linear unmixing of FRET spectral components)
(Wlodarczyk et al., 2008), which allows quantitative measurements of oligomerization during
receptor stimulation with agonist. To evaluate time- and activation-correlated changes in
receptor interaction, apparent FRET efficiencies measured from N1E-115 cells co-expressing
5-HT1A fusion proteins were monitored over time before and during incubation with agonist
and/or antagonist. Cells were co-transfected with donor (5-HT1A-CFP) and acceptor (5-
HT1A-YFP) proteins at a 1:1 ratio and emission spectra were recorded every 2 min using
excitation wavelengths of 458 nm and 488 nm. For each time point, two quantities were
determined, i.e. the product of characteristic FRET efficiency (E) and the fraction of donor
participating in complexes (fD) as well as the corresponding quantity describing the product of
E and the fractions of acceptor participating in complexes (fA). Both values characterize the
stoichiometry of fluorescently labelled receptors and are used to verify the data obtained.

68
In the absence of receptor stimulation we obtained only slight fluctuations of EfD around the
initial values in cells expressing wild-type 5-HT1A receptors. After treatment with serotonin at
10 µM, the values of EfD continuously decreased reaching a plateau after 10 min (Fig. 26A).
In contrast, cells treated with PBS, did not show any significant changes of EfD values (Fig.
26A). The treatment of co-transfected cells with the selective 5-HT1A receptor antagonist,
WAY100635 at 1 µM concentration blocked the agonist-mediated decrease of EfD (Fig. 26A).
Fig. 24. Specificity of 5-HT1A receptor oligomerization.
(A) Dependency of apparent FRET efficiency EfD on donor/acceptor ratio. 5-HT1A receptors labeled either with CFP (41)[79] or YFP (41)[79] were co-expressed at different ratios in N1E-115 cells, wherein the combined concentration of donors and acceptors was held constant. N1E-115 cells co-expressing cytosolic CFP and YFP were used as a control for random interactions. Emission spectra were obtained and analyzed as described in Material and Methods section. EfD values were calculated according to Eq 3. and plotted against the [At]/[Dt] ratio computed with Eq 5. Data points were fitted according to Eq 6. (B) Dependency of apparent FRET efficiency EfD on expression level at fixed donor to acceptor ratio. The EfD values were measured in cells co-expressing WT-CFP/WT-YFP receptors and plotted as a function of estimated total concentration. The data were collected from samples with a [At] to [Dt] ratios ranging between 8 and 10, and EfD values were calculated according to Eq. 3. Experiments were carried out in collaboration with Andrew Woehler.
In order to quantify agonist-mediated changes of EfD, we chose a representative time point
before adding serotonin (5 min before) and compared its value with that of a representative
time point after agonist stimulation (15 min after 5-HT application) (Fig. 26B). This

69
comparison revealed that stimulation of the 5-HT1A receptor with agonist results in a
significant decrease of the EfD value by 12 % ± 2.1%.
We also analyzed, whether the localization of receptor in lipid rafts may influence agonist-
mediated decrease of EfD.. Figure 26B demonstrates that depletion of cholesterol by
treatment of cells expressing wild-type receptor with methyl--cyclodextrin abolished this
effect, suggesting importance of lipid rafts for the agonist-mediated changes in receptor
oligomerization.
Analysis of the time course of the apparent FRET efficiency in cells expressing acylation-
deficient 5-HT1A receptor demonstrated that non-palmitoylated receptors do not produce any
significant changes of EfD values after agonist stimulation (Fig. 26C and D). When the wild-
type receptor was co-expressed with the acylation-deficient receptor, the agonist-mediated
decrease of EfD value was also completely abolished, demonstrating the dominant-negative
effect of non-palmitoylated receptor on the dynamic changes in receptor-receptor interactions
(Fig. 26E and F).
Fig. 25. Dependency of apparent FRET efficiency EfA on donor/acceptor ratio.
5-HT1A receptors labeled either with CFP (donor) or YFP (acceptor) were co-expressed at different ratios in N1E-115 cells, wherein the combined concentration of donors and acceptors was held constant. N1E-115 cells co-expressing cytosolic CFP and YFP were used as a control for random interactions. Emission spectra were obtained and analyzed as described in Experimental Procedures section. EfA values were calculated according to Eq 3. and plotted against the [Dt]/[At] ratio computed with Eq 5. Data points were fitted according to Eq 6. Experiments were carried out in collaboration with Andrew Woehler.
We also performed a time course analysis of EfA values for the wild-type and the acylation-
deficient mutant. Similar to the results obtained for EfD, we observed a significant decrease of

70
EfA values by 15.2 % ± 2.9 % after adding 10 µM serotonin to the cells expressing wild-type
5-HT1A receptors (Fig. 27). The EfA values obtained for the acylation-deficient receptor
mutant as well as for the combination of wild-type and non-palmitoylated mutant were not
affected by the agonist treatment (Fig. 27).

71
Fig. 26.Time course of FRET efficiency EfD upon receptor stimulation.
The graphs on the left show the time course of EfD values calculated according to Eq. (1) for N1E-115 cells co- expressing WT-CFP/WT-YFP (A), Mut-CFP/Mut/YFP (C) or Mut-CFP/WT-YFP (E) receptors as FRET pairs. The cells were treated at zero time point with serotonin (10 μm), PBS, with serotonin together with WAY (1 μM) or with serotonin together with MßCD. All time-course values were normalized to unity at start for better visualization of differences. Data points represent mean ± S.E.M. (n = 6). The data on the right shows percentage of changes of apparent FRET efficiency (EfD) obtained 5 min before and 15 min after treatment for WT-CFP/WT-YFP (B), Mut- CFP/Mut-YFP (D) or Mut-CFP/WT-YFP (F). A statistically significant difference between values is noted (, p<0.01).

72
Fig. 27. Time course of FRET efficiency EfA upon receptor stimulation.
The graphs on the left show the time course of EfA values calculated according to Eq. 1 for N1E-115 cells co-expressing WT- CFP/WT-YFP (A), Mut-CFP/Mut/YFP (C) or Mut-CFP/WT-YFP (E) receptors as FRET pairs. The cells were treated at zero time point with serotonin (10 μm), PBS or with serotonin together with WAY (1 μM). All time courses values were normalized to unity at start for better visualization differences. Data points represent mean ± S.E.M. (n = 6). The graph on the right shows percentage of changes of apparent FRET efficiency (EfA) obtained 5 minutes before and 15 minutes after treatment for WT-CFP/WT-YFP (B), Mut-CFP/Mut/YFP (D) or Mut-CFP/WT-YFP (F). A statistically significant difference between values is noted (*, p < 0.01).

73
3.2.7 Agonist stimulation and lipid rafts localization of the 5-HT1A receptor.
Results obtained in the present study suggested the importance of cholesterol-enriched
membrane subdomains for receptor oligomerization (Fig. 20 and 26). Therefore, we
compared the membrane distribution of the wild-type receptor before and after stimulation
with agonist using density gradient centrifugation. N1E-115 cells expressing the 5-HT1A
receptor were solubilized in cold Triton X-100 (TX-100) and subjected to centrifugation in
OptiprepTM density gradient in order to isolate detergent-insoluble membrane fractions.
Immunoblot analysis of gradient fractions revealed that 38% ± 7.8% (n = 3) of the wild-type
5-HT1A receptor floated with the detergent-resistant low density fractions along with the Gai3-
subunit of heterotrimeric G-protein (Fig. 28). After treatment of cells with 10 µM of 5-HT, the
yield of receptor in the light Triton X-100-resistant membrane fraction was not significantly
changed and was found to be 34.6% ± 4.9% (n = 3; Fig. 28). Chemical cross-linking
performed before the TX-100 treatment and gradient centrifugation revealed that amount of
receptor oligomers in lipid rafts was not changed upon agonist stimulation (data not shown).
It is also notable that distribution of the Gai3 protein and the transferring receptor, which were
used as rafts and non-rafts markers, respectively, did not change after agonist treatment
(Fig. 28) (Kobe et al, 2008).

74
Fig. 28. Agonist stimulation does not change distribution of the 5-HT1A receptor in the detergent-resistant membrane fractions (DRMs).
(A) The neuroblastoma N1E-115 cells expressing the wild-type 5-HT1A receptor fused to GFP were treated with 5-HT (10 µM) or PBS (control). Cells were lysed with the cold 1% TritonTryton-X100 and lysates were ultracentrifugated in the OptiprepTM density gradient. The gradient fractions were analyzed by immunoblotting. Gi protein was used as DRM markers while transferrin receptor (TfR) was used as the non-DRM marker. (B) Relative amount of the 5-HT1A receptors, Gi and transferrin receptor (TfR) in the high density fractions (35%+40%) and the buoyant low density fractions (20%+30%) is shown. Quantitative analysis of the protein distribution was performed by densitometry and calculated in percentage of the total protein amount in all fractions. Data points represent mean ± S.E.M. (n = 3).

75
4 DISCUSSION
4.1 Role of 5-HT7/G12 signaling in morpho- and synaptogenesis
4.1.1 Early structural and functional changes are modulated via the 5-HT/G12
pathway
It is widely accepted that patterns of neuronal activity play a major role in the re-organization
of neuronal connection and circuits (Katz and Shatz, 1996; Maletic-Savatic et al., 1999;
Jontes and Smith, 2000). However, the mechanisms driving the formation of initial (activity-
independent) population of synaptic connections during early development are not entirely
clear. Over the past several years it has become evident that serotonin may modulate
different aspects of early neuronal differentiation, including neurite outgrowth and
synaptogenesis, before it acts as a neurotransmitter (Mazer et al., 1997; Udo et al., 2005).
Such morphogenic functions may be mediated by a variety of 5-HT receptor subtypes
(Barnes and Sharp, 1999; Hoyer et al., 2002). We have recently demonstrated that activation
of the 5-HT7 receptor promotes neurite outgrowth in hippocampal neurons (Kvachnina et al.,
2005). In the present study we demonstrated that prolonged stimulation of 5-HT7 receptor
leads to pronounced elevation in the number of dendritic protrusions. It has been proposed
that dendritic filopodia participate actively in the formation of synapses, and that initial
synaptogenesis may be the result of contact between dendritic protrusions and axons
(Mattila and Lappalainen, 2008). Supporting this view, we found that the number of
structurally intact synapses was significantly increased upon stimulation of 5-HT7 receptor.
We also observed a high degree of co-localization between the 5-HT7 receptor and synaptic
marker, which may provide a physical basis for the functional effects on synaptogenesis. The
functionality of these newly formed synapses was confirmed by a marked enhancement of
spontaneous neuronal activity (e.g. EPSP and spike frequency) generated in networks
formed by cultured hippocampal neurons. Notably the morphogenic functions of 5-HT7
receptors were also preserved in organotypic preparations from the hippocampus of mice.
Under such in vivo like conditions stimulation of 5-HT7 receptor caused pronounced

76
elevation of spinogenesis. These structural changes were accompanied by an increase of
both basal neuronal excitability (assessed by the analysis of fEPSPs) and mPSCs
amplitudes. The last observation suggests that prolonged stimulation of the 5-HT7 receptor
may initiate the boosting of synaptic strength. The mechanisms responsible for the 5-CT
mediated synaptic scaling were not addressed in this study. It is known that the total synaptic
strength can be regulated through changes in number of functional synapses during
development (Kirov et al., 2004; Turrigiano and Nelson, 2004; Takanishi et al., 2006;
Turrigiano, 2008). The coordinated changes in synaptogenesis and synaptic scaling obtained
here can therefore represent a mechanism responsible for the generation of initial synaptic
connections and maturation of basal synaptic circuits during the early neuronal development.
The mechanisms involved, however, seem to be different from these responsible for
modulation of synaptic strength obtained either by activity blockade or by increased activity
(Seeburg et al., 2008; Turrigiano, 2008; Peng et al., 2009).
Analysis of synaptic plasticity revealed that the induction of LTP at the Schaffer collateral
synapses was reduced upon prolonged stimulation of the 5-HT7 receptor. How can the 5-
HT7 receptor-mediated signaling lead to an increase in synaptic transmission and to
decrease in synaptic plasticity? The most straightforward explanation of this observation is
that the increased basal excitability, triggered by the activation of the 5-HT7 receptor, leads
to pre-potentiation of synaptic transmission and thus saturates LTP, preventing further
potentiation (Saghatelyan et al., 2001; Jedlicka et al., 2009).
What are the possible molecular downstream mechanisms underlying the structural and
functional effects of the 5-HT7 receptor in hippocampal neurons? The 5-HT7 receptor is
coupled to two different heterotrimeric G-proteins: Gs and G12 (Vanhoenacker et al., 2000).
It has also been shown that both the Gs- and G12-proteins can regulate the cellular
morphology by activating different signaling cascades. In case of Gs morphogenic effects are
realized either by modulation of cAMP concentration (Corset et al., 2000) or by the direct
binding of Gs to the cytoskeleton (Yu et al., 2009). The downstream effectors of the G12
protein mediating the changes in the actin cytoskeleton are the members of the Rho family of
small GTPases, including RhoA, Rac1 and Cdc42 (Jaffe and Hall, 2005). Experiments

77
performed in hippocampal neuronal preparations from the G12 deficient mouse verified that
the morphological effects obtained upon stimulation of the 5-HT7 receptor were mediated
solely by the G12 protein, demonstrating the critical role of 5-HT7/G12 signaling for formation
of dendritic filopodia and new synapses. We have recently demonstrated that the small
GTPases RhoA and Cdc42 represent the main down-stream effectors of the 5-HT7/G12
signaling. We also found that the major functional effects of this pathway, including actin
reorganisation and formation of neurite-like protrusions, were mediated by the activation of
Cdc42 (Kvachnina et al., 2005). The results of this study suggest that 5-HT7 receptor-
mediated activation of Cdc42 may also be responsible for the formation of dendritic filopodia
and spines in hippocampal neurons.
The 5-HT mediated activation of Cdc42 has been shown to be major signaling pathways
involved in formation of filopodia from presynaptic varicosities in sensory neurons of Aplysia,
leading to long-term facilitation. In this case, however, the receptor responsible was not
identified, although activation of PI3 kinase and PLC were discussed as possible signaling
mechanism (Udo et al., 2005). Cdc42 also plays the central role in rapid conversion of early
nonfunctional contacts between cultured hippocampal neurons into functional synapses after
a brief train of presynaptic action potentials (Shen et al., 2006). Such activity-induced
conversion of silent synapses occurred within minutes, suggesting involvement of different
mechanisms as in the case of 5-HT7 receptor-mediated effects, which required several
hours.
Thus, 5-HT-induced activation of the 5-HT7/G12/Cdc42 signaling pathways and the
consequent reorganization of the dendritic actin network appear to be a part of the initial
molecular cascade required for the growth of new synapses which then become the subject
of activity-dependent structural and functional plasticity (Citri and Malenka, 2008; Turrigiano,
2008).

78
4.1.2 Possible function of 5-HT7/G12 signaling during early postnatal
development
Stimulatory effects of 5-HT7/G12 signaling on the dendritic morphology, synaptogenesis and
synaptic plasticity obtained in hippocampal neurons were restricted to early postnatal
development stages and abolished in adult mice. In accordance with this observation, we
documented the decrease in the expression levels of both 5-HT7 receptor and G12 proteins
in the hippocampus during the postnatal development. This suggests that serotonin, acting
through the 5-HT7/G12/Cdc42 signaling pathway, promotes structural and functional
changes in hippocampal neurons and, more importantly, that these effects may be regulated
by the transient increase in expression of the 5-HT7 and G12 proteins during the early
postnatal period. There is increasing evidence that in the central nervous system 5-HT is
involved in regulation of different aspects of neuronal development before it acts as a
neurotransmitter. The early actions of 5-HT include modulation of neuronal differentiation,
synaptogenesis, axonal path-finding as well as effects on neurogenesis, cell migration and
morphogenesis of the cortex (Okado et al., 1993; Bennett-Clarke et al., 1994; Lebrand et al.,
1996; Mazer et al., 1997; Gould, 1999; Bonnin et al., 2007) Moreover, transient modifications
of the serotonergic system, especially during the early postnatal development, appear to
influence the brain morphology as well as cognitive and emotional behavior in adulthood
(Mazer et al., 1997; Gross et al., 2002; Ansorge et al., 2004).
Molecular mechanisms underlying such developmental effects of 5-HT are poorly
understood. The high variability of reported effects suggests, however, that different 5-HT
actions during development may be defined by variable expression of the corresponding
receptor subtypes and/or their downstream effectors. First experimental proof for that was
recently provided by Bonnin and colleagues (Bonnin et al., 2006; Bonnin et al., 2007), who
demonstrated that dynamic expression of 5-HT1 receptor subfamily members in the
telencephalon of the prenatal mouse may be responsible for the serotonin-mediated
modulation of responsiveness of embryonic thalamocortical axons to netrin-1. In the present
study we also obtained the dynamic expression patterns of 5-HT7 receptor and G12 protein
in hippocampus during postnatal development, which correlated with the morphogenic and
functional effects mediated by the 5-HT7/G12 signaling.

79
What could be the possible function of regulated expression? We hypothesize that transient
expression of 5-HT7/G12 signaling pathway can represent the mechanism, by which
serotonin specifically modulates the formation of basal neuronal connections during the early
postnatal development. This is supported by several observations. First, serotonergic system
is one of the earliest neurotransmitter systems in the mammalian brain, with the final
arborisation of serotonergic innervation occurring up to postnatal day 21 (Lidov and Molliver,
1982; Lauder, 1990). During this terminal serotonergic field development (E19 - P21), 5-HT
reaches the highest concentration in the brain (Whitaker-Azmitia, 2005). It has been also
shown that the physiological concentration of 5-HT both in and around the synaptic cleft can
reach the millimolar range (1 - 10 mM) (Bruns et al., 2000). Therefore, the effective
concentration of the released serotonin in hippocampus should be well within the range
needed for the activation of 5-HT7/G12 signaling (100 nM). Moreover, we observed a high
degree of co-localization between serotonin-containing varicosities and the 5-HT7 receptor.
This may provide a physical basis for the preferential activation of 5-HT7/G12 signaling at
early postnatal stages.

80
4.2 Oligomerization of 5-HT1 receptor
During the last decade, a growing body of biochemical and biophysical evidence indicated
that GPCRs can form oligomeric complexes. Although the existence of GPCR oligomers has
now become generally accepted, their physiological incidence in native tissues as well as
functional importance are still a matter of debate and in some cases remain even
controversial (Hagan et al., 2000; Herrick-Davis et al., 2004; Herrick-Davis et al., 2005). It
has been clearly documented that homo- and hetero-oligomerization of class C GPCRs such
as metabotropic glutamate as well as GABAB receptors is essential for the receptor
trafficking to the cell surface, for ligand-induced receptor activation as well as for G-protein
coupling (Maggio et al., 2005; Milligan, 2006). It has been clearly documented that homo-
and hetero-oligomerization of class C GPCRs such as metabotropic glutamate as well as
GABABB receptors is essential for the receptor trafficking to the cell surface, for ligand-
induced receptor activation as well as for G-protein coupling (Bouvier, 2001; Pin et al., 2003).
In contrast, no general consensus is yet achieved for the functional importance of
oligomerization for class A GPCRs. In the case of opioid receptor, heterodimers of kappa
and delta receptors have been shown to forma distinct functional signaling unit in vivo
(Waldhoer et al., 2005). Recent data on the heterodimerization between 1A and 2A
receptors also demonstrated importance of oligomerization for the inhibition of agonist-
promoted internalization of the 2A and its ability to activate the ERK1/2MAPK signaling
pathway (Lavoie et al., 2002). On the other hand, 2A and rhodopsin receptors, which are
often used as a model GPCRs for the homo-oligomerization analysis, can efficiently activate
their G-proteins in monomeric conformation (Whorton et al., 2007). Similarly, oligomerization
of the neurotensin NTS1 receptor is not required for G-protein activation, although it seems
to alter the mode of the receptor-G protein interaction (White et al., 2007). These findings
show that receptor oligomerization plays differing functional roles at different receptor-G-
protein interfaces, suggesting that there is no common function applicable to all GPCRs. In
the present study we verified the oligomerization state of the 5- HT1A receptor and also
analyzed its oligomerization dynamics upon the agonist stimulation by using classical
biochemical methods and different FRET-based approaches. In addition, we investigated the

81
possible interplay between palmitoylation and oligomerization of the 5-HT1A receptor. A co-
immunoprecipitation assay performed in neuroblastoma N1E-115 cells expressing receptor
constructs containing different epitope tags revealed the presence of immunoreactive 5-
HT1A receptors only in co-transfected cells and not in individually transfected cells mixed
before cell lysis. This strongly suggests that the 5-HT1A receptor forms homo-oligomers.
Homo-oligomerization of 5- HT1A receptors has been also previously reported for
recombinant 5-HT1A receptor expressed in HEK-293 cells (Salim et al., 2002), suggesting
that oligomerization is intrinsic to the 5-HT1A itself. In addition, oligomerization experiments
using a plasma membrane impermeable cross-linker BM[PEO]3 applied to intact cells showed
that the predominant receptor species on the plasma membrane are homodimers.
Biochemical methods used in this study represent the classical approaches used for the
detection of GPCR oligomerization. However, these methods require solubilization and
concentration of the membrane proteins, which could possibly result in artificial aggregation
of receptors (Harrison and van der Graaf, 2006). In addition, these techniques do not allow
an analysis of GPCR oligomerization dynamics in living cells. To overcome these limitations
and to analyze the oligomerization behavior of the 5-HT1A receptor in living cells, we applied
different FRET-based approaches including the acceptor-photobleaching method (Bastiaens
et al., 1996), the fluorescence lifetime-based FRET measurement as well as a novel lux-
FRET approach (Wlodarczyk et al., 2008).
4.2.1 Verification of oligomerization specificity by a novel FRET-based
approach
In addition to biochemical methods, we analyzed 5-HT1A receptor oligomerization by FRET
using receptors fused to enhanced CFP or YFP as donor and acceptor, respectively. It is
notable that CFP- and YFP fused receptors demonstrated subcellular distribution,
pharmacological profiles and signaling properties similar to that of their non-fluorescent wild-
type or acylation-deficient counterparts (Renner et al., 2007) indicating that these fluorescent
constructs can be used in functional studies. By using both acceptor-photobleaching and the
fluorescence lifetime FRET methods, we measured FRET between CFP- and YFP tagged 5-

82
HT1A receptors expressed at the surface of N1E-115 cells. A valid interpretation of FRET
data is, however, not trivial because the FRET signal depends on several factors such as
interaction affinity and stoichiometry of fusion proteins, their folding probability and their
mutual orientation, (Kenworthy and Edidin, 1998; Wallrabe et al., 2003). Moreover, positive
FRET signals may result not only from specific protein interactions including receptor
oligomerization, but also from randomly distributed proteins, as may be the case after
overexpression of donors and acceptors (Meyer et al., 2006). Based on critical analysis of
BRET data, it has been recently considered that the contribution of non-specific interactions
measured by resonance energy transfer may be even larger than previously thought (James
et al., 2006). Therefore, the analysis of FRET data over different donor to acceptor ratios
and/or over different expression levels have been proposed as important prerequisite to
discriminate between specific versus nonspecific interaction (James et al., 2006). Hence,
using a novel lux-FRET approach, we obtained and analyzed apparent FRET efficiency as a
function of the acceptor to donor ratio, [At]/ [Dt] with the aim to distinguish between these two
cases (i.e. specific vs. non-specific interaction). By measuring the emission spectra at two
different excitation wavelengths and applying linear unmixing, lux-FRET method allowed us
to determine the stoichiometry of interacting fluorescently labeled receptors. Artifacts like
bleed-through and cross-talk, which occur by using the filter channel based methods, do not
affect such analysis. Moreover, this approach is more easily implemented than methods
proposed previously (Hoppe et al., 2002; Zal and Gascoigne, 2004). Our data demonstrated
that apparent FRET values obtained for different receptor combinations agreed with the
model prediction for non-random interaction. In addition, the analysis of the energy transfer
efficiency as a function of expression level at fixed donor to acceptor ratio demonstrates that
FRET obtained for 5-HT1A receptors was largely independent of expression level. This
observation further confirms specificity of oligomerization in case of the 5-HT1A receptor.
Further evidence for the specificity of 5-HT1A receptor oligomerization was obtained from the
analysis of recently published data on receptor pharmacology (Papoucheva et al., 2004). The
Hill coefficient value calculated for HA-tagged 5-HT1A receptor was found to be 0.50±0.17,
which indicates negative cooperativity. According to the theory (Abeliovich, 2005), the Hill
coefficient value in negatively cooperating systems can be used to estimate the minimal

83
number of receptor subunits in complex, and the Hill slope of 0.5 indicates that 5-HT1A
exists as a dimer or higher order oligomer.
4.2.2 Regulation of oligomerization by agonist; role of lipid rafts and receptor
palmitoylation
In several biophysical studies investigating the effect of agonists on receptor oligomerization,
changes in the resonance energy transfer were obtained after receptor stimulation (Terrillon
and Bouvier, 2004). This has often been interpreted as an agonist-induced change in
oligomerization state. Since FRET efficiency highly depends on the relative distance and
orientation between the donor and acceptor, such agonist- mediated changes in energy
transfer may also reflect alterations in the pre-existing receptor conformation (Hoffmann et
al., 2005). In the majority of studies, addition of agonist resulted in an increase of the
FRET/BRET signal. However, agonist-dependent reduction of the signal has been reported
for four GPCRs including cholecystokinin, neuropeptide Y4, thyrotropin TSH and
somatostatin SSTR2 receptors (Cheng and Miller, 2001; Kroeger et al., 2001; Berglund et al.,
2003; Grant et al., 2003). Based on different tag combinations and positions (cholecystokinin
receptor), on the FRAP technique (TSH receptor) as well as on biochemical analysis
(neuropeptide Y4 and SSTR2 receptors), authors proposed agonist-induced dissociation of
oligomers rather than a conformational change as a possible reason for the decrease of the
energy transfer efficiency. In the present study, we analyzed the time course of the apparent
FRET efficiency for 5-HT1A receptor oligomerization and found that receptor stimulation with
agonist leads to significant decrease of the FRET signal. On the other hand, the amount of 5-
HT1A oligomers was not affected upon agonist stimulation as revealed by co-
immunoprecipitation and cross-linking analysis. This result was in contrast to examples
mentioned above and suggests that ligand mediated decrease of FRET obtained for the 5-
HT1A receptor does not arise from the dissociation of oligomers to monomers and is rather
achieved by the conformational changes of pre-existing FRET-positive complexes to FRET-
negative orientations. A more intriguing finding was the dependence of 5-HT1A
oligomerization efficiency and dynamics on the palmitoylation state of receptors. The results

84
of the biophysical studies revealed that the removal of palmitoylation sites resulted in
increased FRET efficiency. On the other hand, agonist-mediated decrease of FRET signal
obtained for the wild-type receptor was completely abolished in cells expressing of acylation-
deficient mutants. Combined with the fact that agonist stimulation does not change the
amount of oligomers composed by non-palmitoylated receptor, this suggests that lack of
palmitoylation does not directly affect the extent of oligomerization rather influences
orientation of C-terminal CFP and YFP leading to increased FRET efficiency.
What could be a possible mechanism by which palmitoylation may influence oligomerization
and functions of the 5-HT1A receptor? We have recently shown that a significant fraction of
the 5-HT1A receptor resides in lipid rafts, while the non-acylated mutants (which also do not
couple to Gi-proteins) are excluded from these membrane microdomains (Papoucheva et al.,
2004; Renner et al., 2007). Based on these data in combination with results presented here,
we propose the existence of two populations of 5-HT1A receptors. One population consists
of receptor oligomers localized outside of lipid rafts. This population seems to be partly “non-
functional” in terms of efficient signaling and needs raft localization to coincide with raft-
resided Gi-proteins (Emerit et al., 1990). Another receptor population resides in lipid rafts and
plays an important role in an efficient receptor-mediated signaling. This is also in line with the
current view on the functional role of lipid rafts. Lipid rafts and caveolae have been shown to
be involved in the regulation of various cell functions including the intracellular sorting of
proteins and lipids (Sprong et al., 2001), the establishment of cell polarity (Sprong et al.,
2001) and the fine tuning of signaling processes (Toomre et al., 2000). The detection of
numerous signaling proteins within the detergent-resistant membrane fractions led to the
assumption that lipid rafts represent scaffold platforms which facilitate signal transduction by
spatially recruiting signaling components and by preventing an inappropriate cross-talk
between pathways (Okamoto et al., 1998; Foster et al., 2003). Several members of the
serotonin receptor family, including 5-HT2A and 5-HT7 receptors have also been shown to
be highly enriched in lipid rafts and caveolae (Bhatnagar et al., 2004), suggesting general
importance of this membrane subdomains for the serotonergic signaling. Similar enrichment
in lipid rafts/caveolae has also been reported for other member of GPCR superfamily,

85
including GnRH, endothelin ETB and ETA and chemokine CCR5 receptors (Okamoto et al.,
2000).
In the case of 5-HT1A receptor, stimulation with agonist results in changing FRET-positive to
FRET-negative orientation of oligomers residing in lipid rafts. This may originate from a more
tight association of palmitoylated receptor C-terminus with raft-specific lipids (Melkonian et
al., 1999; Percherancier et al., 2003) or from increased coupling of receptor with raft-resided
Gi proteins, particularly upon agonist stimulation. Both raft as well as non-raft populations
seem to exist in dynamic equilibrium, which is important for fine tuning of receptor-mediated
signaling. In this model palmitoylation does not directly modulate oligomerization of 5-HT1A,
but rather serves as a targeting signal responsible for the retention of the 5-HT1A receptor in
defined membrane microdomains. The fact that the FRET efficiency for the oligomers
composed by wild-type receptors was lower than that for non-functional, acylation-deficient
mutants is also in line with this model. Combined with the fact that cholesterol depletion
resulted in the significant increase of FRET signal only in case of wild-type receptor, these
data suggest that receptors residing in lipid rafts consist of oligomers in FRET-negative
conformation. In addition, abolishing the agonist-mediated changes in the FRET efficiency
obtained in cells expressing wild-type oligomers after cholesterol depletion further confirms
the importance of lipid rafts in 5-HT1A-mediated signaling. Further experimentation will be
necessary to validate this model and elucidate molecular mechanisms regulating interplay
between palmitoylation and oligomerization (Kobe et al, 2008).

86
5
SUMMARY
Role of 5-HT7/G12 signaling in morpho- and synaptogenesis. The neurotransmitter
serotonin (5-hydroxytryptamine or 5-HT) modulates different aspects of early neuronal
differentiation, including neurite outgrowth and synaptogenesis, before it acts as a
neurotransmitter. Here we report that activation of the 5-HT7 serotonin receptor promotes
dendritic branching, formation of the new synapses as well as spontaneous synaptic activity.
The morphological effects obtained upon stimulation of the 5-HT7 receptor were mediated
solely by the G12 protein, demonstrating the critical role of 5-HT7/G12 signaling for formation
of dendritic filopodia and synaptogenesis. Analysis of organotypic preparation from the
hippocampus of juvenile mice demonstrate that 5-HT7R/G12 signaling potentiates formation
of dendritic spines, increases the basal neuronal excitability and leads to robust changes in
long-term potentiation (LTP). We also found that the expression of both 5-HT7 receptor and
G12 protein was significantly reduced during development. Accordingly the effects of 5-
HT7/G12 signaling in adult mice were abolished. Thus, regulated expression of both 5-HT7
receptor and G12 protein may represent a molecular mechanisms by which serotonin
specifically modulate the formation of basal neuronal connections during the early postnatal
development.
Oligomerization of 5-HT1A receptor. In the present study we analyzed the oligomerization
state of the serotonin 5-HT1A receptor and studied oligomerization dynamics in living cells.
We also investigated the role of receptor palmitoylation in this process. Biochemical analysis
performed in neuroblastoma N1E-115 cells demonstrated that both palmitoylated and non-
palmitoylated 5-HT1A receptors form homo-oligomers and that the prevalent receptor
species at the plasma membrane are dimers. A combination of an acceptor-photobleaching
FRET approach with fluorescence lifetime measurements verified the interaction of CFP- and
YFP-labeled wild-type as well as acylation-deficient 5-HT1A receptors at the plasma
membrane of living cells. Using a novel FRET technique based on the spectral analysis we
also confirmed the specific nature of receptor oligomerization. The analysis of

87
oligomerization dynamics revealed that apparent FRET efficiency measured for wild-type
oligomers significantly decreased in response to agonist stimulation, and our combined
results suggest that this decrease was mediated by accumulation of FRET-negative
complexes rather than by dissociation of oligomers to monomers. In contrast, the agonist-
mediated decrease of FRET signal was completely abolished in oligomers composed by
non-palmitoylated receptor mutants, demonstrating the importance of palmitoylation in
modulation of the structure of oligomers.

88
6 REFERENCES
Abeliovich H (2005) An empirical extremum principle for the hill coefficient in ligand-protein interactions showing negative cooperativity. Biophys J 89:76-79.
Adham N, Zgombick JM, Bard J, Branchek TA (1998) Functional characterization of the recombinant human 5-hydroxytryptamine7(a) receptor isoform coupled to adenylate cyclase stimulation. J Pharmacol Exp Ther 287:508-514.
Akgoz M, Azpiazu I, Kalyanaraman V, Gautam N (2002) Role of the G protein gamma subunit in beta gamma complex modulation of phospholipase Cbeta function. J Biol Chem 277:19573-19578.
Andrade R, Malenka RC, Nicoll RA (1986) A G protein couples serotonin and GABAB receptors to the same channels in hippocampus. Science 234:1261-1265.
Angers S, Salahpour A, Bouvier M (2001) Biochemical and biophysical demonstration of GPCR oligomerization in mammalian cells. Life Sci 68:2243-2250.
Angers S, Salahpour A, Bouvier M (2002) Dimerization: an emerging concept for G protein-coupled receptor ontogeny and function. Annu Rev Pharmacol Toxicol 42:409-435.
Ansorge MS, Zhou M, Lira A, Hen R, Gingrich JA (2004) Early-life blockade of the 5-HT transporter alters emotional behavior in adult mice. Science 306:879-881.
Azmitia EC (2001) Modern views on an ancient chemical: serotonin effects on cell proliferation, maturation, and apoptosis. Brain Res Bull 56:413-424.
Ballaz SJ, Akil H, Watson SJ (2007) Analysis of 5-HT6 and 5-HT7 receptor gene expression in rats showing differences in novelty-seeking behavior. Neuroscience 147:428-438.
Barnes NM, Sharp T (1999) A review of central 5-HT receptors and their function. Neuropharmacology 38:1083-1152.
Bartrup JT, Moorman JM, Newberry NR (1997) BDNF enhances neuronal growth and synaptic activity in hippocampal cell cultures. Neuroreport 8:3791-3794.
Bastiaens PI, Majoul IV, Verveer PJ, Söling HD, Jovin TM (1996) Imaging the intracellular trafficking and state of the AB5 quaternary structure of cholera toxin. EMBO J 15:4246-4253.
Beer MS, Stanton JA, Bevan Y, Chauhan NS, Middlemiss DN (1992) An investigation of the 5-HT1D receptor binding affinity of 5-hydroxytryptamine, 5-carboxyamidotryptamine and sumatriptan in the central nervous system of seven species. Eur J Pharmacol 213:193-197.
Bennett-Clarke CA, Leslie MJ, Lane RD, Rhoades RW (1994) Effect of serotonin depletion on vibrissa-related patterns of thalamic afferents in the rat's somatosensory cortex. J Neurosci 14:7594-7607.
Berglund MM, Schober DA, Statnick MA, McDonald PH, Gehlert DR (2003) The use of bioluminescence resonance energy transfer 2 to study neuropeptide Y receptor agonist-induced beta-arrestin 2 interaction. J Pharmacol Exp Ther 306:147-156.
Bhatnagar A, Sheffler DJ, Kroeze WK, Compton-Toth B, Roth BL (2004) Caveolin-1 interacts with 5-HT2A serotonin receptors and profoundly modulates the signaling of selected Galphaq-coupled protein receptors. J Biol Chem 279:34614-34623.

89
Bjorvatn B, Ursin R (1998) Changes in sleep and wakefulness following 5-HT1A ligands given systemically and locally in different brain regions. Reviews in the neurosciences 9:265-273.
Blank JL, Ross AH, Exton JH (1991) Purification and characterization of two G-proteins that activate the beta 1 isozyme of phosphoinositide-specific phospholipase C. Identification as members of the Gq class. J Biol Chem 266:18206-18216.
Blier P, Bouchard C (1993) Functional characterization of a 5-HT3 receptor which modulates the release of 5-HT in the guinea-pig brain. Br J Pharmacol 108:13-22.
Bockaert J, Pin JP (1999) Molecular tinkering of G protein-coupled receptors: an evolutionary success. EMBO J 18:1723-1729.
Bonnin A, Peng W, Hewlett W, Levitt P (2006) Expression mapping of 5-HT1 serotonin receptor subtypes during fetal and early postnatal mouse forebrain development. Neuroscience 141:781-794.
Bonnin A, Torii M, Wang L, Rakic P, Levitt P (2007) Serotonin modulates the response of embryonic thalamocortical axons to netrin-1. Nat Neurosci 10:588-597.
Bouvier M (2001) Oligomerization of G-protein-coupled transmitter receptors. Nature Reviews Neuroscience 2:274-286.
Bräuner-Osborne H, Wellendorph P, Jensen AA (2007) Structure, pharmacology and therapeutic prospects of family C G-protein coupled receptors. Current drug targets 8:169-184.
Brown DA, London E (1998) Functions of lipid rafts in biological membranes. Annu Rev Cell Dev Biol 14:111-136.
Bruns D, Riedel D, Klingauf J, Jahn R (2000) Quantal release of serotonin. Neuron 28:205-220.
Bulenger S, Marullo S, Bouvier M (2005) Emerging role of homo- and heterodimerization in G-protein-coupled receptor biosynthesis and maturation. Trends Pharmacol Sci 26:131-137.
Burnet PW, Mefford IN, Smith CC, Gold PW, Sternberg EM (1996) Hippocampal 5-HT1A receptor binding site densities, 5-HT1A receptor messenger ribonucleic acid abundance and serotonin levels parallel the activity of the hypothalamo-pituitary-adrenal axis in rats. Behav Brain Res 73:365-368.
Canton H, Emeson RB, Barker EL, Backstrom JR, Lu JT, Chang MS, Sanders-Bush E (1996) Identification, molecular cloning, and distribution of a short variant of the 5-hydroxytryptamine2C receptor produced by alternative splicing. Molecular pharmacology 50:799-807.
Chabre M, le Maire M (2005) Monomeric G-protein-coupled receptor as a functional unit. Biochemistry 44:9395-9403.
Chandrashekar J, Mueller KL, Hoon MA, Adler E, Feng L, Guo W, Zuker CS, Ryba NJ (2000) T2Rs function as bitter taste receptors. Cell 100:703-711.
Cheng ZJ, Miller LJ (2001) Agonist-dependent dissociation of oligomeric complexes of G protein-coupled cholecystokinin receptors demonstrated in living cells using bioluminescence resonance energy transfer. J Biol Chem 276:48040-48047.
Citri A, Malenka RC (2008) Synaptic plasticity: multiple forms, functions, and mechanisms. Neuropsychopharmacology 33:18-41.

90
Clarke WP, Yocca FD, Maayani S (1996) Lack of 5-hydroxytryptamine1A-mediated inhibition of adenylyl cyclase in dorsal raphe of male and female rats. J Pharmacol Exp Ther 277:1259-1266.
Corset V, Nguyen-Ba-Charvet KT, Forcet C, Moyse E, Chédotal A, Mehlen P (2000) Netrin-1-mediated axon outgrowth and cAMP production requires interaction with adenosine A2b receptor. Nature 407:747-750.
Coso OA, Teramoto H, Simonds WF, Gutkind JS (1996) Signaling from G protein-coupled receptors to c-Jun kinase involves beta gamma subunits of heterotrimeric G proteins acting on a Ras and Rac1-dependent pathway. J Biol Chem 271:3963-3966.
Dawson LA, Hughes ZA, Starr KR, Storey JD, Bettelini L, Bacchi F, Arban R, Poffe A, Melotto S, Hagan JJ, Price GW (2006) Characterisation of the selective 5-HT1B receptor antagonist SB-616234-A (1-[6-(cis-3,5-dimethylpiperazin-1-yl)-2,3-dihydro-5-methoxyindol-1-yl]-1-[2'-methyl-4'-(5-methyl-1,2,4-oxadiazol-3-yl)biphenyl-4-yl]methanone hydrochloride): in vivo neurochemical and behavioral evidence of anxiolytic/antidepressant activity. Neuropharmacology 50:975-983.
De Paola V, Arber S, Caroni P (2003) AMPA receptors regulate dynamic equilibrium of presynaptic terminals in mature hippocampal networks. Nature neuroscience 6:491-500.
De Ponti F, Tonini M (2001) Irritable bowel syndrome: new agents targeting serotonin receptor subtypes. Drugs 61:317-332.
Delgado M, Caicoya AG, Greciano V, Benhamú B, López-Rodríguez ML, Fernández-Alfonso MS, Pozo MA, Manzanares J, Fuentes JA (2005) Anxiolytic-like effect of a serotonergic ligand with high affinity for 5-HT1A, 5-HT2A and 5-HT3 receptors. Eur J Pharmacol 511:9-19.
Devi LA (2001) Heterodimerization of G-protein-coupled receptors: pharmacology, signaling and trafficking. Trends Pharmacol Sci 22:532-537.
Dityatev A, Dityateva G, Schachner M (2000) Synaptic strength as a function of post- versus presynaptic expression of the neural cell adhesion molecule NCAM. Neuron 26:207-217.
Duncan MJ, Grear KE, Hoskins MA (2004) Aging and SB-269970-A, a selective 5-HT7 receptor antagonist, attenuate circadian phase advances induced by microinjections of serotonergic drugs in the hamster dorsal raphe nucleus. Brain Research 1008:40-48.
Dunphy JT, Linder ME (1998) Signalling functions of protein palmitoylation. Biochim Biophys Acta 1436:245-261.
Emerit MB, el Mestikawy S, Gozlan H, Rouot B, Hamon M (1990) Physical evidence of the coupling of solubilized 5-HT1A binding sites with G regulatory proteins. Biochem Pharmacol 39:7-18.
Erspamer V, Asero B (1952) Identification of enteramine, the specific hormone of the enterochromaffin cell system, as 5-hydroxytryptamine. Nature 169:800-801.
Fargin A, Raymond JR, Regan JW, Cotecchia S, Lefkowitz RJ, Caron MG (1989) Effector coupling mechanisms of the cloned 5-HT1A receptor. J Biol Chem 264:14848-14852.
Faure M, Voyno-Yasenetskaya TA, Bourne HR (1994) cAMP and beta gamma subunits of heterotrimeric G proteins stimulate the mitogen-activated protein kinase pathway in COS-7 cells. J Biol Chem 269:7851-7854.
Filipek S, Stenkamp RE, Teller DC, Palczewski K (2003) G protein-coupled receptor rhodopsin: a prospectus. Annu Rev Physiol 65:851-879.

91
Fiorica-Howells E, Maroteaux L, Gershon MD (2000) Serotonin and the 5-HT(2B) receptor in the development of enteric neurons. J Neurosci 20:294-305.
Foster LJ, De Hoog CL, Mann M (2003) Unbiased quantitative proteomics of lipid rafts reveals high specificity for signaling factors. Proc Natl Acad Sci U S A 100:5813-5818.
Forbes IT, Douglas S, Gribble AD, Ife RJ, Lightfoot AP, Garner AE, Riley GJ, Jeffrey P, Stevens AJ, Stean TO, Thomas DR (2002) SB-656104-A: a novel 5-HT(7) receptor antagonist with improved in vivo properties. Bioorg Med Chem Lett 12:3341-3344.
Fredriksson R, Lagerström MC, Lundin L-G, Schiöth HB (2003) The G-protein-coupled receptors in the human genome form five main families. Phylogenetic analysis, paralogon groups, and fingerprints. Mol Pharmacol 63:1256-1272.
Fricker AD, Rios C, Devi LA, Gomes I (2005) Serotonin receptor activation leads to neurite outgrowth and neuronal survival. Brain Res Mol Brain Res 138:228-235.
Gähwiler BH, Capogna M, Debanne D, McKinney RA, Thompson SM (1997) Organotypic slice cultures: a technique has come of age. Trends in Neurosciences 20:471-477.
Garnovskaya MN, van Biesen T, Hawe B, Casañas Ramos S, Lefkowitz RJ, Raymond JR (1996) Ras-dependent activation of fibroblast mitogen-activated protein kinase by 5-HT1A receptor via a G protein beta gamma-subunit-initiated pathway. Biochemistry 35:13716-13722.
Gether U (2000) Uncovering molecular mechanisms involved in activation of G protein-coupled receptors. Endocr Rev 21:90-113.
Gogolla N, Galimberti I, Depaola V, Caroni P (2006) Preparation of organotypic hippocampal slice cultures for long-term live imaging. Nature protocols 1:1165-1171.
Gordon JA, Hen R (2004) The serotonergic system and anxiety. Neuromolecular Med 5:27-40.
Gould E (1999) Serotonin and hippocampal neurogenesis. Neuropsychopharmacology 21:46S-51S.
Grant GA, Hu Z, Xu XL (2003) Hybrid tetramers reveal elements of cooperativity in Escherichia coli D-3-phosphoglycerate dehydrogenase. J Biol Chem 278:18170-18176.
Gross C, Zhuang X, Stark K, Ramboz S, Oosting R, Kirby L, Santarelli L, Beck S, Hen R (2002) Serotonin1A receptor acts during development to establish normal anxiety-like behavior in the adult. Nature 416:396-400.
Gu JL, Müller S, Mancino V, Offermanns S, Simon MI (2002) Interaction of G alpha(12) with G alpha(13) and G alpha(q) signaling pathways. Proc Natl Acad Sci U S A 99:9352-9357.
Hagan JJ, Price GW, Jeffrey P, Deeks NJ, Stean T, Piper D, Smith MI, Upton N, Medhurst AD, Middlemiss DN, Riley GJ, Lovell PJ, Bromidge SM, Thomas DR (2000) Characterization of SB-269970-A, a selective 5-HT(7) receptor antagonist. Br J Pharmacol 130:539-548.
Hall A (1998) Rho GTPases and the actin cytoskeleton. Science 279:509-514.
Harder T, Scheiffele P, Verkade P, Simons K (1998) Lipid domain structure of the plasma membrane revealed by patching of membrane components. J Cell Biol 141:929-942.
Harhammer R, Gohla A, Schultz G (1996) Interaction of G protein Gbetagamma dimers with small GTP-binding proteins of the Rho family. FEBS Letters 399:211-214.

92
Harrison C, van der Graaf PH (2006) Current methods used to investigate G protein coupled receptor oligomerisation. Journal of pharmacological and toxicological methods 54:26-35.
Hedlund PB, Danielson PE, Thomas EA, Slanina K, Carson MJ, Sutcliffe JG (2003) No hypothermic response to serotonin in 5-HT7 receptor knockout mice. Proc Natl Acad Sci U S A 100:1375-1380.
Heidmann DE, Szot P, Kohen R, Hamblin MW (1998) Function and distribution of three rat 5-hydroxytryptamine7 (5-HT7) receptor isoforms produced by alternative splicing. Neuropharmacology 37:1621-1632.
Herrick-Davis K, Grinde E, Mazurkiewicz JE (2004) Biochemical and biophysical characterization of serotonin 5-HT2C receptor homodimers on the plasma membrane of living cells. Biochemistry 43:13963-13971.
Herrick-Davis K, Grinde E, Harrigan TJ, Mazurkiewicz JE (2005) Inhibition of serotonin 5-hydroxytryptamine2c receptor function through heterodimerization: receptor dimers bind two molecules of ligand and one G-protein. J Biol Chem 280:40144-40151.
Herzog A, Krell G, Michaelis B, Ovtscharoff W, Braun K (2006) Detection of presynaptic terminals on dendritic spines in double labelin confocal images. In: ICPR pp 715-718. Hongkong.
Hoffmann C, Gaietta G, Bünemann M, Adams SR, Oberdorff-Maass S, Behr B, Vilardaga J-P, Tsien RY, Ellisman MH, Lohse MJ (2005) A FlAsH-based FRET approach to determine G protein-coupled receptor activation in living cells. Nat Methods 2:171-176.
Hoon MA, Adler E, Lindemeier J, Battey JF, Ryba NJ, Zuker CS (1999) Putative mammalian taste receptors: a class of taste-specific GPCRs with distinct topographic selectivity. Cell 96:541-551.
Hoppe A, Christensen K, Swanson JA (2002) Fluorescence resonance energy transfer-based stoichiometry in living cells. Biophys J 83:3652-3664.
Horn F, Bettler E, Oliveira L, Campagne F, Cohen F, Vriend G (2003) GPCRDB information system for G protein-coupled receptors. Nucleic Acids Research 31:294.
Horn F, Weare J, Beukers MW, Hörsch S, Bairoch A, Chen W, Edvardsen O, Campagne F, Vriend G (1998) GPCRDB: an information system for G protein-coupled receptors. Nucleic Acids Res 26:275-279.
Hoyer D, Hannon JP, Martin GR (2002) Molecular, pharmacological and functional diversity of 5-HT receptors. Pharmacol Biochem Behav 71:533-554.
Hoyer D, Pazos A, Probst A, Palacios JM (1986) Serotonin receptors in the human brain. I. Characterization and autoradiographic localization of 5-HT1A recognition sites. Apparent absence of 5-HT1B recognition sites. Brain Res 376:85-96.
Jaffe AB, Hall A (2005) Rho GTPases: biochemistry and biology. Annu Rev Cell Dev Biol 21:247-269.
James JR, Oliveira MI, Carmo AM, Iaboni A, Davis SJ (2006) A rigorous experimental framework for detecting protein oligomerization using bioluminescence resonance energy transfer. Nat Methods 3:1001-1006.
Javitch JA (2004) The ants go marching two by two: oligomeric structure of G-protein-coupled receptors. Mol Pharmacol 66:1077-1082.

93
Jedlicka P, Papadopoulos T, Deller T, Betz H, Schwarzacher SW (2009) Increased network excitability and impaired induction of long-term potentiation in the dentate gyrus of collybistin-deficient mice in vivo. Mol Cell Neurosci 41:94-100.
Jones KA, Borowsky B, Tamm JA, Craig DA, Durkin MM, Dai M, Yao WJ, Johnson M, Gunwaldsen C, Huang LY, Tang C, Shen Q, Salon JA, Morse K, Laz T, Smith KE, Nagarathnam D, Noble SA, Branchek TA, Gerald C (1998) GABA(B) receptors function as a heteromeric assembly of the subunits GABA(B)R1 and GABA(B)R2. Nature 396:674-679.
Jontes JD, Smith SJ (2000) Filopodia, spines, and the generation of synaptic diversity. Neuron 27:11-14.
Kamiyama D, Chiba A (2009) Endogenous activation patterns of Cdc42 GTPase within Drosophila embryos. Science 324:1338-1340.
Katz LC, Shatz CJ (1996) Synaptic activity and the construction of cortical circuits. Science 274:1133-1138.
Kaupmann K, Malitschek B, Schuler V, Heid J, Froestl W, Beck P, Mosbacher J, Bischoff S, Kulik A, Shigemoto R, Karschin A, Bettler B (1998) GABA(B)-receptor subtypes assemble into functional heteromeric complexes. Nature 396:683-687.
Kenworthy AK, Edidin M (1998) Distribution of a glycosylphosphatidylinositol-anchored protein at the apical surface of MDCK cells examined at a resolution of <100 A using imaging fluorescence resonance energy transfer. J Cell Biol 142:69-84.
King MV, Marsden CA, Fone KCF (2008) A role for the 5-HT(1A), 5-HT4 and 5-HT6 receptors in learning and memory. Trends in Pharmacological Sciences 29:482-492.
Kirov SA, Goddard CA, Harris KM (2004) Age-dependence in the homeostatic upregulation of hippocampal dendritic spine number during blocked synaptic transmission. Neuropharmacology 47:640-648.
Kobe F, Renner U, Woehler A, Wlodarczyk J, Papusheva E, Bao G, Zeug A, Richter DW,
Neher E, Ponimaskin E (2008) Stimulation- and palmitoylation-dependent changes in
oligomeric conformation of serotonin 5-HT1A receptors. Biochim Biophys Acta
1783:1503-1516.
Kroeger KM, Hanyaloglu AC, Seeber RM, Miles LE, Eidne KA (2001) Constitutive and agonist-dependent homo-oligomerization of the thyrotropin-releasing hormone receptor. Detection in living cells using bioluminescence resonance energy transfer. J Biol Chem 276:12736-12743.
Kroeze WK, Kristiansen K, Roth BL (2002) Molecular biology of serotonin receptors structure and function at the molecular level. Current topics in medicinal chemistry 2:507-528.
Kroeze WK, Sheffler DJ, Roth BL (2003) G-protein-coupled receptors at a glance. J Cell Sci 116:4867-4869.
Kvachnina E, Liu G, Dityatev A, Renner U, Dumuis A, Richter DW, Dityateva G, Schachner M, Voyno-Yasenetskaya TA, Ponimaskin EG (2005) 5-HT7 receptor is coupled to G alpha subunits of heterotrimeric G12-protein to regulate gene transcription and neuronal morphology. J Neurosci 25:7821-7830.
Lakowicz JR (2006) Principles of fluorescence spectroscopy, 3rd Edition. New York: Springer.

94
Lander ES et al. (2001) Initial sequencing and analysis of the human genome. Nature 409:860-921.
Laporte AM, Koscielniak T, Ponchant M, Vergé D, Hamon M, Gozlan H (1992) Quantitative autoradiographic mapping of 5-HT3 receptors in the rat CNS using [125I]iodo-zacopride and [3H]zacopride as radioligands. Synapse 10:271-281.
Lauder JM (1990) Ontogeny of the serotonergic system in the rat: serotonin as a developmental signal. Ann N Y Acad Sci 600:297-313; discussion 314.
Lavoie C, Mercier J-F, Salahpour A, Umapathy D, Breit A, Villeneuve L-R, Zhu W-Z, Xiao R-P, Lakatta EG, Bouvier M, Hébert TE (2002) Beta 1/beta 2-adrenergic receptor heterodimerization regulates beta 2-adrenergic receptor internalization and ERK signaling efficacy. J Biol Chem 277:35402-35410.
Lebrand C, Cases O, Adelbrecht C, Doye A, Alvarez C, el Mestikawy S, Seif I, Gaspar P (1996) Transient uptake and storage of serotonin in developing thalamic neurons. Neuron 17:823-835.
Lee T, Winter C, Marticke SS, Lee A, Luo L (2000) Essential roles of Drosophila RhoA in the regulation of neuroblast proliferation and dendritic but not axonal morphogenesis. Neuron 25:307-316.
Li Z, Van Aelst L, Cline HT (2000) Rho GTPases regulate distinct aspects of dendritic arbor growth in Xenopus central neurons in vivo. Nature neuroscience 3:217-225.
Liang Y, Fotiadis D, Filipek S, Saperstein DA, Palczewski K, Engel A (2003) Organization of the G protein-coupled receptors rhodopsin and opsin in native membranes. J Biol Chem 278:21655-21662.
Lidov HG, Molliver ME (1982) Immunohistochemical study of the development of serotonergic neurons in the rat CNS. Brain Res Bull 9:559-604.
Lindemann B (1996) Taste reception. Physiol Rev 76:718-766.
Linder ME, Deschenes RJ (2003) New insights into the mechanisms of protein palmitoylation. Biochemistry 42:4311-4320.
Logothetis DE, Kurachi Y, Galper J, Neer EJ, Clapham DE (1987) The beta gamma subunits of GTP-binding proteins activate the muscarinic K+ channel in heart. Nature 325:321-326.
Lovenberg TW, Baron BM, de Lecea L, Miller JD, Prosser RA, Rea MA, Foye PE, Racke M, Slone AL, Siegel BW (1993) A novel adenylyl cyclase-activating serotonin receptor (5-HT7) implicated in the regulation of mammalian circadian rhythms. Neuron 11:449-458.
Lundstrom K (2005) Structural biology of G protein-coupled receptors. Bioorg Med Chem Lett 15:3654-3657.
Maggio R, Vogel Z, Wess J (1993) Coexpression studies with mutant muscarinic/adrenergic receptors provide evidence for intermolecular "cross-talk" between G-protein-linked receptors. Proc Natl Acad Sci U S A 90:3103-3107.
Maggio R, Novi F, Scarselli M, Corsini GU (2005) The impact of G-protein-coupled receptor hetero-oligomerization on function and pharmacology. FEBS J 272:2939-2946.
Maletic-Savatic M, Malinow R, Svoboda K (1999) Rapid dendritic morphogenesis in CA1 hippocampal dendrites induced by synaptic activity. Science 283:1923-1927.
Malgaroli A, Tsien RW (1992) Glutamate-induced long-term potentiation of the frequency of miniature synaptic currents in cultured hippocampal neurons. Nature 357:134-139.

95
Manzke T, Guenther U, Ponimaskin EG, Haller M, Dutschmann M, Schwarzacher S, Richter DW (2003) 5-HT4(a) receptors avert opioid-induced breathing depression without loss of analgesia. Science 301:226-229.
Manzke T, Dutschmann M, Schlaf G, Mörschel M, Koch UR, Ponimaskin E, Bidon O, Lalley PM, Richter DW (2009) Serotonin targets inhibitory synapses to induce modulation of network functions. Philos Trans R Soc Lond, B, Biol Sci 364:2589-2602.
Mattila PK, Lappalainen P (2008) Filopodia: molecular architecture and cellular functions. Nat Rev Mol Cell Biol 9:446-454.
Mazer C, Muneyyirci J, Taheny K, Raio N, Borella A, Whitaker-Azmitia P (1997) Serotonin depletion during synaptogenesis leads to decreased synaptic density and learning deficits in the adult rat: a possible model of neurodevelopmental disorders with cognitive deficits. Brain Research 760:68-73.
McCudden CR, Hains MD, Kimple RJ, Siderovski DP, Willard FS (2005) G-protein signaling: back to the future. Cell Mol Life Sci 62:551-577.
McIlwain KL, Merriweather MY, Yuva-Paylor LA, Paylor R (2001) The use of behavioral test batteries: effects of training history. Physiol Behav 73:705-717.
Melkonian KA, Ostermeyer AG, Chen JZ, Roth MG, Brown DA (1999) Role of lipid modifications in targeting proteins to detergent-resistant membrane rafts. Many raft proteins are acylated, while few are prenylated. J Biol Chem 274:3910-3917.
Meneses A (2008) Preface. Physiological, pathophysiological and therapeutic aspects of 5-HT mechanisms. Behav Brain Res 195:1.
Meyer BH, Martinez KL, Segura J-M, Pascoal P, Hovius R, George N, Johnsson K, Vogel H (2006) Covalent labeling of cell-surface proteins for in-vivo FRET studies. FEBS Letters 580:1654-1658.
Milligan G (2006) G-protein-coupled receptor heterodimers: pharmacology, function and relevance to drug discovery. Drug Discov Today 11:541-549.
Monnot C, Bihoreau C, Conchon S, Curnow KM, Corvol P, Clauser E (1996) Polar residues in the transmembrane domains of the type 1 angiotensin II receptor are required for binding and coupling. Reconstitution of the binding site by co-expression of two deficient mutants. J Biol Chem 271:1507-1513.
Morris R (1984) Developments of a water-maze procedure for studying spatial learning in the rat. Journal of Neuroscience Methods 11:47-60.
Mulheron JG, Casañas SJ, Arthur JM, Garnovskaya MN, Gettys TW, Raymond JR (1994) Human 5-HT1A receptor expressed in insect cells activates endogenous G(o)-like G protein(s). J Biol Chem 269:12954-12962.
Müller M, Somjen GG (1998) Inhibition of major cationic inward currents prevents spreading depression-like hypoxic depolarization in rat hippocampal tissue slices. Brain Research 812:1-13.
Mumby SM (1997) Reversible palmitoylation of signaling proteins. Curr Opin Cell Biol 9:148-154.
Nelson G, Hoon MA, Chandrashekar J, Zhang Y, Ryba NJ, Zuker CS (2001) Mammalian sweet taste receptors. Cell 106:381-390.
Newey SE, Velamoor V, Govek E-E, Van Aelst L (2005) Rho GTPases, dendritic structure, and mental retardation. J Neurobiol 64:58-74.
Ng J, Nardine T, Harms M, Tzu J, Goldstein A, Sun Y, Dietzl G, Dickson BJ, Luo L (2002) Rac GTPases control axon growth, guidance and branching. Nature 416:442-447.

96
Okado N, Cheng L, Tanatsugu Y, Hamada S, Hamaguchi K (1993) Synaptic loss following removal of serotoninergic fibers in newly hatched and adult chickens. J Neurobiol 24:687-698.
Okamoto T, Schlegel A, Scherer PE, Lisanti MP (1998) Caveolins, a family of scaffolding proteins for organizing "preassembled signaling complexes" at the plasma membrane. J Biol Chem 273:5419-5422.
Okamoto Y, Ninomiya H, Miwa S, Masaki T (2000) Cholesterol oxidation switches the internalization pathway of endothelin receptor type A from caveolae to clathrin-coated pits in Chinese hamster ovary cells. J Biol Chem 275:6439-6446.
Olenik C, Aktories K, Meyer DK (1999) Differential expression of the small GTP-binding proteins RhoA, RhoB, Cdc42u and Cdc42b in developing rat neocortex. Brain Res Mol Brain Res 70:9-17.
Overstreet DH (2002) Behavioral characteristics of rat lines selected for differential hypothermic responses to cholinergic or serotonergic agonists. Behav Genet 32:335-348.
Papoucheva E, Dumuis A, Sebben M, Richter DW, Ponimaskin EG (2004) The 5-hydroxytryptamine(1A) receptor is stably palmitoylated, and acylation is critical for communication of receptor with Gi protein. J Biol Chem 279:3280-3291.
Parks CL, Robinson PS, Sibille E, Shenk T, Toth M (1998) Increased anxiety of mice lacking the serotonin1A receptor. Proc Natl Acad Sci U S A 95:10734-10739.
Pazos A, Palacios JM (1985) Quantitative autoradiographic mapping of serotonin receptors in the rat brain. I. Serotonin-1 receptors. Brain Research 346:205-230.
Peitzsch RM, McLaughlin S (1993) Binding of acylated peptides and fatty acids to phospholipid vesicles: pertinence to myristoylated proteins. Biochemistry 32:10436-10443.
Peng Y-R, He S, Marie H, Zeng S-Y, Ma J, Tan Z-J, Lee SY, Malenka RC, Yu X (2009) Coordinated changes in dendritic arborization and synaptic strength during neural circuit development. Neuron 61:71-84.
Percherancier Y, Lagane B, Planchenault T, Staropoli I, Altmeyer R, Virelizier J-L, Arenzana-Seisdedos F, Hoessli DC, Bachelerie F (2003) HIV-1 entry into T-cells is not dependent on CD4 and CCR5 localization to sphingolipid-enriched, detergent-resistant, raft membrane domains. J Biol Chem 278:3153-3161.
Pfleger KDG, Eidne KA (2005) Monitoring the formation of dynamic G-protein-coupled receptor-protein complexes in living cells. Biochem J 385:625-637.
Pierce KL, Premont RT, Lefkowitz RJ (2002) Seven-transmembrane receptors. Nature Reviews Molecular Cell Biology 3:639-650.
Pin J-P, Galvez T, Prézeau L (2003) Evolution, structure, and activation mechanism of family 3/C G-protein-coupled receptors. Pharmacol Ther 98:325-354.
Ponimaskin E, Voyno-Yasenetskaya T, Richter DW, Schachner M, Dityatev A (2007) Morphogenic signaling in neurons via neurotransmitter receptors and small GTPases. Molecular neurobiology 35:278-287.
Ponimaskin EG, Profirovic J, Vaiskunaite R, Richter DW, Voyno-Yasenetskaya TA (2002a) 5-Hydroxytryptamine 4(a) receptor is coupled to the Galpha subunit of heterotrimeric G13 protein. J Biol Chem 277:20812-20819.
Ponimaskin EG, Heine M, Joubert L, Sebben M, Bickmeyer U, Richter DW, Dumuis A (2002b) The 5-hydroxytryptamine(4a) receptor is palmitoylated at two different sites,

97
and acylation is critically involved in regulation of receptor constitutive activity. J Biol Chem 277:2534-2546.
Radley JJ, Jacobs BL (2002) 5-HT1A receptor antagonist administration decreases cell proliferation in the dentate gyrus. Brain Res 955:264-267.
Radyushkin K, Anokhin K, Meyer BI, Jiang Q, Alvarez-Bolado G, Gruss P (2005) Genetic ablation of the mammillary bodies in the Foxb1 mutant mouse leads to selective deficit of spatial working memory. Eur J Neurosci 21:219-229.
Rapport MM, GREEN AA, PAGE IH (1948) Serum vasoconstrictor, serotonin; isolation and characterization. J Biol Chem 176:1243-1251.
Renner U, Glebov K, Lang T, Papusheva E, Balakrishnan S, Keller B, Richter DW, Jahn R, Ponimaskin E (2007) Localization of the mouse 5-hydroxytryptamine(1A) receptor in lipid microdomains depends on its palmitoylation and is involved in receptor-mediated signaling. Molecular pharmacology 72:502-513.
Reuter H (1995) Measurements of exocytosis from single presynaptic nerve terminals reveal heterogeneous inhibition by Ca(2+)-channel blockers. Neuron 14:773-779.
Richter DW, Manzke T, Wilken B, Ponimaskin E (2003) Serotonin receptors: guardians of stable breathing. Trends in molecular medicine 9:542-548.
Ross EM (1995) Protein modification. Palmitoylation in G-protein signaling pathways. Curr Biol 5:107-109.
Saghatelyan AK, Dityatev A, Schmidt S, Schuster T, Bartsch U, Schachner M (2001) Reduced perisomatic inhibition, increased excitatory transmission, and impaired long-term potentiation in mice deficient for the extracellular matrix glycoprotein tenascin-R. Mol Cell Neurosci 17:226-240.
Salim K, Fenton T, Bacha J, Urien-Rodriguez H, Bonnert T, Skynner HA, Watts E, Kerby J, Heald A, Beer M, McAllister G, Guest PC (2002) Oligomerization of G-protein-coupled receptors shown by selective co-immunoprecipitation. J Biol Chem 277:15482-15485.
Salom D, Le Trong I, Pohl E, Ballesteros JA, Stenkamp RE, Palczewski K, Lodowski DT (2006) Improvements in G protein-coupled receptor purification yield light stable rhodopsin crystals. J Struct Biol 156:497-504.
Saxena PR, Villalón CM (1990) Brain 5-HT1A receptor agonism: a novel mechanism for antihypertensive action. Trends Pharmacol Sci 11:95-96.
Seeburg DP, Feliu-Mojer M, Gaiottino J, Pak DTS, Sheng M (2008) Critical role of CDK5 and Polo-like kinase 2 in homeostatic synaptic plasticity during elevated activity. Neuron 58:571-583.
Shen W, Wu B, Zhang Z, Dou Y, Rao Z-R, Chen Y-R, Duan S (2006) Activity-induced rapid synaptic maturation mediated by presynaptic cdc42 signaling. Neuron 50:401-414.
Smotrys JE, Linder ME (2004) Palmitoylation of intracellular signaling proteins: regulation and function. Annu Rev Biochem 73:559-587.
Sprong H, van der Sluijs P, van Meer G (2001) How proteins move lipids and lipids move proteins. Nat Rev Mol Cell Biol 2:504-513.
Stoppini L, Buchs PA, Muller D (1991) A simple method for organotypic cultures of nervous tissue. Journal of Neuroscience Methods 37:173-182.
Strathmann MP, Simon MI (1991) G alpha 12 and G alpha 13 subunits define a fourth class of G protein alpha subunits. Proc Natl Acad Sci U S A 88:5582-5586.

98
Sunahara RK, Taussig R (2002) Isoforms of mammalian adenylyl cyclase: multiplicities of signaling. Mol Interv 2:168-184.
Sutherland EW, Rall TW (1958) Fractionation and characterization of a cyclic adenine ribonucleotide formed by tissue particles. J Biol Chem 232:1077-1091.
Svenningsson P, Tzavara ET, Qi H, Carruthers R, Witkin JM, Nomikos GG, Greengard P (2007) Biochemical and behavioral evidence for antidepressant-like effects of 5-HT6 receptor stimulation. J Neurosci 27:4201-4209.
Takanishi CL, Bykova EA, Cheng W, Zheng J (2006) GFP-based FRET analysis in live cells. Brain Research 1091:132-139.
Tang C-M, Insel PA (2005) Genetic variation in G-protein-coupled receptors--consequences for G-protein-coupled receptors as drug targets. Expert Opin Ther Targets 9:1247-1265.
Terrillon S, Bouvier M (2004) Roles of G-protein-coupled receptor dimerization. EMBO Reports 5:30-34.
Thomas DR, Melotto S, Massagrande M, Gribble AD, Jeffrey P, Stevens AJ, Deeks NJ, Eddershaw PJ, Fenwick SH, Riley G, Stean T, Scott CM, Hill MJ, Middlemiss DN, Hagan JJ, Price GW, Forbes IT (2003) SB-656104-A, a novel selective 5-HT7 receptor antagonist, modulates REM sleep in rats. Br J Pharmacol 139:705-714.
Thompson MD, Burnham WM, Cole DEC (2005) The G protein-coupled receptors: pharmacogenetics and disease. Crit Rev Clin Lab Sci 42:311-392.
Thompson SM (2000) Synaptic plasticity: Building memories to last. Curr Biol 10:R218-221.
Toomre D, Steyer JA, Keller P, Almers W, Simons K (2000) Fusion of constitutive membrane traffic with the cell surface observed by evanescent wave microscopy. J Cell Biol 149:33-40.
Towler DA, Gordon JI, Adams SP, Glaser L (1988) The biology and enzymology of eukaryotic protein acylation. Annu Rev Biochem 57:69-99.
Turrigiano GG (2008) The self-tuning neuron: synaptic scaling of excitatory synapses. Cell 135:422-435.
Turrigiano GG, Nelson SB (2004) Homeostatic plasticity in the developing nervous system. Nature Reviews Neuroscience 5:97-107.
Turrigiano GG, Leslie KR, Desai NS, Rutherford LC, Nelson SB (1998) Activity-dependent scaling of quantal amplitude in neocortical neurons. Nature 391:892-896.
Udo H, Jin I, Kim J-H, Li H-L, Youn T, Hawkins RD, Kandel ER, Bailey CH (2005) Serotonin-induced regulation of the actin network for learning-related synaptic growth requires Cdc42, N-WASP, and PAK in Aplysia sensory neurons. Neuron 45:887-901.
Vanhoenacker P, Haegeman G, Leysen JE (2000) 5-HT7 receptors: current knowledge and future prospects. Trends Pharmacol Sci 21:70-77.
Veatch W, Stryer L (1977) The dimeric nature of the gramicidin A transmembrane channel: conductance and fluorescence energy transfer studies of hybrid channels. J Mol Biol 113:89-102.
Waldhoer M, Fong J, Jones RM, Lunzer MM, Sharma SK, Kostenis E, Portoghese PS, Whistler JL (2005) A heterodimer-selective agonist shows in vivo relevance of G protein-coupled receptor dimers. Proc Natl Acad Sci U S A 102:9050-9055.

99
Wallrabe H, Elangovan M, Burchard A, Periasamy A, Barroso M (2003) Confocal FRET microscopy to measure clustering of ligand-receptor complexes in endocytic membranes. Biophys J 85:559-571.
Wedegaertner PB, Wilson PT, Bourne HR (1995) Lipid modifications of trimeric G proteins. J Biol Chem 270:503-506.
Wesołowska A, Nikiforuk A (2007) Effects of the brain-penetrant and selective 5-HT6 receptor antagonist SB-399885 in animal models of anxiety and depression. Neuropharmacology 52:1274-1283.
Whitaker-Azmitia PM (2005) Behavioral and cellular consequences of increasing serotonergic activity during brain development: a role in autism? Int J Dev Neurosci 23:75-83.
White JH, Wise A, Main MJ, Green A, Fraser NJ, Disney GH, Barnes AA, Emson P, Foord SM, Marshall FH (1998) Heterodimerization is required for the formation of a functional GABA(B) receptor. Nature 396:679-682.
Whorton MR, Bokoch MP, Rasmussen SGF, Huang B, Zare RN, Kobilka B, Sunahara RK (2007) A monomeric G protein-coupled receptor isolated in a high-density lipoprotein particle efficiently activates its G protein. Proc Natl Acad Sci U S A 104:7682-7687.
Wlodarczyk J, Woehler A, Kobe F, Ponimaskin E, Zeug A, Neher E (2008) Analysis of FRET signals in the presence of free donors and acceptors. Biophys J 94:986-1000.
Woehler A, Ponimaskin EG (2009) G protein--mediated signaling: same receptor, multiple effectors. Curr Mol Pharmacol 2:237-248.
Wood M, Chaubey M, Atkinson P, Thomas DR (2000) Antagonist activity of meta-chlorophenylpiperazine and partial agonist activity of 8-OH-DPAT at the 5-HT(7) receptor. Eur J Pharmacol 396:1-8.
Yamamoto K, Tanimoto T, Kim S, Kikuchi A, Takai Y (1989) Small molecular weight GTP-binding proteins and signal transduction. Clin Chim Acta 185:347-355.
Yamazaki J, Katoh H, Yamaguchi Y, Negishi M (2005) Two G12 family G proteins, G alpha12 and G alpha13, show different subcellular localization. Biochem Biophys Res Commun 332:782-786.
Yu J-Z, Dave RH, Allen JA, Sarma T, Rasenick MM (2009) Cytosolic Galphas acts as an intracellular messenger to increase microtubule dynamics and promote neurite outgrowth. J Biol Chem 284:10462-10472.
Zal T, Gascoigne NRJ (2004) Using live FRET imaging to reveal early protein-protein interactions during T cell activation. Curr Opin Immunol 16:418-427.
Zipkin ID, Kindt RM, Kenyon CJ (1997) Role of a new Rho family member in cell migration and axon guidance in C. elegans. Cell 90:883-894.
Zucker RS, Regehr WG (2002) Short-term synaptic plasticity. Annu Rev Physiol 64:355-405.

100
7 APPENDIX
7.1 Abbreviations
5-CT 5-carboxamidotryptamine
5-HT 5-hydroxytryptamine
ACSF artificial cerebrospinal fluid
BRET biolumninence resonance energy transfer
cAMP 3'-5'-cyclic adenosine monophosphate
Cdc42 small GTPase of the Rho-subfamily
CFP cyan fluorescent protein
CNS Central nervous system
DIV days in vitro
DMEM Dulbecco's modified Eagle's medium
DRM detergent resistant membrane
EPSC excitatory postsynaptic synaptic currents
FCS fetal calf serum
fEPSP field excitatory postsynaptic potential
FRAP fluorescence recovery after photobleaching
FRET Förster resonance energy transfer
GABA gamma-aminobutyric acid
GDP guanosine 5’-diphosphate
GFP green fluorescent protein
GI gastrointestinal
GIRK G-protein-activated inwardly rectifying potassium channels
GPCRs G-protein coupled receptors
GTP guanosine-5'-triphosphate
IP intraperitoneal
LP long dendritic protrusions
LTP long-term potentiation (LTP)
lux-FRET linear unmixing of FRET spectral components
MAPK mitogen-activated protein kinase
MEM minimal essential medium

101
mGlu metabotropic glutamate
mPSCs miniature postsynaptic currents
Mut mutant, i.e. acylation-deficient receptor
P postnatal
PAGE polyacrylamide gel electrophoresis
PCR polymerase chain reaction
PLC phospholipase C
PNS peripheral nervous system
PPF paired pulse facilitation
Rac small GTPase of the Rho-subfamily
RhoA small GTPase of the Rho-subfamily
RNA ribonucleic acid
SDS sodiumdodecylsulfate
SEM standard error of the mean
SP short dendritic protrusions
TEMED tetraeminethylendiamine
TM transmembrane
TX-100 Triton X-100
WT wild-type
YFP yellow fluorescent protein
PBS phosphate buffered saline
PKA protein kinase A
PMSF phenylmethylsulphonyl fluoride

102
7.2 Curriculum vitae
Persönliche Angaben
Name: Eberhard Fritz Kobe
Geburtsdatum / -ort: 06. Oktober 1971 / Dresden
Staatsangehörigkeit: deutsch
Promotion
seit 2005 Doktorarbeit am Institut für Neuro- und Sinnesphysiologie der Georg August Universität Göttingen bei Professor E. Ponimaskin
“Molecular Mechanisms of Serotonergic Signaling:
Role for the Neuronal Outgrowth and Receptor
Oligomerization”
Studium
07/2005 Abschluss als Diplom-Biologe
Titel der Diplomarbeit:
„Die p21-aktivierbare Kinase1 (PAK1) moduliert die
Plasminogen-Aktivator-Inhibitor-1 Expression über
den Hypoxie-induzierbaren Faktor-1”
(experimenteller Teil an der TU Kaiserslautern)
1998 - 2005 Studiengangwechsel Diplom-Biologie
Georg-August-Universität Göttingen
1996 - 1997 Wechsel an die University of Bristol (UK) im Studiengang Humanmedizin
1994 - 1995 Erasmus AustauschprogrammUniversity of Bristol (UK)
1992 - 1996 Studiengang Humanmedizin an der Humboldt-Universität zu Berlin
Praktika
1999 - 2003 Max Bergmann Center für Biomaterialien Dresden,
(regelmäßig mehrmonatig Leibniz Institut für Polymerforschung Dresden

103
in den Semesterferien)
05/05 – 07/05 2002 Max Planck Institut für experimentelle Medizin
Göttingen bei Prof. Dr. Dr. H. Ehrenreich
Freiwilliges Soziales Jahr
1991 - 1992 Betreuung körperlich behinderter Menschen in
London (UK)
Zivildienst
1990 - 1991 Intensivtherapiestation der Medizinischen Akademie
„Carl Gustav Carus“ Dresden
Schulbildung
1990 Allgemeine Hochschulreife (Abitur)
1988 - 1990 Erweiterte Oberschule Dresden-Plauen
1978 - 1988 68. Polytechnische Oberschule Dresden

104
Publikationen 2008 Kobe F, Renner U, Woehler A, Wlodarczyk J, Papusheva E, Bao G, Zeug A, Richter
DW, Neher E, Ponimaskin E
Stimulation- and palmitoylation-dependent oligomerization of serotonin 5-HT1A receptors
Biochim Biophys Acta 2008 1783:1503-1516.
Ponimaskin E, Dityateva G, Ruonala MO, Fukata M, Fukata Y, Kobe F, Wouters FS, Delling M, Bredt DS, Schachner M, Dityatev A
Fibroblast growth factor-regulated palmitoylation of the neural cell adhesion molecule determines neuronal morphogenesis.
J Neurosci 28:8897-8907
Salonikidis PS, Zeug A, Kobe F, Ponimaskin E, Richter DW Quantitative Measurement of cAMP Concentration Using an Epac Based FRET-Sensor
Biophys J 95:5412-5423.
Wlodarczyk J, Woehler A, Kobe F, Ponimaskin E, Zeug A, Neher E.
Analysis of FRET-signals in the presence of free donors and acceptors.
Biophys J 94:986-1000.
2006 Tron K, Samoylenko A, Musikowski G, Kobe F, Immenschuh F, Schaper F, Ramadori G, Kietzmann T.
Regulation of rat heme oxygenase-1 gene expression by interleukin-6.
J Hepatol. 2006 Jul;45(1):72-80
2005 Fritz Kobe
Die p21-aktivierbare Kinase1 (PAK1) moduliert diePlasminogen-Aktivator-Inhibitor-1 Expression überden Hypoxie-induzierbaren Faktor-1
Diplomarbeit im Fachbereich Biochemie der Georg-August-Universität, Göttingen, 2005
2004 Oswald J, Jörgensen B, Pompe T, Kobe F, Salchert K, Bornhäuser M, Ehninger G, Werner C.
Comparison of flow cytometry and laser scanning cytometry for the analysis of CD34+hematopoietic stem cells.
Cytometry A. 2004 Feb;57(2):100-7.
2003 Pompe T, Kobe F, Salchert K, Jörgensen B, Oswald J, Werner C.
Fibronectin anchorage to polymer substrates controls the initial phase of endothelial cell adhesion.
J Biomed Mater Res A. 2003 Nov 1;67(2):647-57.

105