molecular modification of starch during thermomechanical
TRANSCRIPT

Molecular modification of starchduring thermomechanical treatment
René van den Einde

Promotor:Prof. dr. ir. R.M. BoomHoogleraar Levensmiddelenproceskunde, Wageningen Universiteit
Co-promotor:Dr. ir. A.J. van der GootUniversitair docent, sectie Proceskunde, Wageningen Universiteit
Promotiecommissie:Prof. dr. R.J. HamerWageningen Universiteit
Prof. dr. P. D. IedemaUniversiteit van Amsterdam
Prof. dr. ir. E. van der LindenWageningen Universiteit
Dr. J.J.G. van SoestAgrotechnology & Food Innovations, Wageningen

René van den Einde
Molecular modification of starch during thermomechanicaltreatment
Proefschrift
Ter verkrijging van de graad van doctor
op gezag van de rector magnificus
van Wageningen Universiteit,
Prof. Dr. Ir. L. Speelman,
in het openbaar te verdedigen
op dinsdag 27 januari 2004
des namiddags te vier uur in de Aula.

Einde, R.M. van den 2004. Molecular modification of starch during thermomechanicaltreatment. Thesis Wageningen University – with summary in Dutch.
ISBN: 90-5808-964-9

Contents
1. General introduction 7
2. The effect of thermomechanical treatment on starch breakdown and the 17consequences for process design
3. A mechanistic model on the relation between molecular structure of starch and 33macromolecular degradation during heating-shearing processes
4. Molecular breakdown of starch by thermal and mechanical effects 47
5. Modeling macromolecular degradation of corn starch in a twin screw extruder 63
6. Local mixing effects of screw elements during extrusion 81
7. Understanding molecular weight reduction of starch during heating-shearing 97processes (review)
Summary 125
Samenvatting 131
List of publications 137
Nawoord 139
Curriculum vitae 143


7
Chapter 1
General introduction
1. Starch: origin and production
Starch is the form of carbohydrate reserve in nearly all green plants and it is the major
carbohydrate component in food (Van den Berg, 1981). In many food products, such as for
example pasta, snack foods (crisps) and cereals, starch is an important component and
changes in starch properties, for example by heating and shearing, largely contribute to the
final product structure and properties. On industrial scale, starch is isolated from seeds of
cereal grains (corn, wheat, rice), tubers (potato), roots (tapioca, sweet potato) and the pith of
the tapioca palm (Swinkels, 1985). Worldwide, approximately 48.5 million tons of starch are
produced each year (European Union, 2002). Corn starches, which were used in the work
described in this thesis, are the most important starches on world scale (figure 1). Half the
world’s corn is grown in the USA; China, the second largest corn producer in the world,
grows about 10% (Eco-foam.com, 2003). Nowadays also new starch sources have been
explored, such as yam (Alves et al., 1999; Sebio and Chang, 2000) and pea (Barron et al.,
2000, 2001; Della Valle et al., 1994).
Figure 1: Starch distribution world wide by raw material (Starch.dk, 1999).

Chapter 1
8
2. Starch structure
Starch is a mixture of two types of polymers each consisting of D-glucose-units linked by α-
glycosidic bonds: amylose and amylopectin. Amylose is defined as a linear molecule of α-1,4
linked D-glucopyranosyl units, but it is known that some amylose molecules can be slightly
branched (Buléon et al., 1998). The degree of polymerization (DP) varies from a few hundred
up to about 10000, resulting in molecular weights ranging from 104 to 106. Amylopectin is α-
1,4 linked with about one α-1,6 link per 20 monomer units (Swinkels, 1985). The α-1,6-links
form the so-called branching points (figure 2). In this way, a branched structure is formed.
The degree of polymerisation is about 106 or more, resulting in molecular weights of about
108. Starches of different origins contain different amylose-amylopectin ratios. On average,
corn and waxy corn starch contain 72 and >99% (on dry matter) amylopectin respectively
(Swinkels, 1985; Fritz et al., 1994).
Various proposals on the structure of amylopectin have been made (figure 3). The model
based on the cluster structure (figure 3c) as proposed by Robin et al. (1974) has found wide
acceptance. The average length of a chain in such a structure was shown to be 18.3 glucose
units for waxy corn starch (Gérard et al., 2000).
a b
c
Figure 2: Structure of starch components (Swinkels, 1985); a = structure of one α-D-
glucopyranosyl unit; b = linear-chain structure of amylose molecules; c = structure of
amylopectin branching points.

Chapter 1
9
Starch is present in almost all green plants in semi-crystalline granules, with sizes ranging
from 5 to 100 µm (Barron et al., 2001). Amylose and branching regions of amylopectin form
the amorphous regions in the starch granules. Ordered linear segments of amylopectin form
the crystalline regions. Native corn and waxy corn starch have the A-type crystal structure,
which consists of a double helix. A schematic model for the crystalline regions is shown in
figure 4. Due to these crystalline regions, starch granules show a cross under a polarization
microscope.
b c
Figure 3: Proposals for the fine structure of amylopectin and native starch (Van den Berg,
1981); a = laminated structure, one of the earliest models; b = folded molecules; c = a star
type structure for waxy maize amylopectin.
Figure 4: Schematic model for the arrangement of amylopectin in potato starch (Oostergetel
and Van Bruggen, 1993).
Chapter 1
10
3. Thermomechanical processing of starch-water mixtures
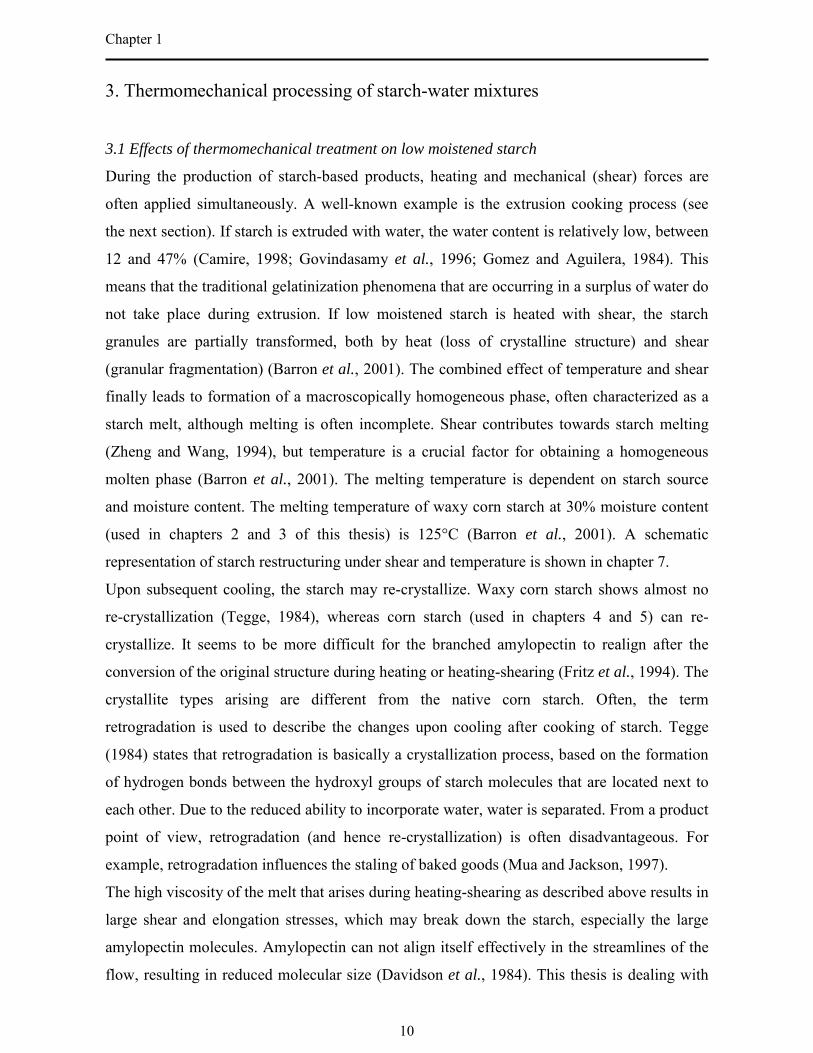
3.1 Effects of thermomechanical treatment on low moistened starch
During the production of starch-based products, heating and mechanical (shear) forces are
often applied simultaneously. A well-known example is the extrusion cooking process (see
the next section). If starch is extruded with water, the water content is relatively low, between
12 and 47% (Camire, 1998; Govindasamy et al., 1996; Gomez and Aguilera, 1984). This
means that the traditional gelatinization phenomena that are occurring in a surplus of water do
not take place during extrusion. If low moistened starch is heated with shear, the starch
granules are partially transformed, both by heat (loss of crystalline structure) and shear
(granular fragmentation) (Barron et al., 2001). The combined effect of temperature and shear
finally leads to formation of a macroscopically homogeneous phase, often characterized as a
starch melt, although melting is often incomplete. Shear contributes towards starch melting
(Zheng and Wang, 1994), but temperature is a crucial factor for obtaining a homogeneous
molten phase (Barron et al., 2001). The melting temperature is dependent on starch source
and moisture content. The melting temperature of waxy corn starch at 30% moisture content
(used in chapters 2 and 3 of this thesis) is 125°C (Barron et al., 2001). A schematic
representation of starch restructuring under shear and temperature is shown in chapter 7.
Upon subsequent cooling, the starch may re-crystallize. Waxy corn starch shows almost no
re-crystallization (Tegge, 1984), whereas corn starch (used in chapters 4 and 5) can re-
crystallize. It seems to be more difficult for the branched amylopectin to realign after the
conversion of the original structure during heating or heating-shearing (Fritz et al., 1994). The
crystallite types arising are different from the native corn starch. Often, the term
retrogradation is used to describe the changes upon cooling after cooking of starch. Tegge
(1984) states that retrogradation is basically a crystallization process, based on the formation
of hydrogen bonds between the hydroxyl groups of starch molecules that are located next to
each other. Due to the reduced ability to incorporate water, water is separated. From a product
point of view, retrogradation (and hence re-crystallization) is often disadvantageous. For
example, retrogradation influences the staling of baked goods (Mua and Jackson, 1997).
The high viscosity of the melt that arises during heating-shearing as described above results in
large shear and elongation stresses, which may break down the starch, especially the large
amylopectin molecules. Amylopectin can not align itself effectively in the streamlines of the
flow, resulting in reduced molecular size (Davidson et al., 1984). This thesis is dealing with

Chapter 1
11
molecular breakdown of starch under these circumstances, as further explained in section 4 of
this chapter.
3.2 An example of thermomechanical processing: extrusion
A well-known example of a thermomechanical process is extrusion cooking. Extrusion has
been utilized to produce various food products for more than 60 years (Akdogan, 1999). The
process is also used for the production of plastic products.
The main layout of an extruder is shown in figure 5. Ingredients in a powdery or granular
form are added at the feed point. Some extruders require mixing with water to the desired
moisture level before extrusion; in other types the water is added in the extruder near the feed
point. From this point, the material is transported towards the end by a rotating screw. During
this transport, the material is subjected to heat (by friction or by a heated barrel) and shear. At
the end of the extruder, the material is pushed through a die to the desired shape. If water is
present, part of it flashes off due to a pressure drop. The flash-off results into expansion of the
extrudate as the steam stretches the still molten material (Camire, 1998). Single screw
extruders contain one rotating screw; twin screw extruders contain two screws, which can be
co- or counter-rotating. Different types of screw elements can be used (figure 6). Transport
elements cause only low shear rates in the starch melt due to the relatively large distance
between the element and the barrel. Only at the tip, high shear rates occur, which are,
however, applied to a small fraction of the material only. Single lead elements are used to
build up pressure due to their smaller pitch compared to transport elements. The distance
between the element and barrel is also in this case relatively large resulting in low shear rates;
high shear rates occur at the tip only. Reverse screw elements have a reverse flight pushing
the material backwards. They are often used to obtain an intensive exchange of solids and
melt between the screws and within screw channels providing optimal mixing (Van Zuilichem
et al., 1999). The average shear rate is generally higher than in the transport and single lead
elements (Yacu, 1985). Paddles are used to knead mixtures of starch or flour and water to a
homogeneous melt. These high shear elements are highly important for obtaining the right
product properties as they influence mixing, residence time and various physicochemical
changes (Choudhury and Gautham, 1998). Paddles can be placed on the screw shaft in a
positive or negative conveying direction. Various angles between the pairs of paddles can be
used (see for example figure 6).

Chapter 1
12
Extruders have often been used to study molecular breakdown of starch. Complicating factors
in the use of the extruder for studying the effect of various (process) parameters on starch
modification are the inhomogeneous distributions of temperature and shear and elongation
rates and the coupled effects of the process parameters that can be adjusted. For example, if
the screw speed is increased, the treatment time decreases, whereas stresses increase and
locally temperatures may increase.
Figure 5: Schematic drawing of an APV MPF 50 twin screw extruder: 1 = feed point; 2 =
hopper; 3 = heating / cooling system; 4 = screw; 5 = die.
a b c d
e f g
Figure 6: Different types of extruder screw elements: (a) single lead element, (b) side view
paddles +60°, (c) transport element, (d) reverse screw element, (e) pair of paddles, (f) various
side views paddles +90°, (g) transport element.
2
1
3 4
5

Chapter 1
13
4. Outline of this thesis
Although molecular breakdown of starch during thermomechanical treatment, for example
extrusion, has been observed in many studies (see, for example, Willett et al., 1997, Baud et
al., 1999, Orford et al., 1993; more references are given in chapter 7) and its importance for
certain product properties such as cold paste viscosity, water solubility and expansion
behavior has been acknowledged widely (Bruemmer et al., 2002, Harper, 1986), the exact
processing conditions under which the breakdown occurs are still largely unknown.
Understanding the molecular breakdown and the influences of process parameters on it would
reveal insights on efficient new process design in this respect. Therefore, we decided to study
the effects of process parameters in a well-defined shear field. Due to the high viscosity of the
molten low moistened starch and its tendency to induce slip, it is difficult to carry out such
investigations on conventional rheological equipment. For this reason, a new device able to
apply a well-defined thermomechanical treatment to low moistened starch was developed,
allowing high shear rates and stresses, comparable to those occurring during extrusion. The
aims of the investigations described in this thesis were:
1. to gain insight into and to model the effect of the different process parameters involved in
thermomechanical treatment (time, temperature, shear or elongation stress, energy input,
moisture content) on the degree of macromolecular degradation of starch;
2. to apply these results to existing processes (extrusion) in order to be able to describe the
molecular weight reduction during these processes and to asses the scope for development
of processes regarding controlled selective starch breakdown.
The effects of different process parameters on the degree of macromolecular degradation are
the subject of chapters 2, 3 and 4. Chapters 5 and 6 discuss the application to extrusion
processes. The two aims are integrated in chapter 7.
Chapter 2 of this thesis describes an experimental study using the newly developed device to
investigate the effect of shear and thermal treatment on a mixture of waxy corn starch and
water. At the temperature range investigated, thermal effects were negligible; all degradation
was induced mechanically. The central question in this chapter is whether mechanically
induced starch breakdown is time-dependent or independent within the time scales generally
used during thermomechanical treatment. In chapter 3, a molecular scale model describing
the molecular breakdown by shear forces of low moisture amylopectin melts is derived that
couples the engineering scale experiments of chapter 2 to molecular scale processes. In

Chapter 1
14
chapter 4, experiments are extended in such a way that thermal breakdown becomes
important. Thus, the combined effects of shear and thermal treatment are investigated.
In chapter 5, the molecular weight reduction of regular corn starch in a twin screw extruder is
predicted using results of chapter 4 as well as flow simulations. It is explained in this chapter
that for a better prediction in certain situations, the trajectories taken by starch particles during
extrusion are needed to estimate a more accurate time-shear and time-temperature history.
Chapter 6 is a first step in that direction: mixing effects of different screw elements are
measured using local Residence Time Distribution (RTD) determination in a completely filled
twin screw extruder using a dilute solution of pre-gelatinized waxy corn starch as a model
fluid. It is shown that most mixing takes place locally in the extruder and is not determined in
global RTD measurements. Finally, chapter 7 reviews the literature on starch molecular
weight reduction. This chapter shows that many results of extrusion trials described in
literature can actually be well understood using the findings of this thesis. Furthermore,
suggestions for process design for selective degradation of starch are given and future
research needs are addressed.
References
Akdogan, H. (1999). High moisture food extrusion. International Journal of Food Science
and Technology, 34, 195-207.
Alves, R.M.L., Grossmann, M.V.E., & Silva, R.S.S.F. (1999). Gelling properties of extruded
yam (Dioscorea alata) starch. Food Chemistry, 67, 123-127.
Barron, C., Buleon, A., Colonna, P., & Della Valle, G. (2000). Structural modifications of low
hydrated pea starch subjected to high thermomechanical processing. Carbohydrate Polymers,
43, 171-181.
Barron, C., Bouchet, B., Della Valle, G., Gallant, D.J., & Planchot, V. (2001). Microscopical
study of the destructuring of waxy maize and smooth pea starches by shear and heat at low
hydration. Journal of Cereal Science, 33, 289-300.
Baud, B., Colonna, P., Della Valle, G., & Roger, P. (1999). Macromolecular degradation of
extruded starches measured by HPSEC-MALLS. Biopolymer Science: Food and Non Food
Applications / Les Colloques de l'INRA, 91, 217-221, 1999.
Berg, C. van den. Vapour sorption equilibria and other water-starch interactions; a physico-
chemical approach. Wageningen Agricultural University, PhD thesis, 1981.

Chapter 1
15
Bruemmer, T., Meuser, F., Lengerich, B. van, & Niemann, C. (2002). Expansion and
functional properties of corn starch extrudates related to their molecular degradation, product
temperature and water content. Starch / Staerke, 54, 9-15.
Buléon, A., Colonna, P., Planchot, V., & Ball, S. (1998). Starch granules: structure and
biosynthesis. International Journal of Biological Macromolecules, 21, 85-112.
Camire, M.E. (1998). Chemical changes during extrusion cooking - recent advances.
Advances in experimental medicine and biology, 434, 109-121.
Choudhury, G.S., & Gautam, A. (1998). Comparative study of mixing elements during twin-
screw extrusion of rice flour. Food Research International, 31(1), 7-17.
Davidson, V.J., Paton, D., Diosady, L.L., & Larocque, G. (1984). Degradation of wheat starch
in a single-screw extruder: characteristics of extruded starch polymers. Journal of Food
Science, 49, 453-458.
Eco-foam.com (2003). http://www.eco-foam.com/production.asp
European Union (2002). Evaluation of the Community Policy for Starch and Starch Products.
http://europa.eu.int/comm/agriculture/eval/reports/amidon/chap1.pdf
Fritz, H.G., Seidenstuecker, T., & Boelz, U. (1994). Use and modification of biological
substances. In Production of thermo-bioplastics and fibres based mainly on biological
materials (p. 10-108). European Commission Science Research Development.
Gérard, C., Planchot, V., Colonna, P., & Bertoft, E. (2000). Relationship between branching
density and crystalline structure of A- and B-type maize mutant starches. Carbohydrate
Research, 326, 130-144.
Gomez, M.H., & Aguilera, J.M. (1984). A physicochemical model for extrusion of corn
starch. Journal of Food Science, 49, 40-63.
Govindasamy, S., Campanella, O.H., & Oates, C.G. (1996). High moisture twin-screw
extrusion of sago starch: 1. Influence on granule morphology and structure. Carbohydrate
Polymers, 30, 275-286.
Harper, J.M. (1986). Extrusion texturization of foods. Food Technology, 40, 70, 72, 74-76.
Mua, J.P., & Jackson, D.S. (1997). Relationships between functional attributes and molecular
structures of amylose and amylopectin fractions from corn starch. Journal of Agricultural and
Food Chemistry, 45, 3848-3854.
Oostergetel, G.T., & Bruggen, E.F.J. (1993). The crystalline domains in potato starch
granules are arranged in a helical fashion. Carbohydrate Polymers, 21, 7-12.

Chapter 1
16
Orford, P.D., Parker, R., & Ring, S.G. (1993). The functional properties of extrusion-cooked
waxy-maize starch. Journal of Cereal Science, 18, 277-286.
Robin, J.P., Mercier, C., Charbonniere, R., & Guilbot, A. (1974). Lintenerized starches. Gel
filtration and enzymatic studies of insoluble residue from prolonged acid treatment of potato
starch. Cereal Chemistry, 51, 389-406.
Sebio, L. & Chang, Y.K. (2000). Effects of selected process parameters in extrusion of yam
flour (Dioscorea rotundata) on physicochemical properties of the extrudates. Nahrung, 44(2),
96-101.
Starch.dk (1999). http://www.starch.dk/isi/stat/rawmaterial.html
Swinkels, J.J.M. (1985). Sources of starch, its chemistry and physics. In G.M.A. van Beynum,
& J.A. Roels. Starch conversion technology (p. 15-46). New York: Marcel Dekker Inc.
Tegge, G. (1984). Staerke und Staerkederivate. Hamburg: Behr�s Verlag.
Valle, G. Della, Quillien, L., & Gueguen, J. (1994). Relationships between processing
conditions and starch and protein modifications during extrusion-cooking of pea flour.
Journal of the Science of Food and Agriculture, 64, 509-517.
Willett, J.L., Millard, M.M., & Jasberg, B.K. (1997). Extrusion of waxy maize starch: melt
rheology and molecular weight degradation of amylopectin. Polymer, 38(24), 5983-5989.
Zheng, X. & Wang, S.S. (1994). Shear induced starch conversion during extrusion. Journal of
Food Science, 59(5), 1137-1143.
Yacu, W.A. (1985). Modelling a twin screw co-rotating extruder. Journal of Food
Engineering, 8, 1-21.
Zuilichem, D.J. van, Kuiper, E., Stolp, W., & Jager, T. (1999). Mixing effects of constituting
elements of mixing screws in single and twin screw extruders. Powder Technology, 106, 147-
159.

Chapter 2
The effect of thermomechanical treatment on starch breakdown and
the consequences for process design
Abstract
Macromolecular degradation of starch by heating and shear forces was investigated using a
newly developed shear cell. With this equipment, waxy corn starch was subjected to a variety
of heat and shear treatments in order to find the key parameter determining the degree of
macromolecular degradation. A model based on the maximal shear stress during the treatment
gave an improved prediction compared to existing models in literature based on specific
mechanical energy input (SME) or shear stress multiplied by time (τ·t). It was concluded that
molecular weight reduction of starch at the temperatures investigated (85-110°C) is a time-
independent process, during which the starch molecules are broken down virtually
instantaneously by high shear force within time scales investigated. Consequences for design
of shear based processes (especially extrusion) are shortly discussed.
This chapter was published as: R.M. van den Einde, A. Bolsius, J.J.G. van Soest, L.P.B.M.
Janssen, A.J. van der Goot, R.M. Boom, The effect of thermomechanical treatment on starch
breakdown and the consequences for process design. (2004). Carbohydrate Polymers, 55(1),
57-63.
Chapter 2
18
1. Introduction
Starch is an ingredient that determines product properties, such as cohesiveness, water
solubility and cold paste viscosity of many food products. Previous studies have shown that
the molecular weight of the starch is an important property in this respect (Bruemmer et al.,
2002; Bindzus et al., 2002).
Production of starch based products often comprises a combination of shear and thermal
treatment, for example in extrusion processes. It is well known that the combination of shear
and thermal treatment leads to molecular breakdown, but the exact cause and control of this
effect are still matters of uncertainties. This is partly due to the fact that the shear rates, shear
stresses and temperatures are rather inhomogeneous in most process equipment and therefore
difficult to control. Nevertheless, the use of extrusion trials led to development of empirical
models describing the relation between molecular weight and process parameters. Parker et
al. (1990) concluded that molecular breakdown relates to the specific mechanical energy input
(SME) during extrusion, defined as the capacity transferred by the screws per unit of mass or
volume (Meuser et al., 1984). Diosady et al. (1985) obtained a first order correlation between
the molecular weight reduction and shear stress multiplied by time (τ·t), thereby suggesting
time-shear equivalence in molecular breakdown of starch.
Some authors presented a different approach by using equipment with more defined shear and
temperature gradients. Vergnes et al. (1987) carried out an important study, describing the
effect of well-defined shear and temperature on macromolecular degradation. They used a
self-built rheometer with pre-shearing to simulate extrusion cooking and concluded that
mechanical energy input during the treatment determined macromolecular degradation of the
starch. Igura et al. (1997) used a flow tester equipped with a capillary tube to show
qualitatively the impact of heating at 150°C and shearing on macromolecular degradation of
various starches. They showed that longer time heating gave the same degree of degradation
as a shorter time heating-shearing treatment, suggesting an equivalence of shear and heating
time at this temperature.
Grandbois et al. (1999) and Beyer (2000) presented a fundamental approach. They
investigated the molecular strength of the glucosidic bonds, and the effect of extensionally
applied forces on these bonds using atomic force microscopy. One of their conclusions was
that breakdown of a covalent bond in an amylose molecule takes place almost instantaneously
in case the force applied exceeds the bond strength. If their outcome is applied to an extrusion

Chapter 2
19
process of a starch-containing product, it implies a dependency of the molecular weight
reduction on the maximal force during the treatment, rather than on treatment time. This
seems to be in contradiction with the empirical studies described above.
The aim of this study was therefore to investigate which fundamental process parameter
determines starch macromolecular degradation during a heating-shearing treatment. For this
purpose a new device was developed, which enabled the separation of the effects of shear
force, shear rate, time and temperature. Experimental data of this device were used to find the
key parameter to starch molecular weight reduction. The outcome of the key parameter study
was used to explain the pattern of starch molecular weight reduction during extrusion
cooking.
2. Theory
2.1. Measurement and quantification of starch degradation
Shear forces are known to induce endodegradation of the high molecular weight compounds
in starch (Baud et al., 1999; Davidson et al., 1984). The intrinsic viscosity [η] is especially
sensitive to this type of degradation, even if the actual molecular weight reduction is limited
and difficult to measure by chromatographic methods. Furthermore, a good correlation was
found between the molecular weight of corn amylopectin as measured by chromatography in
combination with laser light scattering and the intrinsic viscosity (Millard et al., 1997),
suggesting that [η] ~ Mw0.29. Therefore, the intrinsic viscosity can be used as a measure for
the molecular weight.
Some studies suggest that the crystalline part of the starch is not susceptible to a mechanical
treatment. According to these investigations, only the molten parts can be degraded. As a
result of this, the intrinsic viscosity needs to be corrected. Diosady et al. (1985) suggested the
following correction:
rs
iX][][
ηη
= [1]
ff rs
i])[1(][
][ηη
η−−
= [2]
where f denotes the fraction crystalline starch; [η] and [η]rs denote the intrinsic viscosity of
the treated and of the native starch respectively. X represents the relative intrinsic viscosity

Chapter 2
20
(0 < X < 1) and can be used as a measure for starch degradation. X = 1 denotes that starch was
not degraded.
2.2. Modeling and key parameter study
Models relating the decrease in intrinsic viscosity and process parameters were developed by
Parker et al. (1990) and Diosady et al. (1985). Parker and co-workers related the intrinsic
viscosity to the specific mechanical energy during extrusion. Diosady and co-workers related
the intrinsic viscosity to the product of shear stress and time. Their models can be written as:
( )SMECCX aa ⋅−= 21 exp [3]
and
( )tCCX bb τ⋅−= 21 exp [4]
respectively, where SME denotes the specific mechanical energy, τt denotes the product of
shear stress and time and C1a and C1b are constants. Parker and co-workers did not include the
melt correction described in section 2.1, which means that they assumed that f = 1.
Contrary to these studies, the fundamental investigations of Beyer (2000) and Grandbois et al.
(1999) suggest the maximal shear stress to be the key parameter. In analogy with the models
described above, the following correlation can be derived:
( )max21 exp τ⋅−= cc CCX [5]
The value of the constant C1a, C1b or C1c depends on whether or not thermal breakdown takes
place and on whether or not native starch can handle a certain shear stress or mechanical
energy input before breaking down (figure 1). If thermal breakdown takes place, the value is
expected to be lower than 1. If no thermal breakdown takes place and the native starch can
handle a certain shear stress or mechanical energy input before breaking down, the constant is
higher than 1. In this case, X = 1 if the stress or mechanical energy input level is lower than
minimally required for breakdown (figure 1). If the native starch breaks down at any shear
stress or mechanical energy level but no thermal breakdown takes place, the constant is equal
to 1. The use of the shear cell described below allowed us to compare the different models
and thus to find the key parameter to starch degradation.

Chapter 2
21
Figure 1: Effect of the value of parameter C1 on the models described in the Theory section.
3. Materials and methods
3.1. Starch and water
Waxy corn starch was used in all experiments. Intrinsic viscosity and percentage of crystalline
material of the native starch are given in table 1. Before processing, starch was pre-mixed
with water to a moisture content of 30% (w water/w total). Experiments were carried out 1
day after pre-mixing in order to allow equilibrium of water over the starch.
3.2. Heating-shearing treatment in the shear cell
The starch-water mixture was thermomechanically treated in a newly developed shearing
device. This new device was based on a cone and plate rheometer concept. It was designed
and sized at pilot scale. Thickness of the product layer was kept small compared to the
diameter of the cone, in order to apply the desired shear rates at relatively low rotation speeds,
thereby avoiding circular flow and guarantee ideal flow conditions. The engine was chosen in
such a way that shearing stresses up to 6·104 Pa, comparable to extrusion processes, were
possible.
0
1
0 10
maximal shear stress or SME or shear stress * time
XC1>1: certain stress or SME level needed for degradation
C1=1: breakdown at anystress or SME level and no thermal degradation
C1<1: breakdown at any stress or SME level and thermal degradation takes place

Chapter 2
22
Table 1: Treatment conditions and results for a mixture of waxy corn starch and 30% water
processed in the shear cell. Exp. no. = experiment number; N = rotation speed; T =
temperature; t = treatment time; τmax = maximal shear stress during the measurement; τ·t =
shear stress multiplied by time; SME = Specific Mechanical Energy; % crystalline =
percentage of A-type crystals as measured by X-Ray diffraction; [η] = intrinsic viscosity.
Exp.
no.
N
(rpm)
T (°C) t (s) τmax
(104 Pa)
τ · t
(106 Pa·s)
SME
(108 J/m3)
%
crystalline
[η]
(ml/g)
Native - - - - - - 26.0 165
1 10 110 900 1.11 2.49 0.42 13.5 126
2 35 110 900 1.94 1.98 0.58 14.8 114
3 75 110 750 1.97 6.89 4.89 11.2 97
4 35 100 900 1.76 2.40 0.93 17.2 128
5 35 100 900 1.88 2.12 0.96 17.2 113
6 75 100 1200 2.96 5.50 4.58 11.2 81
7 75 100 900 3.89 3.10 3.18 14.6 82
8 75 85 960 3.68 5.29 4.22 15.3 89
9 75 85 1200 3.94 8.69 10.52 12.5 80
10 75 85 960 4.58 6.72 8.82 12.2 71
The shearing device and its dimensions are shown in figure 2. After the shearing zone (1) was
filled, the starch-water mixture was heated by the electrical heating elements (2) in the cone
and sheared between the rotating plate (3) and the non-rotating cone (4). A thermocouple (5)
monitored the sample temperature. As soon as the temperature set point was reached, the
engine was started. During the treatment of sample 1, rotation speed was kept constant at 10
rpm, corresponding to a shear rate of 24 s-1. During the treatment of samples 2, 4 and 5, a
rotation speed of 35 rpm was applied. To avoid slip and inhomogeneous samples, the rotation
speed was obtained in the following steps: the rotation speed was first set at 10 rpm for 300 s,
and then at 35 rpm until the end of the run. During the treatment of samples 3 and 6-10, a
rotation speed of 75 rpm was applied, again obtained in steps: the rotation speed was first at
10 rpm for 300 s, then at 35 rpm for 250 s, then at 50 rpm for 110 s and finally at 75 rpm until
the end of the run. The use of different rotation speed combinations made it possible to

Chapter 2
23
change the shear stress and mechanical energy input. Sample size was 130 g in all
experiments. Times and temperatures are shown in table 1.
Shear stress during the treatment was determined by measuring the torque (6). The specific
mechanical energy input during the treatment in the shear cell (SMESC) was calculated
according to (based on Meuser et al., 1984):
V
dttorqueSME
t
SC∫ ⋅⋅
= 0ω
[6]
Also shear stress (τ) and shear stress multiplied by time (τ · t) were calculated from the torque
measurements.
After the thermomechanical treatment the shear cell was opened and the heated-sheared
sample was directly frozen. Prior to further analysis, samples were dried in an oven at 35°C to
10% water content. After drying, the samples were immersed in liquid nitrogen and ground to
pass a 366 µm sieve.
Figure 2: A newly developed shear cell for applying well-defined shear and temperature to
low moistened starch. Cone angle = 100°, shear zone angle θ = 2.5°, R = 0.1 m, H = 0.082 m.

Chapter 2
24
3.3. Analysis
Intrinsic viscosity [η] of the samples was measured at 25°C with an Ubbelohde viscometer
(Fujio et al., 1995). Starch was dissolved in 1 M KOH for 45 minutes and 6 concentrations in
the range of 0.5-2 mg/ml were used (solvent flow time = 332 s). Values of the intrinsic
viscosity measurement could be reproduced within a range of 5%.
Crystallite type of the starch and percentage of crystalline material was determined using a
Philips PC-APD PW 3710 powder X-Ray diffractometer.
3.4. Mathematical comparison of models
In order to find the key parameter to starch degradation, the models described in the theory
section were fitted to the data. In order to find the best model and thus the key parameter for
starch degradation, two methods were used. As a first indication, the R2 values were
compared. Secondly, the Akaike information criterion was used (Akaike, 1973):
1)1(22)ln( 2
−−+++=
pnpppsnAIC [7]
nRSSs =2 [8]
The criterion states that if two models are compared, model 2 is considered to give a better fit
than model 1 if AIC1 - AIC2 > 5.
Furthermore, the intercepts of the fits can be considered physically correct only if they are
equal to or higher than 1 (see Theory section). Therefore, also the fitted values of the intercept
were used to compare the models.
4. Results and discussion
4.1. Paste formation and melting
In all experiments, a melt with small powdery fractions was obtained, comparable to the
results of Barron et al. (2000) on heating-shearing treatment of pea starch below the melting
temperature. X-Ray diffraction measurements showed that indeed part of the material was not
molten (table 1) and that all samples displayed A-type crystals, the same type as the native
starch.
Development of the shear stress in time appeared to be sensitive to the exact conditions
during preparation and filling. Therefore, starting with the same conditions could lead to a

Chapter 2
25
variety in shear stresses (τ, SME; table 1). Therefore, it was decided to relate the measured
process data to the product properties.
4.2. Macromolecular degradation during heating-shearing treatment
In all samples, macromolecular degradation took place as evident from a decrease in intrinsic
viscosity (table 1). In order to find the key factor to starch degradation, equations [3] to [5]
were fitted to the data (figures 3, 4 and 5). The parameter values obtained, the correlation
coefficients (R2 values) and the values for the Akaike information criteria are shown in
table 2. The first order SME and τ·t-based literature models yielded low R2 values (<0.67),
whereas an acceptable fit (R2=0.933) could be obtained using a first order model based on the
maximal shear stress τmax. The calculated Akaike criteria showed that the τmax based model
described the data significantly better than the SME and τ·t based models: the difference
between the Akaike criteria was higher than 5. Thus, at the temperatures investigated the
process of starch degradation on a macroscopic scale is time independent within time scales
investigated, which is in agreement with the fundamental conclusion by Beyer (2000) for
cleavage of covalent bonds.
Figure 3: Relative intrinsic viscosity X of heated- and heated-sheared waxy corn starch as a
function of τ·t. Points are the measurements, the line is the fitted first order model.

Chapter 2
26
Figure 4: Relative intrinsic viscosity X of heated- and heated-sheared waxy corn starch as a
function of SME. Points are the measurements, the line is the fitted first order model.
Figure 5: Relative intrinsic viscosity X of heated- and heated-sheared waxy corn starch as a
function of maximal shear stress τmax. Points are the measurements; the line is the fitted first
order model.

Chapter 2
27
Table 2: Fit parameters, R2 and AIC values for different first order models including melt
correction (see text) fitted to the data given in table 1.
Model C1 C2 R2 AIC
Diosady et al. (1985)
t)exp( 21 τ⋅−= CCX
0.81 9.60·10-8 0.64 -46.6
Parker et al. (1990)
SME)exp( 21 ⋅−= CCX
0.71 7.37·10-10 0.66 -44.8
New model
)exp( max21 τ⋅−= CCX
0.95 2.20·10-5 0.93 -66.3
The value of the constant C1c in the τmax based model was 0.95. As long as no thermal
degradation takes place, one would expect the value to be at least 1 (see Theory). Although
the uncertainty in the intrinsic viscosity experiments is such that the value is not significantly
different from unity, it may be an indication that some thermal degradation took place. In
order to check this, heating without shearing was applied both at 85 and 110°C for 15
minutes. The sample treated at 110°C had an intrinsic viscosity of 158 g/ml. This very small
difference from the value of native starch might explain why the constant C1c in the τmax based
model was slightly below 1. Thermal treatment at 85°C decreased the intrinsic viscosity to
140 g/ml. This value was found in many replications of this experiment. This might be related
to the solubility of the starch. After the thermal treatment at 85°C it was very difficult to
dissolve the starch in a KOH solution. This might be responsible for the low intrinsic
viscosity measured subsequently. However, these solubility problems were not observed on
any of the thermomechanically treated samples. Comparison of samples 7 and 9, which have
the same maximal shear stress but different treatment temperatures (table 1), clearly shows
that the effect described above was not found in the heating-shearing experiments.
The constants C1a and C1b in the τ·t and SME based models respectively were significantly
lower than 1 (table 2). The thermal effects described above can not account for these low
values of the constants, showing that the physical background of these models can not be
correct. Again, this indicates that the time independent model should be used to predict starch
degradation at the temperatures and process times investigated.

Chapter 2
28
The fact that Vergnes et al. (1987) found a good correlation between SME in a rheometer,
implying a kind of time-shear equivalence, may be explained from the applied higher
temperatures (140 - 180°C). Thermal, time-dependent effects are not negligible anymore at
these temperatures, so that a correlation with time is expected. Furthermore, possible
interactions between thermal and shear effect might occur at these temperatures as well,
which could further induce an effect of time on the results.
4.3. Explanation of degradation effects during extrusion processes
From the measurements, we suggest the following degradation pattern during extrusion at the
temperatures investigated.
As long as all material is powdery, no degradation takes place because no significant shear
force is applied to the starch molecules, as also found by Colonna et al. (1983). As the
material begins to melt, shear stress is applied to the starch, causing the larger molecules in
the molten parts to be degraded. The degradation pattern now becomes more complex as
viscosity and shear stress on one hand decrease due to the breakdown of the macromolecules,
but on the other hand increase due to further melting of the material. Furthermore, the
breakdown will be inhomogeneous, because the shear rate, and thus the shear stress, varies
locally in the extruder. Thus, it is expected that the degradation continues in time along the
length of the extruder, although the degradation process itself is time-independent.
During extrusion trials, the SME is coupled to the shear stresses along the barrel. Typically,
higher maximal shear stresses in the extruder lead to a higher torque on the engine and thus to
a higher SME. Therefore, it is not surprising that in extrusion processes a good correlation
between SME and starch breakdown can be obtained as for example found by Parker et al.
(1990) and Willett et al. (1997).
Using the degradation pattern described above, we are now able to formulate how to prevent
undesired degradation during extrusion (at the temperatures investigated in this paper) and to
review how well the extruder performs if molecular weight reduction is a desired process.
According to our insights, undesired macromolecular degradation during extrusion processes
can be reduced by decreasing the screw speed or increasing the depths of the gaps, so that the
maximal shear stress is lower. The expected effect of screw speed is in accordance with data
of Della Valle et al. (1995) on extrusion of potato starch. It is also in agreement with data of
Della Valle et al. (1996) on extrusion of waxy corn starch and with data of Colonna and
Mercier (1983) on extrusion of manioc starch, although in these two studies the effect of

Chapter 2
29
screw speed was investigated at higher temperatures, so that thermal effects may have to be
taken into account. Increasing the moisture content will also lower the maximal shear stress
and thus reduce the macromolecular degradation, although thermal effects might be more
important at higher moisture content, as indicated by Igura et al. (2001). The expected effect
of moisture content is in accordance with data of Chinnaswamy and Hanna (1990) on
extrusion of corn starch and with data of Davidson et al. (1984) on extrusion of wheat starch.
On the other hand, if molecular reduction is desirable, the inhomogeneity of conditions in an
extruder is a source of inefficiency, as only the high shear spots in the extruder are effective.
5. Concluding summary
At the temperatures investigated, the maximal shear stress during heating-shearing treatment
was found to be the key parameter determining the degree of macromolecular degradation of
starch. This conclusion could be drawn only by means of separating the effects of shear and
time showing that the newly developed shear cell is a useful tool in understanding effects of
shear, temperature and time on the properties of low moistened starch and probably other
materials.
The degree of macromolecular degradation during extrusion processes can be reduced by
decreasing the maximal shear stresses by decreasing screw speed or increasing the depths of
the gaps, but the residence time does not play a role for the breaking process itself. Increasing
moisture content also decreases the maximal shear stress, although it might also affect thermal
breakdown effects. The results presented can form a basis to develop predictive models
enabling exact description of starch degradation.
List of symbols
C1 first fit parameter in first order model (-)
C1a first fit parameter in first order SME model (-)
C1b first fit parameter in first order τ·t model (-)
C1c first fit parameter in first order τmax model (-)
C2a second fit parameter in first order SME model (m3/J)
C2b second fit parameter in first order τ·t model (m2/(N·s))
C2c second fit parameter in first order τmax model (m2/N)

Chapter 2
30
f fraction of molten material (-)
H height of the cone (m)
MC moisture content (%)
Mw molecular weight (Da)
n number of experiments (-)
N rotation speed (rpm)
p number of parameters (-)
R radius of the cone at the top of the shearing zone (m)
RSS residual sum of squares (-)
s standard deviation
SME specific mechanical energy (J/m3)
SMESC specific mechanical energy as calculated for the new shearing device (J/m3)
t time (s)
V volume (m3)
X relative intrinsic viscosity of the molten fraction of the treated starch compared
to native starch (-)
Greek symbols
γ shear rate (s-1)
[η] intrinsic viscosity (ml/g)
[η]i intrinsic viscosity of the molten starch fraction (ml/g)
[η]rs intrinsic viscosity of the unmolten starch fraction (equals intrinsic viscosity of
native starch (ml/g)
θ angle of the shear zone of the newly developed shearing device (û)
τ shear stress (N/m2)
τmax maximal shear stress (N/m2)
ω angular velocity [= 2πN/60] (rad/s)
Chapter 2
31
References
Akaike, H. (1973). Information theory and an extension of the maximum likelihood principle.
In N. Petrov, & F. Csaki. Proceedings of the 2nd international symposium on information
theory (p. 267-281). Budapest: Akademiai Kiado.
Barron, C., Buleon, A., Colonna, P., & Valle, G. Della (2000). Structural modifications of low
hydrated pea starch subjected to high thermomechanical processing. Carbohydrate Polymers,
43, 171-181.
Baud, B., Colonna, P., Valle, G. Della, & Roger, P. (1999). Macromolecular degradation of
extruded starches measured by HPSEC-MALLS. Biopolymer Science: Food and Non Food
Applications / Les Colloques de l'INRA, 91, 217-221.
Beyer, M.K. (2000). The mechanical strength of a covalent bond calculated by density
function theory. Journal of Chemical Physics, 112(17), 7307-7312.
Bindzus, W., Fayard, G., Lengerich, B. van, & Meuser, F. (2002). Description of extrudate
characteristics in relation to the shear stress of plasticised starches determined in-line. Starch /
Staerke, 54, 252-259.
Bruemmer, T., Meuser, F., Lengerich, B. van, & Niemann, C. (2002). Expansion and
functional properties of corn starch extrudates related to their molecular degradation, product
temperature and water content. Starch / Staerke, 54, 9-15.
Chinnaswamy, R., & Hanna, M.A. (1990). Macromolecular and functional properties of
native and extrusion cooked starch. Cereal Chemistry, 67(5), 490-499.
Colonna, P., & Mercier, C. (1983). Macromolecular modifications of manioc starch
components by extrusion-cooking with and without lipids. Carbohydrate Polymers, 3, 87-
108.
Colonna, P., Melcion, J.P., Vergnes, B., & Mercier, C. (1983). Flow, mixing and residence
time distribution of maize starch within a twin-screw extruder with a longitudinally split
barrel. Journal of Cereal Science, 1, 115-125.
Davidson, V.J., Paton, D., Diosady, L.L., & Larocque, G. (1984). Degradation of wheat starch
in a single-screw extruder: characteristics of extruded starch polymers. Journal of Food
Science, 49, 453-458.
Diosady, L.L., Paton, D., Rosen, N., Rubin, L.J., & Athanassoulias, C. (1985). Degradation of
wheat starch in a single-screw extruder: mechano-kinetic breakdown of cooked starch.
Journal of Food Science, 50, 1697-1699, 1706.

Chapter 2
32
Fujio, Y., Igura, N., & Hayakawa, I. (1995). Depolymerization of molten-moisturized-starch
molecules by shearing force under high temperature. Starch/Staerke, 47(4), 143-145.
Grandbois, M., Beyer, M.K., Rief, M., Clausen-Schaumann, H., & Gaub, H.E. (1999). How
strong is a covalent bond? Science, 283, 1727-1730.
Igura, N., Hayakawa, I., & Fujio, Y. (1997). Effect of longer heating time on
depolymerization of low moisturized starches. Starch / Staerke, 49(1), 2-5.
Igura, N., Katoh, T., Hayakawa, I., & Fujio, Y. (2001). Degradation profiles of potato starch
melts through a capillary type viscometer. Starch / Staerke, 53(12), 623-628.
Meuser, F., Lengerich, B. van, & Reimers, H. (1984). Kochextrusion von Staerken. Vergleich
experimenteller Ergebnisse zwischen Laborextrudern und Produktionsextrudern mittels
Systemanalyse. Starch / Staerke, 36(6), 194-199.
Millard, M.M., Dintzis, F.R., Willett, J.L., & Klavons, J.A. (1997). Light-scattering molecular
weights and intrinsic viscosities of processed waxy maize starches in 90% dimethyl sulfoxide
and H2O. Cereal Chemistry, 74(5), 687-691.
Parker, R., Ollett, A.L., & Smith, A.C. (1990). Starch melt rheology: measurement, modelling
and applications to extrusion processing. In P. Zeuthen. Processing and quality of foods (pp.
1.290-1.295). London: Elsevier.
Valle, G. Della, Boché, Y., Colonna, P., & Vergnes, B. (1995). The extrusion behaviour of
potato starch. Carbohydrate Polymers, 28, 255-264.
Valle, G. Della, Colonna, P., Patria, A., & Vergnes, B. (1996). Influence of amylose content
on the viscous behavior of low hydrated molten starches. Journal of Rheology, 40(3), 347-
362.
Vergnes, B., Villemaire, J. P., Colonna, P., & Tayeb, J. (1987). Interrelationships between
thermomechanical treatment and macromolecular degradation of maize starch in a novel
rheometer with preshearing. Journal of Cereal Science, 5, 189-202.
Willett, J.L., Millard, M.M. & Jasberg, B.K. (1997). Extrusion of waxy maize starch: melt
rheology and molecular weight degradation of amylopectin. Polymer, 38(24), 5983-5989.

Chapter 3
A mechanistic model on the relation between molecular structure of
amylopectin and macromolecular degradation during heating-shearing
processes
Abstract
A molecular scale model describing the molecular breakdown of low moisture amylopectin
melts by shear forces was derived and compared to engineering scale experiments. The model
is based on the assumption that the maximum shear stress on the polymer equals the effective
surface stress on that polymer, which is related to the strength of the glycosidic bonds. The
molecules are approximated as spheres, with a radius that exhibits fractal scaling with
molecular weight. The molecular weight reduction as a function of applied shear stress as
deduced from the model agrees satisfactorily with the results from experimentally obtained
engineering scale data. The results show a successful example of a coupling between
engineering scale experiments and micro-scale models and contribute to the understanding of
fundamental changes in properties of starch during industrial scale heating-shearing
processes.
This chapter was accepted for publication in Polymer Degradation and Stability as: R.M. van
den Einde, E. van der Linden, A.J. van der Goot, R.M. Boom, A mechanistic model on the
relation between molecular structure of amylopectin and macromolecular degradation during
heating-shearing processes.

Chapter 3
34
1. Introduction
The use of biopolymers for both food and non-food products is gaining more attention, partly
because of ever stricter demands on product quality, partly for sustainability reasons. For
industrial use, these products should meet high quality demands, leading to a need for new
and flexible processes. Therefore, obtaining quantitative understanding of the phenomena that
are taking place is essential for rational design of new processes.
Practical biopolymer systems are usually complex systems, being mixtures of components
that may have complex molecular structures themselves. This often leads to a more or less
semi-empirical approach to the design of processes and process equipment. Unfortunately,
this also leads to a gap between fundamental, molecular scale mechanistic studies and the
larger scale semi-empirical models.
This paper aims to interpret some aspects of the widely applied process of heating shearing
treatment of low moistened starch, for example in the form of extrusion processes, into a
mechanistic, molecular scale model. One of the phenomena that take place during heating
shearing treatment is the degradation of starch to smaller fragments. This degradation has
considerable impact, which can be positive as well as negative, on the properties of the end
product, such as product cohesiveness (Harper, 1986), expansion at the extruder die
(Chinnaswamy and Hanna, 1990; Bruemmer et al., 2002), cold paste viscosity and water
solubility (Bruemmer et al., 2002).
Despite the importance of macromolecular degradation, its mechanism is still largely
unknown. This is partly due to the fact that the shear rate and temperature are difficult to
control in most engineering scale equipment handling high viscosity products. Another reason
might be that the behavior of low moistened starch during heating and shearing is complex
(Vergnes et al., 1987), among others due to the changes in rheological properties as a
consequence of the combination of melting of crystallites and molecular breakdown.
In earlier work, a pilot-scale shear cell was developed in which temperature, shear rate and
time were well-defined and could be controlled independently (Van den Einde et al., 2004).
We showed that at temperatures between 85 and 110°C the maximally attained value of the
shear stress during a heating-shearing treatment of moistened waxy corn starch determines the
degree of macromolecular degradation. In this paper, the engineering scale experiments are
coupled to a quantitative micro scale model describing the molecular weight reduction of
Chapter 3
35
starch as a function of the maximum shear stress applied. The results allow a molecular scale
explanation of the starch breakdown phenomena occurring during heating shearing treatment.
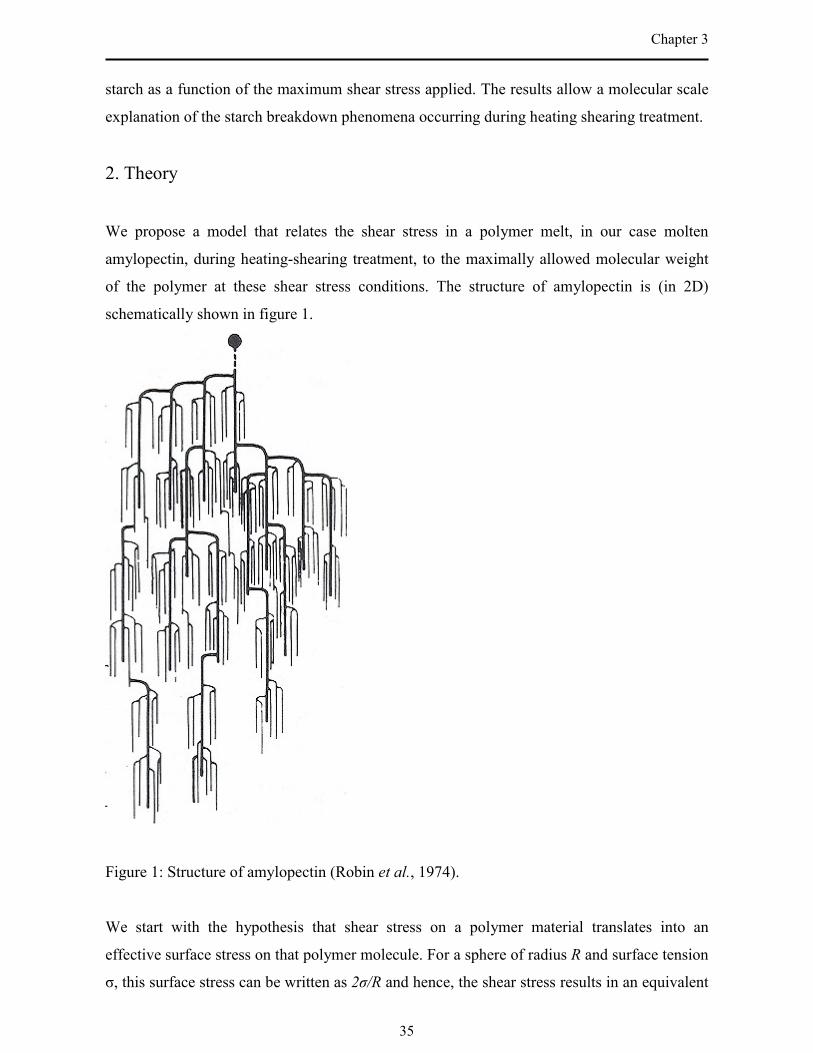
2. Theory
We propose a model that relates the shear stress in a polymer melt, in our case molten
amylopectin, during heating-shearing treatment, to the maximally allowed molecular weight
of the polymer at these shear stress conditions. The structure of amylopectin is (in 2D)
schematically shown in figure 1.
Figure 1: Structure of amylopectin (Robin et al., 1974).
We start with the hypothesis that shear stress on a polymer material translates into an
effective surface stress on that polymer molecule. For a sphere of radius R and surface tension
σ, this surface stress can be written as 2σ/R and hence, the shear stress results in an equivalent

Chapter 3
36
surface tension σ = 0.5 τ R. This effective surface tension is internally counteracted by the
total internal elastic energy of the polymer projected onto its surface (defined as the surface of
the sphere with radius r that just encloses the polymer) per unit of surface area. The idea of
using an effective surface tension equivalent to the total internal elastic energy of a material in
a spherical geometry has been proposed for spherically symmetric lamellar liquid crystalline
phases or layered, spherical structures, also called �onions� (Van der Linden and Dröge,
1993). The according effective surface tension was subsequently used to evaluate the surface
stress and to explain the size of the onions as a function of the shear stress exerted on the
lamellar liquid crystalline phase (Van der Linden et al., 1996). Analogously, in our current
case of a polymer under shear stress, the maximal shear stress τmax just before breakup is
described as:
rb effσ
τ =max [1]
where b was found to be a constant of order unity for linear macromolecules (Silberberg and
Kuhn, 1952, 1954), whereas for lamellar droplets in a liquid crystalline phase, b = 2 was
found to be a plausible value (Van der Linden et al., 1996). Applying a force balance between
the surface stress and the elastic forces inside the molecule results in:
04
12 =+−
rEnr
bbb
πτ [2a]
and hence:
24 rEn bb
eff πσ = [2b]
where nb is the number of bonds with energy Eb in the amylopectin molecule. Considering the
inflexibility of the chair-shaped glucose unit, only the energy of the glycosidic C-O bonds is
assumed to be important. We assume that the energy is divided equally over all glycosidic
bonds and that rupture occurs only if the total force exceeds a certain value. Thus, the
following relation was obtained:
OCOCglu
bb EDPEMMwEn −− ⋅== [3]
where Mw denotes the molecular weight, Mglu denotes the mass of a glucose unit and DP is
the degree of polymerization. Using the fact that the radius has been found to obey fractal
scaling with molecular weight (Bello-Perez et al., 1998), one finds:

Chapter 3
37
ff DD
glu DPDP
MDPMw
ar
/1
0
/1
0
=
= [4]
where a and DP0 are the radius and the degree of polymerization of a statistical unit in the
fractal structure respectively, Df denotes the fractal dimension and DP is the degree of
polymerization of the whole amylopectin molecule. It was assumed that the length of a
statistical unit equals the average chain length in between branches. Hence, DP0 is equal to
17.3 for starch with A-type crystals such as waxy corn (Gerard et al., 2000). The radius of a
glucose unit is about 0.295 nm and thus a = 5.1 nm.
Roger and co-workers found that the fractal dimension of corn amylopectin dissolved by
microwave heating in aqueous solution was 1.8-2.2 (Roger et al., 1999). Hanselmann and co-
workers found that the fractal dimension of waxy corn starch in aqueous solution after 20
minutes of heating at 175°C was 2.39, which increased upon longer heating (Hanselmann et
al., 1996).
Substituting equations [2b-4] into equation [1] and taking the logarithm on each side yields:
( )
+
−=
−
−
f
f
Dglu
DOC
f Ma
DPbEMwD 313
3
0max
4loglog31log
πτ [5]
Thus, a log-log plot of τmax vs. Mw is expected to yield a straight line. The slope of the line
reveals the fractal dimension, whereas the intercept may reveal a value for the average energy
of the C-O bond in the system.
3. Experimental section
3.1. Heating shearing treatment
Moistened waxy corn starch (moisture content 30%) was heated and sheared in our self-
developed shear cell at temperatures 85-110°C, as described earlier (Van den Einde et al.,
2004). At these temperatures, the effect of heating on depolymerization is negligible and all
degradation is induced by the shear force (Van den Einde et al., 2004). Experiments used for
the model were those described earlier (Van den Einde et al., 2004). Temperatures and
maximal shear stresses are given in table 1.

Chapter 3
38
Table 1: Maximal shear stress and intrinsic viscosity for a mixture of waxy corn starch and
30% water processed in the shear cell. Exp. no. = experiment number, 0 = native starch, T =
temperature (°C), τmax = maximally attained shear stress during the treatment (104 Pa), [η] =
intrinsic viscosity (ml/g).
Exp. no. T τmax [η]
0 - - 165
1 110 1.11 126
2 110 1.94 114
3 110 1.97 97
4 100 1.76 128
5 100 1.88 113
6 100 2.96 81
7 100 3.89 82
8 85 3.68 89
9 85 3.94 80
10 85 4.20 86
11 85 4.58 71
3.2. Analysis
Intrinsic viscosity of the samples was determined as described earlier (Van den Einde et al.,
2004). In order to check validity of the intrinsic viscosity as a measure for the molecular
weight of the sample, molecular weight distribution of part of the samples was determined
using an HPSEC MALLS RI system. Native starch and samples 6 and 9 were dissolved in a
90% DMSO solution in water, whereas samples 7 and 11 were dissolved in 1 M NaOH.
Concentration was 8 mg/ml in all cases. One Beckmann PWL-PRE prepguard precolumn and
six Spherogel TSK columns were used for separation. Flow rate was 1 ml/minute. Refractive
Index was measured using a Waters 410 differential refractometer, whereas laser light
scattering was measured using a Dawn D Laser Photometer (Wyatt Technology).
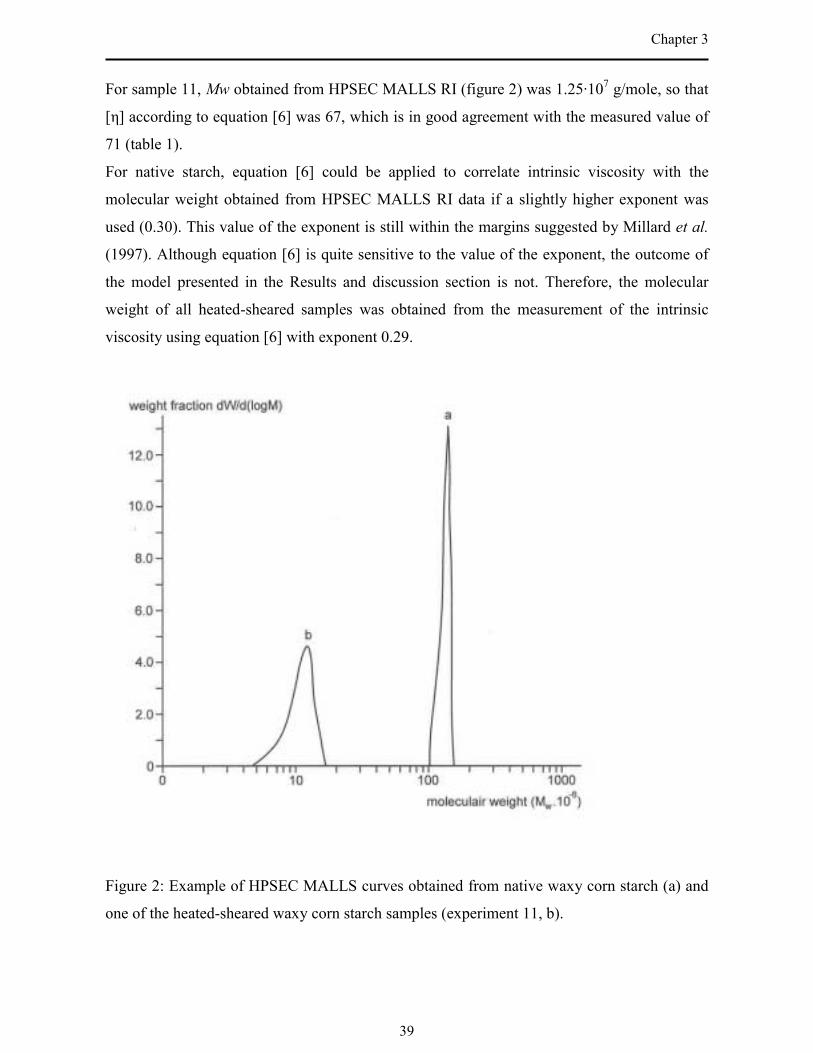
The obtained Mw distribution curves for sample 11 and native starch are shown in figure 2.
Intrinsic viscosity of sample 11, as well as intrinsic viscosity of samples 6, 7 and 9, could be
well correlated to the weight-averaged molecular weight obtained from HPSEC MALLS RI
data using the equation earlier found by Millard et al. (1997):29.059.0][ Mw=η [6]
Chapter 3
39
For sample 11, Mw obtained from HPSEC MALLS RI (figure 2) was 1.25·107 g/mole, so that
[η] according to equation [6] was 67, which is in good agreement with the measured value of
71 (table 1).
For native starch, equation [6] could be applied to correlate intrinsic viscosity with the
molecular weight obtained from HPSEC MALLS RI data if a slightly higher exponent was
used (0.30). This value of the exponent is still within the margins suggested by Millard et al.
(1997). Although equation [6] is quite sensitive to the value of the exponent, the outcome of
the model presented in the Results and discussion section is not. Therefore, the molecular
weight of all heated-sheared samples was obtained from the measurement of the intrinsic
viscosity using equation [6] with exponent 0.29.
Figure 2: Example of HPSEC MALLS curves obtained from native waxy corn starch (a) and
one of the heated-sheared waxy corn starch samples (experiment 11, b).

Chapter 3
40
4. Results and discussion
4.1. Model fit and value of fractal dimension
Figure 3 shows the log-log plot of molecular weight as a function of the maximal shear stress
τmax. The model fitted all the data with R2 = 0.84, which can be considered satisfactory. The
residuals were distributed randomly.
Table 2 shows the calculated fractal dimension, the estimated average bond energy and the
calculated energy of a glycosidic C-O bond, including expected values from literature.
The fractal dimension as deduced from applying our model to the data points was 1.9, which
is in good agreement with the values of 1.8-2.2 as found by Roger et al. (1999). The larger
difference between our value and the value obtained by Hanselmann et al. (1996) is probably
due to the high temperature (175°C) that these authors used to dissolve the starch. Longer
heating treatment at that temperature was shown to increase the fractal dimension
(Hanselmann et al., 1996).
Figure 3: Logarithm of the molecular weight (calculated from intrinsic viscosity
measurements) as a function of the applied maximal shear stress during heating-shearing
treatment. Points are the measured data; the line is the fitted model (see theory section).

Chapter 3
41
Table 2: Fitted and literature values of the fractal dimension Df (-) and the average energy of
the C-O bond EC-O (kJ/mole; see text).
Fitted value Literature values
Df 1.9 1.8-2.2 (Roger et al., 1999)
EC-O 272 280 (Weast, 1979)
4.2. Value of bond energy
The average bond energy found when applying our model was 2.72·105 J/mole when taking
b=2 (equation [1]). This is in accordance with the value for complete breakdown of the bond
into radicals (= 2.8·105 J/mole (Weast, 1979)). Although it should be noted that all estimations
made in the model lead to a degree of uncertainty, the value found suggests that the
mechanism resembles breakdown by physical stress on the bonds, during which radicals may
be formed. Furthermore, the fact that the energy found here is close to this literature value
seems to imply that indeed the stress is divided more or less equally over all bonds, as was
assumed in equation [3]. Hence, each bond is evenly likely to break. Bond breakage at the
inside of the molecule (endodegradation) is effective in lowering the stress and will therefore
stop further breakdown, leading to a shift in molecular weight distribution, as found in this
work (figure 2). On the other hand, if a bond near the outside breaks (exodegradation), the
stress will not become lower and therefore breakdown will continue until the molecule has
become sufficiently smaller. However, although the number of small fragments that can arise
from this exodegradation can be quite high, the total mass of these fragments (which is
detected by the HPSEC MALLS system) will still be low. Hence, only the total mass of the
high molecular weight components formed is sufficient for measuring, resulting in the
molecular weight distribution shown in figure 2.
4.3. Extension of results to other systems
The model described in this paper relates molecular structure (a, Df) to breakdown due to
shear. The model hence reveals structure-function relationships for amylopectin and also
possibly other polymers, as long as the polymer in the melt can be considered more or less as
a sphere. Such relationships can be useful guidelines for initial process design. Two examples
are given below.
Chapter 3
42
Effect of solvent quality. Increasing solvent quality results in a lower fractal dimension as the
molecule tends to adopt a less compact shape. For two solvents that are resulting in the same
melt viscosity and that have the same degree of reactivity with the polymer, the better solvent
will result in more degradation, as decreasing the fractal dimension reduces the maximally
allowed shear stress before breakdown.
Effect of average chain length. A higher average branch length or in other words a more
linear molecular structure implies a higher value of a and hence decreases the shear stress
required to breakdown the polymer to a certain molecular weight. This means that a relatively
less branched polymer will break down at lower shear stresses due to its higher hydrodynamic
volume at the same molecular weight. However, this statement only holds if the more or less
spherical shape of the polymer is not significantly affected.
During shear-induced starch degradation at the temperatures investigated the average
statistical chain length a does not change (Bruemmer, 1999), so that the effect described
above does not influence the outcome for amylopectin.
5. Conclusion
In this work, a model has been proposed that relate the molecular breakdown of starch with
the maximum shear stress. The model is based on a stress balance projected onto the outer
shell of the molecule. Important parameters are the C-O bond strength and the fractal
dimension of amylopectin. The application to our experimental data yielded a fractal
dimension of 1.9, which was in good agreement with literature data. The value obtained for
the bond energy was close to the value for physical bond rupture.
The model developed here provides a tool for choosing the correct process parameters in
order to induce breakdown of starch to the desired molecular weight. Some implications could
be formulated for processes operating at different conditions, or with materials having
different molecular structure. Our results suggest that coupling molecular scale phenomena to
these types of complex processes improves understanding of the fundamental changes in
properties of starch during engineering scale processes and will be essential in future process
design.
Chapter 3
43
Acknowledgement
The authors thank A. Postma for carrying out part of the HPSEC MALLS measurements and
J.J.G. van Soest for his kind assistance with the HPSEC MALLS measurements.
Symbols list
a radius of a statistical unit in the fractal type structure (m)
b constant relating the surface stress to the effective surface tension divided by
the radius (-)
Df fractal dimension (-)
DP degree of polymerization (-)
DP0 degree of polymerization of a statistical unit in the fractal type structure (-)
Eb bond energy (J)
EC-O energy of a C-O bond (J or J/mole)
Mglu molecular weight of a glucose unit (=162 Da)
Mw molecular weight (Da)
nb number of bonds contributing to the effective surface energy in a molecule (-)
r radius (m)
Greek symbols
[η] intrinsic viscosity (g/ml)
σeff effective surface tension (J/m2)
τmax maximal shear stress (Pa)
References
Bello-Perez, L.A., Roger, P., Colonna, P., & Paredes-Lopez, O. (1998). Laser light scattering
of high amylose and high amylopectin materials, stability in water after microwave
dispersion. Carbohydrate Polymers, 37, 383-394.

Chapter 3
44
Bruemmer T. (1999). Charakterisierung molekularer Strukturparameter kochextrudierter
Maisstaerken und Ermittlung von Struktur-Eigenschaftsbeziehungen. Berlin: Technische
Universitaet Berlin.
Bruemmer, T., Meuser, F., Lengerich, B. van, & Niemann, C. (2002). Expansion and
functional properties of corn starch extrudates related to their molecular degradation, product
temperature and water content. Starch / Staerke, 54, 9-15.
Chinnaswamy, R., & Hanna, M.A. (1990). Macromolecular and functional properties of
native and extrusion cooked starch. Cereal Chemistry, 67(5), 490-499.
Einde, R.M. van den, Bolsius, A., Soest, J.J.G. van, Janssen, L.P.B.M., Goot, A.J. van der, &
Boom, R.M. (2004). The effect of thermomechanical treatment on starch breakdown and the
consequences for process design. Carbohydrate Polymers, 55(1), 57-63. (Chapter 2 of this
thesis).
Gérard, C., Planchot, V., Colonna, P., & Bertoft, E. (2000). Relationship between branching
density and crystalline structure of A- and B-type maize mutant starches. Carbohydrate
Research, 326, 130-144.
Hanselmann, R., Burchard, W., Ehrat, M., & Widmer, H.M. (1996). Structural properties of
fractionated starch polymers and their dependence on the dissolution process.
Macromolecules, 29, 3277-3282.
Harper, J.M. (1986). Extrusion texturization of foods. Food Technology, 40, 70-76.
Linden, E. van der, & Dröge, J.H.M. (1993). Deformability of lamellar droplets. Physica A,
193, 439-447.
Linden, E. van der, Hogervorst, W.T., & Lekkerkerker, H.N.W. (1996). Relation between the
size of lamellar droplets in onion phases and their effective surface tension. Langmuir, 12,
3127-3130.
Millard, M.M., Dintzis, F.R., Willett J.L., & Klavons, J.A. (1997). Light-scattering molecular
weights and intrinsic viscosities of processed waxy maize starches in 90% dimethyl sulfoxide
and H2O. Cereal Chemistry, 74(5), 687-691.
Robin, J.P., Mercier, C., Charbonnière, R., & Guilbot, A. (1974). Lintenerized starches. Gel
filtration and enzymatic studies of insoluble residue from prolonged acid treatment of potato
starch. Cereal Chemistry, 51, 389-406.
Roger, P., Bello-Perez, L.A., & Colonna, P. (1999). Contribution of amylose and amylopectin
to the light scattering behaviour of starches in aqueous solution. Polymer, 40, 6897-6909.

Chapter 3
45
Silberberg, A., & Kuhn, W. (1952). Miscibility of liquids influenced by rate of shear. Nature,
170, 450-451.
Silberberg, A., & Kuhn W. (1954). Size and shape of droplets of demixing polymer solutions
in a field of flow. Journal of Polymer Science,13, 21-42.
Vergnes, B., Villemaire, J.P., Colonna, P., & Tayeb, J. (1987). Interrelationships between
thermomechanical treatment and macromolecular degradation of maize starch in a novel
rheometer with preshearing. Journal of Cereal Science, 5, 189-202.
Weast, R.C. (1979). CRC Handbook of chemistry and physics, 59th ed. (p. F-239). Florida:
CRC Press Inc.

Chapter 3
46

Chapter 4
Molecular breakdown of corn starch by thermal and mechanical
effects
Abstract
The molecular weight reduction of corn starch at 30-43% moisture during thermal treatment
at temperatures 90-160°C and during well-defined thermomechanical treatment at
temperatures 90-140°C was investigated. Thermal treatment resulted during the first 5
minutes in a decrease in molecular weight as measured by intrinsic viscosity, after which
longer heating had no significant effect. Higher moisture contents and temperatures generally
resulted in more breakdown, although the effect diminished at higher temperatures. The
decrease in intrinsic viscosity during thermomechanical treatment at relatively low
temperatures and moisture contents was shown to be only dependent on the maximal shear
stress. At higher temperatures, thermomechanical breakdown could be split into a mechanical
part depending on maximal shear stress and a thermal breakdown part, which was again time-
dependent in the shorter time-scales only. Higher moisture content during thermomechanical
treatment resulted in more thermal breakdown and lowered the shear stresses required for
mechanical breakdown. Consequences for process design are discussed briefly.
This chapter was submitted as: R.M. van den Einde, C. Akkermans, A.J. van der Goot, R.M.
Boom, Molecular breakdown of corn starch by thermal and mechanical effects.

Chapter 4
48
1. Introduction
The molecular weight of starch influences many properties of starch-based products, such as
expansion rate, cold paste viscosity, water solubility and absorption, the degree of
retrogradation and gelling properties (Bindzus et al., 2002; Bruemmer et al., 2002;
Chinnaswamy and Bhattacharya, 1986; Mua and Jackson, 1997). The production of starch-
based products often involves the application of a combination of (shear) stresses and thermal
treatment, for example during extrusion. It is known that this combination leads to starch
molecular weight reduction (Baud et al., 1999; Willett et al., 1997).
Recently, it was shown that the extent of mechanical degradation of waxy corn starch is
determined by the maximal shear stress during a thermomechanical treatment, in the situation
that thermal breakdown effects can be neglected (Van den Einde et al., 2004). However, in
many practical situations, the temperature is such that thermal degradation is important as
well, next to shear-based effects. Fujio et al. (1995) and Igura et al. (1997) showed that 15
minutes heating at 150°C resulted in a decrease of molecular weight of corn and sweet potato
starch. Byars (2003) found that thermal degradation effects were important during jet cooking
of waxy corn starch.
The combined and simultaneous effects of heating and shearing on starch have not yet been
clarified completely. Many studies conducted so far have focussed on the degradation of
starch during extrusion and molecular weight reduction was explained quantitatively in terms
of mechanical degradation only (Parker et al., 1990; Diosady et al., 1985; Willett et al.,
1997). Effects of more defined shear and temperature on starch degradation so far also
resulted in quantitative explanations in terms of mechanical degradation only (Vergnes et al.,
1987).
The influence of moisture content on molecular weight reduction is another effect that has not
been investigated thoroughly. It has been suggested that increasing moisture content decreases
the degree of starch degradation during heating and shearing processes such as extrusion
(Chinnaswamy and Hanna, 1990; Wen et al., 1990) due to the reduction of the stresses
occurring (Davidson et al., 1984) since the melt viscosity is reduced. On the other hand, water
might be involved in the chemical reactions that are leading to (thermal) degradation of
starch, as suggested in a recent review by Van den Einde et al. (2003). Igura et al. (2001)
found that the effect of time-temperature history becomes large when processing starch at
Chapter 4
49
high moisture content. This suggests that the effect of moisture content might be more
complex than only its effect through shear stresses.
In this study, a shear cell enabling a well-defined plain shear field was used to investigate the
effects of simultaneous heating and shearing treatment on the molecular weight of regular
corn starch at different moisture contents and temperatures in experiments in which both
thermal and mechanical effects were important. The relative importance of heating was
studied in separate experiments.
2. Materials and methods
2.1. Starch
Regular corn starch was obtained from Cargill BV. Starch was premixed with water as
described earlier (Van den Einde et al., 2004).
2.2. Heating treatment
Mixtures of corn starch were heat-treated in a mold with inner dimensions 100 x 150 x 2 mm
(l x w x h) or in a rotating sterilizing device. The mold was pressurized to avoid steam
leakage. Pressure was in all cases put onto the outer raised edge of the mold, not on the
sample, to avoid pressure effects. Further details on the mold used can be found elsewhere
(Van Soest and Kortleve, 1999). Heat treatment in the mold and in the rotating sterilizing
device was shown to reveal the same results in terms of degradation (results not shown).
Temperatures, times and moisture contents are given in table 1.
2.3. Heating-shearing treatment
Mixtures of corn starch and water were heated and sheared in the shearing device described
earlier (Van den Einde et al., 2004). Temperatures, times and rotation speeds are given in
table 2. Due to the steam pressure, no temperatures higher than 125°C were possible at 37 and
43% moisture, whereas at 30% moisture the maximum temperature was 140°C. At higher
temperatures, steam leakage took place, which was shown to have a large influence on all
results obtained.
After the thermomechanical treatment, samples were dried and ground to fine powder under
liquid nitrogen as described earlier (Van den Einde et al., 2004).
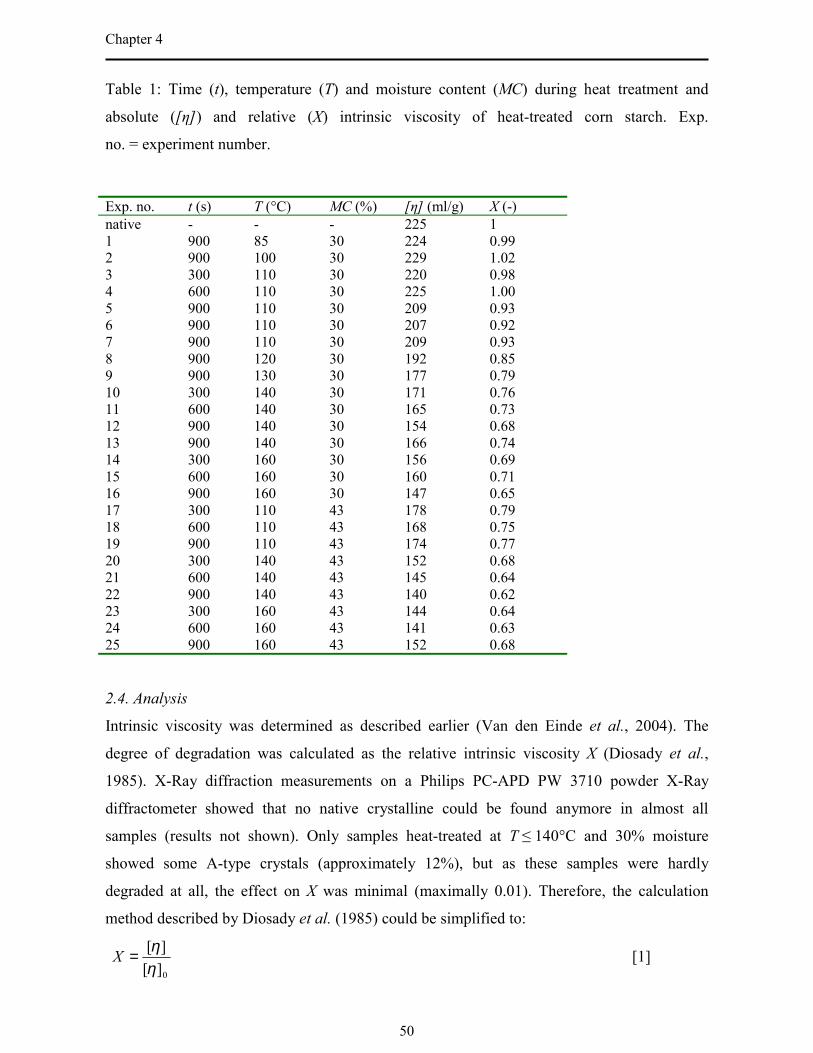
Chapter 4
50
Table 1: Time (t), temperature (T) and moisture content (MC) during heat treatment and
absolute ([η]) and relative (X) intrinsic viscosity of heat-treated corn starch. Exp.
no. = experiment number.
Exp. no. t (s) T (°C) MC (%) [η] (ml/g) X (-)native - - - 225 11 900 85 30 224 0.992 900 100 30 229 1.023 300 110 30 220 0.984 600 110 30 225 1.005 900 110 30 209 0.936 900 110 30 207 0.927 900 110 30 209 0.938 900 120 30 192 0.859 900 130 30 177 0.7910 300 140 30 171 0.7611 600 140 30 165 0.7312 900 140 30 154 0.6813 900 140 30 166 0.7414 300 160 30 156 0.6915 600 160 30 160 0.7116 900 160 30 147 0.6517 300 110 43 178 0.7918 600 110 43 168 0.7519 900 110 43 174 0.7720 300 140 43 152 0.6821 600 140 43 145 0.6422 900 140 43 140 0.6223 300 160 43 144 0.6424 600 160 43 141 0.6325 900 160 43 152 0.68
2.4. Analysis
Intrinsic viscosity was determined as described earlier (Van den Einde et al., 2004). The
degree of degradation was calculated as the relative intrinsic viscosity X (Diosady et al.,
1985). X-Ray diffraction measurements on a Philips PC-APD PW 3710 powder X-Ray
diffractometer showed that no native crystalline could be found anymore in almost all
samples (results not shown). Only samples heat-treated at T ≤ 140°C and 30% moisture
showed some A-type crystals (approximately 12%), but as these samples were hardly
degraded at all, the effect on X was minimal (maximally 0.01). Therefore, the calculation
method described by Diosady et al. (1985) could be simplified to:
0][][
ηη=X [1]

Chapter 4
51
Table 2: Total treatment time (t), time after maximal shear stress (tth), temperature (T),
moisture content (MC), rotation speed (N), maximal shear stress (τmax), absolute ([η]) and
relative (X) intrinsic viscosity, and relative intrinsic viscosity of thermal part (Xth; see text) of
thermomechanically treated starch. Exp. no. = experiment number.
Exp. no. t (s) tth (s) T (°C) MC (%) N (rpm) τmax (104 Pa) [η] (ml/g) X (-) Xth (-)26 960 130 90 30 75 5.11 147 0.65 1.0327 1051 857 90 30 50 4.86 154 0.68 1.0428 480 127 100 30 35 3.87 165 0.73 0.9529 360 88 110 30 75 4.56 143 0.64 0.9230 272 122 110 30 25 3.32 192 0.85 1.0131 540 140 110 30 35 3.51 186 0.83 1.0032 600 260 110 30 35 3.11 172 0.76 0.8733 510 149 120 30 75 3.67 191 0.85 1.0634 600 268 120 30 35 3.27 161 0.72 0.8435 270 120 125 30 50 4.13 169 0.75 1.0136 600 268 130 30 35 2.44 171 0.76 0.7837 847 687 130 30 50 3.45 136 0.60 0.7338 1153 1015 130 30 50 3.45 131 0.58 0.7039 581 444 140 30 50 2.85 151 0.67 0.7340 900 558 140 30 50 1.51 148 0.66 0.6641 300 120 90 37 25 3.16 167 0.74 0.8542 300 120 90 37 75 4.00 157 0.70 0.9243 273 121 90 37 50 3.75 177 0.79 0.9944 600 462 90 37 50 4.20 147 0.65 0.8945 285 88 110 37 25 2.25 179 0.80 0.8046 273 229 110 37 10 2.40 170 0.76 0.7747 720 568 110 37 50 2.85 131 0.58 0.6448 226 86 125 37 50 1.95 173 0.77 0.7749 606 564 125 37 50 2.25 136 0.60 0.6050 280 124 90 43 50 2.80 148 0.66 1.0251 270 130 90 43 25 2.14 162 0.72 0.9752 270 148 110 43 50 1.99 166 0.74 0.9653 270 232 110 43 10 1.45 143 0.64 0.7454 270 562 110 43 10 1.54 122 0.54 0.6455 270 126 125 43 50 1.64 194 0.86 1.0456 600 250 125 43 25 1.09 135 0.60 0.64
3. Results and discussion
All the measured values are shown in tables 1 (heat-treated samples) and 2 (heated-sheared
samples).

Chapter 4
52
3.1. Breakdown by thermal effects only
Figure 1 shows the measured relative intrinsic viscosity X as a function of temperature and
moisture content after 15 minutes heat treatment. A higher temperature generally resulted in
more starch breakdown, although the effect diminished at both high temperature and high
moisture content. At 30% moisture, heat treatment at temperatures ≤ 110°C induced only a
small amount of starch degradation within 15 minutes (X ≥ 0.92), which can probably be
neglected in short-time experiments. Increasing moisture content generally resulted in more
degradation. This effect of moisture content is in accordance with the hypothesis mentioned in
the introduction that water may be involved in the chemical reactions occurring. The effect
became less pronounced at the higher temperatures (table 1).
Figure 1: Relative intrinsic viscosity X of low moistened starch heat-treated at different
moisture contents as a function of temperature. Treatment time was in all cases 15 minutes.
Figure 2 shows that different treatment times (5, 10 or 15 minutes) did not result in
significantly different degrees of breakdown at 30% moisture. Comparable results were
obtained for 43% moisture. It seems that thermal treatment resulted in initial starch
degradation only, after which the intrinsic viscosity remained approximately constant. As
intrinsic viscosity measurements are only sensitive to endodegradation, it was also checked

Chapter 4
53
whether or not increase of time led to the formation of more water soluble products, which are
a measure for exodegradation. Water solubility of the product was in all cases low (0-7%) and
different treatment times resulted in only very small differences, suggesting that also
exodegradation was not significantly dependent on time. Although one would intuitively
expect a first order degradation process, recent investigations by other researchers have
revealed comparable results. Byars (2003) studied degradation of waxy corn starch during
heating in a jet cooker. The first few passes through the jet cooker resulted in significant
decrease in intrinsic viscosity, whereas little additional breakdown was observed during
further passes. Dintzis and Bagley (1995) found that the intrinsic viscosity value of waxy corn
starch autoclaved at 120°C remained constant with increasing holding time (21 to 60
minutes). Although the treatment time investigated was much longer than in this paper, their
results also suggest time independence after an initial breakdown, in agreement with the
results reported here.
Figure 2: The effect of treatment time on the relative intrinsic viscosity X of heat-treated low
moistened starch at different temperatures. MC = 30%.

Chapter 4
54
Figure 3: Relative intrinsic viscosity X of thermomechanically treated low moistened starch as
a function of maximally applied shear stress τmax and moisture content. ▲ and ∆: MC = 30%.
x: MC = 37%; ■ and □: MC = 43%. Closed symbols are used for experiments in which only
mechanical effects are significant; open symbols indicate results from experiments in which
thermal effects played a significant role. Lines indicate the fitted first order models.
3.2. Breakdown by shear
Figure 3 shows the relative intrinsic viscosity X of thermomechanically treated low moistened
starch as a function of maximally applied shear stress τmax and moisture content. In our earlier
work (Van den Einde et al., 2004), it was shown that when thermal effects were avoided, the
mechanical breakdown of waxy corn starch at 30% moisture could be well described by a first
order equation with the maximal shear stress τmax as the key parameter:
( )max21 exp τCCX m = [1]
As explained in the previous section, the heating experiments showed that thermal effects
play a role within 15 minutes at temperatures higher than 110°C if moisture content = 30%.
Equation [1] could indeed be fitted well to all the data at temperatures ≤ 110°C, but also to the
data obtained from short time experiments at 120 and 125°C (table 2, exp. no. 33 and 35).
Thermal effects at 120 and 125°C were found negligible due to the short times used in these
two experiments and therefore these data could be used for fitting as well. Fitted parameters
were C1 = 1.46 and C2 = -2.45 10-5 m2/N. C1 was higher than 1 suggesting that there is a
threshold value for shear stress before regular corn starch breaks down (Van den Einde et al.,
2004). If the shear stress applied is lower than this threshold value, Xm remains at 1. The
minimally required stress can be calculated by equaling equation [1] to 1. Thus, the
degradation equations become:
1=mX if τmax < 2.32 104 N/m2 [5a]

Chapter 4
55
( )max51063.1exp46.1 τ−⋅−=mX if τmax ≥ 2.32 104 N/m2 [5b]
The R2 value was 0.83, which suggests that a first order correlation, as found for waxy corn
starch at 30% moisture content, can be also be applied to regular corn starch at 30% moisture
content. Samples treated for a longer time at 120 or 125°C and samples treated at 130 or
140°C clearly showed an additional thermal effect (table 2), as was expected from the heating
experiments.
At 43% moisture, the situation was somewhat different (figure 3). As stated in the
introduction, water may be involved in the occurring reactions. It is also known that the
rupture force of a covalent bond depends on the chemical environment of the bond (Röhrig
and Frank, 2001). Therefore, it was expected that a higher fraction of water might destabilize
the glycosidic bond and that the shear stresses required for breaking down the starch might be
lower at higher moisture content. For this reason, a separate first order equation with the
maximal shear stress τmax was fitted to those data that had received a relatively short treatment
time after the maximal shear stress was reached (so that thermal effects were supposed to be
almost negligible), resulting in:
1=mX if τmax < 7.74 103 N/m2 [6a]
( )max51018.2exp18.1 τ−⋅−=mX if τmax ≥ 7.74 103 N/m2 [6b]
(R2 = 0.88). The temperature at and above which thermal effects are important is
approximately 110°C. As expected, this is lower than at 30% moisture. Thermal effects
during thermomechanical treatment are further discussed in the next section.
At 37% moisture, data obtained at 90°C were more or less comparable in breakdown to 30%
moisture, although they were somewhat more scattered (figure 3 and table 2). At higher
temperatures, in all cases more breakdown took place than expected from the 30% moisture
shear-induced breakdown line (figure 3). This could be due to thermal effects during the
thermomechanical treatment, as further explained in the next section.
3.3. Breakdown by shear and heat
As explained in the previous section, part of the breakdown of starch in thermomechanically
treated samples was due to thermal effects. As was found earlier, effects of shear stress are
time-independent and the molecular weight of starch after shearing treatment is determined by
the maximal shear stress applied. It was therefore assumed that mechanical breakdown is
dominant during thermomechanical treatment until the time that this maximal shear stress is

Chapter 4
56
encountered. After this time, thermal effects may result in further degradation of the starch.
The mechanisms of breakdown by heat and shear were assumed to be independent. Therefore,
it is logical to assume the following relation:
mththm X
XXXXX =→= [7]
Xm was calculated according to equations [5a] and [5b] for 30 and 37% moisture and
according to equations [6a] and [6b] for 43% moisture.
Figure 4a shows Xth as a function of temperature at 30% moisture. The data points close to
Xth = 1 are the ones of which thermal effects were supposed to be negligible and that were
used for fitting the first order models described in the previous section (figure 3). The other
data in this figure clearly suggests that the data obtained from thermal experiments are not
highly different from those derived from the thermomechanical experiments. This suggests
that thermomechanical treatment can indeed be approximated as an independent combination
of a mechanical treatment with main parameter τmax and a thermal treatment. Combining
figure 4a and table 2 reveals that, in analogy with the heat-treated samples, all samples with
tth > 300 s could be described as dependent on temperature only and not significantly on
treatment time (compare for example experiments 37 and 38). This finding can simplify the
description of the effects of thermomechanical treatment: if time after the maximal shear
stress exceeds a threshold, the treatment can be described as an addition of an effect of τmax
and an effect of the temperature.
Figure 4b shows Xth as a function of temperature at 43% moisture. The shape of the curve is
comparable to the one obtained from the data at 30% moisture. In line with the expectations,
the downward trend in Xth with temperature occurs at lower temperatures than at 30%
moisture. The data obtained from the purely thermal experiments are not highly different from
the ones derived from the thermomechanical treatment. This suggests that also at 43%
moisture, a heating-shearing treatment can be approximated as a mechanical treatment with
main parameter τmax and an independent thermal treatment. The somewhat lower value found
for Xth in experiment 54 (110°C; table 2) might be due to the following. Figure 4b clearly
shows that the difference in breakdown between 110 and 125°C is high. Although
temperature control during the experiment was reasonably accurate, a local increase of
temperature to approximately 114°C was shown to be possible. Taking into account the large
dependence of breakdown on temperature in this regime, it may be possible that this higher
temperature caused the additional breakdown.

Chapter 4
57
Figure 4: Relative intrinsic viscosity due to thermal effects Xth of thermally and
thermomechanically treated corn starch at (a) 30% and (b) 43% moisture as a function of
temperature. Data points with Xth close to 1 were those being used for fitting the first order
mechanical degradation lines in figure 3 (negligible thermal effects; see text).

Chapter 4
58
At 37% moisture, reproducibility was less than at 30 and 43% moisture (table 2) and data
were highly scattered (figure 3). It seems that 37% is in the intermediate area between the two
regimes. The behavior in this region appears to be complex as small changes in conditions
will cause several effects to occur simultaneously, such as bond destabilization, effects on
viscosity and thermal breakdown. Therefore, the behavior of the starch-water mixture in this
region seems to be highly sensitive to small deviations in temperature or moisture content. In
order to obtain a complete view of all the influences on the starch degradation at 37%
moisture, a higher accuracy than possible with the current experimental setup may be
necessary.
3.4. Consequences for product and process design
The role of water in starch breakdown. As described in the introduction, previous studies
suggested that increasing moisture content decreased the degree of starch degradation during
heating-shearing processes, due the effect of lower stresses. Our study indicates that this
statement is not always valid. As figures 2 to 4 and tables 1 and 2 show, increasing moisture
content has three different effects. It decreases the shear stresses, but it also increases the
degree of thermal breakdown and it destabilizes the bond so that smaller stresses are required
for mechanical breakdown. Hence, the relation between moisture content and degree of
degradation is not linear, but more complex. It can even be expected that an optimum occurs
in breakdown at a certain moisture content, as changing moisture content will probably affect
melt viscosity to a different extent than it will affect the degree of degradation. This is in
accordance with results by Govindasamy et al. (1996). They found that increasing moisture
content from 34 to 42% decreased the degree of starch degradation, but that increasing
moisture content from 42 to 50% increased the degree of starch degradation during extrusion
of sago starch. However, these authors suggested this to be caused by gelatinization, resulting
in various extents of granular structure relaxation, rather than by thermal breakdown effects.
Baud et al. (1999) found that degree of degradation after extrusion could not be related
directly to the moisture content, which could be in accordance with the current results. These
authors did not explain their result in terms of thermal degradation either.
Time (in)dependence of thermal breakdown. Another interesting result for process design
is the unexpected partial time dependence of starch breakdown during heat treatment.
Apparently, once a certain heating time is reached, no further starch breakdown will take
place. This can be a useful feature, as it might be possible to change various product

Chapter 4
59
properties or inactivate undesired components without significantly affecting the starch
molecular weight.
4. Concluding remarks
Effects of shear and thermal treatment on low moistened corn starch were unraveled in this
work. Thermal breakdown was shown to have an effect during a limited time only. Upon
further increasing thermal treatment time, no additional breakdown takes place.
Thermomechanical degradation could be divided clearly into a mechanical effect, depending
on maximal shear stress, and an independent thermal effect, which was for (thermal)
treatment times > 300 s only dependent on temperature and not on time. These findings
suggest a convenient way to estimate the effect of thermomechanical treatment on starch
molecular weight and can therefore be a useful tool in process design.
Increasing moisture content had three separate effects on starch molecular weight reduction: it
decreased the stresses, increased thermal breakdown and decreased the stresses required for
breakdown. This makes the effect of moisture content quite difficult to predict, but the
findings described in this paper can provide a first guideline for estimating the effects of
changing moisture content on starch molecular weight reduction.
The finding that shear and temperature effects can be considered independent may open up
the possibility for relatively simple, but accurate models that could be used for design of
processes that are more effective and efficient than the thermomechanical processes available
today.
Acknowledgement
The authors thank H. Bosman for carrying out part of the heat treatment experiments, J.J.G.
van Soest for his kind assistance during part of the heat treatment experiments and during the
X-Ray diffraction measurements and S. van Brenk for carrying out part of the intrinsic
viscosity measurements.

Chapter 4
60
List of symbols
C1 first fit parameter in first order τmax model (-)
C2 second fit parameter in first order τmax model (m2/N)
MC moisture content (%)
t time (s)
tth time after the maximal shear stress was reached [time during which thermal
effects were dominant compared to mechanical effects] (s)
X relative intrinsic viscosity of the molten fraction of the treated starch compared
to native starch (-)
Xm relative intrinsic viscosity of the molten fraction of the treated starch due to
mechanical breakdown (-)
Xth relative intrinsic viscosity of the molten fraction of the treated starch due to
thermal breakdown (-)
Greek symbols
[η] intrinsic viscosity (ml/g)
[η]0 intrinsic viscosity of native starch (ml/g)
τmax maximal shear stress (N/m2)
References
Baud, B., Colonna, P., Valle, G. Della, & Roger, P. (1999). Macromolecular degradation of
extruded starches measured by HPSEC-MALLS. Biopolymer Science: Food and Non Food
Applications / Les Colloques de l'INRA, 91, 217-221.
Bindzus, W., Fayard, G., Lengerich, B. van, & Meuser, F. (2002). Description of extrudate
characteristics in relation to the shear stress of plasticised starches determined in-line. Starch /
Staerke, 54, 252-259.
Bruemmer, T., Meuser, F., Lengerich, B. van, & Niemann, C. (2002). Expansion and
functional properties of corn starch extrudates related to their molecular degradation, product
temperature and water content. Starch / Staerke, 54, 9-15.
Chapter 4
61
Byars, J.A. (2003). Jet cooking of waxy maize starch: solution rheology and molecular weight
degradation of amylopectin. Cereal Chemistry, 80(1), 87-90.
Chinnaswamy, R., & Bhattacharya, K.R. (1986). Characteristics of gel-chromatographic
fractions of starch in relation to rice and expanded rice-product quality. Starch / Staerke,
38(2), 51-57.
Chinnaswamy, R., & Hanna, M.A. (1990). Macromolecular and functional properties of
native and extrusion cooked starch. Cereal Chemistry, 67(5), 490-499.
Davidson, V.J., Paton, D., Diosady, L.L., & Larocque, G. (1984). Degradation of wheat starch
in a single-screw extruder: characteristics of extruded starch polymers. Journal of Food
Science, 49, 453-458.
Dintzis, F.R., & Bagley, E.B. (1995). Effects of thermomechanical processing on viscosity
behavior of corn starches. Journal of Rheology, 39(6), 1483-1495.
Diosady, L.L., Paton, D., Rosen, N., Rubin, L.J., & Athanassoulias, C. (1985). Degradation of
wheat starch in a single-screw extruder: mechano-kinetic breakdown of cooked starch.
Journal of Food Science, 50, 1697-1699,1706.
Einde, R.M. van den, Goot, A.J. van der, & Boom, R.M. (2003). Understanding molecular
weight reduction of starch during heating shearing processes. Journal of Food Science, 68(8),
2396-2404. (Chapter 7 of this thesis).
Einde, R.M. van den, Bolsius, A., Soest, J.J.G. van, Janssen, L.P.B.M., Goot, A.J. van der, &
Boom, R.M. (2004). The effect of thermomechanical treatment on starch breakdown and the
consequences for process design. Carbohydrate Polymers, 55(1), 57-63. (Chapter 2 of this
thesis).
Fujio, Y., Igura, N., & Hayakawa, I. (1995). Depolymerization of molten-moisturized-starch
molecules by shearing force under high temperature. Starch / Staerke, 47(4), 143-145.
Govindasamy, S., Campanella, O.H., & Oates, C.G. (1996). High moisture twin-screw
extrusion of sago starch: 1. Influence on granule morphology and structure. Carbohydrate
Polymers, 30, 275-286.
Igura, N., Hayakawa, I., & Fujio, Y. (1997). Effect of longer heating time on
depolymerization of low moisturized starches. Starch / Staerke, 49(1), 2-5.
Igura, N., Katoh, T., Hayakawa, I., & Fujio, Y. (2001). Degradation profiles of potato starch
melts through a capillary type viscometer. Starch / Staerke, 53(12), 623-628.

Chapter 4
62
Mua, J.P., & Jackson, D.S. (1997). Relationships between functional attributes and molecular
structures of amylose and amylopectin fractions from corn starch. Journal of Agricultural and
Food Chemistry, 45, 3848-3854.
Parker, R., Ollett, A.L., & Smith, A.C. (1990). Starch melt rheology: measurement, modelling
and applications to extrusion processing. In P. Zeuthen. Processing and quality of foods (pp.
1.290-1.295). London: Elsevier.
Röhrig, U.F., & Frank, I. (2001). First-principle molecular dynamics study of a polymer under
tensile stress. Journal of Chemical Physics, 115, 8670-8674.
Soest, J.J.G. van, & Kortleve, P.M. (1999). The influence of maltodextrins on the structure
and properties of compression-molded starch plastic sheets. Journal of Applied Polymer
Science, 74, 2207-2219.
Vergnes, B., Villemaire, J.P., Colonna, P., & Tayeb, J. (1987). Interrelationships between
thermomechanical treatment and macromolecular degradation of maize starch in a novel
rheometer with preshearing. Journal of Cereal Science, 5, 189-202.
Wen, L.F., Rodis, P., & Wasserman, B.P. (1990). Starch fragmentation and protein
insolubilization during twin-screw extrusion of corn meal. Cereal Chemistry, 67(3), 268-275.
Willett, J.L., Millard, M.M., & Jasberg, B.K. (1997). Extrusion of waxy maize starch: melt
rheology and molecular weight degradation of amylopectin. Polymer, 38(24), 5983-5989.
Chapter 5
Modeling macromolecular degradation of corn starch in a twin screw
extruder
Abstract
Macromolecular degradation of starch in a twin screw extruder was modeled. A shear cell
having well-defined flow conditions described earlier was used to measure peak viscosity of
corn starch melts at various moisture contents and temperatures. Shear rate and elongation
rate distributions in the extruder were estimated from numerical calculations from literature
and elongational viscosity was estimated using the Trouton ratio. In this way, stresses in the
extruder were calculated and, using relations on maximum stress vs. intrinsic viscosity
obtained in earlier work, the expected relative intrinsic viscosity was calculated. The model
gave a good prediction of relative intrinsic viscosity after extrusion at various temperatures
(97-130°C), moisture contents (23–45%) and screw speeds (90 or 140 rpm). This suggests
that the use of pilot scale equipment having a well-defined flow pattern can be useful for
understanding complex processes such as extrusion.
This chapter was submitted for publication as: R.M. van den Einde, M.E. van der Veen, H.
Bosman, A.J. van der Goot, R.M. Boom, Modeling macromolecular degradation of corn
starch in a twin screw extruder.

Chapter 5
64
1. Introduction
Extrusion cooking is known to modify starch at all structural levels: the granular structure
disappears, the crystals melt and macromolecules depolymerize (Barron et al., 2001).
Molecular breakdown of starch is known to influence various product characteristics such as
water solubility, cold paste viscosity and extrudate expansion (Bruemmer et al., 2002; Bindzus
et al., 2002). The effects of screw speed, temperature, moisture content and amylose content
on molecular breakdown of starch during extrusion have been investigated (Cai et al., 1995;
Davidson et al., 1984a; Govindasamy et al., 1996; Orford et al., 1993). However, these
studies are extruder-type dependent and can not always easily be translated to other types
(Harper, 1986). To obtain knowledge that is more generally applicable, a mechanistic
approach to understand the effect of process conditions during extrusion cooking on
molecular weight of starch is needed.
A challenge in understanding the effects of extrusion cooking on starch is the estimation of
the correct stresses along the extruder barrel. In most studies only nominal values for the
shear rate were used to describe the effect of extruder stress or strain on starch degradation
(Davidson et al., 1984b; Cai et al., 1995) or on destruction of other components
(Komolprasert and Ofoli, 1991; Ilo and Berghofer, 1998). However, in our previous work we
have shown that the maximum rather than the average stress determines starch breakdown
(Van den Einde et al., 2004a). Slit dies can be used to determine melt viscosity at the end of
the extruder (Della Valle et al., 1995), but these measurements are already influenced by
product transformations during its residence in the barrel. Hence, it is difficult to estimate the
maximum shear stresses during the treatment from those experiments.
The use of equipment having more defined shear and temperature gradients was shown to be
successful for understanding changes in starch by thermomechanical treatment (Vergnes et
al., 1987; Barron et al., 2000; Barron et al., 2001; Van den Einde et al., 2004a, 2004b).
Therefore, the purpose of this work was to construct a model describing the molecular weight
reduction of starch in a twin screw extruder, based on experiments carried out in well-defined
shear and thermal conditions. A shear cell described earlier (Van den Einde et al., 2004a) was
used together with extrusion trials. Shear cell torque data were used to calculate the peak melt
viscosity of the starch. The shear and elongation rates at different places in a paddle section in
the extruder were estimated and the corresponding shear and elongational stresses were
calculated. Paddle sections are, compared to (sections of) transport and single lead elements,

Chapter 5
65
Table 1: Treatment conditions and rheological results for a mixture of corn starch and 30%
water processed in the shear cell. Exp. no. = experiment number; T = temperature; MC =
moisture content; N = rotation speed; τmax = maximum shear stress; Kmax = calculated
consistency factor at τ = τmax. New samples are marked A1 to A8. Other samples were
described earlier (Van den Einde et al., 2004b); numbers are the same as used in the earlier
work.
Exp. no. T (°C) MC (%) N (rpm) τmax (104 Pa) Kmax (103 Pa s0.3)26 90 30 75 5.11 10.827 90 30 50 4.86 11.6A1 90 30 25 5.25 15.4A2 90 30 50 4.76 11.328 100 30 35 3.87 10.229 110 30 75 4.56 9.630 110 30 25 3.32 9.731 110 30 35 3.51 9.332 110 30 35 3.11 8.2A3 110 30 50 4.25 10.1A4 110 30 50 4.25 10.133 120 30 75 3.67 7.734 120 30 35 3.27 8.735 125 30 50 4.13 9.8A5 125 30 50 4.10 9.8A6 125 30 50 3.67 8.736 130 30 35 2.44 6.537 130 30 50 3.45 8.238 130 30 50 3.45 8.2A7 130 30 75 3.66 7.739 140 30 50 2.85 6.8A8 140 30 35 3.45 9.140 140 30 50 1.51 3.641 90 37 25 3.16 9.342 90 37 75 4.00 8.443 90 37 50 3.75 8.944 90 37 50 4.20 10.045 110 37 25 2.25 6.646 110 37 10 2.40 9.347 110 37 50 2.85 6.848 125 37 50 1.95 4.649 125 37 50 2.25 5.450 90 43 50 2.80 6.751 90 43 25 2.14 6.352 110 43 50 1.99 4.753 110 43 10 1.45 5.654 110 43 10 1.54 6.055 125 43 50 1.64 3.956 125 43 25 1.09 3.2

Chapter 5
66
known to be flow restricting and high shear as for example indicated by their effect on the
mechanical energy input (Choudhury and Gautam, 1998). These sections are therefore
determining maximal stresses and hence the degree of breakdown. The expected degree of
degradation in the extruder was calculated and compared to the extrusion experiments.
2. Materials and methods
2.1. Starch and water
Regular corn starch was obtained from Cargill BV (Bergen op Zoom, The Netherlands). For
practical reasons, starch and water were pre-mixed one day before the shear cell experiments.
Starch and water were mixed inside the extruder during the extrusion experiments.
2.2. Determination of melt viscosity
Our shear cell was used to determine melt viscosity at different temperatures and moisture
contents (defined on wet basis). Maximum shear stress was 36 kPa. Further details on this
equipment can be found elsewhere (Van den Einde et al., 2004a).
Experiments used to describe the rheology of the starch melt were part of the ones described
earlier (Van den Einde et al., 2004b). Furthermore, some extra experiments were carried out
to get a more complete view on the rheology of the starch melt and the reproducibility of the
torque measurements. All experiments are summarized in table 1. From the torque
measurement during the treatment, the peak viscosity of the starch melt was calculated. In
accordance with Vergnes and Villemaire (1987), Willett et al. (1997) and Remsen and Clark
(1978), a power law type behavior of the starch melt was assumed. The pseudoplastic index n
was assumed to be 0.3 (Vergnes et al., 1987). The peak consistency factor Kmax was
calculated according to:
nKγ
τ maxmax = [1]
The Kmax-values were then fitted to the following equation (Vergnes and Villemaire, 1987):
( )TkMCkKK 210max exp += [2]
2.3. Extrusion cooking
Mixtures of corn starch and water were extruded using a co-rotating twin screw extruder
(APV Baker MPF 50, L/D = 25). The screw configuration is shown in figure 1. This
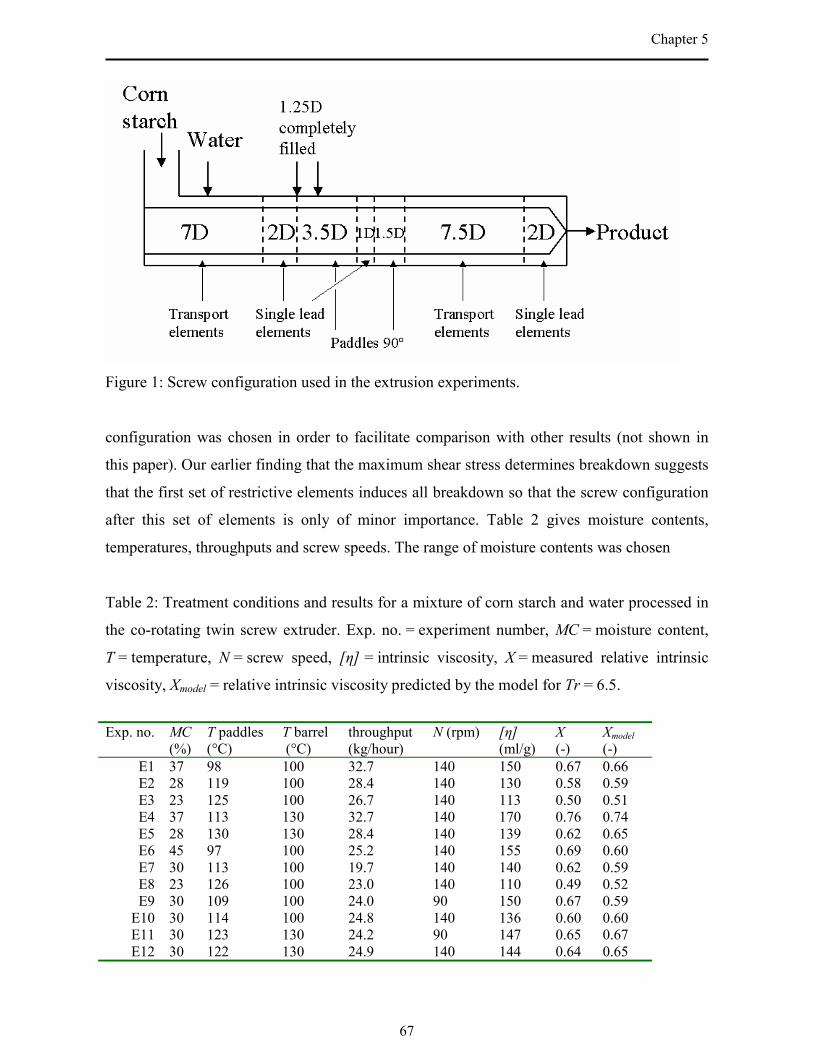
Chapter 5
67
Figure 1: Screw configuration used in the extrusion experiments.
configuration was chosen in order to facilitate comparison with other results (not shown in
this paper). Our earlier finding that the maximum shear stress determines breakdown suggests
that the first set of restrictive elements induces all breakdown so that the screw configuration
after this set of elements is only of minor importance. Table 2 gives moisture contents,
temperatures, throughputs and screw speeds. The range of moisture contents was chosen
Table 2: Treatment conditions and results for a mixture of corn starch and water processed in
the co-rotating twin screw extruder. Exp. no. = experiment number, MC = moisture content,
T = temperature, N = screw speed, [η] = intrinsic viscosity, X = measured relative intrinsic
viscosity, Xmodel = relative intrinsic viscosity predicted by the model for Tr = 6.5.
Exp. no. MC(%)
T paddles(°C)
T barrel (°C)
throughput(kg/hour)
N (rpm) [η](ml/g)
X(-)
Xmodel(-)
E1 37 98 100 32.7 140 150 0.67 0.66E2 28 119 100 28.4 140 130 0.58 0.59E3 23 125 100 26.7 140 113 0.50 0.51E4 37 113 130 32.7 140 170 0.76 0.74E5 28 130 130 28.4 140 139 0.62 0.65E6 45 97 100 25.2 140 155 0.69 0.60E7 30 113 100 19.7 140 140 0.62 0.59E8 23 126 100 23.0 140 110 0.49 0.52E9 30 109 100 24.0 90 150 0.67 0.59
E10 30 114 100 24.8 140 136 0.60 0.60E11 30 123 130 24.2 90 147 0.65 0.67E12 30 122 130 24.9 140 144 0.64 0.65

Chapter 5
68
somewhat broader than in the shear cell to obtain a significant range in degradation values.
No die was applied, since the focus was on the effect of the high-shear paddle section without
other resistances being present. The first 5 pairs of paddles were shown to be the only
elements of the extruder that were completely filled. Temperature in the paddle section was
measured continuously during the experiment; values are given in table 2.
Extruded samples were dried and ground to fine as described earlier (Van den Einde et al.,
2004a).
2.4. Analysis
Intrinsic viscosity was determined as described earlier (Van den Einde et al., 2004a). The
degree of degradation was calculated as the relative intrinsic viscosity X (Diosady et al.,
1985). X-Ray diffraction measurements on a Philips PC-APD PW 3710 powder X-Ray
diffractometer showed that the native crystalline could not be found in any of the heated-
sheared or extruded samples (results not shown). Therefore, the calculation method described
by Diosady et al. (1985) could be simplified to:
0][][
ηη=X [3]
2.5. Estimation of shear and elongational stresses in the extruder
In order to calculate the local shear stresses in the extruder from the melt viscosity data, the
shear rates in the paddle section of the extruder were estimated.
The shear rates and therefore shear stresses differ radially along a paddle. Therefore, the shear
rate distribution was calculated. Van der Wal et al. (1996) simulated the flow of an
incompressible Newtonian fluid in a paddle in an extruder identical to the one used in this
work. Van der Wal & Klomp calculated the shear and elongation rate distributions at various
axial positions along the paddle (unpublished). Although we were aware that the assumptions
made in their paper (incompressible, Newtonian) were not entirely valid for our work, these
simulations were, compared to others described in literature, closest to the situation described
in this paper. Ideally, these data should be combined with information on the pathways that
each particle is taking through the paddle section. Unfortunately there is not, to the best of our
knowledge, any publication describing this. However, the velocity vectors calculated by Van
der Wal et al. (1996) suggest that a high percentage of the particles stays more or less at the
same radial distance from the middle point of the extruder axis. As an approximation, this was

Chapter 5
69
assumed to be the case for all particles. As the maximum shear rate determines the maximum
shear stress and hence the degree of degradation, the figures of Van der Wal & Klomp
(unpublished) were used to estimate the maximum shear rates. Using the rheological data
from the shear cell experiments, the maximum shear stresses at the temperatures and moisture
contents used in the extruder experiments were calculated, according to τ = K·γn (equation
[1]). K follows from equation [2] where T is in this case the temperature in the paddle section.
The same procedure was applied to estimate maximum elongation rates. Both shear and
elongation rates are linearly proportional to the screw speed N (Van der Wal et al., 1996).
The elongational viscosity was calculated according to (Jones et al., 1987):
( ) ( ) Tre ⋅= εηεη 3 [4]
Bhattacharya et al. (1994) measured the Trouton ratio of corn meal at the end of a single
screw extruder at temperatures 160-180°C and moisture contents of 30-35%, resulting in Tr ≈
20 to 55. They suggested that lower product moisture and especially lower barrel
temperatures resulted in a decreased Tr. We assumed corn meal to be comparable to corn
starch with respect to the Trouton ratio. In our work, the moisture content was comparable to
the work of Bhattacharya and co-workers, but the temperature was much lower. Therefore, we
expected the Trouton ratio to be lower than 20. For a Newtonian liquid, the Trouton ratio has
a constant value of 4 (Bhattacharya, 1993). As no further data were available on the Trouton
ratio of corn starch at the temperatures and moisture contents used, Tr was taken as a fit
parameter with an expected value 4 < Tr < 20.
The elongational stress σ was calculated according to:
εησ ⋅= e [5]
In this way, various zones in the paddle section were defined, each having a certain maximum
shear and elongational stress.
2.6. Calculation of expected breakdown during extrusion cooking
Assuming that an elongational stress would result in the same degree of degradation as plain
shear stress of the same magnitude (this assumption is further discussed in section 3.4), the
expected relative intrinsic viscosity X of material after a maximum shear or elongational
stress in zone i was calculated according to:
( )ii CCX max,21 exp τ⋅−= [6a]
or

Chapter 5
70
( )ii CCX max,21 exp σ⋅−= [6b]
respectively, whichever of the two gave the largest degree of degradation (i.e. the lowest
value of X). The parameters C1 and C2 follow from our earlier work (Van den Einde et al.,
2004b):
1=X if τmax < 2.32 104 N/m2 [7a]
( )max51063.1exp46.1 τ−⋅−=X if τmax ≥ 2.32 104 N/m2 [7b]
for MC = 30% and:
1=X if τmax < 7.74 103 N/m2 [8a]
( )max51018.2exp18.1 τ−⋅−=X if τmax ≥ 7.74 103 N/m2 [8b]
for MC = 43%. In both cases, these equations were only valid if treatment time after the
maximum shear stress was reached was shorter than approximately 150 s, so that thermal
effects were negligible (Van den Einde et al., 2004b). This was the case in all shear cell
experiments used in this work as well as in the extruder trials. The relative intrinsic viscosity
of the end product was calculated according to:
i
m
ii XwX ∑
=
=0
[9]
Figure 2: Consistency factors as determined in the experiments versus consistency factors
calculated according to equation [10].

Chapter 5
71
where wi denotes the weight fraction of material passing zone i. wi was calculated by dividing
the area of each zone by the total area. Calculating an overall relative intrinsic viscosity X by
averaging the relative intrinsic viscosities of the different fractions was earlier done by
Diosady et al. (1985).
The predicted relative intrinsic viscosity X (equation [9]) was then compared to the
experimentally determined value. It was assumed that samples extruded at MC<30% would
behave according to the equations derived for MC = 30% (equations [7a] and [7b]; no thermal
breakdown). The sample extruded at MC = 45% was assumed to behave according to the
equations derived for MC = 43% (equations [8a] and [8b]). In our previous work (Van den
Einde et al., 2004b) it was demonstrated that the breakdown of starch at 37% moisture and
T = 90°C could be well described using the equations for MC = 30% (equations [7a] and [7b])
and therefore it was decided to calculate the relative intrinsic viscosity X of both samples
extruded at 37% moisture using these equations.
3. Results
3.1. Melt viscosity
The maximum consistency factors Kmax of the starch melts as calculated from the peak torque
are shown in table 1. Fitting the data to equation [2] revealed:
)014.0052.0exp(1013.2 5max TMCK ⋅−⋅−⋅⋅= [10]
Figure 2 shows the consistency factor fitted with equation [10] and the measured consistency
factor. R2 value was 0.78, which is acceptable considering the accuracy of the torque
measurement (± 10%), and residuals were divided randomly around zero.
3.2. Estimated shear and elongation rate division in paddle section
Figures 3a and 3b show the calculated maximum shear rate and elongation rate distribution
respectively inside the paddle section, under the assumptions given in section 2.5. At the
highest elongation rates, the corresponding stresses are much higher than the maximum shear
stresses for all values of the Trouton ratio suggested in section 2.5. This suggests that these
stresses are important, although the fraction of material exposed to them is low (figure 3b).
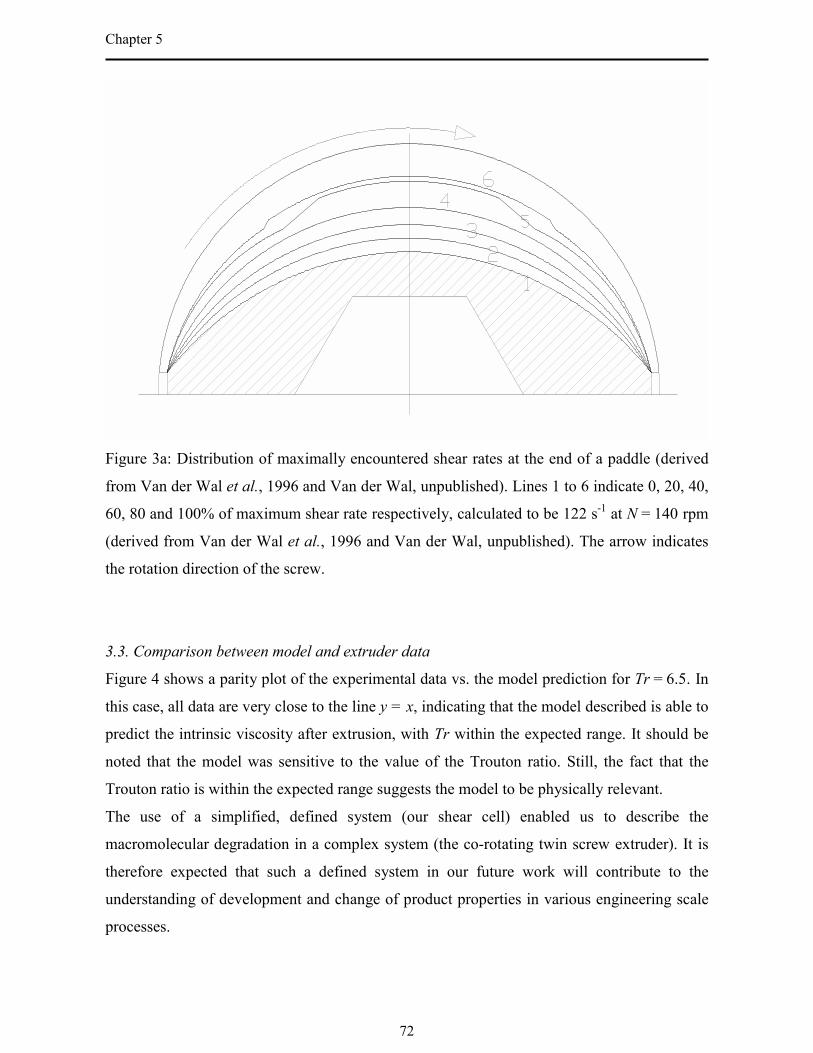
Chapter 5
72
Figure 3a: Distribution of maximally encountered shear rates at the end of a paddle (derived
from Van der Wal et al., 1996 and Van der Wal, unpublished). Lines 1 to 6 indicate 0, 20, 40,
60, 80 and 100% of maximum shear rate respectively, calculated to be 122 s-1 at N = 140 rpm
(derived from Van der Wal et al., 1996 and Van der Wal, unpublished). The arrow indicates
the rotation direction of the screw.
3.3. Comparison between model and extruder data
Figure 4 shows a parity plot of the experimental data vs. the model prediction for Tr = 6.5. In
this case, all data are very close to the line y = x, indicating that the model described is able to
predict the intrinsic viscosity after extrusion, with Tr within the expected range. It should be
noted that the model was sensitive to the value of the Trouton ratio. Still, the fact that the
Trouton ratio is within the expected range suggests the model to be physically relevant.
The use of a simplified, defined system (our shear cell) enabled us to describe the
macromolecular degradation in a complex system (the co-rotating twin screw extruder). It is
therefore expected that such a defined system in our future work will contribute to the
understanding of development and change of product properties in various engineering scale
processes.

Chapter 5
73
Figure 3b: Distribution of maximally encountered elongation rates at the end of a paddle
(derived from Van der Wal et al., 1996). Lines indicate 0, 10, 50 and 100% of maximum
elongation rate due to constriction, calculated to be 129 s-1 at N = 140 rpm. Lines with
negative values indicate 10, 50 and 100% of maximum elongation rate due to broadening.
Figure 4: Experimental vs. fitted values for the relative intrinsic viscosity X of extruded corn
starch. Fitted values were obtained from the model described in sections 2.5 and 2.6 at
Tr = 6.5.

Chapter 5
74
3.4. Discussion on model assumptions
In this modeling study, it was assumed that calculation of the maximum shear and elongation
rate and hence stress distribution supplies the correct maximum stress distribution for the
whole paddle section. It is possible that material that has not encountered high shear rates in
the first pair of paddles is in fact encountering those high shear rates further on in the section,
probably resulting in more breakdown of the starch. On the other hand, viscosity and
therefore stresses may be reduced due to the macromolecular breakdown. The validity of the
assumption stated above was checked in the following way. The reduction in consistency
factor Kmax in the first paddle due to starch breakdown was calculated from the predicted
intrinsic viscosity value after the first paddle according to the equation derived by Parker et
al. (1990):4.3
max ][~ ηK [12]
Using the reduced consistency factor, the same procedure as used to calculate the degradation
in the first paddle (sections 2.5 and 2.6) was applied. This was repeated for all 5 completely
filled paddles. Results of this rough calculation showed that the other completely filled
paddles decreased X maximally 0.0217 (on average 0.007), while the first ones result in a
reduction of 0.26-0.49, suggesting that most degradation is likely to take place in the first
paddle.
The calculation of the stress distribution is based on the assumption that shear and elongation
have the same effect on the molecular breakdown and that the effect of simultaneous shear
and elongation can be considered equal to the effect of the larger one of the two. In emulsion
technology, it is known that elongation is more effective in breaking up droplets than shear
and some relationships describing this effect exist (Walstra, 1983). However, this sort of
relationships is unknown for the system described here. Still, as most studies used only
nominal values for shear rate, as outlined in the introduction of this paper, the approach used
here is a clear step forward, although further investigations on the effect of combined shear
and elongation might improve understanding in this respect.
3.5. Consequences for extruder modeling and process design
In this work, the elongational flow regimes were shown to be important in some of the
regions where this type of flow took place. So far, studies on extruder stress modeling
focussed on shear stress only (Cai et al., 1995). Our results suggest that elongational flow can
not be neglected in extrusion studies.

Chapter 5
75
Another interesting result is that our model was able to describe the molecular weight
reduction in a complete extruder quite well by concentrating on a single paddle. This could
imply that extruders are often oversized when considering molecular weight reduction and
possibly other changes in product properties. Once that the first restrictive element is reached,
breakdown (this paper) and melting (Colonna et al., 1983) predominantly take place in this
high-shear section. A larger length of the extruder is hence unnecessary to induce these
transformations, suggesting that extruders may be designed in a more efficient way. This
suggestion is more or less in agreement with the current trend towards the use of high screw
speeds (see, for example, Qian et al., 2002 and Bleiman et al., 2002), as these high speeds
result in short residence times in the high shear sections. On the other hand, high screw speeds
will lead to extra breakdown due to the higher shear and elongational stresses occurring.
4. Conclusion
A model for the degradation of corn starch in a twin screw extruder was developed using
viscosity data from our shearing device, shear and elongation rate estimations from numerical
simulations from literature and the relations between mechanical breakdown and maximum
stress derived in our earlier work. Using this model, the relative intrinsic viscosity after
extrusion could well be described. The model can therefore be considered as a first step
towards a more fundamental understanding of product modifications during the extrusion
process by using more defined equipment. Therefore, it is a clear step towards a rational
design of processes from the desired product properties.
Acknowledgement
The authors thank Professor A.E.P. Veldman of the University of Groningen, The
Netherlands, for providing the flow simulation data, J. Schouten for carrying out part of the
intrinsic viscosity measurements and for his assistance during the extrusion experiments,
J.J.G. van Soest for his assistance during the X-Ray diffraction measurements and S. van
Brenk for carrying out part of the intrinsic viscosity measurements.

Chapter 5
76
Symbols list
C1 first fit parameter in first order model (-)
C2 second fit parameter in first order model (m2/N)
D extruder diameter (m)
f fraction of molten material (-)
K consistency factor (Pa·sn)
Kmax consistency factor at τ = τmax (Pa·sn)
K0 consistency factor at (extrapolated) MC = 0% and T = 0°C (Pa·sn)
k1 factor describing the dependency of K on moisture content (%-1)
k2 factor describing the dependency of K on temperature (°C-1)
L extruder length (m)
m number of equal-stress zones (-)
MC moisture content (%)
n pseudoplastic index (-)
N screw speed (rpm)
T temperature (°C)
Tr Trouton ratio (-)
X relative intrinsic viscosity of the molten fraction of the treated starch
compared to native starch (-)
w weight fraction (-)
Greek symbols
γ shear rate (s-1)
ε elongation rate (s-1)
η melt viscosity (Pa·s)
ηe elongational viscosity (Pa·s)
[η] intrinsic viscosity (ml/g)
[η]0 intrinsic viscosity of native starch (ml/g)
θ angle of the shear zone of the shear cell (û)
σ elongational stress (Pa)
σmax maximum elongational stress (Pa)

Chapter 5
77
τ shear stress (Pa)
τmax maximum shear stress (Pa)
References
Barron, C., Buleon, A., Colonna, P., & Valle, G. Della (2000). Structural modifications of low
hydrated pea starch subjected to high thermomechanical processing. Carbohydrate Polymers,
43, 171-181.
Barron, C., Bouchet, B., Della Valle, G., Gallant, D.J., & Planchot, V. (2001). Microscopical
study of the destructuring of waxy maize and smooth pea starches by shear and heat at low
hydration. Journal of Cereal Science, 33, 289-300.
Bhattacharya, M. (1993). Slit rheometer studies of wheat flour dough. Journal of Texture
Studies, 24(4), 391-409.
Bhattacharya, M., Padmanabhan, M., & Seethamraju, K. (1994). Uniaxial extensional
viscosity during extrusion cooking from entrance pressure drop method. Journal of Food
Science, 59(1), 221-226.
Bindzus, W., Fayard, G., Van Lengerich, B., & Meuser, F. (2002). Description of extrudate
characteristics in relation to the shear stress of plasticised starches determined in-line. Starch /
Staerke, 54, 252-259.
Bleiman, P., Bulters, M., Elemans, P., & Slot, H. (2002). Melting model for co-rotating twin-
screw extruders. In SPE, Proceedings of ANTEC 2002. Brookfield, Society of Plastic
Engineers, Inc.
Bruemmer, T., Meuser, F., Lengerich, B. van, & Niemann, C. (2002). Expansion and
functional properties of corn starch extrudates related to their molecular degradation, product
temperature and water content. Starch / Staerke, 54, 9-15.
Cai, W., Diosady, L.L., & Rubin, L.J. (1995). Degradation of wheat starch in a twin-screw
extruder. Journal of Food Engineering, 26, 289-300.
Choudhury, G.S., & Gautam, A. (1998). Comparative study of mixing elements during twin-
screw extrusion of rice flour. Food Research International, 31(1), 7-17.
Colonna, P., Melcion, J.P., Vergnes, B., & Mercier, C. (1983). Flow, mixing and residence
time distribution of maize starch within a twin-screw extruder with a longitudinally split
barrel. Journal of Cereal Science, 1, 115-125.

Chapter 5
78
Davidson, V.J., Paton, D., Diosady, L.L., & Larocque, G. (1984a). Degradation of wheat
starch in a single-screw extruder: characteristics of extruded starch polymers. Journal of Food
Science, 49, 453-458.
Davidson, V.J., Paton, D., Diosady, L.L., & Rubin, L.J. (1984b). A model for mechanical
degradation of wheat starch in a single-screw extruder. Journal of Food Science, 49, 1154-
1157.
Diosady, L.L., Paton, D., Rosen, N., Rubin, L.J., & Athanassoulias, C. (1985). Degradation of
wheat starch in a single-screw extruder: mechano-kinetic breakdown of cooked starch.
Journal of Food Science, 50, 1697-1699, 1706.
Einde, R.M. van den, Bolsius, A., Soest, J.J.G. van, Janssen, L.P.B.M., Goot, A.J. van der, &
Boom, R.M. (2004a). The effect of thermomechanical treatment on starch breakdown and the
consequences for process design. Carbohydrate Polymers, 55(1), 57-63. (Chapter 2 of this
thesis).
Einde, R.M. van den, Akkermans, C., Goot, A.J. van der, & Boom, R.M. (2004b). Molecular
breakdown of corn starch by thermal and mechanical effects. Submitted to Carbohydrate
Polymers. (Chapter 4 of this thesis).
Govindasamy, S., Campanella, O.H., & Oates, C.G. (1996). High moisture twin-screw
extrusion of sago starch: 1. Influence on granule morphology and structure. Carbohydrate
Polymers, 30, 275-286.
Harper, J.M. (1986). Extrusion texturization of foods. Food Technology, 40, 70, 72, 74-76.
Ilo, S., & Berghofer, E. (1998). Kinetics of thermomechanical destruction of thiamin during
extrusion cooking. Journal of Food Science, 63(2), 312-316.
Jones, D.M., Walters, K., & Williams, P.R. (1987). On the extensional viscosity of mobile
polymer solutions. Rheologica Acta, 26(1), 20-30.
Komolprasert, V., & Ofoli, R.Y. (1990). Effect of shear on thermostable alpha-amylase
activity. Food Science and Technology / Lebensmittel Wissenschaft und Technologie, 23, 412-
417.
Orford, P.D., Parker, R., & Ring, S.G. (1993). The functional properties of extrusion-cooked
waxy-maize starch. Journal of Cereal Science, 18, 277-286.
Parker, R., Ollett, A.L., & Smith, A.C. (1990). Starch melt rheology: measurement, modelling
and applications to extrusion processing. In P. Zeuthen. Processing and quality of foods (pp.
1.290-1.295). London: Elsevier.
Chapter 5
79
Qian, B., Gogos, C.G., & Todd, D.B. (2002). The melting behavior of amorphous polyester in
a co-rotating twin screw extruder. In SPE. Proceedings of ANTEC 2002. Brookfield, Society
of Plastic Engineers, Inc.
Remsen, C.H., & Clark, J.P. (1978). A viscosity model for a cooking dough. Journal of Food
Process Engineering, 2, 39-64.
Valle, G. Della, Boche, Y., Colonna, P., & Vergnes, B. (1995). The extrusion behaviour of
potato starch. Carbohydrate Polymers, 28, 255-264.
Vergnes, B., Villemaire, J.P., Colonna, P., & Tayeb, J. (1987). Interrelationships between
thermomechanical treatment and macromolecular degradation of maize starch in a novel
rheometer with preshearing. Journal of Cereal Science, 5, 189-202.
Vergnes, B., & Villemaire, J.P. (1987). Rheological behaviour of low moisture molten maize
starch. Rheologica Acta, 26, 570-576.
Wal, D.J. van der, Goffart, D., Klomp, E.M., Hoogstraten, H.W., & Janssen, L.P.B.M. (1996).
Three-dimensional flow modeling of a self-wiping corotating twin-screw extruder. Part II: the
kneading section. Polymer Engineering and Science, 36(7), 912-924.
Walstra, P. (1983). Formation of emulsions. In P. Becher. Encyclopedia of emulsion
technology, volume 1: basic theory (pp. 57-127). New York, Marcel Dekker Inc.
Willett, J.L., Millard, M.M., & Jasberg, B.K. (1997). Extrusion of waxy maize starch: melt
rheology and molecular weight degradation of amylopectin. Polymer, 38(24), 5983-5989.

Chapter 5
80

Chapter 6
Local mixing effects of screw elements during extrusion
Abstract
An in-line method was applied to determine local residence time distribution (RTD) at two
places in a completely filled co-rotating twin screw extruder. Axial mixing effects of different
types of elements were evaluated. Elements were found to induce mixing downstream, but
also upstream of them. Therefore, it was concluded that global RTD measurements provide
too little information on the local mixing. Each element could be characterized by an
equivalent additional mixing length λ, which may be practically useful for extrusion
applications.
This chapter was submitted for publication as: R.M. van den Einde, P. Kroon, A.J. van der
Goot, R.M. Boom, Local mixing effects of screw elements during extrusion.

Chapter 6
82
1. Introduction
In the last decades, interest has steadily grown in the use of co-rotating twin screw extruders
in both food- and non-food applications (De Ruyck, 1997; Oberlehner et al., 1994; Puaux et
al., 2000). The extruder can be used for various functions, such as mixing, cooking or
chemical reactions.
To meet today�s product specifications, accurate control over process conditions is required.
Insight into flow and mixing in the extruder is essential in this respect. Residence time
distribution (RTD) measurements are often used to determine the extent of mixing and flow
phenomena inside the extruder. In various studies in literature, the RTD was measured at the
end of the extruder, as recently reviewed by Ganjyal and Hanna (2002).
In case of extrusion, the RTD is determined by a combination of degree of fill, which mainly
influences mean residence time, and the screw design, which influences the degree of axial
mixing. Therefore, the RTD is useful for a first, overall impression of the mixing behavior,
but it hardly provides detailed information on the local flow phenomena (Carneiro et al.,
1999). Measurement of mixing in a single element would allow improved understanding of
the different mechanisms of mixing that are taking place locally in the extruder. Therefore, it
is interesting to determine local RTD over a screw element in order to characterize the effect
of a screw element on the flow directly.
To our knowledge, few attempts to measure local RTD curves are described in literature. In
general, two types of studies can be distinguished. In some studies local RTD is defined as the
global RTD measured over a very short part of the extruder with die. Jager et al. (1991)
injected the tracer at various points along a co-rotating twin screw extruder and measured the
RTD at the die. Oberlehner et al. (1994) measured RTD at the die of a short part of an
intermeshing co-rotating twin screw extruder.
In other studies the RTD is measured locally along the screw. Chalamet et al. (2000)
measured the local RTD during reactive extrusion using an in-line ultrasonic technique. Jager
et al. (1988, 1989) measured local RTD of the various zones of a counter-rotating twin screw
extruder using a radioactive tracer and two scintillation detectors and modeled the effect of
each zone. Gao et al. (1999) measured local RTD along the screw with an optical probe, but
only used the RTD measured at the die for further analysis. An interesting study was carried
out by Carneiro et al. (1999). They showed that a mixing block with discs offset 90° in a
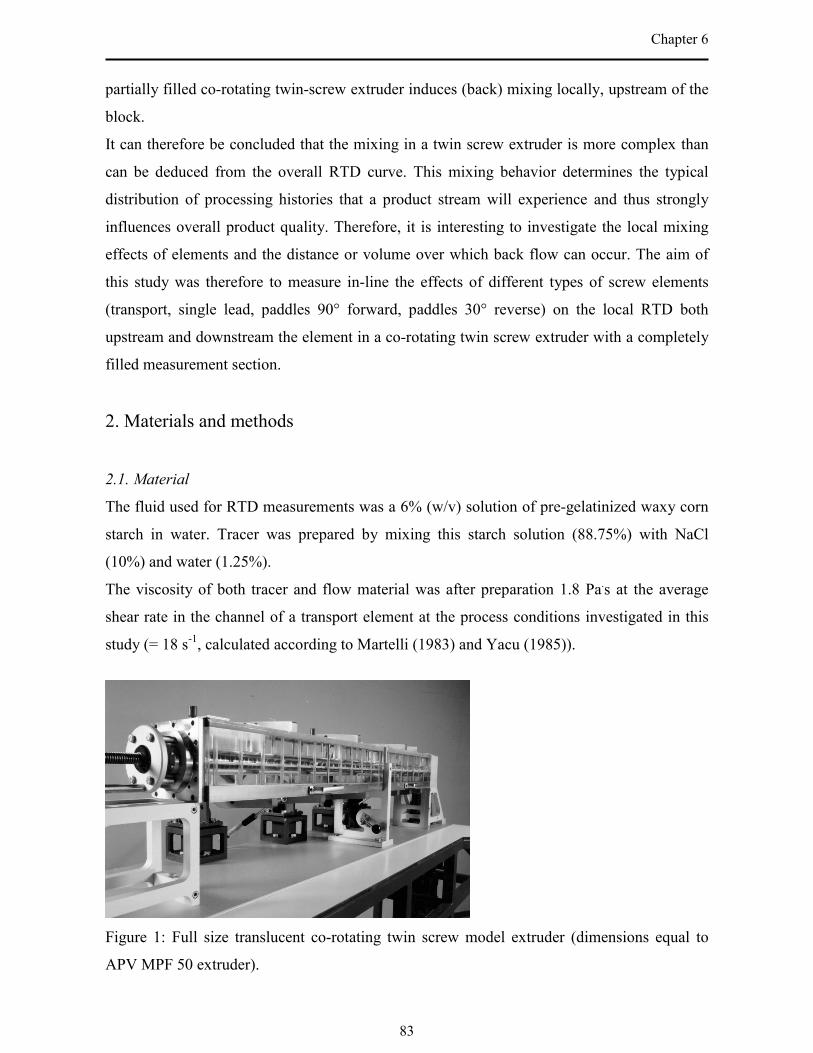
Chapter 6
83
partially filled co-rotating twin-screw extruder induces (back) mixing locally, upstream of the
block.
It can therefore be concluded that the mixing in a twin screw extruder is more complex than
can be deduced from the overall RTD curve. This mixing behavior determines the typical
distribution of processing histories that a product stream will experience and thus strongly
influences overall product quality. Therefore, it is interesting to investigate the local mixing
effects of elements and the distance or volume over which back flow can occur. The aim of
this study was therefore to measure in-line the effects of different types of screw elements
(transport, single lead, paddles 90° forward, paddles 30° reverse) on the local RTD both
upstream and downstream the element in a co-rotating twin screw extruder with a completely
filled measurement section.
2. Materials and methods
2.1. Material
The fluid used for RTD measurements was a 6% (w/v) solution of pre-gelatinized waxy corn
starch in water. Tracer was prepared by mixing this starch solution (88.75%) with NaCl
(10%) and water (1.25%).
The viscosity of both tracer and flow material was after preparation 1.8 Pa.s at the average
shear rate in the channel of a transport element at the process conditions investigated in this
study (= 18 s-1, calculated according to Martelli (1983) and Yacu (1985)).
Figure 1: Full size translucent co-rotating twin screw model extruder (dimensions equal to
APV MPF 50 extruder).

Chapter 6
84
2.2. Extruder
The extruder used was a transparent full size model of a co-rotating APV MPF 50 twin screw
extruder (L/D of used part = 14.5; D = 50 mm). A picture of this extruder is shown in figure 1.
The flow rate was 11.7·10-6 m3/s (± 5%). Flow rate was measured using an Endress & Hauser
Promag 50 measuring device. Screw speed was 60 rpm. The model material was fed to the
extruder through a gear pump. The theoretical flow rate Qth of the transport elements was
calculated to be 11·10-5 m3/s, which means that the extruder gave rise to an additional
pumping effect, as usual under practical conditions.
Apart from the measurement section, the screw configuration was the same in all
experiments, as schematically outlined in figure 2. The extruder was completely filled with
fluid during all measurements.
Figure 2: Extruder configuration.
Tracer was fed into the extruder by means of an injection system shown in figure 3. The
injection system consisted of two electronically adjusted valves and a digital timer, allowing
an exact tracer block pulse of 1 second. The tracer injection system was connected to the
extruder via a tube (length = 85 cm, diameter = 14 mm). The complete setup is schematically
shown in figure 4 (tracer injection system not shown).

Chapter 6
85
Figure 3: Tracer injection system.
Figure 4: Extruder with system for local RTD measurement: A = extruder; B = conductivity
probes; CT = conductivity transmitters; FI = flow rate measuring device.
2.3. In-line measurement system
The technique investigated was based on the measurement of the electrical conductivity of the
material at two points in the extruder. This type of technology was earlier used by Castelain
and co-workers for determination of RTD curves in spatially chaotic 3D flow (Castelain et al.,
2000). The method described here is based on the measurement system used by Van den
Einde et al. (2002) with various modifications allowing simultaneous measurements of both
RTD functions.

Chapter 6
86
The two measurement points were located before and after a 6 D element section (figure 2).
To avoid damage of the conductivity probes (WTW TetraCon 325) by the screw, a plastic
spacer ring (0.625 D) was placed around the axis near the probes. The main wire of each
probe was exactly halfway at the ring. The element section of interest (2 D) was placed in
between two sections of transport elements (each 2 D) so that effects further upstream and
downstream of the element could be measured (as explained in the Introduction of this
chapter).
Electrical influences on the measurements (via extruder screw, sockets or connected
measurement devices) turned out to be critical. Therefore, the signals of the probes were
transformed to volt signals completely independently from each other as described below.
The signal of the first probe was transferred to a volt signal by a WTW LF 340 battery-
operated conductivity transmitter. This volt signal was recorded by a FLUKE 89 IV
multimeter. The signal of the second probe was transferred to a volt signal by a WTW LF 538
conductivity transmitter. Between the transmitter and the socket, an isolating transformer was
placed to avoid disturbances of the conductivity signal by external factors. The volt-signal
was then recorded on a data logging system connected to a computer with Viewdac 2.10
software (Keithley Instruments Inc.). Both systems were independently calibrated.
Measurement of both E(t) curves was now possible within one experiment.
2.4. Determination of local RTD by in-line method
At steady state conditions, the in-line measurement system was started and at the same
moment the tracer was injected as a 1 second block pulse. The signals of both probes were
recorded until they were back at base line.
The conductivity responses from the probes were smoothed according to a 3 point moving
average method:
3)1()()1()( +++−= nknknknk [1]
The base line was then subtracted from the measurement points and salt concentrations were
calculated. The E(t) function was calculated according to:
∑∫∞∞
∆==
00 )(
)(
)(
)()(ttc
tc
dttc
tctEi
i
i
i[2]

Chapter 6
87
Quality of the measurement was tested by checking the total amount of salt detected by each
of the probes. Furthermore, the mean residence time τ of both measurement points was
calculated from the measurement according to:
∫
∫∞
∞
⋅
⋅⋅=
0
0
)(
)(
dttc
dtttcτ [3]
The measured mean residence time was compared to the theoretical mean residence time (τth),
calculated according to:
vth Q
V=τ [4]
where V is the extruder volume from the tracer injection system until the measurement probe.
3. Results and discussion
3.1. Quality of measurement
Percentages of detected salt compared to the salt in the inlet pulse are shown in table 1. All
values are close to 100%, suggesting a reliable measurement. For unknown reasons, the
percentage detected by the second probe was consistently somewhat lower in the experiments
with forward 90° paddles.
Table 1 also shows that the measured mean residence time τ was well reproducible within a
series of experiments with the same element of interest (± at most 2.5%).
3.2. RTD curve and mean residence time
As expected, different screw elements gave rise to differences in RTD downstream of the
elements. However, for some elements also upstream effects were observed (figure 5).
Strongest effects were found after incorporation of paddles. Paddles �30° resulted in a broad
RTD curve upstream of this element section. Paddles +90° resulted in a broad RTD curve
downstream of this element section.
The theoretical value of the mean residence time was always lower than the measured one
(equations [3-4] and table 2), suggesting circular flows inside the extruder. A result of these
circular flows is an increased apparent volume over which the mean residence time is actually
measured (figures 6 and 7). Hence, the measured mean residence time is equal to this apparent

Chapter 6
88
Table 1: Flow rates (Qv), average percentages detected NaCl and measured mean residence
times (τ) in the experiments for both probes. Subscripts 1 and 2 indicate the first and second
measurement point respectively; exp. no. = experiment number.
Element of
interest
Exp. no. Qv
(10-6 m3/s)
% probe 1 τ1 (s) % probe 2 τ2 (s)
transport 1 11.6 107 67.2 100 125.7
2 11.8 107 68.5 98 124.9
3 11.9 109 68.8 100 126.4
4 11.9 100 71.3 90 126.5
single lead 1 11.5 110 70.0 97 118.0
2 11.1 108 70.0 96 118.8
paddles +90° 1 12.2 107 74.3 83 144.2
2 12.0 109 75.2 83 144.6
3 12.1 109 74.4 82 146.1
paddles �30° 1 11.6 104 101.8 96 131.1
2 11.7 104 97.8 97 125.3
3 11.7 105 99.2 99 130.5
4 11.6 106 99.7 97 128.5
5 11.6 104 97.7 95 127.2
6 11.6 102 97.9 96 127.7
volume divided by the flow rate. This can be written as:
vQVqV 110
1⋅+
=τ [5a]
where q1 (0 ≤ q1 ≤ 1) denotes the fraction of the volume between the first and the second
measurement point that is actually part of the apparent volume, and:
vQVqVV 2210
2⋅++
=τ [5b]
respectively, where q2 denotes the fraction of volume of the section downstream of the second
probe that is part of the apparent volume over which the mean residence time is measured.
Because the volume of elements differs, the downstream volumes were defined in terms of
the corresponding additional mixing length λ, the length of the section downstream of the

Chapter 6
89
Figure 5: Local residence time distribution curves obtained at the two measurement points (η
= 1.8 Pa·s, 60 rpm) for different mixing elements.

Chapter 6
90
probe that is part of the apparent volume over which the mean residence time is measured. As
extruder lengths are often defined as a function of the diameter of the screw D, λ was divided
by D, resulting in the dimensionless additional mixing length (λ/D). This can be written as:
vVq
D111 ⋅=λ [6a]
and
vVq
D222 ⋅=λ [6b]
where v denotes the extruder volume (m3) of a section with length D. ν differs slightly for
each element type. Table 2 shows that additional mixing length of the material at both
measurement points was highly influenced by the elements in the measurement section.
Part of the additional mixing length could be caused by two factors. Firstly, the ring around
the screw axis that avoids damage of the probe probably behaves as a perfect mixer, resulting
in circular flow from both upstream and downstream with λ/D = at most 0.3 (see subsection:
In-line measurement system). Secondly, the accuracy of the flow rate measurement was ± 3%,
causing a possible deviation in λ/D of 0.2 at the first measurement point and of 0.4 at the
second measurement point. Therefore, only if the absolute value of λ/D was larger than 0.5 at
the first probe or larger than 0.7 at the second probe, it was concluded that significant circular
flow as a result of screw elements took place.
Table 2 shows that transport elements did not induce any significant circular flow at the
second probe. However, at the first probe some circular flow took place. To explain this, the
model of Jager et al. (1991) was used, who interpreted the extruder as a row of moving
CSTRs with back flow. The number of CSTRs downstream of the second probe is much
lower than the number downstream of the first probe, resulting in less circular flow to the
second probe. The use of single lead elements resulted in the same type of flow pattern. No
significant circular flow was induced at the second probe, whereas some circular flow towards
the first probe took place. The negative value of λ/D at the second probe was probably a result
of the maximum measurement accuracy due to variation in throughput.
The main difference between transport or single lead elements and paddles is the lack of drag
flow towards the die in paddles. This implies that transport towards the die is a result of
pressure flow, as shown in figure 6.
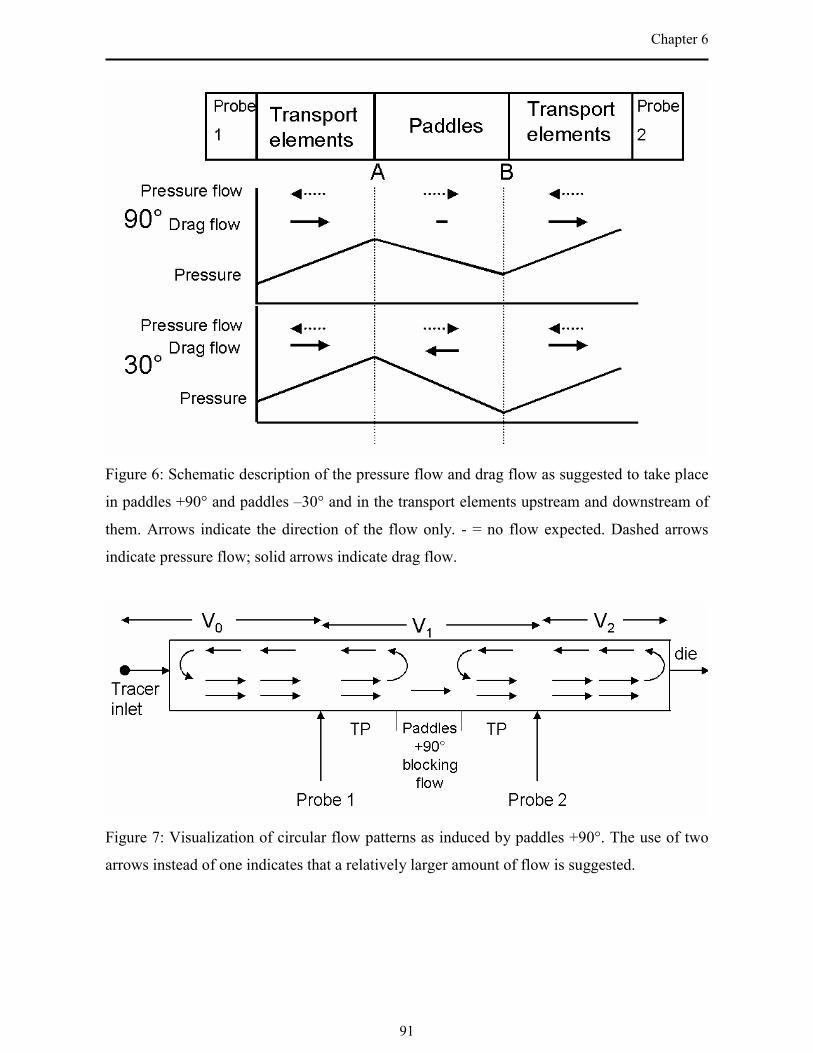
Chapter 6
91
Figure 6: Schematic description of the pressure flow and drag flow as suggested to take place
in paddles +90° and paddles �30° and in the transport elements upstream and downstream of
them. Arrows indicate the direction of the flow only. - = no flow expected. Dashed arrows
indicate pressure flow; solid arrows indicate drag flow.
Figure 7: Visualization of circular flow patterns as induced by paddles +90°. The use of two
arrows instead of one indicates that a relatively larger amount of flow is suggested.

Chapter 6
92
Table 2: Theoretical mean residence time (τth, equation [4]), downstream volume fractions q1
and q2 that are part of the apparent volume and additional mixing length λ/D (see text).
Subscripts 1 and 2 indicate the first and second measurement point respectively, exp. no. =
experiment number.
Element Exp. no. τ1th (s) q1 (-) λ1/D (-) τ2th (s) q2 (-) λ2/D (-)
transport 1 58.4 0.13 0.81 124.1 0.05 0.12
2 57.5 0.17 1.07 122.0 0.08 0.23
3 57.0 0.19 1.16 121.0 0.16 0.48
4 57.0 0.22 1.43 121.0 0.16 0.49
single lead 1 59.0 0.18 1.04 122.1 -0.12 -0.32
2 61.1 0.14 0.79 126.5 -0.21 -0.66
paddles +90° 1 55.6 0.32 1.95 114.4 0.89 3.17
2 56.6 0.31 1.91 116.3 0.83 3.07
3 56.0 0.31 1.89 115.4 0.91 3.20
paddles �30° 1 58.4 0.70 4.20 120.3 0.31 1.02
2 57.9 0.65 3.91 119.3 0.17 0.53
3 57.9 0.67 4.04 119.3 0.32 1.08
4 58.4 0.67 4.00 120.3 0.23 0.75
5 58.4 0.63 3.82 120.3 0.20 0.62
6 58.4 0.64 3.84 120.3 0.21 0.67
The lack of drag flow in paddles +90° leads to a virtual block of the flow at the position
marked A in figure 6. This block results in circular flow towards the first probe. At position
B, no material can stream upwards. This leads to circular flow towards the second probe, as
material flowing back from the transport element section downstream of the paddles can not
enter the paddles +90° section due to the lack of drag flow and the pressure gradient in these
paddles (figure 6). The complete resulting flow pattern is visualized in figure 7. Due to this
pattern, a large additional mixing length was found both at the first and the second
measurement point (table 2).
Finally, the large negative conveying drag flow induced by paddles �30° makes that particles
passing position A are actively transported back, resulting in a large additional mixing length
at the first measurement point. Although the pressure drop in these elements does not favor
back flow, the negative conveying drag flow allows material that is flowing back from the
Chapter 6
93
transport element section to flow upstream, so that circular flow towards the second probe is
limited. Hence, only a relatively small additional mixing length was measured at the second
measurement point.
3.3. Consequences for process design and flow measurements and modeling
The local mixing effects upstream of elements found in this work can not be determined using
global RTD measurements, because the additional mixing length is in that case not included.
This means that there is a clear risk that measurements of RTD carried out at the end of the
extruder underestimate the mixing inside the extruder and thus provide incorrect information
for process design.
The measurements showed that the mixing effect of transport and single lead elements was
dependent on the available downstream volume. As far as we can see now, it is likely that this
effect also holds for the other types of elements. This means that positioning of these elements
influences the local mixing effect. It is known that the positioning of elements determines
their effect in a partially filled twin screw extruder, due to effects on the degree of fill
(Gautam and Choudhury, 1999), but the effect that we found has not yet been reported.
Our results may also have important consequences for modeling of extruder flow, as they
clearly show the complexity of the extruder flow pattern and the interactions between
elements. Some modeling studies have focused on detailed numerical calculation of the flow
profile in a single element or in a block of elements of the same type (Van der Wal et al.,
1996; Ishikawa et al., 2000). The effects described in this paper suggest that taking into
account a larger section of elements would significantly increase the relevance of flow
modeling.
4. Conclusion
The local mixing effect of different types of elements in a co-rotating twin screw extruder was
successfully determined using local RTD measurements. Elements in a completely filled twin
screw extruder were found to induce mixing downstream, but also upstream. This means that
the positioning of elements is important, not only from the well known effects on the degree
of fill, but even in a completely filled system. Comparison between the measured mean
residence time and the theoretical one showed the following differences between the elements
with respect to circular flow:

Chapter 6
94
- Paddles +90° induce circular flow both downstream and upstream of these elements, due
to the pressure drop in these elements without drag flow.
- Paddles �30° induce circular flow upstream of these elements, due to the combination of
the pressure drop in these elements and their negative conveying effect.
- Single lead and transport elements induce limited circular flow upstream of them.
The circular flow of each element could well be characterized using the additional mixing
length λ, suggesting that this parameter is important in extrusion applications. The additional
mixing length is depending on the remaining length of the screw and the type of element.
The effect of elements on RTD upstream clearly shows that more attention should be paid to
local flow phenomena, which in many cases can not be extracted from global residence time
distribution measurements. Since these local flow phenomena were found to have a large
effect on global flow patterns inside the extruder, the result indicates that for further
understanding it is essential to consider the local flow phenomena as part of the complete
extruder.
Acknowledgement
The authors thank J. Peters and C. de Regt for their contributions during the early stages of
this work.
Symbols
c(t) concentration of NaCl at time = t (kg/m3)
D extruder diameter (m)
E(t) residence time distribution function (1/s)
k(n) nth data point for screw configuration k (-)
L length (m)
q1 the fraction of volume of the section downstream of the first probe that is part
of the apparent volume over which mean residence time is measured by this
probe (-)
q2 the fraction of volume of the section downstream of the second probe that is
part of the apparent volume over which mean residence time is measured by
this probe (-)

Chapter 6
95
Qth theoretical maximal throughput (m3/s)
Qv extruder throughput (m3/s)
t time (s)
V volume (m3)
V0 extruder volume until the first measurement point (m3) [including tube
connecting tracer injection system to extruder]
V1 extruder volume between first and second measurement point (m3)
V2 extruder volume downstream of second measurement point (m3)
Greek symbols
λ additional mixing length (D)
v extruder volume with length D (m3)
τ mean residence time as calculated from the measurements (s)
τth theoretical mean residence time (s)
References
Carneiro, O.S., Caldeira, G., & Covas, J.A. (1999). Flow patterns in twin-screw extruders.
Journal of Materials Processing Technology, 92-93, 309-315.
Castelain, C., Berger, D., Legentilhomme, P., Mokrani, A., & Peerhossaini, H. (2000).
Experimental and numerical characterisation of mixing in a steady spatially chaotic flow by
means of residence time distribution measurements. International Journal of Heat and Mass
Transfer, 43, 3687-3700.
Chalamet, Y., Taha, M., & Vergnes, B. (2000). Carboxyl terminated polyamide 12 chain
extension by reactive extrusion using a dioxazoline coupling agent. Polymer Engineering and
Science, 40(1), 263-274.
Einde, R.M. van den, Peters, J., Goot, A.J. van der, & Boom, R.M. (2002). In-line
measurement of local residence time distribution in a twin screw extruder. In: Proceedings of
ANTEC 2002 San Francisco, vol. 1 Processing (p. 28-30). Brookfield: Society of Plastics
Engineers, Inc.

Chapter 6
96
Ganjyal, G., & Hanna, M. (2002). A review on Residence Time Distribution (RTD) in food
extruders and study on the potential of neural networks in RTD modeling. Journal of Food
Science, 67(6), 1996-2002.
Gao, J., Walsh, G.C., Bigio, D., Briber, R.M., & Wetzel, M.D. (1999). Residence time
distribution model for twin-screw extruders. AIChE Journal, 45(12), 2541-2549.
Gautam, A., & Choudhury, G.S. (1999). Screw configuration effects on residence time
distribution and mixing in twin-screw extruders during extrusion of rice flour. Journal of
Food Process Engineering, 22, 263-285.
Ishikawa, T., Kihara, S. I., & Funatsu, K. (2000). 3-D Numerical simulations of
nonisothermal flow in co-rotating twin screw extruders. Polymer Engineering and Science,
40(2), 357-364.
Jager, T., Zuilichem, D.J. van, Stolp, W., & Riet, K. van �t (1988). Residence time
distributions in extrusion-cooking. IV. The feed zone of a conical, counter-rotating, twin-
screw extruder processing maize grits. Journal of Food Engineering, 8(3), 157-172.
Jager, T., Zuilichem, D.J. van, Stolp, W., & Riet, K. van �t (1989). Residence time
distributions in extrusion-cooking. V. The compression zone of a counter-rotating, twin-screw
extruder fed with maize grits. Journal of Food Engineering, 9(3), 203-218.
Jager, T., Zuilichem, D.J. van, Swart, J.G. de, & Riet, K. van �t (1991). Residence time
distributions in extrusion-cooking. VII. Modelling of a corotating, twin-screw extruder fed
with maize grits. Journal of Food Engineering, 14(3), 203-239.
Martelli, F.G. (1983). Twin-screw extrusion, New York: Van Nostrand Reinhold Company.
Oberlehner, J., Cassagnau, P. & Michel, A. (1994). Local residence time distribution in a twin
screw extruder. Chemical Engineering Science, 49(23), 3897-3907.
Puaux, J.P., Bozga, G., & Ainser, A. (2000). Residence time distribution in a corotating twin-
screw extruder. Chemical Engineering Science, 55(9), 1641-1651.
Ruyck, H. de (1997). Modelling of the residence time distribution in a twin-screw extruder.
Journal of Food Engineering, 32(4), 375-390.
Wal, D.J. van der, Goffart, D., Klomp, E.M., Hoogstraten, H.W., & Janssen, L. P. B. M.
(1996). Three-dimensional flow modeling of a self-wiping corotating twin-screw extruder.
Part II: the kneading section. Polymer Engineering and Science, 36(7), 912-924.
Yacu, W.A. (1985). Modelling a twin screw co-rotating extruder. Journal of Food
Engineering, 8, 1-21.

Chapter 7
Understanding molecular weight reduction of starch during heating-
shearing processes
Abstract
Recent understanding of the mechanisms underlying the changes in molecular weight of
starch as a function of process parameters during thermomechanical treatment, for example
extrusion, holds promise towards more effective optimization of thermomechanical processes
according to the desired modification of molecular weight. This paper summarizes recent
advances in theoretical understanding and experimental methods. Empirical observations
from extruder experiments can be better understood on this basis.
The current status in this field has opened up potential for developing new equipment in
which the main process parameters, which normally occur simultaneously, can be separated
and optimized. This will create a much wider window for product-oriented process design and
for new products.
This chapter was published as: R.M. van den Einde, A.J. van der Goot, R.M. Boom,
Understanding molecular weight reduction of starch during heating-shearing processes.
(2003). Journal of Food Science, 68(8), 2396-2404.

Chapter 7
98
1. Introduction
Food products are required to have specific properties. Examples are crispiness, strength,
brittleness, stringiness and fracturability. In many cases, obtaining the correct properties is
still trial and error. In today�s fast-moving market, there is clearly a demand for �reverse
process engineering�, the design of process and product formulation according to the desired
properties (Meeuwse et al., 1999).
In many food products, starch is the major carbohydrate component, thereby determining the
product properties. Therefore, it is important to understand the effects of processing and
process parameters on the starch. Many starch-based foods are produced using processes
involving heating and shearing, for example extrusion. Thermomechanical treatment induces
various changes, such as melting of crystallites, disruption of granules and molecular
breakdown of amylopectin (Vergnes et al., 1987). A better understanding of these changes
could lead to improved product quality and new process concepts.
Recent studies have indicated that the molecular weight (distribution) of starch determines
product properties to a large extent (Bruemmer et al., 2002). Thermomechanical breakdown
has been shown to affect the molecular weight distribution significantly (figure 1). Recent
advances in understanding the changes in molecular weight of starch as a function of process
parameters bear potential for optimization of thermomechanical processes according to the
desired product properties (Bruemmer, 1999; Van den Einde et al., 2004a).
Figure 1: Molecular weight distribution of native (a) and heated-sheared waxy corn starch (b).
(Van den Einde et al., 2004b).
Chapter 7
99
The objectives of this work were to review the thermally and thermomechanically induced
molecular breakdown of starch, including the relevance for food product properties, recent
advances in understanding breakdown mechanisms and relation of these mechanisms to
extrusion processes, analytical methods and finally some recommendations for future research
and process design.
2. Effects of macromolecular degradation on product properties
The impact of macromolecular degradation on the properties of the end product has recently
gained more interest of researchers, because it strongly influences many properties.
Bruemmer (1999) and Bindzus et al. (2002b) found that a lower molecular weight decreased
the cold paste viscosity of the extrudate. Mua and Jackson (1997) studied the effect of
molecular weight on functional properties of isolated amylose and amylopectin fractions.
They concluded that molecular weight influenced pasting and gelling properties of the starch,
as well as the degree of retrogradation (table 1).
A lot of work has been done on the effect of Mw on extrudate expansion. Already in the mid-
70s, Mercier and Feillet (1975) found a relation between the amount of water-soluble
carbohydrate after extrusion � which is related to degradation of the starch � and the
expansion of the extruded product. Almost 10 years later, Chinnaswamy and Bhattacharya
(1986) concluded that it was the mean molecular weight of starch that determined expansion
of parboiled rice by heating at 250°C. Cai and Diosady (1993) found that more starch
degradation led to less extrudate expansion. Bruemmer et al. (2002) found that a lower
molecular weight led to less expansion of the extrudate at the die if the water content was
higher than 16%. At 16% water content, a lower molecular weight increased the expansion of
the extrudate.
Not only the average molecular weight, but also the polydispersity (Bruemmer, 1999) and the
average chain length (Mua and Jackson, 1997) were found to influence the product properties.
Table 1 schematically shows the correlation found between average molecular weight,
polydispersity or average chain length and product properties. From table 1, it is clear that our
knowledge at this moment is not yet complete. As molecular weight may influence various
food product properties that are not noted in table 1, more investigations are required to
further unravel structure-properties relations in starch.

100
Table 1: Correlation found between average molecular weight (Mw), polydispersity (pd) or average chain length (DPc) and product properties.
+ = an increase of the independent variable results in an increase of the dependent variable, - implies the opposite dependency. 0 = no significant
correlation was found.
Product property
Expansion Cold paste
viscosity
Water solubility Water
absorption
Gel
fracturability
Gel stringiness RetrogradationAuthors Starch type
Mw pd DPc Mw pd DPc Mw pd DPc Mw pd DPc Mw pd DPc Mw pd DPc Mw pd DPc
Bindzus and
others (2002b)
wheat, corn,
rice
+a) - +
Bruemmer (1999) corn b) + - - + + -
Chinnaswamy
and Bhattacharya
(1986)
rice +
Mua and Jackson
(1997)
corn
amylose
+ + + + 0 +
Mua and Jackson
(1997)
corn
amylopectin
+ 0 + - - - - c)
a)For wheat starch: parabolic relation; for corn and rice starch linear positive correlation.b)Depending on moisture content, see text.c)Depending on measurement method either � or 0.

Chapter 7
101
3. Mechanisms of thermal and shear-induced breakdown
One of the complicating factors in understanding the molecular weight reduction of starch-
water mixtures by heating and shearing is that both thermal treatment without shear and
thermomechanical treatment can induce breakdown. Igura et al. (1997) showed that long-time
heating could lead to more or less the same average degree of breakdown as a short-time
heating-shearing treatment. Although the exact mechanisms of the molecular weight
reduction of starch are not completely clarified, some knowledge is available that provides a
tool in understanding the degradation during thermomechanical treatment and extrusion.
In describing the mechanisms, this review focuses on the effects of heating with or without
shear on starch in the presence of limited water. Dry heating of starch to 160°C or higher
results in extensive depolymerization leading to the so-called �British gums�. This subject has
been extensively reviewed by Tomasik and Wiejak (1989) and receives no further attention in
this paper.
3.1 Thermal breakdown
Although it has been acknowledged that thermal breakdown of starch is important in various
applications such as extrusion (Davidson et al., 1984b), only a few studies have been
conducted on the effect of heating of starch in the presence of a limited amount of water
(<45% w/w). Fujio et al. (1995) and Igura et al. (1997) investigated the effect of heating of
potato, corn and wheat starch at 150°C and 20 or 25 % (db) moisture content on molecular
weight. They concluded that the effect of heating was dependent on heating time and starch
type. A heating time of 15 minutes resulted in a significant decrease in molecular weight of
corn and sweet potato starch. On the other hand, almost no change in molecular weight was
found if potato or wheat starch was heated for 15 minutes. Steeneken and Woortman (2001)
concluded that heating of potato starch at 16% moisture content to 210°C at 10°C/min in a
DSC experiment resulted in appreciable molecular degradation.
The chemical reactions involved in thermal breakdown of low moistened starch are still
largely unknown. It is possible that the same depolymerization reactions occur as during
heating of dry starch. Tegge (1984) suggested that fragments with a 1,6-anhydro-β-D-
glucopyranose end were formed during dry heating (figure 2). Theander and Westerlund
(1987) found that these components were present in heat-processed (180°C for 1-4 hours)
starch and wheat flour. The component was shown to react further with starch and starch

Chapter 7
102
Figure 2: Mechanism of degradation of dry starch at high temperatures (Tegge, 1984).
fragmentation products to give branched structures, resistant to amylolytic enzymes. Other
reactions may involve water. Hydrolysis reactions might occur during heating of low
moistened starch. This hypothesis is in accordance with the results of a recent investigation by
Igura et al. (2001), who concluded that time-temperature history was more effective on the
depolymerization of potato starch at higher moisture content. Martinez-Bustos et al. (1998)
found that addition of calcium hydroxide during extrusion resulted in a lower water solubility
index if extrusion temperature and moisture content were high. Under these conditions,
thermal reactions are expected to be dominant. Apart from lowering the water activity, the
addition of calcium hydroxide might decrease the number of catalytic protons available and
hence decrease the speed of hydrolysis. However, starch can also be broken down by the
hydroxide itself. As no data were given on this aspect, no definite conclusions can be drawn,
but the results obtained by Martinez-Bustos and co-workers might suggest that hydrolysis
occurs. Finally, the increase in polydispersity of starch during extrusion at high temperature

Chapter 7
103
(Bruemmer, 1999) is consistent with the exodegradation caused by acid hydrolysis (Van Soest
et al., 1996), which again suggests that this is indeed a possible reaction.
3.2. Mechanical breakdown
Subjecting low moistened starch to combined heating and shearing may induce a variety of
physical and chemical changes. The granular structure is lost, native crystals are partially or
completely molten and macromolecules can be disrupted (Barron et al., 2000). Barron et al.
(2001) gave a schematic representation of destructuring of waxy corn and smooth pea starch
by shear and heat (figure 3). They concluded that shearing induced fragmentation of granules
and that a homogeneous melt was obtained when temperature was above the melting
temperature and mechanical energy input was higher than 100 J/g. No significant molecular
breakdown was observed as long as no solid/melt transition had taken place.
Figure 3: Schematic representation of starch destructuring under shear and temperature
(Barron et al., 2001).

Chapter 7
104
Amylopectin is more susceptible to mechanical damage caused by shear than amylose.
Davidson et al. (1984a) suggested that amylopectin can not align itself effectively in the
streamlines of the flow in high shear equipment. Della Valle et al. (1996) suggested that the
high sensitivity of amylopectin, compared to amylose, would be due to its higher molecular
weight rather than to its branched structure. Various authors have demonstrated the
susceptibility of amylopectin for extruder shear forces (examples are given further on in this
paper).
As earlier mentioned for thermal breakdown, research done on thermomechanical degradation
has mostly focussed on physical properties; knowledge on the actual chemical reactions
occurring is much less complete. The fragments with a 1,6-anhydro-β-D-glucopyranose end
that were found after dry heating of starch (as described above) were shown to be present in
wheat starch extruded at 200°C and moisture content 10% only, but could not be found in
wheat starch extruded at 105°C and 30% moisture or 150°C and 20% moisture (Theander and
Westerlund, 1987). Again, it could be possible that under those circumstances hydrolysis
reactions dominate, as described in the section on thermal breakdown.
3.3. Time-dependent and time-independent breakdown
Recently, Van den Einde et al. (2004a) showed that the peak stress during heating-shearing
treatment of waxy corn starch with 30% water determines the degree of starch degradation,
provided that thermal effects can be neglected. The suggested mechanism was that of
(covalent) bond breakage by mechanical stress along the polymer chain. From studies using
atomic force microscopy (Grandbois et al., 1999; Beyer, 2000) it can be derived that the force
required for breaking a covalent bond can be considered time-independent within the time
scales generally encountered during heating-shearing processes.
Despite the demonstrated time independence of shear-induced bond breakage, in other studies
the degree of starch breakdown was found to be dependent on or even linearly proportional to
the treatment time (Vergnes et al., 1987; Davidson et al., 1984b; Diosady et al., 1985). Two
factors can be responsible for this. Firstly, thermal effects might play a role. These effects are
time-dependent, as shown by Igura et al. (1997). Furthermore, combined effects of heat and
shear might be important. The theory of Bueche (1960) on degradation of high molecular
weight polymers suggested that applying shear could lower the activation energy for thermal
bond rupture. Arisawa and Porter (1970) suggested in an investigation on breakdown of
polystyrene that shear (mechanical energy) could change the potential energy function for

Chapter 7
105
thermal bond rupture. Another factor is the crystalline nature of the starch. It has been
suggested that the unmolten crystalline parts of the starch are not susceptible to mechanical
action (Diosady et al., 1985) or that the solid melt transition is a prerequisite for extensive
depolymerization by chain cleavage as for example observed under severe extrusion
conditions (Barron et al., 2001). The melting of these crystalline parts was shown to be time-,
temperature- and shear dependent (Barron et al., 2002; Barron et al., 2000; Zheng and Wang,
1994). Therefore, although the degradation of starch itself is time-independent, increasing the
processing time leads to further melting and hence increases the degree of macromolecular
degradation. On the other hand, in extrusion experiments it was found that melting occurred
in a very short transition section as soon as the first restrictive screw element was encountered
(Colonna et al., 1983), probably due to the high local shear. This suggests that the effect
described above may not be highly important during extrusion processes.
3.4 Selectivity of breakdown
Baud et al. (1999) found that only the larger starch molecules were broken down during
extrusion. If we assume that the force on a molecule can be interpreted roughly as the product
of stress and frontal area of the molecule, we can understand this finding. As soon as the
molecule is broken down, its frontal area is smaller and the force hence will be smaller. For
each value of a stress, a certain critical molecular weight can be defined, below which the
molecules will not be broken down because the force is too low. Hence, mechanical
degradation is expected to be highly selective, as shown in figure 4.
4. Effects of extrusion on macromolecular degradation
With the findings described above it is possible to understand some of the most important
effects of extruder parameters such as screw speed on molecular weight reduction found
during extrusion trials described in literature. Table 2 gives an overview of the effects of all
parameters described in this section as found in earlier studies.
4.1. Effect of screw speed and temperature
The effect of screw speed on starch breakdown in a single screw extruder, which was highly
dependent on temperature, as found by Davidson et al. (1984a), can be understood from the
two mechanisms described above. At the low moisture contents that they used (table 2),

Chapter 7
106
Figure 4: Example of molecular weight distribution of starch and selective breakdown. Large
molecules (shaded area) will be broken down until they reach a certain critical molecular
weight. The frontal area is then too low to cause any further degradation. The amount of
material with lower molecular weight is necessarily increased, with the fragments of the large
molecules. Increasing the shear stress will decrease the critical molecular weight.
stresses are high as long as the temperature is reasonably low. Hence, increasing the screw
speed increases the maximal stress and more degradation takes place. The effect is less
pronounced at 149°C probably because thermal effects already become more important. At
177°C the viscosity is most likely too low for significant mechanical degradation so that
thermal breakdown becomes the dominant mechanism. Then, increasing the screw speed
decreases the residence time so that less thermal breakdown takes place. The latter effect is
more pronounced at higher moisture content as water is probably involved in the reaction.
Govindasamy et al. (1996) found that screw speed increased the degree of degradation of
sago starch in a twin screw extruder if the water content was high. As no viscosity data were
given, only speculation on their findings is possible. Starch breakdown was in this study
highly correlated to the degree of gelatinization, suggesting that this transition was a
prerequisite for depolymerization, as earlier described in the section on time-dependent and
time-independent breakdown.
0
1
2
3
4
5
6
7
1.00E+ 05 1.00E+ 06 1.00E+ 07 1.00E+ 08 1.00E+ 09
Mw
d w
/ d
Mw
Mw, crit
increasing maximal shear stress
Chapter 7
107
4.2. Effect of re-extruding
Willett et al. (1997) conducted an interesting study on extruding waxy corn starch twice. The
first extrusion run caused the molecular weight distribution to shift completely and Mw could
be related well to mechanical energy input; re-extruding the material from the first run
resulted only in a very small fraction of material changing from one molecular weight fraction
towards the other. These results are again consistent with mechanical and (limited) thermal
breakdown respectively. In the first pass, the high maximal stresses in the first extruder run
caused the large molecules to breakdown completely. In the second pass, no additional
mechanical breakdown could be obtained, probably due to reduced melt viscosity.
Furthermore, higher stresses are required to break down lower molecular weight material
thermomechanically (Van den Einde et al., 2004a). Hence, the degradation during the second
run was mainly or completely thermal, resulting in breakdown of only small fractions.
4.3. Effect of SME
The specific mechanical energy (SME) is an often-used parameter to quantify the amount of
shear that is put on material during extrusion (table 2). It is defined as (Bruemmer, 1999):
m
d
QM
SMEω⋅
= (J/kg) [1]
where Md denotes the torque (N·m), ω denotes the angular velocity (s-1) and Qm denotes the
mass flow (kg/s). For a continuously operated system, SME is closely related to (but not
identical to) the maximal stresses during the operation, as these largely determine the torque
on the engine. For that reason, it is clear that a higher SME during extrusion generally leads to
more breakdown of the starch as found in many studies (table 2).
4.4. Effect of amylose content
Using starch having a higher amylose content seems to have two, partially counter-acting,
influences. Firstly, the higher the amylose content of corn starch, the lower is the temperature
above which thermal breakdown takes place (Bruemmer, 1999). Secondly, in certain studies it
was suggested that amylose itself is only susceptible to a small extent or even not at all
susceptible to shear-induced breakdown so that the relative decrease in molecular weight will
be less (Baud et al., 1999; Chinnaswamy and Hanna, 1990; Della Valle et al., 1996). Baud et
al. (1999) suggested that molecules having a molecular weight less than 5·106 g/mole were

108
Table 2: Effects of temperature, screw speed, moisture content, amylose content and specific mechanical energy (SME) on the macromolecular
degradation during extrusion as measured by chromatographic methods and intrinsic viscosity. Abbreviations: T = temperature, N = screw speed,
MC = moisture content, TSE = twin screw extruder, co = co-rotating. DE = dextrose equivalent measurement; GPC = gel permeation
chromatography; LPSEC = low pressure size exclusion chromatography; GFC = gel filtration chromatography; other analysis abbreviations: see
text; + = an increase of the independent variable results in an increase of the degree of breakdown, - implies the opposite dependency.
Author Type ofstarch
Extrudertype
Measuringmethod
T range(°C)
T effect N range(rpm)
N effect MCrange(%)
MCeffect
%amyloserange
%amyloseeffect
SMErange(105 J/kg)
SMEeffect
Baud et al.(1997)
corn1) TSE, co HPSECMALLS
100-180 unclear 20-33 unclear 0-70 - 3.6-21 +
Bindzus et al.(2002b)
wheat,corn,rice
TSE, co GPC 90-150 2) 190-390 2) 16-24 2) 2.9-13 +
Bruemmer(1999)
corn TSE, co LPSEC 100-180180-200
03)
+4)
5) 3.2-9.4 +
Bruemmer(1999)
waxycorn
TSE, co LPSEC 2.2-21 +
Bruemmer(1999)
highamylosecorn
TSE, co LPSEC 100-160>160
0+4)
5) 3.6-14 unclear
Cai et al.(1995)
wheat TSE, co HPSEC 100-120140-160
+-6)
+7)
200-300 + 25-30 -
Chinnaswamyand Hanna(1990)
corn1) SSE GPC 110-150150-200
+-
10-30 - 0-70 8)
Davidson etal. (1984a)
wheat SSE GPC;intrinsicviscosity
121-177 9) 50-100 +10)
-10)20-25 -

109
Govindasamyet al. (1996)
sago TSE, co HPSEC;DE
81-149 + 315-484 -6)
+7)34-47 -
Guha and Ali(2002)
rice TSE, co GPC 80-100 +11)
-12)5.0-28.6 13)
Orford et al.(1993)
waxycorn
TSE, co SEC;intrinsicviscosity
130-180 0 150-200 + 20-25 0 3.6-7.9 +
Della Valle etal. (1996)
corn1) TSE, co LPSEC;intrinsicviscosity
102-19014)
2) 80-24014)2) 20.5-
3614)2) 0-70 - 15) +
Willett et al.(1997)
waxycorn
TSE, co GPC;MALLS
0-17 +
Wen et al.(1990)
corn16) TSE, co GFC 100-200 - 100-300 + 20-30 -
Yamada et al.(1990)
potato TSE GPC 110-230 +
1)With various amylose contents (0-70%).2)Variable was varied, but not any conclusion was drawn from it, as the authors defined treatments in terms of SME.3)Product temperature increased somewhat the polydispersity, but not the average molecular weight.4)Product temperature also strongly increased polydispersity in this temperature range.5)Amylose fraction of the starch was not broken down.6)At the lower moisture content(s).7)At the higher moisture content(s).8)No direct conclusion was drawn; amylose fraction degraded less than amylopectin fraction.9)Depending on moisture content and screw speed positive or negative10)Determined by GPC: effect of screw speed was always positive; determined by intrinsic viscosity: effect of screw speed positive or negative, depending onmoisture content and screw speed (see text).11)If amylose was present in the rice starch.12)If no amylose was present in the rice starch (waxy rice).13)Amylose content determined temperature of maximal degradation (see 11) and 12)).14)Range was different for different amylose contents.15)Defined as �less severe� or �more severe� conditions (SME value for less severe or more severe treatment depending on amylose content of the starch).16)Corn meal was used; the authors suggested that the extent of starch fragmentation might be greater using corn meal than using pure corn amylopectin.

Chapter 7
110
almost unsusceptible to degradation during extrusion in a twin screw extruder at screw speeds
up to 240 rpm. Understanding the overall effect of amylose content remains difficult.
Therefore, more research is needed in order to understand completely the effect of amylose on
the degradation of amylopectin and whether or not it is degraded itself.
4.5. Degradation along the extruder screw
During extrusion, degradation progresses along the screw (Colonna et al., 1983; Cai et al.,
1995). This is not contrary to the instantaneous breakdown by shear described earlier in this
paper because of two reasons. Firstly, thermal effects probably take place all along the screw.
Secondly, the shear and elongation rates in the extruder are different at various locations in
the extruder. The degradation pattern therefore becomes complex after the first crystallites
have molten as on one hand viscosity and stress decrease due to the breakdown of the
macromolecules, but on the other hand the amount of material susceptible to mechanical
degradation increases due to further melting. Furthermore, the breakdown will be
inhomogeneous, because the shear rate, and thus the stress, strongly varies locally in the
extruder. We can therefore expect that the degradation continues in time along the length of
the extruder, although the local degradation process itself is time-independent.
5. Analytical issues
As mentioned earlier, molecular breakdown of starch has strong effects on the properties of
the final product. However, to quantify molecular breakdown itself and its relation to product
properties, it is important to have direct analytical methods available.
Which method is most useful to measure the starch molecular weight (distribution) and thus
starch degradation depends on the type of breakdown that needs to be characterized. While
certain methods can be used to measure endodegradation, other ones are useful for
determining exodegradation. An overview of the methods is given below.
Intrinsic viscosity. The advantage of using intrinsic viscosity is the good reproducibility
compared to chromatography (Millard et al., 1997). Furthermore, intrinsic viscosity is a
property that is closely related to parameters important for product properties. The method is
sensitive towards endodegradation. It has been suggested (Colonna et al., 1984; Zhiqiang et
al., 1999; Fujio et al., 1995) that the intrinsic viscosity is directly related to the viscosity
averaged molecular weight Mv according to the Mark-Houwink relation:

Chapter 7
111
[ ] αη MvK ⋅= (ml/g) [2]
The parameters K and α depend on starch type and amylose content. Recently, Millard et al.
(1997) showed that intrinsic viscosity of waxy corn starch in DMSO could even be correlated
well to the weight-average molecular weight Mw found in chromatographic measurements
according to a Mark-Houwink type equation.
Chromatography and laser light scattering. Chromatographic methods can be applied to
obtain information on the molecular weight distribution. Using High Performance Size
Exclusion Chromatography (HPSEC) measurements, it is possible to describe changes in the
molecular weight distribution by changes in the weight fractions of several molecular size
ranges defined in terms of retention time (Cai et al., 1995). HPSEC is often combined with
laser light scattering detection (HPSEC MALLS, where MALLS denotes Multi Angle Laser
Light Scattering), which allows direct determination of the molecular weight of the passing
fraction. Still, the determined molecular mass should not be interpreted as highly accurate
absolute values but only as a good indication (Van Soest and Kortleve, 1999) due to the fact
that recovery is certainly not 100%. Endodegradation can be measured using HPSEC
MALLS. Measurement of exodegradation is also possible, provided that the fragments that
arise are large compared to the molecules of the solvent used. HPSEC MALLS systems were
used successfully in various studies to determine starch molecular weight distribution as a
function of applied processing (Baud et al., 1999; Willett et al., 1997; Van Soest et al., 1996;
Van Soest and Kortleve, 1999), although both extremely large and very small molecular
weight fractions might not be detected.
Field flow fractionation. Various sorts of field flow fractionation (FFF) coupled with SEC
have already been applied for the analysis of amylopectin. Practically, FFF uses one added
flux perpendicular to the main elution direction. The main usual fluxes are temperature
gradient, gravitation (sedimentation) or cross flow (Roger et al., 2001). The eluted fractions
can be detected by MALLS. Sedimentation FFF allows separation even for molar masses
larger than 109 Da (Hanselmann et al., 1996). Cross flow FFF was shown to be promising for
the fractionation of starch polysaccharides (Roger et al., 2001), although the elution behavior
of the largest molecules still requires more investigation (Van Bruijnsvoort et al., 2001).
Water solubility index (WSI). Some authors used the WSI as a measure for starch
degradation or suggested that changes in WSI were due to the breakdown of starch (Vergnes
et al., 1987; Orford et al., 1993; Martinez-Bustos et al., 1998; Govindasamy et al., 1996;
Davidson et al., 1984a; Choudhury and Gautam, 1998). The advantage of using WSI as a

Chapter 7
112
degradation measure is that it is correlated to the presence of low molecular weight
compounds and hence to the degree of exodegradation. However, the use of this measure has
also a major disadvantage. WSI is strongly positively correlated to the degree of gelatinization
(Cai and Diosady, 1993). Hence, it is best to extract the degradation effect from this analysis
by measuring the degree of gelatinization separately. WSI is directly suitable to measure to
the degree of exodegradation if all products compared are fully gelatinized.
Dextrose Equivalent (DE). DE values can be measured to get an impression of the formation
of very small molecular weight compounds (Govindasamy et al., 1996). DE measurements on
extruded starch are not often carried out, because mechanical degradation is not expected to
result in formation of small molecular weight products. Therefore, DE is useful as an
additional measurement only. On the other hand, DE measurements can be highly important
when extrusion trials in the presence of enzymes are carried out (see, for example, Linko et
al., 1983).
Considering the measurement methods described in this chapter, it is clear that no single
measurement exists that provides a full picture of starch degradation. Therefore, combining
different methods is currently the best way to obtain a complete view of the molecular
breakdown of starch.
6. Control of shear-induced breakdown in extruders
As explained earlier, control of molecular weight reduction during extrusion is important to
ensure specific product characteristics. Combining trial and error type experiments with
estimations on the degradation can be useful in this respect. The maximal stress, which was
shown to determine mechanical breakdown, can be calculated using estimated shear and
elongation rates at different places in the extruder and the estimated viscosity of the material.
This chapter deals with both issues. Thermal effects are not taken into account, as these have
not been quantified well yet.
6.1. Estimating shear and elongation rates in the extruder
The shear rate at different locations in the extruder can be obtained from calculations or
measurements. Estimating the shear rate in transport, single lead and reverse elements can be
done using the equations derived by Martelli (1983) and Yacu (1985). The calculation of

Chapter 7
113
shear rate in paddle sections is more complex. In the last decade, advances have been made in
numerical calculation of the flow patterns in these elements, for both regular paddles and
three-tip kneading blocks (Bravo et al., 2000; Bruce et al., 1997; Ishikawa et al., 2000;
Yoshinaga et al., 2000). However, only a few studies focussed on the average shear rate in
these elements or on the shear rate distribution at different locations in the element. Van der
Wal et al. (1996) estimated the mean shear and elongation rates in a paddle as a function of
throughput and screw speed by solving the equations for isothermal laminar flow of a
Newtonian incompressible fluid without body forces. Mohamed et al. (1990) proposed an
elegant but laborious experimental method to estimate the mean shear rate during extrusion.
Their method requires off-line measurement of rheological properties of both a Newtonian
and a non-Newtonian liquid combined with extruder experiments.
Velocity profile measurements also enable calculation of the shear rate. Table 3 gives an
overview on the technologies used so far to measure velocity profiles in extruders. All these
measurements were done on model extruders with a model fluid as flow material, as described
in the table.
Table 3: Methods for measuring velocity and flow profiles in extruders, including type of
extruder, model material and limitations. SSE = single screw extruder, TSE = twin screw
extruder, co = co-rotating.
Author Method Extruder type Model material Limitations
McCarthy et al.
(1992);
Agemura et al.
(1995)
MRI (Magnetic
Resonance Imaging)
SSE CMC solution extruder constructed
from non-magnetic
materials
Bakalis and
Karwe (1997);
Karwe and
Sernas (1996)
LDA (Laser Doppler
Anemometry)
TSE, co corn syrup only for optically
transparent materials
Carneiro et al.
(1999)
video camera TSE, co silicone oil acrylic barrel; only for
optically transparent
materials

Chapter 7
114
Only limited knowledge is available on the rates of exchange between the high and low shear
zones of the extruder. Calculation of the pathways that the starch molecules follow through
the extruder would be useful in this respect. However, so far only for a single-screw extruder
such a type of calculation was done (Reed and Baird, 1992), which was unfortunately not
used for interpretation in terms of pathways through high- and low-shear spots.
6.2. Estimating melt viscosity and shear and elongation stress
In food extrusion rheology, the key issue is obtaining the required data. The essential
difficulty in measuring melt rheology is that the rheological properties are affected by kinetic
phenomena (Ghoshdastidar et al., 2000). Modeling the rheology of starch (based) melts has
already been attempted for a long time. The first interesting viscosity model for cooking
dough was created by Remsen and Clark (1978). It described viscosity, based on power-law
behavior, as a function of shear rate, temperature and time-temperature history and included
viscosity changes caused by temperature-induced reactions.
MacKey et al. (1989) suggested correcting the melt viscosity with a term describing the shear
history of the material or more precisely the product of shear rate and time. Although the large
number of parameters made the model somewhat difficult to use in practical situations, it has
contributed to the awareness that shear history is important in understanding melt rheology.
The use of slit dies allows measurement of the viscosity of the end product on-line and
collection of information on the extensional viscosity (Bhattacharya et al., 1994). Such a die
was used in many studies (Bhattacharya et al., 1994; Chang et al., 1999; Lai and Kokini,
1990; McMaster et al., 1987; Parker et al., 1990; Seethamraju and Bhattacharya, 1994; Della
Valle et al., 1995; Wang et al., 1990) and was shown to be useful in on-line control of the
extrusion process as product properties and end product melt viscosity were often well-
correlated (Bindzus et al., 2002a). A difficulty in using slit die data for estimating the peak
stress is that the viscosity of the end product is in most cases (much) lower than the peak
viscosity during the extrusion process, as molecular degradation and granule disruption along
the extruder reduce the viscosity during treatment.
A solution to this problem can be off-line measurement of the rheological properties of the
material in a rheometer. Vergnes and Villemaire (1987) used a self-built capillary rheometer
with a Couette pre-shearing zone to derive expressions for the rheology of molten corn starch
as a function of temperature T, moisture content MC and energy input history W, i.e. how

Chapter 7
115
much mechanical energy the material had received in the pre-shearing zone prior to the
measurement. The equation derived was:
( ) ( ) ( ) 1,00
00
11exp −⋅
−−−−
−= MCTma WWMCMC
TTREK γδβη (Pa·s) [3]
where:
( ) MCTMCTMCTm ⋅++= 321, βββ (-) [4]
Values of β, β1, β2, β3, δ, K0 and E/R were determined in their work. The model was recently
extended to mixtures of wheat starch and glycerol and water (Martin et al., 2003). Such a
model may be useful in calculating the peak viscosity if the mechanical energy input before
reaching this viscosity can be estimated.
In extruders, forces are not only put onto the material due to shear flow, but also due to
elongation flow. Data on extensional viscosity of starch (based) melts are scarce. However,
the extensional viscosity can be calculated from the shear viscosity η using the Trouton ratio
Tr (Jones et al., 1987):
( ) ( ) Tre ⋅= εηεη 3 [5]
The Trouton ratio was measured for extruded corn meal (Bhattacharya et al., 1994) resulting
in Tr = 20-50. Thus, the extensional viscosity of the material is much higher than the shear
viscosity. Average elongation rates in a twin screw extruder were shown to be approximately
one tenth of the shear rates, depending on screw speed and throughput (Van der Wal et al.,
1996). Substituting the values found by Bhattacharya and by Van der Wal into equation [5]
reveals that the resulting extensional stress can be high compared to the shear stress, making it
important to take it into account. Hence, it is important that elongation stress is taken into
account.
7. Process design for selective polymer breakdown
In modern process design, the general trend is towards selective, energy efficient and small
processes (Meeuwse et al., 1999). Clearly, considering the molecular breakdown of starch and
probably also other high molecular weight polymers, the current extrusion process does not
match all of these criteria. The main disadvantage of the extruder, as shown above, is the
inhomogeneous shear and elongation rate, leading to non-selective breakdown. Furthermore,

Chapter 7
116
this inhomogeneity also makes it difficult to avoid high stress spots in case that breakdown is
undesired.
As earlier mentioned, selective starch breakdown may be possible (figure 4), as long as no
thermal breakdown takes place. This would require a completely new range of equipment.
Instead of various flow types within one process, more defined flow would be necessary. A
process principle would consist of the following steps: 1. the starch is transformed into a melt
using limited shear and relatively low temperature (in order to prevent random thermal
degradation); 2. the starch melt receives a homogeneous high shear or elongation stress for a
short time. The maximum value of the stress attained determines the degree of breakdown. A
possible option for such a process would be a slowly rotating chamber to induce quick
melting in a well-defined shear field at relatively low temperature combined with a capillary
to provide a short-term precise shear or elongation stress. This type of processes would also
allow shear stress to be a new design parameter, which is in turn controllable by optimizing
the shear and elongation rate.
8. Conclusion
Recent advances in fundamental understanding and control of changes of starch and product
properties include development of equipment in which the real process parameters such as
temperature, time and shear force can be separated and optimized as well as the development
of analytical methods. Investigations with separated process parameters can create a wider
window for product-oriented process design and for new products. There are, however, gaps
in the knowledge on the following subjects. Firstly, more investigations are required to further
qualify and quantify the relations between molecular degradation and product properties.
These investigations are not trivial, as �well-defined starch� does not exist. Controlled
selective (thermo)mechanical degradation, as described in this paper, might help creating
better-defined starch in future. Secondly, if the relations described above are to be applied to
existing processes, e.g. extrusion, more knowledge is required on flow fields and particle
trajectories in the process equipment used. Investigations on these two subjects could lead to
improved process concepts as well as improved product quality and would therefore be
important to be carried out in the near future.

Chapter 7
117
Symbols list
Ea activation energy (J/mole)
K constant in Mark-Houwink equation (ml g-1 Da-α)
K0 consistency factor at T = T0 and MC = MC0 (Pa·sm)
m pseudoplastic index (-)
MC moisture content (%)
MC0 reference moisture content (%)
Md torque (N·m)
Mv viscosity averaged molecular weight (Da)
Mw weight averaged molecular weight (Da)
Qm mass flow rate (kg/s)
R gas constant (= 8.31 J/mole, K)
T temperature (K)
T0 reference temperature (K)
Tr Trouton ratio (-)
W mechanical energy input (J/m3)
W0 reference mechanical energy input (J/m3)
Greek symbols
α exponent in Mark-Houwink equation (-)
β factor describing dependence of viscosity on moisture content MC (%-1)
β1 factor describing dependence of pseudoplastic index m on temperature T (K-1)
β2 factor describing dependence of pseudoplastic index m on moisture content
MC (%-1)
β3 factor describing dependence of pseudoplastic index m on the product of
temperature and moisture content T·MC (K-1%-1)
δ factor describing dependence of viscosity on mechanical energy input (m3/J)
ε elongation rate (s-1)
η viscosity (Pa·s)
ηe extensional viscosity (Pa·s)
[η] intrinsic viscosity (ml/g)

Chapter 7
118
ω angular velocity (s-1)
References
Agemura, C.K., Kauten, R.J., & McCarthy, K.L. (1995). Flow fields in straight and tapered
screw extruders using Magnetic Resonance Imaging. Journal of Food Engineering, 25, 55-72.
Arisawa, K., & Porter, S. (1970). The degradation of polystyrene during extrusion. Journal of
Applied Polymer Science, 14, 879-896.
Bakalis, S., & Karwe, M.V. (1997). Velocity field in a twin-screw extruder. International
Journal of Food Science and Technology, 32, 241-253.
Barron, C., Buleon, A., Colonna, P., & Valle, G. Della (2000). Structural modifications of low
hydrated pea starch subjected to high thermomechanical processing. Carbohydrate Polymers,
43, 171-181.
Barron, C., Bouchet, B., Valle, G. Della, Gallant, D.J., & Planchot, V. (2001). Microscopical
study of the destructuring of waxy maize and smooth pea starches by shear and heat at low
hydration. Journal of Cereal Science, 33, 289-300.
Barron, C., Valle, G. Della, Colonna, P., & Vergnes, B. (2002). Energy balance of low
hydrated starches transition under shear. Journal of Food Science, 67, 1426-1437.
Baud, B., Colonna, P., Valle, G. Della, & Roger, P. (1999). Macromolecular degradation of
extruded starches measured by HPSEC-MALLS. Biopolymer Science: Food and Non Food
Applications / Les Colloques de l'INRA, 91, 217-221.
Beyer, M.K. (2000). The mechanical strength of a covalent bond calculated by density
function theory. Journal of Chemical Physics, 112, 7307-7312.
Bhattacharya, M., Padmanabhan, M., & Seethamraju, K. (1994). Uniaxial extensional
viscosity during extrusion cooking from entrance pressure drop method. Journal of Food
Science, 59, 221-226.
Bindzus, W., Fayard, G., Lengerich, B. van, & Meuser, F. (2002a). Application of an in-line
viscometer to determine the shear stress of plasticised wheat starch. Starch / Staerke, 54, 243-
251.
Bindzus, W., Fayard, G., Lengerich, B. van, & Meuser, F. (2002b). Description of extrudate
characteristics in relation to the shear stress of plasticised starches determined in-line. Starch /
Staerke, 54, 252-259.

Chapter 7
119
Bravo, V.L., Hrymak, A.N., & Wright, J.D. (2000). Numerical simulation of pressure and
velocity profiles in kneading elements of a co-rotating twin screw extruder. Polymer
Engineering and Science, 40, 525-541.
Bruce, D., Wilson, M., & Generalis, S. (1997). Flow field analysis of both the trilobal element
and mixing disc zones within a closely intermeshing, co-rotating twin-screw extruder.
International Polymer Processing, 12, 323-330.
Bruemmer, T. (1999). Charakterisierung molekularer Strukturparameter kochextrudierter
Maisstaerken und Ermittlung von Struktur-Eigenschaftsbeziehungen. [PhD dissertation].
Berlin: Technischen Universitaet Berlin.
Bruemmer, T., Meuser, F., Lengerich, B. van, & Niemann, C. (2002). Expansion and
functional properties of corn starch extrudates related to their molecular degradation, product
temperature and water content. Starch / Staerke, 54, 9-15.
Bruijnsvoort, M. van, Wahlund, K.G., Nilsson, G., & Kok, W.T. (2001). Retention behaviour
of amylopectins in asymmetrical flow field-flow fractionation studied by multi-angle light
scattering detection. Journal of Chromatography A, 925, 171-182.
Bueche, F. (1960). Mechanical degradation of high polymers. Journal of Applied Polymer
Science, 4, 101-106.
Cai, W., & Diosady, L.L. (1993). Modelling of expansion and water solubility index of wheat
starch during extrusion cooking. Acta Alimentaria, 22, 181-192.
Cai, W., Diosady, L.L., & Rubin, L.J. (1995). Degradation of wheat starch in a twin-screw
extruder. Journal of Food Engineering, 26, 289-300.
Carneiro, O.S., Caldeira, G., & Covas, J.A. (1999). Flow patterns in twin-screw extruders.
Journal of Materials Processing Technology, 92-93, 309-315.
Chinnaswamy, R., & Bhattacharya, K.R. (1986). Characteristics of gel-chromatographic
fractions of starch in relation to rice and expanded rice-product quality. Starch / Staerke, 38,
51-57.
Chinnaswamy, R., & Hanna, M.A. (1990). Macromolecular and functional properties of
native and extrusion cooked starch. Cereal Chemistry, 67, 490-499.
Chang, Y.K., Martinez-Bustos, F., Park, T.S., & Kokini, J.L. (1999). The influence of specific
mechanical energy on corn meal viscosity measured by an on-line system during twin-screw
extrusion. Brazilian Journal of Chemical Engineering, 16, 285-295.
Choudhury, G.S., & Gautam, A. (1998). Comparative study of mixing elements during twin-
screw extrusion of rice flour. Food Research International, 31, 7-17.

Chapter 7
120
Colonna, P., Melcion, J.P., Vergnes, B., & Mercier, C. (1983). Flow, mixing and residence
time distribution of maize starch within a twin-screw extruder with a longitudinally split
barrel. Journal of Cereal Science, 1, 115-125.
Colonna, P., Doublier, J.L., Melcion, J.P., Mondredon, F. de, & Mercier, C. (1984). Extrusion
cooking and drum drying of wheat starch. I. Physical and macromolecular modifications.
Cereal Chemistry, 61(6), 538-543.
Davidson, V.J., Paton, D., Diosady, L.L., & Larocque, G. (1984a). Degradation of wheat
starch in a single-screw extruder: characteristics of extruded starch polymers. Journal of Food
Science, 49, 453-458.
Davidson, V.J., Paton, D., Diosady, L.L., & Rubin, L.J. (1984b). A model for mechanical
degradation of wheat starch in a single-screw extruder. Journal of Food Science, 49, 1154-
1157.
Diosady, L.L., Paton, D., Rosen, N., Rubin, L.J., & Athanassoulias, C. (1985). Degradation of
wheat starch in a single-screw extruder: mechano-kinetic breakdown of cooked starch.
Journal of Food Science, 50, 1697-1699, 1706.
Einde, R.M. van den, Bolsius, A., Soest, J.J.G. van, Janssen, L.P.B.M., Goot, A.J. van der, &
Boom, R.M. (2004a). The effect of thermomechanical treatment on starch breakdown and the
consequences for process design. Carbohydrate Polymers, 55(1), 57-63. (Chapter 2 of this
thesis).
Einde, R.M. van den, Linden, E. van der, Goot, A.J. van der, & Boom, R.M. (2004b). A
mechanistic model on the relation between molecular structure of amylopectin and
macromolecular degradation during heating-shearing processes. Accepted for publication in
Polymer Degradation and Stability. (Chapter 3 of this thesis).
Fujio, Y., Igura, N., & Hayakawa, I. (1995). Depolymerization of molten-moisturized-starch
molecules by shearing force under high temperature. Starch / Staerke, 47, 143-145.
Ghoshdastidar, P.S., Ghai, G., & Chhabra, R.P. (2000). Computer simulation of three-
dimensional transport during moistened defatted soy flour processing in the metering section
of a single-screw extruder. Proceedings of the Institution of Mechanical Engineers, 214, 335-
349.
Govindasamy, S., Campanella, O.H., & Oates, C.G. (1996). High moisture twin-screw
extrusion of sago starch: 1. Influence on granule morphology and structure. Carbohydrate
Polymers, 30, 275-286.

Chapter 7
121
Grandbois, M., Beyer, M.K., Rief, M., Clausen-Schaumann, H., & Gaub, H.E. (1999). How
strong is a covalent bond? Science, 283, 1727-1730.
Guha, M., & Ali, S.Z. (2002). Molecular degradation of starch during extrusion cooking of
rice. International Journal of Food Properties, 5, 509-521
Hanselmann, R., Burchard, W., Ehrat, M., & Widmer, H.M. (1996). Structural properties of
fractionated starch polymers and their dependence on the dissolution process.
Macromolecules, 29, 3277-3282.
Igura, N., Hayakawa, I., & Fujio, Y. (1997). Effect of longer heating time on
depolymerization of low moisturized starches. Starch / Staerke, 49, 2-5.
Igura, N., Katoh, T., Hayakawa, I., & Fujio, Y. (2001). Degradation profiles of potato starch
melts through a capillary type viscometer. Starch / Staerke, 53, 623-628.
Ishikawa, T., Kihara, S.I., & Funatsu, K. (2000). 3-D Numerical simulations of nonisothermal
flow in co-rotating twin screw extruders. Polymer Engineering and Science, 40, 357-364.
Jones, D.M., Walters, K., & Williams, P.R. (1987). On the extensional viscosity of mobile
polymer solutions. Rheologica Acta, 26, 20-30.
Karwe, M.V., & Sernas, V. (1996). Application of Laser Doppler Anemometry to measure
veolocity distribution inside the screw channel of a twin-screw extruder. Journal of Food
Process Engineering, 19, 135-152.
Lai, L.S., & Kokini, J.L. (1990). The effects of extrusion operating conditions on the on-line
apparent viscosity of 98% Amylopectin (Amioca) and 70% Amylose (Hylon 7) corn starches
using extrusion. Journal of Rheology, 34, 1245-1266.
Linko, P., Linko, Y.Y., & Olkku, J. (1983). Extrusion cooking and bioconversions. Journal of
Food Engineering, 1, 243-257.
Mackey, K.L., Ofoli, R.Y., Morgan, R.G., & Steffe, J.F. (1989). Rheological modeling of
potato flour during extrusion cooking. Journal of Food Process Engineering, 12, 1-11.
Martelli, F.G. (1983). Twin-screw extrusion. New York: Van Nostrand Reinhold Company.
Martin, O., Averous, L., & Valle, G. Della. (2003). In-line determination of plasticized wheat
starch viscoelastic behavior: impact of processing. Carbohydrate Polymers, 53,169-182.
Martinez-Bustos, F., Chang, Y.K., Bannwart, A.C., Rodriguez, M.E., Guedes, P.A., & Gaiotti
E.R. (1998). Effects of calcium hydroxide and processing conditions on corn meal extrudates.
Cereal Chemistry, 75, 796-801.

Chapter 7
122
McCarthy, K.L., Kauten, R.J., & Agemura, C.K. (1992). Application of NMR imaging to the
study of velocity profiles during extrusion processing. Trends in Food Science and
Technology, 3, 215-219.
McMaster, T.J., Senouci, A., & Smith, A.C. (1987). Measurement of rheological and
ultrasonic properties of food and synthetic polymer melts. Rheologica Acta, 26, 308-315.
Meeuwse, F.M., Grievink, J., Verheijen, P.J.T., & Stappen, M.L.M. van der. (1999).
Conceptual design of processes for structured products. 5th international conference on
foundations of computer-aided process design (FOCAPD 1999), Colorado.
Mercier, C., & Feillet P. (1975). Modification of carbohydrate components by extrusion-
cooking of cereal products. Cereal Chemistry, 52, 283-297.
Millard, M.M., Dintzis, F.R., Willett, J.L., & Klavons, J.A. (1997). Light-scattering molecular
weights and intrinsic viscosities of processed waxy maize starches in 90% dimethyl sulfoxide
and H2O. Cereal Chemistry, 74, 687-691.
Mohamed, I.O., Ofoli, R.Y., & Morgan, R.G. (1990). Modeling the average shear rate in a co-
rotating twin screw extruder. Journal of Food Process Engineering, 12, 227-246.
Mua, J.P., & Jackson, D.S. (1997). Relationships between functional attributes and molecular
structures of amylose and amylopectin fractions from corn starch. Journal of Agricultural and
Food Chemistry, 45, 3848-3854.
Orford, P.D., Parker, R., & Ring, S.G. (1993). The functional properties of extrusion-cooked
waxy-maize starch. Journal of Cereal Science, 18, 277-286.
Parker, R., Ollett, A.L., & Smith, A.C. (1990). Starch melt rheology: measurement, modelling
and applications to extrusion processing. In P. Zeuthen. Processing and quality of foods
(p. 1.290-1.295). London: Elsevier.
Reed, C.M., & Baird, D.G. (1992). Numerical modeling of cooking extrusion of food doughs.
In J.L. Kokini, C.T. Ho, & M.V. Karwe. Food extrusion science and technology (p. 307-321).
New York: Marcel Dekker, Inc.
Remsen, C.H., & Clark, J.P. (1978). A viscosity model for a cooking dough. Journal of Food
Process Engineering, 2, 39-64.
Roger, P., Baud, B., & Colonna, P. (2001). Characterization of starch polysaccharides by flow
field-flow fractionation-multi-angle laser light scattering-differential refractometer index.
Journal of Chromatography A, 917, 179-185.
Seethamraju, K., & Bhattacharya, M. (1994). Effect of ingredients on the rheological
properties of extruded corn meal. Journal of Rheology, 38, 1029-1044.

Chapter 7
123
Soest, J.J.G. van, Benes, K., Wit, D. de, & Vliegenthart, J.F.G. (1996). The influence of
starch molecular mass on the properties of extruded thermoplastic starch. Polymer, 37, 3543-
3552.
Soest, J.J.G. van, & Kortleve, P.M. (1999). The influence of maltodextrins on the structure
and properties of compression-molded starch plastic sheets. Journal of Applied Polymer
Science, 74, 2207-2219.
Steeneken, P.A.M., & Woortman, A.J.J. (2001). Identification of thermal transitions in low-
moisture starch systems by preparative DSC. Lecture given at the Starch Workshop,
Wageningen.
Tegge, G. (1984). Staerke und Staerkederivate. Hamburg: Behr�s Verlag.
Theander, O., & Westerlund, E. (1987). Studies on chemical modifcations in heat-processed
starch and wheat flour. Starch / Staerke, 39, 88-93.
Tomasik, P., & Wiejak, S. (1989). The thermal decomposition of carbohydrates. Part II. The
decomposition of starch. Advances in Carbohydrate Chemistry and Biochemistry, 47, 279-
343.
Valle, G. Della, Boche, Y., Colonna, P., & Vergnes, B. (1995). The extrusion behaviour of
potato starch. Carbohydrate Polymers, 28, 255-264.
Valle, G. Della, Colonna, P., Patria, A., & Vergnes B. (1996). Influence of amylose content
on the viscous behaviour of low hydrated molten starches. Journal of Rheology, 40, 347-362.
Vergnes, B., Villemaire, J.P., Colonna, P., & Tayeb, J. (1987). Interrelationships between
thermomechanical treatment and macromolecular degradation of maize starch in a novel
rheometer with preshearing. Journal of Cereal Science, 5, 189-202.
Vergnes, B., & Villemaire, J.P. (1987). Rheological behaviour of low moisture molten maize
starch. Rheologica Acta, 26, 570-576.
Wal, D.J. van der, Goffart, D., Klomp, E.M., Hoogstraten, H.W., & Janssen, L.B.P.M. (1996).
Three-dimensional flow modeling of a self-wiping corotating twin-screw extruder. Part II: the
kneading section. Polymer Engineering and Science, 36, 912-924.
Wang, S.M., Bouvier, J.M., & Gelus, M. (1990). Rheological behaviour of wheat flour dough
in twin-screw extrusion cooking. International Journal of Food Science and Technology, 25,
129-139.
Wen, L.F., Rodis, P., & Wasserman, B.P. (1990). Starch fragmentation and protein
insolubilization during twin-screw extrusion of corn meal. Cereal Chemistry, 67, 268-275.

Chapter 7
124
Willett, J.L., Millard, M.M., & Jasberg, B.K. (1997). Extrusion of waxy maize starch: melt
rheology and molecular weight degradation of amylopectin. Polymer, 38, 5983-5989.
Yacu, W.A. (1985). Modelling a twin screw co-rotating extruder. Journal of Food
Engineering, 8, 1-21.
Yamada, T., Suzuki, K., Hisamatsu, M., & Komiya, T. (1990). GPC profile change of potato
starch with extrusion processing. Starch / Staerke, 42, 217-223.
Yoshinaga, M., Katsuki, S., Miyazaki, M., Liu, L., Kihara, S.I., & Funatsu, K. (2000). Mixing
mechanism of three-tip kneading block in twin screw extruders. Polymer Engineering and
Science, 40, 168-178.
Zheng, X., & Wang, S.S. (1994). Shear induced starch conversion during extrusion. Journal
of Food Science, 59(5), 1137-1143.
Zhiqiang, L., Xiao-su, Y., & Hangzhou, F.Y. (1999). Effect of bound water on thermal
behaviours of native starch, amylose and amylopectin. Starch / Staerke, 51, 406-410.

Summary
125
Summary
Introduction and aims
Starch is a major ingredient in various food products. During production of starch-based
foods, often a combination of high temperature and (shearing) forces is applied. An important
example is the extrusion process. In this process, a mixture of starch, a limited amount of
water and often other component (proteins) is kneaded and mixed by a rotating screw in a
heated barrel and then extruded through a die towards the desired shape.
The molecular weight of starch determines the overall product properties to a large extent. It
is known that thermomechanical treatment leads to a reduction of the molecular weight of the
starch. However, the exact cause and control of this effect are still matters of uncertainty. The
aims of the investigations described in this thesis were:
1. to gain insight into and to model the effect of the different process parameters involved in
thermomechanical treatment (time, temperature, shear or elongation stress, energy input,
moisture content) on the degree of macromolecular degradation of starch;
2. to apply these results to existing processes (extrusion) in order to be able to describe the
molecular weight reduction during these processes and to asses the scope for development
of processes regarding controlled selective starch breakdown.
New equipment able to apply a well-defined thermomechanical treatment at high
temperatures was developed, consisting of a non-rotating cone and a rotating plate. Whereas
in conventional equipment the different process parameters involved in product
transformations (time, shear rate, temperature, forces) are strongly coupled, the new shear cell
(figure 1) allowed studying the effects of these parameters separately. Using this equipment,
mixtures of starch and water in different ratios were subjected to a thermomechanical
treatment with various temperatures, times and shear rates.
Starch breakdown by heating and shearing
Chapter 2 of this thesis gives the results of an experimental study on starch breakdown by
heating and shearing. Waxy corn starch mixed with 30% water was subjected to a variety of
heat and shear treatments at temperatures 85-110°C in order to find the key parameter
determining the degree of macromolecular degradation. At the temperatures and moisture

Summary
126
Figure 1: Schematic representation of the shear cell (Van der Goot et al., 2003).
content investigated, thermal effects on waxy corn starch were negligible and all degradation
was induced by mechanical effects. A first order model based on the maximum shear stress
during the treatment gave a clearly improved prediction compared to existing first order
models in literature that include time dependence. It was therefore concluded that molecular
weight reduction of starch at the temperatures investigated is a time-independent process,
during which the starch molecules are broken down virtually instantaneously by high shear
forces within the time scales investigated. This finding was in a second study confirmed for
corn starch (chapter 4). In this study, also thermal effects were investigated, both by heating
only and by thermomechanical treatment. Various moisture contents (30-43%) and
temperatures (85-140°C) were used. Thermal treatment resulted during the first 5 minutes in
starch breakdown, after which longer heating had no significant effect. Thermomechanical
breakdown could be split into two parts:
1. a mechanical part depending on maximal shear stress;
2. an independent thermal breakdown part.
The thermal breakdown part was dependent on time more or less the same way as during a
purely thermal treatment without shear: during a relatively short time it resulted in starch
breakdown, after which longer heating had no significant effect. Increasing moisture content
had three effects on starch molecular weight reduction: it decreased the stresses, but it also
decreased the stresses required for mechanical breakdown and increased thermal breakdown.
These effects are partially counteracting. Therefore, it is difficult to predict the effect of
moisture content on starch breakdown, but the findings described in the thesis may provide a
Cone
Torque gauge
Platebiopolymer
mixture
Cone
Torque gauge
PlateStarch water
mixture

Summary
127
first guideline for estimating the effects of changing moisture content on starch molecular
weight reduction.
In chapter 3 of this thesis, a model allowing molecular scale explanation of the starch
breakdown phenomena occurring during heating shearing treatment is explained and
compared to the engineering scale experiments. This model was based on the assumption that
the maximum shear stress on the polymer equals the effective surface stress on that polymer,
which is related to the strength of the glucosidic bonds. The molecules were approximated as
spheres, with a radius that exhibits fractal scaling with molecular weight. The molecular
weight reduction as a function of applied maximum shear stress deduced from the model
agreed satisfactorily with the ones experimentally determined. The results show a successful
example of a coupling between engineering scale experiments and micro-scale models.
Application to extrusion processes and consequences for process design
Chapters 5 and 6 of this thesis focus on the process that is currently used to modify starch-
water mixtures: extrusion cooking. The extruder (figure 2) consists of one or two screws (in
the extruder used in this thesis: two), which transport and mix the material, surrounded by a
cylindrical barrel. Various types of screw elements can be used. At the end of the extruder the
product is pushed through a die, resulting in the desired shape.
Figure 2: Schematic representation of an extruder.
Mixing effects of different screw elements were measured using a local Residence Time
Distribution (RTD) determination system in a twin screw extruder completely filled with a
dilute solution of pre-gelatinized waxy corn starch as a model fluid (chapter 6). Elements in a
completely filled twin screw extruder were found to induce mixing downstream, but also
upstream. These local mixing effects are important as they influence the time-temperature
Summary
128
history, which is important for thermal breakdown as described above and also for other
effects. The mixing effect of transport and single lead element was dependent on the available
downstream volume. This means that the positioning of elements in the extruder influences
the local mixing effect.
Chapter 5 focuses on molecular breakdown of starch in a twin screw extruder. Molecular
breakdown of regular corn starch after extrusion at moisture contents 23-45%, screw speeds
90-180 rpm and temperatures 97-126°C was predicted using the results on starch breakdown
described above (chapter 4). The maximum shear stresses in the extruder were estimated
using simulations from literature on the flow in paddle sections, which are known to provide
the highest stresses. In the extruder, two types of flow can induce significant breakdown:
shear flow (as measured in the equipment described above) and elongation flow. Elongation
stresses were calculated using the estimated Trouton ratio Tr of the starch. A reasonably good
prediction of the degree of degradation was obtained, suggesting that the approach of
describing a complex process, such as an extruder, using results obtained in a well-defined
geometry was successful. Interestingly, our model was able to describe the molecular weight
reduction in a complete extruder quite well by concentrating on a single paddle. This result
suggests that extruders are in fact oversized when considering molecular weight reduction.
Finally, a literature review (chapter 7) shows that many results of extrusion trials described in
literature can be well understood using the findings of this thesis. This chapter also provides
guidelines for process design regarding controlled, selective starch breakdown. Better
homogeneous shear fields are a key factor in the design of such processes. Furthermore,
residence time can be short; longer shear sections are not effective.
Recommendations
With respect to the goals of this thesis, it can be concluded that a good insight has been
obtained in the effects of the various process parameters on starch degradation. The thesis
shows that uncoupling of process parameters can be a successful route to a better
understanding of the effects of complex processes on molecular scale phenomena. In this
work, the effects of shear and temperature were investigated specifically. Gaps still exist in
understanding the effects of elongation flow. Therefore, the development of a device able to
apply well-defined elongation flow and temperature treatments to material is recommended.

Summary
129
Recent advances in analysis technology will increase the rate of success expected from
uncoupling of process parameters even further.
Reference
Van der Goot, A.J., Van den Einde, R.M., Peighambardoust, S.H. (2003). Poster: The effect
of plain shear on biopolymers.

Summary
130

Samenvatting
131
Samenvatting
Inleiding
Dit proefschrift beschrijft de effecten van afschuifkrachten en hoge temperatuur op het
molecuulgewicht van zetmeel. Zetmeel wordt gewonnen uit onder andere verschillende
granen (maïs, tarwe, rijst) en knollen (aardappel) en wordt gebruikt als ingrediënt in veel
levensmiddelen. Om van het zetmeel een levensmiddel te maken, wordt het vaak eerst
gemengd met een geringe hoeveelheid water (en evt. andere ingrediënten) waarna dit mengsel
verder verwerkt wordt. Deze verwerking vindt vaak plaats bij hoge temperaturen en tevens
kunnen grote mechanische krachten op het zetmeel komen te staan. Een proces waarbij dit
beide gebeurt wordt een thermomechanische behandeling genoemd. Zetmeel bestaat uit
moleculen die, vergeleken met veel andere stoffen, groot zijn. Onder invloed van de krachten
en / of de hoge temperatuur kunnen de zetmeelmoleculen afbreken tot kleinere fragmenten,
waardoor het molecuulgewicht lager wordt. Omdat de afbraak van het zetmeel de
eigenschappen van het uiteindelijke levensmiddel beïnvloedt, is het van belang te begrijpen
hoe en bij welke procesomstandigheden deze plaatsvindt. De doelen van dit proefschrift
waren dan ook:
1. Het beschrijven hoe de verschillende procesparameters gedurende een
thermomechanische behandeling van mengsels van zetmeel en water het
molecuulgewicht van het zetmeel beïnvloeden.
2. Het toepassen van de resultaten hiervan op bestaande processen met als doel de
veranderingen in molecuulgewicht gedurende deze processen te kunnen beschrijven en
om ideeën te ontwikkelen voor nieuwe processen waarin zetmeel gecontroleerd en
selectief wordt afgebroken.
De krachten die op het mengsel van zetmeel en water staan tijdens het proces worden bepaald
door de gebruikte temperatuur, de hoeveelheid water in het mengsel en de snelheden in de
gebruikte procesapparatuur. De afbraak van zetmeel wordt dus door een groot aantal
procesfactoren beïnvloed. Nu is het in de apparaten die momenteel gebruikt worden bij de
verwerking van mengsels van zetmeel en water (extruders, zie verderop in deze samenvatting)
moeilijk of zelfs onmogelijk om de genoemde procesfactoren onafhankelijk van elkaar te
variëren. Daarom is een nieuw apparaat ontwikkeld, waarin dit wel mogelijk is (figuur 1).

Samenvatting
132
Cone
Torque gauge
Platebiopolymer
mixture
Kegel
Koppelmeter
PlaatZetmeel water
mengsel
Figuur 1: Schematische voorstelling van het nieuw ontwikkelde apparaat, de “shear cell”.
(Van der Goot et al., 2003).
Afbraak van zetmeel onder invloed van krachten en temperatuur
Drie hoofdstukken in dit proefschrift gaan over de afbraak van zetmeel: hoofdstuk 2 en 3
behandelen mechanische afbraak van zetmeel (= als gevolg van krachten); hoofdstuk 4
behandelt zowel thermische afbraak (= als gevolg van hoge temperatuur) als
thermomechanische afbraak (= waarbij temperatuur en kracht tegelijkertijd afbraak
veroorzaken).
Hoofdstuk 2 laat zien dat de mate van mechanische afbraak van zetmeel afhangt van de
spanning die maximaal op het zetmeel water mengsel heeft gestaan gedurende het proces.
Deze ontdekking staat haaks op een aantal eerdere studies, waarin werd beschreven dat de
afbraak van zetmeel afhing van het product van spanning en tijd. In deze eerdere studies werd
dus gesuggereerd dat een lange tijd een lage spanning op het zetmeel hetzelfde effect zou
hebben als een korte tijd een hoge spanning. De resultaten van hoofdstuk 2 laten zien dat de
afbraak van zetmeel kan worden gerealiseerd in een korte tijd en dat langere procesduur wat
dit effect betreft niet nodig is. In hoofdstuk 3 van het proefschrift wordt een model
gepresenteerd waarmee voorspeld kan worden hoe hoog de maximumspanning tijdens een
behandeling moet zijn om zetmeel tot een bepaald gewenst molecuulgewicht mechanisch af te
breken.
In hoofdstuk 4 is gekeken naar zowel thermische als thermomechanische afbraak. Bij een
thermische behandeling leidde een hogere temperatuur tot meer afbraak. Bovendien leidde

Samenvatting
133
meer water in het mengsel ook tot meer afbraak. Interessant genoeg was het niet altijd zo dat
langere behandeling tot meer afbraak leidde: verhitten leidde initieel tot afbraak van het
zetmeel, maar langere tijd zorgde niet voor meer afbraak. Thermomechanische afbraak van
zetmeel bleek goed beschreven te kunnen worden door de behandeling in twee delen te
splitsen:
1. een mechanische behandeling
2. en een thermische behandeling onafhankelijk daarvan.
De afbraak als gevolg van de mechanische behandeling kon weer worden beschreven als
afhankelijk van de maximaal optredende spanning (zoals in hoofdstuk 2). De afbraak door de
thermische behandeling volgde weer hetzelfde patroon als hierboven beschreven, namelijk de
eerste paar minuten leidden tot afbraak, maar een langere tijd had geen effect meer.
Het effect van de hoeveelheid water op de thermomechanische afbraak was interessant.
Gebruik van een hoger watergehalte had drie verschillende effecten op de zetmeelafbraak: het
verlaagde de krachten die optraden, het leidde tot meer thermische afbraak en de krachten die
nodig waren om zetmeel mechanisch af te breken werden er lager door. Deze effecten zijn
gedeeltelijk tegengesteld. Daarom is het moeilijk om het effect van watergehalte op
zetmeelafbraak te voorspellen, maar de resultaten beschreven in dit proefschrift kunnen een
globaal idee geven.
Toepassing op bestaande processen en consequenties voor procesontwerp
Hoofdstukken 5 en 6 van dit proefschrift beschrijven het proces dat op dit moment veel wordt
gebruikt bij de productie van levensmiddelen gebaseerd op zetmeel: extrusie. Een extruder is
een apparaat dat veel wordt toegepast in de levensmiddelenindustrie, maar ook in de
kunststoffenindustrie. De extruder (figuur 1) bestaat uit een cilindrisch schroefhuis waarin
zich één of twee (in de in dit proefschrift gebruikte extruder: twee) ronddraaiende schroeven
bevinden, die het materiaal transporteren en mengen. Om de schroefas kunnen verschillende
typen elementen bevestigd worden, die ieder hun eigen werking hebben. Een voorbeeld zijn
kneedelementen. Aan het einde van de extruder bevindt zich een spuitkop waarmee het
product in de juiste vorm wordt gebracht.
Hoofdstuk 5 beschrijft afbraak van zetmeel gedurende extrusie wanneer thermische afbraak
(voor een groot gedeelte) mag worden verwaarloosd. In hoofdstuk 6 is gekeken naar de
menging in de extruder. Deze bepaalt hoe lang het zetmeel in de extruder op een bepaalde

Samenvatting
134
Figuur 1: Schematische voorstelling van een extruder.
temperatuur is geweest en is dus van groot belang wanneer ook thermische afbraak een rol
speelt.
In hoofdstuk 5 wordt een model beschreven waarmee voor allerlei extrusiecondities
(verschillende temperaturen, draaisnelheden, watergehalten) kan worden voorspeld in welke
mate het zetmeel afbreekt. Het model geeft goede voorspellingen terwijl het gebaseerd is op
het voorspellen van de afbraak in één kneedelement. Dit suggereert dat extruders groter zijn
gebouwd dan vanuit het oogpunt van afbraak van zetmeel nodig is.
In hoofdstuk 6 is de menging bepaald die locaal veroorzaakt wordt door de verschillende
typen schroefelementen. Schroefelementen zorgen voor locale menging stroomafwaarts, maar
ook stroomopwaarts. Deze locale menging is belangrijk, omdat deze de tijd-temperatuur
geschiedenis van het materiaal beïnvloedt, dat wil zeggen gedurende welke tijd het materiaal
in de extruder een bepaalde temperatuur heeft gehad. Deze tijd kan diverse
producteigenschappen beïnvloeden, waaronder ook het molecuulgewicht van zetmeel zoals
hierboven beschreven.
Hoofdstuk 7 beschrijft dat veel resultaten van eerdere onderzoeken goed verklaard kunnen
worden met de resultaten uit dit proefschrift. Dit hoofdstuk beschrijft daarnaast een proces
voor gecontroleerde afbraak van zetmeel tot een gewenst molecuulgewicht. Hierbij kan de
behandelingstijd kort zijn, omdat – zoals hierboven beschreven – lange tijden niet tot meer
afbraak zullen leiden.
Tot slot
In dit proefschrift is het inzicht beschreven dat is verworven in de processen die een rol spelen
tijdens bijvoorbeeld extrusie van mengsels van zetmeel en water. Dit inzicht is niet verkregen

Samenvatting
135
door de bestaande procesapparatuur (extruders) toe te passen, maar door het materiaal met een
beter gedefinieerd apparaat te bestuderen. De resultaten helpen het begrip van bestaande
processen verder, zeker ook vergeleken met studies waarbij wel die extruders zijn gebruikt.
Daarom lijkt deze strategie ook bij verder onderzoek naar het effect van procesfactoren op de
eigenschappen van het eindproduct een goede te kunnen zijn.
Referentie
Van der Goot, A.J., Van den Einde, R.M., Peighambardoust, S.H. (2003). Poster: The effect
of plain shear on biopolymers.

Samenvatting
136

List of publications
137
List of publications
Einde, R.M. van den, Veen, M.E. van der, Bosman, H., Goot, A.J. van der, & Boom, R.M.
Modeling macromolecular degradation of corn starch in a twin screw extruder. Submitted for
publication.
Einde, R.M. van den, Akkermans, C., Goot, A.J. van der, & Boom, R.M. Molecular
breakdown of corn starch by thermal and mechanical effects. Submitted for publication.
Einde, R.M. van den, Kroon, P., Goot, A.J. van der, & Boom, R.M. Local mixing effects of
screw elements during extrusion. Submitted for publication.
Einde, R.M. van den, Linden, E. van der, Goot, A.J. van der, & Boom, R.M. A mechanistic
model on the relation between molecular structure of starch and macromolecular degradation
during heating-shearing processes. Accepted for publication in Polymer Degradation and
Stability.
Einde, R.M. van den, Bolsius, A., Soest, J.J.G. van, Janssen, L.P.B.M., Goot, A.J. van der, &
Boom, R.M. (2004). The effect of thermomechanical treatment on starch breakdown and the
consequences for process design. Carbohydrate Polymers, 55(1), 57-63.
Goot, A.J. van der, Einde, R.M. van den, & Boom, R.M. (2003). A fresh look into shear-
based biopolymer processing. NPT Procestechnologie, 10(6), 28-30.
Einde, R.M. van den, Goot, A.J. van der, & Boom, R.M. (2003). Understanding molecular
weight reduction of starch during heating-shearing processes (review). Journal of Food
Science, 68(8), 2396-2404.
Einde, R.M. van den, Peters, J., Goot, A.J. van der, & Boom, R.M. (2002). In-line
measurement of local residence time distribution in a twin screw extruder. In: Proceedings of
ANTEC 2002 San Francisco, vol. 1 Processing (p. 28-30). Brookfield: Society of Plastics
Engineers, Inc.

List of publications
138
Goot, A.J. van der, Abrahamse, A.J., Einde, R. M. van den, Padt, A. van der, & Boom, R.M.
(2000). [Development of structures.] Ontwerpen van structuren. VMT
Voedingsmiddelentechnologie, 33(7), 19, 21-22.
Einde, R.M. van den, Zuilichem, D.J. van, Wolters, I., & Stolp, W. (1999). [Combination of
microwave treatment and boiling water for fresh potato slices.] Combinatie microgolven en
kokend water spaart aardappelschijfjes. VMT Voedingsmiddelentechnologie, 32(25), 10-11,
13-14.

Nawoord
139
Nawoord
Tijdens dit promotieonderzoek kreeg ik van mensen die niet in het onderzoek werken vaak de
volgende vraag: “Jij werkt vier jaar lang aan één onderwerp? Is dat niet ontzettend saai?” Als
ik nu, aan het eind van dit onderzoek, terugkijk kan ik alleen maar concluderen dat de vier
jaar ontzettend snel om waren en tevens dat het werk als AIO veel afwisselender is dan veel
mensen denken: het varieert van proeven doen en apparatuur bouwen tot cursussen volgen en
congressen bezoeken en van studenten begeleiden tot rapporten en artikelen schrijven.
Het doen van een promotieonderzoek is gelukkig al lang geen soloactie meer en ik wil hier op
deze plaats dan ook een aantal mensen bedanken, zonder wiens hulp dit proefschrift niet tot
stand was gekomen.
Allereerst bedank ik Atze Jan voor de fantastische begeleiding die hij me de afgelopen vier
jaar heeft gegeven. Atze, je hield me op het goede spoor als ik weer eens te veel zijsprongen
wilde maken, je hebt ontzettend goed in de gaten gehouden dat alles op tijd afkwam, me
behoed voor mijn eigen perfectionisme en niet te vergeten me er doorheen gesleept op een
aantal momenten (met name na ca. 2,5 jaar) waarop ik het onderzoek bijna niet meer zag
zitten. Daarnaast heb je me begeleid op een aantal reizen, onder andere naar Groningen,
Detmold, en niet te vergeten op de verre reis naar San Francisco, sterker nog: daar heb je de
lezing van me overgenomen, omdat ik als gevolg van jet lag (of iets anders) zo ziek was dat ik
die niet meer kon houden…
Remko, de maandelijkse ontmoetingen met jou brachten veel goede ideeën in het onderzoek,
maar minstens zo belangrijk was jouw positieve kijk op het werk. Vaak als ik niet zo tevreden
was over de voortgang en me daar niet zo blij over voelde, had ik er na zo’n ontmoeting met
jou weer helemaal zin in, doordat jij zo duidelijk aangaf wat voor een leuke dingen er
allemaal met mijn metingen te doen zouden kunnen zijn.
Een groot gedeelte van het werk beschreven in dit proefschrift is uitgevoerd op nieuw
gebouwde apparatuur, onder andere de ‘shear cell’. Dit apparaat was er nooit gekomen zonder
het werk van Mees, Jan, Evert, Hans en André van de Mechanische Werkplaats. Bedankt voor
al het werk dat jullie hebben uitgevoerd, de vele ideeën die jullie hadden en voor jullie snelle
beschikbaarheid als wij weer eens een experiment hadden bedacht waar het apparaat niet
tegen bleek te kunnen… Eveneens bedankt voor alle ideeën voor en hulp bij de experimenten
met de perspex extruder; zonder dat was hoofdstuk 6 van dit proefschrift er niet geweest.
Reinoud en Hans van de afdeling Elektronica, bedankt voor jullie bijdrage op

Nawoord
140
elektrotechnisch gebied. Bij het vertalen van een vaag idee naar iets waarmee we naar de
werkplaats konden heeft Pieter een belangrijke rol gespeeld. Pieter, bedankt hiervoor en voor
het uitvoeren van een aantal labexperimenten voor mij (ik weet dat dit laatste niet je favoriete
werk was…). Ook Laurens Bosgra en prof. Janssen van de Rijksuniversiteit Groningen
hebben een belangrijke rol gespeeld in het ontwerp van de apparatuur en bij de optimalisatie
van de meetopstellingen. Saskia, bedankt voor het uitvoeren van een aantal labexperimenten
voor me en voor de hulp bij de laatste shear cell experimenten. Ik wens je veel succes bij de
vervolgonderzoeken en bij je taak als labhoofd (die je van mij hebt overgenomen).
Een deel van dit proefschrift is tot stand gekomen in samenwerking met de sectie
Levensmiddelennatuurkunde. Bij deze dank ik Erik van der Linden voor het tot stand helpen
komen van hoofdstuk 3 van dit proefschrift, en Harry Baptist en Katja Grolle voor hun
begeleiding bij het opzetten van de Ubbelohde experimenten zoals gebruikt in hoofdstukken 2
t/m 5.
Tijdens mijn onderzoek heb ik negen studenten mogen begeleiden bij hun afstudeervak. In
volgorde van aankomst: Daniël, Marcel, Joris, Neleke, Arjen, Coen, Anne, Hans en Cynthia.
Allemaal bedankt voor het vele werk dat jullie hebben uitgevoerd en voor de ideeën waarmee
jullie kwamen. Zonder jullie was dit boekje waarschijnlijk toch een stuk minder dik geweest!
Ik heb het begeleiden als ontzettend leuk en leerzaam ervaren en bovendien dwong het me om
op tijd keuzes in het onderzoek te maken. Verder bedank ik op deze plaats Jeroen van Soest
van Agrotechnology & Food Innovations (voormalig ATO) voor het medebegeleiden van een
groot aantal van de hier genoemde studenten, voor het feit dat we gebruik konden maken van
de nodige bij ATO aanwezige apparatuur en voor het delen van zijn zetmeelkennis met mij.
Veel van het werk van een AIO gebeurt ook achter het bureau. Mark, Anneke, Ed en Sandra,
bedankt voor de gezellige sfeer op kamer 615 en de gezellige kameretentjes en –uitstapjes
(inclusief een onvergetelijk bezoek aan de Volkswagen dealer)! Ed, bedankt voor de hulp die
je me gaf als ik ‘voor het eerst’ een cursusformulier in moest vullen, een Matlab upgrade
moest kopen enz. Het contrast tussen onze bureaus was groot, maar ik ben blij dat je in je
proefschrift schreef dat je mijn “rommel in positieve zin zou gaan missen”. Anneke, om maar
even bij de woorden uit jouw nawoord aan te sluiten, ik ben erg blij dat jij membraan
emulsificatie als onderwerp hebt gekozen, zodat ik aan zetmeel kon werken. Mark, jij bent
oprecht geïnteresseerd in je collega’s en dat werkt erg prettig. Het feit dat jij zo gemakkelijk
aan het lachen te krijgen bent terwijl je wel heel serieus werkt maakt jou een fijne
kamergenoot. Daarnaast heeft het feit dat jij in het midden van jouw onderzoek ook de

Nawoord
141
overstap naar zetmeel hebt gemaakt geleid tot veel nuttige discussies. Bovendien heb jij er
samen met Hadi en je studenten voor gezorgd dat de shear cell pas echt goed ging werken.
Bedankt voor alle humor (‘de verwarming staat al hoog genoeg, er hoeft niet gestookt te
worden’), je hulp als ik me niet zo happy voelde en alle gezelligheid! Ik ben blij dat je één
van mijn paranimfen wilt zijn. Sandra, als mijn directe buurvrouw op de kamer vanaf mijn
derde jaar was je vaak mijn aanspreekpunt (of liever gezegd: begon ik vaak gewoon tegen jou
te kletsen zonder dat daarom gevraagd was…). Ik ben blij dat je eveneens mijn paranimf wilt
zijn.
Aan de verdere collega’s van de vakgroep: bedankt voor alle gezelligheid bij de borrels,
labuitjes, diners, filmavonden, koffiepauzes, lunches en niet te vergeten bij de AIO reizen
naar Polen en Zuid-Afrika. Ik heb me goed thuisgevoeld bij Proceskunde en ik zal de sfeer
zeker missen. Hadi, thank you for the useful discussions about the shear cell and for your help
in optimizing it. Maria, thank you for the nice dinners and chats, I hope you are well in France
now. Isabel, thank you for the nice trips to Haarlem, Amsterdam and The Hague. I wish you
all the best now that you are living here in Wageningen. Eira, bedankt voor de goede
gesprekken (vooral) tijdens de koffiepauzes en voor de drie geweldige feesten die je hebt
georganiseerd. Martijn, ik heb de samenwerking met jou tijdens mijn eerste ‘grote’
onderwijsopdracht als erg prettig ervaren.
De rol van vrienden (m/v) tijdens een promotieonderzoek moet niet onderschat worden.
Diana, Marieke, Anoeska, Maarten, Caroline, André, Martine, Angelique, Martijn, Bart,
Floortje, Floris, Rieneke, Eric, Sigelinde en Monique, allemaal hebben jullie op één of
meerdere manieren geholpen om me hier aan de eindstreep te krijgen, door me op te peppen
als ik het niet zag zitten, door gezelligheid en ontspanning te bieden, door mee te denken of
gewoon door er op het goede moment voor me te zijn.
Buiten het werk ben ik met veel plezier actief geweest als organist en als DJ. Van het
Verrijzeniskoor van Wageningen en de Cantores en de leden van het Dameskoor van
Doorwerth wil ik iedereen bedanken die op zijn of haar manier hieraan heeft bijgedragen. Ook
het bestuur van de Borney’s, in het bijzonder Jan, wil ik bedanken voor het mij de
gelegenheid geven me als DJ te bewijzen, iets wat ik al heel lang graag wilde doen. We
hebben er met z’n allen vaak een leuk feestje van gemaakt!
Tot slot wilde ik graag mijn familie bedanken, in het bijzonder de onderstaande personen.
Maurice, bedankt voor alle gezelligheid en steun. Anneke en Cees, bedankt dat jullie geregeld
meeleefden de afgelopen 4 jaar. En niet te vergeten pa en ma: heel erg bedankt voor het mij

Nawoord
142
de gelegenheid geven om te gaan studeren en om dit promotieonderzoek te gaan doen en voor
alle steun op de momenten dat ik het moeilijk had.
René van den Einde, december 2003

Curriculum vitae
143
Curriculum vitae
René Martin van den Einde werd op 21 september 1976 geboren te Voorburg. In 1994
behaalde hij het VWO diploma met lof aan het Sint Oelbert Gymnasium te Oosterhout. In
datzelfde jaar startte hij met de studie Levensmiddelentechnologie aan de
Landbouwuniversiteit Wageningen (heden Wageningen Universiteit). Twee afstudeervakken
werden afgelegd bij de Sectie Proceskunde. Hij liep stage bij RHM Technology in High
Wycombe, UK en bij Honig in Nijmegen. Na voor zowel het propedeutisch examen in 1995
als het doctoraalexamen in 1999 met lof te zijn geslaagd, startte hij in september 1999 als
AIO bij de sectie Proceskunde van Wageningen Universiteit. Van dit AIO onderzoek zijn de
resultaten in dit proefschrift beschreven.

De omslag van dit proefschrift is een voorbeeld van de op internet veel te vinden ‘fractal
kunst’, gebaseerd op de uitkomsten van fractale berekening. Ook in dit proefschrift is gebruik
gemaakt van een fractale berekening, in hoofdstuk 3. Verder doet dit plaatje enigszins denken
aan extruderschroeven, die in dit proefschrift (met name in hoofdstuk 5 en 6) een rol spelen.