molecular pathology with desorption electrospray ... · molecular pathology with desorption...
TRANSCRIPT
©2015 Waters Corporation 1
Molecular pathology with desorption electrospray
ionization (DESI)
- where we are and where we're going
Dr. Emrys Jones
Waters Users Meeting ASMS 2015
May 30th
©2015 Waters Corporation 2
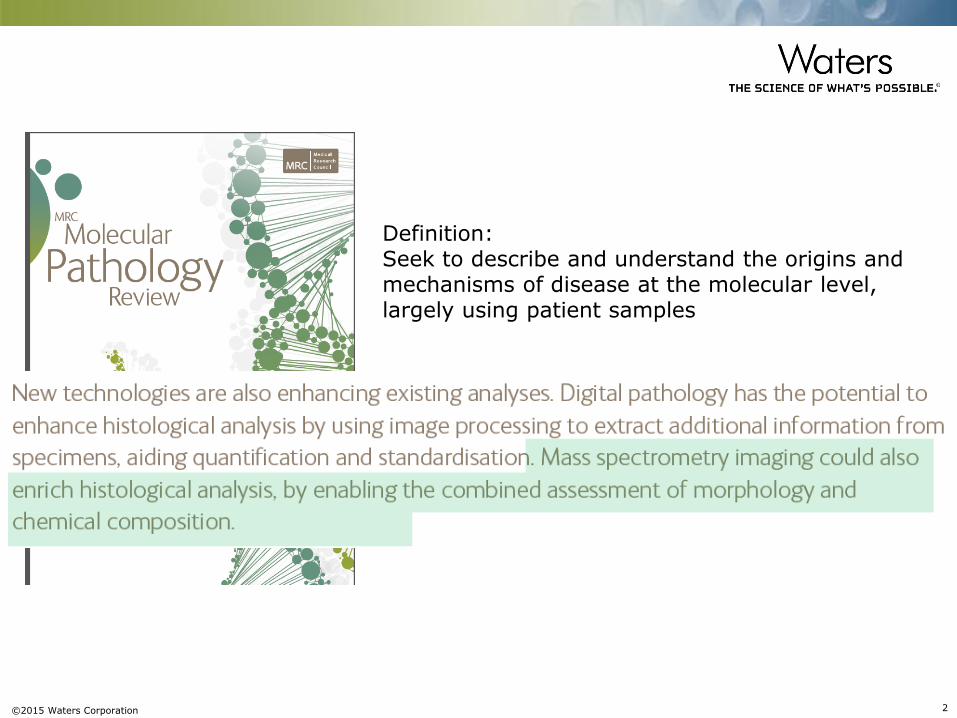
Definition: Seek to describe and understand the origins and mechanisms of disease at the molecular level, largely using patient samples
©2015 Waters Corporation 3
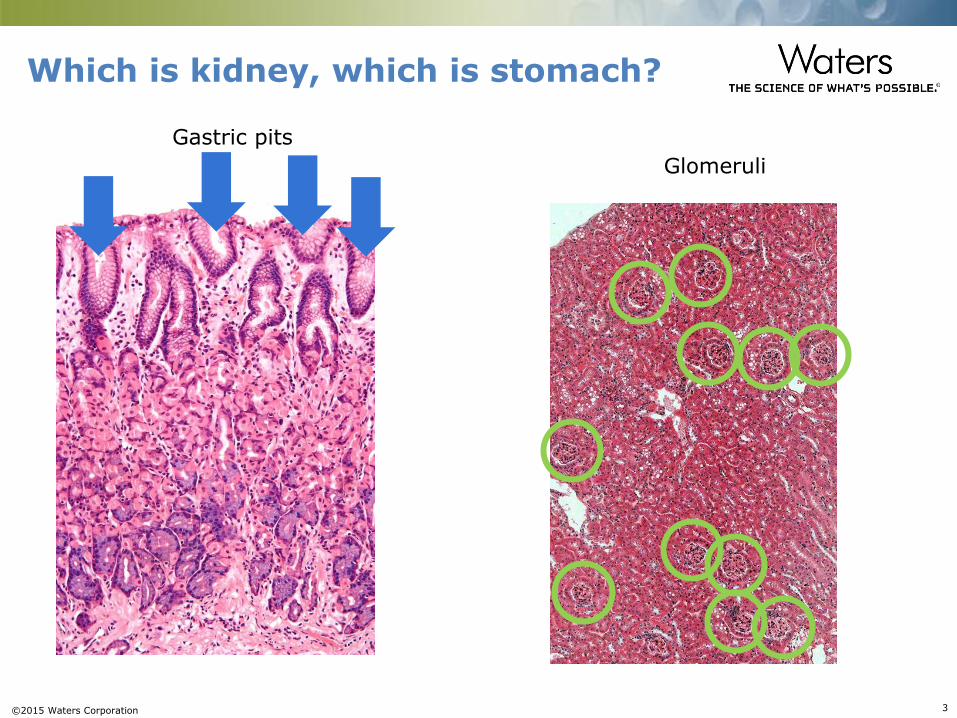
Which is kidney, which is stomach?
Gastric pits
Glomeruli
©2015 Waters Corporation 4
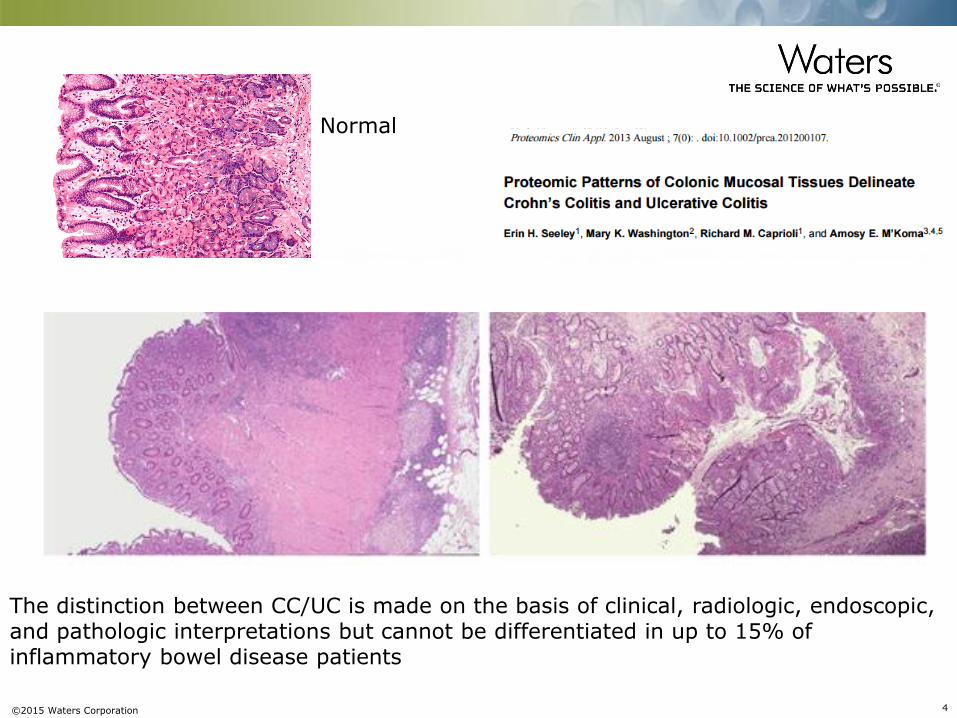
The distinction between CC/UC is made on the basis of clinical, radiologic, endoscopic, and pathologic interpretations but cannot be differentiated in up to 15% of inflammatory bowel disease patients
Normal
©2015 Waters Corporation 5
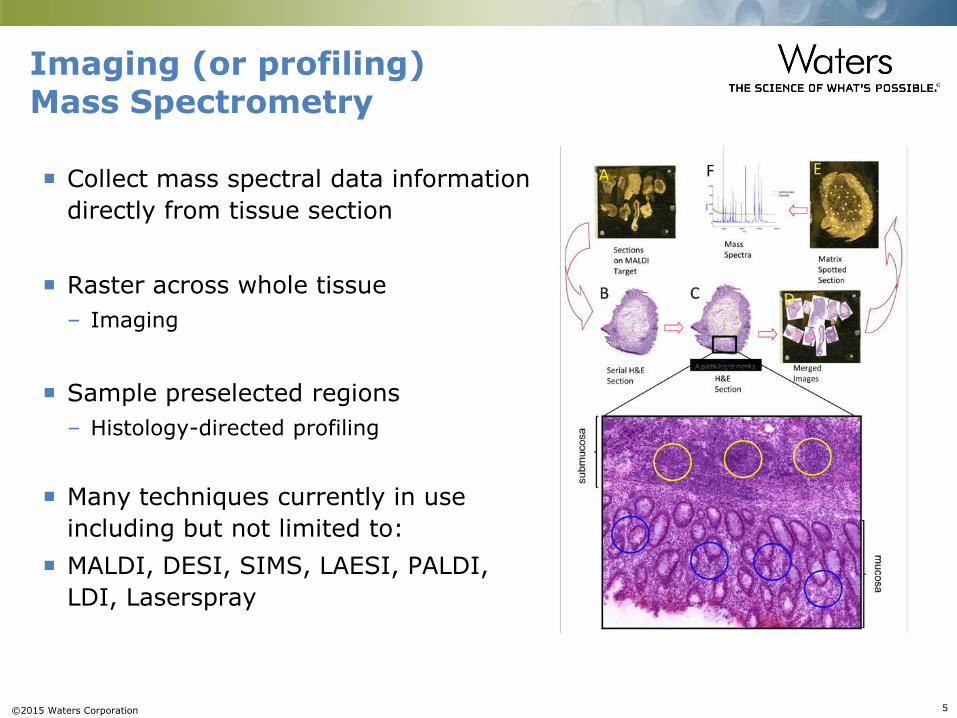
Imaging (or profiling) Mass Spectrometry
Collect mass spectral data information
directly from tissue section
Raster across whole tissue
– Imaging
Sample preselected regions
– Histology-directed profiling
Many techniques currently in use
including but not limited to:
MALDI, DESI, SIMS, LAESI, PALDI,
LDI, Laserspray
©2015 Waters Corporation 6
Goals
Use additional chemical information obtained from sections of
patient tissue and models of disease to further understand the
mechanisms of disease
Develop a chemical information-based tissue identification
system, which is functionally equivalent with the current,
morphology-based tissue ID systems
Work presented and described here is for research purposes,
not for clinical diagnosis
©2015 Waters Corporation 7
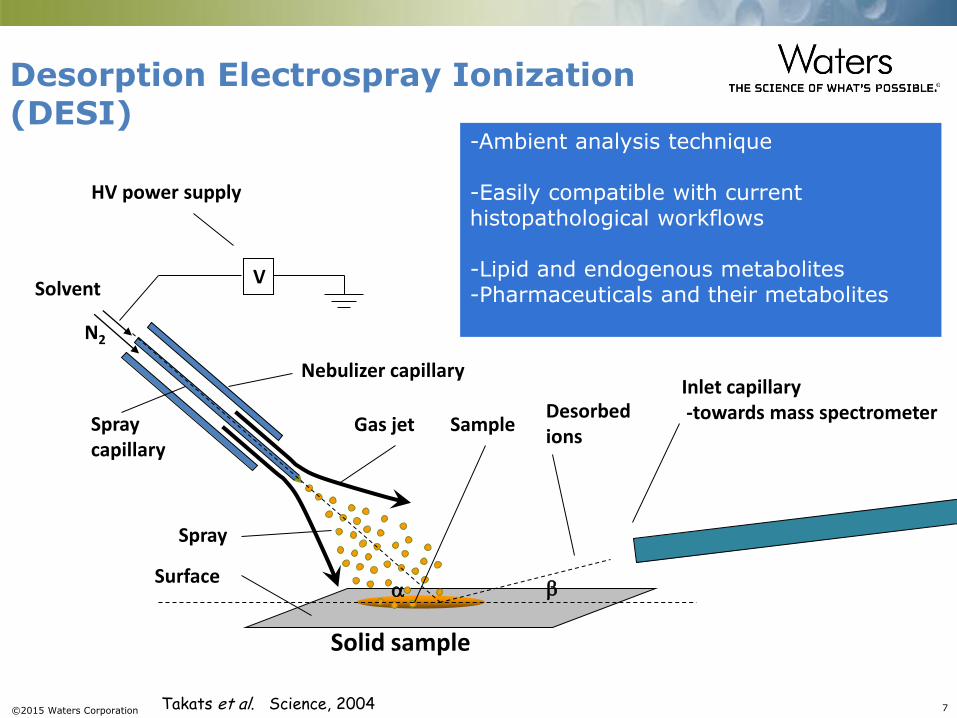
Solvent
N2
V
Nebulizer capillary
Spray capillary
Gas jet
Spray
Surface
Sample Desorbed ions
Inlet capillary -towards mass spectrometer
HV power supply
Solid sample
Takats et al. Science, 2004
Desorption Electrospray Ionization (DESI)
-Ambient analysis technique -Easily compatible with current histopathological workflows -Lipid and endogenous metabolites -Pharmaceuticals and their metabolites
©2015 Waters Corporation 8
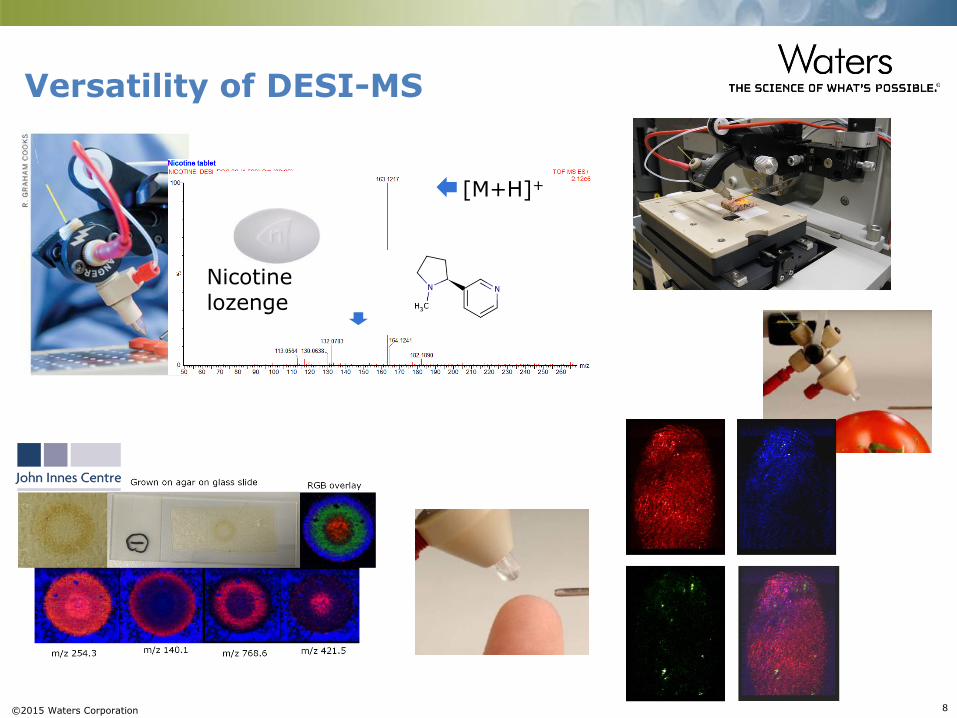
Versatility of DESI-MS
[M+H]+
Nicotine lozenge
©2015 Waters Corporation 9
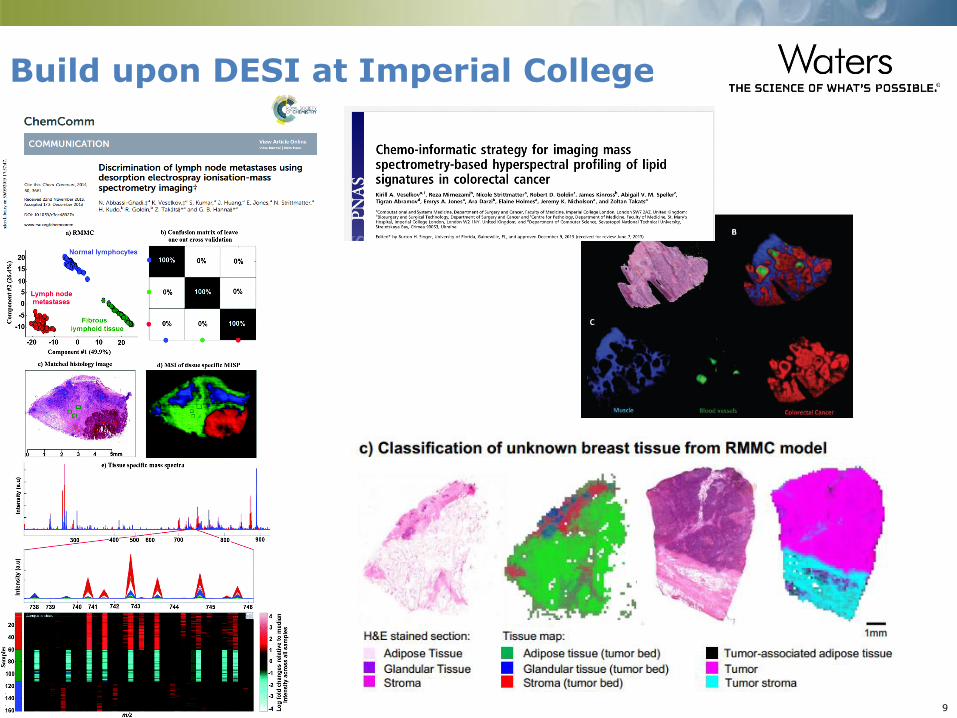
Build upon DESI at Imperial College
©2015 Waters Corporation 10
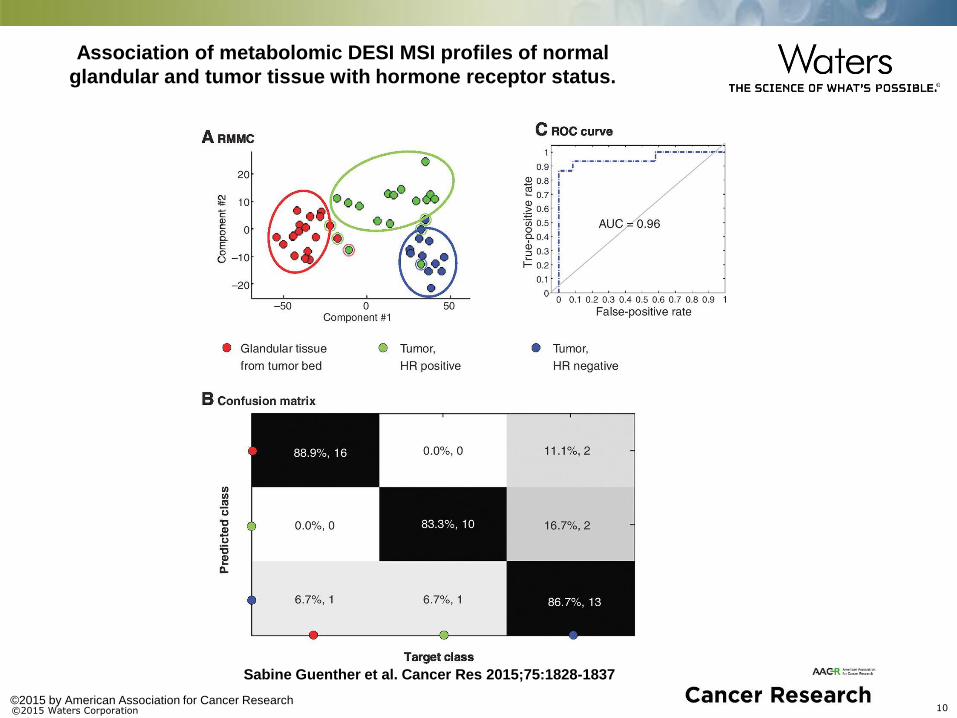
Association of metabolomic DESI MSI profiles of normal
glandular and tumor tissue with hormone receptor status.
Sabine Guenther et al. Cancer Res 2015;75:1828-1837
©2015 by American Association for Cancer Research
©2015 Waters Corporation 11
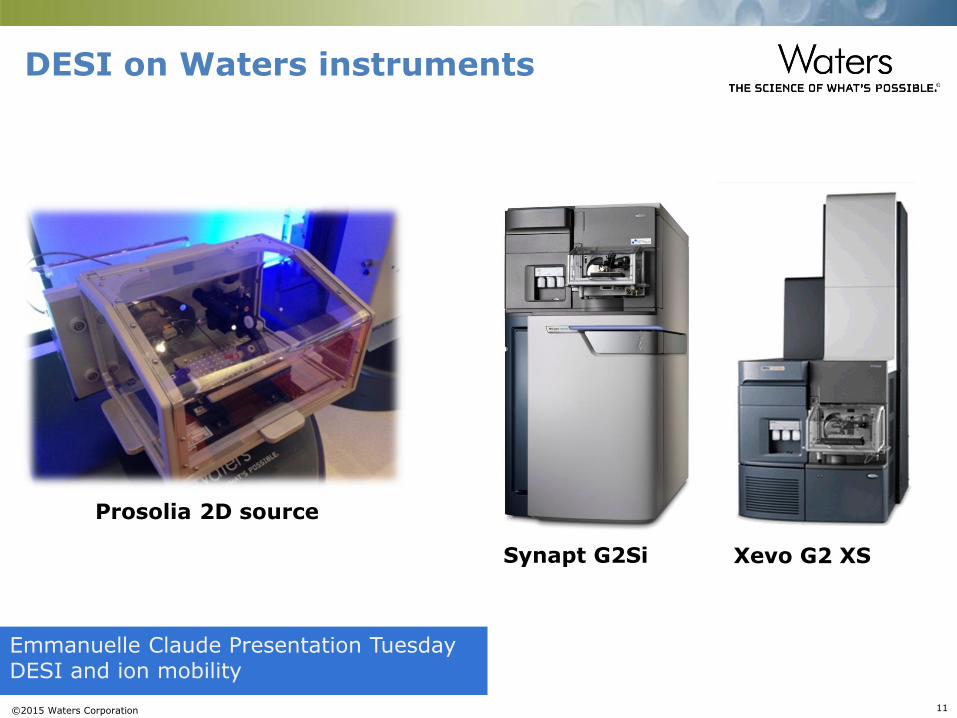
Synapt G2Si Xevo G2 XS
Prosolia 2D source
DESI on Waters instruments
Emmanuelle Claude Presentation Tuesday DESI and ion mobility
©2015 Waters Corporation 12
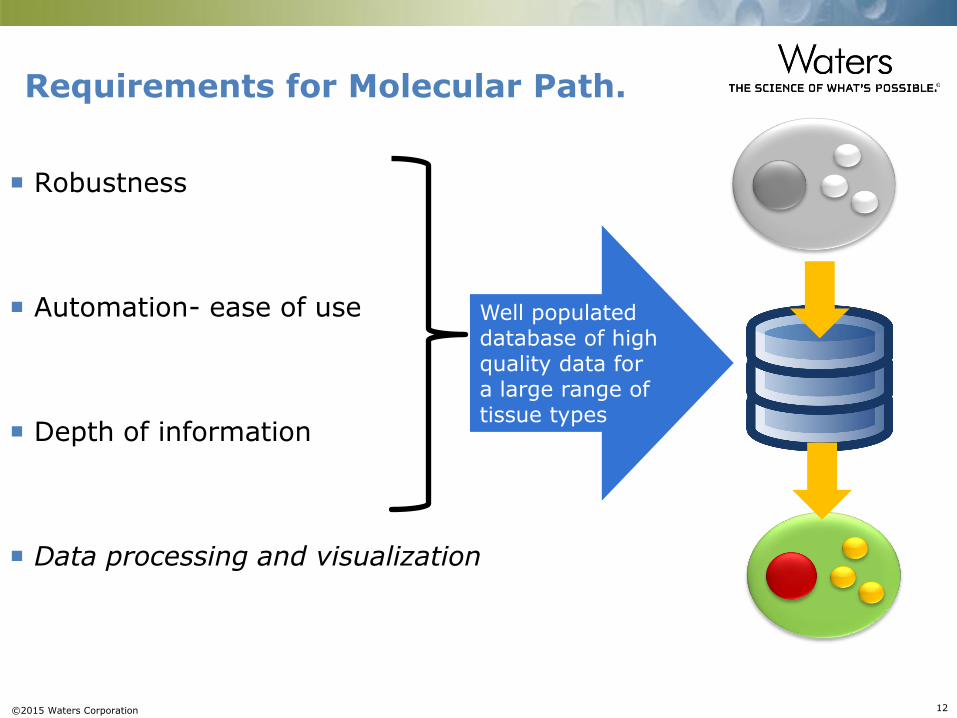
Requirements for Molecular Path.
Robustness
Automation- ease of use
Depth of information
Data processing and visualization
Well populated database of high quality data for a large range of tissue types
©2015 Waters Corporation 13
Requirements for Molecular Path.
Robustness
Automation- ease of use
Depth of information
Data processing and visualisation
©2015 Waters Corporation 14
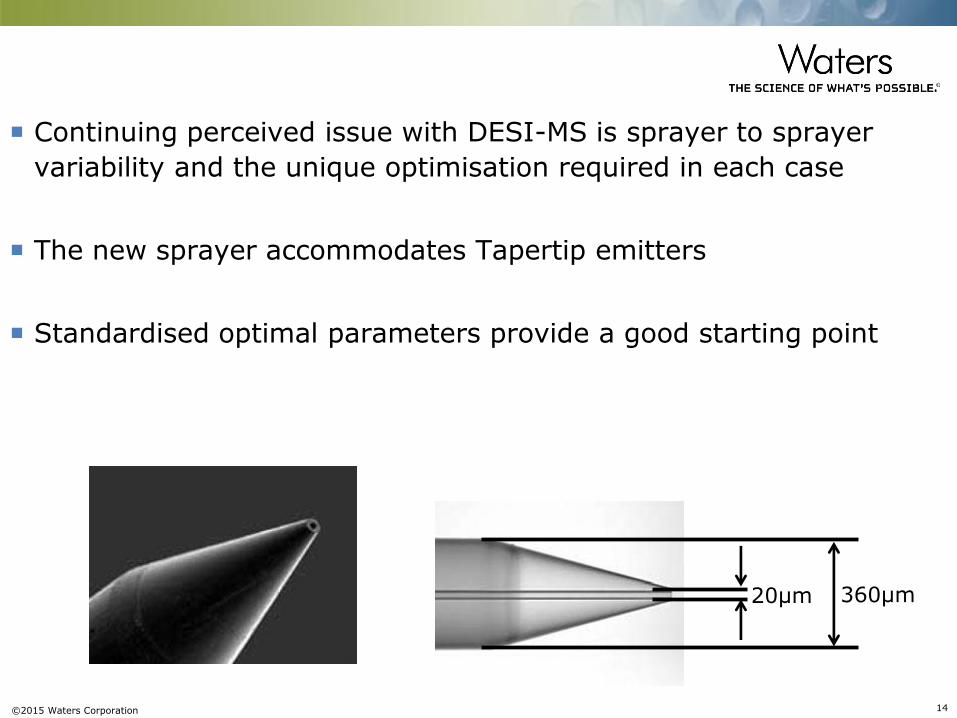
Continuing perceived issue with DESI-MS is sprayer to sprayer
variability and the unique optimisation required in each case
The new sprayer accommodates Tapertip emitters
Standardised optimal parameters provide a good starting point
20μm 360μm
©2015 Waters Corporation 15
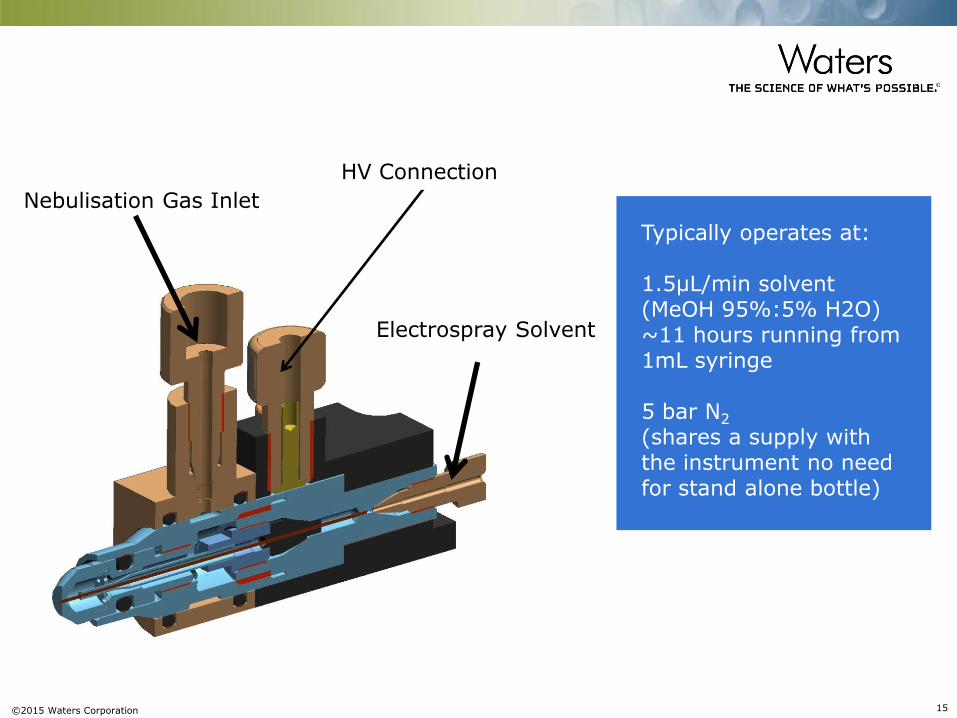
Nebulisation Gas Inlet
HV Connection
Electrospray Solvent
Typically operates at: 1.5µL/min solvent (MeOH 95%:5% H2O) ~11 hours running from 1mL syringe 5 bar N2 (shares a supply with the instrument no need for stand alone bottle)
©2015 Waters Corporation 16
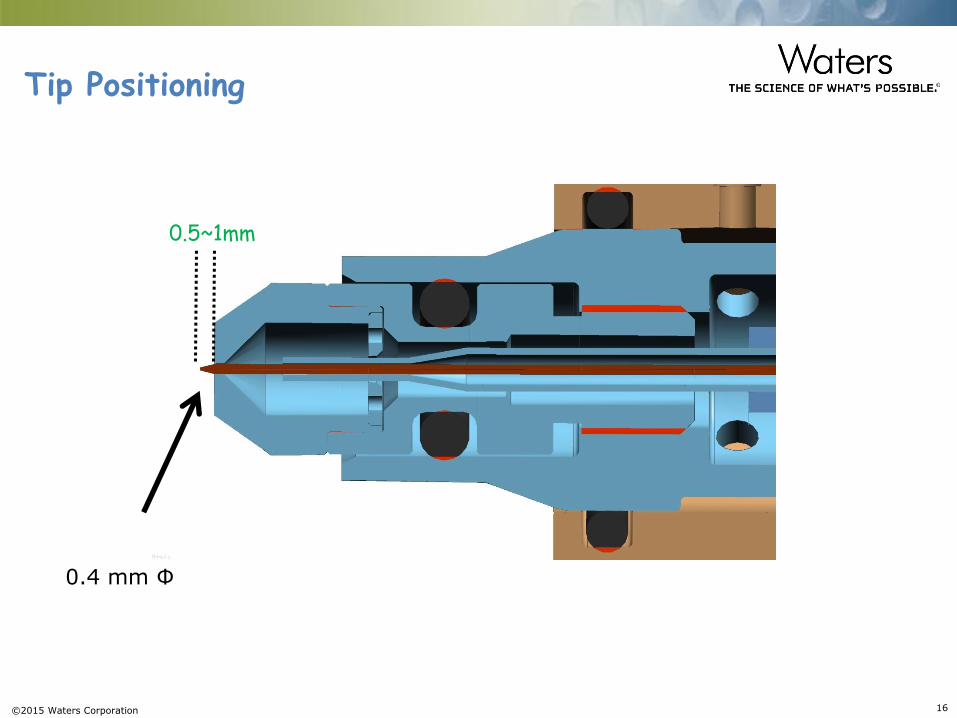
Tip Positioning
0.4 mm Ф
0.5~1mm
©2015 Waters Corporation 17
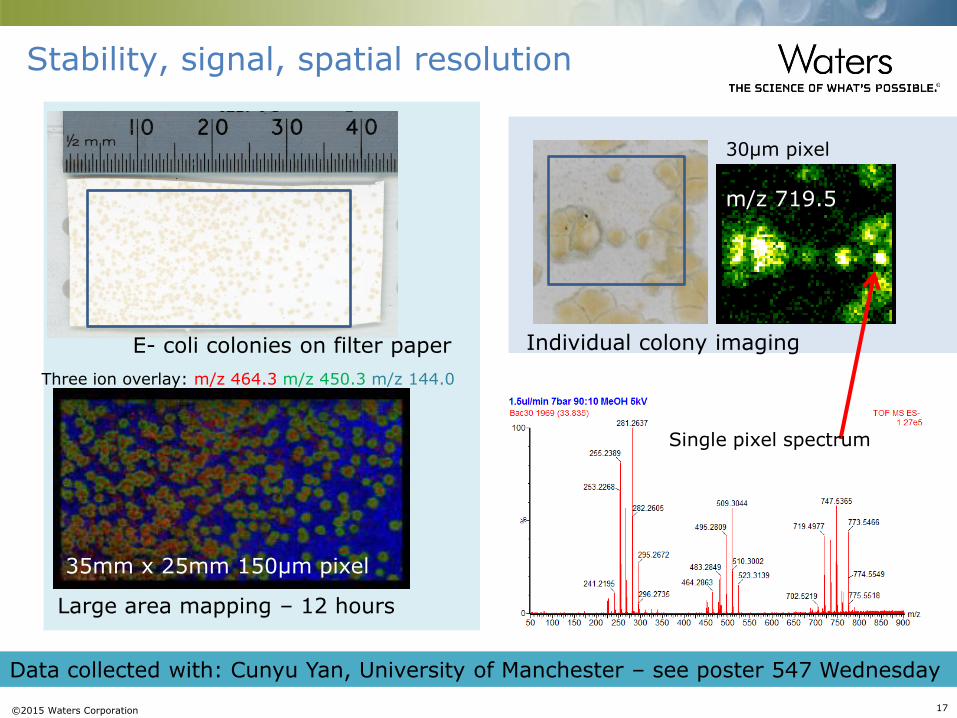
35mm x 25mm 150µm pixel
30µm pixel
m/z 719.5
Single pixel spectrum
Large area mapping – 12 hours
Individual colony imaging
Three ion overlay: m/z 464.3 m/z 450.3 m/z 144.0
Stability, signal, spatial resolution
Data collected with: Cunyu Yan, University of Manchester – see poster 547 Wednesday
E- coli colonies on filter paper
©2015 Waters Corporation 18
Robustness
Automation- ease of use
Depth of Information
Data processing and visualisation
©2015 Waters Corporation 19
An advantage of DESI is the minimal sample preparation
Samples are taken directly from -80°C freezer and placed
onto atmospheric sampling stage
Low solvent flow rates ensure minimal damage to the tissue
allowing subsequent staining for accurate co-registration of
morphology and chemical images
New version of MassLynx and HDI 1.3.5 for experiment
definition
©2015 Waters Corporation 20
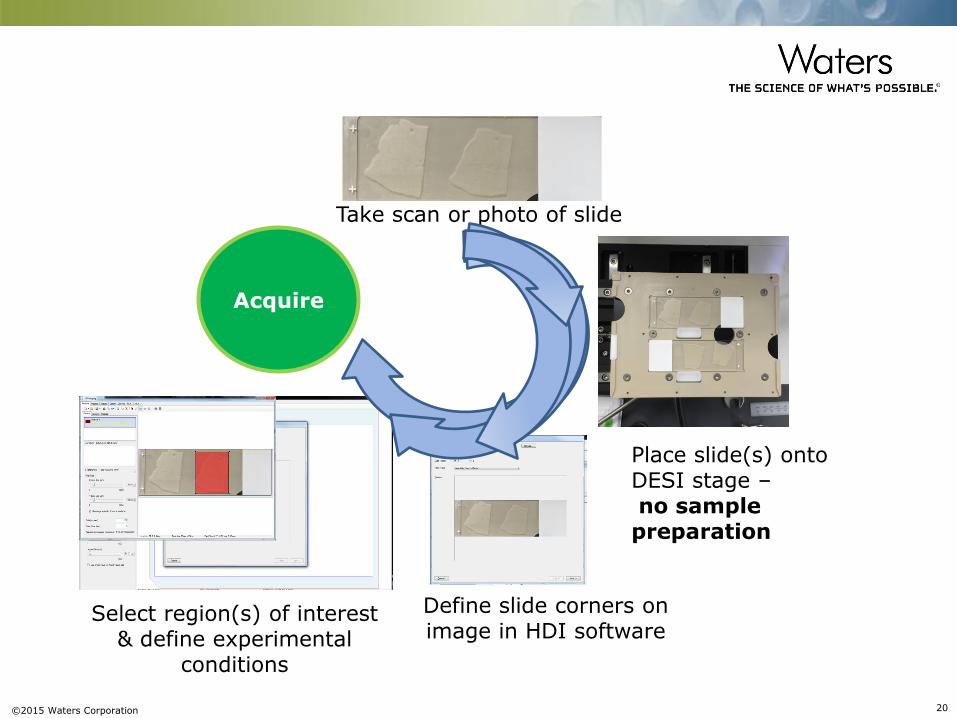
Take scan or photo of slide
Place slide(s) onto DESI stage – no sample preparation
Define slide corners on image in HDI software
Select region(s) of interest & define experimental
conditions
Acquire
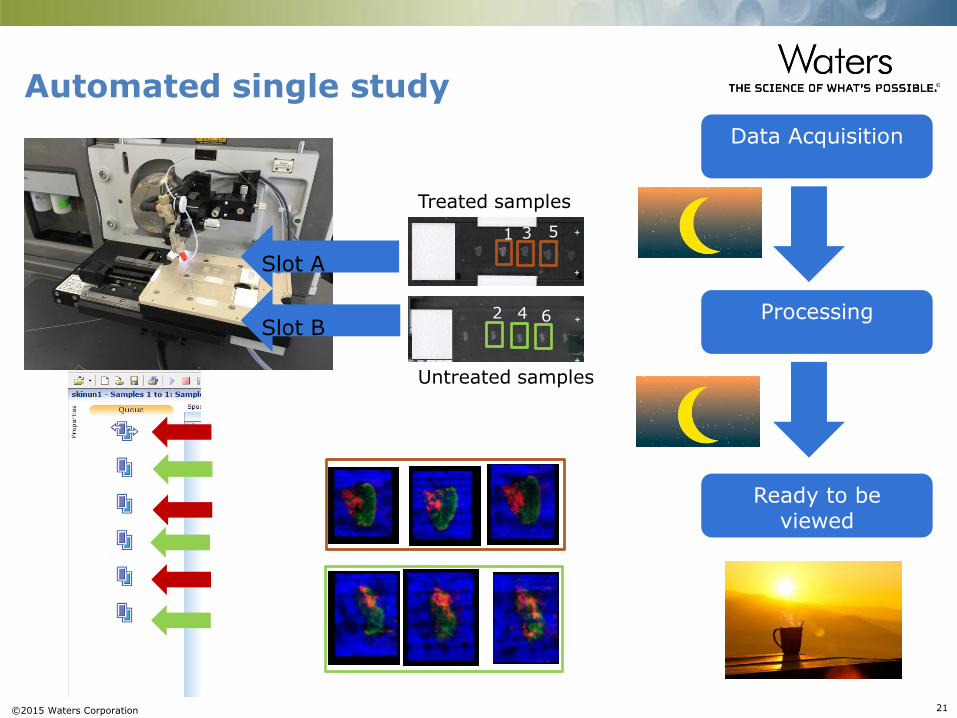
©2015 Waters Corporation 21
Slot A
Slot B
Treated samples
Untreated samples
1
2
3 5
4 6
Data Acquisition
Processing
Ready to be viewed
Automated single study
©2015 Waters Corporation 22
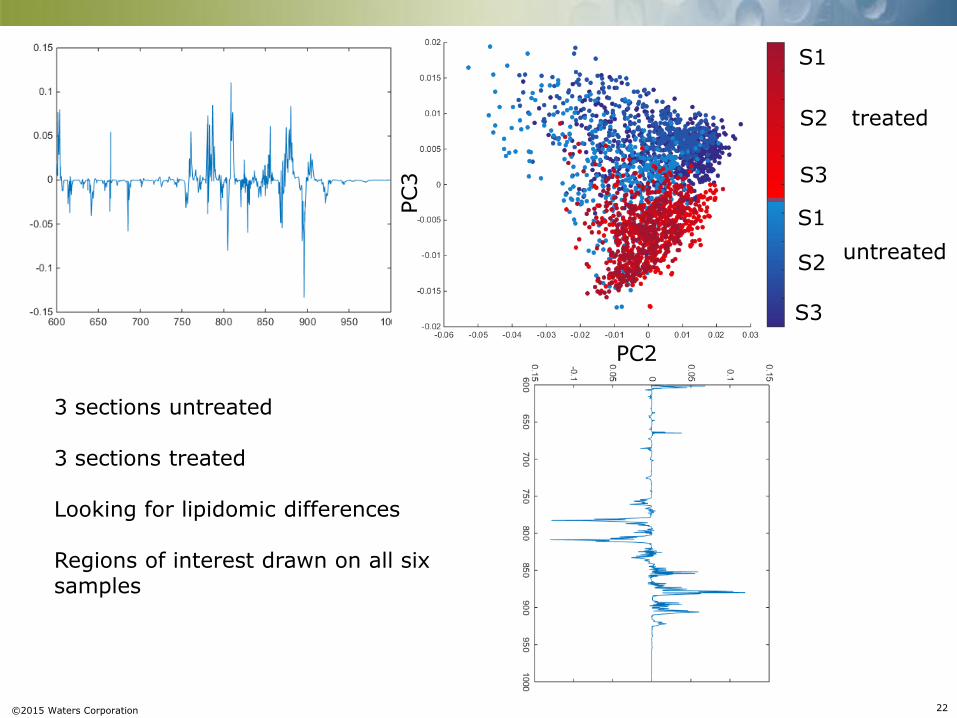
3 sections untreated 3 sections treated Looking for lipidomic differences Regions of interest drawn on all six samples
treated
untreated
PC2
PC3
S1
S2
S3
S1
S2
S3
©2015 Waters Corporation 23
Robustness
Automation- ease of use
Depth of Information
Data processing and visualisation
©2015 Waters Corporation 24
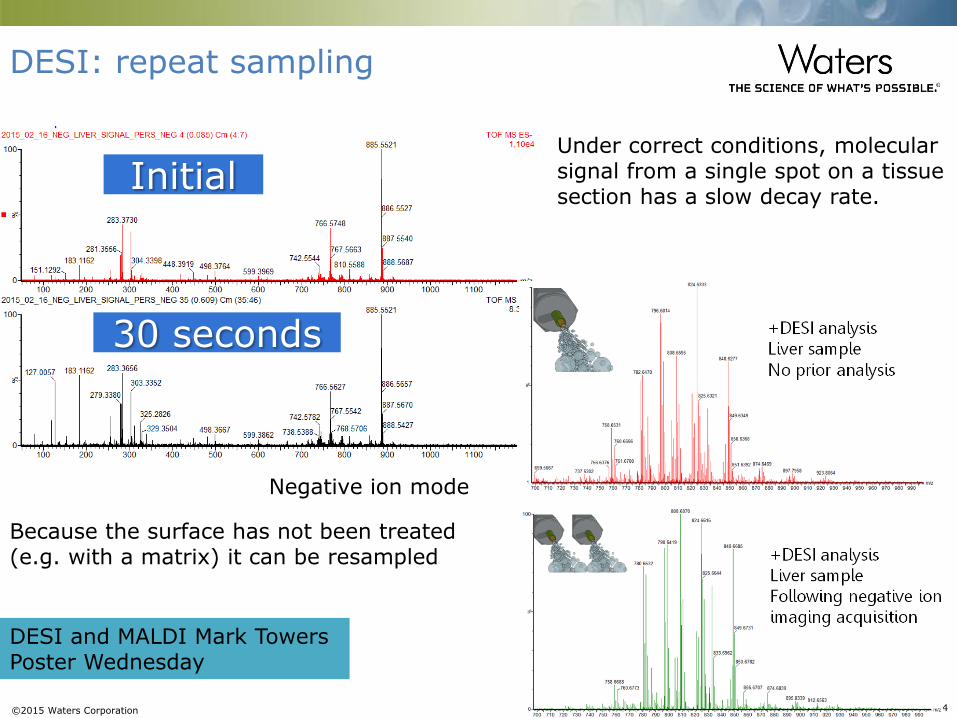
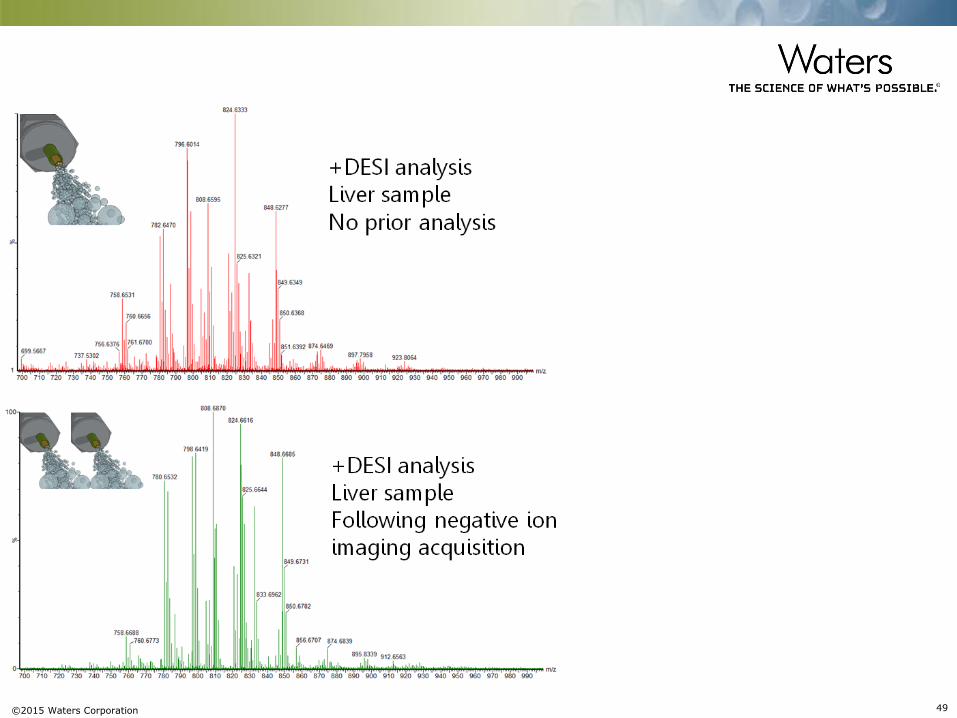
DESI: repeat sampling
Negative ion mode
Initial
30 seconds
DESI and MALDI Mark Towers Poster Wednesday
Under correct conditions, molecular signal from a single spot on a tissue section has a slow decay rate.
Because the surface has not been treated (e.g. with a matrix) it can be resampled
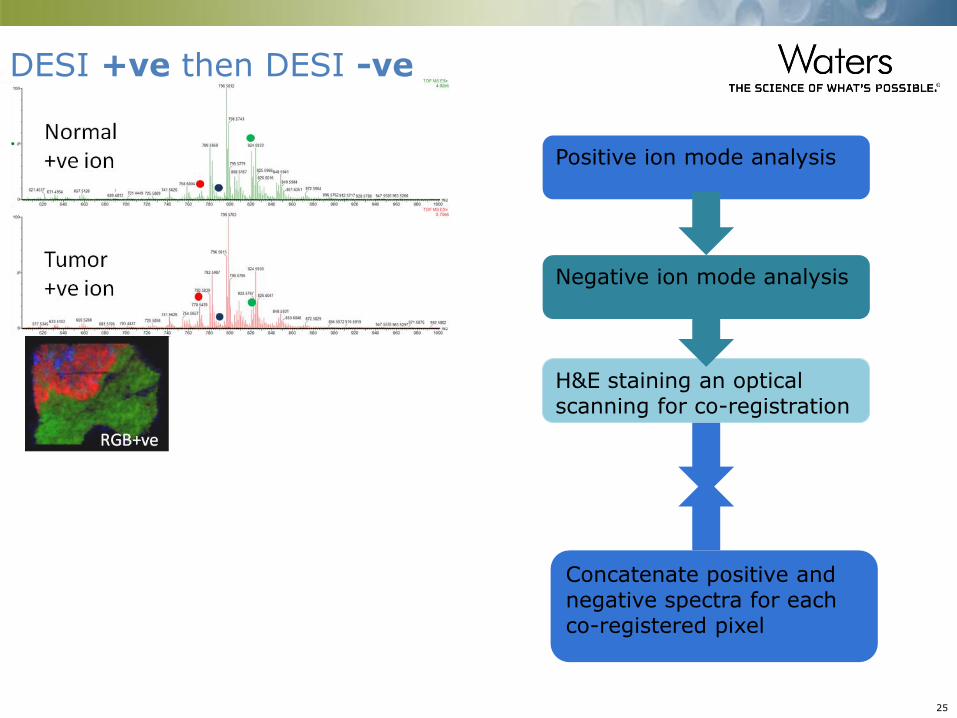
©2015 Waters Corporation 25
Positive ion mode analysis
Negative ion mode analysis
H&E staining an optical scanning for co-registration
Concatenate positive and negative spectra for each co-registered pixel
DESI +ve then DESI -ve
©2015 Waters Corporation 26
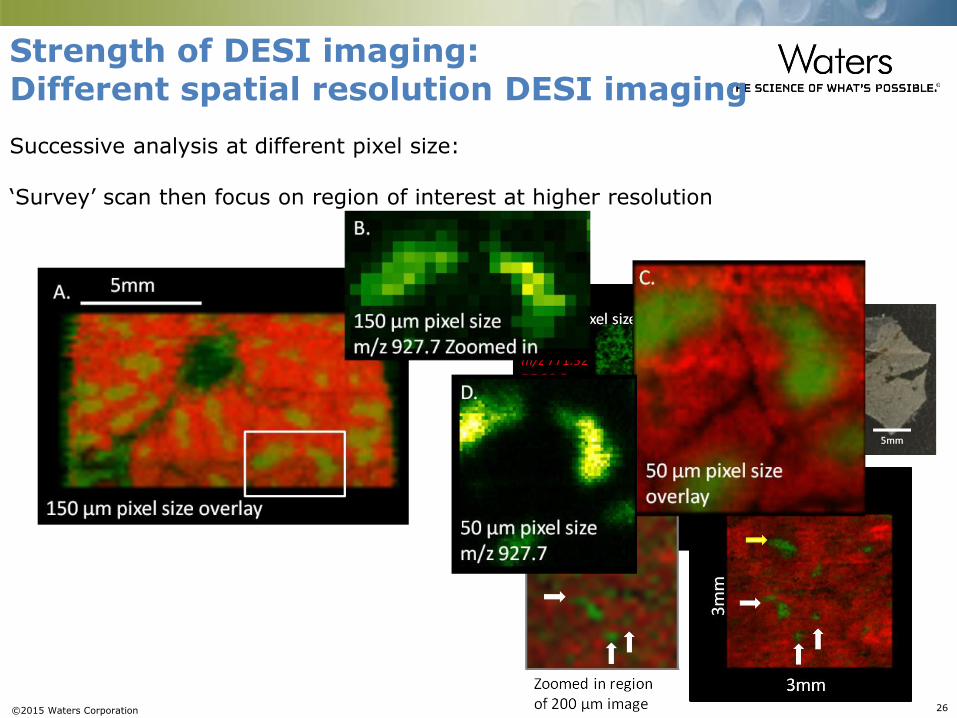
Successive analysis at different pixel size: ‘Survey’ scan then focus on region of interest at higher resolution
Strength of DESI imaging: Different spatial resolution DESI imaging
©2015 Waters Corporation 27
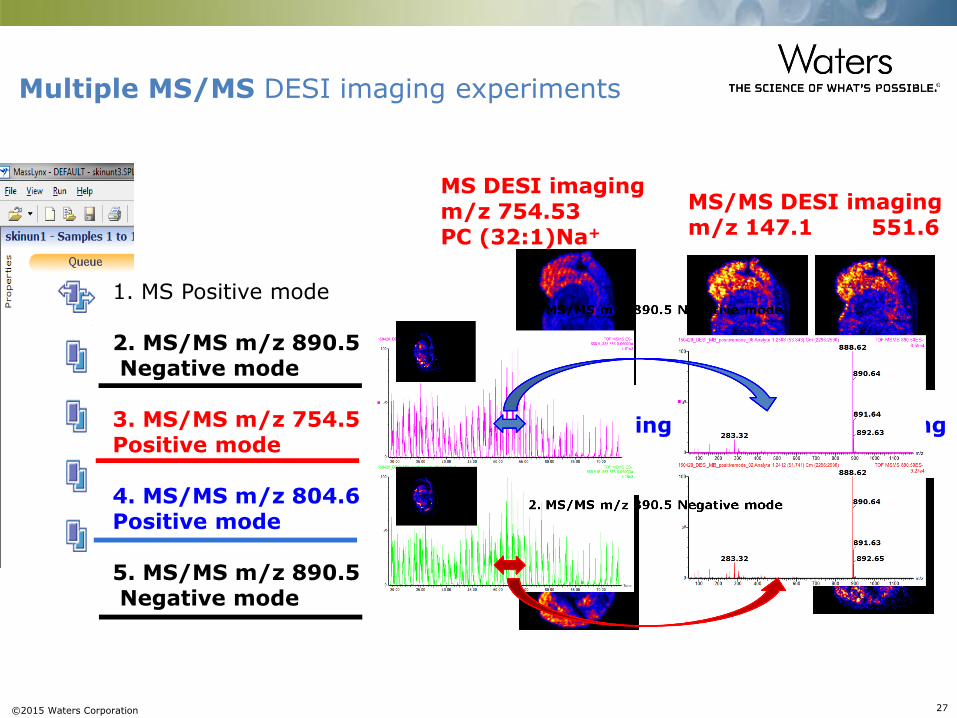
Multiple MS/MS DESI imaging experiments
MS/MS DESI imaging m/z 147.1 551.6
MS/MS DESI imaging 621.5
MS DESI imaging m/z 804.6 PC (36:4)Na+
MS DESI imaging m/z 754.53 PC (32:1)Na+
1. MS Positive mode 2. MS/MS m/z 890.5 Negative mode 3. MS/MS m/z 754.5 Positive mode 4. MS/MS m/z 804.6 Positive mode 5. MS/MS m/z 890.5 Negative mode
©2015 Waters Corporation 28
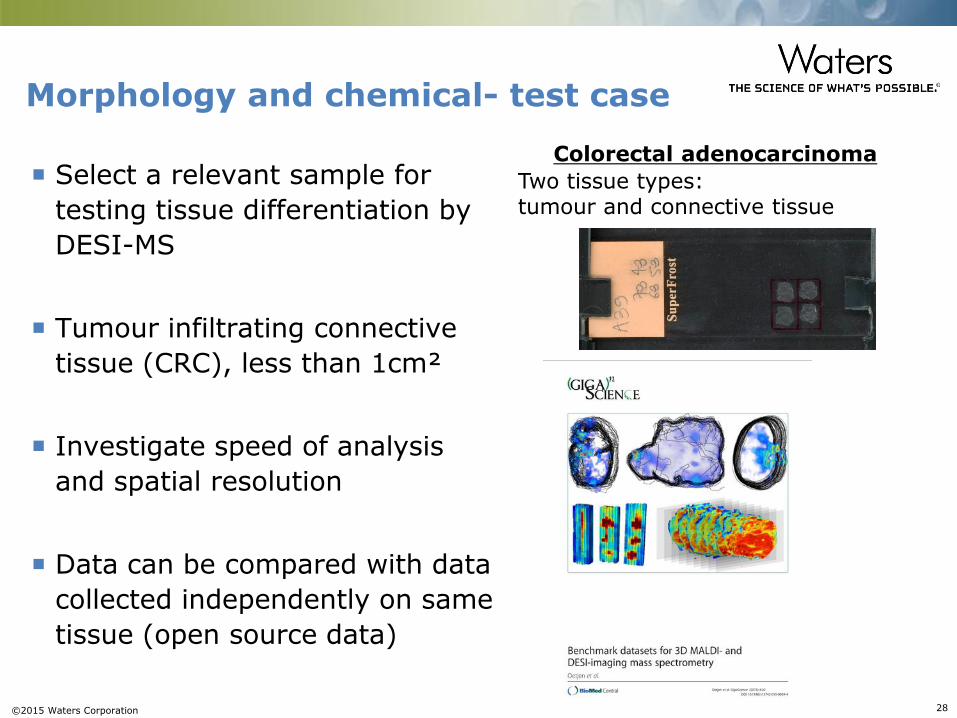
Morphology and chemical- test case
Select a relevant sample for
testing tissue differentiation by
DESI-MS
Tumour infiltrating connective
tissue (CRC), less than 1cm²
Investigate speed of analysis
and spatial resolution
Data can be compared with data
collected independently on same
tissue (open source data)
Two tissue types: tumour and connective tissue
Colorectal adenocarcinoma
~ 1cm
~ 1cm
©2015 Waters Corporation 29
10 20 30 40 50 60
10
20
30
40
50
60
70
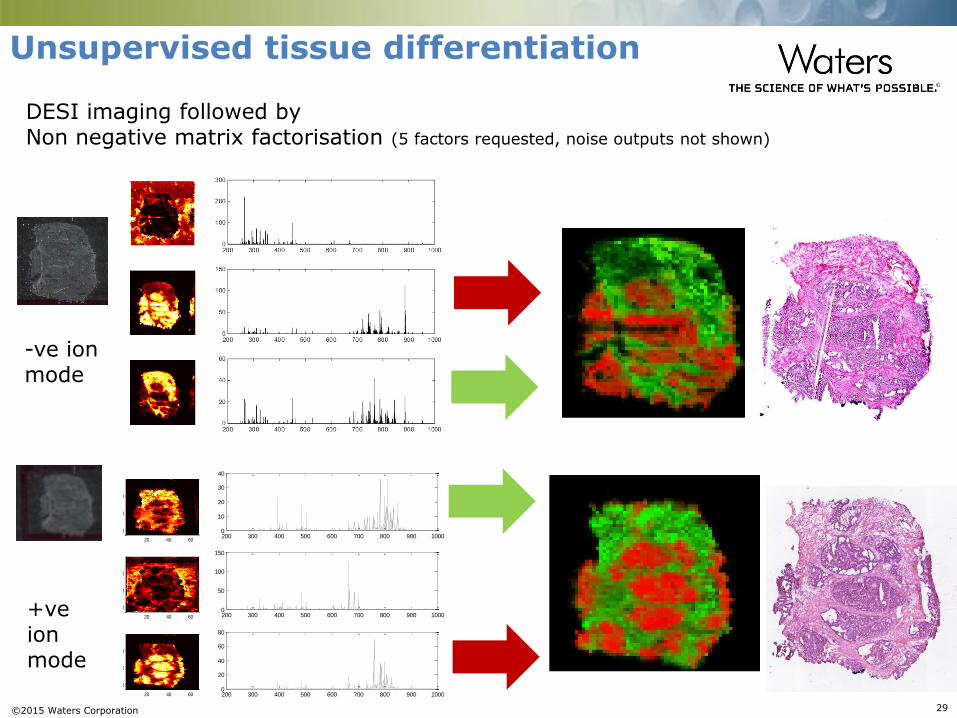
DESI imaging followed by Non negative matrix factorisation (5 factors requested, noise outputs not shown)
Unsupervised tissue differentiation
-ve ion mode
20 40 60
20
40
60
20 40 60
20
40
60
20 40 60
20
40
60
200 300 400 500 600 700 800 900 10000
10
20
30
40
200 300 400 500 600 700 800 900 10000
50
100
150
200 300 400 500 600 700 800 900 10000
20
40
60
80
10 20 30 40 50 60
10
20
30
40
50
60
+ve ion mode
©2015 Waters Corporation 30
5 10 15 20 25 30 35 40 45 50
10
20
30
40
50
60
10 20 30 40 50 60
10
20
30
40
50
60
70
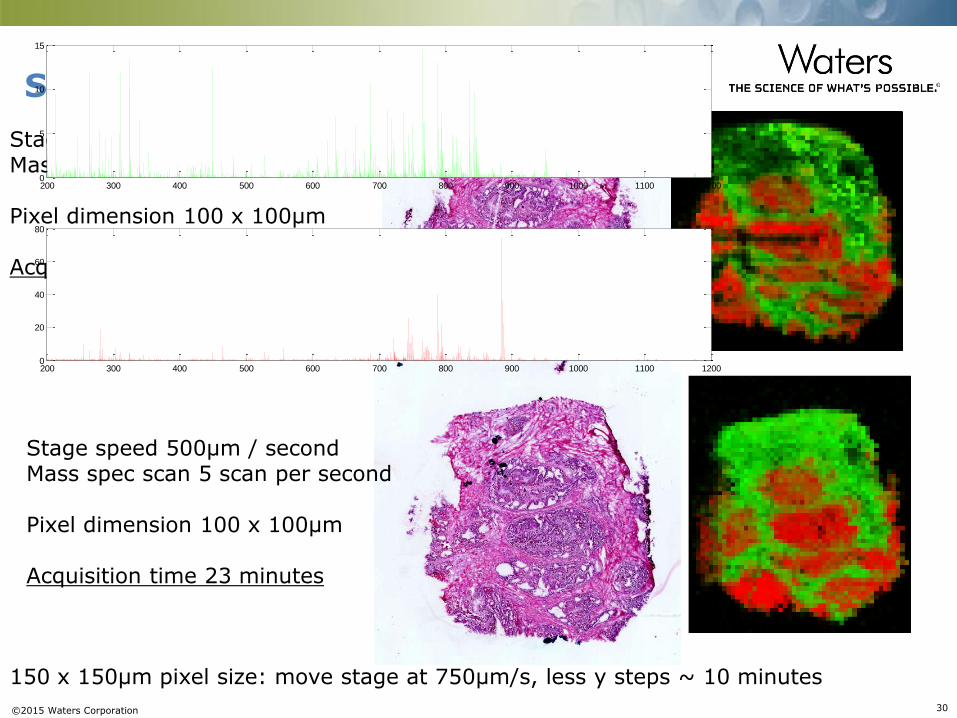
Speed of analysis
Stage speed 100µm / second Mass spec scan 1 scan per second Pixel dimension 100 x 100µm Acquisition time 105 minutes
Stage speed 500µm / second Mass spec scan 5 scan per second Pixel dimension 100 x 100µm Acquisition time 23 minutes
200 300 400 500 600 700 800 900 1000 1100 12000
5
10
15
200 300 400 500 600 700 800 900 1000 1100 12000
20
40
60
80
150 x 150µm pixel size: move stage at 750µm/s, less y steps ~ 10 minutes
©2015 Waters Corporation 31
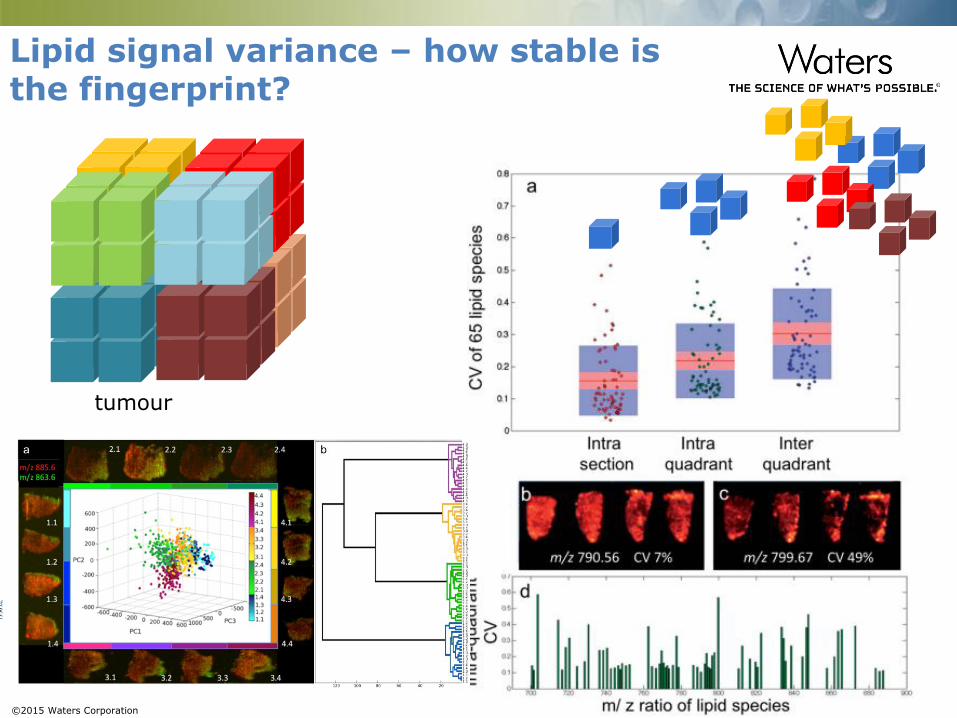
tumour
Lipid signal variance – how stable is the fingerprint?
©2015 Waters Corporation 32
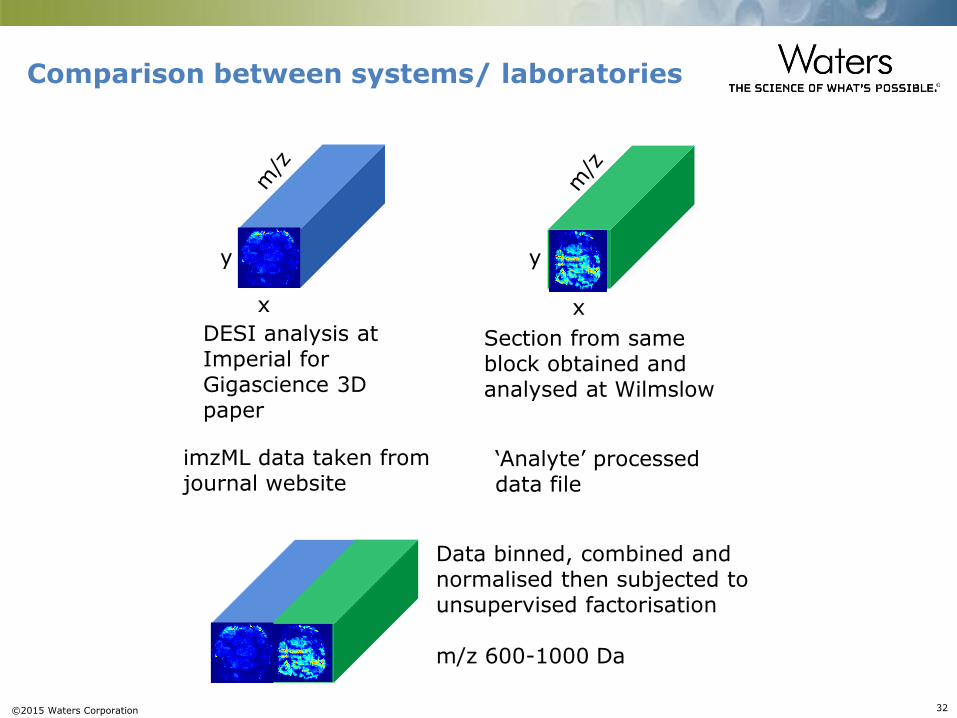
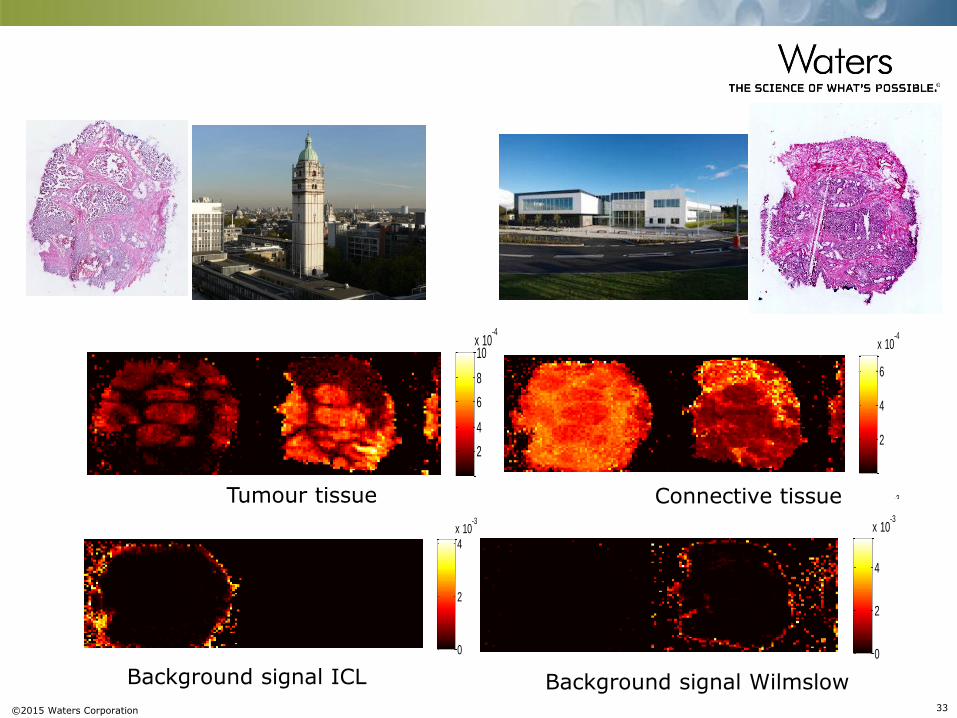
Comparison between systems/ laboratories
20 40 60 80 100 120 140
5
10
15
20
25
30
35
40
45
50
55
20 40 60 80 100 120 140
5
10
15
20
25
30
35
40
45
50
55
x
y
x
y
DESI analysis at Imperial for Gigascience 3D paper
imzML data taken from journal website
Section from same block obtained and analysed at Wilmslow
‘Analyte’ processed data file
20 40 60 80 100 120 140
5
10
15
20
25
30
35
40
45
50
55
20 40 60 80 100 120 140
5
10
15
20
25
30
35
40
45
50
55
Data binned, combined and normalised then subjected to unsupervised factorisation m/z 600-1000 Da
©2015 Waters Corporation 33
0
2
4x 10
-3
2
4
6
8
10x 10
-4
0
2
4
x 10-3
2
4
6
x 10-4
0
2
4x 10
-3
2
4
6
8
10x 10
-4
0
2
4
x 10-3
2
4
6
x 10-4
Connective tissue Tumour tissue
0
2
4x 10
-3
2
4
6
8
10x 10
-4
0
2
4
x 10-3
2
4
6
x 10-4
0
2
4x 10
-3
2
4
6
8
10x 10
-4
0
2
4
x 10-3
2
4
6
x 10-4
Background signal ICL Background signal Wilmslow
©2015 Waters Corporation 34
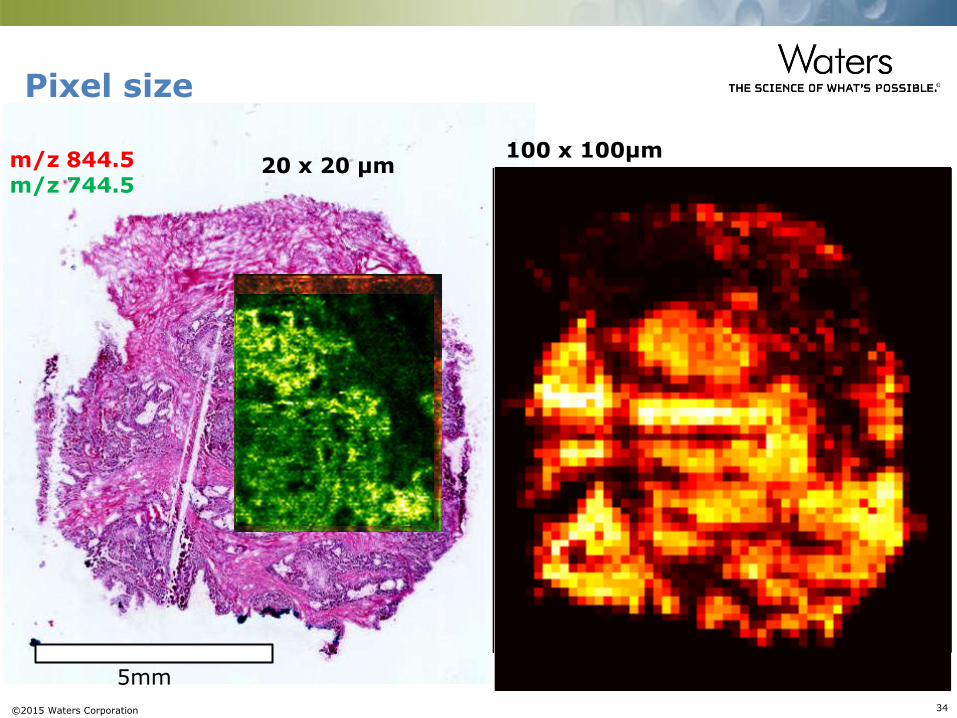
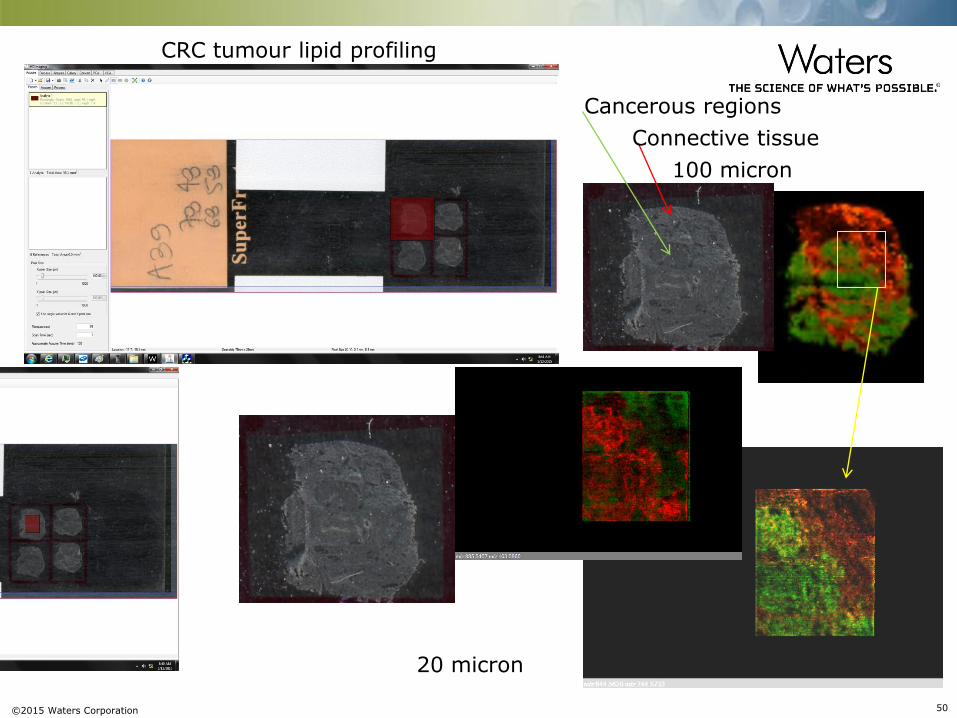
Pixel size
100 µm
20 x 20 µm m/z 844.5 m/z 744.5
5mm
10 20 30 40 50 60
10
20
30
40
50
60
70
10 20 30 40 50 60
10
20
30
40
50
60
70
100 x 100µm
10 20 30 40 50 60
10
20
30
40
50
60
70
10 20 30 40 50 60
10
20
30
40
50
60
70
©2015 Waters Corporation 35
Spatial resolution
Spatial resolution at this scale allows applications where
previous system would not provide sufficient clarity of data
No sample preparation therefore no concerns about migration of
compounds e.g. during matrix deposition
Experimental times become large at these pixel sizes
Ideal situation for the multiple analysis approach
©2015 Waters Corporation 36
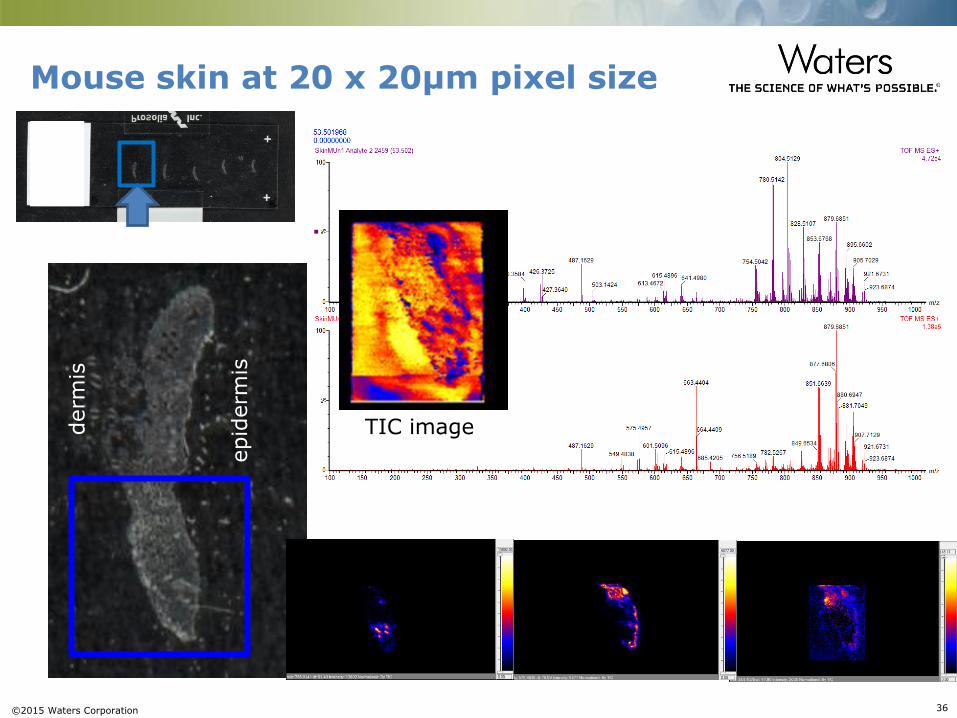
TIC derm
is
epid
erm
is
TIC image
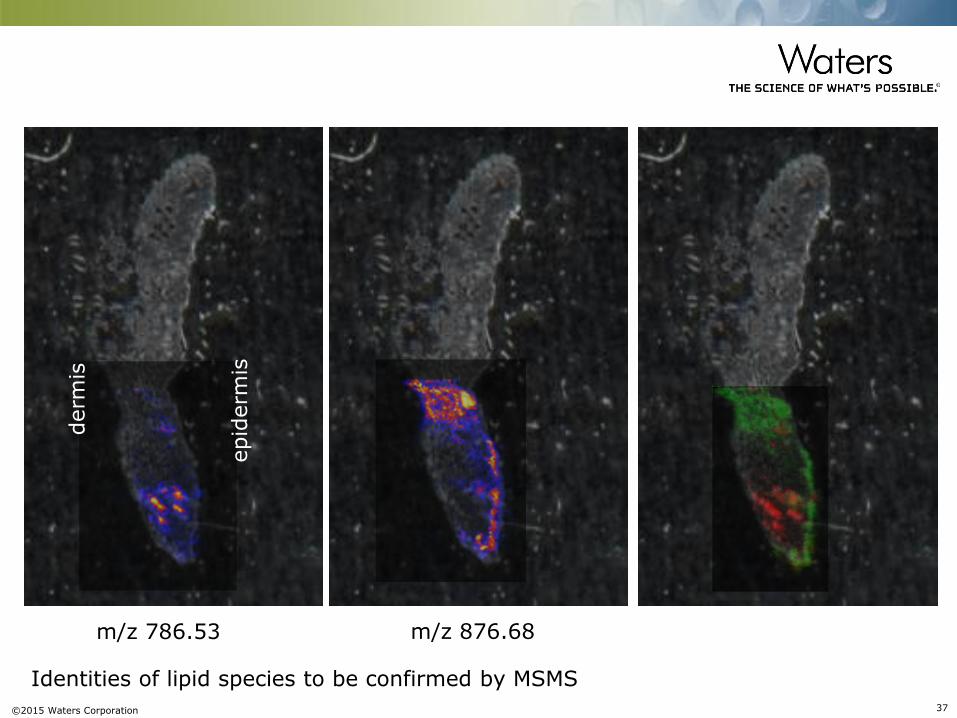
Mouse skin at 20 x 20µm pixel size
©2015 Waters Corporation 37
m/z 876.68 m/z 786.53
derm
is
epid
erm
is
Identities of lipid species to be confirmed by MSMS
©2015 Waters Corporation 38
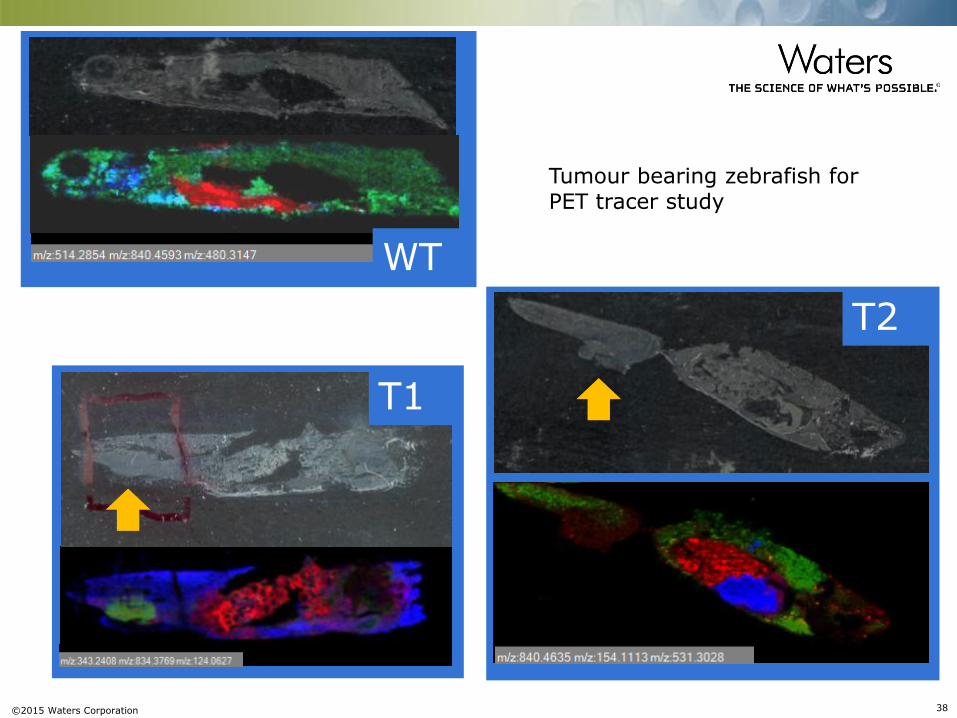
WT
T2
T1
Tumour bearing zebrafish for PET tracer study
©2015 Waters Corporation 39
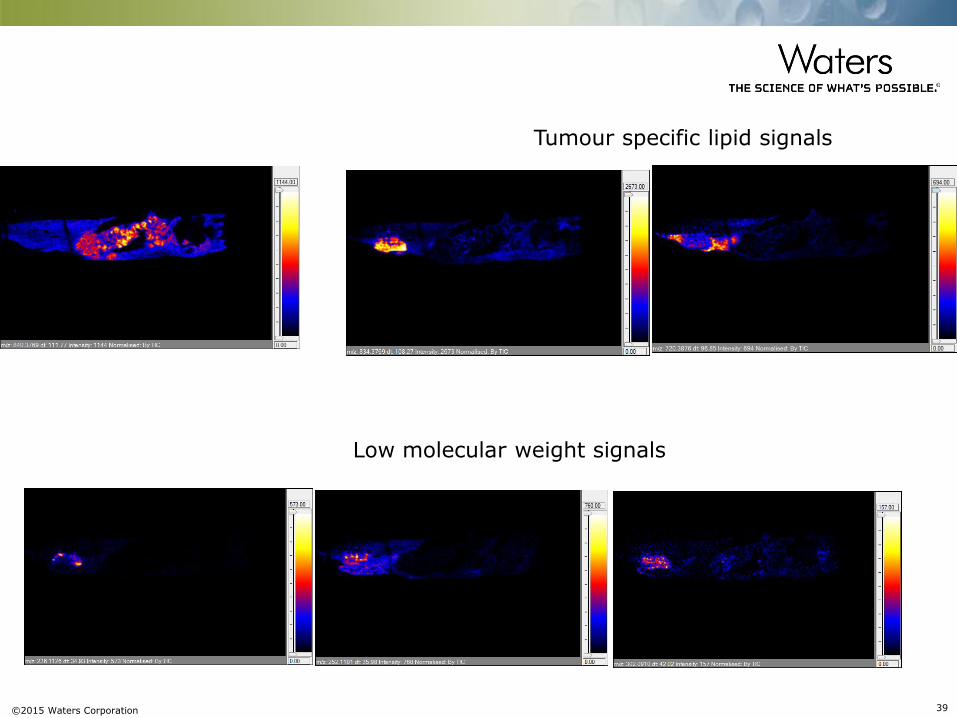
Tumour specific lipid signals
Low molecular weight signals
©2015 Waters Corporation 40
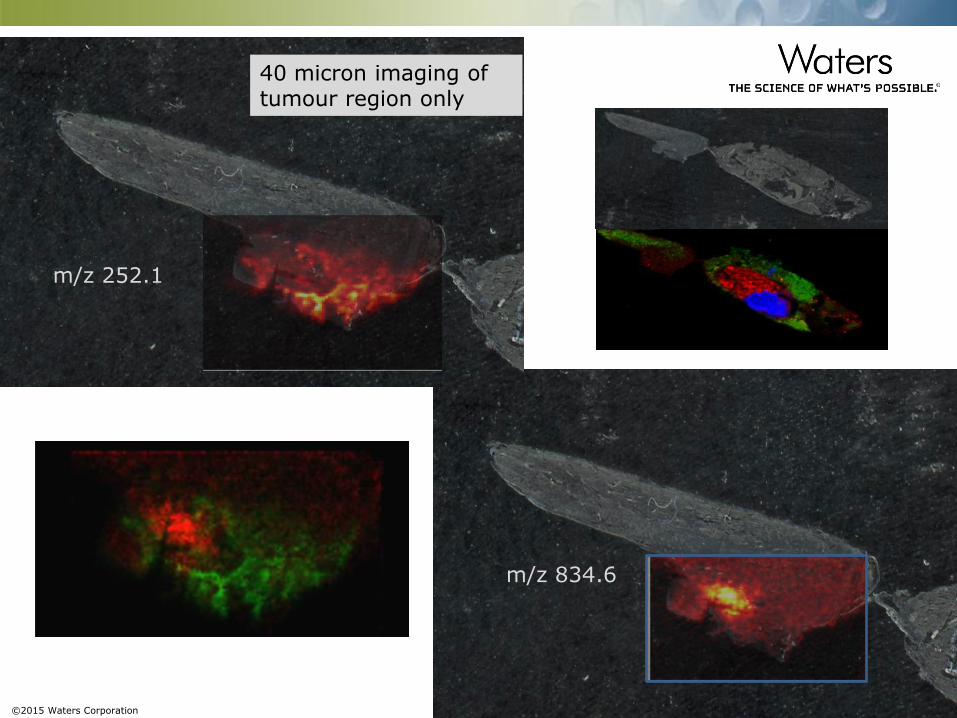
m/z 252.1
m/z 834.6
40 micron imaging of tumour region only
©2015 Waters Corporation 41
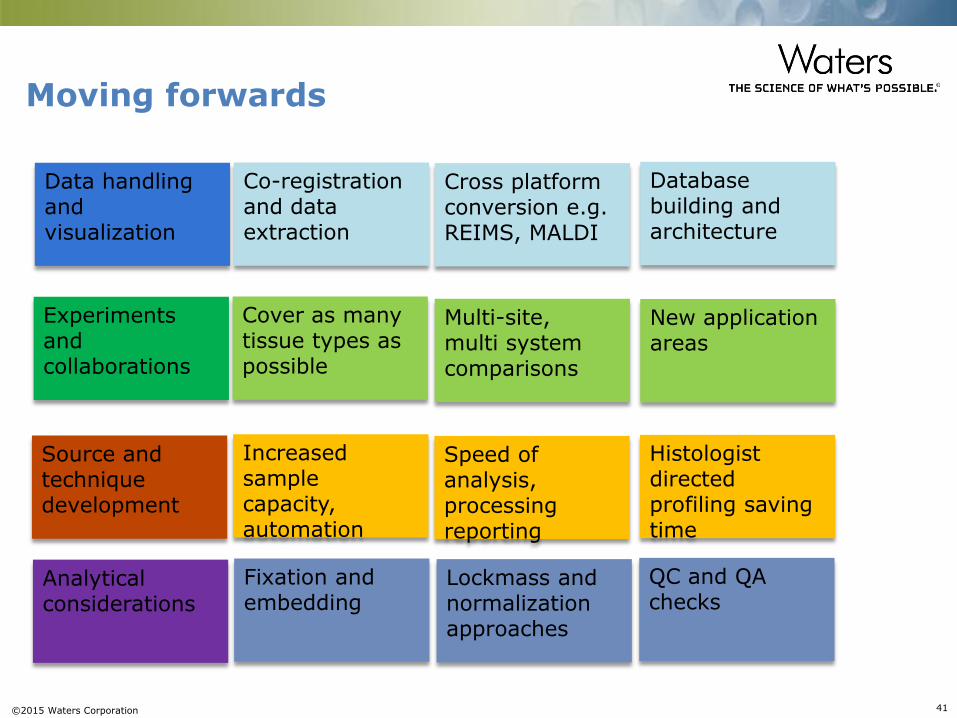
Moving forwards
Data handling and visualization
Co-registration and data extraction
Database building and architecture
Cross platform conversion e.g. REIMS, MALDI
New application areas
Multi-site, multi system comparisons
Experiments and collaborations
Cover as many tissue types as possible
Increased sample capacity, automation
Source and technique development
Histologist directed profiling saving time
Speed of analysis, processing reporting
QC and QA checks
Lockmass and normalization approaches
Fixation and embedding
Analytical considerations
©2015 Waters Corporation 42
Anna Mroz Nicole Strittmatter Jocelyn Tillner Abigail Speller Nima Abbassi-Ghadi Zoltan Takats
Cunyu Yan Perdita Barran Alex Kendall Anna Nicolaou Fiona Henderson Adam McMahon Kaye Williams
Mark Towers Emmanuelle Claude Steve Pringle Steve O’Brian
©2015 Waters Corporation 43
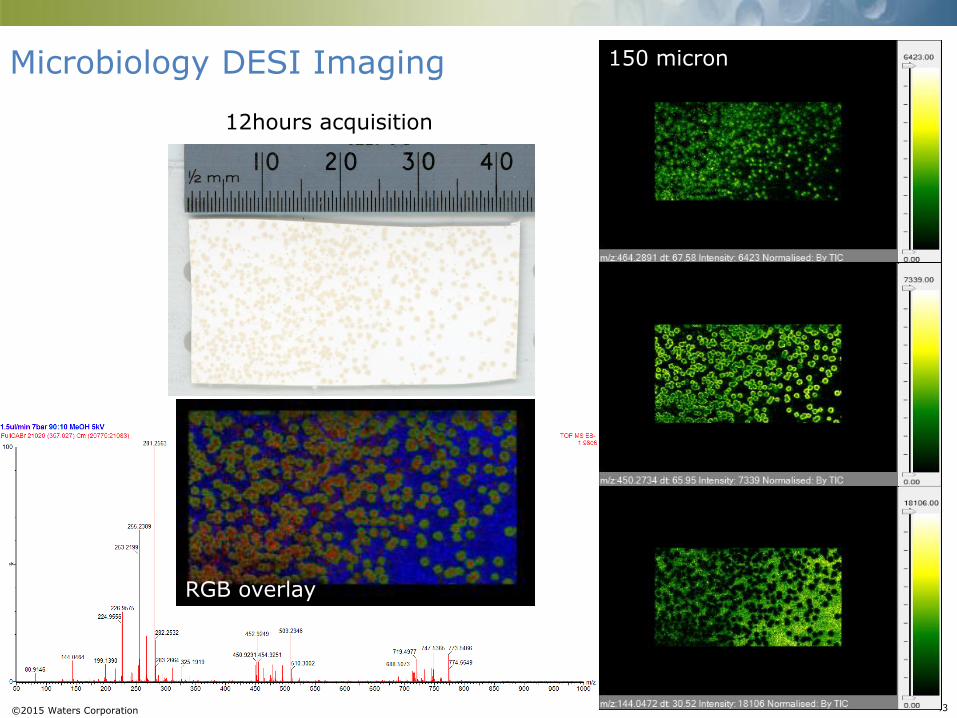
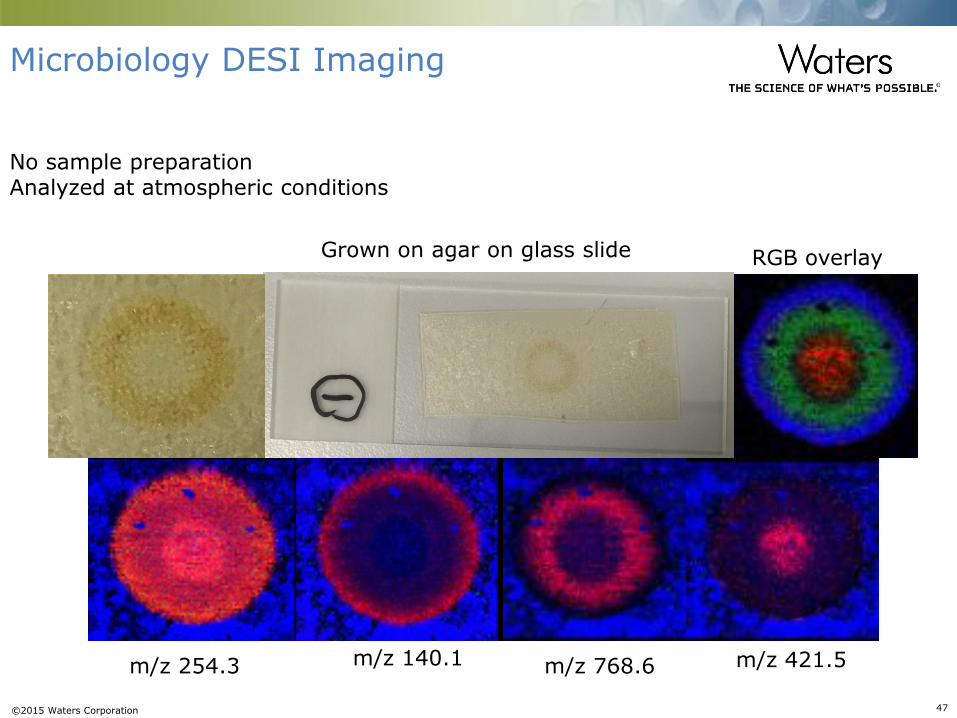
12hours acquisition
Microbiology DESI Imaging
RGB overlay
150 micron
©2015 Waters Corporation 44
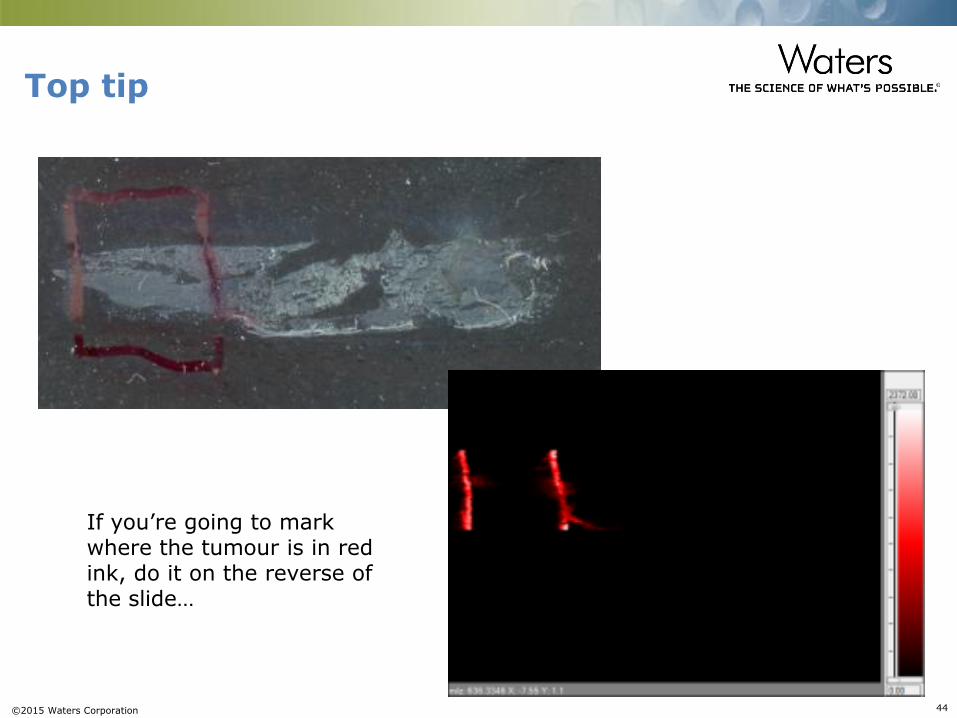
Top tip
If you’re going to mark where the tumour is in red ink, do it on the reverse of the slide…
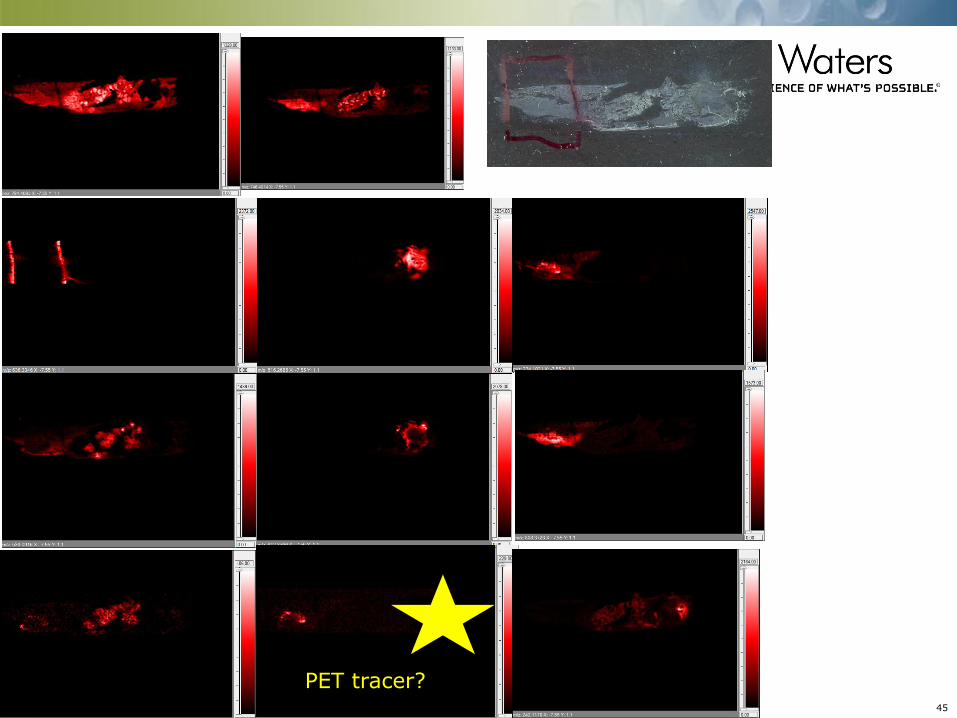
©2015 Waters Corporation 45
PET tracer?
©2015 Waters Corporation 46
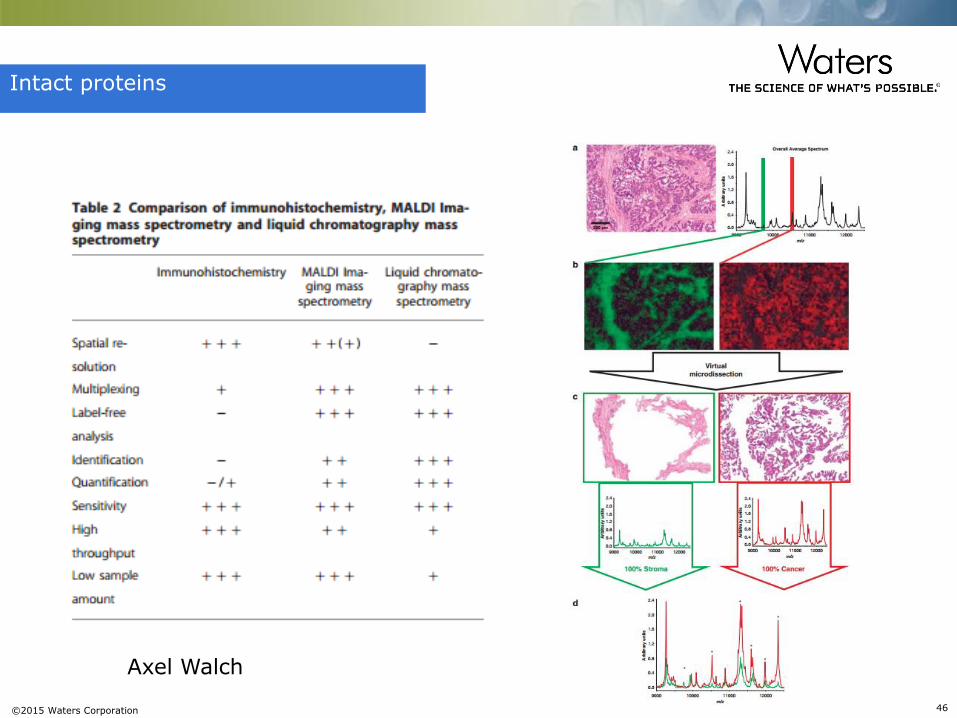
Intact proteins
Axel Walch
©2015 Waters Corporation 47
m/z 140.1 m/z 254.3 m/z 768.6 m/z 421.5
Grown on agar on glass slide
No sample preparation Analyzed at atmospheric conditions
Microbiology DESI Imaging
RGB overlay
©2015 Waters Corporation 48
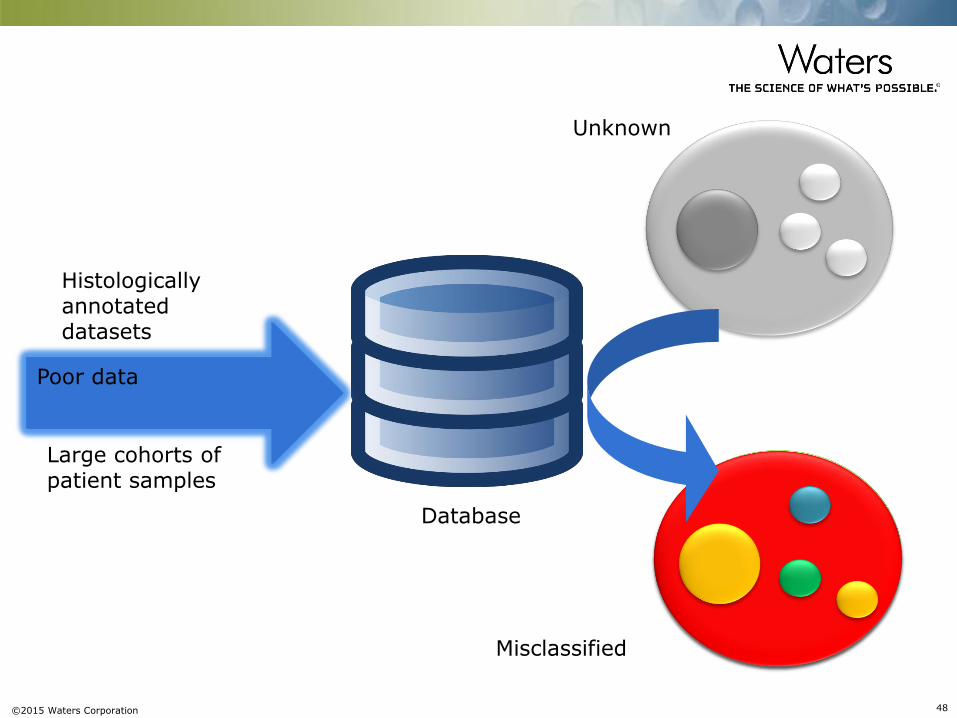
Good data
Unknown
Classified
Database
Large cohorts of patient samples
Histologically annotated datasets
Unclassified Misclassified
Inconsistent data Poor data
©2015 Waters Corporation 49
©2015 Waters Corporation 50
20 x 20µm pixel
100 micron
20 micron
CRC tumour lipid profiling
Connective tissue
Cancerous regions
©2015 Waters Corporation 51
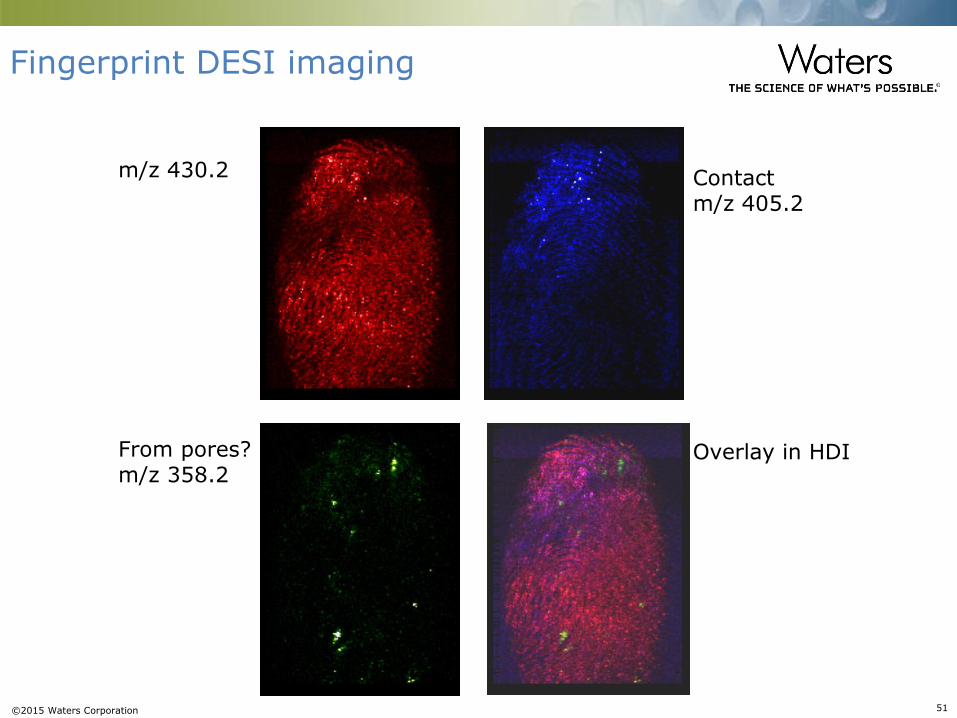
Fingerprint DESI imaging
Contact m/z 405.2
From pores? m/z 358.2
m/z 430.2
Overlay in HDI
©2015 Waters Corporation 52
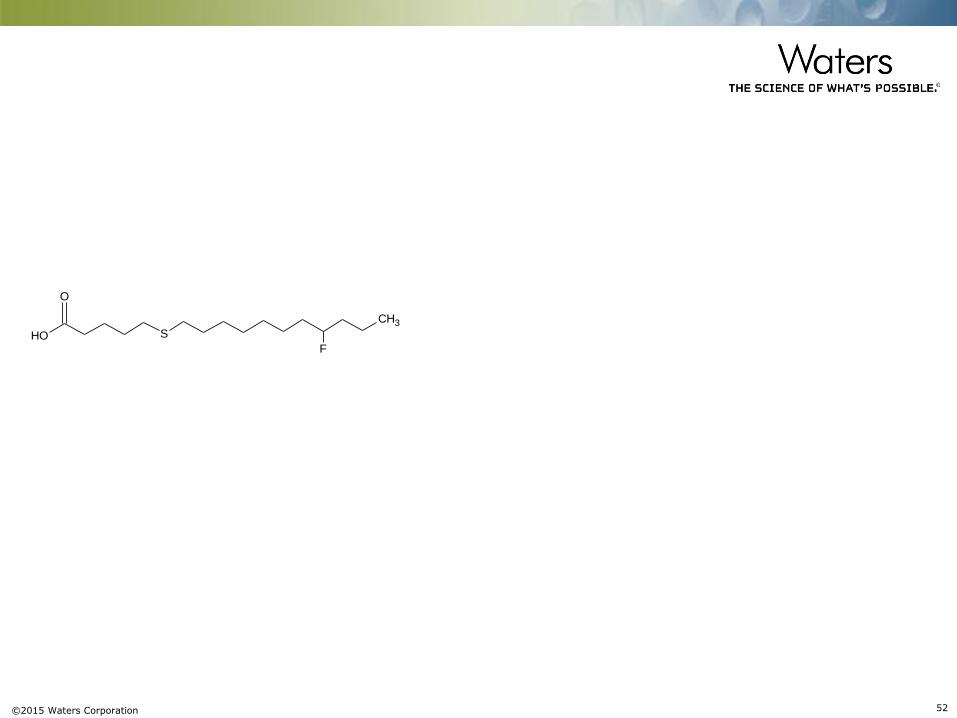
S
CH3
O
OHF
©2015 Waters Corporation 53
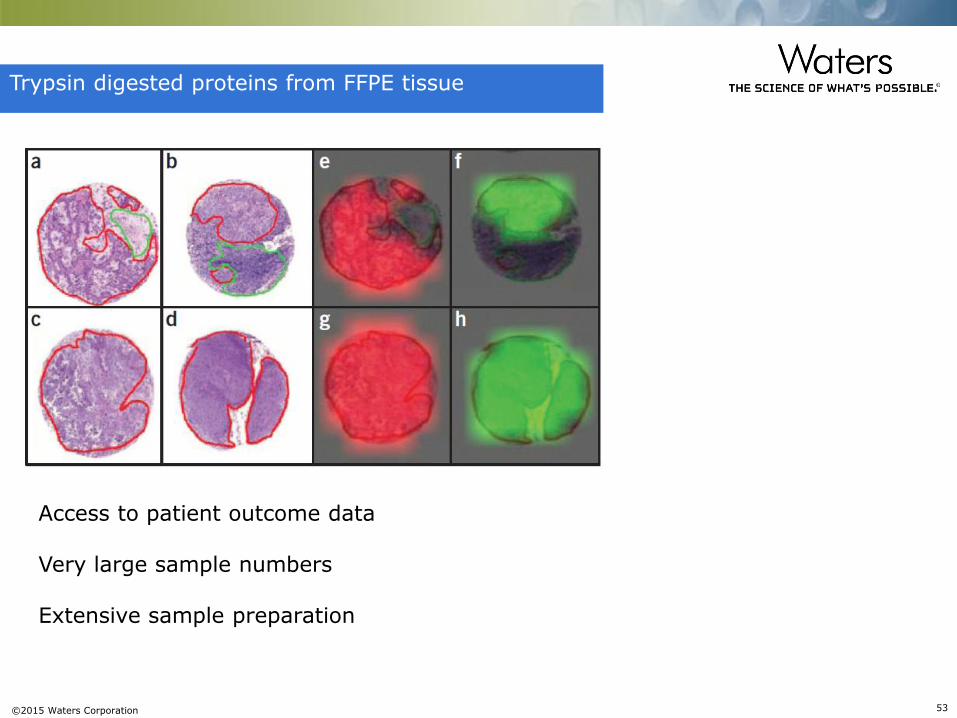
Trypsin digested proteins from FFPE tissue
Access to patient outcome data Very large sample numbers Extensive sample preparation
©2015 Waters Corporation 54
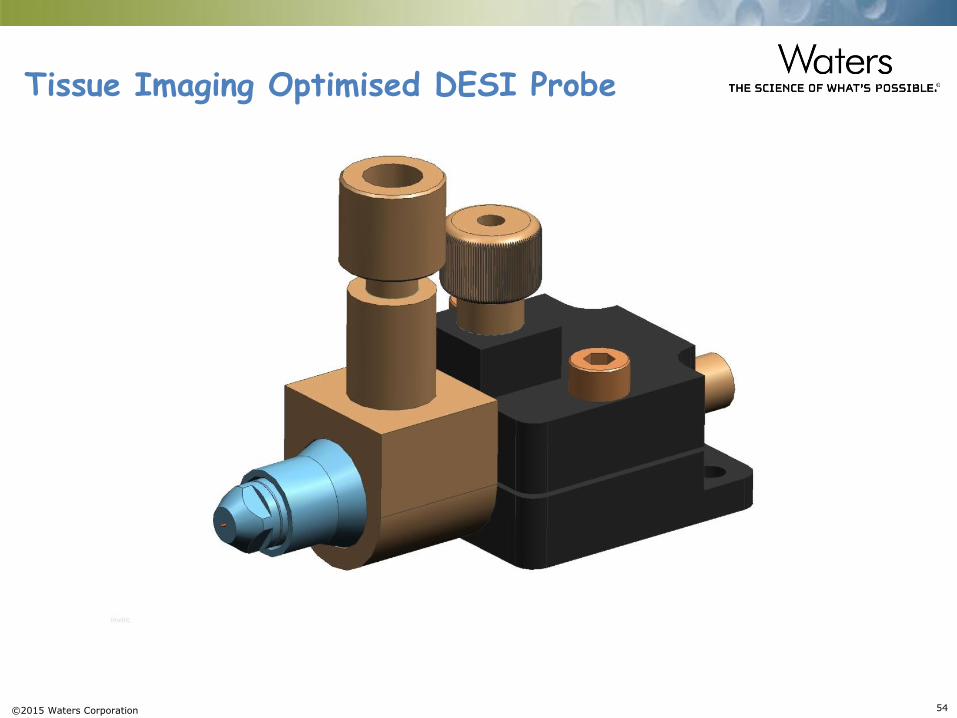
Tissue Imaging Optimised DESI Probe
©2015 Waters Corporation 55
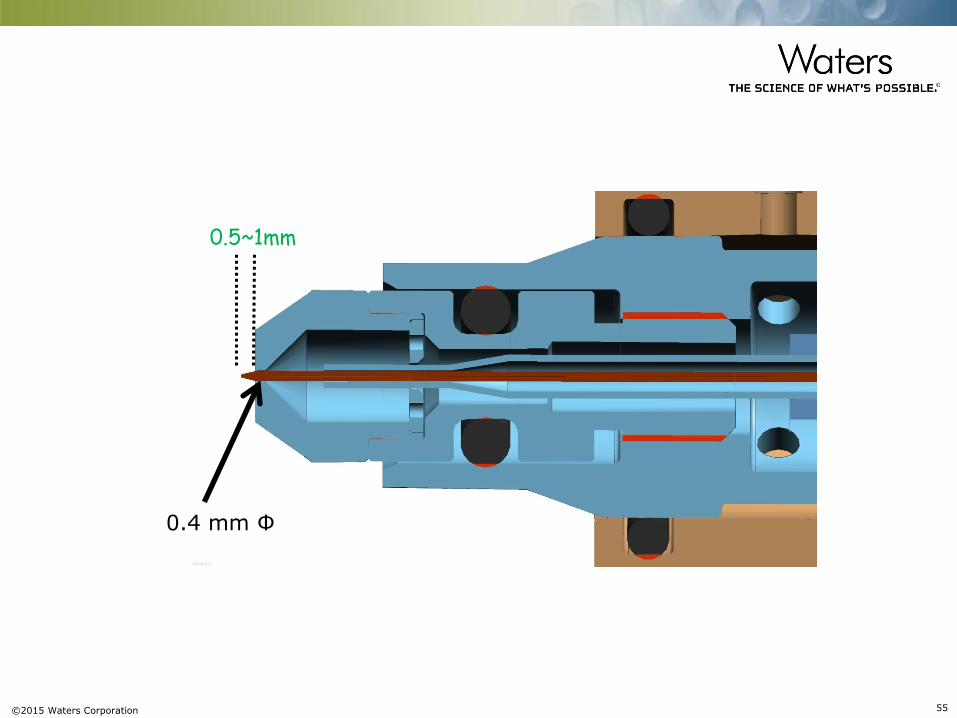
0.4 mm Ф
0.5~1mm
©2015 Waters Corporation 56
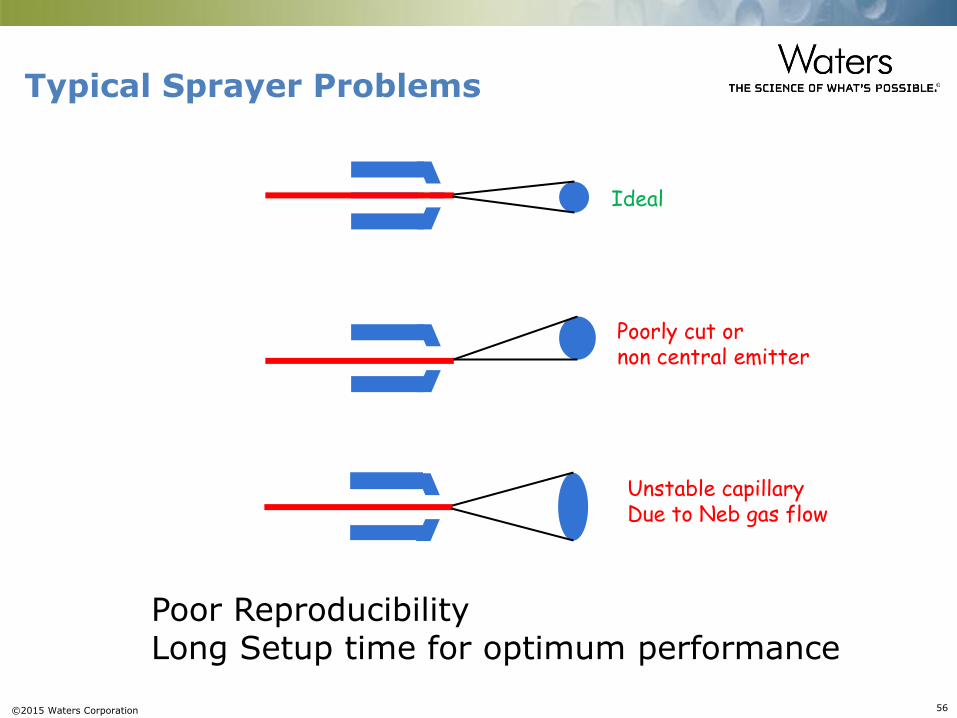
Typical Sprayer Problems
Ideal
Poorly cut or non central emitter
Unstable capillary Due to Neb gas flow
Poor Reproducibility Long Setup time for optimum performance
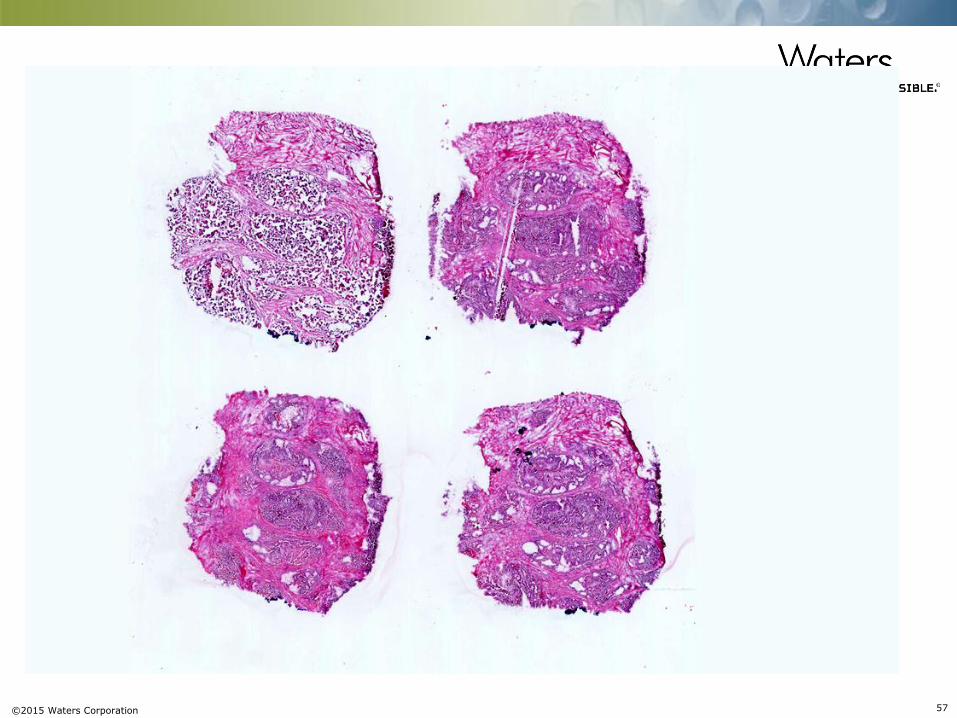
©2015 Waters Corporation 57
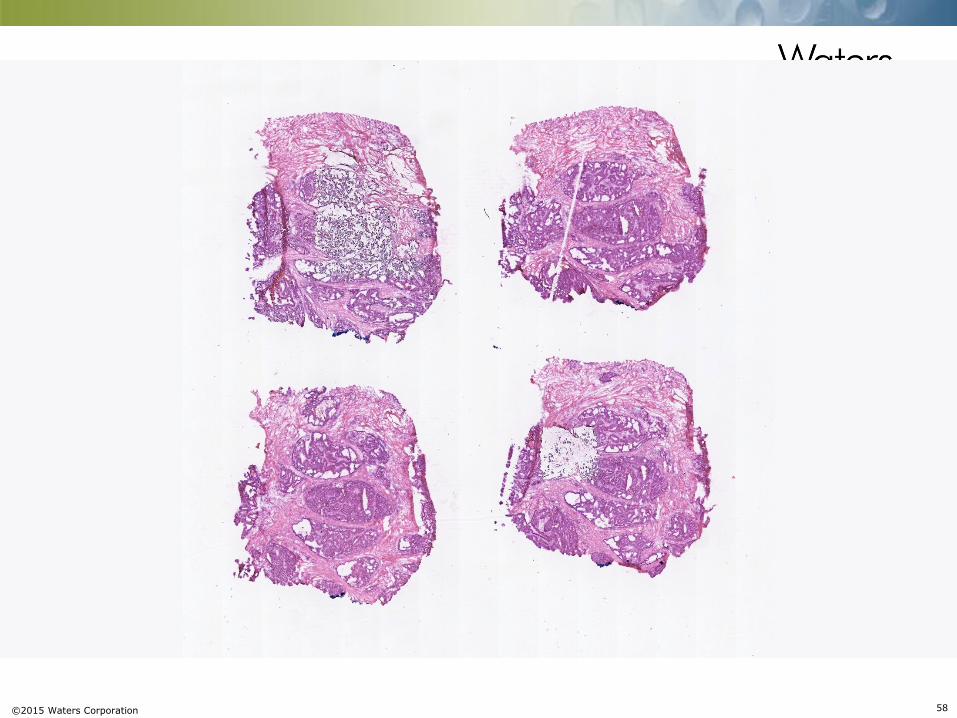
©2015 Waters Corporation 58
©2015 Waters Corporation 59
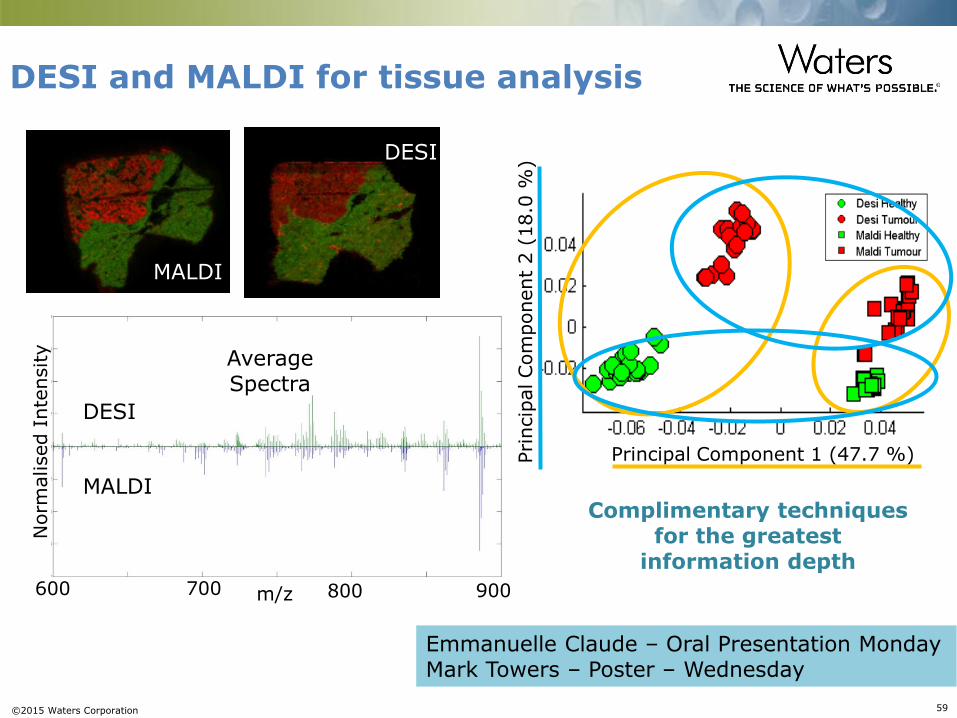
DESI and MALDI for tissue analysis
Principal Component 1 (47.7 %) Pri
ncip
al Com
ponent
2 (
18.0
%)
m/z
DESI
MALDI
Average Spectra
Norm
alised I
nte
nsity
600 700 800 900
DESI
MALDI
Complimentary techniques for the greatest
information depth
Emmanuelle Claude – Oral Presentation Monday Mark Towers – Poster – Wednesday