molecular phylogenetics and evolution · and bismarck archipelagos—has a complex geological and...
TRANSCRIPT

Molecular Phylogenetics and Evolution xxx (2009) xxx–xxx
ARTICLE IN PRESS
Contents lists available at ScienceDirect
Molecular Phylogenetics and Evolution
journal homepage: www.elsevier .com/ locate /ympev
Uncovering cryptic diversity in Aspidomorphus (Serpentes: Elapidae): Evidencefrom mitochondrial and nuclear markers
Genevieve A. Metzger a, Fred Kraus b, Allen Allison b, Christopher L. Parkinson a,*
a Department of Biology, University of Central Florida, 4000 Central Florida Blvd, Orlando, FL 32816, USAb Department of Natural Sciences, Bishop Museum, 1525 Bernice Street, Honolulu, HI 96817, USA
a r t i c l e i n f o
Article history:Received 23 April 2009Revised 21 July 2009Accepted 26 July 2009Available online xxxx
Keywords:New GuineamtDNA and nuDNA concordanceCryptic speciesHydrophiinaeDemansiaToxicocalamus
1055-7903/$ - see front matter � 2009 Elsevier Inc. Adoi:10.1016/j.ympev.2009.07.027
* Corresponding author. Fax: +1 407 823 5967.E-mail address: [email protected] (C.L. Parkin
Please cite this article in press as: Metzger, G.A.and nuclear markers. Mol. Phylogenet. Evol. (20
a b s t r a c t
The Papuan region, comprising New Guinea and nearby islands, has a complex geological history that hasfostered high levels of biodiversity and endemism. Unfortunately, much of this diversity remains undoc-umented. We examine the evolutionary relationships of the venomous snake genus Aspidomorphus (Elap-idae: Hydrophiinae), a Papuan endemic, and document extensive cryptic lineage diversification. BetweenAspidomorphus species we find 22.2–27.9% corrected cyt-b sequence divergence. Within species we find17.7–23.7% maximum sequence divergence. These high levels of genetic divergence may have compli-cated previous phylogenetic studies, which have had difficulty placing Aspidomorphus within the subfam-ily Hydrophiinae. Compared to previous studies, we increase sampling within Hydrophiinae to include allcurrently recognized species of Aspidomorphus and increase species representation for the genera Dem-ansia and Toxicocalamus. We confirm monophyly of Aspidomorphus and resolve placement of the genusutilizing a set of seven molecular markers (12S, 16S, cyt-b, ND4, c-mos, MyHC-2, and RAG-1); we findstrong support for a sister-group relationship between Aspidomorphus and a Demansia/Toxicocalamus pre-ussi clade. We also use one mitochondrial (cyt-b) and one nuclear marker (SPTBN1) to document deepgenetic divergence within all currently recognized species of Aspidomorphus and discuss the SolomonIsland Arc as a potential center of divergence in this species. Lastly, we find high levels of concordancebetween the mtDNA and nuDNA markers used for inter-species phylogenetic reconstruction.
� 2009 Elsevier Inc. All rights reserved.
1. Introduction
With continuing advances in molecular systematics, largeamounts of genetic diversity are being uncovered in nearly all tax-onomic groups (e.g. Elejalde et al., 2008; Hellborg et al., 2005;Thum and Harrison, 2009). The prevalence of unexpected levelsof variation in many species has made it clear that reproductiveisolation and molecular divergence are not necessarily accompa-nied by morphological change (Bickford et al., 2007; Bond et al.,2001; Darda, 1994; Highton and Macgregor, 1983; Narang et al.,1993; Sturmbauer and Meyer, 1992). Research on cryptic diversityhas focused primarily on temperate areas and it remains undeter-mined how much may be present in the tropics, which are home tomore than two-thirds of the world’s described diversity (Bickfordet al., 2007).
The Papuan region—which includes New Guinea and immedi-ately adjacent islands, the Solomon Islands, and the Admiraltyand Bismarck archipelagos—has a complex geological and biologi-cal history. New Guinea is the largest and highest tropical island inthe world (Allison, 2007b). The Central Cordillera, a large mountain
ll rights reserved.
son).
, et al. Uncovering cryptic diver09), doi:10.1016/j.ympev.2009
range that forms the backbone of the island, divides the island intonorthern and southern versants and provides a wealth of differenthabitat types (Beehler, 2007). This range of habitats, combinedwith a geologic history of island-arc accretions and the relative iso-lation of the Papuan region from all large land masses except Aus-tralia, has fostered high levels of biodiversity (Allison, 2007b;Flannery, 1995; Takeuchi, 2007). The herpetofauna of the Papuanregion alone includes more than 800 species, of which over 100have been identified since 2000 and many remain to be described(Allison, 2007a; Allison and Kraus, 2009; F.K., unpubl. data).Approximately 80% of described species of herpetofauna in thePapuan region are endemic and most nonendemics are shared onlywith Australia (Allison, 2007a; Allison and Kraus, 2009).
Of the three families of front-fanged venomous snakes foundworldwide, only one, Elapidae, occurs in the Papuan region. Hydro-phiinae is one of two major subfamilies of elapid snakes and com-prises all marine and terrestrial Australopapuan elapids (Slowinskiand Keogh, 2000; Slowinski et al., 1997). This subfamily representsan adaptive diversification that occurred after the arrival of an ela-pid ancestor in the Australopapuan region approximately 14–30million years ago (MYA; Keogh et al., 1998; Sanders and Lee,2008; Sanders et al., 2008). There are 27 genera and 100 speciesof terrestrial hydrophiines currently recognized (Keogh et al.,
sity in Aspidomorphus (Serpentes: Elapidae): Evidence from mitochondrial.07.027
2 G.A. Metzger et al. / Molecular Phylogenetics and Evolution xxx (2009) xxx–xxx
ARTICLE IN PRESS
1998; Slowinski et al., 1997), including 20 genera (86+ species)found only in Australia or in both Australia and New Guinea, and6 genera (16 species) endemic to the Papuan region. Additionalspecies remain to be described (F.K., unpubl. data).
The hydrophiine genus Aspidomorphus, which occupies lowlandforests of New Guinea and some of its adjacent islands (Fig. 1;McDowell, 1967), contains considerable genetic variation (Keoghet al. 1998) and has the potential for cryptic variation. Morpholog-ically, Aspidomorphus appears most closely related to the venom-ous Austro-Papuan whip snakes in the genus Demansia, based onskull structure, head musculature, and hemipene morphology
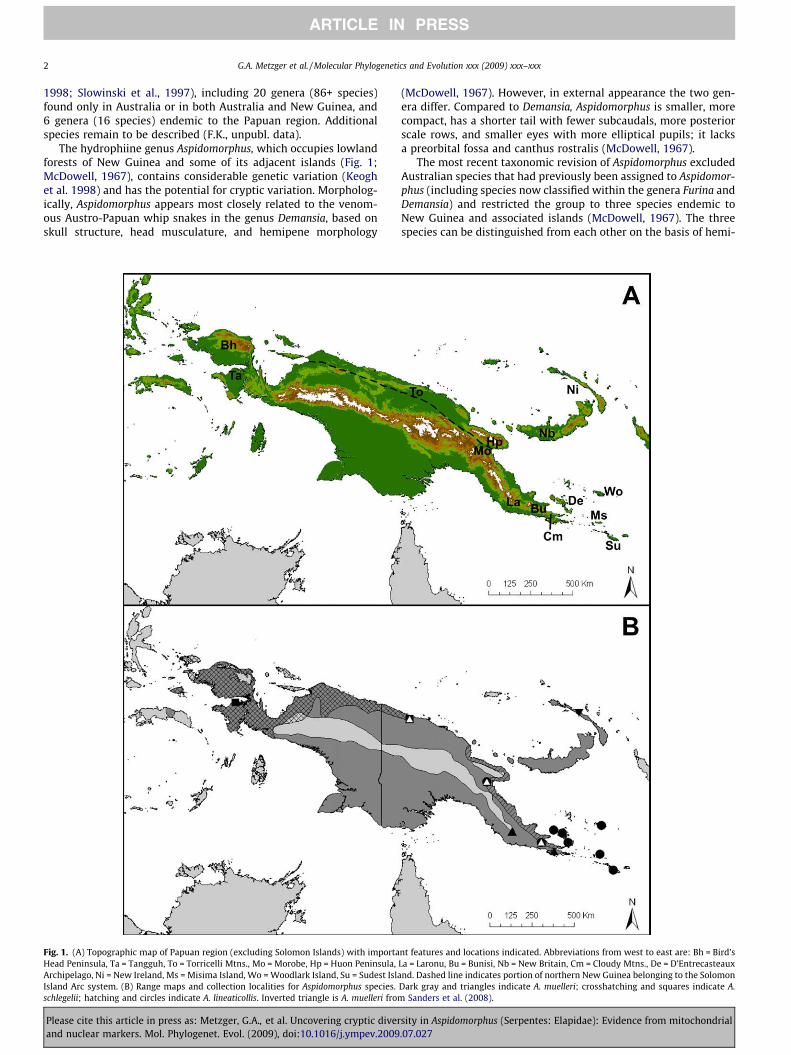
Fig. 1. (A) Topographic map of Papuan region (excluding Solomon Islands) with importaHead Peninsula, Ta = Tangguh, To = Torricelli Mtns., Mo = Morobe, Hp = Huon Peninsula,Archipelago, Ni = New Ireland, Ms = Misima Island, Wo = Woodlark Island, Su = Sudest IslaIsland Arc system. (B) Range maps and collection localities for Aspidomorphus species.schlegelii; hatching and circles indicate A. lineaticollis. Inverted triangle is A. muelleri from
Please cite this article in press as: Metzger, G.A., et al. Uncovering cryptic diverand nuclear markers. Mol. Phylogenet. Evol. (2009), doi:10.1016/j.ympev.2009
(McDowell, 1967). However, in external appearance the two gen-era differ. Compared to Demansia, Aspidomorphus is smaller, morecompact, has a shorter tail with fewer subcaudals, more posteriorscale rows, and smaller eyes with more elliptical pupils; it lacksa preorbital fossa and canthus rostralis (McDowell, 1967).
The most recent taxonomic revision of Aspidomorphus excludedAustralian species that had previously been assigned to Aspidomor-phus (including species now classified within the genera Furina andDemansia) and restricted the group to three species endemic toNew Guinea and associated islands (McDowell, 1967). The threespecies can be distinguished from each other on the basis of hemi-
nt features and locations indicated. Abbreviations from west to east are: Bh = Bird’sLa = Laronu, Bu = Bunisi, Nb = New Britain, Cm = Cloudy Mtns., De = D’Entrecasteauxnd. Dashed line indicates portion of northern New Guinea belonging to the Solomon
Dark gray and triangles indicate A. muelleri; crosshatching and squares indicate A.Sanders et al. (2008).
sity in Aspidomorphus (Serpentes: Elapidae): Evidence from mitochondrial.07.027

G.A. Metzger et al. / Molecular Phylogenetics and Evolution xxx (2009) xxx–xxx 3
ARTICLE IN PRESS
pene morphology, skull structure, and color pattern (McDowell,1967). Of the three Aspidomorphus species, A. muelleri is the largestand is widely distributed across mainland New Guinea and the is-lands of the Bismarck Archipelago (Fig. 1B; McDowell, 1967).Aspidomorphus schlegelii occurs in the northwestern portion ofNew Guinea and A. lineaticollis occupies the eastern portion ofNew Guinea and a number of the offshore islands of Milne BayProvince (Fig. 1B).
There is considerable intraspecific morphological variation inscale counts and color pattern within Aspidomorphus (McDowell,1967). When considered in combination with molecular diver-gence within A. muelleri documented by Keogh et al. (1998) thisvariation suggests that there may be patterns of diversity not cap-tured by current taxonomy. Nevertheless, McDowell (1967) couldnot find geographically consistent patterns in morphological vari-ation in A. muelleri and A. schlegelii and he was not convinced thatthe geographic variation present in A. lineaticollis merited a revisedtaxonomy. Additionally, recent expeditions to New Guinea haverecovered snakes that appear to represent new species (Austinet al., 2008; F.K., pers. obs.).
Despite repeated attempts, studies on the Hydrophiinae com-bining molecular and morphological data or using molecular dataalone have failed to resolve the phylogenetic position of Aspido-morphus (Keogh et al., 1998; Sanders et al., 2008; Scanlon andLee, 2004; Slowinski and Keogh, 2000). These studies have pre-sented several hypotheses, including sister-group relationshipswith Cacophis, Acanthophis, Micropechis, Demansia, a Demansia/Tox-icocalamus clade or a Demansia/Ogmodon clade. Support for each ofthese hypotheses has been weak, with varying taxon samplingamong studies combined with sparse sampling within studies.Additionally, these studies have assumed the monophyly of Aspid-omorphus, using only A. muelleri to represent the entire genus.Monophyly of Aspidomorphus has never been explicitly testedusing molecular data, and molecular studies of other hydrophiinegenera have revealed instances of paraphyly (Pseudechis, Keoghet al., 1998; Hydrophis, Lukoschek and Keogh, 2006; Neelaps, Sand-ers et al., 2008).
In addition to the taxonomic issues highlighted above, the phy-logeography of Aspidomorphus has not been addressed. Recently,several authors have suggested that it is inappropriate to usemtDNA for taxonomic or phylogeographic studies (Ballard andWhitlock, 2004; Bazin et al., 2006; Edwards et al., 2005; Hudsonand Coyne, 2002) unless the results are validated by multiple nu-clear markers. In contrast, Zink and Barrowclough (2008) arguethat mtDNA is an appropriate molecular marker for phylogeo-graphic studies, and that due to long coalescence times and lowmutation rates, nuclear markers are likely to be uninformative ormisleading. Many inter-specific snake phylogeographic and sys-tematic studies to date have relied heavily on mtDNA (Burbrinket al., 2000; Castoe et al., 2007; Daza et al., in press; Guiher andBurbrink, 2008; Lukoschek and Keogh, 2006; Rawlings andDonnellan, 2003; Wüster et al., 2005); in this study we con-duct both separate and combined analyses of mitochondrial andnuclear markers to evaluate their reliability and phylogeographicutility.
Here we address four important phylogenetic questions aboutdiversification in Aspidomorphus. First, we combine four mitochon-drial and three nuclear markers plus the most complete taxonomicsampling of Hydrophiinae to date to address two questions: (1) IsAspidomorphus monophyletic? and (2) What is the sister group toAspidomorphus? We also combine a mitochondrial gene and a nu-clear intron with extensive sampling within Aspidomorphus to ad-dress two additional questions: (3) Do the three species currentlyidentified within Aspidomorphus represent genetically distinct lin-eages? and (4) Does current taxonomy reflect the evolutionary his-tory of this genus?
Please cite this article in press as: Metzger, G.A., et al. Uncovering cryptic diverand nuclear markers. Mol. Phylogenet. Evol. (2009), doi:10.1016/j.ympev.2009
2. Materials and methods
2.1. Sampling
We acquired 51 blood or liver tissue samples, from all threenominal species of Aspidomorphus as well as from the hydrophiinegenera Demansia, Micropechis, and Toxicocalamus (Appendix A) foruse as outgroups in our analyses. Sequences for 48 additional out-groups (33 genera) were obtained from Kate Sanders (Sanders et al.2008), allowing us to include representatives of nearly all terres-trial hydrophiine genera and all major lineages of sea snakes. ForA. lineaticollis, we sampled 30 individuals, including three individ-uals from the mainland and others from the islands of Sudest, Mis-ima, Woodlark, Goodenough, Fergusson, and Normanby. Kiriwinawas the only island with a known population of A. lineaticollis thatwe were unable to sample. For A. muelleri we collected 15 individ-uals from five mainland localities representing the northeasternquarter of the species range. For A. schlegelii, historically the leastcollected member of this genus (McDowell, 1967; Shine andKeogh, 1996), we were able to obtain three individuals: two fromthe Torricelli Mtns. in Papua New Guinea (PNG) and one fromTangguh in Papua Province of Indonesia (Fig. 1).
2.2. Laboratory methods
We extracted total genomic DNA from tissue samples using theDNEasy Blood and Tissue Kit (Qiagen). To address our first twoquestions we amplified seven loci for ten individuals selected torepresent the geographic and taxonomic range present in our sam-pling (Fig. 1, Appendix A): cytochrome b (cyt-b), 12S rRNA (12S),16S rRNA (16S), NADH dehydrogenase and associated tRNAs(ND4), myosin heavy chain 2 intron (MyHC-2), oocyte maturationfactor (c-mos), and recombination activating gene 1 (RAG-1). Wecall this the Q12 dataset. To address questions 3 and 4 we ampli-fied the mitochondrial gene cyt-b and one nuclear locus, b-spectrinnonerythrocytic intron 1 (SPTBN1; Matthee et al., 2001) for all 51samples used in this study. We call this the Q34 dataset. PCR con-ditions and primers for all loci used in this study are given in Table1. For eleven degraded samples of A. lineaticollis (from the islandsof Misima, Woodlark, and Goodenough), we designed internalprimers to amplify the cyt-b gene in three segments (Table 1)and were unable to amplify SPTBN1. Sequencing of PCR productswas done by the Nevada Genomics Center on an ABI sequencerand chromatograms were edited using Sequencher 4.7 (GeneCodes Corp.). For SPTBN1 we found several heterozygotes with al-leles that differed by a single nucleotide. These sites were codedusing appropriate ambiguity codes. We performed sequence align-ment in MEGA 3.1 (Kumar et al., 2004) using Clustal W, and we re-fined alignments by eye. Ambiguous sections were identified byeye and excluded from analysis. GenBank accession numbers forall cyt-b and SPTBN1 sequences generated for this study are givenin Appendix A. Accession numbers for all other sequences gener-ated for this study are given in Appendix B. Accession numbersfor the previously published sequences are in Sanders et al. 2008.
2.3. Phylogenetic analysis
For questions 1 and 2, we combined our Q12 dataset with thedata from Sanders et al. (2008) and recovered the phylogenythrough Bayesian inference (BI) following the Sanders et al. meth-odology. We used MrBayes 3.1 (Ronquist and Huelsenbeck, 2003)with seven data partitions: mitochondrial protein-coding genespartitioned by codon position, mitochondrial RNA, nuclear pro-tein-coding codon positions 1 and 2, nuclear protein-coding codon
sity in Aspidomorphus (Serpentes: Elapidae): Evidence from mitochondrial.07.027

Table 1Primers and PCR conditions for all genes used in this study.
Gene Primers Temp (�C) MgCl (mM) Reference
RAG-1 G396 (R13) 50-TCT GAA TGG AAA TTC AAG CTG TT-30 57 3 Groth and Barrowclough (1999)G397 (R18) 50-GATGCTGCCTCGGTCGGCCACCTTT-30
C-MOS G303 50-ATT ATG CCA TCM CCT MTT CC-30 53 4 Saint et al. (1998) and Hugall et al. (2008)G74 50-TGA GCA TCC AAA GTC TCC AAT C-30
G708 50-GCT ACA TCA GCT CTC CAR CA-30
MyHC-2 G240 50-GAA CAC CAG CCT CAT CAA CC-30 61 1.5 Lyons et al. (1997)G241 50-TGG TGT CCT GCT CCT TCT TC-30
12S rRNA tRNA-Phe 50-AAA GTA TAG CAC TGA AAA TGC TAA GAT GG-30 45 1.25 Keogh et al. (1998)tRNA-Val 50-GTC GTG TGC TTT AGT CTA AGC TAC-30
16S rRNA 50-CGC CTG TTT ATC AAA AAC AT-30 48 1 Kocher et al. (1989)50-CCG GTC TGA ACT CAG ATC ACG T-30
ND4 + tRNA ND4 50-TGA CTA CCA AAA GCT CAT GTA GAA GC-30 48 2 Arévalo et al. (1994)tRNA-Leu 50-TAC TTT TACC TTG GAT TTG CAC CA-30
cyt-b + tRNA L14910 50-GAC CTG TGA TMT GAA AAA CCA YCG TTG T-30 48 3 Burbrink et al. (2000)H16064 50-CTT TGG TTT ACA AGA ACA ATG CTT TA-30
cyt-b (fragment 1) L14910 50-GAC CTG TGA TMT GAA AAA CCA YCG TTG T-30 48 3 This study and Burbrink et al. (2000)Asp_linCTB348 50-CCA AAG AAG GCT GTT GC-30
cyt-b (fragment 2) Asp_linCTB308 50-TAC GGC CTA TAC CTT AAC AAA G-30 48 3 This studyAsp_linCTB768 50-CGG GTT TAA TRT GTT GAG G-30
cyt-b (fragment 3) Asp_linCTB758 50-AAC TTC ACT AAA GCG AAY CC-30 48 3 This study and Burbrink et al. (2000)H16064 50-CTT TGG TTT ACA AGA ACA ATG CTT TA-30
SPTBN1 SPTBN1-F1 50-TCT CAA GAC TAT GGC AAA CA-30 55 3 Matthee et al. (2001)SPTBN1-R1 50-CTG CCA TCT CCC AGA AGA A-30
4 G.A. Metzger et al. / Molecular Phylogenetics and Evolution xxx (2009) xxx–xxx
ARTICLE IN PRESS
position 3, and MyHC-2. Models were selected for each partitionusing Mr. ModelTest 2.2 (Nylander et al., 2004).
For questions 3 and 4, we used our Q34 dataset and inferred thephylogeny using BI and maximum likelihood (ML). We checked forconcordance among loci by running separate preliminary Bayesiananalyses (following the procedures outlined below for the concat-enated dataset) of each gene and compared the topologies. Weimplemented BI in MrBayes 3.1 and used GARLI 0.96 (Zwickl,2006) to implement ML analysis. Based on the results of our anal-ysis of the Q12 dataset (see Fig. 2), Micropechis ikaheka was chosenas the outgroup for both analyses.
For BI we implemented three partitioning strategies. For thefirst, we partitioned our data by locus only. For the second andthird, we partitioned by locus and also partitioned the cyt-b datausing two codon-based methods: (1) all codon positions parti-tioned separately and (2) first and second codon positions togetherwith third codon positions partitioned separately. We used Mr.ModelTest 2.2 to select a best-fit model for each partition basedon Akaike Information Criteria (AIC) and ran preliminary Bayesiananalyses on the partitioned data sets. Relative Bayes Factors wereused to compare partitioning strategies. As there were no signifi-cant differences in Relative Bayes Factors, we implemented thesimplest strategy, partitioning by locus only, with the selectedmodels in MrBayes (GTR+I+U for cyt-b and HKY+U for SPTBN1).We initiated two independent runs (each with 1 cold and 3 heatedchains) with random starting trees and ran them for a total of3 � 106 generations with trees sampled every 100 generations.We discarded the first 7.5 � 105 generations based on stationarity,assessed using the program Tracer (Rambaut and Drummond,2007). A 50% majority-rule phylogram was constructed from thecombined runs.
As GARLI does not support the use of mixed models we used Mr.ModelTest 2.2 on the unpartitioned data set and implemented MLanalysis using the best fit model, GTR +I+U. We used defaultparameter settings in GARLI and terminated each run after20,000 generations elapsed without improvement in the likelihoodscore of the topology. Four runs were initiated to ensure that con-vergence had been reached. We then evaluated bootstrap supportusing 1000 replicates, each terminated after 10,000 generationselapsed with no improvement in the likelihood score of the topol-ogy as recommended by the program authors.
Please cite this article in press as: Metzger, G.A., et al. Uncovering cryptic diverand nuclear markers. Mol. Phylogenet. Evol. (2009), doi:10.1016/j.ympev.2009
To aid comparison of Aspidomorphus to other closely relatedtaxa, we calculated genetic distances for cyt-b in the programMEGA using a Kimura 2-parameter model and gamma-distributedrate variation.
3. Results
For our analysis of the Q12 dataset, we used a total of 5771 bpof sequence data, including 1031 bp of 12S, 507 bp of 16S, 854 bp ofND4 + tRNAs (histidine, serine, and leucine), 1145 bp of cyt-b + tRNA, 523 bp of MyHC-2, 641 bp of c-mos, and 1068 bp ofRAG-1. Using BI we recovered a monophyletic Aspidomorphus with100% posterior probability (Pp) support. Aspidomorphus formed thesister taxon to a clade comprising Demansia and Toxicocalamus pre-ussi (100% Pp). Toxicocalamus loriae and Micropechis ikaheka (77%Pp) are sister species, making Toxicocalamus nonmonophyletic(Fig. 2). The D. psammophis sample added in this study clusteredwith the two Demansia species from the previous study (100% Pp).
Each currently recognized species within Aspidomorphus wasrecovered as genetically distinct (100% Pp). The A. muelleri samplefrom New Ireland (Sanders et al., 2008) clusters with our samplefrom north of the Huon Peninsula (100% Pp) and is the sister taxonto our samples of A. muelleri collected south of the Huon Peninsula(100% Pp).
The Q34 dataset had a length of 2291 bp of which a 17-bp sec-tion of tRNA at the 30 end of cyt-b was excluded from analysis dueto ambiguity in the alignment. Within Aspidomorphus, we identi-fied 44 unique cyt-b haplotypes and 13 unique SPTBN1 genotypes.The cyt-b alignment of 1117 bp had a total of 523 variable charac-ters, of which 422 were parsimony-informative. The SPTBN1 align-ment of 1174 bp had 103 bp of the b-spectrin nonerythrocytic exon1 at the 50 end and 106 bp of the b-spectrin nonerythrocytic exon 2at the 30 end. There were 110 variable characters and 58 parsi-mony-informative characters. Analysis of each gene region inde-pendently resulted in only two instances of a well supported(P95% posterior probability in both trees; Fig. 3) difference inthe topologies, both within species, therefore we concatenatedthe data sets for all further analyses according to recommendationsby Wiens (1998).
Analysis of the concatenated Q34 dataset with both BI and MLmethods also yielded nearly identical topologies, differing only in
sity in Aspidomorphus (Serpentes: Elapidae): Evidence from mitochondrial.07.027

Fig. 2. Bayesian phylogram of hydrophiine relationships. Numbers represent posterior probabilities and dots represent nodes with 100% posterior probability support.Samples with field tags are new to this study. Clades shown in bold are highlighted in the text.
G.A. Metzger et al. / Molecular Phylogenetics and Evolution xxx (2009) xxx–xxx 5
ARTICLE IN PRESS
placement of some recently diverged lineages (Fig. 4). Resolutionwas higher in the Bayesian analysis but support values for these re-gions were low in both analyses. Aspidomorphus again formed amonophyletic group with 100% Pp and 83% bootstrap (Bs) supportand there was strong support (99% Pp, 95% Bs) for its sister-grouprelationship with Demansia psammophis. Within Aspidomorphusthe three currently recognized species formed three monophyleticgroups (100% Pp + Bs), with A. schlegelii being the sister taxon to aclade containing A. muelleri and A. lineaticollis. Within A. lineaticol-lis, there was 100% Pp and Bs support for six distinct groupings ofDNA sequences: (1) Kamiali, (2) mainland Milne Bay Province,(3) the D’Entrecasteaux Archipelago, (4) Woodlark, (5) Misima,and (6) Sudest. Within A. muelleri, there was a deep divergence be-tween the sample collected in the Torricelli Mtns. and all othersamples of A. muelleri (100% Pp + Bs). Similarly, within A. schlegeliithere was deep divergence between the two samples from the Tor-ricellis and the single Indonesian sample.
Based on the cyt-b dataset (including the A. muelleri samplefrom Sanders et al., 2008), the maximum corrected distance be-tween two A. muelleri samples was 23.7%, between the samplefrom the Torricelli Mtns. and another from Bunisi. The average ge-
Please cite this article in press as: Metzger, G.A., et al. Uncovering cryptic diverand nuclear markers. Mol. Phylogenet. Evol. (2009), doi:10.1016/j.ympev.2009
netic distance between the two lineages of A. muelleri was 23.1%.The maximum genetic distance between A. lineaticollis sampleswas 17.7% between a sample from Misima Island and one fromNormanby Island. The average genetic distance between distinctlineages of A. lineaticollis ranged from 10.5% to 16.5%. The averagecyt-b distance between the two geographic samples of A. schlegeliiwas 19.1%. The average distance between A. schlegelii and A. linea-ticollis was 24.7%, the average between A. schlegelii and A. muelleriwas 27.9%, and the average between A. muelleri and A. lineaticolliswas 22.2%. Including the two Demansia species used in Sanderset al. (2008), the average distance between species in Demansiawas 14.8%, and the average distance between Demansia and Aspid-omorphus was 27.5%.
4. Discussion
4.1. Monophyly and relationships of Aspidomorphus and sister genera
Relative to Sanders et al. (2008) our results increase support fora sister-group relationship between Aspidomorphus and a clade
sity in Aspidomorphus (Serpentes: Elapidae): Evidence from mitochondrial.07.027

Fig. 3. Bayesian phylograms of cyt-b (left) and SPTBN1 (right) analyzed independently, with posterior probabilities P 50% shown. Dots indicate 100% posterior probability.Named lineages are indicated: (Ta) Tanguhh, (To) Torricelli Mtns., (N) North of Huon Peninsula, (S) South of Huon Peninsula, (Mo) Morobe, (Bu) Bunisi, (De) D’EntrecasteauxArchipelago, (Wo) Woodlark Island, (Ms) Misima Island, (Su) Sudest Island.
6 G.A. Metzger et al. / Molecular Phylogenetics and Evolution xxx (2009) xxx–xxx
ARTICLE IN PRESS
comprising Toxicocalamus preussi and Demansia, with 100% poster-ior probability for that node (compared to 55% in Sanders et al.). Aclose relationship between Aspidomorphus and Demansia had pre-viously been suggested on the basis of morphological and mtDNAsimilarities (Keogh et al., 1998; McDowell, 1967; Slowinski andKeogh, 2000). A close relationship between Aspidomorphus andToxicocalamus is a recent hypothesis introduced by Sanders et al.(2008). Morphological evidence does not suggest a particularlyclose association, but Toxicocalamus is a diverse and poorly col-lected genus, and it is possible that further research will revealadditional similarities with Aspidomorphus and Demansia. Our den-ser sampling strategy provides the strongest test of Aspidomorphusand Demansia monophyly to date because of our inclusion of Dem-ansia psammophis, A. schlegelii and A. lineaticollis. This has provideddense lineage sampling within Aspidomorphus as well as includingthe species of Demansia considered the most similar to Aspidomor-phus (McDowell, 1967).
The New Guinea endemic Toxicocalamus is not monophyletic inthe family-level analysis, with our sample of T. loriae forming aclade with the monotypic endemic Micropechis ikaheka while theT. preussi sample from Sanders et al. (2008) clusters with Demansia.When McDowell (1969) reviewed Toxicocalamus, he synonymizedApistocalamus and Ultrocalamus into Toxicocalamus and retainedthe old generic names as subgenera. Prior to this reclassification,Toxicocalamus preussi was classified as Ultrocalamus preussi whileToxicocalamus loriae was classified as Apistocalamus loriae. Thisprior generic division, and the considerable morphological varia-tion within this genus (F.K., pers. obs.), lend support to the ideathat the species currently classified under Toxicocalamus may notform a monophyletic group. Nevertheless, when only the mito-chondrial genes are considered, the two Toxicocalamus samples
Please cite this article in press as: Metzger, G.A., et al. Uncovering cryptic diverand nuclear markers. Mol. Phylogenet. Evol. (2009), doi:10.1016/j.ympev.2009
cluster together. This suggests that either genomic variation doesnot coalesce within species or that phylogenetic signal is insuffi-cient in the more slowly evolving nuclear markers for correctplacement of the Toxicocalamus samples. Further sampling of Tox-icocalamus is required to establish monophyly of the genus and toconfirm its position within the Hydrophiinae (ongoing-C.L.P. andF.K.).
4.2. Relationships within Aspidomorphus and concordance betweendatasets
Within the genus Aspidomorphus, we confirm the presence ofthree major lineages that exactly coincide with the three currentlyrecognized species (Figs. 2–4). Our sampling in three areas ofsympatry confirms that the species represent distinct evolutionaryunits. This represents the first molecular test of McDowell’s mor-phological species concepts within Aspidomorphus.
There was very little discordance between the mtDNA and nuD-NA data sets used for this study (Fig. 3). Although the nuclear dataset provided lower resolution than the mitochondrial data, ithelped to resolve the relationship between Aspidomorphus andDemansia, providing strong support for a node that was highlyunstable in analyses using only mtDNA. Deeper relationships with-in the Hydrophiinae have proven difficult to resolve in previousstudies using mitochondrial data alone, mitochondrial and mor-phological data, and mitochondrial and nuclear markers (Keoghet al., 1998; Sanders et al., 2008; Scanlon and Lee, 2004; Slowinskiand Keogh, 2000). It has been hypothesized that this uncertaintymay represent a rapid splitting of lineages after the invasion ofAustralia, resulting in short internal branches that are difficult tocompletely resolve. Alternatively, substitutional saturation of
sity in Aspidomorphus (Serpentes: Elapidae): Evidence from mitochondrial.07.027

Fig. 4. Bayesian phylogram compiled from analyses of combined data, with posterior probability (above node) and ML bootstrap (below node) values >65% shown. Dotsindicate 100% posterior probability and bootstrap support. Named lineages are indicated: (Ta) Tanguhh, (To) Torricelli Mtns., (N) North of Huon Peninsula, (S) South of HuonPeninsula, (Mo) Morobe, (Bu) Bunisi, (De) D’Entrecasteaux Archipelago, (Wo) Woodlark Island, (Ms) Misima Island, (Su) Sudest Island. Asterisks indicate samples used in theQ12 dataset.
G.A. Metzger et al. / Molecular Phylogenetics and Evolution xxx (2009) xxx–xxx 7
ARTICLE IN PRESS
mitochondrial markers might reduce phylogenetic signal for deepdivergences and currently used nuclear markers may be too slowlyevolving to have sufficient phylogenetic signal. Our results suggestthat SPTBN1 may evolve at a rate that permits resolution of diver-gences occurring in the last 10–30 million years. The SPTBN1 locus,along with other nuclear loci with sufficient phylogenetic signal,may be an important tool for addressing deeper elapid relation-ships that have been difficult to resolve with current markers.These results highlight the utility of mtDNA for phylogeographicstudies and provide justification for its continued use in speciesdelimitation and taxonomic investigations. However, the additionof independent lines of evidence, in our case an appropriately cho-sen nuclear marker, can be vital in addressing species-level evolu-tionary questions.
Please cite this article in press as: Metzger, G.A., et al. Uncovering cryptic diverand nuclear markers. Mol. Phylogenet. Evol. (2009), doi:10.1016/j.ympev.2009
4.3. Cryptic variation in Aspidomorphus
This study has confirmed that each of the three Aspidomorphusspecies represents a genetically distinct entity, with deep molecu-lar divergences. This finding is consistent with the possibility thateach of these nominal species contains multiple cryptic species. Inrecent years, cryptic species diversification has been shown to befar more common than previously expected (Sáez and Lozano,2005), and there is considerable evidence for this phenomenonwithin Aspidomorphus. At least six deeply divergent, well-sup-ported lineages occur within A. lineaticollis, two within A. muelleriand two within A. schlegelii. These lineages are supported by bothnuclear and mitochondrial markers, suggesting that gene flow be-tween lineages has been limited for a considerable period of time.
sity in Aspidomorphus (Serpentes: Elapidae): Evidence from mitochondrial.07.027

8 G.A. Metzger et al. / Molecular Phylogenetics and Evolution xxx (2009) xxx–xxx
ARTICLE IN PRESS
The populations of A. lineaticollis on the isolated islands of Sud-est, Misima, and Woodlark form well-supported and divergentclades, while the islands of the D’Entrecasteaux Archipelago havepopulations that are closely related to each other, but still diver-gent from mainland A. lineaticollis (Figs. 4 and 5). Our sample ofA. lineaticollis from Morobe Province on the mainland is the sisterlineage to all conspecifics. Several of these patterns make geologi-cal sense, and the overall pattern may be consistent with an isola-tion-by-distance model. Misima and Woodlark islands wereadjacent until the rifting of the Woodlark Basin began approxi-mately 8 MYA (Little et al., 2007), so sister-group relationships be-tween their biotic elements is tobe expected. Misima and Sudestbelong to the Louisade Archipelago, the southeasternmost exten-sion of the Owen Stanley Terrane, that had been continuous withthe mainland during the distant past (B. Taylor, University of Ha-waii, pers. comm., 2006). The D’Entrecasteaux islands have neverbeen connected to the New Guinea mainland or to other islandgroups, but have been drawing nearer to New Guinea with time(H. Davies, University of Papua New Guinea, pers. comm., 2004).The herpetofauna of these islands is largely shared with the main-land, and endemic elements appear to be derived from sister taxainhabiting that source (F.K., unpubl. data).
In A. muelleri, based on available sampling, major lineage diver-gence appears on either side of the Huon Peninsula (Figs. 1 and 2).This break may be linked to the fact that the northern portion ofNew Guinea, including the Torricelli Mtns. and the Bismarck Is-lands, belongs to the Solomon Island Arc and has been accretingonto mainland New Guinea within the last 5–6 million years(Fig. 1; Davies et al., 1998; Hall, 2002; Pigram and Davies, 1987; Pi-gram and Symonds, 1991; Polhemus and Polhemus, 1998). Thispossibility is supported by the clustering of our sample of A. muel-leri from the Torricellis with the Sanders et al. (2008) sample fromthe island of New Ireland in our outgroup analysis (Figs. 1 and 2).These two samples are separated by approximately 1000 km butshow only 2.5% cyt-b sequence divergence (data not shown), com-pared to 15.5% cyt-b sequence divergence between our samples
Fig. 5. Map showing clade relationships found in A. lineaticollis. Named lineages are indiIsland, (Ms) Misima Island, (Su) Sudest Island.
Please cite this article in press as: Metzger, G.A., et al. Uncovering cryptic diverand nuclear markers. Mol. Phylogenet. Evol. (2009), doi:10.1016/j.ympev.2009
from the Toricellis and Morobe, which are separated by only500 km. This pattern suggests a biogeographic break, rather thansimple isolation-by-distance. Further evidence of a biogeographicbreak between the Solomon Island Arc system and the rest ofNew Guinea occurs within A. schlegelii, where there is more than19% sequence divergence in the cyt-b gene between samples col-lected in the Torricelli Mtns. (Solomon Arc system) and the samplecollected in Indonesia (south of the Solomon Arc system). Evidencefrom other organisms also suggests that populations derived fromthis arc system are more closely related to each other than they areto the lineages inhabiting the Southeast Peninsula (Polhemus andPolhemus, 1998; van Welzen, 1998).
The high genetic distances between individuals within A. schle-gelii are echoed in its congeners, and represent a level of diver-gence comparable to or greater than that seen within otherhydrophiine genera (Fig. 2 and Supp. Table 1; Lukoschek andKeogh, 2006; Sanders et al., 2008; Wüster et al., 2005). In additionto the previously hypothesized problem with short internalbranches, the genetic divergence found within each lineage andwithin Aspidomorphus as a whole may explain some of the diffi-culty encountered by previous studies in placing the taxon accu-rately within Hydrophiinae. The poor lineage sampling withinAspidomorphus in those studies may have caused problems withlong-branch attraction, confusing the placement of the genus.Our improved support for the sister-group relationship betweenAspidomorphus and Demansia vis a vis Sanders et al. (2008) likelyderives from our improved taxon-sampling scheme. Because simi-lar high levels of sequence divergence characterize other hydrophi-ine genera (Lukoschek and Keogh, 2006; Sanders et al., 2008;Wüster et al., 2005) a focus on more thorough taxon representationmay help to resolve other relationships as well (Hillis, 1998; Rann-ala et al., 1998).
Even with limited sampling, our study has uncovered deepmolecular divergences within Aspidomorphus species. Further sam-pling of this genus is likely to uncover additional deeply divergentlineages, particularly wherever populations are isolated, for exam-
cated: (Mo) Morobe, (Bu) Bunisi, (De) D’Entrecasteaux archipelago, (Wo) Woodlark
sity in Aspidomorphus (Serpentes: Elapidae): Evidence from mitochondrial.07.027

G.A. Metzger et al. / Molecular Phylogenetics and Evolution xxx (2009) xxx–xxx 9
ARTICLE IN PRESS
ple in the southern portion of mainland New Guinea (A. muelleri) orthe Bird’s Head Peninsula at the northwest extreme of the main-land (A. schlegelii and A. muelleri). Furthermore, it is likely that bar-riers to gene flow within Aspidomorphus may be acting as barriersfor other organisms on New Guinea; this is especially likely amongthe islands of the Milne Bay Province, but will probably apply else-where as well. Our study lends additional support to a growingbody of research suggesting the existence of considerable crypticdiversity in the Papuan region specifically (Baker et al., 2008;Kraus, 2007; Kraus, 2008; Rawlings and Donnellan, 2003; Zug,2004), and the tropics as a whole (Duda et al., 2008; Helgen,2005; Moritz et al., 1993; Padial and de la Riva, 2009) and providesthe phylogenetic background for a comparative analysis to look forfactors driving cryptic diversification.
4.4. Conservation implications
New Guinea is the third-largest tract of High Biodiversity Wil-derness in the world, behind the Amazon and the Congo (Mitter-meier et al., 2003). While approximately 70% of the island’sforested areas remain intact, deforestation from logging and agri-culture is mounting. As of 2002, the forests in Papua New Guineaare being lost at a rate of 1.41% per year, and commercially acces-sible forests are being lost at twice the overall rate (Shearmanet al., in press). Nearly half of the commercially accessible forestsare already under logging concessions. If current trends continue,more than 80% of commercially accessible forest will be gone by2021 (Shearman et al., 2008). A comprehensive system for conser-vation and protected areas management is vitally important forNew Guinea but is not yet in place. Cryptic diversity and restricted
Please cite this article in press as: Metzger, G.A., et al. Uncovering cryptic diverand nuclear markers. Mol. Phylogenet. Evol. (2009), doi:10.1016/j.ympev.2009
range endemism, both of which occur frequently on New Guinea,must be considered during the establishment of any conservationand management system. Our study highlights the importance ofaugmenting morphological taxonomic descriptions with molecularanalysis when cataloging diversity and determining conservationpriorities.
Acknowledgments
This project was supported by NSF grants to F.K. and A.A. (DEB-0103794 and DEB-0743890), and to C.L.P. (DEB–0416000). RossSadlier (Australian Museum) loaned several tissue samples for thisproject and P. Imada and C.H. Kishinami (Bishop Museum) coordi-nated specimen transactions and provided collections assistance.We thank K. Sanders and S. Keogh for providing sequences andalignments for our outgroup analysis prior to publication. The fol-lowing people provided help at all stages of this manuscript: J.Daza, A. Fenwick, T. Hether, E. Hoffman, S. Johnson, H. Kalkvik,M.B. Manjerovic, G. Territo, and R. Tursi. We also thank Allen Lar-son, the associate editor, and two anonymous reviewers for com-ments which greatly improved the manuscript. Part of this workwas carried out using the resources of the Computational BiologyService Unit from Cornell University, which is partially funded byMicrosoft Corporation. Sequencing through the Nevada GenomicsCenter was supported by an INBRE Grant (2 P20 RR016463). Wethank the PNG National Museum and Art Gallery for providingin-country collaborative assistance; and the PNG Department ofEnvironment and Conservation, PNG National Research Institute,and Central, Milne Bay, Morobe, and West Sepik provincial govern-ments for permission to conduct the fieldwork.
Appendix A
Localities and identification tags for samples used in this study and GenBank accession numbers for sequences generated for ingroupanalysis. PNG = Papua New Guinea, NSW = New South Wales, F = Fergusson Island, G = Goodenough Island, N = Normanby Island;AMS = Australia Museum, BPBM = Bishop Museum, PNGNM = Papua New Guinea National Museum.
Taxon
Location Catalogue No.sity in Aspidomorphu.07.027
Field No.
s (Serpentes: Elapid
cyt-b
ae): Evidence from m
SPTBN1
Aspidomorphus lineaticollis
Kamiali, PNG BPBM 31736 AA 19131 GQ397128 GQ397173 A. lineaticollis Bunisi, PNG BPBM 17282 FK 7351 GQ397135 GQ397175 A. lineaticollis Bunisi, PNG BPBM 17283 FK 7782 GQ397136 GQ397176 A. lineaticollis D’Entrecasteaux, F BPBM 16540 FK 5773 GQ397129 GQ397174 A. lineaticollis D’Entrecasteaux, F BPBM 16541 FK 6141 GQ397130 GQ397174 A. lineaticollis D’Entrecasteaux, F uncat. PNGNM FK 6220 GQ397131 GQ397174 A. lineaticollis D’Entrecasteaux, F BPBM 16542 FK 6458 GQ397132 GQ397177 A. lineaticollis D’Entrecasteaux, N BPBM 16543 FK 6700 GQ397133 GQ397174 A. lineaticollis D’Entrecasteaux, N BPBM 17281 FK 7186 GQ397134 GQ397174 A. lineaticollis D’Entrecasteaux, G AMS 125028 NR 1800 GQ397141 — A. lineaticollis D’Entrecasteaux, G AMS 125029 NR 1801 GQ397140 — A. lineaticollis D’Entrecasteaux, G AMS 125030 NR 1802 GQ397141 — A. lineaticollis Woodlark BPBM 17860 AA 16596 GQ397137 — A. lineaticollis Woodlark BPBM 17862 AA 16715 GQ397138 — A. lineaticollis Misima AMS 125020 NR 1788 GQ397139 — A. lineaticollis Misima AMS 125021 NR 1790 GQ397142 — A. lineaticollis Misima AMS 125022 NR 1791 GQ397143 — A. lineaticollis Misima AMS 125023 NR 1794 GQ397144 — A. lineaticollis Misima AMS 125024 NR 1796 GQ397145 — A. lineaticollis Misima AMS 125025 NR 1798 GQ397146 — A. lineaticollis Sudest uncat. PNGNM FK 9519 GQ397152 GQ397178 A. lineaticollis Sudest BPBM 20782 FK 9547 GQ397147 GQ397178 A. lineaticollis Sudest BPBM 20783 FK 9671 GQ397148 GQ397178 A. lineaticollis Sudest BPBM 20786 FK 9722 GQ397148 GQ397178 A. lineaticollis Sudest BPBM 20784 FK 9742 GQ397149 GQ397179 A. lineaticollis Sudest BPBM 20785 FK 9813 GQ397148 GQ397178(continued on next page)
itochondrial

10 G.A. Metzger et al. / Molecular Phylogenetics and Evolution xxx (2009) xxx–xxx
ARTICLE IN PRESS
Pa
Appendix A (continued)
Taxon
lease cite this article in press as: Mend nuclear markers. Mol. Phylogenet
Location
tzger, G.A., et al. Uncovering cryptic d. Evol. (2009), doi:10.1016/j.ympev.2
Catalogue No.
iversity in Aspidomorphu009.07.027
Field No.
s (Serpentes: Elapid
cyt-b
ae): Evidence from m
SPTBN1
A. lineaticollis
Sudest uncat. PNGNM FK 9873 GQ397148 GQ397179 A. lineaticollis Sudest BPBM 20787 FK 9875 GQ397150 GQ397179 A. lineaticollis Sudest BPBM 20788 FK 9877 GQ397151 GQ397180 A. lineaticollis Sudest BPBM 20789 FK 9878 GQ397151 GQ397179 Aspidomorphus muelleri Torricelli Mtns, PNG BPBM 23453 FK 11473 GQ397153 GQ397183 A. muelleri Apele, PNG BPBM 18929 FK 8587 GQ397161 GQ397187 A. muelleri Laronu, PNG BPBM 19496 FK 8773 GQ397162 GQ397184 A. muelleri Laronu, PNG BPBM 19497 FK 8774 GQ397163 GQ397184 A. muelleri Laronu, PNG BPBM 19498 FK 8775 GQ397164 GQ397188 A. muelleri Laronu, PNG BPBM 19500 FK 9255 GQ397166 GQ397184 A. muelleri Bunisi, PNG BPBM 17284 FK 7391 GQ397157 GQ397181 A. muelleri Bunisi, PNG BPBM 19030 FK 7554 GQ397158 GQ397184 A. muelleri Bunisi, PNG BPBM 17285 FK 7555 GQ397159 GQ397185 A. muelleri Bunisi, PNG BPBM 17286 FK 7765 GQ397160 GQ397186 A. muelleri Bunisi, PNG BPBM 17287 FK 7839 GQ397157 GQ397181 A. muelleri Mt. Obree, PNG BPBM 19499 FK 8856 GQ397165 GQ397184 A. muelleri Cloudy Mtns, PNG BPBM 15154 FK 5179 GQ397154 GQ397182 A. muelleri Cloudy Mtns, PNG BPBM 15155 FK 5305 GQ397155 GQ397187 A. muelleri Cloudy Mtns, PNG BPBM 19029 FK 5325 GQ397156 GQ397187 Aspidomorphus schlegelii Tangguh, Papua, Indonesia uncatalogued AA 16304 GQ397169 GQ397189 A. schlegelii Torricelli Mtns., PNG BPBM 23434 FK 11877 GQ397168 GQ397191 A. schlegelii Torricelli Mtns., PNG BPBM 23433 FK 11616 GQ397167 GQ397190 Demansia psammophis NSW, Australia AMS 147748 NR 3389 GQ397172 GQ397192 Micropechis ikaheka Mt. Shungul, PNG BPBM 18936 FK 8625 GQ397171 GQ397194 Toxicocalamus loriae Mt. Simpson, PNG BPBM 17987 FK 7523 GQ397170 GQ397193Appendix B
Locality, identification numbers, and GenBank accession numbers for sequences generated for outgroup analysis. PNG = Papua New Gui-nea, NSW = New South Wales, F = Fergusson Island; AMS = Australia Museum, BPBM = Bishop Museum, PNGNM = Papua New GuineaNational Museum.
Taxon
Location CatalogueNo.FieldNo.
12S
16S ND4 MyHC-2 c-mos RAG-1Aspidomorphuslineaticollis
d’Entrecasteaux,F
uncat.PNGNM
FK 6220
GQ397245 GQ397237 GQ397205 GQ397217 GQ397227 GQ397198A. lineaticollis
Sudest uncat.PNGNMFK 9873
GQ397247 GQ397239 GQ397212 GQ397219 GQ397229 GQ397199Aspidomorphusmuelleri
Torricellis, PNG
BPBM 23453 FK11473GQ397251
GQ397233 GQ397207 GQ397214 GQ397224 GQ397195A. muelleri
Apele, PNG BPBM 18929 FK 8587 GQ397250 GQ397241 GQ397213 GQ397221 GQ397231 GQ397202 A. muelleri Laronu, PNG BPBM 19497 FK 8774 GQ397249 GQ397242 GQ397206 GQ397222 GQ397232 GQ397203 Aspidomorphusschlegeli
Toricellis, PNG BPBM 23433 FK11616
GQ397252 GQ397234 GQ397204 GQ397215 GQ397223 GQ397196A. schlegeli
Papua,Indonesiauncatalogued
AA16304GQ397246
GQ397238 GQ397210 GQ397218 GQ397228 GQ397200Demansia psammophis
NSW, Australia AMS 147748 NR 3389 GQ397248 GQ397240 GQ397209 GQ397220 GQ397230 GQ397201 Micropechis ikaheka Mt. Shungul,PNG
BPBM 18936 FK 8625 GQ397243 GQ397236 GQ397208 — GQ397226 —Toxicocalamus loriae
Mt. Simpson,PNGBPBM 17987
FK 7523 GQ397244 GQ397235 GQ397211 GQ397216 GQ397225 GQ397197Appendix C. Supplementary data
Supplementary data associated with this article can be found, in the online version, at doi:10.1016/j.ympev.2009.07.027.
itochondrial

G.A. Metzger et al. / Molecular Phylogenetics and Evolution xxx (2009) xxx–xxx 11
ARTICLE IN PRESS
References
Allison, A., 2007a. Herpetofauna of Papua. In: Marshall, A.J., Beehler, B.M. (Eds.), TheEcology of Papua. Periplus Press, Singapore, pp. 564–616.
Allison, A., 2007b. Introduction to the fauna. In: Marshall, A.J., Beehler, B.M. (Eds.),The Ecology of Papua. Periplus Press, Singapore, pp. 479–494.
Allison, A., Kraus, F., 2009. Pacific Biological Survey, Bishop Museum. PapuanHerpetofauna. Available from: <http://www.bishopmuseum.org/research/pbs/papuanherps/index.html> (accessed 9.03.09).
Austin, C.C., Hayden, C.J., Bigilale, I., Dahl, C., Anaminiato, J., 2008. Checklist andcomments on the terrestrial amphibian and reptile Fauna from Utai,Northwestern Papua New Guinea. Herpetol. Rev. 39, 40–46.
Arévalo, E., Davis, S.K., Sites, J., 1994. Mitochondrial DNA sequence divergence andphylogenetic relationships among eight chromosome races of the Sceloporusgrammicus complex (Phrynosomatidae) in Central Mexico. Syst. Biol. 43, 387–418.
Baker, N., De Bruyn, M., Mather, P.B., 2008. Patterns of molecular diversity in wildstocks of the redclaw crayfish (Cherax quadricarinatus) from northern Australiaand Papua New Guinea: impacts of Plio-Pleistocene landscape evolution..Freshw. Biol. 53, 1592–1605.
Ballard, J.W.O., Whitlock, M.C., 2004. The incomplete natural history ofmitochondria. Mol. Ecol. 13, 729–744.
Bazin, E., Glemin, S., Galtier, N., 2006. Population size does not influencemitochondrial genetic diversity in animals. Science 312, 570–572.
Beehler, B.M., 2007. Introduction to Papua. In: Marshall, A.J., Beehler, B.M. (Eds.),Ecology of Papua. Periplus Press, Singapore, pp. 3–13.
Bickford, D., Lohman, D.J., Sodhi, N.S., Ng, P.K.L., Meier, R., Winker, K., Ingram, K.K.,Das, I., 2007. Cryptic species as a window on diversity and conservation. TREE22, 148–155.
Bond, J.E., Hedin, M.C., Ramirez, M.G., Opell, B.D., 2001. Deep molecular divergencein the absence of morphological and ecological change in the Californiancoastal dune endemic trapdoor spider Aptostichus simus. Mol. Ecol. 10, 899–910.
Burbrink, F.T., Lawson, R., Slowinski, J.B., 2000. Mitochondrial DNA phylogeographyof the polytypic North American rat snake (Elaphe obsoleta): a critique of thesubspecies concept. Evolution 54, 2107–2118.
Castoe, T.A., Spencer, C.L., Parkinson, C.L., 2007. Phylogeographic structure andhistorical demography of the western diamondback rattlesnake (Crotalus atrox):a perspective on North American desert biogeography. Mol. Phylogenet. Evol.42, 193–212.
Darda, D.M., 1994. Allozyme variation and morphological evolution among Mexicansalamanders of the genus Chiropterotriton (Caudata, Plethodontidae).Herpetologica 50, 164–187.
Davies, H.L., Winn, R.D., KenGemar, P., 1998. Evolution of the Papuan Basin—a viewfrom the orogen. In: Buchanan, P.G. (Ed.), Petroleum Exploration, Developmentand Production in Papua New Guinea. Proceedings of the Third Papua NewGuinea Petroleum Convention. PNG Chamber of Mines and Petroleum, PortMoresby, pp. 53–62.
Daza, J.M., Smith, E.N., Páez V.P., Parkinson C.L., in press. Complex evolution in theNeotropics: origin and diversification of the widespread genus Leptodeira(Serpentes: Colubridae). Mol. Phylogenet. Evol., doi:10.1016/j.ympev.2009.07.022.
Duda, T.F., Bolin, M.B., Meyer, C.P., Kohn, A.J., 2008. Hidden diversity in ahyperdiverse gastropod genus: discovery of previously unidentified membersof a Conus species complex. Mol. Phylogenet. Evol. 49, 867–876.
Edwards, S.V., Kingan, S.B., Calkins, J.D., Balakrishnan, C.N., Jennings, W.B., Swanson,W.J., Sorenson, M.D., 2005. Speciation in birds: genes, geography, and sexualselection. Proc. Natl. Acad. Sci. USA 102, 6550–6557.
Elejalde, M.A., Madeira, M.J., Muñoz, B., Arrébola, J.R., Gómez-Moliner, B.J., 2008.Mitochondrial DNA diversity and taxa delineation in the land snails of the Iberusgualtieranus (Pulmonata, Helicidae) complex. Zool. J. Linn. Soc. 154, 722–737.
Flannery, T.F., 1995. Mammals of New Guinea. Cornell Univ. Press, Ithaca.Groth, J.G., Barrowclough, G.F., 1999. Basal divergences in birds and the
phylogenetic utility of the nuclear RAG-1 gene. Mol. Phylogenet. Evol. 12,115–123.
Guiher, T.J., Burbrink, F.T., 2008. Demographic and phylogeographic histories of twovenomous North American snakes of the genus Agkistrodon. Mol. Phylogenet.Evol. 48, 543–553.
Hall, R., 2002. Cenozoic geological and plate tectonic evolution of SE Asia and theSW Pacific: computer-based reconstructions, model and animations. J. AsianEarth Sci. 20, 353–431.
Helgen, K.M., 2005. Systematics of the Pacific monkey-faced bats (Chiroptera:Pteropodidae), with a new species of Pteralopex and a new Fijian genus. Syst.Biodivers. 3, 433–453.
Hellborg, L., Gunduz, I., Jaarola, M., 2005. Analysis of sex-linked sequences supportsa new mammal species in Europe. Mol. Ecol. 14, 2025–2031.
Highton, R., Macgregor, J.R., 1983. Plethodon kentucki Mittleman—a valid species ofCumberland Plateau woodland salamander. Herpetologica 39, 189–200.
Hillis, D.M., 1998. Taxonomic sampling, phylogenetic accuracy, and investigatorbias. Syst. Biol. 47, 3–8.
Hudson, R.R., Coyne, J.A., 2002. Mathematical consequences of the genealogicalspecies concept. Evolution 56, 1557–1565.
Hugall, A.F., Foster, R., Hutchinson, M., Lee, M.S.Y., 2008. Phylogeny of Australasianagamid lizards based on nuclear and mitochondrial genes: implications formorphological evolution and biogeography. Biol. J. Linnean Soc. 93, 343–358.
Please cite this article in press as: Metzger, G.A., et al. Uncovering cryptic diverand nuclear markers. Mol. Phylogenet. Evol. (2009), doi:10.1016/j.ympev.2009
Keogh, J.S., Shine, R., Donnellan, S., 1998. Phylogenetic relationships of terrestrialAustralo-Papuan elapid snakes (subfamily hydrophiinae) based on cytochromeb and 16S rRNA sequences. Mol. Phylogenet. Evol. 10, 67–81.
Kocher, T.D., Thomas, W.K., Meyer, A., Edwards, S.V., Paabo, S., Villablanca, F.X.,Willson, A.C., 1989. Dynamics of mitochondrial DNA evolution in animals:amplification and sequencing with conserved primers. Proc. Natl. Acad. Sci. USA86, 6196–6200.
Kraus, F., 2007. Taxonomic partitioning within Papuan members of the Carlianovaeguineae complex (Lacertilia: Scincidae). J. Herpetol. 41, 410–423.
Kraus, F., 2008. Taxonomic partitioning of Cyrtodactylus louisiadensis (Lacertilia:Gekkonidae) from Papua New Guinea. Zootaxa 1883, 1–27.
Kumar, S., Tamura, K., Nei, M., 2004. MEGA3: integrated software for molecularevolutionary genetics analysis and sequence alignment. Brief. Bioinform. 5,150–163.
Little, T.A., Baldwin, S.L., Fitzgerald, P.G., Monteleone, B., 2007. Continental riftingand metamorphic core complex formation ahead of the Woodlark spreadingridge, D’Entrecasteaux Islands, Papua New Guinea. Tectonics 26.
Lukoschek, V., Keogh, J.S., 2006. Molecular phylogeny of sea snakes reveals a rapidlydiverged adaptive radiation. Biol. J. Linnean Soc. 89, 523–539.
Lyons, L.A., Laughlin, T.F., Copeland, N.G., Jenkins, N.A., Womack, J.E., O’Brien, S.J.,1997. Comparative anchor tagged sequences (CATS) for integrative mapping ofmammalian genomes. Nat. Genet. 15, 47–56.
Matthee, C.A., Burzlaff, J.D., Taylor, J.F., Davis, S.K., 2001. Mining the mammaliangenome for artiodactyl systematics. Syst. Biol. 50, 367–390.
McDowell, S.B., 1967. Aspidomorphus, a genus of New Guinea snakes in the FamilyElapidae, with notes on related genera. J. Zool., Lond. 151, 497–543.
McDowell, S.B., 1969. Toxicocalamus, a New Guinea genus of snakes of the familyElapidae. J. Zool., Lond. 159, 443–511.
Mittermeier, R.A., Mittermeier, C.G., Brooks, T.M., Pilgrim, J.D., Konstant, W.R., daFonseca, G.A.B., Kormos, C., 2003. Wilderness and biodiversity conservation.Proc. Natl. Acad. Sci. USA 100, 10309–10313.
Moritz, C., Joseph, L., Adams, M., 1993. Cryptic diversity in an endemic rain-forestskink (Gnypetoscincus queenslandiae). Biodivers. Conserv. 2, 412–425.
Narang, S.K., Klein, T.A., Perera, O.P., Lima, J.B., Tang, A.T., 1993. Genetic evidence forthe existence of cryptic species in the Anopheles albitarsis complex in Brazil—allozymes and mitochondrial DNA restriction fragment length polymorphisms.Biochem. Genet. 31, 97–112.
Nylander, J.A.A., Ronquist, F., Huelsenbeck, J.P., Nieves-Aldrey, J.L., 2004. Bayesianphylogenetic analysis of combined data. Syst. Biol. 53, 47–67.
Padial, J.M., de la Riva, I., 2009. Integrative taxonomy reveals cryptic Amazonianspecies of Pristimantis (Anura: Strabomantidae). Zool. J. Linn. Soc. 155, 97–122.
Pigram, C.J., Davies, H.L., 1987. Terranes and the accretion history of the NewGuinea orogen. BMR J. Aust. Geol. Geophys. 10, 193–211.
Pigram, C.J., Symonds, P.A., 1991. A review of the timing of the major tectonic eventsin the New Guinea Orogen. Southeast Asian Earth Sci. 6, 307–318.
Polhemus, D.A., Polhemus, J.T., 1998. Assembling New Guinea: 40 million years ofisland arc accretion as indicated by the distributions of aquatic Heteroptera(Insecta). In: Hall, R., Holloway, J.D. (Eds.), Biogeography and GeologicalEvolution of Southeast Asia. Backhuys Publishers, Leiden, pp. 327–340.
Rambaut, A., Drummond, A.J., 2007. Tracer v1.4. Available from: <http://beast.bio.ed.ac.uk/Tracer>.
Rannala, B., Huelsenbeck, J.P., Yang, Z.H., Nielsen, R., 1998. Taxon sampling and theaccuracy of large phylogenies. Syst. Biol. 47, 702–710.
Rawlings, L.H., Donnellan, S.C., 2003. Phylogeographic analysis of the green python,Morelia viridis, reveals cryptic diversity. Mol. Phylogenet. Evol. 27, 36–44.
Ronquist, F., Huelsenbeck, J.P., 2003. MrBayes 3: Bayesian phylogenetic inferenceunder mixed models. Bioinformatics 19, 1572–1574.
Sáez, A.G., Lozano, E., 2005. Body doubles. Nature 433, 111.Saint, K.M., Austin, C.C., Donnellan, S.C., Hutchinson, M.N., 1998. C-mos, a nuclear
marker useful in squamate phylogenetic analysis. Mol. Phylogenet. Evol. 10,259–263.
Sanders, K.L., Lee, M.S.Y., 2008. Molecular evidence for a rapid late-Mioceneradiation of Australasian venomous snakes (Elapidae, Colubroidea). Mol.Phylogenet. Evol. 46, 1165–1173.
Sanders, K.L., Lee, M.S.Y., Leys, R., Foster, R., Keogh, J.S., 2008. Molecular phylogenyand divergence dates for Australasian elapids and sea snakes (hydrophiinae):evidence from seven genes for rapid evolutionary radiations. J. Evol. Biol. 21,682–695.
Scanlon, J.D., Lee, M.S.Y., 2004. Phylogeny of Australasian venomous snakes(Colubroidea, Elapidae, Hydrophiinae) based on phenotypic and molecularevidence. Zool. Scr. 33, 335–366.
Shearman, P.L., Ash, J., Mackey, B., Bryan, J.E., Lokes, B., in press. Forest conversionand degradation in Papua New Guinea 1972–2002. Biotropica. doi: 10.1111/j.1744-7429.2009.00495.x.
Shearman, P.L., Bryan, J.E., Ash, J., Hunnam, P., Mackey, B., Lokes, B., 2008. The Stateof the Forests of Papua New Guinea. Mapping the Extent and Condition of ForestCover and Measuring the Drivers of Forest Change in the Period 1972–2002.University of Papua, New Guinea.
Shine, R., Keogh, J.S., 1996. Food habits and reproductive biology of the endemicMelanesian elapids: are tropical snakes really different? J. Herpetol. 30, 238–247.
Slowinski, J.B., Keogh, J.S., 2000. Phylogenetic relationships of elapid snakes basedon cytochrome b mtDNA sequences. Mol. Phylogenet. Evol. 15, 157–164.
Slowinski, J.B., Knight, A., Rooney, A.P., 1997. Inferring species trees from gene trees:a phylogenetic analysis of the Elapidae (Serpentes) based on the amino acidsequences of venom proteins. Mol. Phylogenet. Evol. 8, 349–362.
sity in Aspidomorphus (Serpentes: Elapidae): Evidence from mitochondrial.07.027

12 G.A. Metzger et al. / Molecular Phylogenetics and Evolution xxx (2009) xxx–xxx
ARTICLE IN PRESS
Sturmbauer, C., Meyer, A., 1992. Genetic divergence, speciation and morphologicalstasis in a lineage of African cichlid fishes. Nature 358, 578–581.
Takeuchi, W.N., 2007. Introduction to the Flora of Papua. In: Marshall, A.J., Beehler,B.M. (Eds.), The Ecology of Papua. Periplus Press, Singapore, pp. 269–302.
Thum, R.A., Harrison, R.G., 2009. Deep genetic divergences among morphologicallysimilar and parapatric Skistodiaptomus (Copepoda: Calanoida: Diaptomidae)challenge the hypothesis of Pleistocene speciation. Biol. J. Linnean Soc. 96, 150–165.
van Welzen, P.C., 1998. Increased speciation in New Guinea: tectonic causes? In:Dransfield, J., Coode, J.J.E., Simpson, D.A. (Eds.), Plant Diversity in Malesia III.Royal Botanical Gardens, Kew, pp. 363–387.
Wiens, J.J., 1998. Combining data sets with different phylogenetic histories. Syst.Biol. 47, 568–581.
Please cite this article in press as: Metzger, G.A., et al. Uncovering cryptic diverand nuclear markers. Mol. Phylogenet. Evol. (2009), doi:10.1016/j.ympev.2009
Wüster, W., Dumbrell, A.J., Hay, C., Pook, C.E., Williams, D.J., Fry, B.G., 2005. Snakesacross the Strait: trans-Torresian phylogeographic relationships in three generaof Australasian snakes (Serpentes: Elapidae: Acanthophis, Oxyuranus, andPseudechis). Mol. Phylogenet. Evol. 34, 1–14.
Zink, M.R., Barrowclough, G.F., 2008. Mitochondrial DNA under siege in avianphylogeography. Mol. Ecol. 17, 2107–2121.
Zug, G.R., 2004. Systematics of the Carlia ‘‘fusca” lizards (Squamata: Scincidae) ofNew Guinea and nearby islands. Bishop Museum Bullet. Zool. 5. I–viii+, 1-83.
Zwickl, D.J., 2006. Genetic algorithm approaches for the phylogenetic analysis oflarge biological sequence datasets under the maximum likelihood criterion.Ph.D. dissertation, The University of Texas at Austin.
sity in Aspidomorphus (Serpentes: Elapidae): Evidence from mitochondrial.07.027