molecular recognition in nonaqueous solvent. 2. structural and thermodynamic analysis of cationic...
TRANSCRIPT

J . Am. Chem. Soc. 1990, 112, 441 1-4419 441 1
Molecular Recognition in Nonaqueous Solvents. 2. Structural and Thermodynamic Analysis of Cationic Selectivity of 18-Crown-6 in Methanol
Michael H. Mazer,? J. Andrew McCammon,*qt and Terry P. Lybrandt Contribution from the Department of Chemistry, University of Houston, Houston, Texas 77204-5641, and the Department of Medicinal Chemistry, University of Minnesota, Minneapolis, Minnesota 55455. Received August 2, I989
Abstract: Molecular dynamic simulations are used to predict the binding affinity in host-guest systems by the thermodynamic cycleperturbation method. The relative free energy of solvation of Na+ and K+ in methanol (19.8 and 19.1 kcal mol-') and the relative free energy of binding of Na+ and K+ to 18-crown-6 in methanol (-3.8 and -3.0 kcal mol-') are calculated by thermodynamic integration and thermodynamic perturbation, respectively. These results are in reasonable agreement with the experimental values, 17.3 and -2.47 kcal mol-', respectively. In addition, the contributions to the relative free energy from the internal energy and entropy are calculated. Finally, a detailed analysis is made of the structure and its fluctuations in this system to provide additional insight to the selectivity of binding.
Since their discovery in 1967 by Pedersen' at Du Pont, crown ethers have been a very important member of the class of molecules known as organic Although synthetic, crown ethers share with enzymes and other biological molecules the capacity of recognizing and selectively binding ions or other molecules. Crown ethers display a wide range of binding specificities, in part because they range in size from a ring containing as few as 9 ring atoms to more than 30.4 In addition, the ring can be modified to decrease its flexibility by replacing the saturated carbon-carbon linking group with aromatic carbon^.^ Substitutions can also be made in which chains are added in such a fashion that they aid in complex formation from above or below the plane of the ring.*
Originally, it was proposed that the selectivity of crown ethers depended mainly on the size of the guest relative to the cavity size of the host.' For example, 18-crown-6 (1,4,7,10,13,16-hex- aoxacyclooctadecane), which has a cavity radius ranging between 1.3 and 1.6 A? selectively binds potassium over sodium in methanol+I2 and ~ a t e r ~ * ' ~ + ' ~ where the cationic radii are 1.33 and 0.97 A,9 respectively. More recently, the selectivity of host molecules in general has been attributed to the spatial arrangement of binding sites.3 The synthesis of 18-crown-6 results in 6 oxygen atoms being collected around a ring. Therefore, the selectivity of 18-crown-6 must depend on the way in which these atoms are arranged to interact with the guest molecule. In addition to the host-guest interaction, factors in the selectivity of any host species include the relative free energy of desolvation of the guest mol- ecules and the free energy of organizing the host into a suitable conformation for binding.'1*'e'6
The present paper describes a series of molecular dynamic simulations designed to clarify some of the factors involved in the binding and selectivity of 18-crown-6 for sodium and potassium cations in methanol. In addition to investigating the thermody- namics of binding,17J8 we have studied how the crown and solvent molecules conform to the different cations and thus influence the selectivity. Theory
In order to study the equilibrium thermodynamics of binding, the thermodynamic cycleperturbation method was In the notation of this popular m e t h ~ d , ~ ~ J * ~ * ~ - ~ ~ the relative free energy, enthalpy, or entropy of binding between guests G and g to host H can be expressed as AAF = AF2 - AFl = AF4 - AF3.
g + H - g:H A 6
G + H - G:H A.5
Here, F is any thermodynamic state function. Reactions 1 and 2 are studied by experimental methods, while reactions 3 and 4
( I ) Schroeder, H. E.; Pedersen, C. J. Pure Appl. Chem. 1988, 60, 445. (2) Cram, D. J. Science 1988, 240, 760. (3) Lehn, J.-M. Angew. Chem. 1988, 27, 89. (4) Lehn, J.-M. Struct. Bonding 1973, 16, 1 . Truter, M. R. Srrucr.
Bonding 1973, 16, 71. Simon, W.; Morf, W. E.; Meier, P. C. Struct. Bonding 1973, 16, 113. Izatt, R. M.; Eatough, D. J.; Christensen, J. J. Strucr. Bonding 1973, 16, 161.
(5) Weber, E.; Vogtle, F. Top. Curr. Cbem. 1981, 98, I . Cram, D. J.; Trueblood, K. N . Top. Curr. Chem. 1981, 98, 43.
(6) Hilgenfeld, R.; Saenger, W. Top. Curr. Chem. 1982, 101, 1. (7) Takeda, Y . Top. Curr. Chem. 1984, 121, I . (8) Echegoyen, L.; Gokel. G. W.; Kim. M. S.; Eyring, E. M.; Petrucci, S.
(9) Frensdorff, H. K. J . Am. Chem. Soc. 1971, 93, 600. (10) Lamb, J. D.; Izatt, R. M.; Swain, C. S.; Christensen, J. J. J . Am.
( 1 I ) Michaux, G.; Reisse, J. J. Am. Chem. SOC. 1982, 104, 6895. (12) Chen, C. C.; Petrucci, S. J . Pbys. Cbem. 1982, 86, 2601. (13) Izatt, R. M.; Terry, R. E.; Haymore, B. L.; Hansen, L. D.; Dalley,
N. K.; Avondet, A. G.; Christensen, J. J. J . Am. Chem. SOC. 1976, 98, 7620. (14) Lamb, J. D.; Izatt. R. M.; Swain, C. S.; Christensen, J. J . J . Am.
Chem. Soc. 1980, 102, 475. (15) Heiland, H.; Ringseth, J. A.; Brun, T. S. J . Solution Cbem. 1979,
8 , 779. (16) Straatsma, T. P.; McCammon, J. A. J . Cbem. Phys. 1989,91, 3631.
J . Phys. Chem. 1987, 91, 3854.
Cbem. SOC. 1980, 102,475.
(17) Mazor, M. H.; McCammon, J. A,; Lybrand, T. P. J. Am. Chem. Soc. 1989, 1 1 1 , 55.
(18) van Eerden, J.; Harkema, S.; Feil, D. J . Pbys. Cbem. 1988,92, 5076. (19) Tembe, B. L.; McCammon, J. A. Comp. Chem. 1984.8, 281. (20) McCammon, J. A.; Lybrand, T. P.; Allison, S. A.; Northrup, S. H.
In Biomolecular Stereodynamics III; Sarma, R. H., Ed.; Adenine: New York, 1986.
(21) Lybrand, T. P.; McCammon, J. A.; Wipff, G. Proc. Natl. Acud. Sci. U.S.A. 1986, 83, 833.
(22) McCammon, J. A.; Karim, 0. A.; Lybrand, T. P.; Wong, C. F. Ann.
(23) Wong, C. F.; McCammon, J. A. J. Am. Cbem. SOC. 1986,108,3830. (24) McCammon, J. A.; Harvey, S. C. Dynamics of Proteins and Nucleic
(25) Lybrand, T. P.; Ghosh, 1.; McCammon, J. A. J . Am. Chem. SOC.
(26) Jorgensen, W. L.; Ravinohan, C. J . Chem. Pbys. 1985, 83, 3050. (27) Straatsma, T. P.; Berendsen, H. J. C.; Postma, J. P. M. J. Cbem.
(28) Jorgensen, W. L.; Buckner, J. K. J. Pbys. Cbem. 1986, 90, 4651. (29) Jorgensen, W. L.; Buckner, J. K. J . Phys. Chem. 1987, 91, 6083. (30) Fleischman, S. H.; Brooks, C. L., 111 J . Cbem. Pbys. 1987,87,3029.
N.Y. Acad. Sci. 1986, 482, 210.
Acids, Cambridge University Press: Cambridge, 1987.
1985, 107, 7793.
Phys. 1986, ,85,6720.
'University of Houston. t University of Minnesota.
(31) Singh. U. C.; Brown, F. K.; Bash, P. A.; Kollman, P. A. J . Am. Chem. SOC. 1987, 109, 1607.
0 1990 American Chemical Society , , I -

4412 J . Am. Chem. Soc., Vol. 112, No. 11, 1990
can be simulated and studied by computational methods. In this particular study, the substitutions are H = 18-crown-6, g = Na', and G = K+. The free energy changes for reactions 3 and 4 were calculated by two methods: thermodynamic perturbationm2 and thermodynamic i n t e g r a t i ~ n . ~ ~ - ~ ~ In addition, the entropic and enthalpic components of the free energy changes for the two reactions were evaluated by a finite difference-perturbation meth~d. 'O*~~
Thermodynamic Integration. Thermodynamic integration is a method for calculating the change in free energy between states. It makes use of the expression
Mazor et ai.
PA = A(X = 1) - A(X = 0) =
where the free energy A is a function of a coupling parameter X which joins states 0 and 1,
V and K are the potential and kinetic energy functions of the system, respectively, N is the number of particles, and is the product of Boltzmann's constant and absolute temperature. Evaluating the derivative in eq 2 yields
This can be approximated by
where, n = number of steps in X and AX = I /n . Thus, the free energy associated with changing a system from one in which X = 0 to one in which X = 1 could be evaluated by a molecular dynamics simulation during which the potential function slowly changes in discrete steps in A. At each value of A, the ensemble average of the change in the potential function with respect to X is calculated. This quantity is then weighted with the step size in X and summed to yield the free energy change associated with the change in the system.
In the molecular dynamics package AMBER version 3:' the derivative in eq 5 is approximated by the expression
8V(q,X) AV(q,X) V(q,X + AX) - Vq,M (6) - u p - -
aX = AX AX
( 3 2 ) Bash, P. A.; Singh, U. C.; Langridge, R.; Kollman, P. A. Science
( 3 3 ) Bash, P. A.; Singh, U . C.; Brown, F. K.; Langridge, R.; Kollman, P. 1987, 236, 564.
A. Science 1987. 235. 514. (34) Rao, S. N.; Singh, U . C.; Bash, P. A.; Kollman, P. A. Nature 1987,
( 3 5 ) van Gunsteren, W. F.; Berendsen, H. J. C. J . Compur.-Aided Mol.
(36) Cieplak, P.; Kollman, P. A. J . Am. Chem. SOC. 1988, 110, 3734. (37) Jorgensen, W. L.; Gao, J . J . Am. Chem. Soc. 1988, 110, 4212. (38) Jorgensen, W. L.; Briggs, J . M.; Gao, J . J . Am. Chem. Soc. 1987,109,
6857. Jorgensen, W. L.; Briggs, J. M . J . Am. Chem. Soc. 1989, 111,4190. (39) Jorgensen. W. L.; Boudan, S.; Nguyen, T. B. J . Am. Chem. Soc. 1989,
1 1 1 , 155. (40) McQuarrie, D. A. Sfatistical Mechanics; Harper and Row: New
York, 1976. (41) Postma, J . P. M.; Berendsen, H. J . C.; Haak, J. R. Faraday Symp.
Chem. Soc. 1982, 17, 5 5 . (42) Friedman, H. L. A Course in Statistical Mechanics; Prentice-Hall:
Engiewood Cliffs, NJ, 1985. (43) Bennett, C. H. J . Compur. Phys. 1976, 22, 291. (44) Berendsen, H. J. C. In Molecular Dynamics and Protein Structure;
Hermans, J., Ed.; University of North Carolina: Chapel Hili, NC, 1985. (45) Beveridge, D.; Mezei, M. In Molecular Dynamics and Prorein
Srrucrure; Hermans. J., Ed.; University of North Carolina: Chapel Hill, NC, 1985.
(46) Brooks, C. L., 111 J . Phys. Chem. 1986. 90, 6680. (47) Weiner, P. K.; Kollman, P. A. J . Compur. Chem. 1981, 2, 281.
328, 5 5 1 .
Des. 1987, I , 171.
In the AMBER "slow growth" routine of the GIBBS module, the ensemble average is approximated in one step:
A.A C[V(q,X + Ah) - V ( ~ J ) I A (7) M
Here, M is the number of molecular dynamics steps and AX = 1 /M. The calculation of the free energy by such a method requires the interparticle potential guiding the dynamics to change by AX between each pair of steps. Also, the quantity in square brackets must be evaluated at each step and summed over the entire molecular dynamics run.
In our system, the expression in square brackets after can- cellation of the terms not dependent on X is V(r,X + AX) - V(r,X) = { [ t i (X + AX)~j]l/~[r*i(X + AX) +
r*j]I2 - [~i(X)tj]'/~[r*i(X) + r*j]'2}f'2ij - 2.0([ti(X + AX)~jl'/~[r*i(X + AX) + r*jI6 - [ti(X)tj]'/2[r*i(X) + r*jI6)r4ij
(8) Here, t and r* are the familiar parameters of the Lennard-Jones potential. The ith atom is the one undergoing the change (the cation) and the jth atom is any other atom in the system. The ti and r*i terms are calculated from the initial and final values (indicated by 0 and I , respectively) through the expressions
q ( X ) = (1-X)Coi + X t ' i
f*i(X) = (1 - X)f*Oi + hr*$
(9)
(10)
The initial, final, and all other constant t and r* values were arrived at through the conversions from the input parameters Ak and ck for all atom types:
t k = 0.25CkCk/Ak ( 1 1)
f*k = 0.50(2.0A,/Ck)'/6 (12)
Perturbation. Instead of using eq 2 to evaluate a change in free
(13)
where Qi is the canonical partition function of state i. If we consider this change from state 0 to state 1 as a perturbation of state 0,
HI = Ho + AH (14)
and if the perturbation occurs only in the potential energy terms of the Hamiltonian,
V, = Vo + AV (15)
AA = -Pi In (e~p(- /?AV(q)})~
energy, one can calculate the change from
AA = AI - A o = -PI In {Ql/Qo}
then eq 13 can be expressed as
(16) This is an exact expression for the free energy change associated with a perturbation A V of the reference system.
In our system, the perturbation is A V = { [ ~ ' ~ t ~ ] ' / 2 [ r * ' ~ + r*j]'2 - [tOitj]'/2[r*oi + r*j]'2Jf-lZij -
2.01 [~'itj]'/*[r*'i + r*jI6 - [ ~ ~ i t j ] ' / ~ [ ~ * ~ i + r*jI6)r4ij (17)
The initial and final values are identical with the terms in eqs 9 and IO and are calculated from input parameters through eqs 11 and 12.
In the AMBER "windowing" portion of the GIBBS module, the total perturbation AV can be divided into a set of smaller per- turbations 6V where
A V = 6 V (18)
The free energy change associated with the total perturbation is the sum of the free energy changes for each window. For example, the fifth window of a IO-window perturbation might calculate the free energy increment associated with changing an atom (P) from one whose c and r* terms were 60% initial state and 40% final state to one in which the terms are 50% each state. The averaging
windows

Molecular Recognition in Nonaqueous Solvents
is performed in an ensemble containing a particle P which is 60% Po and 40% PI. In this module, the number of molecular dynamics steps for equilibration at each window and the number of steps of data gathering after equilibration can be varied.
Calculating the Change in Entropy. The entropy change as- sociated with a given perturbation AV can be expressed as the negative of the temperature derivative of the corresponding free energy change:
-a& AS = - aT
Substituting eq 13 and performing the derivative yields an ex- pression for AS of the form
Using a finite difference approximation for the derivatives,
substituting for the partition functions, and simplifying with en- semble averages, an expression for the entropic change corre- sponding to a perturbation A V is obtained:
AS = k In (exp(-P(Vl - Vo)))o +
K I n 2AT [ k ( T + A T ) kT
In this expression, k is Boltzmann's constant and all of the averages are performed in the reference ensemble a t some constant tem- perature T.
Methods
All molecular dynamics simulations in this study were done in a box 28.52 A on a side with periodic boundary conditions and a cut-off radius of 9.0 A. The molecular dynamics package AMBER, version 3.0,47 was used for all calculations. It employs the leap-frog algorithm to integrate the equations of motion and the SHAKE'* routine to constrain all bonds to their equilibrium lengths. The box size was chosen so that the largest solute, the 18-crown-6, would have a t least 10 A of solvent between it and the side of the box. The volume corresponds to the experimental volume49 of 343 methanol molecules a t 300 K and 1 atm.
Solvent. Initially, the methanol oxygens were placed on a Cartesian lattice with spacings of 3.57 A. The united atom model% was used with Jorgensen's OPLS parameterss' for methanol. The methanol molecule was held rigid in its experimental geometrys2
(48) Ryckaert, J. P.; Ciccotti, G.; Berendsen, H. J. C. J . Comput. Phys.
(49) Wilhoit, R . C.; Zwolinski, B. J . J . Phys. Chem. Re/. Data, Suppl. 1977, 23. 327.
1971 I 2 -_ ._, . , -. (50) Weiner, S. J.; Kollman, P. A.; Case, D.; Singh, U. C.; Ghio, C.;
Alagona, G.; Profeta, S.; Weiner, P. J . Am. Chem. SOC. 1984, 106, 765. (5 I ) Jorgensen. W. L. J . Phys. Chem. 1986, 90, 1276. (52) Harmony, M. D.; Laurie, V. W.; Kuczkowski, R. L.; Swhwendeman,
R. H.; Ramsay, D. A.; Lovas, F. L.; Lafferty, W. J.; Maki, A. G. J . Phys. Chem. Ref. Data 1979, 8, 619.
J . Am. Chem. SOC., Vol. 112, No. 11, 1990 4413
Table 1. Solute/Solvent Systems free guest
members Na+,K+
simulation system 1 solute
solvent methanol labels for starting
342 solvent
N a 1 ,Na2,Na3,
KI,K2,K3,K4 configurations Na4,Na5,Na6
complexed guest Na+: 18-crown-6 K+: 18-crown-6 1 solute 335 solvent methanol N a l 1 ,NalZ,Nal3 ,Na14
KI 1,K12,KI 3,K14
by the addition of a bond between the carbon atom and the hydroxy hydrogen atom. The hydroxy hydrogen was assigned a mass of IO amu so as to reduce the high frequency motions. A series of 20 short (0.5 ps) NVE molecular dynamics runs were performed on the pure methanol to allow the system to relax. At the start of each NVE run, velocities were assigned randomly to the methanol atoms from a Maxwellian distribution of velocities corresponding to 300 K. The time step for each run was 0.001 ps. The potential energy of the system was monitored as the series of runs progressed. By the 10th run, the potential energy of each methanol had fallen from -5.4 kcal mol-' to -8.3 kcal mol-'. The second 10 runs maintained this energy, which is 2% higher than the experimental value of -8.5 kcal mol-' 49,53,54 and 3% higher than the value seen in previous Monte Carlosi and molecular dynamicssS calculations with this parameter set. The fact that we do not use a switching function at the cut-off point in our nonbonded interactions may account for the slight discrepancy.
A sequence of three molecular dynamics runs were then per- formed with weak coupling to a constant temperature baths6 at 300 K. The coupling was arrived at through scaling the velocities after each molecular dynamics step by p, where
Here, To is the bath temperature, T,,, is the temperature during the last dynamics step, At is the dynamics time step, and T~ is the coupling time constant. In the three NVT molecular dynamics runs, To = 300 K, At = 0.001 ps, and T~ = 0.1 ps. The first two NVT runs were 5 ps in length. The third run was 20 ps in length and had coordinates saved every 100 steps. From these coordi- nates, the self-diffusion constant for methanol was estimated through the Einstein relation
d 6 0 = lim -lr(t) - r(0)l2 I-- dt
In this expression, D is the diffusion constant and the right-hand side is the long-time rate of change of the mean square molecular displacement. A value 2.5 X cm2 s-I was calculated, which is 4% higher than e~periment.~' The deviation from experiment reflects both the approximations in the potential function and the use of an artifically high mass for the hydroxy hydrogen. In addition, the coordinates were used to calculate various radial distribution functions for the pure methanol system. These compared very favorably with those of J~rgensen.~ ' At this point, the box of pure methanol was believed to be equilibrated and ready for use as a starting structure for solvation.
Solutes. Two different types of solute/solvent systems are considered in this article, the free cation (either Na+ or K+) in methanol and the cation/ 18-crown-6 complexes in methanol (Table I) . The initial coordinates for the complexes were arrived at by having the 18-crown-6 adopt the perfect D3,, configuration with the cation equidistant from each of the six oxygen atoms.
~~
(53) Timmermans, J. Physico-chemical Constants of Pure Organic Com-
(54) Jorgensen, W. L. J . Am. Chem. SOC. 1980, 102, 543. (55) Haughney, M.; Farrario, M.; McDonald, I . R. J . Phys. Chem. 1987,
(56) Berendsen, H. J . C.; Pmtma, J. P. M.; van Gunsteren, W. F.; DiNola,
(57) Hurle, R. L.; Woolf, L. H. Ausr. J . Chem. 1980, 33, 1947.
pounds; Elsevier: Amsterdam, 1950.
91, 4934.
A.; Haak, J. R . Chem. Phys. 1984.81, 3684.
4414 J . Am. Chem. SOC., Vol. 112, No. 1 1 , 1990 Mazor et al.
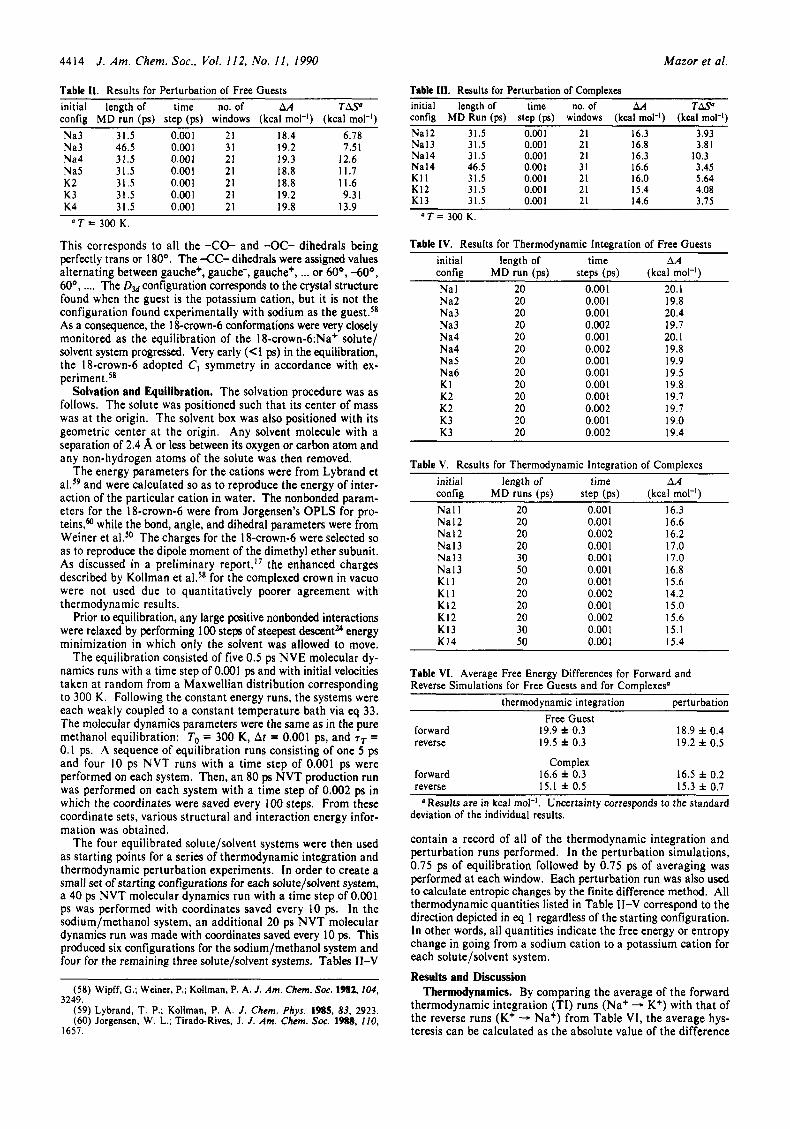
Table 11. Results for Perturbation of Free Guests initial length of time no. of AA TAS" config MD run (ps) step (us) windows (kcal mol-I) (kcal mol-,) Na3 31.5 0.001 21 18.4 6.78 Na3 46.5 0.001 31 19.2 7.51 Na4 31.5 0.001 21 19.3 12.6 Na5 31.5 0.001 21 18.8 11.7 K2 31.5 0.001 21 18.8 11.6 K3 31.5 0.001 21 19.2 9.31 K4 31.5 0.001 21 19.8 13.9
O T = 300 K .
This corresponds to all the -CO- and -0C- dihedrals being perfectly trans or 1 80°. The -CC- dihedrals were assigned values alternating between gauche+, gauche-, gauche', ... or 60°, -60°, 60°, .... The D3,, configuration corresponds to the crystal structure found when the guest is the potassium cation, but it is not the configuration found experimentally with sodium as the guest.s8 As a consequence, the 18-crown-6 conformations were very closely monitored as the equilibration of the 18-crown-6:Na+ solute/ solvent system progressed. Very early (<I ps) in the equilibration, the 18-crown-6 adopted C, symmetry in accordance with ex- ~ e r i m e n t . ~ ~
Solvation and Equilibration. The solvation procedure was as follows. The solute was positioned such that its center of mass was at the origin. The solvent box was also positioned with its geometric center a t the origin. Any solvent molecule with a separation of 2.4 A or less between its oxygen or carbon atom and any non-hydrogen atoms of the solute was then removed.
The energy parameters for the cations were from Lybrand et aLS9 and were calculated so as to reproduce the energy of inter- action of the particular cation in water. The nonbonded param- eters for the 18-crown-6 were from Jorgensen's OPLS for pro- teins," while the bond, angle, and dihedral parameters were from Weiner et aLsO The charges for the 18-crown-6 were selected so as to reproduce the dipole moment of the dimethyl ether subunit. As discussed in a preliminary report," the enhanced charges described by Kollman et aLs8 for the complexed crown in vacuo were not used due to quantitatively poorer agreement with thermodynamic results.
Prior to equilibration, any large positive nonbonded interactions were relaxed by performing 100 steps of steepest descent" energy minimization in which only the solvent was allowed to move.
The equilibration consisted of five 0.5 ps NVE molecular dy- namics runs with a time step of 0.001 ps and with initial velocities taken at random from a Maxwellian distribution corresponding to 300 K. Following the constant energy runs, the systems were each weakly coupled to a constant temperature bath via eq 33. The molecular dynamics parameters were the same as in the pure methanol equilibration: To = 300 K, Ar = 0.001 ps, and T~ = 0.1 ps. A sequence of equilibration runs consisting of one 5 ps and four IO ps NVT runs with a time step of 0.001 ps were performed on each system. Then, an 80 ps NVT production run was performed on each system with a time step of 0.002 ps in which the coordinates were saved every 100 steps. From these coordinate sets, various structural and interaction energy infor- mation was obtained.
The four equilibrated solute/solvent systems were then used as starting points for a series of thermodynamic integration and thermodynamic perturbation experiments. In order to create a small set of starting configurations for each solute/solvent system, a 40 ps NVT molecular dynamics run with a time step of 0.001 ps was performed with coordinates saved every IO ps. In the sodium/methanol system, an additional 20 ps NVT molecular dynamics run was made with coordinates saved every I O ps. This produced six configurations for the sodium/methanol system and four for the remaining three sotute/solvent systems. Tables 11-V
(58) Wipff, G.; Weiner, P.; Kollman, P. A. J . Am. Chem. Soc. 1982,104,
(59) Lybrand, T. P.; Kollman, P. A. J . Chem. Phys. 1985, 83. 2923. (60) Jorgensen, W. L.; Tirado-Rives, J. J . Am. Chem. SOC. 1988, 110.
3249.
1657.
Table 111. Results for Perturbation of Complexes initial length of time no. of M T A P config MD Run (ps) step (ps) windows (kcal mol-') (kcal mol-') Na12 31.5 0.001 21 16.3 3.93 Na13 31.5 0.001 21 16.8 3.81 Na14 31.5 0.001 21 16.3 10.3 Na14 46.5 0.001 31 16.6 3.45 KI 1 31.5 0.001 21 16.0 5.64 K12 31.5 0.001 21 15.4 4.08 K13 31.5 0.001 21 14.6 3.75
T = 300 K.
Table IV. Results for Thermodynamic Integration of Free Guests initial config Na 1 Na2 Na3 Na3 Na4 Na4 Na5 Na6 KI K2 K2 K3 K3
length of M D run (DS)
20 20 20 20 20 20 20 20 20 20 20 20 20
time
0.001 0.001 0.002 0.001 0.002 0.001 0.001 0.001 0.001 0.002 0.001 0.002
AA (kcal mol-l)
20.1 19.8 20.4 19.7 20.1 19.8 19.9 19.5 19.8 19.7 19.7 19.0 19.4
Table V. Results for Thermodynamic Integration of Complexes
config M D runs (ps) step (ps) (kcal mol-') initial length of time AA
N a l l 20 0.001 16.3 Na12 Na12 Na13 Na13 Na13 KI 1 KI 1 K12 K12 K13 K14
20 20 20 30 50 20 20 20 20 30 50
0.001 0.002 0.001 0.001 0.001 0.001 0.002 0.001 0.002 0.001 0.001
16.6 16.2 17.0 17.0 16.8 15.6 14.2 15.0 15.6 15.1 15.4
Table VI. Average Free Energy Differences for Forward and Reverse Simulations for Free Guests and for Complexesa
thermodynamic integration perturbation Free Guest
forward 19.9 f 0.3 18.9 f 0.4 reverse 19.5 f 0.3 19.2 f 0.5
Complex forward 16.6 f 0.3 16.5 f 0.2 reverse 15.1 f 0.5 15.3 f 0.7
aResults are in kcal mo1-I. Uncertainty corresponds to the standard deviation of the individual results.
contain a record of all of the thermodynamic integration and perturbation runs performed. In the perturbation simulations, 0.75 ps of equilibration followed by 0.75 ps of averaging was performed at each window. Each perturbation run was also used to calculate entropic changes by the finite difference method. All thermodynamic quantities listed in Table 11-V correspond to the direction depicted in eq 1 regardless of the starting configuration. In other words, all quantities indicate the free energy or entropy change in going from a sodium cation to a potassium cation for each solute/solvent system. Results and Discussion
Thermodynamics. By comparing the average of the forward thermodynamic integration (TI) runs (Na+ - K+) with that of the reverse runs (K+ - Na+) from Table VI, the average hys- teresis can be calculated as the absolute value of the difference

Molecular Recognition in Nonaqueous Solvents
between the two. For the free guests, a value of 0.4 kcal mol-' or 3% is obtained. The small hysteresis for the thermodynamic integration of sodium cation to potassium cation in methanol indicates a situation in which the Hamiltonian is changing slowly enough for the resulting configurational changes of the system to keep pace. Similarly small hysteresis values have been found in TI simulations in which the free energy difference between sodium and potassium cations in
From Table VI, a hysteresis of 1.5 kcal mol-' or 9% is found for the complexes. Prior TI simulations on the same host/guest species in water solvent also yielded a large hysteresis.18 In this study and in the water solvent study, the T I runs in which the sodium was changed into the potassium while complexed resulted in free energy differences whose absolute value was larger than that of the reverse run. A large hysteresis may indicate a situation in which the Hamiltonian is changing too quickly. In order to reduce the rate of change of the Hamiltonian with respect to time and hopefully allow the resulting configurational changes of the system to keep pace, two long (50 ps) thermodynamic integration runs were performed. We see that these two long runs have a hysteresis of 1.4 kcal mo1-l and were very consistent with the other forward and reverse simulations. Because all TI simulations of finite length have the generated configurations lagging the Hamiltonian:lfi* it can not be determined from these results alone whether the forward or the reverse runs are a more accurate measure of the free energy difference between the complexes.
In an effort to better understand the complexes and to generate data for use in calculating the entropic differences, a series of perturbation simulations were done. The results of these simu- lations for the free guests and for the complexes can be found in Table I I and 111, respectively. Again, the data for the free guest is very self consistent between the forward and reverse simulations (Table VI). They are also very similar to the thermodynamic integration results. The entropic results are consistent with the general notion of sodium being a solvent structure-making cation while potassium cation is the converse due to its larger size.63
The free energy differences from the perturbation experiments are also very consistent with those from thermodynamic integration for the complexes (Table VI). Again, the free energy calculations for a particular direction agree very well between the thermo- dynamic integration and the perturbation results. The entropic results are fairly consistent between the forward and reverse directions with the exception of the short simulation starting with the Na14 configuration (Table 111). They indicate a small but consistent increase in entropy in going from sodium to potassium while complexed. This difference may be due in part to differences in the solvent structure around the host-guest complex, although compressibility measurements in water seem to indicate that there is not a large amount of solvent structure around the complexes."Js The large uncertainty in the entropic results hampers any quan- titative discussion. Michaux and Reissell came to a similar conclusion regarding the solvation entropy contributions for the complexes in their solution thermodynamics study of the binding of 18-crown-6 to Na+ and K+ in water and methanol, stating that "we prefer to conclude that at the level of accuracy we are dealing with, these contributions are similar for the two solvents and more or less independent of the nature of the cation". Through viewing the trajectories of the complexes and their associated solvent molecules, some indication was seen that the motion of the solvent molecules residing near the solute was restricted to a greater extent by the sodium complex than by the potassium complex. This may account for part of the entropy increase in going from a soi- um/ 18-crown-6 complex to a potassium/ 18-crown-6 complex. These solvent motions will be discussed in detail in the following section.
During a forward TI run, the 18-crown-6 begins in a Cl con- figuration and ends in a configuration of approximately D3,+
was calculated.
(61) Straatsma, T. P.; Berendsen. H. J. C. J. Chem. Phys. 1988,89,5876. (62) Straatsma, T. P.; Berendsen, H. J. C.; Postma, J. P. M. J . Chem.
(63) Marcus, Y. Ion Soluarion; John Wiley and Sons: Chichester, NY, Phys. 1986.85.6720.
1985.
J . Am. Chem. SOC., Vol. I 12, No. 1 I, I990 441 5
Table VII. Thermodynamic Quantities for the Selective Binding of K+ versus Na+ to 18-crowp6 in Methanol at 300 K
relative AAA AAU TAAS complexation values" (kcal mol-I) (kcal mol-') (kcal mol-I)
experiment -2.48 f 0.09 -5.20 f 0.17 -2.72 f 0.26 TI -3.8 f 1.3 P -3.0 f 1.2 -8.4 f 3.8 -5.4 f 5.0 relative AAA AAU TAAS
solvation valuesb (kcal mol-') (kcal mol-') (kcal mol-') experiment 17.3 20.48 3.18 TI 19.8 f 0.4 P 19.1 f 0.4 29.6 f 2.2 10.5 f 2.6
individual AA AU TAS reactionsC (kcal mol-') (kcal mol-I) (kcal mol-')
1 -5.94 dz 0.04 -7.50 f 0.07 -1.56 f 0.1 1 2 -8.42 f 0.05 -12.70 f 0.10 -4.28 f 0.15 3
TI 19.8 f 0.4 P 19.1 f 0.4 29.6 f 2.2 10.5 f 2.6
TI 16.0 f 0.9 P 16.1 f 0.8 21.1 f 1.6 5.1 f 2.4
4
'Experimental results from ref 11. TI = Thermodynamic Integra- tion. P = Perturbation. bFor reaction 3 of eq l . Experimental results from ref 62. <Numbers correspond to eq 1.
symmetry. Here, the symmetry group classification is assigned by the rotational isomeric state pattern of the dihedral angles, e.g., trans, trans, gauche+, trans, trans, gauche-, .... In the reverse TI runs, the 18-crown-6 starts in D3d symmetry and in 90% of the runs it is still in an approximately D3d configuration at the end when the guest is described by sodium parameters. From ab initioM and molecular mechanicss8 calculations of sodium cation interactions with 18-crown-6 with Cl and D3d symmetry, the C, structure is lower in energy by more than 4 kcal mol-' in vacuo. It is possible then that in the reverse TI simulations, runs of longer than 50 ps are needed to allow the 18-crown-6 to reach its lowest energy state.I8 Problems of this type in which a system with a number of accessible conformations is involved in a TI simulation are presently under study by Straatsma and M ~ C a m m o n . ' ~ . ~ ~ This work has shown that very long simulations (> 1 ns) may be necessary to fully explore the rotational isomeric states of free crown ether systems, and also that the order of stability of isomeric states in solution differs from that in vacuo for such systems. The sampling problem is likely to be present in the case of the com- plexes as well, although interactions with the guests may reduce the number of thermally accessible rotamers somewhat.
The thermodynamic results from the simulations can be com- pared with a variety of experimental data. As is seen from the top panel of Table VII, the relative free energies of complexation of the two guests as calculated both by thermodynamic integration and perturbation are in reasonable agreement with experiment. The contributions made from differences in entropy and internal energy are also qualitatively in agreement with experiment. Comparison can also be made between simulation and experiment for the relative free energy, entropy and internal energy of solvation for the two ions,
Na+(g) Na* + MeOH
In this cycle, reaction iv is identical with reaction 3 of the original thermodynamic cycle (eq 1). In comparing the experimental processes (steps i and ii in eq 2 5 ) with the simulation results (step iv in eq 25, and the middle panel in Table VII), one must consider the mass-dependent terms that are involved in principie in the
(64) Portmann, P.; Maruizumi, T.; Welti, M.; Badertscher, M.; Neszmelyi,
(65) Straatsma, T. P.; McCammon, J. A. J . Chem. Phys. 1989, 90, 3300. A.; Simon, W.; Pretsch, E. J . Chem. Phys. 1987, 87, 493.
4416 J. Am. Chem. Soc.. Vol. 112, No. 11, 1990
I I I
/ I
I I
I I
I I
/
-
, I .- I
Mazor et ai.
I I
800.
600.
& 400. .I
200.
0. 2. 4.
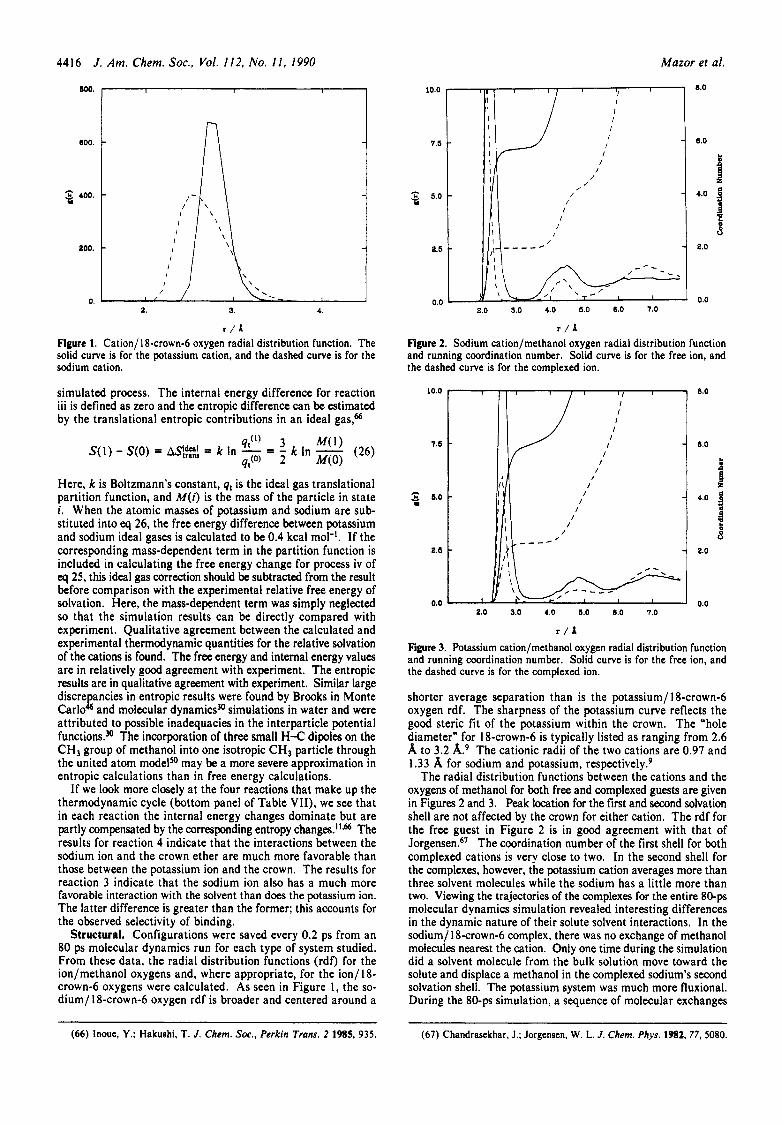
Figure 1. Cation/l8-crown-6 oxygen radial distribution function. The solid curve is for the potassium cation, and the dashed curve is for the sodium cation.
simulated process. The internal energy difference for reaction iii is defined as zero and the entropic difference can be estimated by the translational entropic contributions in an ideal gas,66
clt(’) 3 M ( 1 ) (26) S(1) - S(0) = Ht& = k In - = - k In -
qt(0) 2 M ( 0 )
Here, k is Boltzmann’s constant, qt is the ideal gas translational partition function, and M ( i ) is the mass of the particle in state i. When the atomic masses of potassium and sodium are sub- stituted into eq 26, the free energy difference between potassium and sodium ideal gases is calculated to be 0.4 kcal mol-’. If the corresponding mass-dependent term in the partition function is included in calculating the free energy change for process iv of eq 25, this ideal gas correction should be subtracted from the result before comparison with the experimental relative free energy of solvation. Here, the mass-dependent term was simply neglected so that the simulation results can be directly compared with experiment. Qualitative agreement between the calculated and experimental thermodynamic quantities for the relative solvation of the cations is found. The free energy and internal energy values are in relatively good agreement with experiment. The entropic results are in qualitative agreement with experiment. Similar large discrepancies in entropic results were found by Brooks in Monte Carlo4 and molecular dynamicsM simulations in water and were attributed to possible inadequacies in the interparticle potential functions.a The incorporation of three small H-C dipoles on the CH3 group of methanol into one isotropic CH3 particle through the united atom modelw may be a more severe approximation in entropic calculations than in free energy calculations.
If we look more closely at the four reactions that make up the thermodynamic cycle (bottom panel of Table VII), we see that in each reaction the internal energy changes dominate but are partly compensated by the corresponding entropy changes.”*& The results for reaction 4 indicate that the interactions between the sodium ion and the crown ether are much more favorable than those between the potassium ion and the crown. The results for reaction 3 indicate that the sodium ion also has a much more favorable interaction with the solvent than does the potassium ion. The latter difference is greater than the former; this accounts for the observed selectivity of binding.
Structural. Configurations were saved every 0.2 ps from an 80 ps molecular dynamics run for each type of system studied. From these data, the radial distribution functions (rdf) for the ion/methanol oxygens and, where appropriate, for the ion/ 18- crown-6 oxygens were calculated. As seen in Figure 1, the so- dium/ 18-crown-6 oxygen rdf is broader and centered around a
10.0
7.6
5.0 .I
2.6
0.0
6.0
6.0
b t $5
4.0 g 3 4 ::
2.0
0.0
j 2.0
I I I 0.0 0.0 2.0 3.0 4.0 6.0 6.0 7.0
r / l
Figure 3. Potassium cation/methanol oxygen radial distribution function and running coordination number. Solid curve is for the free ion, and the dashed curve is for the complexed ion.
shorter average separation than is the potassium/ 18-crown-6 oxygen rdf. The sharpness of the potassium curve reflects the good steric fit of the potassium within the crown. The ‘hole diameter” for 18-crown-6 is typically listed as ranging from 2.6 8, to 3.2 A? The cationic radii of the two cations are 0.97 and 1.33 8, for sodium and potassium, re~pectively.~
The radial distribution functions between the cations and the oxygens of methanol for both free and complexed guests are given in Figures 2 and 3. Peak location for the first and second solvation shell are not affected by the crown for either cation. The rdf for the free guest in Figure 2 is in good agreement with that of Jorgensen.6’ The coordination number of the first shell for both complexed cations is very close to two. In the second shell for the complexes, however, the potassium cation averages more than three solvent molecules while the sodium has a little more than two. Viewing the trajectories of the complexes for the entire 80-ps molecular dynamics simulation revealed interesting differences in the dynamic nature of their solute solvent interactions. In the sodium/ 18-crown-6 complex, there was no exchange of methanol molecules nearest the cation. Only one time during the simulation did a solvent molecule from the bulk solution move toward the solute and displace a methanol in the complexed sodium’s second solvation shell. The potassium system was much more fluxional. During the 80-ps simulation, a sequence of molecular exchanges
(66) Inoue, Y.; Hakushi, T. J. Chem. Soc., Perkin Trans. 2 1985, 935. (67) Chandrasekhar, J.; Jorgensen. W. L. J . Chem. fhys. 1982,77,5080.
Molecular Recognition in Nonaqueous Solvents
I I I I I
, I I I I I
1.5
1.0
0.5
n n -25.0 -111.0 -5.0 5.0
Energy / kcal.mol-'
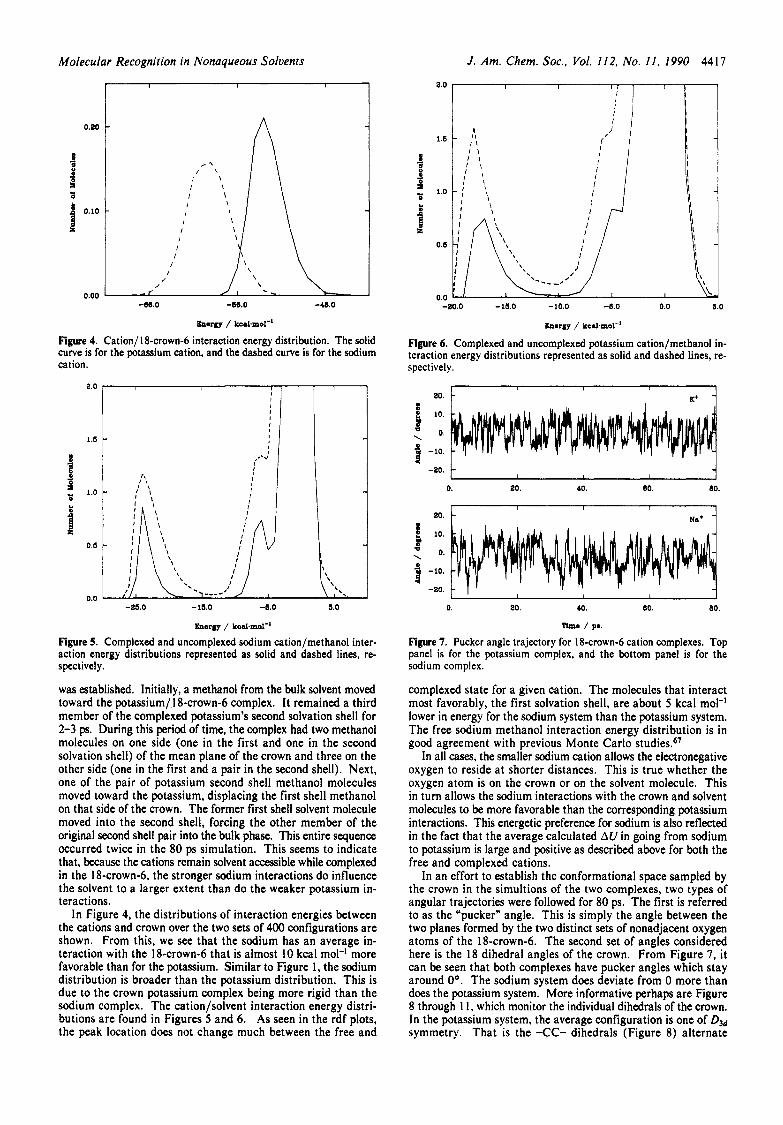
Figure 5. Complexed and uncomplexed sodium cation/methanol inter- action energy distributions represented as solid and dashed lines, re- spectively.
was established. Initially, a methanol from the bulk solvent moved toward the potassium/ 18-crown-6 complex. It remained a third member of the complexed potassium's second solvation shell for 2-3 ps. During this period of time, the complex had two methanol molecules on one side (one in the first and one in the second solvation shell) of the mean plane of the crown and three on the other side (one in the first and a pair in the second shell). Next, one of the pair of potassium second shell methanol molecules moved toward the potassium, displacing the first shell methanol on that side of the crown. The former first shell solvent molecule moved into the second shell, forcing the other member of the original second shell pair into the bulk phase. This entire sequence occurred twice in the 80 ps simulation. This seems to indicate that, because the cations remain solvent accessible while complexed in the 18-crown-6, the stronger sodium interactions do influence the solvent to a larger extent than do the weaker potassium in- teractions.
In Figure 4, the distributions of interaction energies between the cations and crown over the two sets of 400 configurations are shown. From this, we see that the sodium has an average in- teraction with the 18-crown-6 that is almost 10 kcal mol-' more favorable than for the potassium. Similar to Figure 1, the sodium distribution is broader than the potassium distribution. This is due to the crown potassium complex being more rigid than the sodium complex. The cation/solvent interaction energy distri- butions are found in Figures 5 and 6. As seen in the rdf plots, the peak location does not change much between the free and
Figure 6. Complexed and uncomplexed potassium cation/methanol in- teraction energy distributions represented as solid and dashed lines, re- spectively.
20. 1 Y+ -I ! 10.
H \ O.
j -10.
-20 I- -I ~
0. 20. 40. 80. 80.
I 1
"+ 20.
0. 20. 40. 80. 80.
Tim0 / pa.
Figure 7. Pucker angle trajectory for 18-crown-6 cation complexes. Top panel is for the potassium complex, and the bottom panel is for the sodium complex.
complexed state for a given cation. The molecules that interact most favorably, the first solvation shell, are about 5 kcal mol-' lower in energy for the sodium system than the potassium system. The free sodium methanol interaction energy distribution is in good agreement with previous Monte Carlo ~ tudies .~ '
In all cases, the smaller sodium cation allows the electronegative oxygen to reside at shorter distances. This is true whether the oxygen atom is on the crown or on the solvent molecule. This in turn allows the sodium interactions with the crown and solvent molecules to be more favorable than the corresponding potassium interactions. This energetic preference for sodium is also reflected in the fact that the average calculated AU in going from sodium to potassium is large and positive as described above for both the free and complexed cations.
In an effort to establish the conformational space sampled by the crown in the simultions of the two complexes, two types of angular trajectories were followed for 80 ps. The first is referred to as the "pucker" angle. This is simply the angle between the two planes formed by the two distinct sets of nonadjacent oxygen atoms of the 18-crown-6. The second set of angles considered here is the 18 dihedral angles of the crown. From Figure 7, it can be seen that both complexes have pucker angles which stay around Oo. The sodium system does deviate from 0 more than does the potassium system. More informative perhaps are Figure 8 through 1 I , which monitor the individual dihedrals of the crown. In the potassium system, the average configuration is one of D3d symmetry. That is the -CC- dihedrals (Figure 8) alternate

44 18 J . Am. Chem. SOC., Vol. I 12, No. 11 , I990 Mazor et al.
-eo
eo -eo
eo
-00
60
-00
eo
-00 D
eo
-00
eo
0.0 20.0 40.0 00.0 80.0 Tim. / pa.
Figure 8. The six C C - dihedral angle trajectories for the potassium/ 18-crown-6 complex.
120
240 1 I I
120 I- -I
240
120
240
120
0.0 20.0 40.0 60.0 80.0 Time / pa.
Figure 9. The six 40- and six -0C- dihedral angle trajectories for the potassium/ 18-crown-6 complex drawn as thick and thin lines, respec- tively.
between gauche+ and gauche- and the 40- and -0C- dihedrals (Figure 9) stay trans as one moves around the ring. This is evidence again of the good fit of the potassium inside the 18- crown-6. The sodium case is much more dynamic. The -CC- dihedrals (Figure 10) shift from gauche+ to gauche- and back during the course of the simulation. The 40- and -0C- di- hedrals (Figure 1 I ) show large excursions from trans. This re- inforces the fact that the 18-crown-6 must leave the DM symmetry for a lower C, symmetry on average to achieve the close cation- oxygen distances important for favorable interactions. Conclllsions
The thermodynamic results of this study are in reasonable agreement with available experimental results. In particular, the
\ I I
eo
-00
00 r
-00
eo - 0.0 20.0 40.0 80.0 80.0
Time / pa.
Figure 10. The six -CC- dihedral angle trajectories for the sodium/ 18-crown-6 complex.
120
240
120 t i
240
240 I I I
120
0.0 20.0 40.0 80.0 80.0 Tim0 / pa.
Figure 11. The six CO- and six a- dihedral angle trajectories for the scdium/l8-crown-6 complex drawn as thick and thin lines, respec- tively.
free energy results are very encouraging. The energetic and entropic quantities are in qualitative agreement with experiment. The free energies of the uncomplexed and complexed sodium systems are both less than their potassium counterparts. The difference is greater for the uncomplexed systems, however, yielding the expected potassium selectivity of 18-crown-6 in methanol. Solvation and complexation are energetically driven with the sodium systems always favored. The more favorable interaction of the sodium cation with both the solvent and host is seen in the atomic pair interaction energy distributions. The shorter sodium oxygen separation seen in the radial distribution function plots is a major factor in the relative energetics and hence in the selectivity of binding.
J . Am. Chem. SOC. 1990, 112, 4419-4424 4419
the Burroughs Wellcome Fund. T. P. Lybrand is the recipient of a Presidential Young Investigator Award from the NSF. M. H. Mazor is supported by an NIH Traineeship under the Houston Area Molecular Biophysics Training Program.
Acknowledgment. This work has been supported in part by grants from NSF, the Robert A. Welch Foundation, and the National Center for Supercomputing Applications. J . A. McCammon is the recipient of the G. H. Hitchings Award from
Hydrolytically Degradable Amino Acid Containing Polymers
Andrea Staubli, Eyal Ron, and Robert Langer* Contribution from the Department of Chemical Engineering, Massachusetts Institute of Technology, Cambridge, Massachusetts 021 39. Received October 5, 1989
Abstract: A universal approach to incorporate amino acids into a polymeric backbone via hydrolytically labile bonds is reported. The amino acids were first converted into dicarboxylic acids by derivatization at their amino terminus with trimellitic anhydride and subsequently polymerized via the corresponding mixed anhydride by melt polycondensation in vacuo at elevated temperatures (100-200 "C). The reaction conditions (e.g., reaction time, temperature, and effect of several catalysts) were optimized for both the homopolymers and copolymers with sebacic acid in defined ratios. Polymerizations performed at 180 OC gave, in general, maximal molecular weight after 1-2 h, followed by subsequent gelation of the polymers. Higher molecular weight copolymers (M, > IOOOOO) were obtained with increasing content of sebacic acid, which exhibited low melting points (<IO0 "C) and good solubility in common organic solvents. Both enhanced degradation (as compared to conventional poly(amino acids)) due to the presence of hydrolytically labile anhydride bonds and improved mechanical strength as a result of the existing imide bonds was observed.
A variety of polymeric structures containing amino acids have been synthesized, principally polypeptides which have been used in structural, immunological, and enzymological studies as well as in biomaterials (e.g., s ~ t u r e s , ' ~ ~ J ' skin substitute^,^*^ drug de- livery systems5). While the significance of polypeptides is un- questioned, their value in some areas such as biomaterials is frequently limited due to undesirable chemical and physical properties, e.g., their chemical inertness-which leads to mainly enzyme-mediated and possibly irreproducible biodegrada- tion'v2-and potential antigenicity. Nonpeptidic analogues have been synthesized by using both side-chain modifications and backbone modifications (e.g., replacement of individual backbone elements6 or copolymerization of intact polypeptide blocks with other chain sequences'.*). Another possibility are poly(amino acids) where intact amino acids are polymerized via their side- chain functionalities by nonpeptidic bonds (such as iminocarbonate or ester bonds, which have been reported to display improved film- and fiber-forming properties9) generating structural analogues of conventional poly(amino acids).'O The latter approach, how- ever, is only applicable to selected amino acids, each of them requiring specifically designed synthesis procedures depending on their side-chain functionalities.
In this report we describe a universal approach to incorporate amino acids into the polymeric backbone via hydrolytically labile anhydride linkages. Previous findings showed that the degradation rates of poly(anhydrides) may range from days to years, depending on the choice of monomer unit." It occurred to us that one of
( I ) Dickinson, H. R.; Hiltner, A.; Gibbons, D. F.; Anderson, J. M. J.
( 2 ) Dickinson, H. R.; Hiltner, A. J . Eiomed. Mater. Res. 1981, I S , 591. (3) Aiba. S.; Minoura, N.; Fujiwara, Y . J. Eiomed. Mater. Res. 1982, 16,
181. (4) Aiba, S.; Minoura, N.; Fujiwara, Y.; Yamada, S.; Nakagawa, T.
Biomaterials 1985. 6 , 3 I . (5) Kopecek, J. Biomaterials 1984, 5. 19. (6) Spatola, A. F. Peptide Backbone Modifications. In Chemistry and
Biochemistry of Amino Acids, Peptides, and Proteins; Weinstein, B., Ed.; Marcel Dekker: New York, 1983; pp 268-357.
(7) Vlasov, G. P.; Rudkovskaya, G. D.; Ovsyannikova, L. A. Makromol. Chem. 1982, 183, 2635.
(8) Kumaki, T.; Sisido, M.; Imanishi, Y. J . Biomed. Mater. Res. 1985, 19, 785.
(9) Goodman, 1.; Rhys, J. A. Polyesters; American Elsevier: New York, 1965; Vol. I .
(IO) Kohn, J.; Langer, R. J . Am. Chem. Soc. 1987, 109, 817.
Biomed. Mater. Res. 1981, I S , 577.
Table I . Copolymerization of N-Trimellitylimidoglycine (TMA-gly) with Sebacic Acid (SA) in Various Ratios at 180 OC
9C TMA-gly 7% S A M W ' Mn MWIM, 16 84 104860 51560 2.03 20 80 61880 37670 1.64 29 71 46256 20412 2.27 40 61 27284 10294 2.65 50 50 15530 4959 3.13 63 37 9105 4806 1.89 70 30 6080 3476 1.75 80 20 3098 2162 1.43 90 IO 3050 2765 1.1
a Melt polymerized for 2 h.
the disadvantages of poly(anhydrides), Le., their poor mechanical properties, may be eliminated by the integration of either amide linkages, which reinforce the polymer by intermolecular attractive forces (e.g., hydrogen bonding)-or imide bonds, which are known for their excellent mechanical and thermal qualities. Best results were obtained in the latter case where the amino terminus is incorporated into a ring system eliminating any interfering side reactions (as opposed to the amide-containing poly(anhydrides) where the polymer synthesis was limited by possible side reactions of the free remaining electron pair on the secondary amide group, e.g., intramolecular cyclization to form N-carboxyanhydrides). The chemical synthesis was conducted in three steps. The amino acids were first converted into diacids by condensation with tri- mellitic anhydride (in the case of amino acids with reactive side-chain functionalities, conventional protecting groups need to be introducedI2). These dicarboxylic acid monomers were then converted to their mixed anhydride with acetic acid by heating at reflux in acetic anhydride.I3q1* The isolated and purified prepolymers were then subjected to melt-polycondensation at elevated temperatures in vacuo under nitrogen sweep (Figure 1).
This approach allows the integration of essentially any amino acid into the backbone, creating a new class of polymers which should display both enhanced degradability (due to the presence
( 1 1) Leong, K. W.; Brott, B. C.; Langer, R. J . Eiomed. Mater. Res. 1985, 19. 941.
(12) Bodanszky, M.; Bodanszky, A. In The Practice of Peptide Synthesis;
(13) Domb, A. J.; Langer, R. J . Polym. Sci. 1987, 25, 3373. Springer Verlag: 1984.
0002-7863/90/ 151 2-4419$02.50/0 0 1990 American Chemical Society