molecular study of the genetic variability of pumpkins landraces … · 2018-05-08 · 1núcleo de...
TRANSCRIPT
Agricultural Sciences, 2018, 9, 511-523 http://www.scirp.org/journal/as
ISSN Online: 2156-8561 ISSN Print: 2156-8553
DOI: 10.4236/as.2018.94035 Apr. 30, 2018 511 Agricultural Sciences
Molecular Study of the Genetic Variability of Pumpkins Landraces from Brazilian Amazon
Lúcia Helena Pinheiro Martins1, Maria Teresa Gomes Lopes2, Hiroshi Noda3, Pedro de Queiroz Costa Neto2, Ayrton Luiz Urizzi Martins2, Fabíola Viana de Almeida4, Liane Cristine Rebouças Demosthenes5
1Núcleo de Etnoecologia da Amazônia (NETNO) Universidade Federal do Amazonas, Manaus, Brazil 2Faculdade de Ciências Agrárias (FCA), Universidade Federal do Amazonas, Manaus, Brazil 3Instituto Nacional de Pesquisas da Amazônia (INPA), Manaus, Brazil 4Instituto Federal de Educação Tecnológica do Amazonas/Campus Parintins, IFAM/Parintins, Brazil 5Instituto de Ciências Exatas e Tecnologia (ICET), Universidade Federal do Amazonas, Itacoatiara, Brazil
Abstract The Cucurbita maxima Duchesne is a vegetable crop plant cultivated and maintained by traditional Amazon communities, Brazil. The situation is wor-sened by the possibility of disappearance of local populations and genetic va-riability of this specie, taking into account the today changes promoted in family farming. The aim of this study was to estimate the current levels of ge-netic variability of local cultivars through the use of molecular markers (Am-plified Fragment Length Polymorphism—AFLP). We chose to collect in two distinct micro regions in order to identify possible influences of geographic isolation and different levels of market requirements in the conservation of the genetic variability of the C. maxima. For the molecular analysis, bulk sam-ples of fresh leaves of 15 plants/half-sibling family were collected in paper bags. There were 34 samples from the half-sib families. The analysis of the re-sults half-sib obtained by methods of estimation of genetic variation by mole-cular markers shows that the forms of cultivation and management adopted by family farmers maintain the identities of the local/landraces (native culti-vars) and, at the same time, the levels of diversity for the assurance of adapta-bility macro-environmental. Keywords Crop Genetic Variability, Molecular Marker, Amplified Fragment Length Polymorphism,Cucurbita maxima Duchesne
How to cite this paper: Martins, L.H.P., Lopes, M.T.G., Noda, H., de Queiroz Costa Neto, P., Martins, A.L.U., de Almeida, F.V. and Demosthenes, L.C.R. (2018) Molecular Study of the Genetic Variability of Pump-kins Landraces from Brazilian Amazon. Agricultural Sciences, 9, 511-523. https://doi.org/10.4236/as.2018.94035 Received: March 14, 2018 Accepted: April 28, 2018 Published: April 30, 2018 Copyright © 2018 by authors and Scientific Research Publishing Inc. This work is licensed under the Creative Commons Attribution International License (CC BY 4.0). http://creativecommons.org/licenses/by/4.0/
Open Access

L. H. P. Martins et al.
DOI: 10.4236/as.2018.94035 512 Agricultural Sciences
1. Introduction
The Cucurbita maxima Duchesne is a vegetable crop plant cultivated and main-tained by traditional Amazon communities, Brazil. The C. maxima species known as Jerimum Caboclo. It is present in the production system of the region-al family agriculture and in the list of plants of the diet of these people [1]. It can be consumed in various ways, its ripe and immature fruits, flowers and leaves as vegetables, edible seeds and ripe fruits as forage [2] [3]. Although Brazil is con-sidered a center of diversity of pumpkins and squash, there is little knowledge about the germplasm maintained by family farming in the Amazon. The situa-tion is worsened by the possibility of disappearance of local populations and ge-netic variability of this specie, taking into account the today changes promoted in family farming.
Five Cucurbita species are cultivated plants (C. argyrosperma Huber., C. fici-folia Bouché, C. maxima Duchesne, C. moschata Duchesne and C. pepo L.) [4]. The native species of the Americas were part of the food base, already in the time of the Olmec civilization, later incorporated by the Aztec, Inca and Maia civiliza-tions. Even today, species of Cucurbitaceae are in the system of ancestral indi-genous production complex in Mexico called milpa. The pumpkins (C. moscha-ta and C. argyrosperma) are cultivated associated with legumes such as beans (Phaseolus spp. or Vigna unguiculata (L.) Walp.) and maize (Zea mays L.) [5]. In Brazil, C. moschata and C. maxima were part of the diet of indigenous peoples before colonization [6].
All species of the genus Cucurbita are diploid, with 20 pairs of chromosomes (2n = 40). The plants are annual, presenting herbaceous stem, creeping, scandal or subshrub, equipped with tendrils and adventitious roots. The branches can reach 10 meters in length. The leaves are large, dark green in color. The fruits have varied shapes and sizes; In C. maxima, the peduncle is of circular section [7].
The pumpkins are cross-breeding plants, and pollination is carried out by in-sects (entomophilic pollination) [8]. The reproductive system is characterized by cross-pollination which is favored by monoic flowers. The flowers open in the morning and have the bees as the main group of pollinators.
The production ratio of male and female flowers varies greatly. Environments of high temperatures favor the formation of male flowers and milder tempera-tures, feminine flowers. The development of the plant is differentiated; however, synchronization occurs in the anthesis of male and female flowers [9].
The selection allowed the maintenance of great genetic variability among and within the cultivated species. Variability is associated with a diversity of uses at-tributed to interests and needs in relation to different formats and sizes [10].
The molecular marker AFLP (Amplified Fragment Length Polymorphism) technique has been used in the evaluation of genetic diversity of lineages, clones and germplasm bank accesses. The technique has advantages such as the repro-ducibility of amplified fragments and the speed of analysis due to the fluores-

L. H. P. Martins et al.
DOI: 10.4236/as.2018.94035 513 Agricultural Sciences
cence primer labeling system [11]. The advantage of generating a large number of polymorphisms per reaction
and the need for prior knowledge of DNA sequence data for the construction of the primers used [12]. The technique consists in: digestion of the total genomic DNA with restriction enzymes, ligation of adapters with known sequence at the two ends of each fragment and selective amplification of the fragment set using primers [13] [14]. The amplified fragment marker may be an ideal tool for ge-netic studies and, among them, for genetic diversity.
So many techniques are available for the detection of genetic polymorphism, that is, the determination of genetic variability at the DNA sequence level. Mo-lecular markers are DNA characteristics that differentiate two or more individu-als and are inherited genetically [15]. They can be defined as any and all mole-cular phenotypes derived from an expressed gene or reference points on the chromosomes [16].
The AFLP technique has great capacity for the detection of genetic variability and use in characterization of cultivars. It is based on selective PCR amplifica-tion of restriction fragments from a total digest of genomic DNA [13]. It consists of the cleavage of the subject’s genomic DNA using two restriction enzymes, followed by the use of specific adapters, which are attached to the ends of the cleaved DNA fragments. PCR amplifications of the DNA fragments and high resolution gel electrophoresis are performed to visualize the generated fragments [17]. Among the advantages of using AFLP are the high degree of polymorphism detected and the number of markers obtained by gel analyzed [18].
The aim of this study was to estimate the current levels of genetic variability of local cultivars through the use of molecular markers (Amplified Fragment Length Polymorphism—AFLP).
2. Materials and Methods The properties of family farmers who were cultivating C. maxima were identi-fied in rural communities of Benjamin Constant and Iranduba cities, Amazonas (Table 1). The samples were fruits from plants grown by family farms and adapted to the Amazonian floodplain environment, with climatic characteristics equatorial, hot and humid. We chose to collect in two distinct micro regions in order to identify possible influences of geographic isolation and different levels of market requirements in the conservation of the genetic variability of the C. maxima.
Six plants were sampled, distributed in such a way that, on the whole, the constitution of the seeds of the six fruits contained the contribution of pollen from all the existing plants in the cultivated area. Crop lands were stratified and sampling were adopted the procedures for outcrossing species, such as the case of pumpkin landraces, to collect material in field conditions with gametic con-trol [19].
The objective of this step was to obtain frequent and continuous fresh vegeta-ble material (fresh leaves) for the DNA extraction step. The seeds of the

L. H. P. Martins et al.
DOI: 10.4236/as.2018.94035 514 Agricultural Sciences
Table 1. General identification of landraces Cucurbita maxima collected in Benjamin Constant and Iranduba, AM. 2012/2013.
City Locality Geographic Coordinates
Landraces Half-sib families
Benjamin Constant
São Luís 04˚24'14.7" 069˚55'09.8"
SL SL1, SL2, SL3, SL4,
SL5, SL7
Benjamin Constant
Novo Lugar 04˚22'48.3" 069˚57'54.1"
NL NL1, NL2, NL3, NL4, NL5, NL7
Benjamin Constant
São José 04˚20'27.5" 069˚57'15.8"
SJ SJ3, SJ4, SJ5, SJ6,
SJ8, SJ9
Benjamin Constant
Novo Paraíso 4˚19'30.48" 69°59'8.77"
NP NP1, NP2, NP3, NP4, NP5, NP6
Iranduba Ilha da Paciência 03˚19'16.32'' 60˚11'09.83''
IA IA1, IA2, IA3, IA5,
IA7, IA8
Iranduba Ilha da Paciência 03˚19'16.32'' 60˚11'09.83''
IB IB1, IB2, IB3, IB4,
IB5, IB6
fruit samples (from) were seeded in plastic cups of 300 mL containing substrate for the production of seedlings of vegetables and organic compound (3: 1), in a greenhouse of the Sector of Horticulture of the Institute of Agricultural Sciences of the Federal University of Amazonas. All half-sib families collected previously were represented in the sowing plastic cups. Sowing occurred in a staggered way, that is, each week, three half-sib families previously identified with the original collection codes were chosen and placed for sowing, with 15 replicates.
For the molecular analysis, bulk samples of fresh leaves of 15 plants/half-sibling family were collected in paper bags. There were 34 samples from the half-sib families.
The pool leaves corresponding to each family were initially stripped and cut into small pieces, weighing about 60 mg and pooled to be later macerated in a pistil crucible. Each sample for extraction represented 15 sheets of different in-dividuals from one family.
For the extraction, the protocol adapted from [16] was used [20]. The DNA pellet was resuspended in 30 or 50 μl of TE buffer solution plus RNAse and in-cubated at 37˚C for 1 hour for further storage at −20˚C.
Quantification of the DNA by the direct reading equipment, the reading me-thod in Nanodrop (Model Spectrophotometer 2000 - Thermo Scientific) was used.
2.1. Molecular Marker AFLP
The digestion reaction step consisted of the use of 350 ng of genomic DNA in a solution prepared with 5.0 μL of One Phor All buffer, 0.5 μL of BSA ‘bovine se-rum albumin’, 0.25 μL of the Mse-I enzyme and 0.5 μL of the Eco RI enzyme by adding Milli-Q water to complete a final volume of 50 μL. Reactions occurred in 3 hours at a temperature of 37˚C and final 15 minutes at 70˚C in the Esco Swift

L. H. P. Martins et al.
DOI: 10.4236/as.2018.94035 515 Agricultural Sciences
Max Pro. At adapter attachment, the digestion fragments were ligated to Mse-I and Eco
RI specific adapters, added to the T4 DNA Ligase enzyme (Thermo Scientific) and the T4 DNA Ligase buffer. Added 40 μL of digested DNA and filled with Milli-Q water to a final volume of 50 μL. The samples were incubated in a ther-mocycler (Esco Swift Max Pro) for 3 hours at 23˚C.
Pre-amplification was performed with specific primers Mse-I + A (50 ng/μL) and Eco RI + C (ng/μL). 0.5 μL of each primer (Eco RI + C rare cut and fre-quently Mse-I + A, 2.0 μL of 5 mM dNTPs (Promega), 2.0 μL 10x buffer (UniS-cience ), 0.6 μL 50 mM MgCl 2 (UniScience), 2.4 μL of Taq DNA polymerase (5 U) (Ferments), 2.0 μL of ligated DNA and 10 μL of Milli-Q water for one The PCR program [21] was developed in 26 cycles of amplification after denaturation at 94˚ for 2 minutes. The cycles were constituted of 94˚ for 1 minute, annealing at 56˚ per 1 minute and extension at 72˚ for 1 minute. The final cycle was per-formed at 72˚ for 5 minutes (protocol adapted [13]. Selection was tested from 14 of the oligonucleotide combinations and four combinations were selected be-cause of the better number of polymorphic loci and visualization quality of the bands (Table 2).
The selective amplification was done to a final solution volume of 20 μL, with 0.2 μL of Taq DNA Polymerase (5 U/μL) (Fermentas), 2.0 μL of 10x buffer (Un-iScience), 0.6 μL of MgCl 2.50 (UniScience), 0.8 μL of 5 mM dNTPs, 1.0 μL Eco-RI, 1.2 μL Mse-I, 3.0 μL of pre-amplified DNA and 11.2 μL Milli-Q water. The PCR program consisted of denaturation at 94˚C for 2 minutes; 12 cycles of 30 seconds at temperatures of 94˚C, 65˚C for 30 seconds each and 72˚C for one minute; then 23 cycles at 94˚C, 56˚C for 30 seconds and 72˚C for one minute; finally, a step at 72˚C for two minutes. The samples were stored at −20˚C until used in the next step. The samples were heated for five minutes at a temperature of 95˚C for denaturation. At each electrophoresis, a pre-run was performed for cleaning and heating the gel for one hour at 80 W of power, in 1X TEB buffer in electrophoresis system (GT Gene model, BioRad source—Power Pac HV, 3000 V) [22].
For the application of the denatured samples, 8 μL of loading buffer was ap-plied to the Polyacrylamide gel and 50 μL Ladder (50 - 800 bp) DNA marker
Table 2. Sequence of primer combinations chosen for the selective amplification of AFLP markers. Plant Genetic Improvement Laboratory. UFAM. 2015.
Primers AFLP combination
Mse-I + CTC Eco RI + AGC
Mse-I + CTC Eco RI + AGT
Mse-I + CTC Eco RI + ACA
Mse-I + CAT Eco RI + ACA

L. H. P. Martins et al.
DOI: 10.4236/as.2018.94035 516 Agricultural Sciences
from Promega and 2 μL from Loading Dye (Promega). The samples were applied on 6% polyacrylamide gel in tempered glass plates of dimensions 38 × 50 cm, submitted to electrophoresis, in a source of 3000 V, at 300 mA of intensity, 80 W of power and 2500 V of tension by a period of 4 hours.
The gels were staining with silver nitrate [23]. The steps involved solutions: fixation (acetic acid and absolute ethanol); pre-treatment (nitric acid); impreg-nation (silver nitrate); of development (sodium carbonate); and blocking (glacial acetic acid). The steps were sandwiched with distilled water.
2.2. Analysis of Amplified Fragments
Bands were visualized in the range of 100 to 750 bp of the combinations used and counted for presence (1) or absence (0), generating binary data matrices, both by combination and by all combinations. The number of polymorphic loci was calculated from those in which at least one of the samples had a difference in presence or absence of band. The percentage of polymorphic sites by combining from the total bands in each of four combinations was estimated by genetic analysis of the binary matrix.
2.3. Grouping Analysis
The matrix of similarity with the data of the general matrix of the four joint combinations was generated by the Jaccard coefficient [24] and a dendrogram was elaborated by the UPGMA algorithm (Unweighted Pair-Group Average). The Jaccard coefficient (SJ) prioritizes the samples by the presence similarity and is based on the equation:
aJa b c
S=
+ +
SJ: Jaccard coefficient a: number of coincidences of type 1-1 for each pair of accesses; b: number of dislocations of type 1-0 for each pair of accesses; c: number of disagreements of type 0-1 for each pair of accesses. The coefficient of correlation coefficient was estimated by the NTSYS-pc
software version 2.1/2000 [25]. The reliability and robustness of the dendrogram were tested by the bootstrap analysis with 1000 replications by NTSYS-pc ver-sion 2.1/2000 [25].
2.4. Correspondence Analysis
A simple correspondence analysis of the 34 families of C. maxima half-sib based on three main axes was performed on 246 discrete distribution characteristics by the NTSYS-pc version 2.1/2000 statistical package [25]. We attempted to identify the set of variables that could form the composite variables that best explained the DNA samples. Correspondence analysis is a method of sorting for categori-cal data counting data [26].

L. H. P. Martins et al.
DOI: 10.4236/as.2018.94035 517 Agricultural Sciences
3. Results and Discussion 3.1. Polymorphism of Cucurbita maxima
The most informative combinations of the 14 tested were selected because of the better response of polymorphic loci. The total loci of all four combinations was 246 and polymorphism was 81, equivalent to 34%. The highest percentage of polymorphism was detected by the combination Mse-I + CTC/Eco RI + ACA with 48% (Table 3).
Molecular studies with 40 microsatellite loci in C. pepo Rio Grande do Sul cultivated showed that there is great genetic variability landraces, distributed among different materials, although it also exists within populations. The main contributing causes are the alogamy of the species, the exchange of seeds be-tween the farmers and the cultivation of more than one variety within the same area. The study also pointed out that there is no subdivision of populations ac-cording to the collection site [27].
Other molecular studies with genetic markers have also indicated the exis-tence of variability between and within the accesses collected at the different sites investigated. For example, C. moschata collected in Colombia Department de-tected high genetic diversity in agreement with the wide morphoagronomic di-versity registered for the species. Most of the variation was related among indi-viduals within the same Department (88.76%) [28]. In the classification analysis, the 121 introductions were grouped in three groups, the first one of the Andean Region, the second formed by some introductions of the Andean Region and the Andean Coast and the third harboring most of the introductions of the Atlantic Coast [28].
3.2. Genetic Variability among Half-Sib Families Based on the AFLP Marker
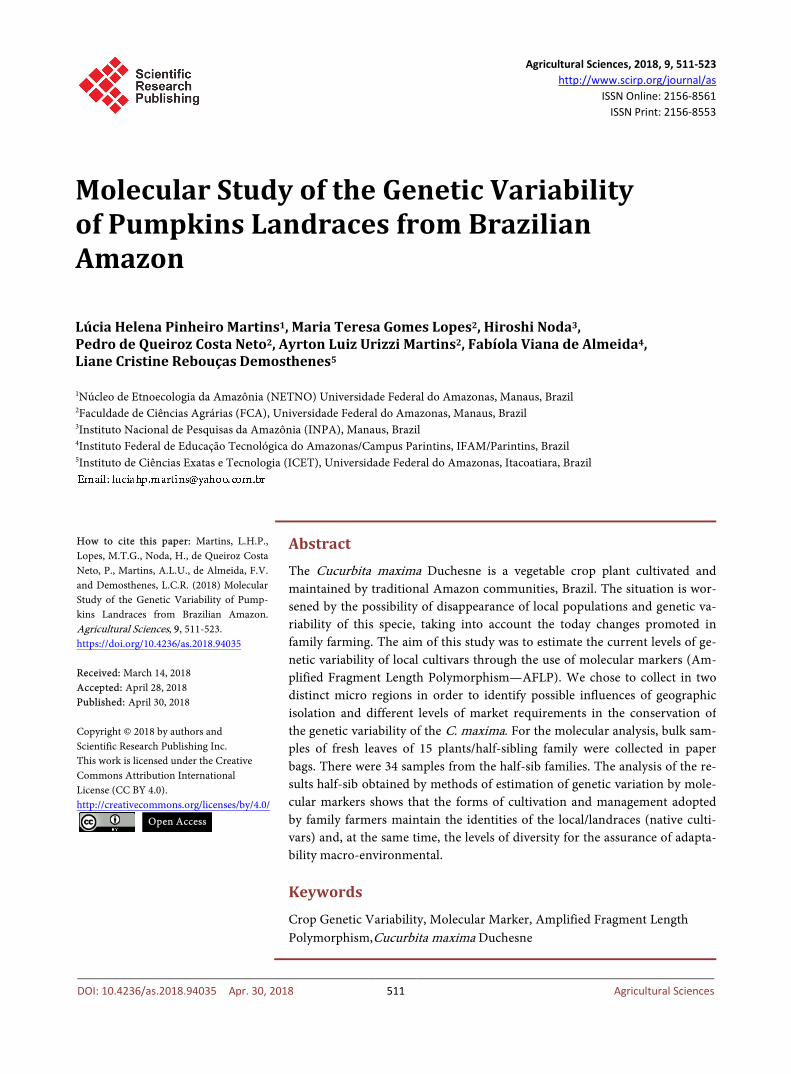
In the analysis of the generated dendrogram we can observe the formation of six groups that coincide with the local cultivars separated by the geographic dis-tances (Figure 1). The cut line was 0.92 of similarity (dashed line). The analysis of the melt-level behavior [29] was used to determine the groups number in the final partition. Table 3. Total number and polymorphic fragments by AFLP molecular markers in Cu-curbita maxima observed in four primer combinations. Laboratory of Plant Genetic Im-provement. UFAM. 2015.
Combination of AFLP primers C. maxima variability
Total number Loci
Number of polimorphic loci
Polymorphism %
Mse-I + CTC Eco RI + AGC 53 9 17
Mse-I + CTC Eco RI + AGT 78 28 36
Mse-I + CTC Eco RI + ACA 81 39 48
Mse-I + CAT Eco RI + ACA 34 5 15
L. H. P. Martins et al.
DOI: 10.4236/as.2018.94035 518 Agricultural Sciences
Figure 1. Dendrogram of 34 samples of half-sib families from Cucurbita. maxima formed by the coefficient of similarity of Jac-card, by the algorithm UPGMA. Cophenetic correlation (0.8445). Manaus, 2015.
Group I brings together all the families of half-sib of the local variety Iranduba
A (IA), originating in the Lower Solimões River. Group II is formed by five fam-ilies of half-sib of the local variety Novo Lugar (NL), located in Ilha do Aramaçá, Benjamin Constant, Upper Solimões River.
Group III gathers all the families of half-sib local variety São Luís (SL), locality located to the left margin of the channel of the Solimões-Amazonas River (Up-per Solimões River). This group also houses a family of half-sib (NL7) of the lo-cal NL variety, separated by the geographical distance of 5.7 km in a straight line. The fourth group is home to three half-sib families (SJ3, SJ4 and SJ5) from the local variety of São José (SJ), all from Ilha do Aramaçá. In group V all half-sib families of the local variety Novo Paraíso (NP) are reunited, in addition to SJ8 and SJ9. Novo Paraíso is located on Bom Intento Island, Benjamin Constant, and São José on a nearby island, 3.9 km in a straight line. Group VI houses all the families of half-sib of the local variety Iranduba B (IB) located in the Ilha da Paciência, Iranduba (Lower Solimões River). We can infer that in the molecular study, the largest distance (5.7 km) between different local cultivars occurred in Group III, which brought together the families of half-sib of São Luís and only one of Novo Lugar, different from the morphological characteristics that grouped geographically distant local cultivars. This result also contributes to confirm the existence of morphoagronomic and genetic variability among and within local cultivars of C. maxima landraces cultivated by family farms.
The groups were formed according to the geographically separated local cul-tivars. Even those different varieties that participated in the groups of another

L. H. P. Martins et al.
DOI: 10.4236/as.2018.94035 519 Agricultural Sciences

L. H. P. Martins et al.
DOI: 10.4236/as.2018.94035 520 Agricultural Sciences
Figure 2. Dispersion of 34 families of Cucurbita maxima half-sib families, based on the main axes (1 and 2) of the simple corres-pondence analysis on 246 discrete distribution characteristics (polymorphism in 81). Circled in blue are the families of half-sib of Iranduba (Lower Solimões River) and in red, those of Benjamin Constant (Upper Solimões River). Amazonas, 2015.
origin, are located nearby Benjamin Constant. This can be explained by the fact that the marker technique performs structural characterization, that is, the AFLP has a large genome coverage, however the observed polymorphism is related to the genetic structure. Different from the morphoagronomic techniques that they identify by the phenotypic expression.
Genetic resources are not only linked to genotypes, but everything that is linked to them, such as information, environment, socioeconomic and ecological [30]. It includes the set of environmental factors (pests, weeds) and cultural fac-tors (associated traditional knowledge).
Molecular markers Random Amplified Polymorphic DNA (RAPD) [31], us-ing Amplified Fragment Length Polymorphism (AFLP) [32] and using microsa-tellite markers contributed to describe and confirm the genetic variability of Cucurbita species, especially C. moschata and C. maxima for the conservation in agricultural crops of varieties by farmers [33].
The genetic variability of the half-sib families was detected by the similarity matrix generated by the Jaccard coefficient, with values in the range of 0.7786 and 1.00 (Table 4). The greatest similarity between half-sib families occurred with the comparison between samples NL1 and NL2, NL1 and NL3, NL2 and NL3, SL2 and SL3. The smallest similarities were observed among the NP6 and IB3 families (0.7786).
The calculated values for the class interval of the similarity parameters pre-sented mean and variance of 0.87 and 0.002, respectively. It was found that 70.4% of the sample values are in the range of 0.8 to 0.89 and all values were grouped above 0.7, indicating the number of occurrences and the percentage of distances genetics organized by the interval classes.

L. H. P. Martins et al.
DOI: 10.4236/as.2018.94035 521 Agricultural Sciences
The distribution of the different samples of half-sib families by the main axes of the correspondence analysis (Figure 2). Two groups according to geographic location were formed: the first one formed by the half-sib families of the local cultivars of Upper Solimões River (NL, NP, SJ and SL) and the second group bringing together the families of half-sib families IA and IB, geographically lo-cated in the municipality of Iranduba.
This result shows that the methodology used was able to separate the variabil-ity between the local cultivars (Upper Solimões versus Lower Solimões Rivers).
4. Conclusion
The analysis of the results obtained by methods of estimation of genetic varia-tion by molecular markers shows that the forms of cultivation and management adopted by family farmers maintain the identities of the local/native cultivars and, at the same time, the levels of diversity for the assurance of adaptability macro-environmental.
References [1] Fonseca, M.A., Queiroz, M.A., Lopes, J.F., Assis, J.G.A., Romão, R.L., Ramos, S.R.R.,
Carmo, C.A.S., Moura, M.C.L., Dias, R.C.S., Silveira, L.M., Barbieri, R.L., Silva, D.J.H. and Noronha, S. (2015) Geographical Distribution and Conservation of Cucurbita in Brazil. Magistra, Cruz das Almas, BA, 27, 432-442.
[2] Esquinas-Alcazar, J.T. and Gulick, P.J. (1983) Genetic Resources of Cucurbitaceae. IPBGR, Rome, 101.
[3] Saade, R.L. and Hernández, S.M. (1992) La Agricultura em Mesoamerica: Cucurbitas. In: Hernández Bermejo, J.E. and Léon, J., Eds., Cultivos Marginados. Outra perspectiva de 1492. Colección FAO: Producción y protección vegetal, No. 26, Roma.
[4] Heiden, G.; Barbieri, R. L.; Neitzke, R. S. (2007) Key for the identification of species of pumpkins (Cucurbita, Cucurbitaceae) grown in Brazil. (Documents, 197). Em-brapa Temperate Weather, Pelotas, 31.
[5] Canul Ku, J. Vallejo, P.R., González, F.C. and Servia, J.L.C. (2005) Morphological Diversity of Squash Grown in the Center-East of Yucatan, Mexico. Revista Fitotec-nia Mexicana, 28, 339-349.
[6] Carvalho, P.G.B., de Peixoto, A.A.P. and Ferreira, M.A.J.F. (2011) Characterization of Pumpkins as to the Levels of Total Carotenoids Alpha and Betacarotene (Re-search and Development Bulletin 78). Embrapa Hortaliças, Brasilia, 20.
[7] Lima, G.K.L. (2013) Rescue and Germplasm Study of Cucurbita spp. of Rio Grande do Norte. Thesis, Mossoró.
[8] Romano, C.M., Stumpf, E.R.T., Barbieri, R.L., Bevilaqua, G.A.P. and Rodrigues, W.F. (2008) Manual Pollination in Pumpkins. Embrapa Temperate Weather (Documents, 225), Pelotas, 26.
[9] OECD, Organization for Economic Co-operation and Development, Environment, Health and Safety Publications (2012) Consensus Document on the Biology of Cu-curbita L. (Squashes, Pumpkins, Zucchinis and Gourds). Series on Harmonization of Regulatory Oversight in Biotechnology. No. 53 ENV/JM/MONO31, 77.

L. H. P. Martins et al.
DOI: 10.4236/as.2018.94035 522 Agricultural Sciences
[10] Bisognin, D.A. (2002) Origin and Evolution of Cultivated Cucurbits. Rural Science. Santa Maria, 32, 715-723. https://doi.org/10.1590/S0103-84782002000400028
[11] Pasqual, M., Rezende, R.K.S., Villa, F. and Chagas, E.A. (2008) Biotechnology Ap-plied to the Improvement of Fruit Trees. In: Bruckner, C.H., Ed., Fundamentals of Fruit Tree Breeding, UFV, Viçosa, 117-170.
[12] Faleiro, F.G. (2007) Genetic-Molecular Markers Applied to Conservation and Use of Genetic Resources. Embrapa, Cerrados, Planaltina, 102.
[13] Vos, P., Hogers, R., Bleeker, M., Reijans, M., van de Lee, M.T., Hornes, M., Frijters, A., Pot, J., Peleman, J., Kuiper, M. and Zabeau, M. (1995) AFLP: A New Technique for DNA Fingerprinting. Nucleic Acids Research, 23, 4407-4414. https://doi.org/10.1093/nar/23.21.4407
[14] Caixeta, E.T., de Oliveira, A.C.B., de Brito, G.G. and Sakiyama, N.S. (2009) Types of Markers. In: Borém, A. and Caixeta, E.T. (Eds), Molecular Markers, Folha de Viço-sa, Viçosa, 11-93.
[15] Milach, S.C. K. (1998) DNA Markers. Applications in Plant Breeding. Biotechnolo-gy Science & Development, 5, 14-17.
[16] Ferreira, M.E. and Grattapaglia, D. (1998) Introduction to the Use of Molecular Markers in Genetic Analysis. 3rd Edition, Document 20, Embrapa-Cenargen, Brasília, 220 p.
[17] Brammer, S.P. (2000) Molecular Markers: Basic Principles and Use in Plant Breed-ing Programs. http://www.cnpt.embrapa.br/biblio/p_do03.htm
[18] Milach, S.C.K. (1999) Molecular Markers on Genetic Resources and Plant Breeding. In: Queiroz, M.A., Goedert, C.O. and Ramos, S.R.R., Eds., Genetic Resources and Plant Breeding for the Brazilian Northeast, Embrapa Semiárido, Brasília, DF, Em-brapa Genetic Resources and Biotechnology, Petrolina. http://www.cpatsa.embrapa.br:8080/catalogo/livrorg/index.html
[19] Vencovsky, R. (1987) Effective Population Size in the Collection and Preservation of Germplasm Outcrossing Species. IPEF, 35, 79-84.
[20] Martins, L.H.P. (2015) Genetic Variability and Conservation of Cucurbita maxima Duchesne by Family Agriculture in the Western Central Amazon. Thesis, Federal University of Amazonas, 151 p.
[21] Couch, J.A. and Fritz, P.J. (1990) Isolation of DNA from Plants High in Polyphe-nolics. Plant Molecular Biology Reporter, 8, 8-12. https://doi.org/10.1007/BF02668875
[22] Lopes, R., Lopes, M.T.G., Carneiro, M.S., Matta, F.P., Camargo, L.E.A. and Vieira, M.L.C. (2006) AFLP Linkage Analysis and Mapping of Resistance Genes to Xanthomonas axonopodis pv. passiflorae n Yellow Passion Fruit. Genome, 49, 17-29. https://doi.org/10.1139/g05-081
[23] Creste, S., Tulmann Neto, A. and Figueira, A. (2001) Detection of Single Sequence Repeat Polymorphisms in Denaturing Polyacrylamide Sequencing Gels by Silver Staining. Plant Molecular Biology Reporter, 19, 299-306. https://doi.org/10.1007/BF02772828
[24] Cruz, C.D. (2008) GENES Program: Genetic Diversity. Viçosa. Ed. UFV. 278 p.
[25] Rohlf, F.J. (2000) NTSYS-pc, Version 2.1. Numerical Taxonomy and Multivariate Analysis System. Exeter Software, New York.
[26] Hammer, Harper, D.A.T. and Ryan, P.D. (2012) PAST: Paleontological Statistics Software Package for Education and Data Analysis. Electronic Paleontology, 4, 187 .

L. H. P. Martins et al.
DOI: 10.4236/as.2018.94035 523 Agricultural Sciences
[27] Priori, D., Barbieri, R.L., Castro, C.M., Oliveira, A.C., Vilella, J.C.B. and Mistura, C.C. (2012) Molecular Characterization of Creole Varieties of Pumpkins with Mi-crosatellite Markers. Brazilian Horticulture, 30, 499-506. https://doi.org/10.1590/S0102-05362012000300024
[28] Restrepo, J.A. and Vallejo, C.F.A. (2008) Molecular Characterization of Colombian Introductions of Zapallo Cucurbita moschata. Acta Agronómica (Palmira), 57, 9-17.
[29] Mingoti, S.A. (2005) Data Analysis through Multivariate Statistical Methods: An Applied Approach. Belo Horizonte. UFMG.
[30] Clement, C.R., Rizzi Rocha, S.F., Cole, D.M. and Vivan, J.L. (2007) Conservation on Farm. In: Nass, L., Ed., Plant Genetic Resources, Embrapa Genetic Resources and Biotechnology, Brasília, 511-544.
[31] Gwanama, C., Labuschagne, M.T. and Botha, A.M. (2000) Analysis of Genetic Vari-ation in Cucurbita moschata by Random Amplified Polymorphic DNA (RAPD) Markers. Euphytica, 113, 19-24. https://doi.org/10.1023/A:1003936019095
[32] Ferriol, M.B.P., Cordova, P.F. and Nuez, F. (2004) Molecular Diversity of a Germplasm Collection of Squash (Cucurbita moschata) Determined by SRAP and AFLP Markers. Crop Science, 44, 654-663.
[33] Watcharawongpaiboon, N. and Chunwongse, J. (2007) Development of Microsatel-lite Markers from an Enriched Genomic Library of Pumpkin (Cucurbita moschata L.). Songklanakarin Journal of Science and Technology, 29, 1217-1223.