molten salt assisted self-assembly (masa): … · 2013-07-16 · molten salt assisted self-assembly...
TRANSCRIPT

MOLTEN SALT ASSISTED SELF-ASSEMBLY (MASA):
SYNTHESIS OF MESOPOROUS SILICA-ZnO AND
MESOPOROUS CdO THIN FILMS
A DISSERTATION SUBMITTED TO
THE DEPARTMENT OF CHEMISTRY
AND
THE GRADUATE SCHOOL OF ENGINEERING AND SCIENCE
OF
BILKENT UNIVERSITY
IN PARTIAL FULFILLMENT OF THE REQUIREMENTS
FOR THE DEGREE OF
MASTER OF SCIENCE
By
CÜNEYT KARAKAYA
January 2012

i
I certify that I have read this thesis and have found that it is fully adequate, in scope and
in quality, as a thesis for the degree of Master of Science.
Prof. Dr. Ömer Dağ
Supervisor
I certify that I have read this thesis and have found that it is fully adequate, in scope and
in quality, as a thesis for the degree of Master of Science.
Prof. Dr. Saim Özkar
Examining Committee Member
I certify that I have read this thesis and have found that it is fully adequate, in scope and
in quality, as a thesis for the degree of Master of Science.
Assoc. Prof. Dr. Margarita Kantcheva
Examining Committee Member
ii
I certify that I have read this thesis and have found that it is fully adequate, in scope and
in quality, as a thesis for the degree of Master of Science.
Assist. Prof. Dr. Erman Bengü
Examining Committee Member
I certify that I have read this thesis and have found that it is fully adequate, in scope and
in quality, as a thesis for the degree of Master of Science.
Assist. Prof. Dr. Emrah Özensoy
Examining Committee Member
Approval of the Graduate School of Engineering and Science
Prof. Dr. Levent Onural
Director of the Institute

iii
ABSTRACT
MOLTEN SALT ASSISTED SELF-ASSEMBLY (MASA):
SYNTHESIS OF MESOPOROUS SILICA-ZnO AND MESOPOROUS
SILICA-CdO THIN FILMS
CÜNEYT KARAKAYA
M.S. in Chemistry
Supervisor: Prof. Dr. Ömer Dağ
January 2012
A series of mesostructured salt-silica-two surfactants (salt is [Zn(H2O)6](NO3)2,
ZnX or [Cd(H2O)4](NO3)2, CdYand surfactants are cetyltrimethylammonium bromide
(CTAB) and 10-lauryl ether, C12H25(OCH2CH2)10OH, C12EO10) thin films were
synthesized by changing the Zn(II) or Cd(II)/SiO2 mole ratios. The films were prepared
through spin coating of a clear solution of all the ingredients (salt, CTAB, C12E10, silica

iv
source (tetramethyl orthosilicate,TMOS, and water) and denoted as meso-silica-ZnX-n
and meso-silica-CdY-n, where n is Zn(II) or Cd(II)/SiO2 mole ratios. The synthesis
conditions were optimized by using the meso-silica-ZnX-1.14 and meso-silica-CdY-1.14
films and XRD, FT-IR spectroscopy, POM and SEM techniques. The stability of the
films, especially in the high salt concentrations, was achieved above the melting point of
salts. Slow calcination of the films, starting from the melting point of the salt to 450 oC
has produced the mesoporous silica-metal oxide (ZnO and CdO) thin films, and denoted
as meso-silica-ZnO-n and meso-silica-CdO-n, with n of 0.29, 0.57, 0.86, 1.14, and 1.43.
The calcination process was monitored by measuring the FT-IR spectra and XRD
patterns at different temperatures. Structural properties of the mesoporous films have
been investigated using FT-IR spectroscopy, XRD, N2 sorption measurements, UV-Vis
spectroscopy, SEM, TEM and EDS techniques. It has been found that the meso-silica-
ZnO-n and meso-silica-CdO-n films consist of nanocrystalline metal oxide nanoplates
on the silica pore walls of the mesoporous framework. The formation of nanoplates of
metal oxides was confirmed by etching the silica walls using diluted HF solution and by
reacting with H2S and H2Se gases. The etching process produced CdO nanoplates
without silica framework. The H2S and H2Se reactions with the CdO nanoplates or
meso-silica-CdO have converted them to CdS and CdSe nanoplates or meso-silica-CdS
and meso-silica-CdSe, respectively. Finally, a hypothetical surface coverage of metal
oxide nanoplates has been calculated by combining the data of N2 sorption
measurements, UV-Vis spectroscopy and TEM images and found that there is a full
coverage of CdO and partial coverage of ZnO over silica walls in the meso-silica-CdO-n
and meso-silica-ZnO-n thin films, respectively.
Keywords: Mesoporous ZnO, Mesoporous CdO, Mesoporous silica, Thin Films,
Lyotropic liquid crystals.

v
ÖZET
ERİYİK TUZ YARDIMLI KENDİLİĞİNDEN OLUŞMA (EYKO):
MEZOGÖZENEKLİ SİLİKA-ZnO VE MEZOGÖZENEKLİ SİLİKA-CdO
İNCE FİLMLERİN SENTEZİ
CÜNEYT KARAKAYA
Kimya Bölümü Yüksek Lisans Tezi
Tez Yöneticisi : Prof. Dr. Ömer Dağ
Ocak 2012
Bu çalışmada, bir seri mezoyapılı tuz-silika yüzeyaktif içeren (tuz
[Zn(H2O)6](NO3)2, ZnX veya [Cd(H2O)4](NO3)2, CdY dir ve yüzeyaktifler
setiltirimethilamonyum bromür (CTAB) ve 10-löril eter, C12H25(OCH2CH2)10OH,
C12EO10 dur) ince film Zn(II)/SiO2 veya Cd(II)/SiO2 mol oranı değiştilerek sentezlendi.
Filmler, spin kaplama yönetemi ile bütün girdileri (tuz, CTAB, C12E10, silika kaynağı
(tetrametilortosilikat,TMOS, ve su) içeren şeffaf çözeltiler kullanılarak hazırlandı ve
mezo-silika-ZnX-n ve mezo-silika-CdY-n (n Zn(II)/SiO2 ve Cd(II)/SiO2 mol oranıdır)

vi
olarak isimlendirildi. Sentez koşulları, mezo-silika-ZnX-1.14 ve mezo-silika-CdY-1.14
filmleri kullanılarak ve XRD, FT-IR, POM ve SEM teknikleri ile detaylı bir şekilde
incelenerek optimize edildi. Filmlerin kararlılığı, özellikle yüksek oranlarda, tuzların
erime sıcaklığı üstünde tutulmasıyla sağlandı. Filmlerin yavaş ve tuzun erime
noktasından 450 oC ye kadar ısıtılmaları mezogözenekli silika-metal oksit (ZnO ve CdO)
ince filmlerini üretti ve elde edilen filmler mezo-silika-ZnO-n ve mezo-silika-CdO-n
olarak adlandırıldı (n 0.29, 0.57, 0.86, 1.14, ve 1.43 olarak değiştirildi). Isıtma aşaması
FT-IR tayfları ve XRD desenleri değişik sıcaklıklarda ölçülerek takip edildi. Elde edilen
mezogözenekli filmlerin yapısal özellikleri detaylı olarak FT-IR spektroskopi, XRD, N2
sorpsiyon ölçümleri, UV-Vis spektroskopi, SEM, TEM ve EDS teknikleri ile incelendi.
Mezo-silika-ZnO-n ve mezo-silika-CdO-n filmlerinin silika duvar yüzeylerinin metal
oksit nano-plakaları ile kaplandığı saptandı. Sentez esnasında metal oksit nano-
plakaların oluşumu silika duvarların seyreltik HF çözeltisiyle aşındırılarak ve filmlerin
H2S ve H2Se gazları ile tepkimeye sokularak doğrulandı. Kimyasal aşındırma sonucu
metal oksit nano-plakalar elde edildi. Ayrıca, mezogözenekli yapıdaki bütün metal oksit
nano-plakaların H2S ve H2Se ile tepkimeleri sonucu metal sülfür ve metal selenür
dönüştürüldüğü gösterildi. Son olarak, metal oksit plakaların silika duvarlarını kaplama
yüzdesi varsayımsal olarak hesaplandı. Hesaplar sonucu, ZnO’in yüzeyin yarısını CdO
ise tüm yüzeyi kapladığı saptandı.
Anahtar Kelimeler: Mezogözenekli ZnO, Mezogözenekli CdO,
Mezogözenekli silika, İnce Filmler, Liyotropik Sıvı Kristaller

vii
ACKNOWLEDGEMENTS
I would like to express my gratitude to…
……My supervisor, Prof. Dr. Ömer Dağ for his guidance, encouragement, patience and
supervision throughout my studies.
…….Yurdanur Türker and Cemal Albayrak for his contributions and scientific
discussions.
…….Special thanks to my friends, Hacı, Çebi. Zafer, Fatih Abi, Emre, Hakan, Çebi,
Sefa, Murat,Koray, Atıf and Tuğrul for his memorable helps and supports
….dear Professors in my thesis committee, Prof. Margarita Kantcheva, Prof. Erman
Bengü, Prof. Saim Özkar and Prof. Emrah Özensoy
Finally, I am sincerely thankful to my family: my parents, Nuran Karakaya and
Kamil Karakaya and my brother Furkan Karakaya for their continuous supports
throughout during my life and to Şeyma Öztürk for her love and everlasting supports in
my life.

viii
Table of Contents 1 INTRODUCTION ...................................................................................................... 1
1.1 The Inception of Mesoporous Materials ............................................................. 1
1.1.1 Mesoporous Silica Powders ......................................................................... 2
1.2 True Liquid Crystal Templating (TLCT) Method ............................................... 4
1.3 Evaporation Induced Self Assembly (EISA) Method ......................................... 5
1.4 Mesoporous Transition Metal Oxides ................................................................. 7
1.5 The EISA Process for Synthesis of Mesoporous Metal Oxides .......................... 8
1.6 Nano-casting of Metal Oxides ........................................................................... 11
1.7 Solid State Grinding Method ............................................................................. 16
1.8 Lyotropic Liquid Crystalline (LLC) Mesophases of Transition Metal Salts .... 18
1.9 ZnO Nanoparticles and Mesoporous ZnO ........................................................ 20
2 EXPERIMENTAL .................................................................................................... 22
2.1 MATERIALS .................................................................................................... 22
2.2 SYNTHESIS ..................................................................................................... 22
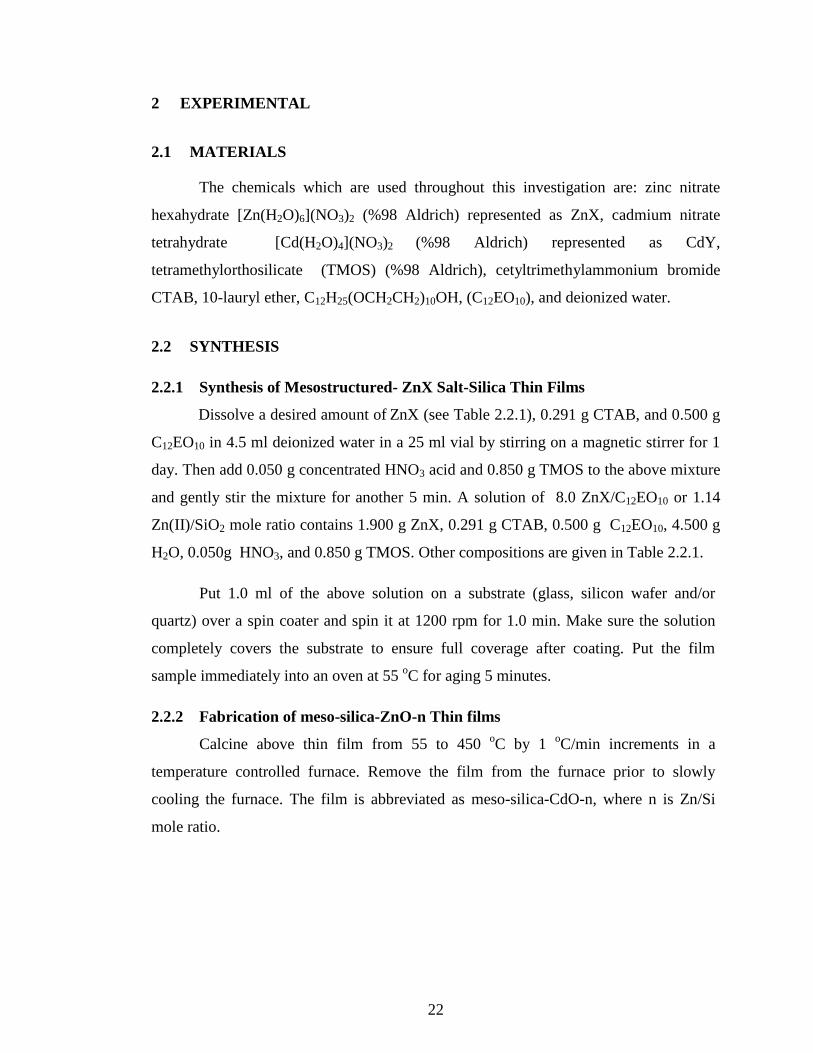
2.2.1 Synthesis of Mesostructured- ZnX Salt-Silica Thin Films ........................ 22
2.2.2 Fabrication of meso-silica-ZnO-n Thin films ............................................ 22
2.2.3 Synthesis of meso-silica-CdO-n Thin Films .............................................. 24
2.2.4 Fabrication of meso-silica-CdO-n Thin films ............................................ 24
2.2.5 Etching of meso-silica-CdO-n Thin Films ................................................. 24
2.2.6 Synthesis of meso-silica-CdS-n Thin Films............................................... 26
2.2.7 Synthesis of meso-silica-CdSe-n Thin Films ............................................. 26
2.3 CHARACTERIZATION .................................................................................. 26
2.3.1 X-Ray Diffraction (XRD) patterns ............................................................ 26
2.3.2 FT-IR Spectroscopy ................................................................................... 27
2.3.3 UV-Vis Absorption Spectroscopy ............................................................. 27
2.3.4 Polarized Electron Microscopy (POM) Images ......................................... 27
2.3.5 The N2 (77.4 K) Sorption Measurements................................................... 27
2.3.6 Transmission Electron Microscopy (TEM) Images ................................... 27
2.3.7 Scanning Electron Microscopy (SEM) ...................................................... 28
3 RESULT AND DISCUSSION ................................................................................. 29

ix
3.1 Optimization of the meso-silica-ZnX-n Films .................................................. 29
3.2 Optimization of Synthesis Conditions for the meso-silica-CdY-n Films ......... 42
3.3 Synthesis of the meso-silica-ZnO-n and meso-silica-CdO-n Thin Films ......... 45
4 CONCLUSION ........................................................................................................ 67
5 FUTURE WORK...................................................................................................... 69
5.1 The Preparation of meso-titanina-ZnX-n Thin Films ....................................... 69
5.2 The Synthesis of meso-titania-Zn2TiO4 Thin Films .......................................... 70
6 REFERENCES ......................................................................................................... 73
x
LIST OF FIGURES
Figure 1.1.1 Schematic representation of M41S family in different structure 1)
bicontinuous cubic, 2) 2D hexagonal, and 3) Lamellar. . ............................... 3
Figure 1.2.1: The illustration of true liquid crystalline templating method. The
formation of liquid crystalline phase of surfactant (left), inclusion of
inorganic precursor to liquid crystal phase (middle), and polymerization
of inorganic precursor to solid matrix and removal of surfactant (right). ...... 4
Figure 1.3.1: The phase diagram of C12EO8 and water (27) .............................................. 6
Figure 1.3.2: The schematic representation of Evoparation Induced Self Assemly
(EISA) process.(33) ........................................................................................ 7
Figure 1.5.1: The schematic representation of EISA for the synthesis of Mesoporous
metal oxides; a) the EISA process and b) the stabilization of metal oxide
precursor. ...................................................................................................... 10
Figure 1.6.1: The schematic representation of two different paths of nano-casting for
the synthesis of mesoporous metal oxides .................................................... 13
Figure 1.7.1: The schematic representation of solid state grinding method .................... 17
Figure 1.8.1: a) A POM image of [Cd(H2O)4](NO3)2 in C12H25(CH2CH2O)10OH and
b) a schematic representation of a hexagonal LLC phase, the small circles
represent metal complexes and NO3− ions.(89) ............................................ 19
Figure 1.8.2: The phase diagram of [Zn(H2O)6](NO3)2 and C12EO10 system.(90) .......... 20
Figure 3.1.1: The representative preparation of the meso-silica-ZnX-n film by spin
coating. .......................................................................................................... 30
Figure 3.1.2: The POM image of an as-prepared meso-silica-ZnX-1.14 thin film. ........ 31
Figure 3.1.3 a) Small-angle XRD patterns of the as prepared meso-silica-ZnX-n thin
films where n is shown on the patterns(1). b) The schematic
representation of d(100) planes in 2D hexagonal mesostructure..................... 32
Figure 3.1.4: Small-angle (top) and wide angle (bottom) XRD patterns of the meso-
silica-ZnX-1.14 thin films with different aging times where time is shown
on the patterns ............................................................................................... 33
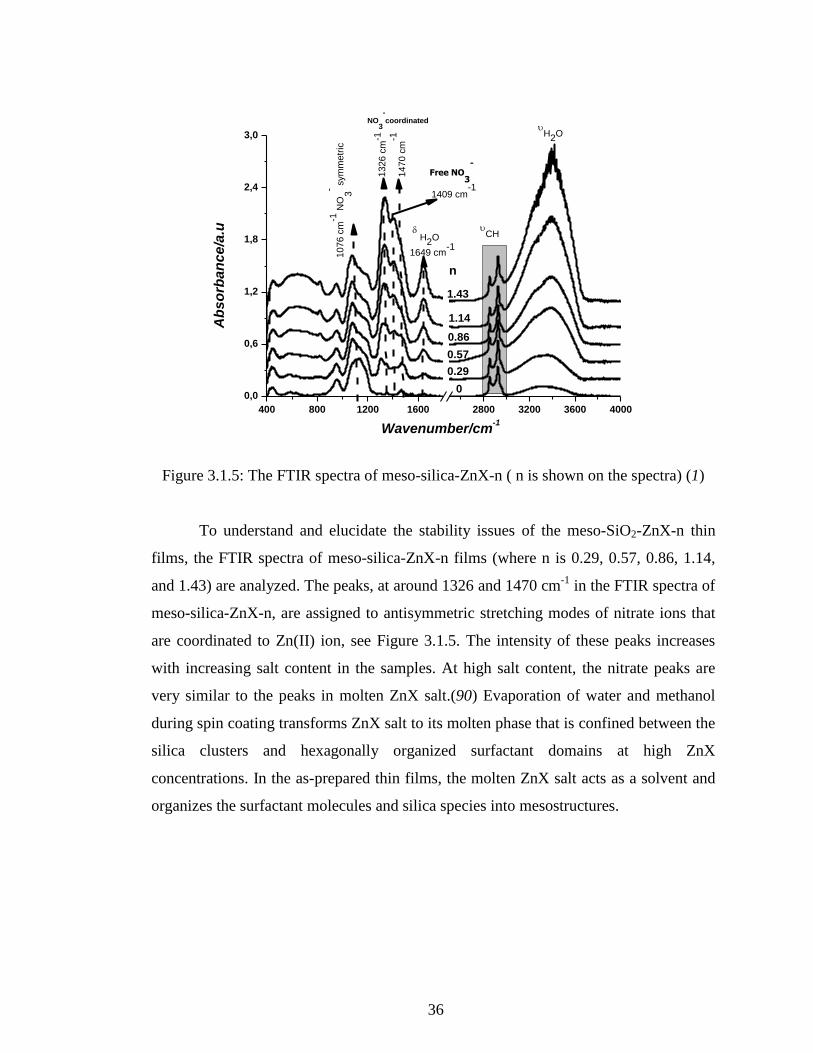
Figure 3.1.5: The FTIR spectra of meso-silica-ZnX-n ( n is shown on the spectra) (1) .. 36

xi
Figure 3.1.6: The small-angle and wide-angle XRD patterns of the as prepared meso-
silica-ZnX-n thin film aged for 5 minutes at 55 0C and in time at room
temperature where time is shown on the patterns ......................................... 37
Figure 3.1.7: The small-angle and high angle XRD patterns of the as prepared meso-
silica-ZnX-n thin film aged for 2 hours at 55 0C in time where time is
shown on the patterns ................................................................................... 38
Figure 3.1.8: The FTIR spectra of as-prepared meso-silica-ZnX-1.14 at different
temperature with time (Temperatures is shown on the spectra) ................... 39
Figure 3.1.9: The small-angle and high angle (inset) XRD patterns of the as prepared
meso-silica-ZnX-n thin film aged for 1 day at 55 0C in time where time is
shown on the patterns ................................................................................... 41
Figure 3.2.1: The small-angle diffraction patterns of as prepared meso-silica-CdY-n
(n is 0.57, 0.86, and 1.14 and n is shown on the spectra ............................... 42
Figure 3.2.2: The POM image (a) and the high-angle diffraction patterns (b) of meso-
silica-CdY-1.14, 5 minutes after preparation at RT...................................... 43
Figure 3.2.3: The FTIR spectra of meso-silica-CdY-n ( n is shown on the spectra) (1) . 44
Figure 3.3.1: The small-angle XRD patterns of the meso-silica-ZnX-1.14 thin film
during calcination where temperature is shown on the patterns and the
high angle XRD patterns of the meso-silica-ZnO-1.14 (inset) ..................... 45
Figure 3.3.2: The small-angle XRD patterns of the meso-silica-CdO-1.14 thin film
and the high angle XRD patterns of the meso-silica-CdO-1.14 (inset) ........ 46
Figure 3.3.3: The N2 sorption isortherms of the meso-silica-ZnO-n (up) and the meso-
silica-CdO-n (down) samples where n values are shown on each plot(1) .... 47
Figure 3.3.4: The pore size distribution of the mesoporous-silica-ZnO-n (a) and
mesoporous-silica-CdO-n (b)where n values are shown on each plot(1) ..... 49
Figure 3.3.5: The meso-silica-ZnX-1.14 during calcination at different temperature
(temperature is shown on the spectra) (1) ..................................................... 51
Figure 3.3.6: FTIR spectra of (a) meso-silica-ZnO-n, (b) meso-silica-CdO-n (n is
shown on the left on each spectrum) (1) ....................................................... 52
Figure 3.3.7: The XRD pattern of meso-silica-ZnO-0.86 at (a) 450oC, (b) 550
oC, and
(c) 650oC. The common diffraction lines of ZnO are marked on the
patterns(1) ..................................................................................................... 54
Figure 3.3.8: (a) UV-Vis absorption spectra of meso-silica-ZnO-n (1) (b) of meso-
silica-CdO-n (n is shown on the spectra) ...................................................... 55
xii
Figure 3.3.9: Direct gap fitting of UV-Vis absorption spectra of (a) meso-silica-ZnO-
n (n is the ZnO/SiO2 mole ratio, inset is a table of composition (ZnO/SiO2
mole ratio) and band-gap values (eV)) and (b) meso-silica-CdO-n (n is
the CdO/SiO2 mole ratio, inset is a table of composition (CdO/SiO2 mole
ratio) and band-gap values (eV)). (1) ............................................................ 56
Figure 3.3.10: The plots of the thickness of ZnO and CdO in the meso-silica-MO-n
versus n(1)..................................................................................................... 57
Figure 3.3.11: The SEM images of meso-silica-ZnO-1.14 (a, b), TEM images of
meso-silica-ZnO-n, n is (c) 0.86, (d)1.14, and (e) 0.57 (inset is the yellow
line showing the spacings between the lines), and (f) FFT of a crystalline
domain(1). ..................................................................................................... 58
Figure 3.3.12:The TEM images of the meso-silica-CdO-n, n is (a, b) 0.57, (c) 0.86
and (d) 1.14.(e) HRTEM image of the meso-silica-CdO-0.86 and the FT
(f) and inverse FFT (g) of the marked region of (e). (1) .............................. 60
Figure 3.3.13: The meso-silica-CdO-0.86 film upon HF etching; (a) TEM image of
(b) FFT of a large area, (c) SAED pattern, (d) magnified TEM image. (1) . 62
Figure 3.3.14 The FTIR spectra of (a) (I) pure meso-SiO2 and before (II) and after
H2Se reaction of meso-silica-CdO-0.86, (b) before (I) and after (II) H2S
reaction of meso-silica-CdO-0.86, The EDS spectra of (c) meso-silica-
CdS-0.86 and (d) meso-silica-CdSe-0.86 thin films. (1) .............................. 64
Figure 5.1.1 small-angle XRD pattern of as-prepared meso-titania-ZnX-0.86 ............... 69
Figure 5.2.1 N2 sorption isotherms of meso-titania-Zn2TiO4 with a Zn/Ti mole ratio
of (I) 0.29, (II) 0.57, and (III) 0.89. .............................................................. 70
Figure 5.2.2 . The wide angle XRD pattern of meso-titania-Zn2TiO4-0.86 powders
heated at different temperature (the temeperature are shown in the graph.) 71

xiii
TABLE OF CONTENT
Table 1.6-1: The summary of some mesoporous metal oxides via nano-casting ............ 11
Table 1.6-2: The summary of some transition metal nitrates and their volume contraction
.......................................................................................................................................... 15
Table 2.2-1: The amounts of chemicals used in the preparation of meso-silica-ZnO-n .. 23
Table 2.2-2: The amounts of chemicals used in the preparation of meso-silica-CdO-n .. 25
Table 3.3-1: Parameter for surface coverage calculated from measured data. ................ 65

1
1 INTRODUCTION
In the last few decades, chemists, material scientists and engineers have focused
on developing new and functional inorganic materials for various applications. The
motivation behind these studies is that most chemical reactions and charge transfer
processes occur on the surface of the solid materials. The nanoscale materials are high
surface area materials. One synthesis approach to obtain high surface area materials is
the synthesis of porous materials that can be classified according to their pore size:
microporous (≤ 2 nm), mesoporous (2-50 nm) and macroporous materials (≥50 nm) (2).
The most known examples of microporous materials are zeolites that have
crystalline framework consisting of SiO4 and AlO4-
tetrahedral units, called
aluminosilicates. (3) The tetrahedral arrangement of building units provides uniform and
regular cages with small sized channels connecting each other. The cages generally have
diameter of less than 14.2 Å and high surface area that makes them very important in
many applications, such as chemical drying, shape selective separation,(4) shape
selective heterogeneous catalysis,(5) and selective ion exchanger.(6) Despite usefulness
in all of these applications, the microporosity in zeolites can have some drawbacks.(7)
For example, the pores of zeolites are not accessible for the reactions if the reactants and
products are larger than these pores. In addition, the pores of zeolites can be occluded by
the products and this adversely affects the conversion efficiency of zeolitic catalysts.
Therefore, in order to eliminate these kinds of drawbacks, materials having larger pores
than traditional zeolites are needed.
1.1 The Inception of Mesoporous Materials
Mesoporous materials have pore size distributions between 2 nm and 50 nm that
are suitable for attaining high surface area and eliminating the drawbacks of
microporous materials. Silica is a good candidate as a framework for mesoporous
materials due to its well-known chemistry, chemical stability, ability to be functionalized
and biocompatibility. The first example of mesoporous silica materials were
demonstrated by Japanese researchers in 1990.(8) Alkyltrimethylammonium–kanemite

2
complexes form three dimensional silica framework that resists to calcination process to
remove the organic species, leading to mesoporous silica. Since the discovery of M41S
family (MCM-41, MCM-48, and MCM-50)(9) that are synthesized using surfactants as a
template, the templated siliceous periodic mesoporous materials have been extensively
studied. Scientists had carried out comprehensive research to control the pore size, pore
geometry, morphology and functionalization of pore walls of mesoporous silica
powders. On the other hand, because of the limitations of use of mesoporous powders in
many applications, many new synthesis protocols have been introduced to the literature
to make mesoporous materials on a desired substrate as thin films.
1.1.1 Mesoporous Silica Powders
The general route to synthesize surfactant templated mesoporous silica powders
is based on self-assembly of surfactant, above its critical micelle concentration (CMC),
and silica precursors in an acidic or basic aqueous media. The type of surfactants
(cationic, anionic or neutral), surfactant chain length and concentration, solvent and type
of silica precursor are important in the control of morphology, pore size, surface area,
pore volume and wall thickness of the mesoporous materials.
The first examples of mesoporous silica, known as M41S family were reported
by Mobil scientists in 1992.(9) In the M41S family, the initial composition of charged
cationic surfactant (cetyltrimetyl ammonium bromide (CTAB)) and
tetraethylorthoslicate (TEOS) in optimized pH were altered in order to determine the
structure of the final material such as hexagonal MCM-41, cubic MCM-48, lamellar
MCM-50 as indicated in Figure 1.1.1.(10) Among the M41S family, the most popular
one is the MCM-41 with a 2-D hexagonal structure with cylindrical 2-D pores through
the particles, and belongs to p6mm space group.(11) The pore size distribution is in the
range of 4 to 6 nm with about 1 nm wall thickness leading to higher than 1000 m2g
-1
surface area.

3
Figure 1.1.1 Schematic representation of M41S family with different structures 1)
bicontinuous cubic, 2) 2D hexagonal, and 3) Lamellar. .
Other types of mesoporous ordered or disordered silica with different
morphologies were further developed by changing surfactant type. SBA-n series were
prepared by using cationic charged surfactant or nonionic surfactants in acidic
media.(12-15) The SBA-15, which is the most important among the SBA-n family, has
2-D hexagonal arrangement of pores, prepared using a triblock copolymer
(EO20PO70EO20, P123).(16),(17) The pore size of SBA-15 is larger than that of MCM-
41. In addition, the wall thickness is so thick (around 20 nm) that it provides extra
thermal stability. Other members of SBA-n family, SBA-1 and SBA-6 have cubic,
mesoporosity synthesized by using charged surfactants under acidic or basic
conditions.(18, 19)
1 2
3

4
1.2 True Liquid Crystal Templating (TLCT) Method
The mesoporous silica particles, like MCM-41 and SBA-15 are synthesized at
surfactant concentrations above CMC. However, silica monolith with an ordered pore
structure could not be synthesized in dilute conditions. Attard and coworkers introduced,
for the first time, a novel method that uses liquid crystalline region of a surfactant and a
silica precursor for the synthesis of silica monoliths.(20) They utilized the liquid
crystalline phase of nonionic, oligo(ethylene oxide) surfactant of
C16H33(OCH2CH2)8OH, (represented as C16EO8) in the presence of a silica precursor.
The hydrolyzed silica precursor (tetramethylorthosilicate, TMOS) by acid was
impregnated into liquid crystalline phase. After polymerization of hydrolyzed silica
precursor and removal of surfactant, a crack-free mesoporous silica monolith with a 2D
hexagonal pore structure can be obtained: that is a negative copy of liquid crystalline
phase. This method is known as true liquid crystal templating method (TLCT) and is
illustrated in the Figure 1.2.1.
Mesoporous silica monoliths with various structures can be obtained via TLCT
by altering the liquid crystalline phase with different surfactants, compositions and
additives.(21, 22) However, this method always produces thicker films or monoliths.
H2O Silica Silica
Figure 1.2.1: The illustration of true liquid crystalline templating method. The
formation of liquid crystalline phase of surfactant (left), inclusion of inorganic
precursor to liquid crystal phase (middle), and polymerization of inorganic precursor
to solid matrix and removal of surfactant (right).

5
Therefore a new approach is necessary to investigate the thin film technologies of
mesoporous materials. There are many publications on the synthesis of mesoporous
silica thin films. (23),(24) The most attractive and widely investigated method is the
evaporation induced self-assembly (EISA) that is also applicable to other mesostructured
metal oxides.(25)
1.3 Evaporation Induced Self Assembly (EISA) Method
In order to overcome the drawbacks of TLCT method, as mentioned above,
Brinker and coworkers have introduced, for the first time, the EISA method providing
rapid formation of self-assembly of surfactant and inorganic moiety with a prefect,
oriented replica of liquid crystal template.(25) The self-assembly of surfactant and
inorganic moiety occurs at the same time and this provides a homogenous distribution of
surfactant and inorganic precursors.
A typical phase diagram of a CnEOm-H2O is showed in Figure 1.3.1. Notice that
the surfactant molecules at low concentration form homogenous solution in an aqueous
media. Above the CMC, they start to aggregate and to create micelles by the help of
attractive (hydrophobic) and repulsive (hydrophilic) domains of surfactant and water.
Furthermore, at higher concentration of surfactant and adequate temperature, the liquid
crystalline phase with different structures can be formed according to surfactant
percentage and temperature, such as cubic, hexagonal and lamellar. (26)

6
Figure 1.3.1: The phase diagram of C12EO8 and water: bicontinuous cubic
(V1), normal hexagonal (H1), micelle cubic (I), micelle (L1). (27)
The assembly process starts in a homogenous solution of surfactant and
inorganic precursor with large amount of easily volatile solvent having low viscosity.
Generally, dip coating of this solution over a substrate produces monoliths (28, 29) or
films.(30) The substrate, dipped into above solution is generally pulled upwards with
constant rate; the evaporation of volatile solvent starts in the upper parts of
substrate.(31) After evaporation of the solvent, a homogenous liquid crystalline phase
starts forming on the surface of the substrate with the concentration of surfactant over
time, as illustrated in Figure 1.3.2. The inorganic precursor in the LLC mesophase
polymerizes and eventually solidifies the film into an ordered organic-inorganic
mesostructures, in the aging step. The mesoorder of this liquid crystalline phase depends

7
on the dip coating rate and initial concentration of surfactant and inorganic
precursor.(25) The surfactant molecules can be removed from the structure by either
calcination or washing with a proper solvent. Moreover, the EISA process can also be
operated by spin and spray coating methods.(32) In conclusion, the EISA process is a
crucial and facile method for the synthesis of mesoporous silica, and also for some metal
oxides thin films.
Figure 1.3.2: The schematic representation of Evoparation Induced Self Assemly (EISA)
process.(33)
1.4 Mesoporous Transition Metal Oxides
Perhaps, the most studied and well-understood known mesoporous material is
mesoporous silica owing to easy and well-known sol-gel chemistry of silica. However,
mesoporous other metal oxides are more attractive than mesoporous silica because of
great interest on their applications, as heterogeneous catalysts, photovoltaic devices,
sensing, photocatalysts and biological applications.(34-37) Yet, the synthesis of
mesoporous metal oxides is quite difficult compared to mesoporous silica. The first

8
difficulty is the reactivity of metal oxide precursor that makes the control of the
polymerization step of metal oxide precursor more difficult.(38) In addition, during the
calcination process, the pores may collapse due to redox reactions, phase transformation
and crystallization. Despite those difficulties, chemists have developed some synthesis
protocols to synthesize mesoporous metal oxides.
1.5 The EISA Process for Synthesis of Mesoporous Metal Oxides
The EISA process is also a powerful method for the synthesis of mesoporous
films and monoliths. The first examples of mesoporous metal oxides, such as TiO2,
ZrO2, Nb2O5, Ta2O5, Al2O3, SnO2, WO3, HfO2, and mixed oxides SiAlOy, Al2TiOy,
ZrTiOy, SiTiOy, and ZrW2Oy via EISA process, were demonstrated by Stucky and
coworkers.(39, 40) Like the synthesis of mesoporous silica by EISA method, the
mesoporous metal oxides were synthesized by using liquid crystalline templating from a
dilute solution of surfactant and proper metal oxide precursor in a proper solvent. The
EISA of surfactant and metal oxide precursor results a mesostructured solid upon
evaporation of the solvent. Obtaining a stable metal oxide solution with a proper solvent
is very important. The transition metal chlorides, MCl4, are stable in ethanol in the
presence of hydrochloric acid, due to the formation of stable chloroalkoxy complexes of
metals. Fortunately, less reactive metal oxide precursors, like metal alkoxides (M(OR4)),
could be used to better control on the synthesis of mesoporous metal oxides.(41) Co-
assembly of metal complexes using pluronics, such as P123 (HO(CH2CH2O)26-
(CH(CH3)CH2O)70-(CH2CH2O)26H, EO26PO70EO26), and provides large pores with
thicker metal oxide walls that can be crystallized upon calcination. Note that smaller
surfactants cause the collapse ordered pore system upon calcination. The EISA process
of mesoporous metal oxides is schematically represented in Figure 1.5.1.
Slow condensation of metal oxide precursor in the solution is very important to
obtain a mesostructured framework. Metal alkoxides, such Ti(OR)4, condenses itself into
titania, TiO2, in an acidic and humid environment. For a better controlled condensation
of metal oxide precursor, bidentate ligands have been used. Bidente ligands such as
carboxylate and nitrates are useful in the condensation and crystallization of the
precursors owing to the formation of linkage among metal species.

9
Mesoporous ordered metal oxide with large pore
a) Evaporation Induced Self-Assembly Process
Homogenous Solution
Evaporation of alcohol Dip coating
Co-assembly of metal oxide precursor and
surfactant
Calcination
Condensation of metal oxide precursor and
formation of mesophase
Surfactant
Metal oxide precursor
Volatile Solvent
Alcohol

10
The EISA method has been employed by several groups for the synthesis of
various mesoporous metal oxides and mixed metal oxides.(42-48) Most of the
synthesized mesoporous metal oxides and mixed metal oxides by EISA method are
limited to early transition metals (Ti, Ta, Nb, Zr and etc.). Alkoxides of late transition
metals (Fe, Ni, Co, Zn, Cd and etc.) with more d electrons are very reactive that makes
the EISA method very difficult. The high reactivity results in an uncontrolled
condensation and formation of bulk metal oxides. However, some transition metal
oxides, such as Fe2O3 (49), CrOx(50) and NiO (51) have been synthesized via EISA
method. In the synthesis of mesoporous Fe2O3 and CrOx , the metal precursors are their
nitrate salts. The nitrate ion can coordinate to metal ion and also bridge two or more
metal complexes in non-aqueous solution. This provides a slow condensation of metal
precursor to metal oxide framework. However, the EISA method has some drawbacks in
the synthesis of mesoporous transition metal oxides; i) since the gelation and
Figure 1.5.1: The schematic representation of EISA for the synthesis of
Mesoporous metal oxides; a) the EISA process and b) the stabilization of metal oxide
precursor.
b) The Stabilization of Transition Metal Oxide Precursor (TMO) Condensation
M(OR)4 +
HCl
or
Alcohol
(H O)
Hydrolysis
M+
Cl
OH
OR
M+
L
Alcohol and L (Bridge ligand)
Hydrolysis
Condensation
O
O O
O O
O
O
O O
O
O O
O O M
M
M
M
11
condensation step takes long such as 7- 14 days, it is not a facile method and ii) the
crystalline walls are too thick (about 10 nm), causing a decrease in the surface area.
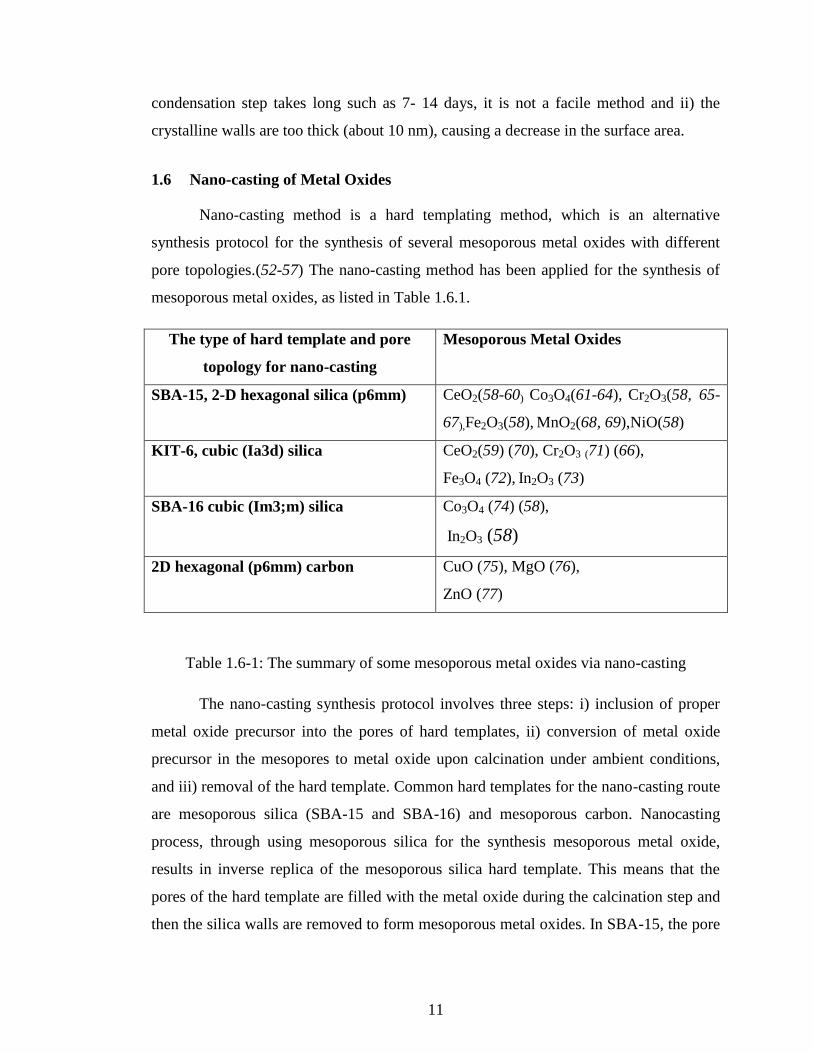
1.6 Nano-casting of Metal Oxides
Nano-casting method is a hard templating method, which is an alternative
synthesis protocol for the synthesis of several mesoporous metal oxides with different
pore topologies.(52-57) The nano-casting method has been applied for the synthesis of
mesoporous metal oxides, as listed in Table 1.6.1.
The type of hard template and pore
topology for nano-casting
Mesoporous Metal Oxides
SBA-15, 2-D hexagonal silica (p6mm) CeO2(58-60) Co3O4(61-64), Cr2O3(58, 65-
67),Fe2O3(58), MnO2(68, 69),NiO(58)
KIT-6, cubic (Ia3d) silica
CeO2(59) (70), Cr2O3 (71) (66),
Fe3O4 (72), In2O3 (73)
SBA-16 cubic (Im3;m) silica
Co3O4 (74) (58),
In2O3 (58)
2D hexagonal (p6mm) carbon
CuO (75), MgO (76),
ZnO (77)
Table 1.6-1: The summary of some mesoporous metal oxides via nano-casting
The nano-casting synthesis protocol involves three steps: i) inclusion of proper
metal oxide precursor into the pores of hard templates, ii) conversion of metal oxide
precursor in the mesopores to metal oxide upon calcination under ambient conditions,
and iii) removal of the hard template. Common hard templates for the nano-casting route
are mesoporous silica (SBA-15 and SBA-16) and mesoporous carbon. Nanocasting
process, through using mesoporous silica for the synthesis mesoporous metal oxide,
results in inverse replica of the mesoporous silica hard template. This means that the
pores of the hard template are filled with the metal oxide during the calcination step and
then the silica walls are removed to form mesoporous metal oxides. In SBA-15, the pore
12
structure is 2-D hexagonal and pores are connected to each other with micro channels.
Therefore, even after the removal of silica walls, the metal oxide rods are connected to
each other via micro rods leading to continuous, bridged metal oxide rods. The SBA-16
has a 3-D cubic pore topology that makes it more appropriate to obtain continuous
mesoporous framework after removal of the silica template. Herein, the main trick for
the synthesis of mesoporous metal oxide is the choice of mesoporous silica hard
templates with thicker walls.
In order to obtain mesoporous metal oxide with true porous topology like in
mesoporous silica, a better hard template is mesoporous carbon. The mesoporous carbon
can be synthesized via nano-casting by using mesoporous silica (SBA-15). Therefore,
the pores of mesoporous silica are filled with carbon, by decomposing carbon species in
the pores, then the silica walls are etched out. This provides that the mesoporous metal
oxides will have a true mesopore topology like in mesoporous silica after nano-casting
step. These two path ways of nano-casting using mesoporous carbon and silica to create
mesoporous metal oxides are schematically represented in Figure 1.6.1.

13
A key factor in nano-casting method is impregnation of metal precursor into
pores of mesoporous silica with an efficient filling. The metal nitrate salt in a proper
Mesoporous Silica
SBA-15, SBA-16..
Path 1
Mesoporous
Carbon
Mesoporous
Metal Oxides
Path 2
Mesoporous
Metal Oxides
Figure 1.6.1: The schematic representation of two different paths of nano-casting for the
synthesis of mesoporous metal oxides

14
solvent is mixed well with mesoporous silica and then the solvent is evaporated.
However, the impregnation method does not always provide efficient inclusion of metal
nitrates into of the mesoporous silica. One strategy for an efficient pore filling uses
mesoporous silica, in which the surfactant has been removed using microwaves.(78) The
silanol groups on the surface of the pore can be kept during the calcination step and this
enhances the filling rate of metal oxide precursor into pores in polar solvent. Another
strategy for an efficient pore filling is functionalization of silanol groups with proper
chelating ligands. Schüth and coworkers have used 2-dimensional hexagonal SBA-15
silica that is functionalized with vinyl groups for the synthesis of mesoporous
Co3O4.(79) Vinyl groups can complex with Co2+
cations and facilitate the successful
impregnation of metal salts into pores of SBA-15. An amino functionalized SBA-15 has
also been used for the synthesis of mesoporous Cr2O3 and WxOy by using acidic
solutions of K2Cr2O7 and H3PW12O40, respectively.(65, 66, 80) Another effective
strategy in the literature is usage of molten metal salts without a solvent(74) (metal
nitrates generally melt at low temperatures). In all of these strategies, the repetitive
loadings is necessary in order to increase loading of metal oxide precursor in the
mesopores, however, this may cause undesired formation of bulk metal oxide outside of
mesoporous silica.
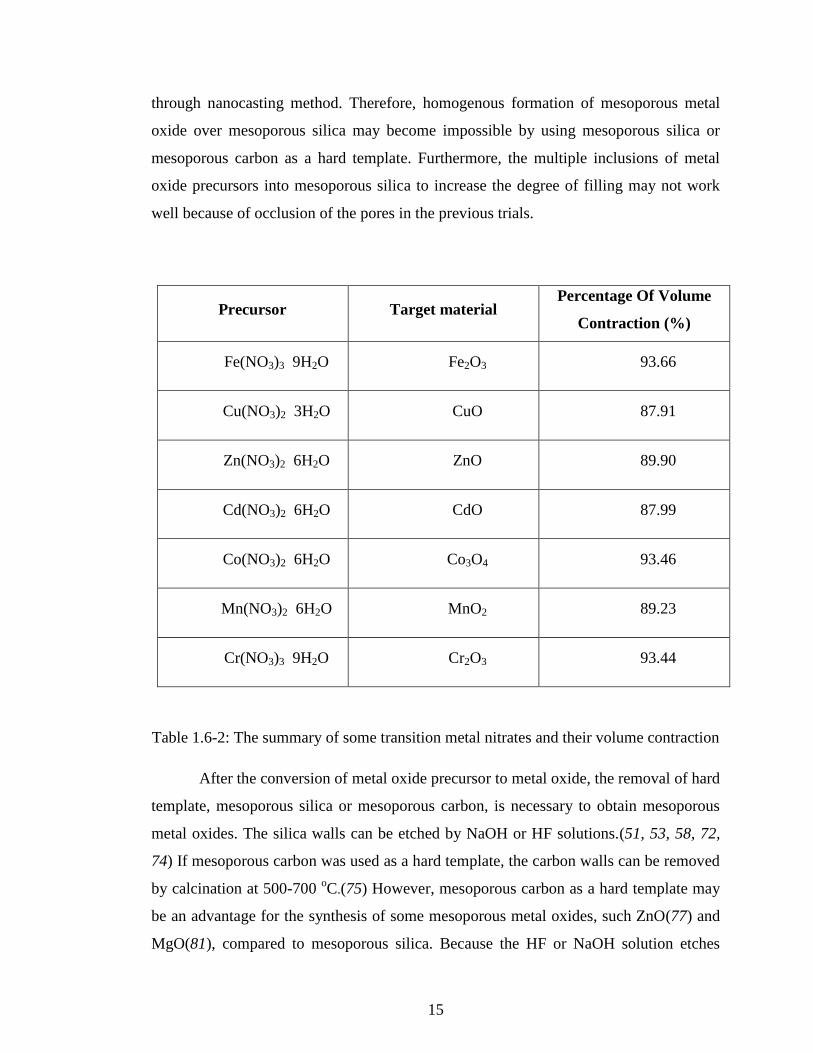
Despite the fact that a 100 % pore filling cannot be accomplished, after
calcination process to convert metal oxide precursor to metal oxide, the metal oxides
could not fill all the pores of mesoporous silica. There is a huge density difference
between metal oxide precursors and metal oxides. This causes a large volume
contraction. The general choice of metal oxide precursor for nanocasting method is
metal nitrates. (19) that usually have low decomposition temperature. For example, the
melting point of [Zn(NO3)2].6H2O is only 35.5 oC and its density is only 2.065 g/cm
3 but
the density of ZnO is quite high, 5.606 g/cm3. If one mole [Zn(NO3)2].6H2O is converted
into one mole ZnO, the volume of zinc salt is decreased to its 10.1% . This means that
the voids of mesoporous silica, totally filled with zinc nitrate hexahydrate, will only coat
silica surface and only block 10.1% of the pore volume. Some other metal nitrates and
their volume contraction are listed in Table 1.6.2. This enormous volume contraction of
metal precursor is an important drawback for the synthesis of mesoporous metal oxides
15
through nanocasting method. Therefore, homogenous formation of mesoporous metal
oxide over mesoporous silica may become impossible by using mesoporous silica or
mesoporous carbon as a hard template. Furthermore, the multiple inclusions of metal
oxide precursors into mesoporous silica to increase the degree of filling may not work
well because of occlusion of the pores in the previous trials.
Precursor Target material Percentage Of Volume
Contraction (%)
Fe(NO3)3 9H2O Fe2O3 93.66
Cu(NO3)2 3H2O CuO 87.91
Zn(NO3)2 6H2O ZnO 89.90
Cd(NO3)2 6H2O CdO 87.99
Co(NO3)2 6H2O Co3O4 93.46
Mn(NO3)2 6H2O MnO2 89.23
Cr(NO3)3 9H2O Cr2O3 93.44
Table 1.6-2: The summary of some transition metal nitrates and their volume contraction
After the conversion of metal oxide precursor to metal oxide, the removal of hard
template, mesoporous silica or mesoporous carbon, is necessary to obtain mesoporous
metal oxides. The silica walls can be etched by NaOH or HF solutions.(51, 53, 58, 72,
74) If mesoporous carbon was used as a hard template, the carbon walls can be removed
by calcination at 500-700 oC.(75) However, mesoporous carbon as a hard template may
be an advantage for the synthesis of some mesoporous metal oxides, such ZnO(77) and
MgO(81), compared to mesoporous silica. Because the HF or NaOH solution etches
16
these kinds of metal oxides due to their amphoteric character, and result a collapse of
mesostructure.
In addition, nanocasting method is more applicable for the synthesis of
mesoporous metal oxide powders rather than thin films. For the heterogeneous catalysis,
it is important to produce large scale mesoporous catalyst with a high surface area.(52,
55) However, many applications, such photovoltaic applications, are based on thin film
technologies.(82, 83)
1.7 Solid State Grinding Method
The nanocasting method for the synthesis of mesoporous metal oxides is quite
time consuming and contains lots of steps (preparation of hard template, inclusion metal
oxide precursor, condensation and template removal). Therefore, elimination of even
one step, in nanocasting method, would be a great advantage for the synthesis of
mesoporous metal oxides. In addition, the nanocasting method does not produce
homogenous and continuous mesoporous frameworks. Wang and coworkers developed a
novel method, in which a metal oxide precursor without a solvent is incorporated into
the as-prepared mesoporous silica. Calcination results in a homogenous coating of pore
surface with the metal oxides and removal of the surfactant.(84) This method has been
employed to several metal oxides, such as MgO, CuO and ZnO. (84-88) In general, as-
prepared mesoporous silica is grinded together with a metal nitrate salt without a
solvent; the metal nitrate salt is incorporated into as-prepared mesoporous silica without
any extra drawing force. Presence of surfactants inside the pores prevents the formation
of nanorods ; instead formation of nanoparticles covering the surface of silica was
enhanced. The schematic representation of solid state grinding method is shown in
Figure 17.1.

17
The solid state grinding method is a less time consuming and a facile synthesis
method compared to nanocasting method. However, the volume contraction problem
still exists as in the nanocasting method and limits the surface coverage of the pores. In
addition to this, loading of the metal oxide precursor, metal nitrate, is less than that in
nanocasting method. To illustrate, this method has been employed to coat mesoporous
SBA-15 with CuO with a coverage of only 15% of the surface of silica walls; authors of
this work also mentioned that they observed pore blocking in some parts of mesoporous
silica.(84) Therefore, a more efficient loading and conversion method is required to
Silica Surfactant
As-prepared mesoporous silica
Silica Surfactant
Metal Salt
Metal salt-incorporated mesoporous
silica
Grinding
Metal oxide coated mesoporous
silica
Silica
Metal
Oxides
Figure 1.7.1: The schematic representation of solid state grinding method

18
enhance the metal oxide loading with a uniform distribution in the pores of mesoporous
silica, specifically as thin films for advanced applications.
1.8 Lyotropic Liquid Crystalline (LLC) Mesophases of Transition Metal Salts
Liquid crystals are divided into two groups; thermotropic liquid crystals and
lyotropic liquid crystals. While thermotropic liquid crystals are a kind of ordered
assembly of molecules that shows a phase transformation with temperature change, the
phase of lyotropic liquid crystals depends on a second component (solvent) and
temperature. By using lyotropic liquid crystalline (LLC) templating method (know as
true liquid crystalline templating, TLCT, method), different types of mesoporous
materials have been synthesized as mentioned in the previous chapters.
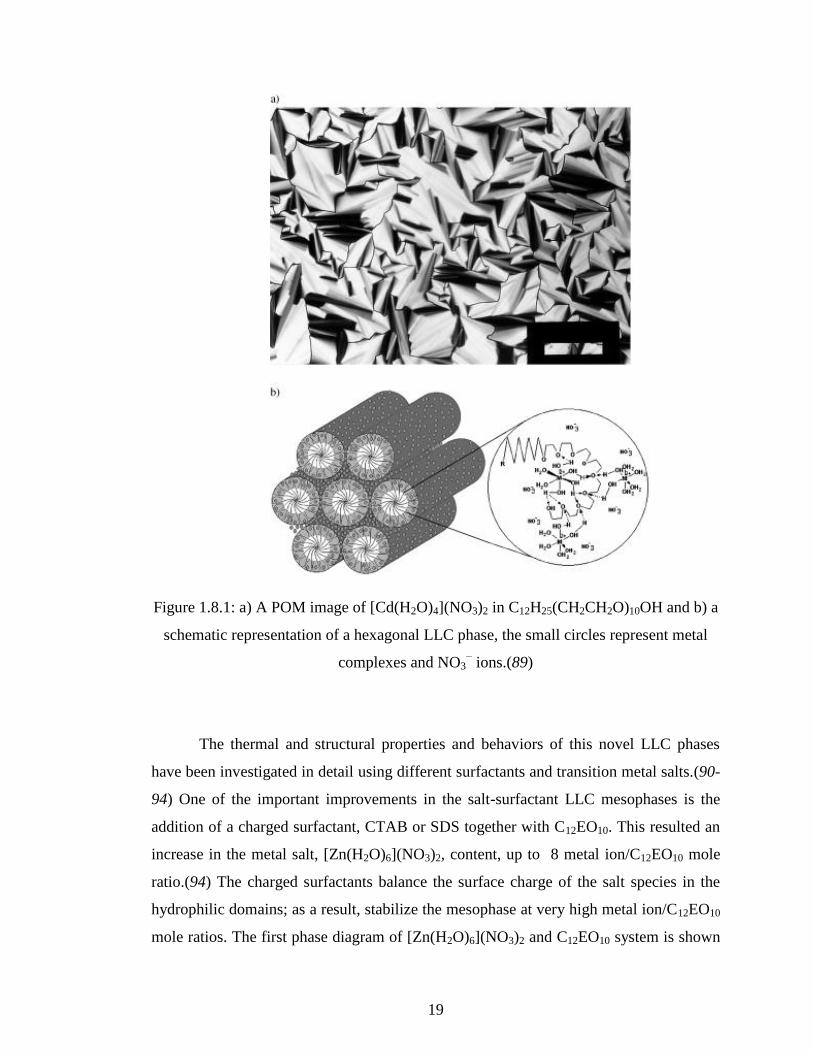
Dag et al. have introduced a new type of LLC mesophase in which the transition
metal aqua complexes act as a solvent and form the LLC mesophases with
oligo(ethylene oxide) surfactants (C12H25(CH2CH2O)10OH, C12E10).(89) Herein, they
showed that the coordinated water molecules of the transition metal aqua complexes
direct the self-assembly of surfactant molecules into hexagonal or cubic mesostructures
with the help of hydrogen bonding (between ethylene oxide groups of the surfactant and
coordinated water of aqua metal complex). The hexagonal LLC mesophase of
[Zn(H2O)6](NO3)2 −C12EO10 is stable up to 70 w/w % (weight of salt over total weight
percent) at RT. A schematic representation of this self-assembly in a hexagonal packing
and its characteristic fan texture of hexagonal phase are shown in Figure 1.8.1.
19
Figure 1.8.1: a) A POM image of [Cd(H2O)4](NO3)2 in C12H25(CH2CH2O)10OH and b) a
schematic representation of a hexagonal LLC phase, the small circles represent metal
complexes and NO3− ions.(89)
The thermal and structural properties and behaviors of this novel LLC phases
have been investigated in detail using different surfactants and transition metal salts.(90-
94) One of the important improvements in the salt-surfactant LLC mesophases is the
addition of a charged surfactant, CTAB or SDS together with C12EO10. This resulted an
increase in the metal salt, [Zn(H2O)6](NO3)2, content, up to 8 metal ion/C12EO10 mole
ratio.(94) The charged surfactants balance the surface charge of the salt species in the
hydrophilic domains; as a result, stabilize the mesophase at very high metal ion/C12EO10
mole ratios. The first phase diagram of [Zn(H2O)6](NO3)2 and C12EO10 system is shown

20
in Figure 1.8.2.(90) The new mesophase is stable below 0 oC. Moreover, they concluded
that the zinc nitrate hexahydrate salt is in the molten phase in confined hydrophilic
domains of the LLC mesophase and organize the surfactant molecules into mesophase.
This discovery is an important step for both understanding the origin of the
salt:surfactant LLC mesophases and designing new materials by using these phases.
Figure 1.8.2: The phase diagram of [Zn(H2O)6](NO3)2 and C12EO10 system:
bicontinuous cubic (V1), normal hexagonal (H1), micelle cubic (I), micelle (L1).(90)
1.9 ZnO Nanoparticles and Mesoporous ZnO
ZnO is a n-type and wide band gap semiconductor with band gap of 3.37 eV and
an exciton (e-h pair) binding energy of 60 meV. These properties make ZnO unique in
many applications as a piezoelectric materials, UV light-emitting diodes, lasers,
photovoltaic solar cells, UV-photodetectors, gas-sensors, and varistors.(95-98) For many
applications of ZnO that require high surface area, the synthesis of mesoporous ZnO is

21
also very important.(83, 99) To the best of our knowledge, only one example of
mesoporous ZnO prepared by EISA method was demonstrated by Schüth and
coworkers.(100, 101) They have used a special organometallic single-source precursor
for the controllable condensation of ZnO precursor. The mesoporous ZnO has also been
prepared through nanocasting method.(102) Generally, ZnO nanoparticles were
embedded into mesoporous silica to obtain high surface area ZnO without particle
aggregation through solid state grinding method,(103) templating chelating ligand (104)
and functionalization of silica walls (105). However, all these methods do not ensure
high loading of zinc oxide into mesoporous silica.
In this thesis, we have developed a novel synthesis protocol for mesoporous
silica–metal oxide (ZnO and CdO) thin films. In this method, two surfactants (a charged
surfactant, CTAB and C12EO10) with a silica precursor, TMOS assemble together with
an extensive amount of zinc nitrate hexahydrate, [Zn(H2O)6](NO3)2, or cadmium nitrate
tetrahydrate, [Cd(H2O)4](NO3)2, into a liquid crystalline mesophase. The confinement of
the metal salt in mesophase makes the metal salt transform into its molten phase that acts
as a solvent and organizes two surfactants into a hexagonal liquid crystalline phase.
Then, this mesophase can be converted into mesoporous silica-metal oxide thin films
upon calcination. We named this novel synthesis protocol as molten salt assisted self-
assembly (MASA) in which two solvents are used: a volatile solvent (water) which
provides homogenous mixing of the ingredients into a clear solution and facilitate self-
assembly and a non-volatile solvent (metal nitrate salts at molten state) that stabilizes
and keeps the mesophase after water evaporation enables for the formation of metal
oxide. The MASA synthesis protocol has been investigated by using x-ray diffraction
(XRD), Fourier transform infrared (FT-IR) spectroscopy, UV-Visible absorption
spectroscopy, Transmission electron microscopy (TEM ), Energy dispersive x-ray
spectroscopy (EDS), polarized optical microscopy (POM) and N2 sorption surface area
analysis.
22
2 EXPERIMENTAL
2.1 MATERIALS
The chemicals which are used throughout this investigation are: zinc nitrate
hexahydrate [Zn(H2O)6](NO3)2 (%98 Aldrich) represented as ZnX, cadmium nitrate
tetrahydrate [Cd(H2O)4](NO3)2 (%98 Aldrich) represented as CdY,
tetramethylorthosilicate (TMOS) (%98 Aldrich), cetyltrimethylammonium bromide
CTAB, 10-lauryl ether, C12H25(OCH2CH2)10OH, (C12EO10), and deionized water.
2.2 SYNTHESIS
2.2.1 Synthesis of Mesostructured- ZnX Salt-Silica Thin Films
Dissolve a desired amount of ZnX (see Table 2.2.1), 0.291 g CTAB, and 0.500 g
C12EO10 in 4.5 ml deionized water in a 25 ml vial by stirring on a magnetic stirrer for 1
day. Then add 0.050 g concentrated HNO3 acid and 0.850 g TMOS to the above mixture
and gently stir the mixture for another 5 min. A solution of 8.0 ZnX/C12EO10 or 1.14
Zn(II)/SiO2 mole ratio contains 1.900 g ZnX, 0.291 g CTAB, 0.500 g C12EO10, 4.500 g
H2O, 0.050g HNO3, and 0.850 g TMOS. Other compositions are given in Table 2.2.1.
Put 1.0 ml of the above solution on a substrate (glass, silicon wafer and/or
quartz) over a spin coater and spin it at 1200 rpm for 1.0 min. Make sure the solution
completely covers the substrate to ensure full coverage after coating. Put the film
sample immediately into an oven at 55 oC for aging 5 minutes.
2.2.2 Fabrication of meso-silica-ZnO-n Thin films
Calcine above thin film from 55 to 450 oC by 1
oC/min increments in a
temperature controlled furnace. Remove the film from the furnace prior to slowly
cooling the furnace. The film is abbreviated as meso-silica-CdO-n, where n is Zn/Si
mole ratio.

23
Sample name
The amounts of Chemicals (g)
ZnX C12EO10 CTAB TMOS HNO3 H2O
meso-silica-ZnO-
0.29
0.475 0.500 0.291 1.900 0.050 4.500
meso-silica-ZnO-
0.57
0.950 0.500 0.291 1.900 0.050 4.500
meso-silica-ZnO-
0.86
1.425 0.500 0.291 1.900 0.050 4.500
meso-silica-ZnO-
1.14
1.900 0.500 0.291 1.900 0.050 4.500
meso-silica-ZnO-
1.43
2.375 0.500 0.291 1.900 0.050 4.500
meso-silica-ZnO-
1.71
2.850 0.500 0.291 1.900 0.050 4.500
Table 2.2-1: The amounts of chemicals used in the preparation of meso-silica-ZnO-n

24
2.2.3 Synthesis of meso-silica-CdO-n Thin Films
Dissolve a desired amount of [Cd(H2O)4](NO3)2 (see Table 2.2.2), 0.291 g
CTAB, and 0.500 g C12EO10 in 4.5 ml deionized water in a 25 ml vial by stirring on a
magnetic stirrer for 1 day. Then add 0.050 g concentrated HNO3 acid and 0.850 g
TMOS to the above mixture and gently stir the mixture for another 5 min. The sample
with 8 CdY/C12EO10 or 1.14 Cd(II)/SiO2 mole ratio contains 1.970 g CdY, 0.291 g
CTAB, 0.500 g C12EO10, 4.500 g H2O, 0.050g HNO3, and 0.850 g TMOS. Other
compositions are given in the Table 2.3.1.
Put 1.0 ml of the above solution on a substrate (glass, silicon wafer and/or
quartz) over a spin coater and spin the sample at 1200 rpm for 1.0 min. Make sure the
solution completely covers the substrate to ensure full coverage after coating. Put the
film sample immediately into an oven at 65 oC for aging.
2.2.4 Fabrication of meso-silica-CdO-n Thin films
Calcine above thin film from 65 to 450 oC by 1
oC/min increments in a
temperature controlled furnace. Remove the film from the furnace prior to slowly
cooling the furnace. The film is abbreviated as meso-silica-CdO-n, where n is Cd/Si
mole ratio.
2.2.5 Etching of meso-silica-CdO-n Thin Films
The calcined films or the powders, scraped from the substrates, were etched in a
4% HF solution in plastic vials. Centrifuge the solution to collect powder by decanting
the liquid part into waste bottle. Add distilled water over the precipitate to wash out any
remaining fluoride species. Centrifuge the mixture and remove the liquor and repeat the
washing step 2 to 3 times. Then dry the powder in an oven.

25
Sample name
The amounts of Chemicals (g)
CdY C12EO10 CTAB TMOS HNO3 H2O
meso-silica-CdO-
0.29
0.492 0.500 0.291 1.900 0.050 4.500
meso-silica-CdO-
0.57
0.985 0.500 0.291 1.900 0.050 4.500
meso-silica-CdO-
0.86
1.478 0.500 0.291 1.900 0.050 4.500
meso-silica-CdO-
1.14
1.970 0.500 0.291 1.900 0.050 4.500
meso-silica-CdO-
1.43
2.460 0.500 0.291 1.900 0.050 4.500
meso-silica-CdO-
1.71
2.956 g 0.500 g
0.291
g
1.900 g
0.050
g
4.500 g
Table 2.2-2: The amounts of chemicals used in the preparation of meso-silica-CdO-n

26
2.2.6 Synthesis of meso-silica-CdS-n Thin Films
Place the calcined meso-silica-CdO-n thin film in a vacuum chamber and
evacuate the chamber for 2 min. Put 300 torr H2S gas over the meso-silica-CdO-n thin
films for 100 min at room temperature. Then pump out the unreacted excess H2S gas
from the reaction media for 5 min before removing the sample from the reaction
chamber. The samples are labelled as meso-silica-CdS-n.
2.2.7 Synthesis of meso-silica-CdSe-n Thin Films
Place the calcined meso-silica-CdO-n thin film in a vacuum chamber and
evacuate the chamber for 2 min. Put 300 torr of 5 % H2Se gas (diluted with pure N2 gas)
over the sample for 15 min at RT to obtain meso-TiO2-CdSe thin film. Then transfer the
excess H2Se gas in the reaction chamber over a CuO loaded mesoporous silica for 2 min
to convert the excess H2Se into CuSe nanoparticles. Then, evacuate the unreacted gas by
using a rotary pump for 5 min before removing the sample. The samples are labelled as
meso-silica-CdSe-n.
2.3 CHARACTERIZATION
2.3.1 X-Ray Diffraction (XRD)
The XRD patterns of the films of meso-SiO2-ZnX and meso-SiO2-CdY films on
glass microscope slides were recorded by using Rigaku Miniflex diffractometer with a
Cu Kα (1.5405 A°) x-rays source operating at 30 kV/15 mA. The fresh samples of meso-
SiO2-ZnX or CdY were monitored at small angles between 1 and 5
o, 2θ, with 1
o/ min
scan rate for the investigation of mesostructure. For the high angle measurements
approximately 20 films over glass slides were scraped and collected on a XRD sample
holder. The high angle XRD patterns were recorded between 10 and 80o, 2θ by using
Pananalytical Multi-purpose x-ray diffractometer, equiped with a Cu Kα (1.5405 À) x-
rays source operating at 45 kV/40 mA.

27
2.3.2 FT-IR Spectroscopy
FT-IR spectra of the meso-SiO2-ZnX and meso-SiO2-CdY films, coated over
single crystal Si(100) wafers, were recorded by using Bruker Tensor 27 model FTIR
spectrometer. The spectra were collected in the range of 400 and 4000 cm-1
with a
resolution of 4 cm-1
and by collecting 128 scans. The calcination process of the meso-
SiO2-ZnX was monitored using homemade temperature controlled (Digi-Sense Cole
Parlmer) sample holder. The calcined samples were diluted using KBr and pressed into
KBr pellets for the FT-IR measurements.
2.3.3 UV-Vis Absorption Spectroscopy
The UV-Vis absorption spectra of meso-SiO2-ZnO-n and meso-SiO2-CdO-n thin
films, coated on quartz substrates were collected by using Thermo Scientific Evolution
300/600 UV-Visible spectrometer. The spectra were obtained in the range of 200 and
800 nm with a resolution of 2 nm and 100 nm/min scan rate.
2.3.4 Polarized Electron Microscopy (POM) Images
The POM images of the films, coated on microscope glass substrate were
recorded by using ZEISS Axio Scope A1 Polarizing Optical Microscope in
transmittance mode with 20X optic lens, between crossed polarizers.
2.3.5 The N2 (77.4 K) Sorption Measurements
The N2 (77.4 K) sorption measurements were carried by using a TriStar 3000
automated gas adsorption analyzer (Micrometrics) in the relative pressure range, P/P0,
from 0.01 to 0.99. The samples of meso-SiO2-ZnO-n and meso-SiO2-CdO-n were
collected from 15-25 films coated on glass microscope slides by scraping with razor
blade and the amount of sample were ranged from 10 mg to 20 mg. Surface areas were
calculated in the range from 0.05 to 0.3 relative pressure with 5 points. The powder
samples were degassed under (~10-2
torr) vacuum for 3 hours at 300 oC in order to
remove adsorbed water and volatile species in the pores prior to measurements.
2.3.6 Transmission Electron Microscopy (TEM) Images
The high resolution transmission electron microscope (HRTEM) images were
collected by using a FEI Technai G2 F30 at an operating voltage of 200 kV. The

28
calcined films were scraped and ground in a mortar using 5 ml of ethanol for 10 min and
dispersed using a sonication for 5 min. One drop of the dispersed ethanol solution was
put on a TEM lacey grid and dried over a hot-plate. Then, for further comprehensive
analysis of the crystal structure of ZnO and CdO nanoparticles, the images were
analyzed by using the software of Digital Micrograph 3.6.5.
2.3.7 Scanning Electron Microscopy (SEM)
Nano-SEM images were recorded using Hitachi HD-2000 STEM in SEM mode.
The samples were prepared by dispersing powders over the TEM grids. The SEM
images were also recorded by using ZEISS EVOS-40, operated at 15 kV. The samples
were prepared on silicon wafers that were attached to aluminum sample holders using
conductive carbon adhesive tabs.

29
3 RESULT AND DISCUSSION
3.1 Optimization of the meso-silica-ZnX-n Films
In this thesis, mesostructured salted (ZnX or CdY) silica films were prepared
and investigated to synthesize desired mesoporous silica-ZnO or CdO thin films. The
meso-silica-ZnX-n films were prepared by spin coating a clear aqueous solution of
CTAB, C12EO10, ZnX, HNO3, and TMOS. To obtain the clear aqueous solutions, the
mixture should be vigorously stirred for 1 day. Note that the surfactants, CTAB and
C12EO10, which have long hydrophobic tails, are not easy to dissolve (it may take about
1 day) in an aqueous media. After dissolving the surfactants in water, HNO3 and TMOS
are added into the solution (TMOS hydrolyzes to Si(OH)4 by an acid catalyzed
hydrolysis reaction, Equation 3.1.1 and 3.1.2). Note that after addition of TMOS to
above acidic solution; the solution warms up, indicating the hydrolysis of TMOS. The
hydrolysis follows a condensation step with a pH dependent rate. The condensation of
silica precursor in the reaction condition is so moderately high, (Equation 3.1.3) that
after 2 hrs from the addition of TMOS and HNO3, the SiO2 nanoparticles are formed.
The solution that is aged for more than 15 min is not good for the synthesis of meso-
silica-ZnX-n thin films. Therefore, ideally in 5 min after the addition of TMOS, the
solution should be spin coated over a substrate.
Si(OCH3)4 + H2O → HO- Si(OCH3)3+ CH3OH Hydrolysis (Eq 3.1.1)
Si(OCH3)4 + 4 H2O → Si(OH)4 + 4 CH3OH Acid Catalyst Hydrolysis(Eq 3.1.2)
Si(OH)4 → SiO2 + H2O Condensation (Eq 3.1.3)

30
In order to prepare the meso-silica-ZnX-n films, the solution of CTAB, C12EO10,
ZnX, HNO3, water, and TMOS is put over a substrate on spin coater and spanned as
represented in Figure 3.1.1. The excess water evaporates during spinning. The film
thickness can be adjusted by altering spin rate and time. The ideal spinning rate and time
is optimized to be 1200 rpm and 1 min, respectively, for the ideal thickness of meso-
silica-ZnX-n thin films. The sample thickness is about 1 µm after the evaporation of
water and methanol (a side product).
Vigorously
stirred for 1
day at room
temperature
HNO3 and TMOS,
respectively
Stirred for 5
min.
Droping
solution
ZnX or CdX
CTAB and C12
EO10
Water
Spin coating
The meso-silica-ZnX-n
fim
Figure 3.1.1: The representative preparation of the meso-silica-ZnX-n film by spin
coating.

31
The spin coated sample on a glass microscope slide has been characterized using
XRD and POM techniques. The as-prepared meso-silica-ZnX-n films are likely in a
liquid crystalline mesophase. POM is a useful technique for the determination of
anisotropic mesostructures. A fan-like texture, observed from meso-silica-ZnX-1.14
film, under a polarized optical microscope (POM), is characteristic for this existence of
2-D hexagonal mesostructure, see Figure 3.1.2. The observed birefringence in the POM
image is characteristic for anisotropic 2-D hexagonal mesophase.
Figure 3.1.2: The POM image of an as-prepared meso-silica-ZnX-1.14 thin
film.
5 um

32
Figure 3.1.3.
The small angle diffraction lines observed from all compositions of meso-silica-
ZnX-n (n is 0.29, 0.57, 0.86, 1.14, 1.43, and 1.71) belong to (100) and (200) planes of
2D hexagonal mesostructure, Figure 3.1.3.a. The d-spacing of the (100) planes, d(100),
x y
z d (100)
θ=60o
a)
b)
a
Figure 3.1.3 a) Small-angle XRD patterns of the as prepared meso-silica-ZnX-n thin films
where n is Zn(II)/SiO2 mole ratio(1). b) The schematic representation of d(100) planes in
2D hexagonal mesostructure

33
can be calculated by utilizing the Bragg’s law, nλ = 2dsin θ. For example, d(100) for the
meso-silica-ZnX-0.29 is found to be about 4.8 nm, where 2θ is 1.84o. The unit cell
parameter, a, is calculated from a = d(100)/sin(60o) (a = 4.8/0.866 = 5.5 nm). The second
line at 3.58o, 2θ, corresponds to the (200) planes of 2D-hexagonal structure. The
diffraction lines of meso-silica-ZnX-n, gradually shifts to smaller angles with increasing
the ZnX content of the sample. It is reasonable that increase in the salt content in
mesostructure increases the unit cell parameter, expands the hydrophilic domains in the
mesostructure.
First, for the synthesis of ordered mesoporous silica-ZnO thin film, meso-silica-
ZnX-n samples are aged at room temperature for the condensation of silica domains,
which eventually provides a rigid 2-D hexagonal and ordered mesostructure. Then, by a
controlled calcination under an air atmosphere, the ZnX salt is converted to ZnO and the
surfactants are removed. As a consequence, the ordered mesoporous silica-ZnO thin
films with 2-D hexagonal structure may be obtained upon calcination.
2 3 4
0
30000
60000
90000
120000
10 20 30 40
0
20000
40000
60000
80000
100000
120000
140000
160000
180000
200000
220000
240000
260000
280000
Time
30 minutes
15 minutes
Inte
nsit
y/c
ps
2 degree
Figure 3.1.4: Small-angle and wide angle (inset) XRD patterns of the meso-silica-ZnX-
1.14 thin films with different aging times where time is shown on the patterns

34
To elucidate and understand the underlying mechanism for the formation of
meso-silica-ZnX-n, the stability of the mesostructure of as prepared meso-silica-ZnX-
1.14 thin film was monitored by recording small angle and high angle diffraction
patterns at different aging time. The highly intense diffraction line at around 1.4o, 2θ
shifts to around 1.8o, 2θ and its intensity decreases after about 2 min, Figure 3.1.4. The
diffraction lines at wide angle XRD pattern belong to ZnX salt, Figure 3.1.4 (PDF card
number: 00-046-0595). This means that most of the ZnX salt leaches out from the
mesostructure and crystalizes out of the 2D hexagonally oriented mesostructure. The
shift from 1.4o, 2θ to 1.8
o, 2θ, in the low angle diffraction line indicates that domains of
the mesophase shrink more than 30%, and likely indication of leaching salt out of the
mesostructure.
Figure 3.1.5: Small (top) and wide (bottom) angle XRD patterns of the calcined meso-
silica-ZnX-1.14 thin film
If the films, in which ZnX salt leached out from the mesophase, are heated from
room temperature (RT) to 450 oC with 1
oC /min intervals, the formation of bulk
wurtzite ZnO is observed. The diffraction lines in wide-angle XRD pattern of the
calcined sample of meso-silica-ZnX-1.14 belong to (100) and (002) planes of wurtzite
ZnO (d100 = 2.8141 Å and d002 = 2.6027 Å), Figure 3.1.5. Interestingly, ordered 2-D
hexagonal mesoporous silica-ZnO thin films and bulk ZnO form together. The
diffraction line at around 2.4o, 2θ in small-angle diffraction patterns of the calcined
2 3 4 5
0
2000
4000
6000
8000
10000
12000
14000
Inte
nsit
y/c
ps
2 degree
20 30 40 50
500
750
1000
(002)
Inte
nsit
y/c
ps
2 degree
(100)

35
sample of meso-silica-ZnX-1.14 originates from the (100) plane of 2-D hexagonal
structure (d100 = 3.7 nm), see Figure 3.1.5. Because, all salt species does not leach out
from the mesostructure, remaining ZnX in the mesophase with silica precursor forms
the mesoporous ordered structure. As shown in the SEM image of this sample in Figure
3.1.6, after calcination, cracks and round hollows about 1 µm size are formed
throughout the film. It is likely that the ZnX salt crystals leached out from the
mesophase, formed bulk ZnO crystals. These crystals cover the surface of ordered
mesoporous silica-ZnO in which less amount of ZnO than initial salt composition exists
in the mesoporous domains of the film.
Figure 3.1.6: The SEM images of calcined the meso-silica-ZnX-1.14 thin film. Inset
shows higher resolution SEM image of square.
36
1076 c
m-1
NO
3
- sym
metr
ic
400 800 1200 1600 2800 3200 3600 4000
0,0
0,6
1,2
1,8
2,4
3,0
CH
Free NO3
-
0
0.29
0.57
0.86
1.14Ab
so
rba
nc
e/a
.u
Wavenumber/cm-1
n
1.43
1326 c
m-1
1409 cm-1
147
0 c
m-1
1649 cm-1
NO3
-coordinated
H
2O
H
2O
1076 c
m-1
NO
3
- sym
metr
ic
Figure 3.1.5: The FTIR spectra of meso-silica-ZnX-n ( n is shown on the spectra) (1)
To understand and elucidate the stability issues of the meso-SiO2-ZnX-n thin
films, the FTIR spectra of meso-silica-ZnX-n films (where n is 0.29, 0.57, 0.86, 1.14,
and 1.43) are analyzed. The peaks, at around 1326 and 1470 cm-1
in the FTIR spectra of
meso-silica-ZnX-n, are assigned to antisymmetric stretching modes of nitrate ions that
are coordinated to Zn(II) ion, see Figure 3.1.5. The intensity of these peaks increases
with increasing salt content in the samples. At high salt content, the nitrate peaks are
very similar to the peaks in molten ZnX salt.(90) Evaporation of water and methanol
during spin coating transforms ZnX salt to its molten phase that is confined between the
silica clusters and hexagonally organized surfactant domains at high ZnX
concentrations. In the as-prepared thin films, the molten ZnX salt acts as a solvent and
organizes the surfactant molecules and silica species into mesostructures.

37
1.0 1.5 2.0 10 15 20 25 30 35 40
0
20000
40000
60000
(012)
24 min
12 min
Time
ASAP
2 min
4 min
8 min
60 min
Time
Inte
nsit
y/c
ps
2 degree
(011)
Figure 3.1.6: The small-angle and wide-angle XRD patterns of the as prepared meso-
silica-ZnX-n thin film aged for 5 minutes at 55 0C and in time at room temperature
where time is shown on the patterns
The meso-SiO2-ZnX-n samples at high ZnX concentrations, above 0.57
Zn(II)/Silica mole ratio, can form the mesostructure by keeping ZnX salt in its molten
phase. The mesostructure is stable if the samples are kept above melting point of ZnX
salt. Notice that the melting point of [Zn(H2O)6](NO3)2 is only 36.5 0C. To understand
the role of temperature above the melting point of salt species, small and wide angle
XRD patterns of meso-SiO2-ZnX-1.14 film sample were recorded over time after aging
the samples at 55 0C. However the diffraction patterns were recorded at RT; the
temperature of the samples reaches to RT in 2 min. The diffraction line at around 1.7o,
2θ, of the sample aged for 5 min at 55 0C shifts to around 1.4
o in 2 min, and its intensity
increases, see Figure 3.1.6. This means that when the sample film reaches RT, the
volume of mesophase expands by absorbing ambient water and the mesophase becomes

38
better ordered. However, after 8 min of aging at RT, the diffraction line, at around 1.4o
shifts back to 1.7o and the diffraction lines of ZnX salt in the wide angle appear (PDF
card number: 00-046-0595). This is a characteristic behavior when the sample leaches
out salt.
1.5 2.0 2.5
0
20000
40000
60000
80000
100000
5 10 15 20 25 30 35 40
100
200
300
400
500
600
700
800
900
12 min
45 min
Time
Inte
nsit
y/c
ps
2 degree
42 min
6 min
4 min
ASAP
2 min
Time
Inte
nsit
y/c
ps
2 degree
Figure 3.1.7: The small-angle and high angle XRD patterns of the as prepared meso-
silica-ZnX-n thin film aged for 2 hours at 55 0C in time where time is shown on the
patterns
This behavior shows that the structure of the meso-silica-ZnX-1.14 film is not
stable at RT for a long time and some of the salt species leach out from the
mesostructure. The aged sample at 55 0C for 2 hrs also shows a similar behavior, see
Figure 3.1.7. However this sample is stable at RT over 1h. Notice also that there is no
diffraction line at wide-angle region due to ZnX crystals, showing that the salt species
are confined and likely in its molten phase between the silica and hexagonal organized

39
surfactant domains. This can be explained by the melting point depression due to
confinement effect. Otherwise, high amount of salt has to crystallize during self-
assembly. Therefore, longer aging, at 55 oC, stabilize the samples for a longer time at
RT.
800 1000 1200 1400 1600 1800
0.0
0.5
1.0
1.5
2.0
R. T. 10 min.
R. T. 2 min.
As Prepared
Ab
so
rba
nc
e/a
.u
Wavenumber/cm-1
At C
Figure 3.1.8: The FTIR spectra of as-prepared meso-silica-ZnX-1.14 at different
temperature with time (Temperatures is shown on the spectra)
In order to understand the behavior of as-prepared meso-silica-ZnX-n at high
salt concentrations, against aging, the FT-IR spectra of as-prepared meso-silica-ZnX-
1.14 were also recorded during aging at 55 oC. The bottom spectrum in Figure 3.1.8 is
the spectrum of the as-prepared sample. Then, the film sample was heated to 55 oC on a
homemade IR heating stage, and its spectrum was recorded at 55 oC. Finally, the
sample was cooled to RT and two more spectra were recorded 2 and 10 min later. The
peaks between 1250 and 1480 cm-1
, due to asymmetric stretching modes of nitrate ions,

40
and at 1630 cm -1
, due to bending mode of water molecules show changes with
temperature and time, Figure 3.1.8. By heating the sample to 55 oC, the coordination of
nitrate ions to Zn (II) ion is enhanced due to enlarging the splitting of coordinated
nitrate peak position and the intensity of the water peak at 1630 cm -1
is decreased.
However, cooling the sample to RT for 2 min, the peaks, due to coordinated nitrates,
increased and the intensity of the water peak at 1630 cm -1
increased, similar to the
initial spectrum of as prepared sample, see Figure 3.1.8. This means that the
coordinated water molecules evaporate at 55 oC (dehydration), and the ZnX salt species
reabsorb the water molecules (hydration) at RT. This also explains the expansion of the
mesophase, observed in the small angle XRD patterns, since the volume of ZnX salt
species expands by the hydration. However, if the sample is kept at RT long enough,
most of salt species leached out from the mesophase. This can also be observed in the
FTIR spectrum (see top spectrum in Figure 3.1.8). The sharp peak at around 1400 cm-1
is due to ZnX crystals.
The mesostructure, at high salt concentration is only stable above the melting
point of the salt. It means that the molten ZnX salt can organize the surfactants (CTAB
and C12E10) and silica species into a 2-D hexagonal mesostructure. In conclusion,
keeping samples above the melting point immediately after spin coating is prerequisite
for the synthesis mesostructured silica-ZnX films.

41
1.2 1.6 2.0 2.4 2.8 3.2
0
7000
14000
21000
5 10 15 20 25 30 35 40
0
1000
2000
3000
4000
2 min
TimeInte
nsit
y/c
ps
2 degree
As prepared
2 min.
30 min.
TimeInte
nsit
y/c
ps
2 degree
Figure 3.1.9: The small-angle and high angle (inset) XRD patterns of the as prepared
meso-silica-ZnX-n thin film aged for 1 day at 55 0C in time where time is shown on the
patterns
To further understand the effect of aging, the as-prepared meso-silica-ZnX-1.14
was aged at 55 oC for 1 day. The mesostructure still responses to the adsorption of
water, such that, the diffraction line in the small angle XRD pattern shifts to lower
angle, see Figure 3.1.9. However, the diffraction lines due to ZnX crystals appear in 2
min at RT, indicating that most of the salt species are not inside the mesophase despite
aging the sample for one day. The calcination of this sample also produced bulk ZnO
crystals.
In summary, the samples should be kept above the melting point of ZnX salt
immediately after the assembly of mesophase through spin coating in order to keep the
mesostructure stable. The aging temperature, 55 oC, is ideal for meso-silica-ZnX-n
films. The samples are not stable at RT because of leaching out of the salt. The salt
species, which are out of the mesostructure crystalize and form bulk metal oxide upon

42
calcination. Aging step should not be longer than 2 hrs because further aging step also
causes leaching of salt species from the mesostructure.
3.2 Optimization of Synthesis Conditions for the meso-silica-CdY-n Films
The knowledge and experience that were gained from the optimization of the
meso-silica-ZnX-n films can be applied to other salt – surfactant systems to show the
generality of the synthesis method, developed in this thesis. Therefore, the meso-silica-
CdY-n samples(where CdY is [Cd(H2O)4](NO3)2 ) were prepared by spin coating a
clear solution of CTAB, C12EO10, CdY, HNO3, water, and TMOS as described in the
preparation of the meso-silica-ZnX-n film samples.
1 2 3
0
5000
10000
15000
20000
25000
30000
0.54
0.86
1.14
2
deg
ree
2 degree
n
Figure 3.2.1: The small-angle diffraction patterns of as prepared meso-silica-CdY-n (n is
0.57, 0.86, and 1.14 and n is shown on the spectra
The small-angle diffraction lines observed from the as prepared meso-silica-
CdY-n (n is Cd(II)/SiO2 mole ratio and 0.57, 0.86, and 1.14) prove the formation of a 2D
hexagonal mesostructure and they belong to (100) plane of the hexagonal mesostructure,
Figure 3.2.1. As in the meso-silica-ZnX-n samples, increasing the salt content shifts the

43
diffraction line to smaller angles, indicating that the distance between surfactant
domains increases with increasing salt content.
5 10 15 20 25 30 35 40
0
2000
4000
6000
8000
10000
(212)
Inte
nsit
y/c
ps
2 degree
b)
(110)
Figure 3.2.2: The POM image (a) and the high-angle diffraction patterns (b) of meso-
silica-CdY-1.14, 5 minutes after preparation at RT.
The mesophase
CdY crystals
a)

44
To check the stability of meso-silica-CdY-n film samples at high salt
concentrations, the POM image and the high-angle diffraction patterns of meso-silica-
CdY-1.14 have been recorded after 5 min aging at RT, Figure 3.2.2. Since the films are
too thin, a fan texture characteristic of 2D hexagonal mesostructure is difficult to
observe. However, formation and growth of the CdY crystals can be monitored using
the POM and thin films. The crystals cover the surface of the film and appear as sharp
texture under the POM. Most salt species leached out from the mesostructure in 5 min.
The wide-angle diffraction lines, in the XRD pattern of the samples, due to CdY salt
crystals also appear upon crystallization of the films (PDF card number:04-011-2154).
500 1000 1500 2500 3000 3500 4000
0.0
0.3
0.6
0.9
1.2
1.5
(1.43)
(1.14)
(0.86)
(0.57)
(0.29)
Ab
so
rba
nc
e/a
.u.
Wavenumber/cm-1
(0.0)
n
Figure 3.2.3: The FTIR spectra of meso-silica-CdY-n ( n is shown on the spectra) (1)
FTIR spectroscopy is also a useful tool to follow the changes in the samples
during aging at RT and high temperatures. The sharp peaks between 1250 and 1500 cm-
1 in the FTIR spectra of meso-silica-CdY-n belong to asymmetric stretching mode of
nitrate ions that are coordinated to Cd(II) ion, see Figure 3.2.3. Intensity of these peaks

45
increases with increasing salt content in the samples, Figure 3.2.3. At high salt content,
the nitrate peaks are very similar to the peaks in the molten CdY salt. Therefore, by
keeping the samples above the melting point of CdY salt, the mesostructure can be
stabilized for the synthesis of mesoporous silica-CdO films as in the preparation of
meso-silica-ZnX films.
3.3 Synthesis of the meso-silica-ZnO-n and meso-silica-CdO-n Thin Films
It is known from the optimization studies of the meso-silica-ZnX-n films in
which the mesostructure, at high salt concentrations, can be stabilized after spin coating
above the melting point of the salt. Interestingly, a slow calcination of the meso-silica-
ZnX-n starting from 55 o
C with an interval of 1oC/min up to 450
oC, immediately after
spin coating, forms transparent mesoporous films, denoted as meso-silica-ZnO-n
(where n is the Zn/Si mole ratio).
2 3 4
0
25000
50000
75000
100000
125000
150000
As prepared
250 oC
200 oC
150 oC
450 oC
100 oC
Temperatures
Inte
nsit
y/c
ps
2 degree
10 20 30 40 50 60
100
200
300
400
500
600
700
Inte
nsit
y/c
ps
2 degree
Figure 3.3.1: The small-angle XRD patterns of the meso-silica-ZnX-1.14 thin film
during calcination where temperature is shown on the patterns and the high angle XRD
patterns of the meso-silica-ZnO-1.14 (inset)

46
The small angle diffraction line loses its intensity at around 100-150 oC and it
completely vanishes at around 250 oC during the calcination step, see Figure 3.3.1. This
means that the calcination yields a completely disordered structure. More importantly,
there is no diffraction line due to ZnO crystals, indicating that bulk ZnO does not form
in the films during the calcination process, see Figure 3.3.1 (inset). It means that all salt
species decompose into ZnO on the silica pore-walls, where it cannot grow into bulk
large ZnO crystals.
1 2 3 4 5
0
2000
4000
6000
8000
10000
12000
14000
5 10 15 20 25 30 35 40
100
200
300
400
500
600
700
Inte
nsi
ty/c
ps)
2 degree
Inte
nsit
y/c
ps
2 degree
Figure 3.3.2: The small-angle XRD patterns of the meso-silica-CdO-1.14 thin film and
the high angle XRD patterns of the meso-silica-CdO-1.14 (inset)
The slow calcination of the meso-silica-CdY-n films starting from 65 o
C with an
interval of 1oC/min up to 450
oC, immediately after spin coating, forms transparent
mesoporous films denoted as meso-silica-CdO-n (where n is the Cd/Si mole ratio). Like
in the synthesis of the meso-silica-ZnO-n films, the calcination process causes loss of
meso-order in the films, as it is shown in the small angle diffraction pattern of the
meso-silica-CdO-1.14; see Figure 3.3.2. Also, there is no diffraction line due to bulk
CdO in the high angle XRD pattern. All salt species decompose into CdO on the silica
pore-walls and cannot grow into bulk CdO crystals. On the other hand, despite all,

47
above the salt/silica mole ratio of 1.43, the film samples leach out some of the salt
species and form bulk oxide upon calcination step in addition to meso-silica-CdO-x
(where x is Cd/Si mole ratio and in unknown).
0.0 0.2 0.4 0.6 0.8 1.0
0
100
200
300
400
500
600
meso-SiO2-ZnO-1.14
meso-SiO2-ZnO-0.86
Vo
lum
e A
ds
orb
ed
/cm
3/g
, S
TP
Relative Pressure/P/Po
meso-SiO2-ZnO-0.57
0.0 0.2 0.4 0.6 0.8 1.0
0
40
80
120
160
200
240
meso-SiO2-CdO-1.14
meso-SiO2-CdO-0.57
meso-SiO2-CdO-0.86
Vo
lum
e A
ds
orb
ed
/cm
3/g
, S
TP
Relative Pressure/P/Po
Figure 3.3.3: The N2 sorption isortherms of the meso-silica-ZnO-n (up) and the meso-
silica-CdO-n (down) samples where n values are shown on each plot(1)

48
To prove above proposal, whether the meso-silica-ZnO-n and mesoporous-
silica-CdO-n films have mesoporosity or not, the films were recording N2 adsorption-
desorption isotherms. At least 20 mg powder sample is needed for an accurate N2
adsorption-desorption measurements. Therefore, tens of meso-silica-ZnO-n and
mesoporous-silica-CdO-n film samples, which were coated over the glass slides, were
scraped to obtain needed amount of sample (one film coated on a glass slide is about 1
mg). Scraping the samples from the meso-silica-ZnO-0.29 and meso-SiO2-CdO-0.29
samples is very difficult. Therefore, N2 adsorption-desorption measurements are done
for only the meso-silica-ZnO-n and mesoporous-silica-CdO-n (where n is 0.57, 0.86, and
1.14) samples, see Figure 3.3.3. In all the N2 sorption isotherms, the hysteresis on the
adsorption and desorption branches shows that the meso-silica-ZnO-n and mesoporous-
silica-CdO-n (where n is 0.57, 0.86, and 1.14) samples have mesoporosity. These
isotherms are type IV isotherms and characteristic of the mesoporous materials.

49
0 50 100 150 200 250 300
0
1
2
3
4
Zn
O-0
.86
Zn
O-1
.14
ZnO-0.57
dv/d
D/c
m3/g
/A
Pore size/A
Meso
po
rou
s S
ilic
a
o
a)
0 50 100 150 200 250 300
0.0
0.5
1.0
1.5
2.0
2.5
Cd
O-1
.14
Cd
O-0
.86
Cd
O-0
.57
dv/d
D/c
m3/g
Pore Size/A
Meso
po
rou
s S
ilic
a
o
b)
Figure 3.3.4: The pore size distribution of the mesoporous-silica-ZnO-n (a) and
mesoporous-silica-CdO-n (b)where n values are shown on each plot(1)
50
The Brunauer-Emmett-Teller (BET) surface areas that are 430, 175, and 130
m2/g in the meso-silica-ZnO-n samples, where n is 0.57, 0.86, and 1.14, respectively,
decreases with increasing the ZnO content in the meso-silica-ZnO-n samples. The BET
surface areas of the mesoporous-silica-CdO-n, where n is 0.57, 0.86, and 1.14 are 85, 55,
and 50 m2/g , respectively. The same trend as in the meso-silica-ZnO-n samples is
observed in the meso-silica-CdO-n; increase in the metal oxide content decreases the
surface area. Note also that a calcined salt-free mesoporous silica film has a surface area
of 950 m2/g with a relatively narrow pore-size distribution centered at 2.1 nm, see Figure
3.3.4. The Barrett-Joyner-Halenda (BJH) pore-size distribution curves of the
mesoporous-silica-ZnO-n and mesoporous-silica-CdO-n samples become broader and
shift to higher values with increasing metal oxide content in the samples. For example,
the pore size distribution of the meso-silica-ZnO-1.14 is centered at 12.4 nm and starts
from 5 nm and tails up to 20 nm. The mesostructure, in the fresh sample, is distorted and
expanded during calcination process. During the calcination, above 150 oC, the order of
hexagonal mesostructure goes to a disordered mesostructure, and at the end of
calcination, completely disordered mesoporous silica-metal oxide samples having
expanded pores, especially in the high ZnO and CdO amounts, are formed. The decrease
in the surface area and increase in pore size distribution with increasing ZnO or CdO
content clearly show that the silica-ZnO or CdO walls of the mesoporous structure
becomes thicker in the samples .

51
500 1000 1500 2800 3200 3600
0.0
0.4
0.8
1.2
1.6
2.0
952 cm-1
450350
250
200
155
135
115
100
80
60
40
Ab
so
rba
nc
e/a
.u.
Wavenumber/cm-1
RT
T(oC)
CHNO3SiO2
Figure 3.3.5: The meso-silica-ZnX-1.14 during calcination at different temperature
(temperature is shown on the spectra) (1)
In order to elucidate the structural properties of the mesoporous silica-ZnO
film samples, the calcination step was monitored by recording the FT-IR absorption
spectra of meso-silica-ZnX-1.14 at different temperatures, see Figure 3.3.5. The
intensity of nitrate peaks starts gradually to decrease on heating the films at around 100
oC and the peaks completely disappear at around 250
oC. This means that all nitrates are
decomposed at around 250 oC. The peaks due to symmetric and antisymmetric
stretching modes of the surfactants are observed at around 2820 and 2920 cm-1
and their
intensities decline at around 200 oC and completely disappear at 250
oC. The peaks
between 1100 and 1220 cm-1
are assigned to the υ-SiO symmetric and antisymmetric
stretching modes and the peaks at around 952 cm-1
is due to silanol groups (SiO-H) of
silica framework. (106) The calcination causes changes on the υ-SiO and υ-SiO-H
stretching modes. The peak due to the υ-SiO-H stretching mode disappeared at 100 oC
and the peaks due to υ-SiO symmetric and antisymmetric stretching mode gradually
shifted to lower frequencies at higher temperatures. These changes are most probably

52
due to reaction between silanol groups and Zn(II) to form Si-O-Zn linkages. As
discussed previously, the nitrate ions are coordinated to Zn (II) ions and upon
calcination, they decompose. In addition to this, above 100 oC, there is no water
molecule, coordinated to Zn (II) ions. Furthermore, the silanol groups are very reactive
with transition metal ions. Therefore, the Zn(II) species react with silanol groups and
cause changes on the υ-SiO symmetric and asymmetric stretching frequencies, while the
υ-SiO-H stretching mode disappears. The FT-IR spectral changes are consistent with the
changes in the XRD patterns of meso-silica-ZnX-1.14 during calcination. The
decomposition of nitrates causes reaction between Zn(II) ions and silica framework and
a distortion on the silica-metal oxide framework. Fortunately, due to stability of the
surfactants up to 200 oC and solidification of the mesostructure by the polymerization of
the silica species together with Zn(II) ions, mesoporous thin film can be obtained upon
calcination. Yet, the calcined samples have disordered and non-uniform pore size
distribution.
400 800 1200 1600 2000
0.0
0.6
1.2
1.8
2.4
53
6 c
m-1
1.43
1.14
0.86
0.57
0
Ab
so
rban
ce/a
.u.
Wavenumber/cm-1
0.29
45
6 c
m-1
926 cm-1
(a)
n
400 800 1200 1600 2000
0.0
0.6
1.2
1.8
2.4
1.43
1.14
0.86
0.57
0.29
Ab
so
rban
ce/a
.u.
Wavenumber/cm-1
0
505 cm-1
91
4 c
m-1
(b)
n
Figure 3.3.6: FTIR spectra of (a) meso-silica-ZnO-n, (b) meso-silica-CdO-n (n is Zn or
Cd/SiO2 mole ratio) (1)

53
To further understand the calcination process, the FTIR spectra of the meso-
silica-ZnO-n and the meso-silica-CdO-n (n is 0, 29, 0.57, 0.86, 1.14, and 1, 43) were
recorded for all compositions and shown in Figure 3.3.6. Intensity of the peaks at around
926 cm-1
in the meso-silica-ZnO-n samples and at 914 and 864 cm-1
in the meso-silica-
CdO-n samples gradually increase with increasing metal oxide component of the
samples up to metal oxide/silica mole ratio of 1.14. The meso-silica-ZnO-1.43 and the
meso-silica-CdO-1.43 samples always formed bulk ZnO and CdO, respectively, together
with mesoporous framework that contains relatively low metal oxide. Therefore, the
peak due to υ-SiO stretching mode of the silica-metal oxide interface, Si-O-Zn and Si-O-
Cd, loses its intensity compared to its metal oxide content.
The peak of the mesoporous silica at 1080 cm-1
gradually shifts to lower
frequencies with increasing metal oxide content in the samples of meso-silica-ZnO-n
and meso-silica-CdO-n up to 1.14 mole ratio. A similar trend is also observed in the
peak at around 456 cm-1
due to bending mode of SiO2. The peaks at 538 and 505 cm-1
in
the spectra of meso-silica-ZnO-n and and meso-silica-CdO-n, respectively, gradually
increase in intensity with increasing metal oxide content. If some of ZnO or CdO form
bulk oxides, the shift is profoundly less. Therefore, the FT-IR spectroscopy and XRD
techniques can be complementarly used to better chracterize the samples.
Moreover, to the best of our knowledge, the mixed oxides, like MSixOy do not
exist. Therefore, the Si-O-M bond (M is Zn or Cd) should be in the interface between
the metal oxide nanoplates (see latter) and mesoporous silica framework.

54
20 30 40 50 60
0
4000
8000
12000
(c)
Inte
nsity
/cps
2
(a)
(b)
a-SiO2 ZnO
(100)
(002)
(101)
Figure 3.3.7: The XRD pattern of meso-silica-ZnO-0.86 at (a) 450oC, (b) 550
oC, and (c)
650oC. The common diffraction lines of ZnO are marked on the patterns(1)
Up to now, from the comprehensive analysis of the meso-silica-ZnO-n and
meso-silica-Cd-n samples using FTIR and N2 adsorption-desorption measurements, the
samples are mesoporous and contains silica-ZnO and silica-CdO pore-walls,
respectively. However, there is no information about the crystal structure of metal
oxides in the mesoporous structure because the wide-angle XRD patterns of the films,
obtained from the samples coated on the glass slides, are very broad with no definite
diffraction line. The XRD patterns of the samples require large amount of powder
samples. So, around 30 films coated on the glass slides were scraped to fill the XRD
powder sample holder. Figure 3.3.7 shows the XRD pattern of meso-silica-ZnO-0.86 at
450, 550, and 650
oC. The common diffraction lines correspond to (100), (002), and
(101) planes of wurtzite structure of ZnO are marked on the patterns. However, the wide
angle diffraction lines are so broad that they cannot be resolved due to being amorphous
or ultra-small nanocrystallites. The diffraction lines due to ZnO domains cannot be
resolved even by heating the samples at 550 and 650 oC, see Figure 3.3.7. Therefore, a

55
more sophisticated characterization tool is needed to determine the crystal structures of
ZnO or CdO in the samples.
The UV-Vis absorption spectra of both meso-silica-ZnO-n and meso-SiO2-
CdO-n samples were recorded using the films coated over quartz slides, see Figure 3.3.8.
The samples only absorb in the UV region. Note that, the films are crack-free and
transparent. The intensity of absorption band gradually increases with increasing ZnO
content in the films.
1.8 2.4 3.0 3.6 4.2 4.8 5.4 6.0
0.0
0.5
1.0
1.5
2.0
2.5
1.14
0.86
0.57
Ab
so
rban
ce/a
.u.
Energy/eV
0.29
(a)
2 3 4 5 6
0
1
2
3
4
(b)
n
Ab
so
rban
ce/a
.u.
Energy/eV
1.14
0.86
0.570.29
Figure 3.3.8: (a) UV-Vis absorption spectra of meso-silica-ZnO-n (1) (b) of meso-silica-
CdO-n (n is shown on the spectra)

56
2 3 4 5 60
20
40
60
80
1001.14 0.86
0.57
Ab
so
rban
ce
2*E
nerg
y2
Energy/eV
3.37 eV Bulk Band Gap
0.29
(a)
ZnO/SiO2 Band
Mole Ratio Gap (eV)
1.14 4.89
0.86 5.38
0.57 5.66
0.29 5.85
2 3 4 5 6
0
100
200
300
400
500
Ab
so
rban
ce
2*E
nerg
y2
Energy/eV
0.29
0.57
0.86
1.14
Bu
lk B
an
d G
ap
= 2
.27
eV
(b)
CdO/SiO2 Band
Mole Ratio Gap (eV)
1.14 4.90
0.86 5.38
0.57 5.62
0.29 6.00
Figure 3.3.9: Direct gap fitting of UV-Vis absorption spectra of (a) meso-silica-ZnO-n
(n is the ZnO/SiO2 mole ratio, inset is a table of composition (ZnO/SiO2 mole ratio) and
band-gap values (eV)) and (b) meso-silica-CdO-n (n is the CdO/SiO2 mole ratio, inset is
a table of composition (CdO/SiO2 mole ratio) and band-gap values (eV)). (1)
In order to find the band gap and also calculate the particle size, the UV-Vis
absorption spectra of films were re-plotted using direct gap relationship in which, the y-
axis is the square of absorbance times energy and x-axis is the energy, see Figure 3.3.8.
The bulk band gap of ZnO is 3.37 eV. (107) Compared to bulk oxide, the highest blue
shift is 2.48 eV for the meso-silica-ZnO-0.29 film and lowest blue shift is 1.52 eV from
the meso-silica-ZnO-1.14. The bulk band gap of CdO is 2.84 eV. The highest blue shift
is 3.77 eV from the meso-silica-CdO-0.29 film and lowest blue shift is 2.63 eV for the
meso-silica-CdO-1.14. The band gaps of both meso-silica-ZnO-n and meso-silica-CdO-
n are listed in the insets of Figure 3.3.8. The blue-shift, observed in both meso-silica-
ZnO-n and meso-silica-CdO-n films are due to the quantum confinement effect. It is
well known that a decrease in particle size of a semiconductor increases the band gap.
The particle size of both CdO and ZnO in the mesostructure can be calculated using an
effective mass model (EMM). (108) This model is formulated in equation 3.3.1;
E(R) = E
g + ћ
2
2
/2R2
x (1/me + 1/m
h) – 1.8e
2
/4є0єR Eq 3.3.1.

57
where Eg is the bulk band gap (eV), r is particle size (Å), h (ћ = h/2) is the Planck` s
constant, me is the effective mass of electron, mh is the effective mass of hole, m0 is the
free electron mass (9.110x10⁻³¹
kg), є0 is the permittivity of free space (8.85418782x10-
12 C
2N
-1m
-2), є is the dielectric constant, e is the charge on the electron (1.602176x10
-19
C).
0.2 0.4 0.6 0.8 1.0 1.2
1.3
1.4
1.5
1.6
1.7
Th
ickn
ess
/nm
n/MO/SiO2 Mole Ratio
CdO
ZnO
Figure 3.3.10: The plots of the thickness of ZnO and CdO in the meso-silica-MO-n
versus n(1)
The thickness of ZnO and CdO, calculated using effective-mass model, in the
meso-silica-ZnO-n and meso-silica-CdO-n films versus n are plotted in Figure 3.3.10.
Thickness of the ZnO or CdO increases with increasing metal content of the samples,
Figure 3.3.10. The particle size of ZnO for meso-silica-ZnO-n films alters between 1.4
and 1.7 nm. This means that the ZnO nanoparticles are very small and have a few layer
of zinc oxide in the silica framework or over silica-walls. The particle size of CdO
domains are calculated to be in the range between 1.3 and 1.6 nm.

58
Figure 3.3.10
10 nm10 nm5 0 n m5 0 n m
Figure 3.3.11: The SEM images of meso-silica-ZnO-1.14 (a, b), TEM images of meso-
silica-ZnO-n, n is (c) 0.86, (d)1.14, and (e) 0.57 (inset is the yellow line showing the
spacings between the lines), and (f) FFT of a crystalline domain(1).

59
To further understand the structural details of the films, a series of TEM and
SEM images have also been collected and analyzed from some of the meso-silica-ZnO-n
and meso-silica-CdO-n samples. The samples for TEM imaging were well grinded in a
mortar and diluted in ethanol and dispersed by sonication to get very small particles on a
TEM grid. The SEM images of the meso-silica-ZnO-1.14 sample, in Figure 3.3.10 (a)
and (b), clearly show that the sample has sponge like mesoporosity. The pores are
disordered and have relatively large pore size distribution. The TEM images of the
meso-silica-ZnO-n, n is 0.86, 1.14, and 0.57 are shown in Figure 3.3.10 (b), (c) and (d),
respectively. Due to contrast difference between silica and ZnO domains, ZnO domains
are darker than silica domains. In the high resolution TEM images, Figure 3.3.10 (e),
lattice fringes of ZnO crystals can be observed. By taking the Fast Fourier Transform
(FFT) of a selected ZnO nanocrystal in the image, the lattice spacing are calculated, see
Figure 3.3.10 (f). The observed lattice spacings of 0.281, 0.260, and 0.162 nm are due
to the (100), (002), and (110) lattice planes of the ZnO nanocrystallites in wurtzite
structure, where the unit cell parameters, a and c are 0.325 and 0.520 nm, respectively,
and consistent with bulk ZnO values. In addition, the particle size range between 1.4 and
1.7 nm, calculated from the UV-Vis spectra data is also consistent with the size of these
domains, observed in the TEM images. Figure 3.3.10 (e) clearly shows that the particle
size is around 1.6 nm for the meso-silica-ZnO-0.57 sample.

60
5 nm5 nm
Figure 3.3.12:The TEM images of the meso-silica-CdO-n, n is (a, b) 0.57, (c) 0.86
and (d) 1.14.(e) HRTEM image of the meso-silica-CdO-0.86 and the FFT (f) and
inverse FFT (g) of the marked region of (e). (1)

61
Figure 3.3.12 shows the TEM images of the meso-silica-CdO-n smaples,
where n is 0.57, 0.86, and 1.14. The TEM images show that the samples are sponge-like
mesoporous. Like in the meso-silica-ZnO-n samples, darker domains are due to
crystalline CdO particles, see Figure 3.3.11 (b), (c) and (d). In the high resolution TEM
images, Figure 3.3.11 (e), the CdO domains are nanocrystalline, and display lattice
fringes. The FFT and its inverse FFT of the selected region in the TEM image display
lattice spots, corresponding to lattice planes with 0.332, 0.271, and 0.235 nm spacings.
They are due to (110), (111), and (200) planes, respectively, of cubic CdO, where the
unit cell constant, a, is 0.469 nm.
The high resolution TEM images of the meso-silica-CdO-1.14 sample also
show 15 nm nanocrystalline domains, see Figure 3.3.11 (e). However, Figure 3.3.12 (b)
shows CdO nanocrystals with a 1.6 nm thicknesses, which is more consistent with the
UV-Vis data. If the CdO nanocrystals have confinement at least in one-dimension like
in nanoplates, the QCE is observed only on thickness axis of the CdO nanoparticles.
Therefore, CdO particles are like nanoflakes (or nanoplates), and the blue shift in the
UV-Vis spectra caused by the quantum confinement effect in one-dimension.
Furthermore, in both TEM images of the meso-silica-CdO-n and the meso-
silica-ZnO-n, the location of the CdO and ZnO domains, respectively, are not well
understood. The darker domains, corresponding to metal oxide, exist as rings and follow
each other. However, it is difficult to understand whether metal oxide nanoparticles coat
the silica walls or are homogeneously embedded in the silica walls.

62
Figure 3.3.13: The meso-silica-CdO-0.86 film upon HF etching; (a) TEM image
of (b) FFT of a large area, (c) SAED pattern, (d) magnified TEM image. (1)

63
In order to clear the ambiguity about the morphology of nanocrystals of ZnO
and CdO in the mesostructure, the silica walls of the meso-silica-CdO-0.86 film is
etched by using a 4% aqueous HF solution. The selected area diffraction pattern (SAED)
of the etched samples prove that the CdO nanocrystals have a face centered cubic crystal
structure, in which the intense diffraction rings are originating from the (200) and (220)
planes of cubic CdO nanocrystallites, see Figure 3.3.13 (c). The FFT of a large area
TEM image displays two rings, corresponding to the (200) and (220) planes of cubic
CdO crystals. The particles after etching look like nanoflakes as large as 10 to 15 nm. It
is difficult to observe the particle thickness. To be consistent and in not conflict with the
UV-Vis data, the thickness of the particles must be around 1.6 nm. This can only be
explained by the fact that the CdO particles are in the form of nanoplates. The quantum
confinement effect is observed in just one dimension, along the thickness axis of the
metal oxide nanoplates.

64
In order to solve second ambiguity about the structural composition of silica-
metal oxide walls, the meso-silica-CdO-0.86 is reacted with a H2S or H2Se gases at
room temperature to convert CdO nanoplates into CdS or CdSe nanoplates. After
reaction of meso-silica-CdO-0.86 with H2S or H2Se gas, the samples were denoted as
meso-silica-CdS-0.86 and meso-silica-CdSe-0.86, respectively. The samples, before and
after reactions, were analyzed by using FTIR spectroscopy, Figure 3.3.14 (a) and (b).
The peaks at 914 cm -1
corresponding to Si-O-Cd bonds in the FTIR spectrum of the
1.5 2.0 2.5 3.0 3.5 4.0
0
500
1000
1500
2000
2500
Inte
ns
ity
/a.u
.
Energy/KeV
Si
S Cd
after HF
meso-SiO2-CdS-0.86
(c)
1 2 3 4 5
0
300
600
900
Inte
nsit
y/a
.u.
Energy/keV
meso-CdSe
bulk-CdSe
Se
Cd
(d)
400 600 800 1000 1200 1400 1600 1800 2000
0.0
0.1
0.2
0.3
0.4
0.5
0.6
0.7
Ab
so
rban
ce/a
.u.
Wavenumber/cm-1
meso-SiO2
(I)
(II)
(III)
(a)
400 600 800 1000 1200 1400 1600 1800 2000
0.0
0.1
0.2
0.3
0.4
0.5
0.6
Ab
so
rban
ce/a
.u.
Wavenumber/cm-1
(I)
(II)
(b)
Figure 3.3.14 The FTIR spectra of (a) (I) pure meso-SiO2 and before H2Se reaction (II)
and after H2Se reaction of meso-silica-CdO-0.86, (b) before H2S reaction (I) and after (II)
H2S reaction of meso-silica-CdO-0.86, The EDS spectra of (c) meso-silica-CdS-0.86 and
(d) meso-silica-CdSe-0.86 thin films. (1)

65
meso-silica-CdO-0.86 disappear after reactions under H2S or H2Se gases. Moreover, the
spectra of the meso-silica-CdS-0.86 and the meso-silica-CdSe-0.86 are like pure
mesoporous silica. This is due to the fact that all Si-O-Cd bonds break through H2S or
H2Se reactions. The full conversion of the cadmium oxide to cadmium sulfide or to
cadmium selenide was ensured using the EDS data, see Figure 3.3.12. The S/Cd and
Se/Cd intensity ratios in the EDS data are the same as commercial bulk CdS and CdSe.
In conclusion, the full conversion of the cadmium oxide nanoplates to cadmium sulfide
or to cadmium selenide nanoplates proves that the metal oxide nanoplates coat the silica
walls: they are not embedded in the silica walls.
meso-silica-CdO-n
n (CdO/SiO2 Mole Ratio)
Surface Area
meso-SiO2-CdO-n
(m2/g)
Surface area for
1 g of CdO (m2/g)
% Surface
Coverage
1.14 50 70 113
0.86 55 85 101
0.57 85 154 58
meso-silica-ZnO-n
n (ZnO/SiO2 Mole Ratio)
Surface Area
meso-SiO2-CdO-n
m2/g)
Surface area for
1 g of CdO (m2/g)
% Surface
Coverage
1.14 130 214 49
0.86 175 325 37
0.57 430 948 13
Table 3.3-1: Parameter for surface coverage calculated from measured data.
Therefore, the CdO and ZnO nanoplates coat the surface of silica walls in the
films and the number of Si-O-M bond, where M is Zn or Cd increases by increasing
metal oxide content in the samples. The surface coverage of silica wall with metal oxide
nanoplates can be calculated hypothetically by using UV-Vis and the N2 sorption data.
The mass of metal oxide in 1 g sample can be calculated using the CdO/SiO2 mole

66
ratios. Also, volumes of metal oxide nanoplates can be calculated using the densities of
ZnO and CdO and their thickness. The thickness of metal oxide nanoplates is known
from UV-Vis data for each sample. Therefore, the surface area of metal oxides
nanoplates can easily be calculated by dividing a volume of metal oxide with a specific
thickness. If the surface of silica walls is completely covered with metal oxide
nanoplates, this hypothetically calculated surface should be the surface area measured by
the N2 sorption measurements. The percent coverage of silica walls can be calculated
from the percentage ratios of measured and calculated surface areas. Table 3.3.1 shows
the calculated and measured surface areas and also the coverage of silica surface with
nanoplates of metal oxides for meso-silica-ZnO-n and meso-silica-CdO-n, where n is
1.14, 0.86, and 0.57. From these calculations, it is reasonable to conclude that a full
coverage of the silica surface was achieved in the meso-SiO2-CdO-0.86 sample, but
even in meso-silica-ZnO-1.14, the surface coverage is about 50%,

67
4 CONCLUSION
The salt-surfactant LLC mesophase concept and the EISA method have been
successfully combined to form the mesostructured silica-ZnX or CdY films up to a 1.14
salt/silica mole ratio. Herein, two solvent systems have been employed; the primary
solvent is the molten salt that does not evaporate during spin coating and is converted to
metal oxide nanoplates during calcination, the second solvent is water, which
evaporates during spin coating. Two solvent systems provide our method distinguishes
from the EISA method. Therefore, we called this novel method for the synthesis
mesoporous silica-metal oxide films as molten salt assisted self-assembly (MASA).
In order to employ MASA successfully, there is one very critical prerequisite; the films
should be kept above the melting point of salt after spin coating to get stable
mesostructured films. Otherwise, most of salt species leach out from the mesostructure,
giving bulk metal oxide upon calcination. Also, using transition metal salt having low
melting point is very critical. Because of this, metal nitrate salts [Zn(H2O)6](NO3)2 and
[Cd(H2O)4](NO3)2), which have melting points very close to RT, are chosen for this
investigation. A slow calcination gives uniformly coated 1.4-1.7 nm thick crystalline
metal oxide nanoplates on the pore walls of mesoporous silica films. By MASA
method, the loading of metal oxide nanoplates in both the meso-silica-ZnO-n and the
meso-silica-CdO-n films can be increased up to 1.14 Zn or Cd(II)/silica mole ratios.
This leads to ~100 and ~50 % surface coverage of the silica walls in the meso-SiO2-
CdO-n and meso-SiO2-ZnO-n thin films, respectively. Pure metal oxide nanoplates
without silica framework can also be obtained by etching the silica walls using dilute
HF solution. The meso-SiO2-CdO-n films under a H2S or H2Se atmosphere can be
converted to meso-SiO2-CdS-n and meso-SiO2-CdSe-n film, in which all CdO
nanoplates are converted to CdS and CdSe nanoplates, respectively. The MASA
method is not limited to the mesoporous silica-CdO and ZnO thin films, other transition
metal salts or alkali earth metal salts can be used. Also, the MASA method is not
limited to silica frameworks; for example, it can also be employed for the synthesis of
mesoporous titania-metal oxide films (see future section).

68
The MASA method has many advantages compared to other methods such as
nano-casting, solid-state grinding and EISA methods for the synthesis of mesoporous
ZnO and CdO thin films. First advantage is that the MASA process is one-step and
facile synthesis method for the preparation of mesoporous silica-metal oxide thin films.
Nano-casting and solid-state grinding methods are time consuming due to several long
steps. These methods are limited and only employed for the synthesis of powders.
Second advantage is that no extra conditions such as humidity, aging, etc., are required
in the MASA method. Third advantage is the uniform distribution of metal oxide
nanoparticles inside the pores without pore blocking. Final advantage is that the
maximum loading can be increased up to 61 and 71 w/w% in the meso-SiO2-ZnO-n and
meso-SiO2-CdO-n, respectively. The surface coverage can also be adjusted up to
~100 % and ~50 % of silica walls in the meso-SiO2-CdO-n and meso-SiO2-ZnO-n thin
films, respectively.
Therefore, MASA is a new self-assembly process with many advantages and can
be employed to produce mesoporous mixed oxide thin films for thin film applications.

69
5 FUTURE WORK
5.1 The Preparation of meso-titanina-ZnX-n Thin Films
To show the MASA method is not limited to silica, we have changed the silica
with titania. In this work, mesostructured salted-titania films were prepared and
investigated towards stable and desired mesoporous titania-ZnO. The films were
prepared by spin coating a clear solution of CTAB, C12EO10, ZnX,, HNO3, and
Ti(OBu)4 in ethanol. Compared to MASA method in the synthesis of meo-silica-ZnX-n
thin films, ethanol has to be used instead of water with an adequate amount of HNO3
acid, in order to prevent the uncontrolled condensation of titania precursor. Note that
Ti(OBu)4 is quite reactive to water. Therefore, MASA method has been modified by
changing the polymerizing precursor, solvent and pH to prepare mesostructured ZnX-
titania films. The experimental procedure of MASA process is the same with the
protocol for the synthesis of meso-silica-ZnO-n films. As-prepared mesostructured
ZnX-titania films are denoted as meso-titania-ZnX-n, where n is the Zn/Ti mole ratio.
Three samples with n of 0.29, 0,57 and 0,86 has been prepared.
1.0 1.5 2.0 2.5 3.0
0
20000
40000
60000
80000
Inte
ns
ity
/cp
s
2
Figure 5.1.1 small-angle XRD pattern of as-prepared meso-titania-ZnX-0.86

70
Small-angle XRD pattern of the as-prepared meso-titania-ZnX-0.86 display a
diffraction line at 1.56o, 2 (5.6 nm, d-spacing) corresponds to (100) plane of 2D
hexagonal mesostructure, Figure 5.1.1. This proves that the MASA method can be
applied to synthesize mesoporous titania-ZnO films. Because, as in the synthesis of
meso-silica-ZnO-n thin films, the molten ZnX salt can also be confined between the
titania and surfactant domains. This is a perquisite to obtain a mesoporous materials
upon calcination. Note that keeping the samples above the melting point of salt is very
important for the MASA process. Therefore, the fresh as-prepared films have been kept
in an oven above the melting point of salt before calcination.
5.2 The Synthesis of meso-titania-Zn2TiO4 Thin Films
0.0 0.2 0.4 0.6 0.8 1.0
0
30
60
90
120
150
Vo
lum
e A
ds
orb
ed
, c
m3/g
Relative Pressure, P/Po
(I)
(II)
(III)
Figure 5.2.1 N2 sorption isotherms of meso-titania-Zn2TiO4 with a Zn/Ti mole ratio of
(I) 0.29, (II) 0.57, and (III) 0.89.
As-prepared meso-titania-ZnX-n thin films have been calcined from 60 to 450 oC
with an interval of 1 oC/min, and the product is dumped as meso-titania-Zn2TiO4. The
calcined films have been further characterized by using XRD and N2 sorption
measurements. The N2 sorption data display type IV isotherms, characteristic of
mesoporous materials, see Figure 5.2.1.

71
To find the structural detail of mesoporous calcined films, the XRD patterns of
calcined meso-titania-ZnO-0.86 sample, which was heated at different temperatures,
have been recorded, Figure 5.2.2. The wide angle XRD pattern of meso-titania-Zn2TiO4-
0.86 powders, obtained by scraping around 20 thin films displays broad diffraction
lines at 30.0, 34.7, 42.7, 53.5, 56.5, 62, and 72.4o, 2, corresponding to the (220), (311),
(400), (422), (511), (440), and (533) planes, respectively, of nanocrystalline Zn2TiO4.
The particle size increases with heating samples, but the meso-Zn2TiO4 is stable up to
650 oC, see Figure 5.2.2. Note that the sharp diffraction lines corresponding to ZnO bulk
oxide was not observed in the XRD pattern.
20 30 40 50 60 70 80
0
600
1200
1800
(622)
(620)
(440)(511)
(422)oo
oo
oo
o
450oC
550oC
650oC
Inte
nsit
y/c
ps
2
o(220)
(311)
(400)
Figure 5.2.2 . The wide angle XRD pattern of meso-titania-Zn2TiO4-0.86 powders
heated at different temperature (the temeperature are shown in the graph.)
The data of XRD and N2 sorption measurements ensures that MASA method is
applicable for the synthesis of mesoporous titania-metal oxide samples. Although the
mesoporosity can successively be formed by the MASA method, the composition of the

72
pore-walls is quite different from that of silica. These two metals, titanium and zinc,
form mixed oxide, zinc titanate, rather than titania-ZnO as in the silica system. The
MASA method can be further adopted to obtain other metal titanates, possibly mixed
metal titanates.

73
6 REFERENCES
1. C. Karakaya, Y. Turker, C. Albayrak, O. Dag, Assembly of Molten
Transition Metal Salt–Surfactant in a Confined Space for the Synthesis of
Mesoporous Metal Oxide-Rich Metal Oxide–Silica Thin Films. Chemistry of
Materials 23, 3062 (2011/06/28, 2011).
2. L. B. McCusker, F. Liebau, G. Engelhardt, Nomenclature of structural and
compositional characteristics of ordered microporous and mesoporous
materials with inorganic hosts - (IUPAC recommendations 2001). Pure
Appl. Chem. 73, 381 (Feb, 2001).
3. G. Schrimpf, M. Schlenkrich, J. Brickmann, P. Bopp, Molecular dynamics
simulation of zeolite NaY: a study of structure, dynamics, and
thermalization of sorbates. The Journal of Physical Chemistry 96, 7404
(1992/09/01, 1992).
4. T. T. Moore, W. J. Koros, Non-ideal effects in organic–inorganic materials
for gas separation membranes. Journal of Molecular Structure 739, 87
(2005).
5. A. Corma, V. Fornes, S. B. Pergher, T. L. M. Maesen, J. G. Buglass,
Delaminated zeolite precursors as selective acidic catalysts. Nature 396, 353
(Nov, 1998).
6. A. Farkas, M. Rozic, Z. Barbaric-Mikocevic, Ammonium exchange in
leakage waters of waste dumps using natural zeolite from the Krapina
region, Croatia. J. Hazard. Mater. 117, 25 (Jan, 2005).
7. K. Egeblad, C. H. Christensen, M. Kustova, C. H. Christensen, Templating
Mesoporous Zeolites†. Chemistry of Materials 20, 946 (2008/02/01, 2007).
8. T. Yanagisawa, T. Shimizu, K. Kuroda, C. Kato, THE PREPARATION OF
ALKYLTRIMETHYLAMMONIUM-KANEMITE COMPLEXES AND
THEIR CONVERSION TO MICROPOROUS MATERIALS. Bull. Chem.
Soc. Jpn. 63, 988 (Apr, 1990).
9. C. T. Kresge, M. E. Leonowicz, W. J. Roth, J. C. Vartuli, J. S. Beck,
ORDERED MESOPOROUS MOLECULAR-SIEVES SYNTHESIZED BY
A LIQUID-CRYSTAL TEMPLATE MECHANISM. Nature 359, 710 (Oct,
1992).
10. J. S. Beck et al., A new family of mesoporous molecular sieves prepared
with liquid crystal templates. Journal of the American Chemical Society 114,
10834 (1992/12/01, 1992).
11. P. Selvam, S. K. Bhatia, C. G. Sonwane, Recent Advances in Processing and
Characterization of Periodic Mesoporous MCM-41 Silicate Molecular

74
Sieves. Industrial & Engineering Chemistry Research 40, 3237 (2001/07/01,
2001).
12. P. Feng, X. Bu, G. D. Stucky, D. J. Pine, Monolithic Mesoporous Silica
Templated by Microemulsion Liquid Crystals. Journal of the American
Chemical Society 122, 994 (2000/02/01, 1999).
13. Q. Huo et al., Generalized synthesis of periodic surfactant/inorganic
composite materials. Nature 368, 317 (1994).
14. D. Zhao et al., Novel Mesoporous Silicates with Two-Dimensional
Mesostructure Direction Using Rigid Bolaform Surfactants. Chemistry of
Materials 11, 2668 (1999/10/01, 1999).
15. D. Zhao et al., Continuous Mesoporous Silica Films with Highly Ordered
Large Pore Structures. Advanced Materials 10, 1380 (1998).
16. D. Zhao et al., Triblock Copolymer Syntheses of Mesoporous Silica with
Periodic 50 to 300 Angstrom Pores. Science 279, 548 (January 23, 1998,
1998).
17. D. Zhao, Q. Huo, J. Feng, B. F. Chmelka, G. D. Stucky, Nonionic Triblock
and Star Diblock Copolymer and Oligomeric Surfactant Syntheses of Highly
Ordered, Hydrothermally Stable, Mesoporous Silica Structures. Journal of
the American Chemical Society 120, 6024 (1998/06/01, 1998).
18. Q. Huo, D. I. Margolese, G. D. Stucky, Surfactant Control of Phases in the
Synthesis of Mesoporous Silica-Based Materials. Chemistry of Materials 8,
1147 (1996/01/01, 1996).
19. Q. Huo et al., Organization of Organic Molecules with Inorganic Molecular
Species into Nanocomposite Biphase Arrays. Chemistry of Materials 6,
1176 (1994/08/01, 1994).
20. G. S. Attard, J. C. Glyde, C. G. Goltner, Liquid-crystalline phases as
templates for the synthesis of mesoporous silica. Nature 378, 366 (1995).
21. K. J. Edler, P. A. Reynolds, A. S. Brown, T. M. Slawecki, J. W. White,
Shear and salt effects on the structure of MCM-41 synthesis gels. J. Chem.
Soc.-Faraday Trans. 94, 1287 (May, 1998).
22. A. Firouzi, D. J. Schaefer, S. H. Tolbert, G. D. Stucky, B. F. Chmelka,
Magnetic-field-induced orientational ordering of alkaline lyotropic silicate -
surfactant liquid crystals. Journal of the American Chemical Society 119,
9466 (Oct, 1997).

75
23. V. R. Tirumala et al., Mesoporous Silica Films with Long-Range Order
Prepared from Strongly Segregated Block Copolymer/Homopolymer Blend
Templates. Chemistry of Materials 19, 5868 (2007/11/01, 2007).
24. N. Nishiyama, S. Tanaka, Y. Egashira, Y. Oku, K. Ueyama, Enhancement of
Structural Stability of Mesoporous Silica Thin Films Prepared by Spin-
Coating. Chemistry of Materials 14, 4229 (2002/10/01, 2002).
25. C. J. Brinker, Y. Lu, A. Sellinger, H. Fan, Evaporation-Induced Self-
Assembly: Nanostructures Made Easy. Advanced Materials 11, 579 (1999).
26. D. Grosso et al., Fundamentals of Mesostructuring Through Evaporation-
Induced Self-Assembly. Advanced Functional Materials 14, 309 (2004).
27. Zheng, M. Suzuki, T. Inoue, Phase Behavior of an Aqueous Mixture of
Octaethylene Glycol Dodecyl Ether Revealed by DSC, FT-IR, and 13C
NMR Measurements. Langmuir 18, 1991 (2002/03/01, 2002).
28. N. A. Melosh, P. Davidson, B. F. Chmelka, Monolithic Mesophase Silica
with Large Ordering Domains. Journal of the American Chemical Society
122, 823 (2000/02/01, 2000).
29. N. A. Melosh et al., Molecular and Mesoscopic Structures of Transparent
Block Copolymer−Silica Monoliths. Macromolecules 32, 4332 (1999/06/01,
1999).
30. D. Grosso et al., Two-Dimensional Hexagonal Mesoporous Silica Thin
Films Prepared from Block Copolymers: Detailed Characterization and
Formation Mechanism. Chemistry of Materials 13, 1848 (2001/05/01, 2001).
31. A. Gibaud et al., Evaporation-Controlled Self-Assembly of Silica Surfactant
Mesophases. The Journal of Physical Chemistry B 107, 6114 (2003/06/01,
2003).
32. Y. Lu et al., Aerosol-assisted self-assembly of mesostructured spherical
nanoparticles. Nature 398, 223 (1999).
33. G. Soler-Illia et al., Mesoporous hybrid and nanocomposite thin films. A
sol–gel toolbox to create nanoconfined systems with localized chemical
properties. Journal of Sol-Gel Science and Technology 57, 299 (2011).
34. A. Taguchi, F. Schüth, Ordered mesoporous materials in catalysis.
Microporous and Mesoporous Materials 77, 1 (2005).
35. M. Hartmann, Ordered Mesoporous Materials for Bioadsorption and
Biocatalysis. Chemistry of Materials 17, 4577 (2005/09/01, 2005).

76
36. M. A. Carreon, V. V. Guliants, Ordered Meso- and Macroporous Binary and
Mixed Metal Oxides. European Journal of Inorganic Chemistry 2005, 27
(2005).
37. M. H. Bartl, S. W. Boettcher, E. L. Hu, G. D. Stucky, Dye-Activated Hybrid
Organic/Inorganic Mesostructured Titania Waveguides. Journal of the
American Chemical Society 126, 10826 (2004/09/01, 2004).
38. S. W. Boettcher, J. Fan, C.-K. Tsung, Q. Shi, G. D. Stucky, Harnessing the
Sol–Gel Process for the Assembly of Non-Silicate Mesostructured Oxide
Materials. Accounts of Chemical Research 40, 784 (2007/09/01, 2007).
39. P. Yang, D. Zhao, D. I. Margolese, B. F. Chmelka, G. D. Stucky,
Generalized syntheses of large-pore mesoporous metal oxides with
semicrystalline frameworks. Nature 396, 152 (1998).
40. P. Yang, D. Zhao, D. I. Margolese, B. F. Chmelka, G. D. Stucky, Block
Copolymer Templating Syntheses of Mesoporous Metal Oxides with Large
Ordering Lengths and Semicrystalline Framework. Chemistry of Materials
11, 2813 (1999/10/01, 1999).
41. P. C. A. Alberius et al., General Predictive Syntheses of Cubic, Hexagonal,
and Lamellar Silica and Titania Mesostructured Thin Films§. Chemistry of
Materials 14, 3284 (2002/08/01, 2002).
42. J. Haetge, P. Hartmann, K. Brezesinski, J. Janek, T. Brezesinski, Ordered
Large-Pore Mesoporous Li4Ti5O12 Spinel Thin Film Electrodes with
Nanocrystalline Framework for High Rate Rechargeable Lithium Batteries:
Relationships among Charge Storage, Electrical Conductivity, and
Nanoscale Structure. Chemistry of Materials 23, 4384 (2011/10/11, 2011).
43. T. Brezesinski et al., Self-Assembly and Crystallization Behavior of
Mesoporous, Crystalline HfO2 Thin Films: A Model System for the
Generation of Mesostructured Transition-Metal Oxides. Small 1, 889 (2005).
44. K. Cassiers et al., Surfactant-Directed Synthesis of Mesoporous Titania with
Nanocrystalline Anatase Walls and Remarkable Thermal Stability. The
Journal of Physical Chemistry B 108, 3713 (2004/03/01, 2004).
45. P. C. Angelomé, G. J. d. A. A. Soler-Illia, Organically Modified Transition-
Metal Oxide Mesoporous Thin Films and Xerogels. Chemistry of Materials
17, 322 (2005/01/01, 2004).
46. J. C. Yu, L. Zhang, Z. Zheng, J. Zhao, Synthesis and Characterization of
Phosphated Mesoporous Titanium Dioxide with High Photocatalytic
Activity. Chemistry of Materials 15, 2280 (2003/06/01, 2003).

77
47. Wu et al., Hollow Spheres Based on Mesostructured Lead Titanate with
Amorphous Framework. Langmuir 19, 1362 (2003/02/01, 2003).
48. M. Mamak, N. Coombs, G. Ozin, Self-Assembling Solid Oxide Fuel Cell
Materials: Mesoporous Yttria-Zirconia and Metal-Yttria-Zirconia Solid
Solutions. Journal of the American Chemical Society 122, 8932
(2000/09/01, 2000).
49. B. Sun et al., Synthesis of Mesoporous α-Fe2O3 Nanostructures for Highly
Sensitive Gas Sensors and High Capacity Anode Materials in Lithium Ion
Batteries. The Journal of Physical Chemistry C 114, 18753 (2010/11/11,
2010).
50. A. K. Sinha, K. Suzuki, Three-Dimensional Mesoporous Chromium Oxide:
A Highly Efficient Material for the Elimination of Volatile Organic
Compounds. Angewandte Chemie 117, 275 (2005).
51. S. Banerjee, A. Santhanam, A. Dhathathreyan, P. M. Rao, Synthesis of
Ordered Hexagonal Mesostructured Nickel Oxide. Langmuir 19, 5522
(2003/06/01, 2003).
52. J. Deng et al., Ultrasound-Assisted Nanocasting Fabrication of Ordered
Mesoporous MnO2 and Co3O4 with High Surface Areas and Polycrystalline
Walls. The Journal of Physical Chemistry C 114, 2694 (2010/02/18, 2010).
53. G. S. Armatas, A. P. Katsoulidis, D. E. Petrakis, P. J. Pomonis, M. G.
Kanatzidis, Nanocasting of Ordered Mesoporous Co3O4-Based
Polyoxometalate Composite Frameworks. Chemistry of Materials 22, 5739
(2010/10/26, 2010).
54. C. West, R. Mokaya, Nanocasting of High Surface Area Mesoporous Ga2O3
and GaN Semiconductor Materials. Chemistry of Materials 21, 4080
(2009/09/08, 2009).
55. P. Ji, J. Zhang, F. Chen, M. Anpo, Ordered Mesoporous CeO2 Synthesized
by Nanocasting from Cubic Ia3d Mesoporous MCM-48 Silica: Formation,
Characterization and Photocatalytic Activity. The Journal of Physical
Chemistry C 112, 17809 (2008/11/20, 2008).
56. M. Tiemann, Repeated Templating†. Chemistry of Materials 20, 961
(2008/02/01, 2007).
57. J.-H. Smått, C. Weidenthaler, J. B. Rosenholm, M. Lindén, Hierarchically
Porous Metal Oxide Monoliths Prepared by the Nanocasting Route.
Chemistry of Materials 18, 1443 (2006/03/01, 2006).

78
58. B. Tian et al., General Synthesis of Ordered Crystallized Metal Oxide
Nanoarrays Replicated by Microwave-Digested Mesoporous Silica.
Advanced Materials 15, 1370 (2003).
59. W. Shen, X. Dong, Y. Zhu, H. Chen, J. Shi, Mesoporous CeO2 and CuO-
loaded mesoporous CeO2: Synthesis, characterization, and CO catalytic
oxidation property. Microporous and Mesoporous Materials 85, 157 (2005).
60. E. Rossinyol et al., Nanostructured metal oxides synthesized by hard
template method for gas sensing applications. Sensors and Actuators B:
Chemical 109, 57 (2005).
61. T. Wagner, J. Roggenbuck, C.-D. Kohl, M. Fröba, M. Tiemann, in Studies in
Surface Science and Catalysis, S. Q. Y. T. Dongyuan Zhao, Y. Chengzhong,
Eds. (Elsevier, 2007), vol. Volume 165, pp. 347-350.
62. M. Tiemann, Porous Metal Oxides as Gas Sensors. Chemistry – A European
Journal 13, 8376 (2007).
63. K. M. Shaju, F. Jiao, A. Debart, P. G. Bruce, Mesoporous and nanowire
Co3O4 as negative electrodes for rechargeable lithium batteries. Physical
Chemistry Chemical Physics 9, 1837 (2007).
64. A. Rumplecker, F. Kleitz, E.-L. Salabas, F. Schüth, Hard Templating
Pathways for the Synthesis of Nanostructured Porous Co3O4. Chemistry of
Materials 19, 485 (2007/02/01, 2007).
65. K. Zhu, B. Yue, W. Zhou, H. He, Preparation of three-dimensional
chromium oxide porous single crystals templated by SBA-15. Chemical
Communications, 98 (2003).
66. C. Dickinson et al., Formation Mechanism of Porous Single-Crystal Cr2O3
and Co3O4 Templated by Mesoporous Silica. Chemistry of Materials 18,
3088 (2006/06/01, 2006).
67. W. Zhou, K. Zhu, B. Yue, H. He, C. Dickinson, in Studies in Surface
Science and Catalysis, I. M. C. E. van Steen, L. H. Callanan, Eds. (Elsevier,
2004), vol. Volume 154, Part A, pp. 924-930.
68. M. Imperor-Clerc, D. Bazin, M.-D. Appay, P. Beaunier, A. Davidson,
Crystallization of β-MnO2 Nanowires in the Pores of SBA-15 Silicas: In
Situ Investigation Using Synchrotron Radiation. Chemistry of Materials 16,
1813 (2004/05/01, 2004).
69. S. Zhu, Z. Zhou, D. Zhang, H. Wang, Synthesis of mesoporous amorphous
MnO2 from SBA-15 via surface modification and ultrasonic waves.
Microporous and Mesoporous Materials 95, 257 (2006).
79
70. S. C. Laha, R. Ryoo, Synthesis of thermally stable mesoporous cerium oxide
with nanocrystalline frameworks using mesoporous silica templates.
Chemical Communications, 2138 (2003).
71. K. Jiao et al., Growth of porous single-crystal Cr2O3 in a 3-D mesopore
system. Chemical Communications, 5618 (2005).
72. F. Jiao et al., Ordered Mesoporous Fe2O3 with Crystalline Walls. Journal of
the American Chemical Society 128, 5468 (2006/04/01, 2006).
73. B. Tian et al., Facile Synthesis and Characterization of Novel Mesoporous
and Mesorelief Oxides with Gyroidal Structures. Journal of the American
Chemical Society 126, 865 (2004/01/01, 2003).
74. W. Yue, A. H. Hill, A. Harrison, W. Zhou, Mesoporous single-crystal
Co3O4 templated by cage-containing mesoporous silica. Chemical
Communications, 2518 (2007).
75. X. Lai et al., Ordered Mesoporous Copper Oxide with Crystalline Walls.
Angewandte Chemie International Edition 46, 738 (2007).
76. J. Roggenbuck, M. Tiemann, Ordered Mesoporous Magnesium Oxide with
High Thermal Stability Synthesized by Exotemplating Using CMK-3
Carbon. Journal of the American Chemical Society 127, 1096 (2005/02/01,
2005).
77. T. Waitz et al., Crystalline ZnO with an enhanced surface area obtained by
nanocasting. Applied Physics Letters 90, 123108 (2007).
78. B. Tian et al., Microwave assisted template removal of siliceous porous
materials. Chemical Communications, 1186 (2002).
79. Y. Q. Wang et al., Directing the Formation of Vinyl-Functionalized Silica to
the Hexagonal SBA-15 or Large-Pore Ia3d Structure. Chemistry of
Materials 15, 5029 (2003/12/01, 2003).
80. B. Yue et al., Preparation and characterization of three-dimensional
mesoporous crystals of tungsten oxide. Chemical Physics Letters 407, 83
(2005).
81. J. Roggenbuck, G. Koch, M. Tiemann, Synthesis of Mesoporous
Magnesium Oxide by CMK-3 Carbon Structure Replication. Chemistry of
Materials 18, 4151 (2006/08/01, 2006).
82. R. Zhang, S. Kumar, S. Zou, L. L. Kerr, High-Density Vertically Aligned
ZnO Rods with a Multistage Terrace Structure and Their Improved Solar
Cell Efficiency. Crystal Growth & Design 8, 381 (2008/02/01, 2007).

80
83. Y.-Z. Zheng et al., Novel ZnO-Based Film with Double Light-Scattering
Layers as Photoelectrodes for Enhanced Efficiency in Dye-Sensitized Solar
Cells†. Chemistry of Materials 22, 928 (2010/02/09, 2009).
84. Y. M. Wang, Z. Y. Wu, L. Y. Shi, J. H. Zhu, Rapid Functionalization of
Mesoporous Materials: Directly Dispersing Metal Oxides into As-Prepared
SBA-15 Occluded with Template. Advanced Materials 17, 323 (2005).
85. W.-H. Tian et al., Adsorptive Desulfurization by Copper Species within
Confined Space. Langmuir 26, 17398 (2010/11/16, 2010).
86. E. Li, V. Rudolph, Transesterification of Vegetable Oil to Biodiesel over
MgO-Functionalized Mesoporous Catalysts†. Energy & Fuels 22, 145
(2008/01/01, 2007).
87. Z. Y. Wu et al., Generating Superbasic Sites on Mesoporous Silica SBA-15.
Chemistry of Materials 18, 4600 (2006/09/01, 2006).
88. Y. M. Wang, Z. Y. Wu, H. J. Wang, J. H. Zhu, Fabrication of Metal Oxides
Occluded in Ordered Mesoporous Hosts via a Solid-State Grinding Route:
The Influence of Host–Guest Interactions. Advanced Functional Materials
16, 2374 (2006).
89. Ö. Çelik, Ö. Dag, A New Lyotropic Liquid Crystalline System:
Oligo(ethylene oxide) Surfactants with [M(H2O)n]Xm Transition Metal
Complexes. Angewandte Chemie International Edition 40, 3799 (2001).
90. C. Albayrak, N. Özkan, O. Dag, Origin of Lyotropic Liquid Crystalline
Mesophase Formation and Liquid Crystalline to Mesostructured Solid
Transformation in the Metal Nitrate Salt−Surfactant Systems. Langmuir 27,
870 (2011/02/01, 2010).
91. A. F. Demirörs, B. E. Eser, Ö. Dag, Liquid Crystalline Mesophases of
Pluronics (L64, P65, and P123) and Transition Metal Nitrate Salts
([M(H2O)6](NO3)2). Langmuir 21, 4156 (2005/04/01, 2005).
92. Ö. Dag, O. Samarskaya, C. Tura, A. Günay, Ö. Çelik, Spectroscopic
Investigation of Nitrate−Metal and Metal−Surfactant Interactions in the
Solid AgNO3/C12EO10 and Liquid-Crystalline
[M(H2O)n](NO3)2/C12EO10 Systems. Langmuir 19, 3671 (2003/04/01,
2003).
93. Ö. Dag, S. Alayoǧlu, İ. Uysal, Effects of Ions on the Liquid Crystalline
Mesophase of Transition-Metal Salt:Surfactant (CnEOm). The Journal of
Physical Chemistry B 108, 8439 (2004/06/01, 2004).
94. C. Albayrak, A. M. Soylu, O. Dag, Lyotropic Liquid-Crystalline
Mesophases of [Zn(H2O)6](NO3)2−C12EO10−CTAB−H2O and

81
[Zn(H2O)6](NO3)2−C12EO10−SDS−H2O Systems. Langmuir 24, 10592
(2008/10/07, 2008).
95. D. R. Clarke, Varistor Ceramics. Journal of the American Ceramic Society
82, 485 (1999).
96. B. K. Meyer et al., Bound exciton and donor–acceptor pair recombinations
in ZnO. physica status solidi (b) 241, 231 (2004).
97. D. C. Look, B. Claflin, P-type doping and devices based on ZnO. physica
status solidi (b) 241, 624 (2004).
98. C. Klingshirn, The Luminescence of ZnO under High One- and Two-
Quantum Excitation. physica status solidi (b) 71, 547 (1975).
99. S. Polarz, F. Neues, M. W. E. van den Berg, W. Grünert, L. Khodeir,
Mesosynthesis of ZnO−Silica Composites for Methanol Nanocatalysis.
Journal of the American Chemical Society 127, 12028 (2005/08/01, 2005).
100. G. Xiong, L. Luo, C. Li, X. Yang, Synthesis of Mesoporous ZnO (m-ZnO)
and Catalytic Performance of the Pd/m-ZnO Catalyst for Methanol Steam
Reforming. Energy & Fuels 23, 1342 (2009/03/19, 2009).
101. S. Polarz, A. V. Orlov, F. Schüth, A.-H. Lu, Preparation of High-Surface-
Area Zinc Oxide with Ordered Porosity, Different Pore Sizes, and
Nanocrystalline Walls. Chemistry – A European Journal 13, 592 (2007).
102. S. Lepoutre et al., Nanocasted mesoporous nanocrystalline ZnO thin films.
Journal of Materials Chemistry 20, 537 (2010).
103. Q. Jiang et al., Fabrication of photoluminescent ZnO/SBA-15 through
directly dispersing zinc nitrate into the as-prepared mesoporous silica
occluded with template. Journal of Materials Chemistry 16, 1536 (2006).
104. K. Niu et al., Fabrication and Photoluminescent Properties of
ZnO/Mesoporous Silica Composites Templated by a Chelating Surfactant.
Langmuir 27, 13820 (2011/11/15, 2011).
105. W.-H. Zhang, J.-L. Shi, L.-Z. Wang, D.-S. Yan, Preparation and
Characterization of ZnO Clusters inside Mesoporous Silica. Chemistry of
Materials 12, 1408 (2000/05/01, 2000).
106. M. D. Alba, Z. Luan, J. Klinowski, Titanosilicate Mesoporous Molecular
Sieve MCM-41: Synthesis and Characterization. The Journal of Physical
Chemistry 100, 2178 (1996/01/01, 1996).
107. U. Ozgur et al., A comprehensive review of ZnO materials and devices.
Journal of Applied Physics 98, 041301 (2005).

82
108. L. Brus, Electronic wave functions in semiconductor clusters: experiment
and theory. The Journal of Physical Chemistry 90, 2555 (1986/06/01, 1986).

83
APPENDIX
(1) Reprinted from Chemistry of Materials, Vol. 23, C. Karakaya, Y. Turker, O.
Dag. "Assembly of Molten Transition Metal Salt–Surfactant in a Confined Space for the
Synthesis of Mesoporous Metal Oxide-Rich Metal Oxide–Silica Thin Films" 3062-3071
(2011), with permission from ACS.
(27) Reprinted from Langmuir, Vol. 18 L. Zheng, M. Suzuki,
and T. Inoue " Phase
Behavior of an Aqueous Mixture of Octaethylene Glycol Dodecyl Ether Revealed by
DSC, FT-IR, and 13
C NMR Measurements" 1991-1998, (2002), with permission from
ACS.
(33) Reprinted from Journal of Sol-Gel Science and Technology, Vol. 57; L.
G. J. A. A. Soler-Illia , P. C. Angelomé, M. C. Fuertes, A. Calvo, A. Wolosiuk,
A. Zelcer , M. G. Bellino and E. D. Martínez " Mesoporous hybrid and nanocomposite
thin films. A sol–gel toolbox to create nanoconfined systems with localized chemical
properties " 299-312, (2011), with permission from Springer.
(89) Reprinted from Angewandte Chemie International Edition, Vol. 113 Issue 20; Ö
Çelik, Ö Dag A New Lyotropic Liquid Crystalline System: Oligo(ethylene oxide)
Surfactants with [M(H2O)n]Xm Transition Metal Complexes " 3915–3919, (2001), with
permission from Willey
(90) Reprinted from Langmuir, Vol. 27; C. Albayrak, N. Ozkan, Ö Dag A New
Lyotropic Liquid Crystalline System: " Origin of Lyotropic Liquid Crystalline
Mesophase Formation and Liquid Crystalline to Mesostructured Solid Transformation in
the Metal Nitrate Salt−Surfactant Systems " 870-873, (2001), with permission from ACS