momentum savings from appliance standards
TRANSCRIPT
OCTOBER 2015
Momentum Savings from Appliance Standards

Momentum Savings from Appliance Standards 2
Contributors
Developed by Ben Barrington, Rob Carmichael, Cadeo Group; Angie Lee, Jane Hummer, Navigant Consulting with the support of countless analysts, consultants, and advisors.
Developed for the Bonneville Power Administration
Please refer questions to: Carrie Cobb, [email protected], 503.230.4985

Momentum Savings from Appliance Standards 3
Executive Summary Every day, codes and standards have a dramatic impact on energy demand in the Pacific Northwest. Over a twenty-five year analysis period, the appliance standards analyzed in this project alone represent a resource on par with an entire dam – 1500 aMW. This is enough to power over one million homes and illustrates the sheer magnitude of savings that standards deliver. In addition to creating a large and lasting impact on demand, standards are ever evolving – increasing in stringency for existing regulations and expanding scope to cover previously unregulated products. Since their inception, federal and state efficiency standards have all but eliminated the most inefficient products from the market. Together, the magnitude and ubiquity of standards impacts is changing the way resource planners view efficiency acquisition, and altering the arena of demand-side management policy and strategy.
In 2013, The Bonneville Power Administration (BPA) contracted Navigant (“the research team”) to conduct standards impact analysis specific to the Northwest for 30 federal appliance standards. Since then, more standards have been announced and the research team conducted a second round of analysis to estimate the total energy resources for 15 additional appliance standards. This report builds upon the first round of this project and details the collective savings of 45 standards while examining the findings of the second round in greater detail. This report also aims to document many of the improvements to the tools and processes made in the second round of the project.
The second round of this project had three main goals:
1. Estimate the total energy resource from 2010 to 2034 provided by 15 appliance standards including 14 federal standards plus the state of Oregon energy efficiency standard for battery chargers
2. Track the Momentum Savings from these standards toward the Bonneville Power Administration’s (BPA’s) energy efficiency Sixth Power Plan achievements1
3. Increase stakeholder review and data quality through initiatives which promote model transparency, ease of use, and a streamlined collaborative review process
Prior to collecting the requisite data needed to build each appliance standards model, the team revamped the model template used in the first iteration and developed common user guides to assist stakeholders in their review. Upgrades to the models included introducing a common structure, using standard naming conventions, and color coding inputs and calculations. The research team also added a navigation tab, which provides an overview of how data flows throughout the model, and hyperlinks to navigate between tabs. Finally, the team developed a central repository to track and respond to reviewer comments on draft models.
With the new tools in place, the project team conducted extensive secondary data collection to revise the central stock-turnover models for the residential and commercial sectors, as well as develop individual
1 Momentum Savings from federal codes and standards count towards the Bonneville Power Administration’s conservation commitment, as long as the given code or standard was not accounted for by the Council in the Sixth Plan baseline.

Momentum Savings from Appliance Standards 4
appliance standards models for each product considered in this round of analysis.2 This effort included gathering the most up to date market and usage data, much of which was unavailable at the time of the Sixth Plan’s publication. In addition to internal reviews by BPA engineers, numerous stakeholders reviewed the models, including those from the Northwest Power and Conservation Council (NWPCC or the “Council”), and the Northwest Energy Efficiency Alliance (NEEA), among others. These reviews helped ensure the use of the best available data and align models with the region’s Fifth and Sixth Power Plan assumptions. With this collaboration, the project team built 15 new appliance standards models. Each is capable of comparing scenarios with and without the new standards in order to estimate the standards’ impact on energy savings relative to the Plans’ assumptions from 2010 to 2034.
2 A stock-turnover model tracks the year-by-year shipments (flow) and installed base (stock) of appliances in a given area by modeling each products annual retirements, replacements, and new installations. The stock-turnover models are separate from the individual appliance standards models.

Momentum Savings from Appliance Standards 5
Table of Contents First… A Treatise on Savings Terminology .................................................................................................................................. 8
Abbreviations and Acronyms ........................................................................................................................................................ 11
Key Insights ..................................................................................................................................................................................... 13
Results ............................................................................................................................................................................................... 14
Introduction and Purpose .............................................................................................................................................................. 15
Methodology ...................................................................................................................................................................................... 16
Screening Process ......................................................................................................................................................................... 17
Data Collection and Sources .................................................................................................................................................... 18
Modeling .......................................................................................................................................................................................... 21
Stock Turnover Models .......................................................................................................................................................... 21
Appliance Standards Models ............................................................................................................................................... 23
Savings Calculations ................................................................................................................................................................ 26
Results ............................................................................................................................................................................................... 32
Residential Sector Results ..................................................................................................................................................... 32
Non-Residential Sector Results .......................................................................................................................................... 33
Cross-Sector Results ............................................................................................................................................................... 34
Baseline Adjustments .................................................................................................................................................................. 34
Reconciliation with NEEA’s Reports ....................................................................................................................................... 37
Model Enhancements, Future Improvements, and Data Gaps ................................................................................... 38
Enhancements to Models ..................................................................................................................................................... 38
Future Improvements ............................................................................................................................................................. 38
Data Gaps .................................................................................................................................................................................... 40
Additional Products Covered by Standards................................................................................................................... 41
Appendix A: Acknowledgements ................................................................................................................................................ 42
Appendix B: Product Standards That Took Effect from 2005 to 2020.......................................................................... 43
Appendix C: Data Forms for Individual Products .................................................................................................................. 47

Momentum Savings from Appliance Standards 6
List of Figures and Tables Figures:
Figure 1. Annual Fraction of Replacements (Assuming Constant Stock) ...................................................................22
Figure 2. New Installations Grow the Installed Stock .........................................................................................................23
Figure 3. Efficiency Distributions Before and After Standards ........................................................................................24
Figure 4. Illustration of Pre-Case and Post-Case Shipment Weighted UEC ..............................................................25
Figure 5. Illustration of Pre-Case and Post-Case Installed Stock Unit Energy Consumption .............................26
Figure 6. Accumulated Replacements Following Standards ...........................................................................................27
Figure 7. Momentum Savings from Replacement Shipments during Stock Turnover .........................................28
Figure 8. New Shipments Create Savings Following Standards.....................................................................................29
Figure 9. Illustration of Incremental Savings from New Shipments .............................................................................30
Figure 10. Momentum Savings from Appliance Standards .............................................................................................31
Figure 11. Example of a Baseline Adjustment .......................................................................................................................35
Tables:
Table ES-1. Summary of BPA Savings from Round 2 Federal and State Standards, adjusted for Busbar .....14
Table ES-2. Summary of BPA Savings from Analyzed Federal and State Standards, adjusted for Busbar ...14
Table ES-3. BPA Momentum Savings before and after Adjustments for 2010-2015 ............................................15
Table 1. Products Selected for Analysis ...................................................................................................................................18
Table 2. Residential Standards-Induced Momentum Savings (aMW) with Busbar ................................................32
Table 3. Non-Residential Standards-Induced Momentum Savings (aMW) with Busbar .....................................33
Table 4. Products Applicable to All Sectors Standards-Induced Momentum Savings (aMW) with Busbar .34
Table 5. Residential Products’ Baseline Adjustments – Regional and BPA ................................................................36
Table 6. Commercial Products’ Baseline Adjustments – Regional and BPA ..............................................................36
Table 7. BPA’s Momentum Savings by Sector by Year (2010-2015) with Busbar ...................................................37
Table 8. BPA’s Momentum Savings and Baseline Adjustments for 2010-2015 with Busbar ..............................38
Table 9. Additional Products Covered by Standards ..........................................................................................................41
Table B-1. Product Standards ......................................................................................................................................................43
Table C-1. Automatic Commercial Icemakers .......................................................................................................................47

Momentum Savings from Appliance Standards 7
Table C-2. External Power Supplies ...........................................................................................................................................52
Table C-3. Commercial Beverage Vending Machines ........................................................................................................57
Table C-4. Residential Clothes Dryers ......................................................................................................................................60
Table C-5. Residential Microwaves ............................................................................................................................................65
Table C-6. Residential Room Air Conditioner .......................................................................................................................72
Table C-7. Small Electric Motors .................................................................................................................................................47
Table C-8. Residential Central Air Conditioner .....................................................................................................................51
Table C-9. Residential Cooktops ................................................................................................................................................56
Table C-10. Commercial Clothes Washer ...............................................................................................................................61
Table C-11. Commercial Refrigeration Equipment .............................................................................................................66
Table C-12. Residential Furnace Fans .......................................................................................................................................72
Table C-13. Electric Motors ..........................................................................................................................................................81
Table C-14. Illuminated Exit Signs .............................................................................................................................................89
Table C-15. Commercial Pre-Rinse Spray Valve ...................................................................................................................94
Table C-16. Battery Chargers .......................................................................................................................................................99
Table C-17. Walk-in Coolers and Freezers .......................................................................................................................... 101
Table C-18. Residential Ovens .................................................................................................................................................. 106

Momentum Savings from Appliance Standards 8
First… A Treatise on Savings Terminology The list of culprits is long and mercurial: annual, claimable, incremental, first-year, one-time, cumulative, non-programmatic, programmatic, standards-induced, naturally occurring, in-the-baseline, baseline-adjusted, etc. The first 20 pages of this report would prove an inadequate space for the definitions of all the different types and categories of “energy savings” used in the Northwest and in the industry at large. The jargon is often necessary for making distinctions among how savings are calculated, or how they are aggregated over time, or how they are adjusted for attribution and baseline issues. However, the nomenclature can render the uninitiated reader utterly nonplussed, downright angry (why don’t the values in second row sum to that column in the bar chart?!?!), or worse – skeptical. Meanwhile, the initiated may apply their own understanding to the same terms and embark unawares of what we really mean to say.
To avoid a confused and potentially hostile readership, we define and discuss a few key terms. We use these terms—and only these—to define the savings we report herein.
Energy savings. All savings in this report reflect the energy savings achieved by an above-baseline measure in the first year following its installation. This concept is often referred to as “incremental” savings. Even though the measure continues to save energy throughout its life relative to the baseline, only the kilowatt-hour savings that accrue in the first year are reported as “incremental” savings for that measure. Those savings are assumed to occur in perpetuity. Furthermore, when reporting savings for more than one year, those savings reflect the simple addition of year-by-year first-year savings. The term “cumulative savings” describes savings that accrue in this manner.
This meaning is consistent with how the Bonneville Power Administration, the Northwest Power and Conservation Council (NWPCC or the “Council”), and the Northwest region calculate and report savings toward the Sixth Power Plan’s (Sixth Plan) target. However, it is not consistent with how the U.S. Department of Energy (DOE) estimates and reports savings from its standards rulemakings, which are central to this project. DOE’s reported savings include all savings from an above-baseline unit throughout the life of that unit. The savings are in addition to the unit’s replacement, and its replacement’s replacement, and so on, over some finite analysis period (typically 30 years). This accounting method is appropriate when viewed from the standpoint of assessing a standard’s cost effectiveness to the consumer or in accounting for carbon abatement. It is unnecessary for analyses aimed at quantifying the resource provided by energy efficiency.
Momentum Savings. Momentum Savings is an umbrella term meant to capture all savings that accrue in the market over and above an NWPCC plan baseline, but which are not incented by utility programs. Core characteristics of Momentum Savings include the following:
1. Momentum Savings excludes savings incented by programs.
2. Momentum Savings must be above an NWPCC plan baseline.
3. Momentum Savings are real savings. Consider the fact that at least some above-baseline widgets or measures occur outside of programs. In fact, significant shares of above-baseline sales are not run through programs in some markets. Yet those non-rebated widgets achieve savings just the

Momentum Savings from Appliance Standards 9
same—same unit, same baseline, and, ultimately, the same resource. That is why the Council is indifferent to how the target is achieved (and why Momentum Savings count toward the target).
4. Momentum Savings estimation has the following two key challenges:
a. Data availability. While programs typically have data on the number of units sold or jobs performed, quantification of Momentum Savings often requires a broader set of market-level data (in order to assess what occurred outside of programs). Market research is paramount.
b. Risk of double-counting or undercounting. One cannot simply estimate total market savings—again, relative to an NWPCC plan baseline—and then subtract out programmatic savings. First, program baselines do not always align with NWPCC plans. Second, Northwest Energy Efficiency Alliance (NEEA) initiatives drive savings that must be reconciled with Momentum Savings estimates.
Standards-driven savings. These are energy savings that accrue in the region because of national minimum efficiency standards, as modeled in this analysis.
The relationship between Momentum Savings and standards-driven savings. Given the above definition of standards-driven savings, it is tempting to think that because these savings are not achieved through programs, they must be Momentum Savings. In reality, however, some savings are and some are not. This is because the standard may have been assumed in an NWPCC plan baseline (recall that to count as Momentum Savings, the savings must be above an NWPCC plan baseline). If, for example, the Council knows a DOE standard will take effect in the first year of an NWPCC plan period, then it would likely make the new standard the baseline for that plan. Therefore, in this instance, the new standard cannot drive any Momentum Savings: the standard is not above the plan baseline.
Thus, the savings associated with a hypothetical DOE standard would affect neither the claimable programmatic savings nor the claimable Momentum Savings. Does that mean the DOE standard caused no savings, and provided no resource for the region? No. The savings from the standards are simply already “in the baseline” of the new plan. The standards-driven savings are quite real (and, as you see in this report, quite substantial); they simply cannot count toward the target in this case. Conversely, if a standard takes effect that the Council did not assume in a plan, then the savings from the standard would count as Momentum Savings; the standard generates savings above the plan baseline. The planners’ choice of where to draw a plan baseline has no bearing on the actual impact of the resource provided by the standard to the region.
Sixth Plan Baseline Adjustments. The team calculated baseline adjustments to reconcile the difference between the market efficiency assumed in the Sixth Plan and the market efficiency as modeled with the benefit of hindsight. To use the best available and most current information, the project team diligently collected data that were unavailable to the NWPCC at the time it developed the Sixth Plan. New data from NEEA’s Residential Building Stock Assessment, for example, provided updated operating hour and duty cycle information for a number of appliances. Similarly, new shipment data provided a different picture of the market size and efficiency mix for some products. The new data led to different baseline energy consumption in the models as compared to the Sixth Plan. Does this mean that the Sixth Plan was wrong? Not exactly. It was written with the best available data at the time. However, where program efficacy is measured against the Sixth Plan baseline, it is important to get the assumed starting market

Momentum Savings from Appliance Standards 10
efficiency correct. Where new data revealed a different market efficiency mix from the Sixth Plan, the baseline must be adjusted.
Where possible, the team isolated the assumed efficiency mix in the Sixth Plan, and then substituted it in the updated models to create an apples-to-apples comparison of assumed market efficiency. The difference in energy consumption with each of these assumptions yielded the baseline adjustments. This calculation was carried out for each year of the Sixth Plan (2010 – 2015) to capture any effect of assumed stringency or timing of standards as well as other changes of market efficiency over time. The adjustment values are given in average megawatts and can be either positive or negative, depending on whether the Sixth Plan assumed a market that was more or less efficient than it was in actuality.

Momentum Savings from Appliance Standards 11
Abbreviations and Acronyms aMW – Average megawatts
AHAM – Association of Home Appliance Manufacturers
ASAP – Appliance Standards Awareness Project
BPA – Bonneville Power Administration
CAC – Central air-conditioning
CBSA – Commercial Building Stock Assessment
CFL – Compact fluorescent lamp
CFLK – Ceiling fan lighting kit
CFR – Code of Federal Regulations
CSIQ – Codes and Standards Impact Quantification
DHW – Domestic hot water
DOE – U.S. Department of Energy
EF – Energy Factor
EIA – U.S. Energy Information Administration
EISA – Energy Independence and Security Act
EPACT – Energy Policy Act
EPS – External power supply
EUI – Energy use intensity
EUL – Effective Useful Life
HID – High-intensity discharge
HVAC – Heating, ventilation, and air-conditioning
LED – Light-emitting diode
LFL – Linear fluorescent lighting
NAECA – National Appliance Energy Conservation Act
NEEA – Northwest Energy Efficiency Alliance
NIA – National impact analysis

Momentum Savings from Appliance Standards 12
NPS – Non-programmatic savings
NWPCC – Northwest Power and Conservation Council
PNWRES - 1992 Pacific Northwest Residential Energy Survey
PNWNonRES - 1992 Pacific Northwest Non-Residential Energy Survey
PTAC/HP – Packaged terminal air-conditioning/heat pump
RBSA – Residential Building Stock Assessment
RTF – Regional Technical Forum
TSD – Technical support document
UEC – Unit Energy Consumption
UES – Unit Energy Savings
WICF – Walk-in coolers and freezers

Momentum Savings from Appliance Standards 13
Key Insights Both the modeling and the data collection activity yielded several key insights:
The efficiency resource from standards is extremely large. This iteration of standards analysis identified another 586.1 average megawatts (aMW) of resource from energy efficiency standards. This is in addition to the 960.2 aMW identified in the first round of analysis. Together, these standards represent a resource comparable to that provided by an entire dam. While this analysis reflects the combined savings from 45 standards, the savings are highly concentrated with the bulk of savings coming from just a few high-impact products. From this iteration of the analysis, an estimated 328.4 aMW of savings will accrue just from battery chargers, electric motors, and furnace fans. The Seventh Power Plan baseline will likely include these standards, but nevertheless, the resource achieved by these standards is real, large, and significantly alters the planning horizon.
Oregon standards for battery chargers are among the biggest contributors to Momentum Savings. Efficiency standards for 18 classes of battery chargers ranging in size from personal audio devices to three-phase lift-trucks, took effect in 2014. These standards are modeled after the California standards which took effect in 2013 for consumer products (e.g. personal audio devices), in 2014 for industrial products (e.g. lift-trucks), and will take effect in 2017 for small commercial products (e.g. handheld barcode scanners). Analysis indicates that these standards will contribute 65 aMW in savings in the five years following their adoption (2014-2018) – on par with those realized through the standards for residential water heaters (64 aMW). Further, these standards dominate all others analyzed in the second round of analysis. This is in part due to the fact that the research team expects these standards to become de facto for the region (reflected in the preceding figures) as manufacturers, distributors, and retailers have a substantial disincentive to maintain parallel inventories and supply chains between states. However, interviews with manufacturers, distributors, and retailers would inform these assumptions.
Stakeholder participation yields more accurate estimates of savings from appliance standards. Numerous data points factor into estimating Momentum Savings from standards. These include market saturations, product lifetimes, prevailing efficiency mixes, and more product specific usage metrics than there are products themselves. Each one of these inputs can have a substantial impact on the estimated market size or unit annual energy consumption of a given appliance. For example, do households in the Pacific Northwest run their clothes dryers 224 cycles per year or 311 cycles per year (almost 50% more)?3 Stakeholder review helps ensure the best possible data finds its way into the analysis and that the modeling teams interpret it correctly. This round of modeling focused on improving the models and review process to encourage this type of participation. However, there is certainly further room for improvement.
3 224 cycles per year represents the market weighted average as calculated using 2012 RBSA data and Sixth Power Plan housing estimates. In contrast, 311 cycles per year represents the mean number as taken from NEEA’s 2014 Dryer field study.

Momentum Savings from Appliance Standards 14
Results The definition of “savings” that applies for this analysis is consistent with how the Council, BPA, and other regional stakeholders discuss savings. Unless otherwise stated, the savings expressed herein refer to incremental savings in each year, sometimes referred to as “first-year savings.”4
For this round of analysis, BPA’s standards-driven claimable Momentum Savings from 2010 to 2015 is 0.5 aMW in the residential sector, 2.8 aMW in the commercial sector, and 11.1 aMW for battery chargers and external power supplies (both of which represent a mix of residential and commercial products). This additional 14.5 aMW of savings is on top of the 68.4 aMW identified in the previous round of analysis.
The magnitude of the savings highlights the power of regional standards which comprise the vast majority (over 70%) of savings identified in this round from 2010-2015. Table ES-1 illustrates the breakdown of the 2014 analysis results comparing Federal and State energy efficiency standards.
Table ES-1. Summary of BPA Savings from Round 2 Federal and State Standards, adjusted for Busbar
2010 2011 2012 2013 2014 2015 Total
Federal Standards 0.0 0.0 0.0 0.0 0.1 3.3 3.4
State Standards 0.0 0.0 0.0 0.0 5.8 5.4 11.1
Total 0.0 0.0 0.0 0.0 5.9 8.7 14.5
Source: Navigant Analysis, 2015
Table ES-2 summarizes the BPA results from 2013 analysis and 2014 analysis. A total of 82.9aMW is available through all analyzed products from 2010-2015.
Table ES-2. Summary of BPA Savings from Analyzed Federal and State Standards, adjusted for Busbar
2010 2011 2012 2013 2014 2015 Total
Total – Round 1, Non-Lighting Products
3.9 4.0 3.9 4.3 4.1 14.4 34.5
Total – Round 2, Non-Lighting Products
0.0 0.0 0.0 0.0 5.9 8.7 14.5
Total – Lighting Products 0.0 1.4 6.9 9.6 9.2 6.9 33.9
Total 3.9 5.3 10.8 13.9 19.1 30.0 82.9
Source: Navigant Analysis, 2015
4 Only the first year savings count toward the target, despite the fact that savings from above-baseline measures occur in perpetuity. This is different from how DOE reports savings from its rulemakings.

Momentum Savings from Appliance Standards 15
NEEA reports savings for battery chargers, residential clothes dryers, dishwashers, and clothes washers. The research team subtracted the incremental savings from these products from BPA’s Momentum Savings. In addition, BPA’s non-residential lighting momentum savings model captures the momentum savings from lighting standards also analyzed in this project. The research team removed the momentum savings yield from lighting standards from this analysis to avoid double counting between this and the non-residential lighting momentum savings analysis. Table ES-3 details the remaining BPA momentum after correcting for NEEA claimed savings, overlap between lighting standards momentum savings and non-residential lighting momentum savings, and a baseline adjustment. The deduction amounts to 46.4 aMW from 2010-2015.
Table ES-3. BPA Momentum Savings before and after Adjustments for 2010-2015
Category Savings (aMW)
Momentum Savings from Standards
82.9
Less Savings from Lighting Products
-33.9
Less Savings Reported by NEEA
-12.0
Less Baseline Adjustment
-0.5
Remaining Momentum Savings
36.5
Source: Navigant Analysis, 2015
Introduction and Purpose The Northwest Power and Conservation Council (NWPCC or the “Council”) establishes regional energy conservation targets every five years. In 2009, when the Council established a target of 1,200 average megawatts (aMW) for the 2010-2015 “Sixth Plan” timeframe, Bonneville Power Administration (BPA) committed to achieving the public power portion of that resource target—approximately 504 aMW. The Council is indifferent to how BPA achieves those savings, whether through utility programs and incentives, codes and standards, or other means of market transformation. BPA’s chosen strategy for achieving its substantial share of the target includes the acquisition of two types of savings: programmatic (those savings BPA directly incentivizes) and momentum (all non-incentivized savings). This report discusses the Momentum Savings side of this strategy, and more specifically, the contribution of standards to Momentum Savings.

Momentum Savings from Appliance Standards 16
Codes and standards are a significant source of Momentum Savings in the Northwest, and since 1980, account for an estimated 40% of conservation energy savings in the region.5 In the years preceding the submittal of the Sixth Plan (the Plan), the U.S. Department of Energy (DOE) and Congress were particularly active in establishing new or higher efficiency standards. This created the possibility of substantial standards-driven Momentum Savings in the region. To estimate the regional impact, BPA contracted Navigant Consulting, Inc. (Navigant) to conduct an analysis of many DOE standards on important residential appliances and commercial equipment.
The Navigant research team developed the overarching standards impact analysis methodology—coined the Codes and Standards Impact Quantification (CSIQ) Process—in 2011, modeling it on DOE’s National Impact Analyses (NIAs).6 The methodology envisioned the construction of product-specific models that make use of the best available energy and market data in the nation. The research team used these models to:
• Retrospectively estimate Momentum Savings due to standards
• Serve as a transparent tool for multiple parties to use when informing future regional efficiency efforts
• Provide custom standards impact assessments integrating current regional efforts and existing data sources
This report builds on the CSIQ efforts from 2011 and provides the results of a second iteration of codes and standards analysis. In the first round of the standards project, the research team analyzed 30 appliance standards in accordance with the CSIQ methodology. The second round added another 15 standards comprised of 14 federal standards and one Oregon state standard. The following sections detail improvements made to the analysis methodology since the first round, the results of the analysis, and a discussion of improvements to consider implementing in future iterations of this project.
Methodology The objective of this project was to analyze the impact of standards that took effect during the Sixth Plan timeframe (2010-2015) over a 25-year analysis period. This section describes the analyses’ methodology.
The research team executed the analysis in three phases:
1. Screening standards for the analysis
2. Data collection and analysis
3. Stock modeling and savings estimation
In each phase of the project, the team created numerous workbooks including prioritization tools, proposed data forms, stock turnover models, and appliance standards Momentum Savings models. Each
5 See the report, “Methodology for Quantifying the Savings from Codes and Standards,” available here: http://www.bpa.gov/energy/n/reports/evaluation/multi_sector/pdf/BPA_Codes_Standards_Approach_Final.pdf 6 Ibid

Momentum Savings from Appliance Standards 17
workbook builds upon those in earlier phases with the process culminating in the Momentum Savings models. These models aim to estimate the energy savings impact of appliance standards and to serve as a resource for future regional analyses in the Northwest. With this in mind, extensive stakeholder input, data sharing, and review guided the team’s analytical judgments and methodological decisions during each phase of the analysis.
Screening Process In the first iteration of this project, the research team identified all federal, Oregon, and Washington appliance and equipment standards that went into effect between 2005 and 2015. In all, the team identified 47 standards on consumer products and commercial equipment that would affect energy consumption in the residential and commercial sectors.7 With guidance from BPA, the Council, and the Northwest Energy Efficiency Alliance (NEEA), the research team prioritized 30 appliance standards for analysis. The team selected these 30 standards based on the magnitude of potential savings, value of data and analysis to the region, and the interaction amongst products.8
The research team repeated the screening process for the second iteration of analysis, and reviewed DOE rulemaking status for all products and equipment that have already or are expected to take effect in the foreseeable future. The team identified 14 additional standards, including the Oregon battery chargers standard which meet this criteria. While DOE groups residential cooktops and ovens into a single standard rulemaking, this analysis considers these products separately, resulting in 15 distinct analyses.
Table 1 displays the final products the research team selected for analysis in the current iteration of the project. Refer to Appendix B: Product Standards That Took Effect from 2005 to 2020 for the full list of standards that went into effect (or will go into effect) between 2005 and 2020.
7 The terms “consumer product” and “commercial equipment” have specific regulatory meaning in the context of DOE’s Appliance Standards Program. For simplicity, in this report, we will use the term “product” to mean the regulated device, regardless of the sector in which it is used predominantly. 8 For more in-depth discussion of selection criteria for the 2013 project cycle, refer to 2013 final report on standards impact project. “Momentum Savings from Appliance Standards

Momentum Savings from Appliance Standards 18
Table 1. Products Selected for Analysis
Sector Products
Residential
• Central Air-Conditioning • Clothes Dryers • Cooktops • Ovens • Furnace Fans • Microwave Ovens • Room Air-Conditioning
Commercial/Industrial
• Walk-In Coolers and Freezers • Commercial Refrigeration Equipment • Automatic Commercial Icemakers • Beverage Vending Machine • Electric Motors • Small Electric Motors
All Sectors • External Power Supplies • Battery Chargers
Source: Navigant Analysis, 2015
Data Collection and Sources Models are only as good as the inputs that drive them. With the appliances standards selected, the team dedicated a substantial portion of the project to secondary data collection to fully understand the inputs required for the appliance standards models. These data inputs fall into four groups:
1. Standards data: These data include the applicability, timing, and stringency of standards, which are often surprisingly complex. A single “DOE standard” can affect many different types of regulated products differently and at different times. For example, the standard for “walk-in coolers and freezers” is actually a set of standards on three separate products: the door, the panels, and the refrigeration system. The standard further differentiates each component into a number of product classes, and each class has its own standard level. Collection efforts covered the following three types of standards data:
a. The product types or “classes” that standards affect. Numerous factors may delineate product classes. Examples include capacity bins (e.g., >=1,000 lb. ice/ 24 hrs. harvest rate or <1,000 lb. ice/ 24 hrs. harvest rate for remote condensing automatic commercial ice makers), fuel used (e.g., gas vs. electric clothes dryers), or some feature that provides utility to the consumer and affects energy consumption (e.g., self-cleaning vs. non-self-cleaning ovens.) Note that for the purposes of this analysis, the research team only considered electrically powered products.

Momentum Savings from Appliance Standards 19
b. The timing of standards. DOE typically announces new federal appliance standards three years in advance of their required compliance date. After the standard takes effect, manufacturers may no longer produce and sell non-compliant appliances and equipment. Occasionally, different product classes will have different compliance dates.
c. The stringency of standards. DOE is required by law to set standards at a level which achieves the greatest national energy savings and is both technologically feasible and economically justified. These criteria result in different standard levels for different appliances and equipment. The stringency of these standards is a critical input to the appliance standards models as it dictates just how far the baseline moves.
2. Market data: These data describe the count, type, and efficiency of the products comprising the sales of a given product and include:
a. The distribution of product classes analyzed. As described earlier in this section, DOE standards cover multiple product classes. However, it is rare that product classes are equally represented in the market. Fuels, features, and price points (among other attributes) may cause the market to favor one product class over another. Understanding the relative proportion of each product class in the market is critical to understanding the magnitude of the impact as each product class has its own standard level.
b. The distribution of efficiencies for each product class. Prior to standards, not all shipments are at the baseline efficiency level. Higher efficiency products, such as those with ENERGYSTAR® ratings are sold even in the absence of standards. The prevailing efficiency distributions both with and without new standards in effect are critical in understanding how the market moves following standards, and hence how much energy is saved.
3. Usage data: These data contribute to the calculation of the annual unit energy consumption (UEC) of each product and include:
a. The UECs themselves or other efficiency ratings. Various efficiency levels comprise the efficiency distribution. These levels include both a baseline efficiency level and one or more efficiency levels above the baseline. Each efficiency level corresponds to a different UEC. Sometimes, the UECs are reported directly at each level. More often, efficiency ratings are reported at each level. In this case, the efficiency ratings are combined with usage data to calculate the UECs.
b. Usage and duty cycle information. Where UECs are not reported directly, usage and/or duty cycle data are needed to translate between an efficiency rating and the UEC. As an example, residential clothes dryers’ efficiency levels are expressed as pounds of laundry dried per kilowatt hour. Both the average number of pounds per load and loads per year are required to calculate the UEC for residential clothes dryers.
4. Stock model data: The research team uses these data to generate the number of units in the region’s installed stock, as well as the number retired and installed each year. These data include:
Momentum Savings from Appliance Standards 20
a. Regional historical and forecast housing stock and commercial floor space. These figures are used in conjunction with market saturation data to arrive at the installed stock in the turnover models.
b. Market saturation. Market saturation is simply the number of units per household or per square foot of commercial floor space of a given appliance. Recent and historic saturation data help identify trends in market adoption of appliances. These data form the basis of appliance stock when combined with regional historical and forecast housing stock and commercial floor space data.
c. Product lifetime data. Estimates of product lifetime help determine the useful life of an appliance before it requires replacement. These data drive stock turnover.
To collect these data, the team conducted a regional and national data assessment for each product selected in the screening process. While the best data sources varied by product, the key regional and national data sources include:
Regional Data:
1. Sixth Plan forecast and supply curves,
2. Regional Technical Forum (RTF) Unit Energy Savings (UES) measure workbooks,
3. Residential Building Stock Assessment (RBSA),
4. Commercial Building Stock Assessment (CBSA),
5. NEEA metering and equipment field studies, and
6. California Energy Commission appliance efficiency rulemaking staff analyses.
National Data:
1. DOE energy conservation standards rulemaking documents and their underlying data,
2. U.S. Energy Information Administration (EIA),
3. Appliance Standards Awareness Project (ASAP),
4. Association of Home Appliance Manufacturers (AHAM), and
5. The U.S. census.
All else equal, the research team prioritized use of regional data over national data for model inputs. However, sources varied in timeliness, comprehensiveness, and validity. The team relied heavily on the project’s stakeholders to evaluate which data source to use, particularly whenever both national and regional data were available. When using national data the team adjusted parameters such as floor space and population, as necessary, to make it representative of the Northwest.
To facilitate the comparison of national versus regional sources, the team developed product-by-product “data forms,” which maintained key data input values (e.g., baselines, lifetimes, duty cycles, etc.) and documented their sources. The team also documented these sources throughout the standards savings

Momentum Savings from Appliance Standards 21
models themselves. Appendix C: Data Forms for Individual Products includes each product’s data form, as well as the rationale for selecting one source over another, as applicable.
Modeling Using the data outlined above, the research team developed models to quantify the Momentum Savings from appliance standards. The models quantify these savings by comparing appliance energy consumption between two cases: a “Pre-Case” and a “Post-Case”. The Pre-Case aligns with the Sixth Plan assumptions of what standards are on the books or in effect at the time the plan was written. In this regard, the Pre-Case does not reflect the impact of standards announced after the Sixth Plan was published. In contrast, the Post-Case does reflect the impact of standards announced after the Sixth Plan was published. In either case, energy consumption is a product of appliance shipments and their unit energy consumption (UEC). Where shipments are held constant between the Pre-Case and Post-Case, the incremental savings come from the change in UEC between the Pre-case and Post-Case and are defined by the following equation:
𝑆ℎ𝑖𝑖𝑖𝑖𝑖𝑖𝑖 𝑥 𝐶ℎ𝑎𝑖𝑎𝑖 𝑖𝑖 𝑈𝑈𝐶 𝑏𝑖𝑖𝑏𝑖𝑖𝑖 𝑃𝑃𝑖 − 𝐶𝑎𝑖𝑖 𝑎𝑖𝑎 𝑃𝑃𝑖𝑖 − 𝐶𝑎𝑖𝑖 = 𝐼𝑖𝐼𝑃𝑖𝑖𝑖𝑖𝑖𝑎𝐼 𝑆𝑎𝑆𝑖𝑖𝑎𝑖
Shipments are derived from central stock turnover models whereas UECs are developed in individual appliance standards models. The following two sections describe these two types of models in greater detail.
Stock Turnover Models Stock turnover models provide the shipments and installed stock projections needed to calculate incremental savings in the appliance standards models. A set of shipments and installed stock spanning the full analysis period from 1981 to 2034 is pulled from the stock turnover models into each appliance standards model by way of a link. The estimates of shipments and installed stock are based on appliance saturations (typically from the RBSA or CBSA), appliance lifetimes (typically from DOE standards rulemakings), and either a projection of housing stock (for residential products) or commercial floor space (for commercial products). Because of this last distinction, the research team developed two centralized stock turnover models: one for appliances in the residential sector, and one for appliances in the commercial sector.
In either model, the installed stock of appliances in each year of the analysis is simply the product of the number of homes (or area of commercial floor space) and the appliance saturation in that year. The models then estimate the shipments in each year of the analysis by examining how the stock turns over and how it grows. Stock turnover is a function of the estimated useful life of a product. The models assume that products are shipped, put into service, and remain in the installed stock for their estimated useful life after which they are retired and replaced. As illustrated in Figure 1 absent any growth in stock, this means that in every year of the analysis, a fraction equal to one over the lifetime of the installed stock is retired and replaced.

Momentum Savings from Appliance Standards 22
Figure 1. Annual Fraction of Replacements (Assuming Constant Stock)
Momentum Savings from Appliance Standards 23
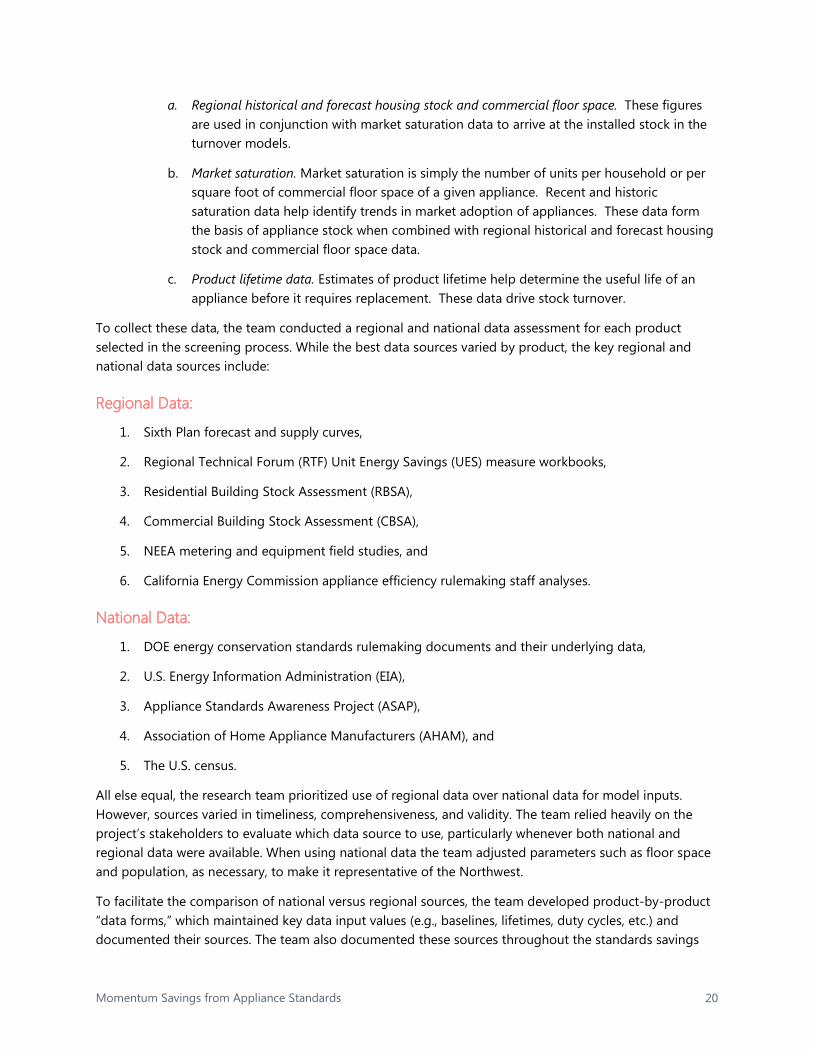
In contrast to stock turnover, stock growth is a function of new construction and/or increasing saturation, both of which represent completely new installations. New installations tied to new construction is exactly as the name suggests: an increase in housing stock or commercial floor space translates into more appliances in the stock. In contrast to new construction, new installations from increasing saturation simply means that there are more units per household or per square foot of commercial floor space. As illustrated in Figure 2, these new installations are shipped and contribute to growing the installed stock.
Figure 2. New Installations Grow the Installed Stock
It is important to distinguish between replacement shipments and new installations when accounting for Momentum Savings as the two types of shipments contribute differently. This accounting is described in greater detail in Savings Calculations.
Appliance Standards Models As mentioned, the two types of shipments, and installed stock are pulled into individual appliance standards models to calculate the Momentum Savings from standards. These models do so by combining the shipment data with UEC data. Unlike the shipments, the UECs are developed within the individual appliance standards models. UECs are a function of the market efficiency mix (typically from DOE standards rulemakings), the product mix (also typically from DOE standards rulemakings), and other usage characteristics (from regional specific studies, as available, or from DOE standards rulemakings). Because the efficiency mix, product mix, and usage characteristics are product specific, each appliance has its own standards model. As described in Data Collection and Sources, standards cover multiple classes of products, each with its own efficiency mix. A UEC is calculated for each efficiency level of each product

Momentum Savings from Appliance Standards 24
class analyzed. The models then calculate weighted average UECs based on the mix of products and efficiencies in each year of the analysis.
Recall from the introduction to Modeling, incremental savings come from the change in UEC between the Pre-case and Post-Case. In any model, the UEC is the same in either case leading up to standards. However, when standards take effect, they directly impact the efficiency mix in the Post-Case by eliminating the least efficient products from the market, and in turn change the Post-Case UECs. This change in efficiency distribution between the Pre-Case and Post-Case typically follows one of two patterns: a roll-up, or a shift. A roll-up models the situation in which the fraction of shipments which no longer comply with new standards, moves to meet the new minimum standard, but goes no higher. This represents the most conservative approach to modeling the impact of standards as it elicits the least change in UEC. In contrast, the shift maintains a similar distribution of shipments across various efficiency levels, but all efficiency levels are now above the new minimum standard. This reflects a greater change in UEC. To be conservative in the estimate of Momentum Savings, the appliance standards modeled in this project almost exclusively examine a roll-up of products following standards. Figure 1 provides an illustration of these two changes in efficiency distribution.
Figure 3. Efficiency Distributions Before and After Standards

Momentum Savings from Appliance Standards 25
In addition to changing the efficiency mix, standards may also cause a change in product mix. This happens in instances where different products are adequate substitutes for one another. An example of this occurred with amended standards for residential clothes washers. Following standards, the price gap closed between less efficient (and traditionally less expensive) top-loaders and higher efficiency (traditionally more expensive) front-loaders. This change in pricing prompted a portion of the market to buy the now comparatively less expensive front-loaders – altering the product mix. Because of changes to either the efficiency mix, the product mix, or both; standards impact the weighted average UECs in the Post-Case. This change in shipment weighted UEC happens immediately following standards as manufacturers can no longer produce and sell non-compliant appliances, as illustrated in Figure 4.
Figure 4. Illustration of Pre-Case and Post-Case Shipment Weighted UEC

Momentum Savings from Appliance Standards 26
In contrast, the installed stock UECs change more gradually. This happens because the stock does not turn over in just one year – it takes the equivalent of one product lifetime. The installed stock grows more efficient following standards as older units retire and are replaced by higher efficiency standards compliant products. Once the stock has turned over completely, it ceases to grow more efficient as all the units comprising the installed stock before standards have already been replaced by higher efficiency alternatives as illustrated in Figure 5.
Figure 5. Illustration of Pre-Case and Post-Case Installed Stock Unit Energy Consumption
The difference between the UECs in the Pre-Case and Post-Case represents the opportunity for savings. One might think you could simply multiply the difference in shipment weighted UECs by the shipments in any given year to arrive at the incremental savings. However, this is not the case. Only certain shipments count towards savings. The next section discusses the accounting issues addressed in savings calculations.
Savings Calculations As discussed in the ‘Treatise on Savings,’ energy savings must adhere to two primary criteria: they must be from an above-baseline measure, and they count only in the first year following installation. Comparing a Pre-Case which aligns with the Sixth Plan assumptions of standards to a Post-Case which includes the effect of new standards announced after the Sixth Plan helps establish what measures are above baseline. However, the accounting of which shipments count and when, is more complicated. Recall from Stock Turnover Models, that there are two types of shipments: replacements and new installations. Each contributes to savings in a different way.
Replacements only count towards savings as the stock is turning over. During this period they are replacing units that were part of the installed stock before standards took effect. Once the stock has turned over it is entirely comprised of standards compliant products, and no more savings from replacements can be gained. This is because at this point and thereafter, there is no difference in energy

Momentum Savings from Appliance Standards 27
consumption between the replacement unit and the retired unit it is replacing. Recall our earlier example in which an installed stock of 50 units is comprised of an appliance with an average lifetime of 10 years. This means that 5 units will fail and be replaced each year. Were a new standard to take effect in 2015, the newly standards compliant replacements would accrue in the stock until it had completely turned over by 2024, one product lifetime later, as illustrated in Figure 6.
Figure 6. Accumulated Replacements Following Standards

Momentum Savings from Appliance Standards 28
When standards compliant units replace part of the installed stock that predates standards – these units create savings. However, once the entire stock has turned over, replacement units cease to create savings as they are simply replacing similar standards compliant products. Figure 7 illustrates how replacement units create savings during stock turnover, and not thereafter.
Figure 7. Momentum Savings from Replacement Shipments during Stock Turnover
In contrast to replacements, new installation shipments create savings even after the stock has turned over. This is because they are compared against what could have been installed, had new standards not taken effect. They are still only credited once – in the year they are shipped, but operate independently from stock turnover.

Momentum Savings from Appliance Standards 29
Recall that new installation shipments are the result of increasing market saturation or growing housing stock. If the installed stock starts at 50 units in 2010 and grows at a rate of 1 unit per year, the saturation will grow to 74 units by 2034 (over 25 years inclusive.) This means that one new installation per year is contributing to Momentum Savings following standards as illustrated in Figure 8.
Figure 8. New Shipments Create Savings Following Standards

Momentum Savings from Appliance Standards 30
These units are not replacing anything, they are simply new stock. Accordingly, when calculating Momentum Savings, we compare them to the alternative products had standards not taken effect. As such, savings associated with new shipments continue to accrue independent of stock turnover. If these units also contribute 0.1 aMW of savings, the incremental savings from new installations would appear as it does in Figure 9.
Figure 9. Illustration of Incremental Savings from New Shipments

Momentum Savings from Appliance Standards 31
To recap, both replacements and new installations create Momentum Savings while the stock is turning over – a period lasting one product lifetime after standards take effect. However, only new installations generate savings after the stock has turned over, because after that point replacements are replacing already-standards compliant units. Adding the savings from replacement shipments to those arising from new installations produces the characteristic pattern of Momentum Savings from standards as illustrated in Figure 10.
Figure 10. Momentum Savings from Appliance Standards
Products/Equipment and Savings Aggregation
The research team combined the standards analysis results by sector, namely, the residential and the nonresidential sector. The team further breaks down the residential aggregated results into the three residential building types: single family, multi-family, and manufactured homes.
Similarly, the non-residential sector aggregated results can reflect savings across to seventeen commercial building types. The research team leveraged CBSA data to vary the saturation assumptions by building type when available. When CBSA is not available, the team developed saturation of the product by scaling DOE shipment data.
Products such as battery chargers, external power supplies, and small electric motors are applicable to residential, commercial, and industrial sectors. Due to the span of these products in all sectors, Navigant analyzed these products with stand-alone models. Thus, these models are not linked to the central residential or commercial models.

Momentum Savings from Appliance Standards 32
Results This section presents the results from residential, non-residential, and cross-sector products. The results include the savings from both 2013 and 2014 analysis cycles to give a comprehensive picture of the impact of the analyzed standards. This section also shows the adjustments made to the Sixth Plan’s forecast using up-to-date data which was unavailable at the time of the writing of the Plan.
Residential Sector Results Table 2 displays the regional residential site savings and BPA residential sector site savings impact of the analyzed standards from 2010 to 2015 and from 2016 to 2034. The aggregated Momentum Savings due to standards before program adjustments of the analyzed products is 35.2 aMW (with line loss, or “busbar” accounted for) from 2010 to 2015 for the Pacific Northwest. Region-specific savings are 14.8 aMW (with busbar).
Table 2. Residential Standards-Induced Momentum Savings (aMW) with Busbar
Product Region BPA
2010-2015 2016-2034 2010-2015 2016-2034
Res Dishwashers 1.27 6.16 0.53 2.59
Res Refrigerators 7.53 125.34 3.16 52.64
Res Freezers 1.47 27.34 0.62 11.48
Res Clothes Washers 0.00 0.00 0.00 0.00
Res Water Heaters 14.20 186.20 5.96 78.21
Res Ceiling Fan Lighting Kits 3.75 4.63 1.58 1.94
Res Torchieres 2.91 1.21 1.22 0.51
Res Heat Pumps 1.44 27.34 0.60 11.48
Res Central Air Conditioners 0.02 0.34 0.01 0.14
Res Clothes Dryers 0.87 27.34 0.37 11.48
Res Electric Furnace Fans 0.00 85.36 0.00 35.85
Res Microwaves 0.00 4.42 0.00 1.86
Res Room Air Conditioners 0.30 1.21 0.13 0.51
Total Residential 33.77 496.89 14.18 208.69
Source: Navigant Analysis, 2015 - Note that clothes washers do not yield savings as the Sixth Plan captured the efficiency level of the standard.

Momentum Savings from Appliance Standards 33
Non-Residential Sector Results Table 3 displays the regional commercial sector results of the analyzed standards from 2010 to 2015 and from 2016 to 2034. The total Momentum Savings from standards across the region is 49.66 aMW (with busbar). BPA’s share of these savings is 20.86 aMW (with busbar). These values are for standards impacts alone and do not reflect any adjustments made for programs convering the analyzed products. The majority of the Momentum Savings from 2010-2015 comes from standards on distribution transformers while electric motors and walk-in coolers and freezers contribute significantly to Momentum Savings from 2016 onwards.
Table 3. Non-Residential Standards-Induced Momentum Savings (aMW) with Busbar
Product Region BPA
2010-2015 2016-2034 2010-2015 2016-2034
NonRes Clothes Washers 1.71 8.26 0.72 3.47
NonRes Illuminated Exit Signs 0.00 0.00 0.00 0.00
NonRes Pre-Rinse Spray Valves 0.00 0.00 0.00 0.00
NonRes Refrigeration Equipment 0.00 10.89 0.00 4.57
NonRes Walk-In Coolers and Freezers
2.23 50.79 0.94 21.33
NonRes Electric Motors 0.66 108.33 0.28 45.50
NonRes Distribution Transformers 44.93 318.85 18.87 133.92
NonRes Central Air-Conditioner (Air-Cooled)
0.00 0.20 0.00 0.08
NonRes Central Air-Conditioner (Water-Cooled)
0.01 0.06 0.00 0.03
Non-Res Packaged Terminal Air-Conditioning/Heat Pump
0.12 0.36 0.05 0.15
NonRes Automatic Commercial Icemakers
0.00 7.26 0.00 3.05
NonRes Beverage Vending Machine 0.00 0.00 0.00 0.00
Total Commercial 49.66 505.00 20.86 212.10
Source: Navigant Analysis, 2015

Momentum Savings from Appliance Standards 34
Several products have no standards-induced Momentum Savings above the Sixth Plan baseline:
• Pre-Rinse Spray Valves: The standard was included in the Fifth and Sixth Plans.
• Illuminated Exit Signs: This product was not included in the Sixth Plan because it was assumed to already be at or above the standard with negligible potential remaining.
• Beverage Vending Machine: The Sixth Plan accounted for the standard for this equipment in the baseline.
Cross-Sector Results Battery chargers, external power supplies, and small electric motors are applicable to residential, and non-residential sectors. From 2010-2015, the region’s Momentum Savings from these products sum to 33.26 aMW, of which 13.97 aMW savings is specific to BPA.
Table 4. Products Applicable to All Sectors Standards-Induced Momentum Savings (aMW) with Busbar
Product Region BPA
2010-2015 2016-2034 2010-2015 2016-2034
Battery Chargers 26.51 108.05 11.13 45.38
External Power Supplies 0.00 63.64 0.00 26.73
Small Electric Motors 6.76 58.42 2.84 24.53
Total Commercial 33.26 230.10 13.97 96.64
Source: Navigant Analysis, 2015
Baseline Adjustments BPA estimates Momentum Savings, in part, to improve stakeholders’ understanding of the full contribution of energy efficiency in meeting the region’s energy needs, regardless of whether efficiency improvements result directly from programs. To demonstrate that the Momentum Savings from appliance standards are real (and substantial), analysis should measure savings against the most accurate baseline available. While the Council develops a baseline for each Power Plan based on the data available at the time, the passage of time often presents better, more complete baseline data. For instance, analysts and researchers may publish relevant market data (e.g., ENERGY STAR annual shipment data, NEEA’s RBSA and CBSA studies, program evaluations, industry reports, etc.) just months after the Council finalizes the most recent Power Plan.
A baseline adjustment improves the accuracy of the Momentum Savings estimate while remaining consistent with the spirit of the Council baseline. The intent of the Council baseline is to accurately represent the average unit energy consumption (UEC) in a given market in the plan year. The plan year is the year prior to the years covered by the relevant Power Plan. For this Momentum Savings analysis, 2009 is the plan year for the Sixth Plan, which covers the years 2010 through 2015. The Council made the best
Momentum Savings from Appliance Standards 35
possible estimate of the average UEC in 2009 with the data available when they prepared the Sixth Plan. However, 2009 market data collected after the publication of the Power Plan may indicate that the actual average UEC in 2009 was different than the Council’s estimated baseline. In these cases, the Momentum Savings analyst may seek to adjust the baseline to more accurately reflect the average UEC in 2009. The “adjusted baseline” is the best possible estimate of the actual average UEC in the plan year, based on the data available now.
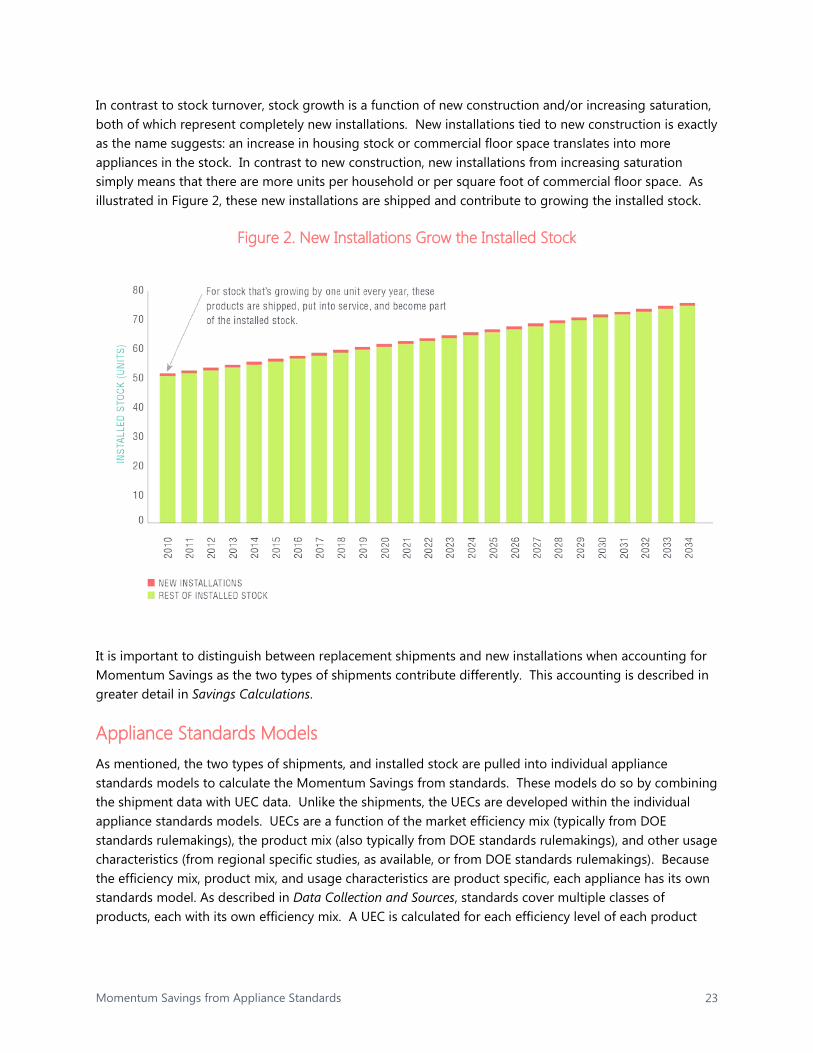
The baseline adjustment essentially “trues up” the Council baseline with the actual market conditions in the plan year, as shown in Figure 11. Since the adjusted baseline reflects the actual average UEC in the plan year, the adjusted baseline (which is frozen over time) and the trend line of actual average UEC as it changes over the analysis period originate from the same point on the graph. The change in actual average UEC over time reflects the changing efficiency mix. The space between the actual UEC trend line and the adjusted baseline in each year of the analysis period represent real energy savings.
Figure 11. Example of a Baseline Adjustment
Baseline adjustments may be up or down from the Council’s original baseline. If the market proves less efficient than the Council expected in the plan year, then the adjusted baseline is higher than the Council baseline.
The research team adjusted baselines only under the following circumstances:
• If newer data sources (e.g., sales data) indicate that the actual efficiency mix9 in the plan year is different than that used in the Council baseline, or
9 Note that the efficiency mix may include substitutional goods that serve the same end use. For instance, the efficiency mix in the residential HVAC market includes two different products which serve the same purpose (forced air furnaces and air source heat pumps) as well as multiple efficiency levels within those product types. If newer sales data revealed that the forced air furnaces’ share of residential HVAC sales in the plan year was higher than estimated in the Power Plan, the analyst would consider a baseline adjustment since forced air furnaces use more energy than air source heat pumps.

Momentum Savings from Appliance Standards 36
• If newer data sources (e.g., sales data) indicate that the product mix in the plan year is different than the plan baseline in instances when products are substitutional.
Baseline adjustments are not always possible. Newer, better data on the plan year’s efficiency or product mix does not always exist. Similarly, the Council baseline may not explicitly report its assumed efficiency mix. Some cases may require assumptions about how to align the newer data with the Council’s baseline. Any such assumptions will be caveated in the Momentum Savings methodologies.
Residential sector. Based on this methodology, the sum of all residential product baseline adjustments for the entire region was -3.64 aMW. BPA’s share of this total is -1.53 aMW.
Table 5. Residential Products’ Baseline Adjustments – Regional and BPA
Product Regional Sixth Plan Baseline Adjustment
(aMW)
BPA Sixth Plan Baseline Adjustment
(aMW)
Residential Clothes Dryers -0.18 -0.08
Residential Dishwashers 1.36 0.57
Residential Freezers -0.06 -0.03
Residential Microwaves -0.19 -0.08
Residential Refrigerators -4.70 -1.97
Residential Room Air Conditioners
0.12 0.05
Total Residential Sector Adjustments
-3.64 -1.53
Source: Navigant Analysis, 2015
Commercial sector. The sum of the one-time baseline adjustments from the commercial products was 2.54 aMW for the region (and 1.07 aMW for BPA’s share).
Table 6. Commercial Products’ Baseline Adjustments – Regional and BPA
Product Regional Sixth Plan
Baseline Adjustments (aMW)
BPA Sixth Plan Baseline Adjustments
(aMW)
NonRes Commercial Refrigeration Equipment 2.54 1.07
Total Commercial Sector Adjustments 2.54 1.07
Source: Navigant Analysis, 2015
Cross sector. There is no baseline adjustment for cross sector products.

Momentum Savings from Appliance Standards 37
Reconciliation with NEEA’s Reports Other programs and organizations in the region also track the markets of the products analyzed in this project. NEEA reports savings to BPA from several initiatives covering such products. Therefore, to ensure that savings are not double-counted, the totals claimable as standards in Table 8 exclude NEEA’s values, as these savings are already accounted for in NEEA’s reporting to BPA. Excluded products include:
• Residential Dishwashers
• Residential Clothes Washers
• Residential Clothes Dryers
• Cross-Sector Battery Chargers
Table 7 summarizes the residential and commercial results by year from 2010 to 2015 before subtracting NEEA’s savings and overlap between standards and non-residential lighting momentum savings.
Table 7. BPA’s Momentum Savings from Standards by Sector by Year (2010-2015) with Busbar
2010 2011 2012 2013 2014 2015 Total
Residential 0.53 0.55 0.56 0.74 0.54 11.25 14.18
Non-Residential 3.38 3.4 3.32 3.54 3.59 3.62 20.85
Cross Sector 0 0 0 0 5.79 8.19 13.97
Lighting 0 1.37 6.87 9.62 9.16 6.87 33.89
Total 3.91 5.32 10.75 13.90 19.08 29.93 82.89
Source: Navigant Analysis, 2015
Table 8 summarizes BPA’s claimable Momentum Savings and baseline adjustments, as well as the adjustments made for overlap between BPA standards lighting momentum savings and non-residential lighting momentum savings, and NEEA’s reported savings.

Momentum Savings from Appliance Standards 38
Table 8. BPA’s Momentum Savings from Standards and Baseline Adjustments for 2010-2015 with Busbar
Momentum Baseline
Adjustment Total
Residential 14.18 -1.53 12.65
Non-Residential 20.85 1.07 21.92
Cross Sector 13.97 0.0 13.97
Lighting 33.89 0.0 33.89
Total 82.89 -0.46 82.43
Less Reported by NEEA -12.03 0.0 70.86
Less Lighting -33.89 0.0 -33.89
Total Remaining Claimable 36.97 -0.46 36.51
Source: Navigant Analysis, 2015
Model Enhancements, Future Improvements, and Data Gaps The following sections describe the research team’s efforts to improve upon the appliance standards models in this round of analysis, areas that the team identified for future model improvements, and gaps in the analysis.
Enhancements to Models The research team made improvements to the appliance standards models as part of the second iteration of this project. These upgrades include developing a common model structure, using standard naming conventions for tabs and variables, and using consistent color coding of tabs, variables, and calculated values. The models now also feature a navigation tab which provides an overview of how data flows throughout the model and contains embedded hyperlinks to navigate between tabs. Each tab also has a link back to the Navigation tab as well as a link to a Comments tab where reviewers may leave feedback, questions, and suggestions for the modeling team.
The team also made significant efforts to source the assumptions within the models, and document the quality of these sources. This allows the team and stakeholders to quickly identify aging assumptions, review model accuracy, and ensure the use of the best available data.
Future Improvements While the models created during this second iteration of analysis effectively quantify energy savings from appliance standards, the research team realizes there is room for improvements to accuracy and ease of use, and suggests the following enhancements to future versions:

Momentum Savings from Appliance Standards 39
• Disaggregation of central models by territory. It is difficult for program managers to recreate the overall size of their territory since the model ties shipments and stock back to the central sector models. Adapting these central stock turnover models to disaggregate results to individual service territories may help program managers better understand the impact of momentum standards in their area and to design better programs. This is especially important for HVAC related standards, the impact of which may vary widely between climate zones across the region.
• Additional commercial building equipment data by building type. Energy consumption varies by building type in both residential and commercial sectors. There is considerable variation in saturation and usage data across different commercial and residential building types. Modeling impacts and forecasts by building type would allow greater insight into the composition of savings and the nature of existing potential, arming programs with better information for acquisition strategies. The team incorporated building level CBSA data to the appropriate standards models. However, the CBSA did not cover all commercial equipment analyzed in the standards project. Future commercial building primary data collection for equipment that were not in the scope of the CBSA 2014 could better inform standard model operating hours, saturation levels, turnover assumptions, and equipment types by building type.
• Improved Saturation Projections. Saturation is a key driver of stock growth and turnover. Where the central stock turnover models have only two points of historic saturations for each appliance, the current approach to modeling saturation over time is crude: linear interpolations between two points and constant values on either side of the window. This is fine for mature markets in which one would not expect much change in saturation over time. However, for new products and emerging technologies this approach is a poor fit. Incorporation of Bass diffusion models into saturation projections (both historic and future) where appropriate is one way to substantially improve the accuracy and realism of these numbers.
• Turnover assumption research. Each model’s turnover assumption—the rationale used by the modeler to “retire” some of the installed stock each year—is the dominant driver of the models’ annual shipment forecasts. To date, the models make the implicit assumption that products fail at a uniform rate. The suitability of this approach varies by product. For mature markets with slow steady growth, it is appropriate in most cases. For emerging technologies or for products of varying lifetimes, more sophisticated approaches using survival curves can be worth the extra effort to characterize the reality of non-uniform failure rates. The analyses could benefit from additional research comparing the two methods on savings impact and appropriateness.
• Variable Input Scenarios. In some instances, the team identified numerous sources of data some of which contradict each other. An example of this is residential clothes dryer usage, for which the NEEA field study and RBSA values disagree on the number of cycles per year. In future models, the team could allow for reviewers to examine multiple scenarios comprised of different, but credible data. This could in turn feed into sensitivity analysis within the model.
• Sensitivity Analysis. Much of the data used in these models is collected with enough statistical rigor that standard errors can accompany the mean values. The RBSA is particularly good at providing them and is cited throughout the analysis. Noting the ability to evaluate the sensitivity to these variables would help establish realistic bounds on estimated savings.

Momentum Savings from Appliance Standards 40
Data Gaps The standards impact analysis model designs mirror, as closely as possible, the structure and assumptions made in the Sixth Plan potential assessment. The purpose of the Sixth Plan was to assess energy resource potential, and therefore focused on products and product classes thought to offer material potential. However, the DOE’s NIA models provide more granularity on product classes and efficiency levels than did the Sixth Plan. Mapping to DOE assumptions would help improve the analytical rigor of the models created in this iteration of the project.
• Residential Data Gaps: End-use load research for many residential products. There is a lack of data regarding operating use, duty cycles, and load profiles for many residential products. Such data would greatly enhance the accuracy and rigor of the models as well as programmatic savings estimates. Only residential clothes dryers and central air conditioners use regional specific data (NEEA field and metering study and SEEM, respectively) in developing their UECs in this round of residential models. Residential models using DOE data include: cooktops, electric ovens, electric furnace fans, microwaves, and room air-conditioners. Load shape data would enable assessment of a broader set of demand-side management activities.
• Non-residential Data Gaps: Electric Motors. The CBSA does not have saturation data for electric motors by horse power distribution and by building type. The team estimated the saturation of electric motors by scaling DOE NIA data. Future data collection of electric motors distribution by horse power would help further customize the analysis for the region.

Momentum Savings from Appliance Standards 41
Additional Products Covered by Standards Table 9 shows all regulated products not analyzed as part of this project cycle. Most of the products listed have small energy savings or primarily use gas.
Table 9. Additional Products Covered by Standards
Sector Products
Residential
• Compact Audio Equipment • DVD Players and Recorders • Pool Pumps • Portable Electric Spas • Dehumidifiers • Residential Ceiling Fans • Pool Heaters • Residential Boilers • Direct Heating Equipment
Commercial/Industrial
• Water Dispensers • Hot Food Holding Cabinets • Commercial Warm Air Furnace • Commercial Water Heating Equipment • Commercial Package Boilers • Commercial Unit Heaters
Lighting • Traffic Signals Modules and Pedestrian Modules
Source: Navigant Analysis, 2015

Momentum Savings from Appliance Standards 42
Appendix A: Acknowledgements This work would not have been possible without the efforts of Carrie Cobb of BPA, who from the project’s conception ensured it was enriched by the participation of many valuable contributors. Chief among those who lent their time, data, and expertise were Kevin Geraghty and Bonnie Watson from BPA, Tom Eckman, Charlie Grist, Tina Jayaweera, and Massoud Jourabchi of the Northwest Power and Conservation Council. The authors would also like to thank Christina Steinhoff of the Northwest Energy Efficiency Alliance.
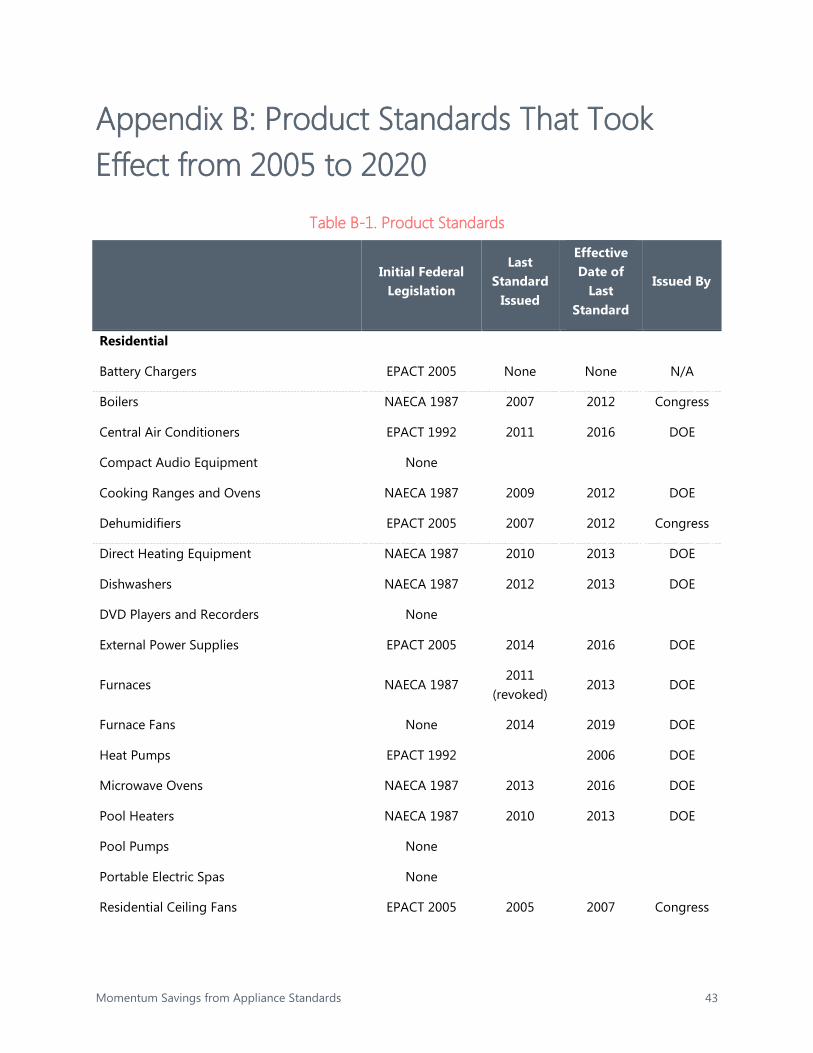
Momentum Savings from Appliance Standards 43
Appendix B: Product Standards That Took Effect from 2005 to 2020
Table B-1. Product Standards
Initial Federal
Legislation
Last Standard
Issued
Effective Date of
Last Standard
Issued By
Residential
Battery Chargers EPACT 2005 None None N/A
Boilers NAECA 1987 2007 2012 Congress
Central Air Conditioners EPACT 1992 2011 2016 DOE
Compact Audio Equipment None
Cooking Ranges and Ovens NAECA 1987 2009 2012 DOE
Dehumidifiers EPACT 2005 2007 2012 Congress
Direct Heating Equipment NAECA 1987 2010 2013 DOE
Dishwashers NAECA 1987 2012 2013 DOE
DVD Players and Recorders None
External Power Supplies EPACT 2005 2014 2016 DOE
Furnaces NAECA 1987 2011
(revoked) 2013 DOE
Furnace Fans None 2014 2019 DOE
Heat Pumps EPACT 1992 2006 DOE
Microwave Ovens NAECA 1987 2013 2016 DOE
Pool Heaters NAECA 1987 2010 2013 DOE
Pool Pumps None
Portable Electric Spas None
Residential Ceiling Fans EPACT 2005 2005 2007 Congress

Momentum Savings from Appliance Standards 44
Initial Federal
Legislation
Last Standard
Issued
Effective Date of
Last Standard
Issued By
Residential Clothes Dryers NAECA 1987 2011 2015 DOE
Residential Clothes Washers NAECA 1987 2012 2015 DOE
Residential Refrigerators and Freezers NAECA 1987 2011 2014 DOE
Residential Room Air Conditioners NAECA 1987 2011 2014 DOE
Residential Water Heaters NAECA 1987 2010 2015 DOE
Commercial/Industrial
Automatic Commercial Ice Makers EPACT 2005 2014 2017 Congress
Commercial CAC and HPs (Air-Cooled, Large)
EPACT 1992 2010 2016 Congress
Commercial CAC and HPs (Air-Cooled, Small)
EPACT 1992 2008 2016 Congress
Commercial CAC and HPs (Air-Cooled, Very Large)
EPACT 1992 2010 2016 Congress
Commercial CAC and HPs (Water- and Evaporatively-Cooled)
EPACT 1992 2012 2013 DOE
Commercial Clothes Washers EPACT 2005 2010 2018 DOE
Commercial Packaged Boilers EPACT 1992 2009 2012 DOE
Commercial Pre-Rinse Spray Valves EPACT 2005 2005 2006 Congress
Commercial Refrigeration Equipment EPACT 2005 2014 2017 DOE
Commercial Warm Air Furnaces EPACT 1992 2004
Commercial Water Heating Equipment EPACT 1992 2001 2003 DOE
Distribution Transformers: Liquid-Immersed and Medium-Voltage, Dry-Type
EPACT 1992 2007 2010 DOE
Distribution Transformers: Low-Voltage Dry-Type
EPACT 2005 2005 2007 Congress
Electric Motors EPACT 1992 2014 2016 Congress
Hot Food Holding Cabinets None

Momentum Savings from Appliance Standards 45
Initial Federal
Legislation
Last Standard
Issued
Effective Date of
Last Standard
Issued By
Packaged Terminal AC and HP EPACT 1992 2008 2012 DOE
Single Package Vertical Air Conditioners & Single Package Vertical Heat Pumps
EISA 2007 2009 2010 DOE
Refrigerated Beverage Vending Machines EPACT 2005 2009 2012 DOE
Unit Heaters EPACT 2005 2005 2008 Congress
Walk-In Coolers and Freezers EISA 2007 2014 2017 Congress
Water Dispensers None
Lighting
Candelabra & Intermediate Base Incandescent Lamps
None 2007 2012 Congress
Ceiling Fan Light Kits EPACT 2005 2005 2007 Congress
Fluorescent Lamp Ballasts NAECA 1988 2011 2014 DOE
General Service Fluorescent Lamps EPACT 1992 2015 2018 DOE
General Service Incandescent Lamps EISA 2007 2007 2012 Congress
High Intensity Discharge Lamps not until 2017
Illuminated Exit Signs EPACT 2005 2005 2006 Congress
Incandescent Reflector Lamps EPACT 1992 2015 2018 DOE
Medium Base Compact Fluorescent Lamps EPACT 2005 2005 2006 Congress
Mercury Vapor Lamp Ballasts EPACT 2005 2005 2008 Congress
Metal Halide Lamp Fixtures EISA 2007 2014 2017 DOE
Torchieres EPACT 2005 2005 2006 Congress
Traffic Signal Modules and Pedestrian Modules
EPACT 2005 2005 2006 Congress

Momentum Savings from Appliance Standards 47
Appendix C: Data Forms for Individual Products
Table C-1. Automatic Commercial Icemakers
Input Description Regional Value Different from
DOE NIA? Regional Value DOE Value Notes Data Source
Usage
Standard Effective Year
Year when standard takes
effect N/A
N/A. Existing BPA model and 6P baseline
captured the previous standard with a 2010
standard effective year
2018

Momentum Savings from Appliance Standards 48
Input Description Regional Value Different from
DOE NIA? Regional Value DOE Value Notes Data Source
Pre-case Efficiency
Distribution
Efficiency level in the 6P
Yes
100% of shipments are at 2010 standard level.
Metric : kWh Self Contained Ice
Makers <200lb : 2436 Self-Contained Ice
Makers >=200 lb. : 7346 Not Self Contained Ice
Makers : 8710 Energy Savings are based on Energy use (kWh/100
lb. of ice), Average Ice Harvest Rate and Duty
Cycle;
Efficiency distributions span over 4-5 EL levels for each product class. See Market
share tab
Efficiency distribution based on
manufacturer surveys
PC_Packaged_Refrig_Equipment.xls
LCC analysis - EERE-2010-BT-STD-0037-0060
NIA Model - EERE-2010-BT-STD-0037-0057
Post-case Efficiency
Distribution
Efficiency level after standard
took effect N/A N/A
2018 Standard corresponds to
TSL 3; See standards tab
The previous standard was based only on Batch type
Ice Makers. The new standard will also
regulate Continuous type Ice Makers.
Hence, there is an additional set of
product classes for Continuous that we need to account for
in this analysis.
DOE NIA Commercial Refrigeration Product
workbook DOE NOPR Table I.1; TSD:
10.5.2 Results for the Adopted Standards

Momentum Savings from Appliance Standards 49
Input Description Regional Value Different from
DOE NIA? Regional Value DOE Value Notes Data Source
Harvest (lbs. of ice/24 hours)
Varies by product
classes, ranges from 101-1036 lbs. /24 hrs.
Varies by product classes, ranges
from 50-2,500 lbs. /24 hrs.
PC_Packaged_Refrig_Equipment.xls
LCC analysis - EERE-2010-BT-STD-0037-0060
NIA Model - EERE-2010-BT-STD-0037-0057
Market
Number of product classes
Number of product classes
Yes Three product classes
Four Equipment types - 32
product classes. See standards
tab; 15 representative
product classes. See Market share tab for product
class distribution.
See Product Classes tab. Additionally, in the new standard,
there is an addition of Continuous type Ice Makers to the
previous Batch type.
PC_Packaged_Refrig_Equipment.xls;
NIA Model - EERE-2010-BT-STD-0037-0057
DOE NOPR

Momentum Savings from Appliance Standards 50
Input Description Regional Value Different from
DOE NIA? Regional Value DOE Value Notes Data Source
Shipments for ice-maker
Equipment shipment by
year N/A
Based on Appliance Magazine 2008
numbers.
Calculated as follows: "Approximate Annual
Sales in 2001" % * Average of 1998 to
2010 shipments (based on Appliance Magazine 2008 numbers)*PNW
population % * shipment growth rate
(based on CRE NIA Econ Trend)
Based on Commercial
Square Footage year-on-year
"growth" (hard coded number in CommercialRefrigerationEquipment_NIA_workbook) - new NIA model has data from 2013 Annual
Energy Outlook
PC_Packaged_Refrig_Equipment.xls
LCC analysis - EERE-2010-BT-STD-0037-0060
NIA Model - EERE-2010-BT-STD-0037-0057
Stock Model
Shipment Growth Rate
Shipment growth rate
based on forecast
No
Average at 1.35%.6P uses NIA analysis,
therefore all shipment assumptions are the
same
New equipment is driven by
construction of new floor space and replacement units are replaced on a one-for-one
basis
DOE TSD Chapter 10 shipment model;
CRE_Final_Rule_NIA_Workbook

Momentum Savings from Appliance Standards 51
Input Description Regional Value Different from
DOE NIA? Regional Value DOE Value Notes Data Source
Lifetime Product Lifetime
N/A 10 years 8.5 years (NIA
model)
DOE TSD Chapter 10 shipment model;
PC_Packaged_Refrig_Equipment.xls

Momentum Savings from Appliance Standards 52
Table C-2. External Power Supplies
Input Description Regional Value Different from
DOE NIA?
Regional Value
DOE Value Notes Data Source
Usage
UEC
Unit energy consumption (accounts for
hours of use per week and device
efficiency)
Yes 6 kWh pre
2006, 2 kWh post 2006
Varies based on product class and
CSL. DOE more specific
Regional: Code write-up DOE: Calculated from DOE External
Power Supplies 2014 Final Rule, Technical Support Document:
National Impact Analysis Spreadsheet, 'Energy Split' tab, column D and 'EPS Inputs' tab,
columns AH:AN
Hours per week
Hours of use per week in various
operational modes,
application states, and
usage trends.
Yes Unclear
Varies based on frequency of use
and mode; accounted for in
UEC values.
DOE more specific
DOE: DOE External Power Supplies 2014 Final Rule, Technical Support Document: Chapter 7: Energy Use
Analysis
5P Baseline Device Efficiency
Fifth Plan baseline device efficiency tiers
Yes
0.983 (2006) (Unclear
what units are)
Varies based on product class and
CSL. DOE more specific
Regional: Code write-up DOE: 10 CFR 430.32 (w)

Momentum Savings from Appliance Standards 53
Input Description Regional Value Different from
DOE NIA?
Regional Value
DOE Value Notes Data Source
6P Baseline Device Efficiency
Sixth Plan baseline device efficiency tiers
Yes
0.983*1.05 (2008-2034)
(Unclear what units
are)
Varies based on product class and
CSL. DOE more specific
Regional: Code write-up DOE: 10 CFR 430.32 (w)
2008 Standard Device Efficiency
Device efficiency after standard
took effect Yes Unclear
Based on UEC. Varies based on product class.
DOE more specific DOE: 10 CFR 430.32 (w)
2016 Standard Device Efficiency
Device efficiency after standard
took effect Yes
Not included
Varies based on product class.
DOE more specific
DOE: DOE External Power Supplies 2014 Final Rule, Technical Support Document: Chapter 5: Engineering
Analysis
Market
Pre-case product class distribution
Number of product class(s) and distribution if standard did
not exist
Yes No product
class separations
Varies based on product class.
DOE more specific
Calculated from 2009 shipments in DOE External Power Supplies 2014
Final Rule, Technical Support Document: National Impact Analysis
Spreadsheet, 'EPS Inputs' tab, column N. Calculation divided 'Product Class Totals' for each
product class by the sum of the 'Product Class Totals' for all product
classes.

Momentum Savings from Appliance Standards 54
Input Description Regional Value Different from
DOE NIA?
Regional Value
DOE Value Notes Data Source
Post-case case product class distribution
Number of product class(s) and distribution factoring in the
effective standard
Yes No product
class separations
NIA model does not assume a
change in market share with standards.
DOE more specific
Calculated from 2009 shipments in DOE External Power Supplies 2014
Final Rule, Technical Support Document: National Impact Analysis
Spreadsheet, 'EPS Inputs' tab, column N. Calculation divided 'Product Class Totals' for each
product class by the sum of the 'Product Class Totals' for all product
classes.
Pre-case efficiency level
distribution
Efficiency distribution of each product
class if standard did not exist
Yes No product
class separations
Varies based on product class.
DOE more specific
DOE External Power Supplies 2014 Final Rule, Technical Support
Document: National Impact Analysis Spreadsheet, 'Inputs' tab, cells
E78:K86
Post-case efficiency level
distribution
Efficiency distribution of each product
class factoring in the effective
standard
Yes No product
class separations
Roll up assumption
DOE more specific
DOE: DOE External Power Supplies 2014 Final Rule, Technical Support Document: Chapter 9: Shipments Analysis, section 9.3.1 (page 9-3)

Momentum Savings from Appliance Standards 55
Input Description Regional Value Different from
DOE NIA?
Regional Value
DOE Value Notes Data Source
Appliance Saturation
Saturation rate of external
power supplies in the NW
region
Yes
Sales volume in 2006: 198
million (times 4% for PNW)
Not included Use 4% of DOE
shipments for NW Regional: Code write-up
Stock Model
Historical Replacement
Units Shipment in 2005
Number of external power
supplies shipped to region in
2005
Yes Not
included Varies based on product class.
DOE more specific
DOE External Power Supplies 2014 Final Rule, Technical Support
Document: National Impact Analysis Spreadsheet, 'Inputs' tab, cells
C52:C60
New Construction forecast
New construction forecast from
2005-2030
Yes Not
included
Based on population growth
rate (0.75%) DOE more specific
DOE External Power Supplies 2014 Final Rule, Technical Support
Document: National Impact Analysis Spreadsheet, 'Inputs' tab, cells
J52:J60
Product Lifetime External Power Supply Product
Lifetime Yes
Not included
Varies based on product class.
DOE more specific
DOE External Power Supplies 2014 Final Rule, Technical Support
Document: National Impact Analysis Spreadsheet, 'Inputs' tab, cells
AA52:AA60
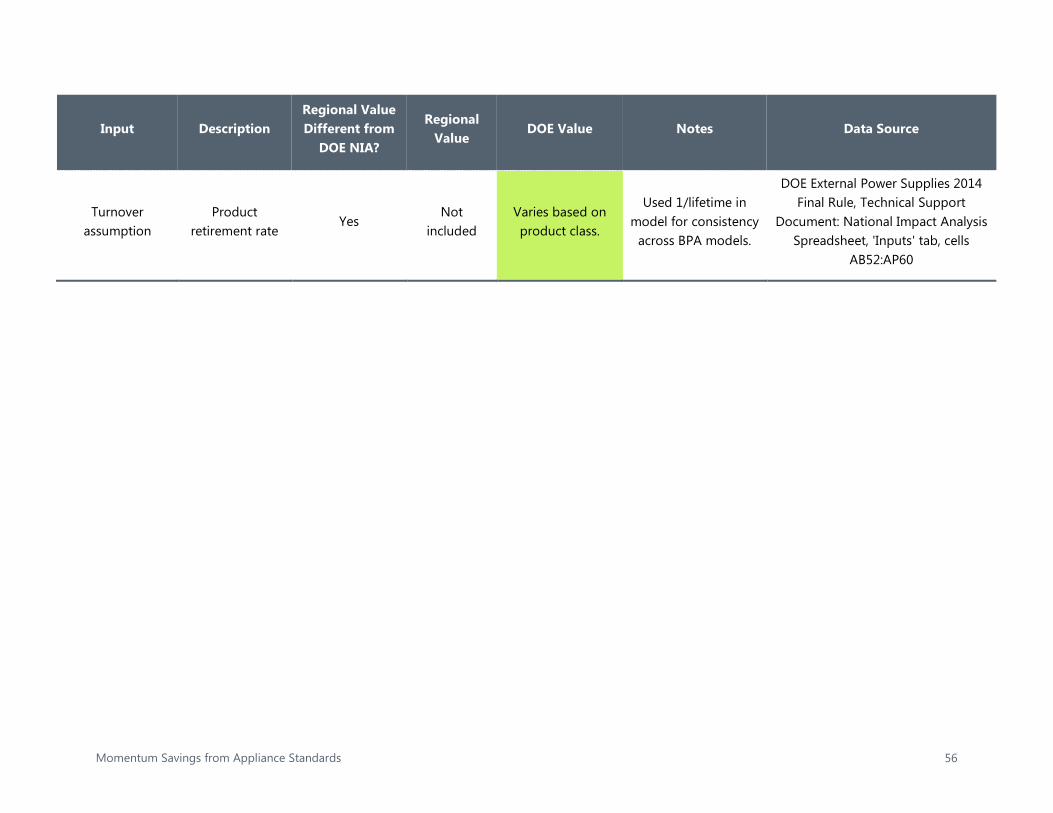
Momentum Savings from Appliance Standards 56
Input Description Regional Value Different from
DOE NIA?
Regional Value
DOE Value Notes Data Source
Turnover assumption
Product retirement rate
Yes Not
included Varies based on product class.
Used 1/lifetime in model for consistency
across BPA models.
DOE External Power Supplies 2014 Final Rule, Technical Support
Document: National Impact Analysis Spreadsheet, 'Inputs' tab, cells
AB52:AP60

Momentum Savings from Appliance Standards 57
Table C-3. Commercial Beverage Vending Machines
Input Description Regional Value Different from
DOE NIA? Regional Value DOE Value Notes Data Source
Usage
Standard Effective Year
Standard Effective Year
No 2012 2012 DOE Final Rule
published August 31, 2009
Pre-case efficiency
distribution
Efficiency level in the 6P
Yes
Standard included in 6P but with the assumed standard level in the 6P is different from the final rule.
The council assumed TSL 4 for Beverage Vending Machine
products as the standard while the final rule is TSL 6 for Class A
vending machines and TSL 3 for Class B machines. This has been
corrected in the existing BPA models.
Calculated using hard coded annual energy consumption (in
Commercial Refrigeration Equipment analysis workbook -
2012 Assumptions tab B213-K216) and market share (market share based on 2010 shipment from
ANOPR workbook).
N/A PC_Packaged_Refrig_Eq
uipment.xls

Momentum Savings from Appliance Standards 58
Input Description Regional Value Different from
DOE NIA? Regional Value DOE Value Notes Data Source
Post-case efficiency
distribution
Minimum Standard
Yes
100% at Level 4. Based on hard
coded annual energy consumption (in Commercial Refrigeration
Equipment analysis workbook) and market share. Existing BPA model
updated post-case with the correct TSLs.
100% at TSL 6 for Class A and TSL 3 for Class B.
See Standards tab. Calculated at TSL6 and
TSL3 and based on hard coded energy
consumption (in Commercial
Refrigeration Equipment analysis workbook) and
market share
DOE NIA Commercial Refrigeration Product
workbook
Beverage Vending Machines
Volume (cu.ft.)
Average volume of Beverage Vending
Machines by Product Classes
No
Ranges from 17-34 cu.ft. UEC is calculated in Commercial
Refrigeration Equipment analysis workbook from a hard coded
number (sourced from ANOPR)
Ranges from 17-34 cu.ft. depending on
configuration, document at equipment
specification tab in model
Supply Curves and Standards
Product Classes Volume are
different
DOE Final Rule TSD Chapter 7 - Page 7-2,
Table 7.2.1
Number of product classes
Number of product classes
No Six Product Classes. Same as DOE Six Product Classes See Product Classes tab
1. 2009 DOE Direct Final Rule, Table I.1,
VI.1 and VI.2

Momentum Savings from Appliance Standards 59
Input Description Regional Value Different from
DOE NIA? Regional Value DOE Value Notes Data Source
Market
Shipment for
beverage machines
Equipment shipment by
year No
Historical shipments sourced from State of the Vending Machine Industry (2006) and National
Automatic Merchandising Association. Data captured in
ANOPR
Historical shipments sourced from State of the Vending Machine Industry (2006) and National Automatic
Merchandising Association. Data
captured in ANOPR and Direct Final Rule
Supply curves has shipment numbers from
Beverage Vending Machines ANOPR.
Stock Model
Lifetime Product Lifetime
Yes Measure Life in Supply Curves is
14 years Measure Life is 10 years
DOE Final Rule TSD Chapter 8 - Page 8-4,
Table 8.1.1 PC_Packaged_Refrig_Eq
uipment.xls MDataMeasEquip tab

Momentum Savings from Appliance Standards 60
Table C-4. Residential Clothes Dryers
Input Description
Regional Value
Different from DOE NIA?
Regional Value DOE Value Notes Data Source
Usage
Efficiency Levels (Typically this a
baseline for the 6P and one higher level and for DOE it is a
set of efficiency levels)
Combined Energy Factor is the Metric. Units
are lbs./kWh
N/A
2 (not explicitly stated, so we assume it was baseline and a
higher "measure" level")
DOE Standard +2.0 Standby: 3.55, DOE Standard +1.5 W
Standby: 3.56, DOE Standard + 0.08 W Standby: 3.61, Gap Fill + 0.08W Standby: 3.73, Gap Fill + 0,08 W standby:
3.81, Gap Fill/Maximum Available + 0.08 W Standby 4.08, Heat Pump (Max-Tech)
+ 0.08! Standby: 5.42
Found regional distribution in
ResSectorConAssmt_112509Summary, which said 0% above baseline.
2011-04-18_TSD_Chapter_7_Energy_Use_Analysi
s and ResSectorConAssmt_112509Summary
from 6P
Washer Cycles per year
Average annual washing cycles
Yes, different from DOE
SF: 229, MF: 215.6, MH: 207.1 AVG:
224.3 283
Use RBSA 2012 value
RBSA 2012-Single Family/Multi-
Family/Manufactured Housing
Percentage of washer loads that
become dryer loads
Share of washer loads that
become dryer loads
Yes, different from DOE
SF: 89.2%, MF: 91.6%, MH: 88.8%
95% Use RBSA 2012
value
RBSA 2012-Single Family/Multi-
Family/Manufactured Housing

Momentum Savings from Appliance Standards 61
Input Description
Regional Value
Different from DOE NIA?
Regional Value DOE Value Notes Data Source
Dryer Loads Dryer Loads Yes, different
from DOE 311 269
Use RBSA Laundry Field Study Data
2014 NEEA Dryer Field Study: Section
3.4.8. Loads per Year (page 38)
Test load size Average dryer
load Yes, different
from DOE 7.64 8.45
Use Regional Data
2015 NEEA Dryer Field Study:
Appendix A5.2. Dryer Load
Characteristics - Table 33. Dryer
Load Characteristics
DOE TSD Chapter
5. The average load weights for
standard -size units range from 3.8 lbs. To 13.7 lbs. with a mean value of 8.45
lbs.

Momentum Savings from Appliance Standards 62
Input Description
Regional Value
Different from DOE NIA?
Regional Value DOE Value Notes Data Source
Dryer UEC by Vintage
Dryer UEC by Vintage
Yes, different from DOE
1990-1994- (624.2),1995-
1999- (721.7),2000-
2004- (775.2),2005-
2009- (832.8),Post 2009-
(635.5),Total- (761.8)
n/a Using historic
UECs as run up to standard
2014 NEEA Residential Building Stock Assessment: Metering Study,
Table 48. Annual Clothes Dryer Energy Use by
Vintage
Market
Pre-case product class distribution
Number of product class(es) and distribution if standard did
not exist
Yes, different from DOE
1 product class: Electric, Standard (4.4 ft3 or greater
capacity)
6 product classes in DOE.
6 product classes, but Electric,
Standard (4.4 ft3 or greater
capacity) is 97% of market
Post-case case product class distribution
Number of product class(es) and distribution factoring in the
effective standard
Yes, different from DOE
1 product class: Electric, Standard (4.4 ft3 or greater
capacity)
6 product classes in DOE.
6 product classes, but Electric,
Standard (4.4 ft3 or greater
capacity) is 78% of market

Momentum Savings from Appliance Standards 63
Input Description
Regional Value
Different from DOE NIA?
Regional Value DOE Value Notes Data Source
Pre-case efficiency level distribution
Efficiency distribution of each product
class if standard did not exist
Yes different from DOE
Baseline is 3.01 (which was the min standard in place at the time of the Plan (1994
standard) with 100% of
shipments.
6 levels, see below Year before
standard rulemaking GRIM
Post-case efficiency level distribution
Efficiency distribution of each product
class factoring in the effective
standard
Yes, different from DOE
Baseline is 3.01 (which was the min standard in place at the time of the Plan (1994
standard) with 100% of
shipments.
6 levels, see below Year after standard
rulemaking GRIM
Appliance Saturation
Saturation rate of residential
clothes dryers in the NW region
Yes, different from DOE
RBSA: 98% (SF), 47% (MF), 95%
(MH) N/A
Use RBSA 2012 value
RBSA 2012-Single Family/Multi-
Family/Manufactured Housing
Stock Model

Momentum Savings from Appliance Standards 64
Historical Replacement Units Shipment in 2005
Number of CD shipped to
region in 2005 Not applicable Using Sixth Plan
In central residential file
Sixth Plan
New Construction forecast
New construction forecast from
2005-2030
Not applicable Using Sixth Plan In central
residential file Sixth Plan
Product Lifetime Residential
Clothes Dryer Product Lifetime
Yes, different from DOE
14 16 Used DOE
because most recent.
NW Council Supply Curve: Clothes Washers and
Dryers - Single Family
Turnover assumption
Product retirement rate
Yes, different from DOE
1/lifetime
The 1/lifetime assumption is
consistent with the council's
modeling practice.

Momentum Savings from Appliance Standards 65
Table C-5. Residential Microwaves
Input Description
Regional Value
Different from DOE
NIA?
Regional Value
DOE Value Notes Data Source
Usage
Efficiency Levels
(Typically this a
baseline for the 6P and one higher
level and for DOE it is a
set of efficiency
levels)
No, same as DOE
5 Efficiency levels See data tab 2011-04-18_TSD_Chapter_8_Life-
Cycle_Cost_and_Payback_Period_Analyses.pdf
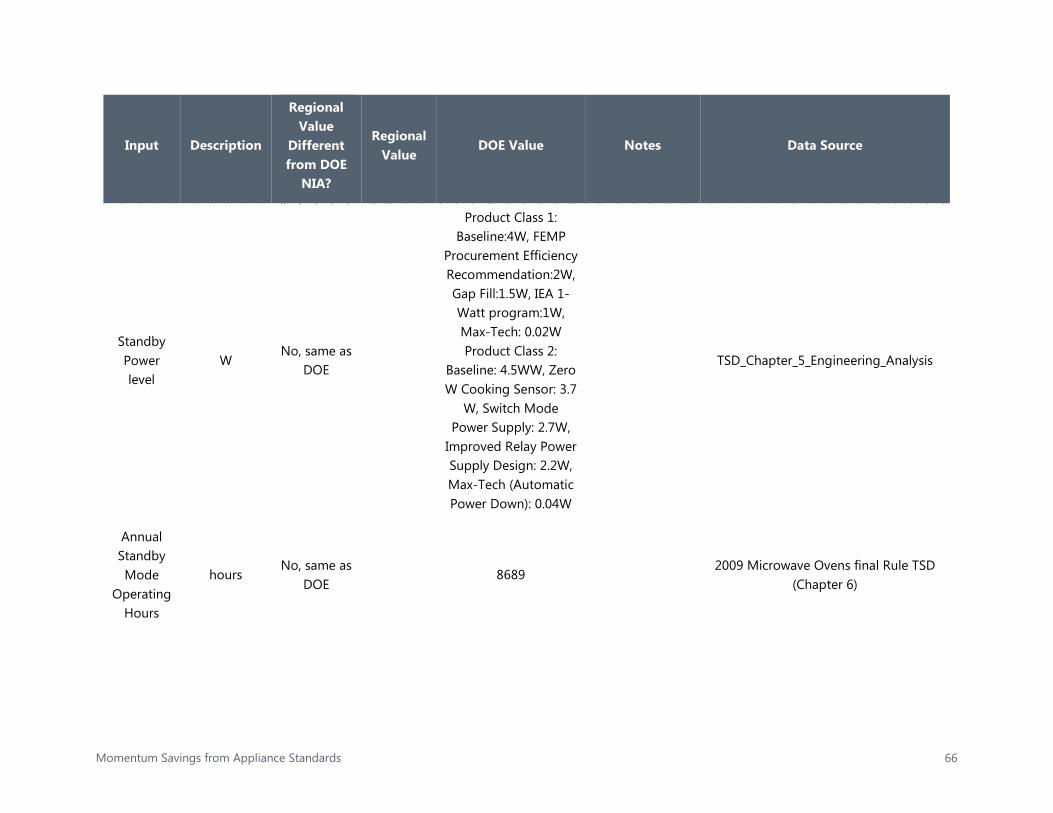
Momentum Savings from Appliance Standards 66
Input Description
Regional Value
Different from DOE
NIA?
Regional Value
DOE Value Notes Data Source
Standby Power level
W No, same as
DOE
Product Class 1: Baseline:4W, FEMP
Procurement Efficiency Recommendation:2W, Gap Fill:1.5W, IEA 1-Watt program:1W, Max-Tech: 0.02W Product Class 2:
Baseline: 4.5WW, Zero W Cooking Sensor: 3.7
W, Switch Mode Power Supply: 2.7W,
Improved Relay Power Supply Design: 2.2W, Max-Tech (Automatic Power Down): 0.04W
TSD_Chapter_5_Engineering_Analysis
Annual Standby Mode
Operating Hours
hours No, same as
DOE 8689
2009 Microwave Ovens final Rule TSD (Chapter 6)

Momentum Savings from Appliance Standards 67
Input Description
Regional Value
Different from DOE
NIA?
Regional Value
DOE Value Notes Data Source
Annual Active Mode
Operating Hours
hours No, same as
DOE 71
2009 Microwave Ovens final Rule TSD (Chapter 6)
Annual Standby Power Energy
Consumption
kWh/year No, same as
DOE Baseline:
17.4
Standard: Product Class 1: 8,6, Product Class 2: 19.1 (This is the first standard)
ResOven_MicrowaveFY09v1_0
Annual Cooking Energy
Consumption
kWh/year No, same as
DOE Baseline:
131 N/A ResOven_MicrowaveFY09v1_0

Momentum Savings from Appliance Standards 68
Input Description
Regional Value
Different from DOE
NIA?
Regional Value
DOE Value Notes Data Source
Annual Energy
Use kWh/year
No, same as DOE
PRODUCT CLASS 1: Baseline: 34.75, CSL1:
17.38, CSL2:13.03, CSL:8.69, CSL4:0.17 PRODUCT CLASS 2:
Baseline: 39.10, CSL1: 32.15, CSL2: 23.46,
CSL3:19.11, CSL4:0.35
2011-04-18_TSD_Chapter_8_Life-
Cycle_Cost_and_Payback_Period_Analyses.pdf
Market
Pre-case product
class distributio
n
Number of product
class(s) and distribution if standard
did not exist
No, same as DOE
2 product classes: Microwave-ovens and
countertop combination
microwave ovens, and Built-in and over-the-
range combination microwave ovens
DOE NIA spreadsheet

Momentum Savings from Appliance Standards 69
Input Description
Regional Value
Different from DOE
NIA?
Regional Value
DOE Value Notes Data Source
Post-case case
product class
distribution
Number of product
class(s) and distribution factoring in the effective
standard
No, same as DOE
2 product classes: Microwave-ovens and
countertop combination
microwave ovens, and Built-in and over-the-
range combination microwave ovens
DOE NIA spreadsheet
Pre-case efficiency
level distributio
n
Efficiency distribution
of each product class if
standard did not exist
No, same as DOE
Baseline appears
to be 4W for
Product class 1
and 4.5W for
Product class 2; 100% at baseline
DOE has efficiency distributions for the analyzed product
classes in the "Data" tab
DOE NIA spreadsheet

Momentum Savings from Appliance Standards 70
Input Description
Regional Value
Different from DOE
NIA?
Regional Value
DOE Value Notes Data Source
Post-case efficiency
level distributio
n
Efficiency distribution
of each product
class factoring in the effective
standard
No, same as DOE
DOE has efficiency distributions for the analyzed product
classes in the "Data" tab
DOE NIA spreadsheet
Appliance Saturation
Saturation rate of Res Microwaves in the NW
region
Yes, different
from DOE
Sixth Plan: 100%
2005:89.3% TSD_Chapter_3_Market_and_Technolog
y_Assessment, ResOven_MicrowaveFY09v1_0
Stock Model
Historical Replacement Units Shipment in 2005
Number of residential
microwaves shipped to region in
2005
N/A Using
Sixth Plan

Momentum Savings from Appliance Standards 71
Input Description
Regional Value
Different from DOE
NIA?
Regional Value
DOE Value Notes Data Source
New Constructi
on forecast
New construction
forecast from 2005-
2030
N/A Using
Sixth Plan
2011-04-18_TSD_Chapter_8_Life-Cycle_Cost_and_Payback_Period_Analys
es.pdf
Product Lifetime
Res Dishwasher
Product Lifetime
15 years 9 years Used DOE
because most recent
Turnover assumptio
n
Product retirement
rate 1/lifetime
The 1/lifetime assumption is
consistent with the council's
modeling practice.

Momentum Savings from Appliance Standards 72
Table C-6. Residential Room Air Conditioner
Input Description
Regional Value
Different from DOE
NIA?
Regional Value
DOE Value Notes Data Source
Usage
Standard Year Effective year of
standard N/A N/A 2014 DOE 2011 DFR
Efficiency Levels
(Typically this is a baseline
for the 6P and one higher
level and for DOE it is a set of efficiency
levels)
Combined Energy
Efficiency Ratio (CEER) (Btu/h-
W)
N/A
2: A baseline
and a higher
measure level.
6 Product Classes
Analyzed with between 4 and
6 Els depending on
PC. 8000BTU/hr.
baseline coincides with
6P.
2011-04-
18_TSD_Chapter_7_Energy_Use_Analysis, EStarRoomACFY09v1_0

Momentum Savings from Appliance Standards 73
Input Description
Regional Value
Different from DOE
NIA?
Regional Value
DOE Value Notes Data Source
Standby Energy Use
W N/A N/A 1.4
Based on the test
data, DOE established a baseline
standby/off mode power consumption level of 1.4
W. Sixth Plan did not
consider stand by explicitly.
DOE TSD Chapter 5
Council's Baseline
Assumption Sixth Plan
kWh/year Yes,
different from DOE
Baseline: 375kWh/
year
Depends on product classes (DOE analyzed
6)
EStarRoomACFY09v1_0

Momentum Savings from Appliance Standards 74
Input Description
Regional Value
Different from DOE
NIA?
Regional Value
DOE Value Notes Data Source
Annual hours of use
Hours AC is in use/year
Yes, different
from DOE 460 750
While the difference between
national and regional
values would be expected, we need to discuss with Council how
to deal values.
2011-04-18_TSD_Chapter_7_Energy_Use_Analysis,
EStarRoomACFY09v1_0

Momentum Savings from Appliance Standards 75
Input Description
Regional Value
Different from DOE
NIA?
Regional Value
DOE Value Notes Data Source
Pre-case product class distribution
Number of product class(s) and distribution if standard did
not exist
No, same as DOE
For the Sixth Plan
supply curve,
they used an
average capacity, based on
AHAM national
sales weighted average
from 2007 (8500
btu/hr.)
16 Product Classes in DOE; consolidating
to 6 for simplicity and because DOE only analyzed
6.
Using DOE because it is more recent
(2011).
2011-04-18_TSD_Chapter_9_Shipments_Analysis (2)

Momentum Savings from Appliance Standards 76
Input Description
Regional Value
Different from DOE
NIA?
Regional Value
DOE Value Notes Data Source
Post-case case product
class distribution
Number of product class(s) and distribution factoring in the
effective standard
No, same as DOE
Same as above.
16 Product Classes in DOE; consolidating
to 6 for simplicity and because DOE only analyzed
6.
Using DOE because it is more recent
(2011).
2011-04-18_TSD_Chapter_9_Shipments_Analysis (2)
Pre-case efficiency
level distribution
Efficiency distribution of each product
class if standard did not exist
Yes, different
from DOE N/A
DOE has efficiency
distributions for the
analyzed product classes
in the efficiency
distributions tab
Year before standard
rulemaking GRIM
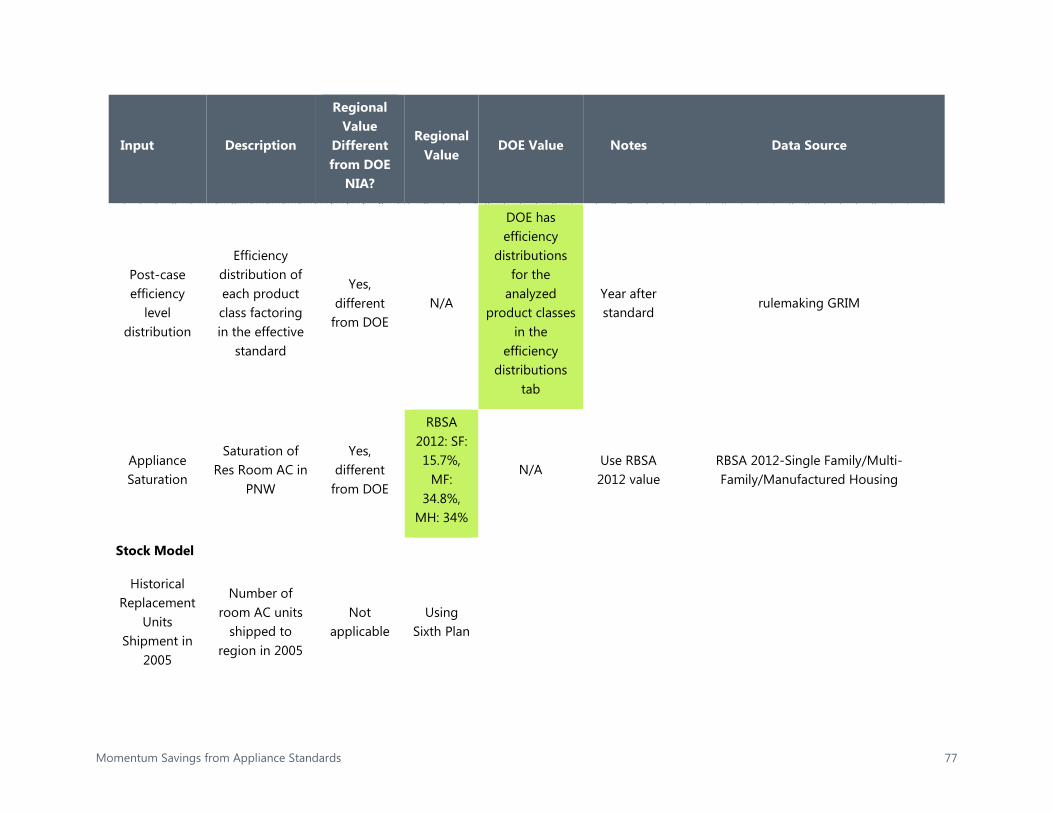
Momentum Savings from Appliance Standards 77
Input Description
Regional Value
Different from DOE
NIA?
Regional Value
DOE Value Notes Data Source
Post-case efficiency
level distribution
Efficiency distribution of each product class factoring in the effective
standard
Yes, different
from DOE N/A
DOE has efficiency
distributions for the
analyzed product classes
in the efficiency
distributions tab
Year after standard
rulemaking GRIM
Appliance Saturation
Saturation of Res Room AC in
PNW
Yes, different
from DOE
RBSA 2012: SF: 15.7%,
MF: 34.8%,
MH: 34%
N/A Use RBSA 2012 value
RBSA 2012-Single Family/Multi-Family/Manufactured Housing
Stock Model
Historical Replacement
Units Shipment in
2005
Number of room AC units
shipped to region in 2005
Not applicable
Using Sixth Plan

Momentum Savings from Appliance Standards 78
Input Description
Regional Value
Different from DOE
NIA?
Regional Value
DOE Value Notes Data Source
New Construction
forecast
New construction forecast from
2005-2030
Not applicable
Using Sixth Plan
Product Lifetime
Room AC Product Lifetime
Yes, different
from DOE 9 10.5
Used DOE because
most recent
Turnover assumption
Product retirement rate
Yes, different
from DOE 1/lifetime
The 1/lifetime
assumption is consistent
with the council's modeling practice.
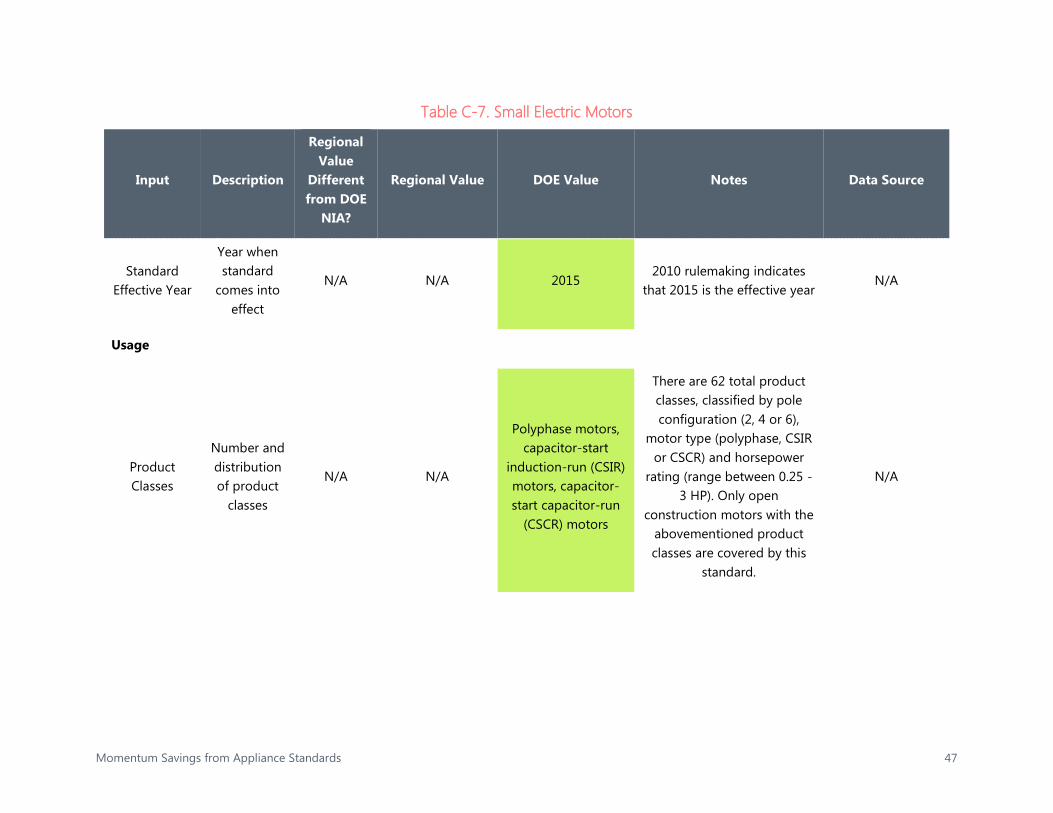
Momentum Savings from Appliance Standards 47
Table C-7. Small Electric Motors
Input Description
Regional Value
Different from DOE
NIA?
Regional Value DOE Value Notes Data Source
Standard Effective Year
Year when standard
comes into effect
N/A N/A 2015 2010 rulemaking indicates
that 2015 is the effective year N/A
Usage
Product Classes
Number and distribution of product
classes
N/A N/A
Polyphase motors, capacitor-start
induction-run (CSIR) motors, capacitor-start capacitor-run
(CSCR) motors
There are 62 total product classes, classified by pole configuration (2, 4 or 6),
motor type (polyphase, CSIR or CSCR) and horsepower
rating (range between 0.25 - 3 HP). Only open
construction motors with the abovementioned product classes are covered by this
standard.
N/A

Momentum Savings from Appliance Standards 48
Input Description
Regional Value
Different from DOE
NIA?
Regional Value DOE Value Notes Data Source
Annual Energy
Consumption
DOE calculated average annual
energy use by efficiency
level
N/A N/A
Various values from 858 to 2310
kWh/year for the three motor types at different efficiency
levels
Uses shipment-weighted distribution of product class
shipments to determine weighted average energy use
per unit
N/A
Pre-case efficiency
level
Pre-standard efficiency
level N/A N/A
Polyphase 75.3%, CSIR 57.9%, CSCR
71.4%
These are the baseline efficiencies for the three demonstrated product
classes
N/A
Post-case efficiency
level
Post-standard efficiency
level
N/A N/A Polyphase 83.5% (EL 5), CSIR 77.6% (EL 7),
CSCR 81.7% (EL 3)
Standards require polyphase motors, CSIR and CSCR
motors to meet average full load efficiency levels as specified in the Code of
Federal Regulations, 10 CFR 431.446
N/A

Momentum Savings from Appliance Standards 49
Input Description
Regional Value
Different from DOE
NIA?
Regional Value DOE Value Notes Data Source
Market
Pre-case efficiency
distribution
Efficiency distribution
of each product class
if standard did not exist
N/A N/A Polyphase 54%, CSIR
40%, CSCR 37% baseline
Full distribution contained in model for three product
classes at all efficiency levels N/A
Post-case efficiency
distribution
Efficiency distribution
of each product class factoring in the effective
standard
N/A N/A
Polyphase 97% at EL 5 (or 4b), CSIR 100% at EL 7, CSCR 85% at
EL 3
Modified TSL 4b for polyphase, modified TSL 7 for CSIR (EL 7) and CSCR (EL 3).
N/A
Shipment by Product Class
Motor shipments by
HP class N/A N/A
DOE estimated shipments available for 2008: 750,000
polyphase, 3,100,000 CSIR, 163,158 CSCR
Shipment data is available for 2000 NEMA and can be used to backcast shipment data for the years between 2000 and
2008
N/A

Momentum Savings from Appliance Standards 50
Input Description
Regional Value
Different from DOE
NIA?
Regional Value DOE Value Notes Data Source
Shipment Growth Rate
Sales Growth Estimate
N/A N/A Reference scenario:
1.83%
DOE provides shipment growth scenarios for each
product class N/A
% Sales Applicable to
Standards
Percentage of motor
sales affected by the
standard
N/A N/A 100%
DOE only forecasted shipments for small electric motors that were covered
under this rulemaking
N/A
Stock Model
Lifetime Product lifetime
N/A N/A
Polyphase motors (9 years), CSIR motors
(7 years), CSCR motors (7 years)
Since the different product classes have different lifetime values, each product class has
its own stock model
N/A
Product Turnover
Assumption
Stock Turnover
Rate N/A N/A Weibull distribution
This model uses a replace upon lifetime assumption for the stock turnover model for
simplification.
N/A

Momentum Savings from Appliance Standards 51
Table C-8. Residential Central Air Conditioner
Input Description
Regional Value
Different from DOE
NIA?
Regional Value DOE Value Notes Data Source
Usage
Efficiency Levels Efficiency distribution of
each product class if standard did not exist
No N/A 13-17 in 0.5 SEER increments.
These were used along with the
national shipments to create a shipment
weighted SEER in both the Pre-Case
and Post-Case
DOE GRIM
Efficiency Levels Efficiency distribution of
each product class if standard did not exist
No N/A 13-24.5 in 0.5 SEER
increments.
These were used along with the
national shipments to create a shipment
weighted SEER in both the Pre-Case
and Post-Case
DOE GRIM
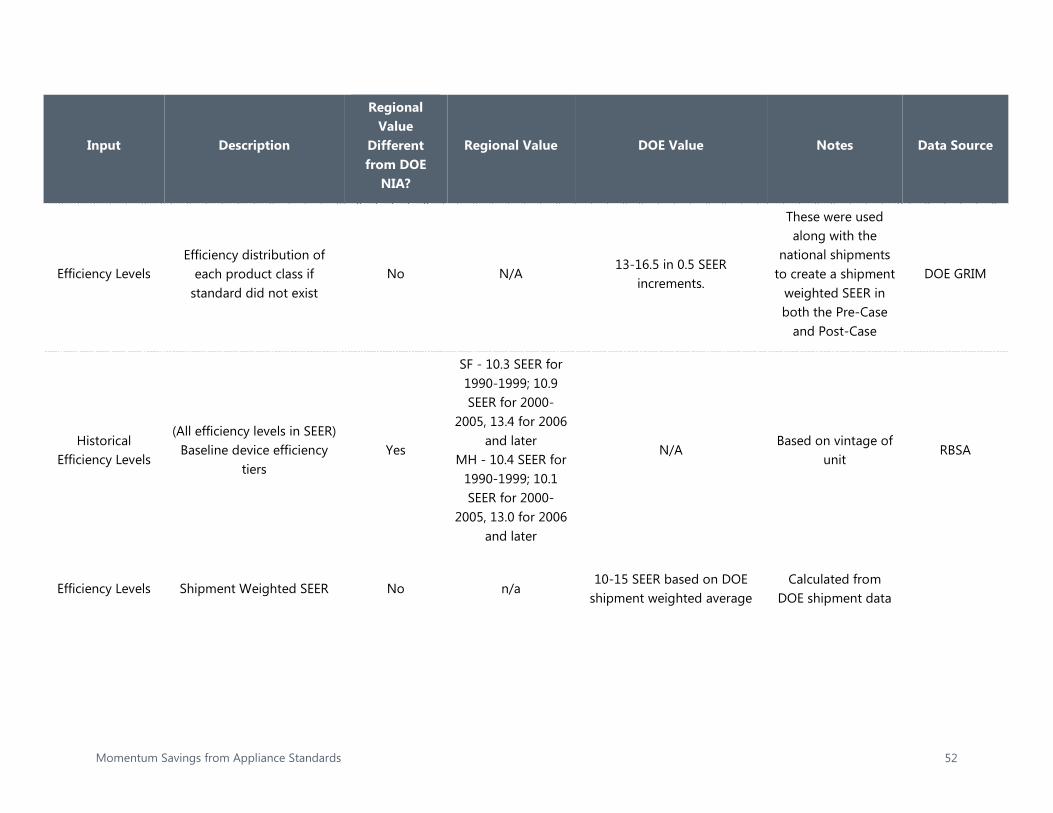
Momentum Savings from Appliance Standards 52
Input Description
Regional Value
Different from DOE
NIA?
Regional Value DOE Value Notes Data Source
Efficiency Levels Efficiency distribution of
each product class if standard did not exist
No N/A 13-16.5 in 0.5 SEER
increments.
These were used along with the
national shipments to create a shipment
weighted SEER in both the Pre-Case
and Post-Case
DOE GRIM
Historical Efficiency Levels
(All efficiency levels in SEER) Baseline device efficiency
tiers Yes
SF - 10.3 SEER for 1990-1999; 10.9 SEER for 2000-
2005, 13.4 for 2006 and later
MH - 10.4 SEER for 1990-1999; 10.1 SEER for 2000-
2005, 13.0 for 2006 and later
N/A Based on vintage of
unit RBSA
Efficiency Levels Shipment Weighted SEER No n/a 10-15 SEER based on DOE
shipment weighted average Calculated from
DOE shipment data

Momentum Savings from Appliance Standards 53
Input Description
Regional Value
Different from DOE
NIA?
Regional Value DOE Value Notes Data Source
Efficiency Levels UEC at Various SEER
Ratings Yes
Varies by Cooling Zone:
10 SEER CZ1: 499, CZ2 1110, CZ3
2017 11 SEER CZ1: 464,
CZ2 1041, CZ3 1901
12 SEER CZ1: 430, CZ2 972, CZ3 1784 13 SEER CZ1: 395, CZ2 903, CZ3 1668 14 SEER CZ1: 355, CZ2 812, CZ3 1508 15 SEER CZ1: 316, CZ2 721, CZ3 1348
N/A
Values extracted from the Single
Family Representative
Building Types in Simplified Energy Enthalpy Model
(SEEM)
DOE TSD
Market
Pre-case efficiency level
distribution
Efficiency distribution of each product class if
standard did not exist No N/A
Varies by Year (Annual Market Average SEER
generated from DOE Shipment Data)
Developed from Efficiency Levels and DOE shipments in
the Pre-Case
DOE TSD

Momentum Savings from Appliance Standards 54
Input Description
Regional Value
Different from DOE
NIA?
Regional Value DOE Value Notes Data Source
Post-case efficiency level
distribution
Efficiency distribution of each product class factoring
in the effective standard No N/A
Varies by Year (Annual Market Average SEER
generated from DOE Shipment Data)
Developed from Efficiency Levels and DOE shipments in
the Post-Case
DOE TSD
1992 Appliance Saturation
Saturation rate of CAC in the NW region
Yes 9.4%; 1.3%; 7.5% N/A
Saturations for SF, MF, MH,
respectively. DOE model does not
break out saturation by building type
PNWRES'92
2011 Appliance Saturation
Saturation rate of CAC in the NW region
Yes 16.9%; 2.3%; 13.5% N/A
Saturations for SF, MF, MH,
respectively. DOE model does not
break out saturation by building type
RBSA

Momentum Savings from Appliance Standards 55
Input Description
Regional Value
Different from DOE
NIA?
Regional Value DOE Value Notes Data Source
Cooling Zone Housing
Allocation
% of Housing (SF and MH) in each cooling zone
Yes
SF CZ1: 64.3%, CZ2: 25.3%, CZ3:
10.4% MH CZ1: 63.4%, CZ2: 24.9%, CZ3:
11.7%
N/A Housing Allocations extracted from raw
RBSA data RBSA
Stock Model
Product Lifetime Saturations tab in central
residential model Yes 19.5 years 20 years
DOE TSD, Sixth Plan
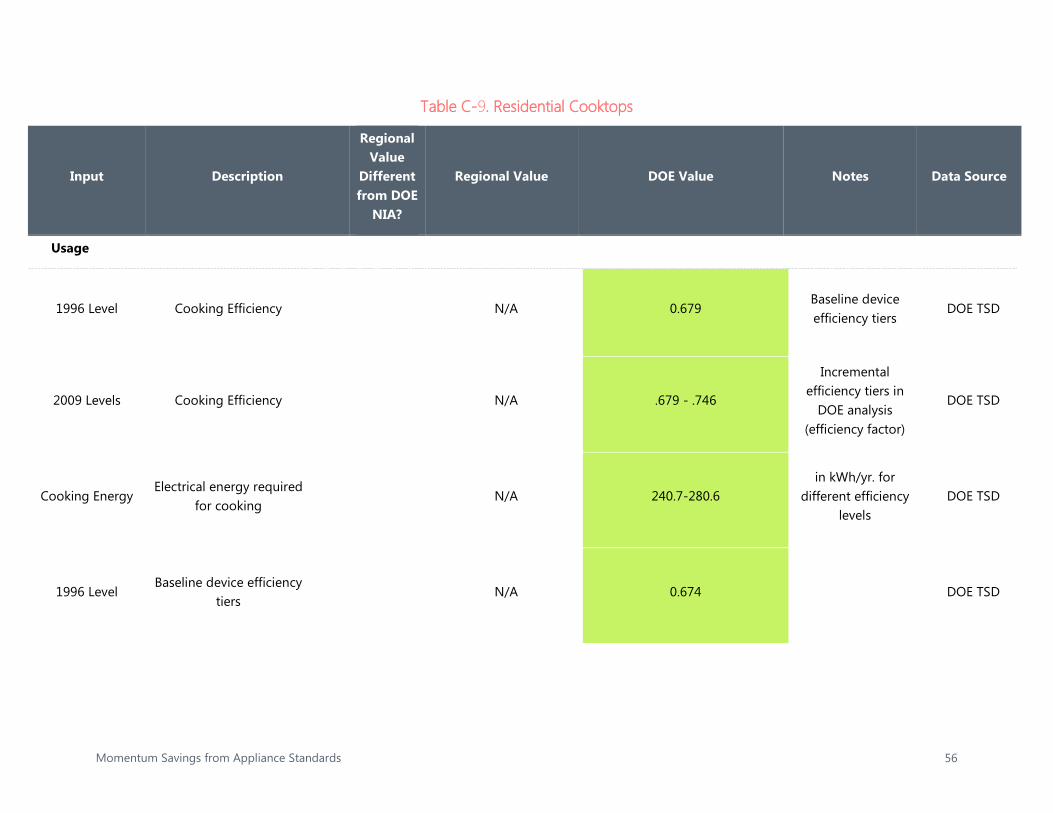
Momentum Savings from Appliance Standards 56
Table C-9. Residential Cooktops
Input Description
Regional Value
Different from DOE
NIA?
Regional Value DOE Value Notes Data Source
Usage
1996 Level Cooking Efficiency N/A 0.679 Baseline device efficiency tiers
DOE TSD
2009 Levels Cooking Efficiency N/A .679 - .746
Incremental efficiency tiers in
DOE analysis (efficiency factor)
DOE TSD
Cooking Energy Electrical energy required
for cooking N/A 240.7-280.6
in kWh/yr. for different efficiency
levels DOE TSD
1996 Level Baseline device efficiency
tiers N/A 0.674 DOE TSD

Momentum Savings from Appliance Standards 57
Input Description
Regional Value
Different from DOE
NIA?
Regional Value DOE Value Notes Data Source
2009 Levels Incremental efficiency tiers in DOE analysis
N/A .674-.704
Cooking efficiency for different
efficiency levels (efficiency factor)
DOE TSD
Cooking Energy Electrical energy required
for cooking N/A 246.0-256.7
in kWh/yr. for different efficiency
levels DOE TSD
Market
Pre-case product class distribution
Number of product class(s) and distribution if
standard did not exist N/A DOE GRIM Model
These are from the DOE NIA
DOE TSD

Momentum Savings from Appliance Standards 58
Input Description
Regional Value
Different from DOE
NIA?
Regional Value DOE Value Notes Data Source
Post-case case product class distribution
Number of product class(s) and distribution factoring in the effective
standard
N/A DOE GRIM Model These are from the
DOE NIA DOE TSD
Pre-case efficiency level
distribution
Efficiency distribution of each product class if
standard did not exist N/A DOE GRIM Model
These are from the DOE NIA
DOE TSD
Post-case efficiency level
distribution
Efficiency distribution of each product class
factoring in the effective standard
N/A DOE GRIM Model These are from the
DOE NIA DOE TSD
Appliance Saturation
Saturation rate of Ovens in the NW region
75.1; 96.9; 88.9% DOE model does not break out by
building type
SF/MF/MH RBSA

Momentum Savings from Appliance Standards 59
Input Description
Regional Value
Different from DOE
NIA?
Regional Value DOE Value Notes Data Source
Pre-case product class distribution
Number of product class(s) and distribution if
standard did not exist N/A DOE GRIM Model
These are from the DOE NIA
DOE TSD
Post-case case product class distribution
Number of product class(s) and distribution factoring in the effective
standard
N/A DOE GRIM Model These are from the
DOE NIA DOE TSD
Pre-case efficiency level
distribution
Efficiency distribution of each product class if
standard did not exist N/A DOE GRIM Model
These are from the DOE NIA
DOE TSD
Post-case efficiency level
distribution
Efficiency distribution of each product class
factoring in the effective standard
N/A DOE GRIM Model These are from the
DOE NIA DOE TSD
Appliance Saturation
Saturation rate of Ovens in the NW region
75.1; 96.6; 88.9% SF/MF/MH
RBSA
Stock Model
Product Lifetime Residential Ovens
Spreadsheet Cooking Eff Tab
N/A 13 years no 6th Plan value DOE TSD

Momentum Savings from Appliance Standards 60
Input Description
Regional Value
Different from DOE
NIA?
Regional Value DOE Value Notes Data Source
Product Lifetime Residential Ovens
Spreadsheet Cooking Eff Tab
N/A 13 years no 6th Plan value DOE TSD

Momentum Savings from Appliance Standards 61
Table C-10. Commercial Clothes Washer
Input Description
Regional Value
Different from DOE
NIA?
Regional Value
DOE Value Notes Regional Data
Source DOE Data Source
Usage
Cycles per Year
Average annual
washing cycle
Only DOE value
available 2190 2190
DOE Commercial Clothes washers NIA, assumption for laundromat
NW Council Supply Curve:
EStarWasher_DryerComLaundry_FY09v1_0
DOE Commercial Clothes washers NIA
Washer Capacity
Average clothes
washer size
Commercial washer
size available in the MF
sector
2.83 cu.ft 2.83 cu.ft DOE Commercial Clothes washers
NIA
NW Council Supply Curve:
EStarWasher_DryerComLaundry_FY09v1_0
DOE Commercial Clothes washers NIA
Water Heating
Fuel Share
DHW heating
market share by fuel type
Yes, different
from DOE
64% electric
20% electric Regional water
heating fuel share is used
NW Council Supply Curve:
EStarWasher_DryerComLaundry_FY09v1_0
DOE Commercial Clothes washers NIA
Clothes Dryer Fuel
Share
Clothes dryer market share by fuel
type
Yes, different
from DOE
82% electric
40% electric Regional water
heating fuel share is used
NW Council Supply Curve:
EStarWasher_DryerComLaundry_FY09v1_0
DOE Commercial Clothes washers NIA

Momentum Savings from Appliance Standards 62
Input Description
Regional Value
Different from DOE
NIA?
Regional Value
DOE Value Notes Regional Data
Source DOE Data Source
6P Baseline device
efficiency
Sixth Plan device
efficiency tiers
Commercial washer efficiency
tiers available in the MF
sector
2 efficiency
levels; 1.04 MEF
2005-2006; 1.26
MEF 2007-2030
5 efficiency levels for front loading, and 3 levels for top
loading
DOE has more efficiency tiers and
product classes
Sixth Plan model code write-up sent to
Navigant from the NW Council in 2013.
DOE Commercial Clothes washers NIA
Standard device
efficiency
Device efficiency
after standard
took effect
Commercial washer efficiency
tiers available in the MF
sector
N/A
2.0 MEF front loading; 1.6
MEF top loading
current values are up to date; the
2012 standard was not included in
the council's forecast
N/A DOE Commercial
Clothes washers NIA
Market
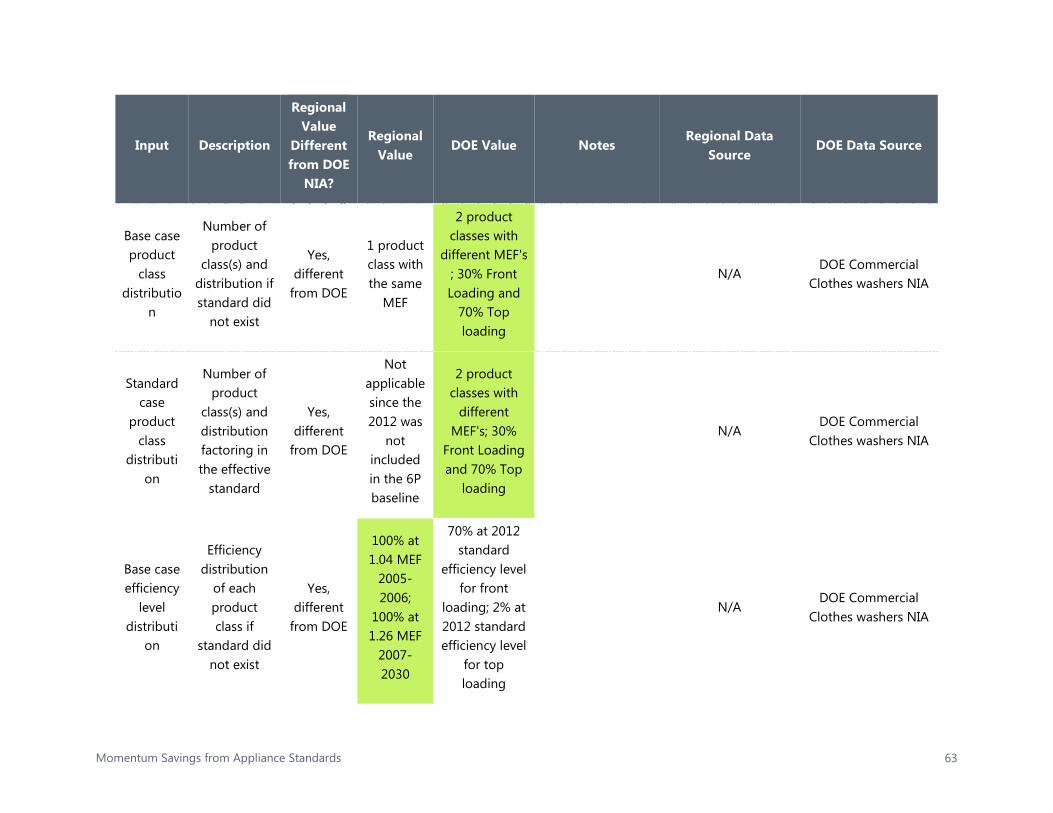
Momentum Savings from Appliance Standards 63
Input Description
Regional Value
Different from DOE
NIA?
Regional Value
DOE Value Notes Regional Data
Source DOE Data Source
Base case product
class distributio
n
Number of product
class(s) and distribution if standard did
not exist
Yes, different
from DOE
1 product class with the same
MEF
2 product classes with
different MEF's ; 30% Front Loading and
70% Top loading
N/A DOE Commercial
Clothes washers NIA
Standard case
product class
distribution
Number of product
class(s) and distribution factoring in the effective
standard
Yes, different
from DOE
Not applicable since the 2012 was
not included in the 6P baseline
2 product classes with
different MEF's; 30%
Front Loading and 70% Top
loading
N/A DOE Commercial
Clothes washers NIA
Base case efficiency
level distributi
on
Efficiency distribution
of each product class if
standard did not exist
Yes, different
from DOE
100% at 1.04 MEF
2005-2006;
100% at 1.26 MEF
2007-2030
70% at 2012 standard
efficiency level for front
loading; 2% at 2012 standard efficiency level
for top loading
N/A DOE Commercial
Clothes washers NIA

Momentum Savings from Appliance Standards 64
Input Description
Regional Value
Different from DOE
NIA?
Regional Value
DOE Value Notes Regional Data
Source DOE Data Source
Standard case
efficiency level
distribution
Efficiency distribution
of each product
class factoring in the effective
standard
Only DOE analysis available
Not applicable since the product was not included
in the commercial sector
100% at standard level
100% compliance at standard
effective year N/A
DOE Commercial Clothes washers NIA
Stock Model
Historical Replacement Units Shipment in 2005
Number of CCW
shipped to region in
2005
Yes, differ-ent from
DOE
Data from Supply
Curve, MF sector
Not applicable
PNW Residential Sector Load Forecast
Copied from PNWResSectorSupplyCurveUnits_Sixth_Fn
l workbook
DOE Commercial Clothes washers NIA
New Construct
ion forecast
New construction
forecast from 2005-
2030
Only DOE analysis available
Data from Supply
Curve, MF sector
Not applicable
PNW Residential Sector Load Forecast
Copied from PNWResSectorSupplyCurveUnits_Sixth_Fn
l workbook
DOE Commercial Clothes washers NIA

Momentum Savings from Appliance Standards 65
Input Description
Regional Value
Different from DOE
NIA?
Regional Value
DOE Value Notes Regional Data
Source DOE Data Source
Product Lifetime
CCW product lifetime
Yes, different
from DOE 14 7.13
Using DOE lifetime because it
is more robust
NW Council Supply Curve:
EStarWasher_DryerComLaundry_FY09v1_0
DOE Commercial Clothes washer NIA
Turnover Assumpti
on
Retirement Rate
Yes, different
from DOE 1/lifetime
Survival curve based on Weibull
distribution
This analysis takes the DOE model and scale it by regional floor
space. Therefore, keeping the
original turnover assumption.
NW Council Supply Curve:
EStarWasher_DryerComLaundry_FY09v1_0
DOE Commercial Clothes washers NIA
Abandon Rate
Retired units not replaced
Yes, different
from DOE 0% 12%
The council's baseline did not
account for abandon rate
N/A DOE Commercial
Clothes washers NIA

Momentum Savings from Appliance Standards 66
Table C-11. Commercial Refrigeration Equipment
Input Description
Regional Value
Different from DOE
NIA?
Regional Value DOE Value Notes Data Source
Usage
Standard Effective
Year
Standard Effective
Year N/A
The 6P included the 2010 and 2012
standards 2017
DOE 2014 Commercial Refrigeration
Equipment Final Rule, Technical Support
Document Chapter 2: Analytical Framework,
page 2-9
5P pre-case
efficiency distributio
n
Efficiency distribution level at 2005
No 100% at TSL level 1 100% at TSL level 1 No difference DOE NIA Commercial Refrigeration Product
workbook

Momentum Savings from Appliance Standards 67
Input Description
Regional Value
Different from DOE
NIA?
Regional Value DOE Value Notes Data Source
6P Pre-case
efficiency distributio
n
Efficiency level
distribution in the 6P
N/A
The 6P Supply curve used the 2010 and 2012 standards as
the baseline for the CRE products for
100% of shipments. See Standards tab; UEC weighted by
shipment
N/A PC_Packaged_Refrig_
Equipment.xls
Post-case efficiency distributio
n
Efficiency level
distribution N/A N/A Varies by product class.
See Standards tab in this spreadsheet.
DOE 2014 Commercial Refrigeration
Equipment Final Rule, National Impacts
Analysis Spreadsheet, Market Share Inputs
tab (entire tab)

Momentum Savings from Appliance Standards 68
Input Description
Regional Value
Different from DOE
NIA?
Regional Value DOE Value Notes Data Source
UEC Unit energy consumptio
n Yes
Sourced from cre_nopr_tsd_cp_6.pfd whereas the Non-hybrid products UEC
were calculated using numbers sourced from
Navigant (industry test measurement)
Varies by product class. Change model to
account for the new product classes.
PC_Pack_Refrig_Equip_6P_D3
DOE 2014 Commercial Refrigeration
Equipment Final Rule, National Impacts
Analysis Spreadsheet, LCC Inputs tab, cells
B3:J29
Market
Number of product
classes
Number of product classes
No
ref &frz- 6 product classes ; non-hybrid ref-frz- 15 product
classes
49 total product classes in 2017 standard
See product classes tab in this
spreadsheet.
PC_Packaged_Refrig_Equipment.xls;
DOE 2014 Final Rule

Momentum Savings from Appliance Standards 69
Input Description
Regional Value
Different from DOE
NIA?
Regional Value DOE Value Notes Data Source
Shipment for non-hybrid
products
Shipment by year for
replacement and new
units
No
Supply Curves has no regional value.
Use 2008 appliance magazine value and scale to region with
4%. Also used ARI, No. 7
Exhibit B at p. 1.
New standard used several different sources:
2005 shipments data provided by the Air-Conditioning, Heating, and
Refrigeration Institute (AHRI) as part of its
comments to the 2009 rulemaking Framework document (Docket No. EERE-2006-STD-0126, ARI, No. 7,
Model updated and changed to account for the new product
classes.
DOE CRE TSD Chapter 9 shipment
model; CRE_Final_Rule_NIA_
Workbook

Momentum Savings from Appliance Standards 70
Input Description
Regional Value
Different from DOE
NIA?
Regional Value DOE Value Notes Data Source
Shipment for ref and
frz products
Equipment shipment by
year N/A
Supply Curves has no regional value.
Use 2008 appliance magazine value and scale to region with
4% Also used ARI, No. 7
Exhibit B at p. 1.
Exhibit B at p. 1) • Commercial Refrigeration Equipment to 2014 by Freedonia Group, Inc. (the Freedonia
2010 report)1 • 2008 Size and Shape of Industry by the North American Association of
Food Equipment Manufacturers and the updated 2013 report (NAFEM
reports)2 • 2012 Size and Shape of Industry by the North American Association of
Food Equipment Manufacturers and the updated 2013 report (NAFEM
reports)3 • Energy Savings Potential and R&D
Opportunities for Commercial Refrigeration
prepared by Navigant Consulting, Inc., for DOE (NCI 2009 report).4
• CBECS 1999 and 2003 survey micro-data.
• Energy Star Unit Equipment and Market Penetration Reports, 2006-
2013.
N/A
PC_Packaged_Refrig_
Equipment.xls;
Stock Model

Momentum Savings from Appliance Standards 71
Input Description
Regional Value
Different from DOE
NIA?
Regional Value DOE Value Notes Data Source
Shipment Growth
Rate
Shipment growth rate based on forecast
No 6P uses 2012 standard NIA
analysis
New equipment is driven by construction of new floor space and replacement units are replaced on a
one-for-one basis. Data source : EIA’s Annual Energy
Outlook (AEO) 2014
DOE TSD Chapter 10 shipment model;
CRE_Final_Rule_NIA_Workbook
Lifetime Product Lifetime
N/A The documented
lifetime in 6P is 10 years.
TSD: DOE used 15 years as the average equipment lifetime for CRE used in small businesses.
Weibull distribution used range of 7-13 years with an average of 10
years For small businesses: Weibull distribution 9-20 years with
average of 15 years.
DOE TSD Chapter 10 shipment model;
CRE_Final_Rule_NIA_Workbook

Momentum Savings from Appliance Standards 72
Table C-12. Residential Furnace Fans
Input Description
Regional Value
Different from DOE
NIA?
Regional Value DOE Value Notes Data Source
Usage
2013 Baseline Baseline device efficiency tiers
N/a 704.8 in kwh/yr. DOE TSD
2013 Levels Incremental
efficiency tiers in DOE analysis
N/a 330.9-610.2 in kwh/yr. varies
by efficiency level DOE TSD
2013 MH FER Efficiency Tiers
for Manufactured Housing
N/a 174.7-328.7 in kwh/yr. varies
by efficiency level DOE TSD
Heating Hours Hours spent in heating mode
N/a 495 DOE TSD
Cooling Hours hours spent in cooling mode
N/a 782 DOE TSD
Annual Electricity Consumption
Electricity Consumption
N/a 553-1110; 312-587 in kwh/yr. varies
by efficiency level DOE TSD
2013 Baseline Baseline device efficiency tiers
801.6 in kwh/yr. DOE TSD

Momentum Savings from Appliance Standards 73
Input Description
Regional Value
Different from DOE
NIA?
Regional Value DOE Value Notes Data Source
2013 Levels Incremental
efficiency tiers in DOE analysis
399.3-699.7 in kwh/yr. varies
by efficiency level DOE TSD
2013 MH FER Efficiency Tiers
for Manufactured Housing
222.3-407.7 in kwh/yr. varies
by efficiency level DOE TSD
Heating Hours Hours spent in heating mode
659 DOE TSD
Cooling Hours hours spent in cooling mode
495 DOE TSD
Annual Electricity Consumption
Electricity Consumption
553-1110; 397-728 in kwh/yr. varies
by efficiency level DOE TSD
2013 Baseline Baseline device efficiency tiers
N/A 739.8 in kwh/yr. DOE TSD
2013 Levels Incremental
efficiency tiers in DOE analysis
N/A 352.3-638.4 in kwh/yr. varies
by efficiency level DOE TSD

Momentum Savings from Appliance Standards 74
Input Description
Regional Value
Different from DOE
NIA?
Regional Value DOE Value Notes Data Source
2013 MH FER Efficiency Tiers
for Manufactured Housing
N/A 0 in kwh/yr. varies
by efficiency level DOE TSD
Heating Hours Hours spent in heating mode
N/A 432 DOE TSD
Cooling Hours hours spent in cooling mode
N/A 1026 DOE TSD
Annual Electricity Consumption
Electricity Consumption
N/A 629-1321 in kwh/yr. varies
by efficiency level DOE TSD
2013 Baseline Baseline device efficiency tiers
N/A 367 in kwh/yr. DOE TSD
2013 Levels Incremental
efficiency tiers in DOE analysis
N/A 171.8-317.3 in kwh/yr. varies
by efficiency level DOE TSD
2013 MH FER Efficiency Tiers
for Manufactured Housing
N/A 103.6-196.6 in kwh/yr. varies
by efficiency level DOE TSD

Momentum Savings from Appliance Standards 75
Input Description
Regional Value
Different from DOE
NIA?
Regional Value DOE Value Notes Data Source
Heating Hours Hours spent in heating mode
N/A 572 DOE TSD
Cooling Hours hours spent in cooling mode
N/A 854 DOE TSD
Annual Electricity Consumption
Electricity Consumption
N/A 294-628; 185-351 in kwh/yr. varies
by efficiency level DOE TSD
Market
Pre-case product class distribution
Number of product class(s) and distribution if standard did
not exist
N/a DOE GRIM Model GRIM uses NIA
shipments. DOE TSD

Momentum Savings from Appliance Standards 76
Input Description
Regional Value
Different from DOE
NIA?
Regional Value DOE Value Notes Data Source
Post-case case product class distribution
Number of product class(s) and distribution factoring in the
effective standard
N/a DOE GRIM Model GRIM uses NIA
shipments. DOE TSD
Pre-case efficiency level
distribution
Efficiency distribution of each product
class if standard did not exist
N/a DOE GRIM Model GRIM uses NIA
shipments. DOE TSD
Post-case efficiency level
distribution
Efficiency distribution of each product
class factoring in the effective
standard
N/a DOE GRIM Model GRIM uses NIA
shipments. DOE TSD
Appliance Saturation
Saturation rate of Furnaces in the
NW region 54.1; 5.7; 64.3 N/A
SF/MF/MH; DOE model does not
break out by building type
RBSA

Momentum Savings from Appliance Standards 77
Input Description
Regional Value
Different from DOE
NIA?
Regional Value DOE Value Notes Data Source
Pre-case product class distribution
Number of product class(s) and distribution if standard did
not exist
N/a DOE GRIM Model GRIM uses NIA
shipments. DOE TSD
Post-case case product class distribution
Number of product class(s) and distribution factoring in the
effective standard
N/a DOE GRIM Model GRIM uses NIA
shipments. DOE TSD
Pre-case efficiency level
distribution
Efficiency distribution of each product
class if standard did not exist
N/a DOE GRIM Model GRIM uses NIA
shipments. DOE TSD
Post-case efficiency level
distribution
Efficiency distribution of each product
class factoring in the effective
standard
N/a DOE GRIM Model GRIM uses NIA
shipments. DOE TSD

Momentum Savings from Appliance Standards 78
Input Description
Regional Value
Different from DOE
NIA?
Regional Value DOE Value Notes Data Source
Appliance Saturation
Saturation rate of Furnaces in the
NW region 54.1; 5.7; 64.3 N/A
DOE model does not break out by
building type RBSA
Pre-case product class distribution
Number of product class(s) and distribution if standard did
not exist
N/A DOE GRIM Model GRIM uses NIA
shipments. DOE TSD
Post-case case product class distribution
Number of product class(s) and distribution factoring in the
effective standard
N/A DOE GRIM Model GRIM uses NIA
shipments. DOE TSD
Pre-case efficiency level
distribution
Efficiency distribution of each product
class if standard did not exist
N/A DOE GRIM Model GRIM uses NIA
shipments. DOE TSD

Momentum Savings from Appliance Standards 79
Input Description
Regional Value
Different from DOE
NIA?
Regional Value DOE Value Notes Data Source
Post-case efficiency level
distribution
Efficiency distribution of each product
class factoring in the effective
standard
N/A DOE GRIM Model GRIM uses NIA
shipments. DOE TSD
Appliance Saturation
Saturation rate of Furnaces in the
NW region 54.1; 5.7; 64.3
SF/MF/MH; DOE model does not
break out by building type
RBSA
Pre-case product class distribution
Number of product class(s) and distribution if standard did
not exist
N/A DOE GRIM Model GRIM uses NIA
shipments. DOE TSD
Post-case case product class distribution
Number of product class(s) and distribution factoring in the
effective standard
N/A DOE GRIM Model GRIM uses NIA
shipments. DOE TSD

Momentum Savings from Appliance Standards 80
Input Description
Regional Value
Different from DOE
NIA?
Regional Value DOE Value Notes Data Source
Pre-case efficiency level
distribution
Efficiency distribution of each product
class if standard did not exist
N/A DOE GRIM Model GRIM uses NIA
shipments. DOE TSD
Post-case efficiency level
distribution
Efficiency distribution of each product
class factoring in the effective
standard
N/A DOE GRIM Model GRIM uses NIA
shipments. DOE TSD
Appliance Saturation
Saturation rate of Furnaces in the
NW region 54.1; 5.7; 64.3
SF/MF/MH; DOE model does not
break out by building type
RBSA
Stock Model
Product Lifetime Furnace fan
lifetime N/A 21.2
No Sixth Plan value
DOE TSD

Momentum Savings from Appliance Standards 81
Table C-13. Electric Motors
Input Description
Regional Value
Different from DOE
NIA?
Regional Value
Suggested Value Notes Data Source
Usage
Standard Effective Year
Year when standard comes
into effect N/A N/A 2016
DOE rulemaking comes into effect in 2016. All NEMA
Design A & B electric motors (the only motor types
covered in this regional analysis) must meet EL 2, specified in the Code of
Federal Regulations, 10 CFR 431.25
10 CFR 431.25
Product Classes Number and
distribution of product classes
Yes
Existing BPA model has 6
product classes: 1-5
HP; 6-20 HP; 21-50HP; 51-100 HP; 101-200 HP; 201-
500 HP
6 product classes in total; 1-5 HP; 6-20 HP; 21-50HP; 51-100 HP; 101-200 HP; 201-500 HP
There are 482 different product classes based on
motor design, pole configuration, enclosure and
horsepower - this analysis simplifies them to six
product classes by horsepower ranges. NEMA Design C, fire pump and
brake pump motors are not included in this analysis due to extremely low shipment
numbers.
DOE Electric Motors Technical Support Document: Table
9.2.2

Momentum Savings from Appliance Standards 82
Input Description
Regional Value
Different from DOE
NIA?
Regional Value
Suggested Value Notes Data Source
Hours of Operation
Annual operating hours per motor
Existing BPA model:
ranges from 2,567 to
5,444
Average operating hours ranges from 1,000 to 7,518 hours per
year, based on sector, application and horsepower
range
DOE Electric Motors Technical Support Document: Table
7.2.8
Pre-case efficiency level
Efficiency levels prior to standard
N/A
Existing BPA model
includes 100% at 2010 standard level
in 2010.
Baseline efficiency levels determined by lowest market efficiency products in motor
databases for NEMA Designs A & B
EL 0: pre-EISA 2007 baseline efficiency level
EL 1: based on NEMA MG-1-2011 Table 12-11
EL 2: based on NEMA MG-1-2011 Table 12-12
EL 3 (best-in-market): based on one NEMA level above EL 2 EL 4 (maximum technology):
based on one NEMA level above EL 3
Baseline efficiency levels based on analysis of motor
database to determine motors with the lowest market efficiency. These
baseline efficiencies were targeted to be lower than
any existing energy conservation standards
(most recently EISA 2007)
DOE Electric Motors Technical Support Document Chapter
5.3

Momentum Savings from Appliance Standards 83
Input Description
Regional Value
Different from DOE
NIA?
Regional Value
Suggested Value Notes Data Source
Post-case efficiency level
2016 standard, weighted
averages to be calculated after
combining horsepower
classes
N/A N/A
Standard requires all covered products to meet EL 2 efficiency levels (as specified in the Code of Federal Regulations, 10 CFR
431.25
DOE Electric Motors Technical Support
Document: Table 5-4
Market
Market Distribution by
Sector
Electric Motors were shipped to the commercial, industrial, and
agricultural sectors
N/A
Existing BPA model: 72% commercial;
28% Industrial
26.1% industrial, 73.8% commercial, 0.1% agricultural for motor classes 1-5 HP; 6-20
HP; and 21-50 HP 63.3% industrial, 29.7%
commercial, 7.0% agricultural for motor classes 51-100 HP
76.0% industrial, 20.6% commercial, 3.4% agricultural for motor classes 101-200 HP
69.1% industrial, 27.9% commercial, 3.0% agricultural for motor classes 201-500 HP
DOE Electric Motors Technical Support Document: Table
7.2.6

Momentum Savings from Appliance Standards 84
Input Description
Regional Value
Different from DOE
NIA?
Regional Value
Suggested Value Notes Data Source
Base case efficiency level
distribution
Efficiency distribution of each product
class if standard did not exist
N/A
Existing BPA model: 2005-2009: 100% at
pre-EISA level; 2010:
100% at EISA
Distribution based on DOE basecase efficiency distribution for 2012 and 2016 - onward; the efficiency distribution accounts for the impact of expansion in
scope
DOE Electric Motors: EERE-2010-BT-STD-0027-0112 - NEMA
Design A & B Motors
Standard case efficiency level
distribution
Efficiency distribution of each product
class factoring in the effective
standard
N/A N/A Distribution based on DOE
policy case efficiency distribution for 2016 - onward
DOE Electric Motors: EERE-2010-BT-STD-0027-0112 - NEMA
Design A & B Motors

Momentum Savings from Appliance Standards 85
Input Description
Regional Value
Different from DOE
NIA?
Regional Value
Suggested Value Notes Data Source
Shipment by Product Class
Motor shipments by HP class
N/A
Existing BPA model:
Shipment data sourced from NEMA shipment
DOE developed total shipment estimates for 2011 based on
IMS market research report and data provided by motor
stakeholders such as NEMA, manufacturers and multiple
other sources
Shipment data also available at the sector and application level. DOE data was driven
by data collected from extensive field
measurements by the Washington State University Extension Energy Program (WSU), Applied Proactive
Technologies and the New York State Energy Research and Development Authority
(NYSERDA) 2 (“WSU/NYSERDA database”), and field data compiled by the Industrial Assessment
Center (IAC) at Oregon State University (OSU) (“Northwest
Industrial Database”)
DOE Electric Motors Technical Support Document: Table
9.2.2

Momentum Savings from Appliance Standards 86
Input Description
Regional Value
Different from DOE
NIA?
Regional Value
Suggested Value Notes Data Source
Shipment Growth Rate
Sales Growth Estimate
N/A
Existing BPA model:
average at 1.4%
Varies - based on Private Fixed Investments Index for
applicable equipment and structures
DOE used annual growth rates in private fixed
investment for applicable equipment and structures
(including motors) as a proxy for annual shipment growth rates, using sources from the U.S. Census Bureau, NEMA
and the Bureau for Economic Analysis
DOE Electric Motors: EERE-2010-BT-STD-0027-0109 - Electric
Motors Shipment Analysis
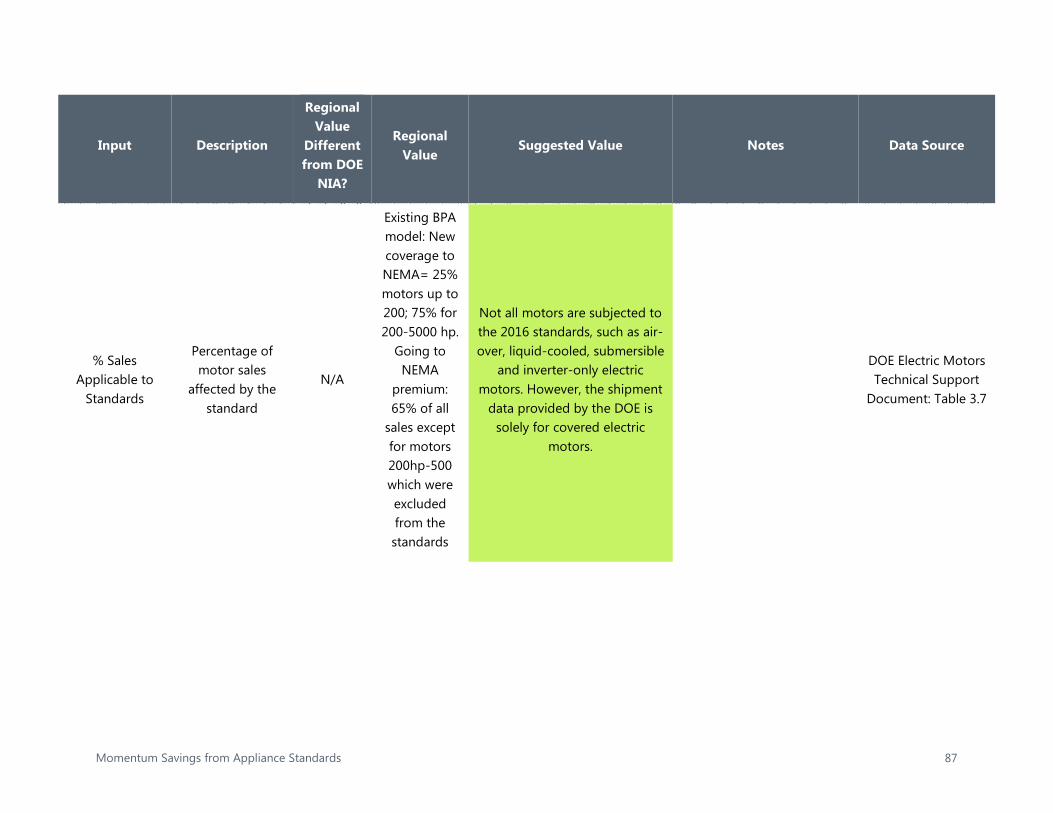
Momentum Savings from Appliance Standards 87
Input Description
Regional Value
Different from DOE
NIA?
Regional Value
Suggested Value Notes Data Source
% Sales Applicable to
Standards
Percentage of motor sales
affected by the standard
N/A
Existing BPA model: New coverage to NEMA= 25% motors up to 200; 75% for 200-5000 hp.
Going to NEMA
premium: 65% of all
sales except for motors 200hp-500 which were excluded from the standards
Not all motors are subjected to the 2016 standards, such as air-over, liquid-cooled, submersible
and inverter-only electric motors. However, the shipment
data provided by the DOE is solely for covered electric
motors.
DOE Electric Motors Technical Support
Document: Table 3.7

Momentum Savings from Appliance Standards 88
Input Description
Regional Value
Different from DOE
NIA?
Regional Value
Suggested Value Notes Data Source
Stock Model
Lifetime Product lifetime Yes
Existing BPA model: Varies from 17-29
years
Varies by motor classes and sector type; weighted average lifetime range from 8 years to
29 years
Different sectors and applications have different
total operating hours, meaning that one motor can
have multiple lifetimes across sectors.
DOE Electric Motors Technical Support Document: Table
8.2.22
Product Turnover
Assumption
Stock Turnover Rate
Yes Existing BPA
model: 1/lifetime
Weibull distribution Parameters included within
the DOE TSD
DOE Electric Motors Technical Support Document: Table 8.2.25 and Table
8.2.26

Momentum Savings from Appliance Standards 89
Table C-14. Illuminated Exit Signs
Input Description
Regional Value
Different from DOE NIA?
Regional Value DOE Value Notes Data Source
Usage
Operating hours per year
24/7 operation N/A 8760 hours/year N/A
Used in supply curve, found in several
resources including DOE 2008 Report
Supply Curve (PC_Exit_Sign_6P_D2.xls
); http://apps1.eere.energy.gov/buildings/publications/pdfs/ssl/nichefinalreport_october2008.pd
f
Number of faces
Number of sides of the exit sign
N/A 2 N/A Supply curve assumes
all signs are double sided.
Supply Curve (PC_Exit_Sign_6P_D2.xls
)
5P Baseline Device
Efficiency
Fifth Plan baseline device efficiency
N/A Not included N/A N/A N/A

Momentum Savings from Appliance Standards 90
Input Description
Regional Value
Different from DOE NIA?
Regional Value DOE Value Notes Data Source
6P Baseline Device
Efficiency
Sixth Plan baseline device efficiency
N/A Incandescent 16 W/face, CFL 8.5
W/face, LED 3 W/face N/A Values for 2007
Supply Curve (PC_Exit_Sign_6P_D2.xls
); http://apps1.eere.energy.gov/buildings/publications/pdfs/ssl/nichefinalreport_october2008.pd
f
2006 Standard Device
Efficiency
Device efficiency after standard took
effect N/A 5 W/face N/A
Regional standards never went into effect
because of EPACT 2005
DOE (10 CFR 431 Subpart L)
Market
Pre-case product class distribution
Number of product class(s) and
distribution if standard did not
exist
N/A 85% LED, 10% CFL, 5% Incandescent in
2010 N/A
Supply Curve (PC_Exit_Sign_6P_D2.xls
)
Post-case case product class distribution
Number of product class(s) and
distribution factoring in the effective
standard
N/A 100% LED N/A
Use frozen efficiency at EPACT level (5
W/face), which would be 100% LED
Supply Curve (PC_Exit_Sign_6P_D2.xls
)

Momentum Savings from Appliance Standards 91
Input Description
Regional Value
Different from DOE NIA?
Regional Value DOE Value Notes Data Source
Pre-case efficiency level
distribution
Efficiency distribution of each
product class if standard did not
exist
N/A Incandescent 16 W/face, CFL 8.5
W/face, LED 3 W/face N/A Values for 2007
Supply Curve (PC_Exit_Sign_6P_D2.xls
); http://apps1.eere.energy.gov/buildings/publications/pdfs/ssl/nichefinalreport_october2008.pd
f
Post-case efficiency level
distribution
Efficiency distribution of each
product class factoring in the
effective standard
N/A 100% LED at 5
W/face N/A
Use frozen efficiency at EPACT level (5
W/face)
DOE (10 CFR 431 Subpart L)
Appliance Saturation
Saturation rate of exit signs in the NW
region N/A
1.5 million signs in 2010, scaled based on floor space for
other years
N/A
Based on 2008 national value scaled to 2010 using 1.6% growth rate from
2008 report. Assumes 4% are in NW (from
population?)
Supply Curve (PC_Exit_Sign_6P_D2.xls
); http://apps1.eere.energy.gov/buildings/publications/pdfs/ssl/nichefinalreport_october2008.pd
f
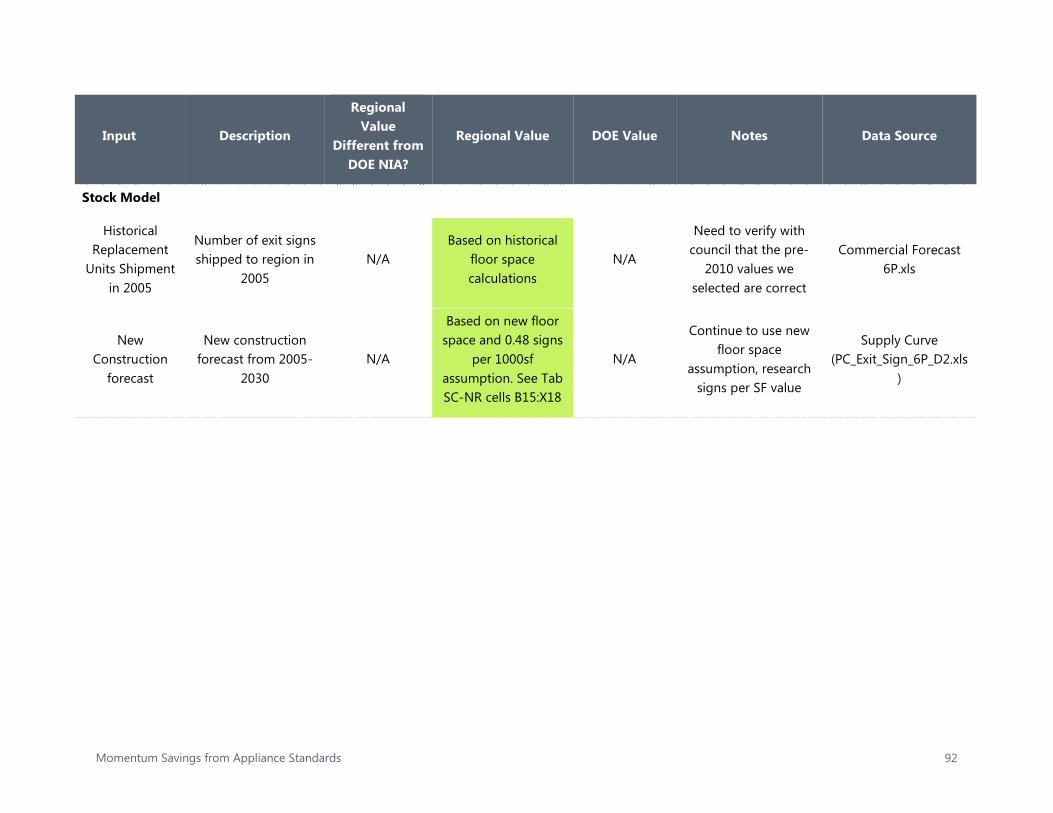
Momentum Savings from Appliance Standards 92
Input Description
Regional Value
Different from DOE NIA?
Regional Value DOE Value Notes Data Source
Stock Model
Historical Replacement
Units Shipment in 2005
Number of exit signs shipped to region in
2005 N/A
Based on historical floor space calculations
N/A
Need to verify with council that the pre-
2010 values we selected are correct
Commercial Forecast 6P.xls
New Construction
forecast
New construction forecast from 2005-
2030 N/A
Based on new floor space and 0.48 signs
per 1000sf assumption. See Tab SC-NR cells B15:X18
N/A
Continue to use new floor space
assumption, research signs per SF value
Supply Curve (PC_Exit_Sign_6P_D2.xls
)

Momentum Savings from Appliance Standards 93
Input Description
Regional Value
Different from DOE NIA?
Regional Value DOE Value Notes Data Source
Product Lifetime Exit sign Product
Lifetime N/A
13.1 years (LED), 10 years (CFL and incandescent)
N/A
Commercial Master sheet says "Average of lighting system
change rate weighted by type" and then calculates turnover
rate as 1/13.1; Lifetime in supply curve listed as 13
years in MDataTestLED and
MDataEquip tabs (but it is unclear if those tabs are relevant in
this analysis)
Supply Curve (PC_Exit_Sign_6P_D2.xls); Commercial Master (Com_Master.xls); PC-
ExitSigns-D1(Plan 5).xls
Turnover assumption
Product retirement rate
N/A 1/lifetime N/A
Commercial Master sheet says "Average of lighting system
change rate weighted by type" and then calculates turnover
rate as 1/13.1
Commercial Master (Com_Master.xls)
Abandon Rate Retired units not
replaced N/A Not included N/A
Assume it is 0% since exit signs are required
for safety N/A

Momentum Savings from Appliance Standards 94
Table C-15. Commercial Pre-Rinse Spray Valve
Input Description Regional Value Different from
DOE NIA? Regional Value DOE Value Notes Data Source
Usage
Annual Days of Operation
Number of days per
year spray valve is used
N/A 365.25 days per
year N/A RTF file
Regional Technical Forum Workbook
(ComCookingPreRinseSprayValve_v2_0 available at http://rtf.nwcouncil.org/m
easures/
Daily Hours of Use
Number of hours per day spray
valve is used
N/A 0.63 hrs./day N/A
From RTF file; Supply curve assumed 1.29
hours per day for Fifth plan, 0.8 for food
service hours pre-case, 1 for food service hours
post-case, 0.1 for grocery service hours
pre-case, 0.14 for grocery service hours
post-case
Regional Technical Forum Workbook
(ComCookingPreRinseSprayValve_v2_0 available at http://rtf.nwcouncil.org/m
easures/

Momentum Savings from Appliance Standards 95
Input Description Regional Value Different from
DOE NIA? Regional Value DOE Value Notes Data Source
Change in water
Temperature
Change in water
temperature from source
to fully heated
N/A 36.3F N/A
From RTF file; 41.8F for food service and 30.3F for grocery service in
supply curves
Regional Technical Forum Workbook
(ComCookingPreRinseSprayValve_v2_0 available at http://rtf.nwcouncil.org/m
easures/
Water Heating
Efficiency
Efficiency of heating
water used in spray
valve
N/A 93% for electric N/A
Water sense report uses 0.90 for electricity and
0.60 for natural gas http://www.epa.gov/WaterSense/docs/prsv_field_study_report_033111v
2_508.pdf).
Supply Curve (C_Spray_Head_6P_D1.xls)
5P Baseline Device
Efficiency
Fifth Plan baseline device
efficiency
N/A
Calculate based on 5500 kWh/head of savings from Fifth
plan
N/A Supply Curve
(C_Spray_Head_6P_D1.xls)
6P Baseline Device
Efficiency
Sixth Plan baseline device
efficiency
N/A 1.6 gpm N/A Supply Curve
(C_Spray_Head_6P_D1.xls)

Momentum Savings from Appliance Standards 96
Input Description Regional Value Different from
DOE NIA? Regional Value DOE Value Notes Data Source
2006 Standard Device
Efficiency
Device efficiency
after standard
took effect
N/A Flow rate of not
more than 1.6 gpm N/A
DOE (10 CFR 431 Subpart O)
Market
Pre-case product class distribution
Number of product
class(s) and distribution if standard
did not exist
N/A No product classes N/A
RTF assumptions include all building types (food service,
grocery, etc.)
Regional Technical Forum Workbook
(ComCookingPreRinseSprayValve_v1_1) available at http://rtf.nwcouncil.org/m
easures/
Post-case case product
class distribution
Number of product
class(s) and distribution factoring in the effective
standard
N/A No product classes N/A
RTF assumptions include all building types (food service,
grocery, etc.)
Regional Technical Forum Workbook
(ComCookingPreRinseSprayValve_v1_1) available at http://rtf.nwcouncil.org/m
easures/

Momentum Savings from Appliance Standards 97
Input Description Regional Value Different from
DOE NIA? Regional Value DOE Value Notes Data Source
Pre-case efficiency
level distribution
Efficiency distribution
of each product class if
standard did not exist
N/A 100% at plan
device efficiency levels
N/A Use frozen efficiency at EPACT level from 2006
and later
DOE (10 CFR 431 Subpart O)
Post-case efficiency
level distribution
Efficiency distribution
of each product
class factoring in the effective
standard
N/A
Same as pre-case since standards
were captured in 5P and 6P
N/A Use frozen efficiency at EPACT level from 2006
and later
DOE (10 CFR 431 Subpart O)
Appliance Saturation
Saturation rate of spray valves in the NW region
N/A
17,755in 2010, scaled to other
years using population growth
rate
N/A
EPA Water Sense specifies 1.35 million
nationally (http://www.epa.gov/WaterSense/docs/prsv_field_study_report_033111v
2_508.pdf)
Supply Curve (C_Spray_Head_6P_D1.xls)
Stock Model

Momentum Savings from Appliance Standards 98
Input Description Regional Value Different from
DOE NIA? Regional Value DOE Value Notes Data Source
Historical Replacement
Units Shipment in
2005
Number of spray valves shipped to region in
2005
N/A
Based on population and
population growth rate calculations
N/A
Commercial Forecast 6P.xls
New Construction
forecast
New construction
forecast from 2005-
2030
N/A Based on
population growth rate
N/A Supply Curve
(C_Spray_Head_6P_D1.xls)
Product Lifetime
Product Lifetime
N/A 5 years N/A
Supply Curve (C_Spray_Head_6P_D1.xls);
Commercial Master (Com_Master.xls)
Turnover assumption
Product retirement
rate N/A 1/lifetime N/A
Commercial Master (Com_Master.xls)
Abandon Rate Retired units not replaced
N/A Not included N/A N/A

Momentum Savings from Appliance Standards 99
Table C-16. Battery Chargers
Input Description Regional Value Different from
DOE NIA? Regional Value DOE Value Notes Data Source
Usage
Pre-case UEC
Average UEC of Non-Compliant
Products No Same as CEC Value
Varies by Product Class
2011 California Energy Commission Staff Analysis of Battery Chargers and Self-Contained Lighting
Controls
Post-case UEC
Average UEC of Compliant
Products No Same as CEC Value
Varies by Product Class
2011 California Energy Commission Staff Analysis of Battery Chargers and Self-Contained Lighting
Controls
Market
Product Classes
List of Covered Product Classes
No Same as CEC Value 18 Product Classes
Based on Application
2011 California Energy Commission Staff Analysis of Battery Chargers and Self-Contained Lighting
Controls
Stock 2009 and 2013 California Stock
Yes
Scaled off CEC value based on
Regional Population
Varies by Product Class
Developed from Efficiency Levels and DOE shipments in the Pre-Case
2011 California Energy Commission Staff Analysis of Battery Chargers and Self-Contained Lighting
Controls

Momentum Savings from Appliance Standards 100
Input Description Regional Value Different from
DOE NIA? Regional Value DOE Value Notes Data Source
California Population
Population of California in
2009 and 2013 N/A N/A
2009: 36,961,229 2013: 38,431,393
Used to develop market
saturation estimates
US Census
PNW Population
Population of PNW in 2009
and 2013 Yes
1980 to 2010 Populations by
County N/A
Very large dataset
US Census Population Estimates Historical
Datasets.
Stock Model
Product Lifetime
Saturations tab in central residential
model
No N/A Varies by Product
Class
2011 California Energy Commission Staff Analysis of Battery Chargers and Self-Contained Lighting
Controls

Momentum Savings from Appliance Standards 101
Table C-17. Walk-in Coolers and Freezers
Input Description
Regional Value
Different from DOE
NIA?
Regional Value DOE Value Notes Data Source
Usage
Standard Effective Year
Year when standard comes
into effect Update
Not in Sixth Plan; 2009 standard
modeled in existing BPA WICF model
2017
Modeled 2009 standard in
previous BPA model, will
update current analysis with
2017 standard
79 FR 32049
Product Classes
WICF have two components- (1)
refrigeration system (2)
envelope which includes the panel
and the display doors.
Possible update
36 combinations of refrigeration
system and envelope with
shipment analyzed in existing BPA WICF model
22 product classes for refrigeration
system and 9 product classes for
envelope (components).
DOE's final rulemaking has
separate models for refrigeration
systems and envelopes.
DOE NIA Walk-in Coolers and Freezers Final Rule Workbook
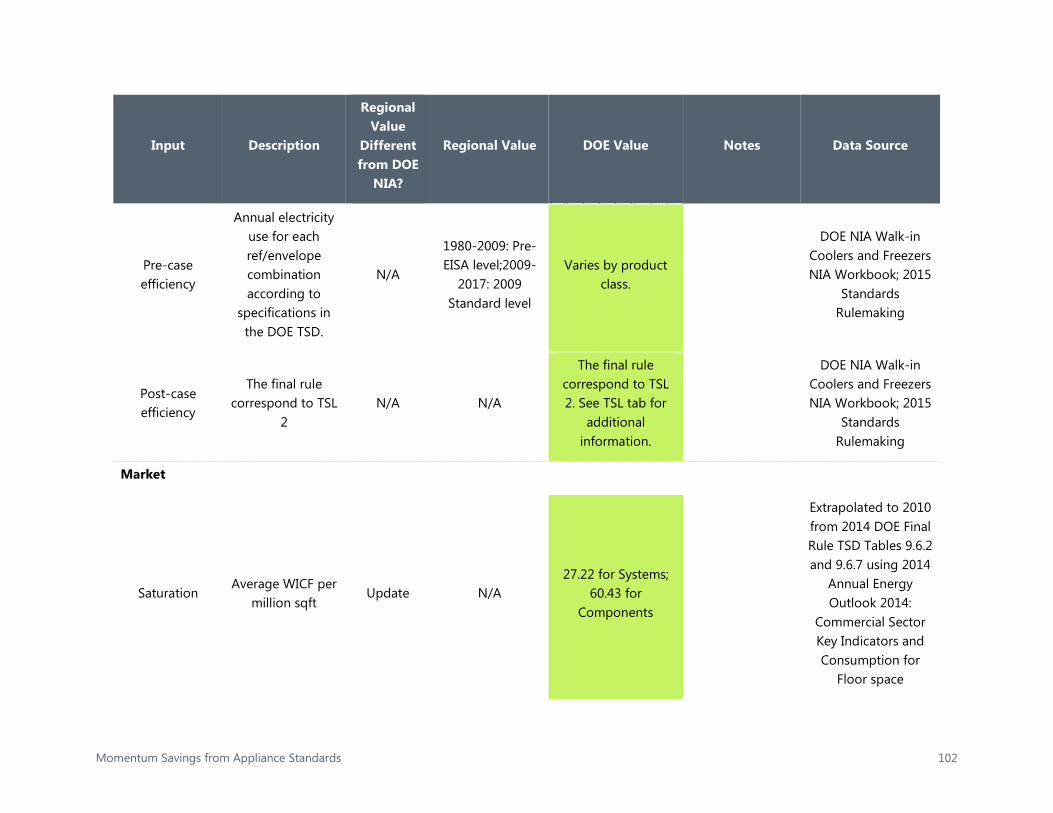
Momentum Savings from Appliance Standards 102
Input Description
Regional Value
Different from DOE
NIA?
Regional Value DOE Value Notes Data Source
Pre-case efficiency
Annual electricity use for each ref/envelope combination according to
specifications in the DOE TSD.
N/A
1980-2009: Pre-EISA level;2009-
2017: 2009 Standard level
Varies by product class.
DOE NIA Walk-in Coolers and Freezers NIA Workbook; 2015
Standards Rulemaking
Post-case efficiency
The final rule correspond to TSL
2 N/A N/A
The final rule correspond to TSL 2. See TSL tab for
additional information.
DOE NIA Walk-in Coolers and Freezers NIA Workbook; 2015
Standards Rulemaking
Market
Saturation Average WICF per
million sqft Update N/A
27.22 for Systems; 60.43 for
Components
Extrapolated to 2010 from 2014 DOE Final Rule TSD Tables 9.6.2 and 9.6.7 using 2014
Annual Energy Outlook 2014:
Commercial Sector Key Indicators and Consumption for
Floor space
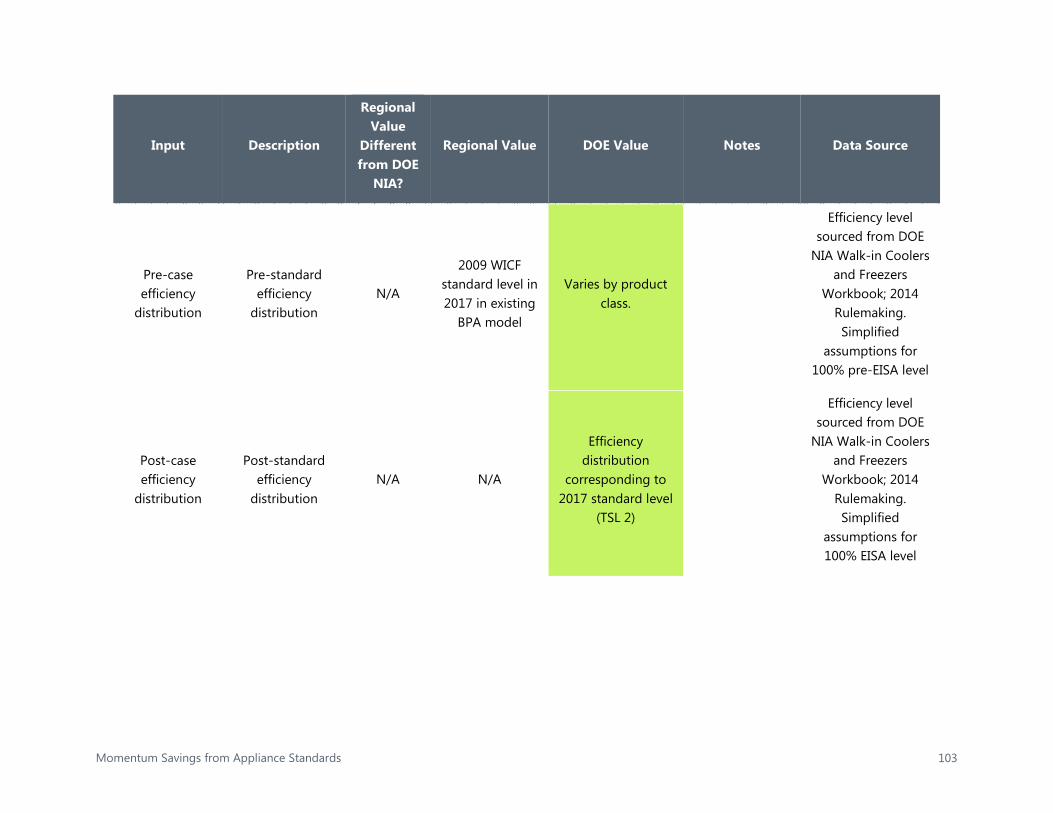
Momentum Savings from Appliance Standards 103
Input Description
Regional Value
Different from DOE
NIA?
Regional Value DOE Value Notes Data Source
Pre-case efficiency
distribution
Pre-standard efficiency
distribution N/A
2009 WICF standard level in 2017 in existing
BPA model
Varies by product class.
Efficiency level sourced from DOE
NIA Walk-in Coolers and Freezers
Workbook; 2014 Rulemaking. Simplified
assumptions for 100% pre-EISA level
Post-case efficiency
distribution
Post-standard efficiency
distribution N/A N/A
Efficiency distribution
corresponding to 2017 standard level
(TSL 2)
Efficiency level sourced from DOE
NIA Walk-in Coolers and Freezers
Workbook; 2014 Rulemaking. Simplified
assumptions for 100% EISA level

Momentum Savings from Appliance Standards 104
Input Description
Regional Value
Different from DOE
NIA?
Regional Value DOE Value Notes Data Source
Compliance Rate for existing
stock
For units eligible for replacement in existing buildings, compliance rate
might be an issue as facility
managers might repair instead of
replacing the failed unit
N/A
10 % compliance rate assumed in
existing BPA WICF model
N/A Not used in
model.
Stock Model
Scalar Scale national
analysis to regional analysis
N/A 4% in existing BPA Analysis
N/A

Momentum Savings from Appliance Standards 105
Input Description
Regional Value
Different from DOE
NIA?
Regional Value DOE Value Notes Data Source
Lifetime
Lifetime is defined as when a
refrigeration system or a
component fails or needed
replacement
Update
Envelope: 15 years,
Refrigeration System 12 years, Doors: 14 years
Panels: 12 years; Refrigeration
system: 10 years; Display Doors, Small Passage Doors, and Small Freight Doors:
12 years; Large Passage and Freight
Doors: 6 years (Assumed 10 years for systems and 12
years for components in
model)
Lifetime of WICF averages to be
15 years.
DOE WICF NOPR_TSD Chapter
9

Momentum Savings from Appliance Standards 106
Table C-18. Residential Ovens
Input Description
Regional Value
Different from DOE
NIA?
Regional Value
DOE Value Notes Data Source
Usage
1996 Level Cooking Efficiency N/A 0.1066 DOE TSD
2009 Levels Cooking Efficiency N/A .1066 - .1209
Incremental efficiency tiers
in DOE analysis - efficiency
factor
DOE TSD
Cooking Energy Electrical energy
required for cooking 90.7-154.3 70.6-132.4
in kWh/yr. for different efficiency
levels
DOE TSD
Self-Cleaning/Ignition Energy
electrical energy required for
ignition/cleaning N/A 0
0 because the standard oven does not have
a cleaning cycle
DOE TSD

Momentum Savings from Appliance Standards 107
Input Description
Regional Value
Different from DOE
NIA?
Regional Value
DOE Value Notes Data Source
Cleaning Cycle per Year
number of cleaning cycles
N/A 0
0 because the standard oven does not have
a cleaning cycle
DOE TSD
Clock Energy electrical energy used
by clock per year N/A 34.2
does not vary by efficiency
level DOE TSD
1996 Level Cooking Efficiency N/A 0.1099 DOE TSD
2009 Levels Cooking Efficiency N/A 0.1099 - .1123
Incremental efficiency tiers
in DOE analysis - efficiency
factor
DOE TSD
Cooking Energy Electrical energy
required for cooking
108.0-159.2
116.6; 113.5
in kWh/yr. for different efficiency
levels
DOE TSD
Self-Cleaning/Ignition Energy
electrical energy required for
ignition/cleaning N/A 21.1
does not vary by efficiency
level DOE TSD

Momentum Savings from Appliance Standards 108
Input Description
Regional Value
Different from DOE
NIA?
Regional Value
DOE Value Notes Data Source
Cleaning Cycle per Year
number of cleaning cycles
N/A 4 does not vary by efficiency
level DOE TSD
Clock Energy electrical energy used
by clock per year N/A 33.3
does not vary by efficiency
level DOE TSD
1996 Level Cooking Efficiency N/A 0.0536 DOE TSD
2009 Levels Cooking Efficiency N/A .0583; .06
Incremental efficiency tiers
in DOE analysis
DOE TSD
Cooking Energy Electrical energy
required for cooking N/A 0
no electricity consumed
during cooking
because this is a gas oven
DOE TSD
Self-Cleaning/Ignition Energy
electrical energy required for
ignition/cleaning N/A 0
0 because the standard oven does not have
a cleaning cycle
DOE TSD

Momentum Savings from Appliance Standards 109
Input Description
Regional Value
Different from DOE
NIA?
Regional Value
DOE Value Notes Data Source
Cleaning Cycle per Year
number of cleaning cycles
N/A 0
0 because the standard oven does not have
a cleaning cycle
DOE TSD
Clock Energy electrical energy used
by clock per year N/A 0
does not vary by efficiency
level DOE TSD
1996 Level Baseline device efficiency tiers
N/A 0.054 DOE TSD
2009 Levels Incremental efficiency tiers in DOE analysis
N/A .054; .0063
Cooking efficiency for
different efficiency
levels
DOE TSD
Cooking Energy Electrical energy
required for cooking N/A
in kWh/yr. for different efficiency
levels
DOE TSD
Self-Cleaning/Ignition Energy
electrical energy required for
ignition/cleaning N/A 21.8
does not vary by efficiency
level DOE TSD

Momentum Savings from Appliance Standards 110
Input Description
Regional Value
Different from DOE
NIA?
Regional Value
DOE Value Notes Data Source
Cleaning Cycle per Year
number of cleaning cycles
N/A 4 does not vary by efficiency
level DOE TSD
Clock Energy electric energy used by
clock per year N/A 31.5
does not vary by efficiency
level DOE TSD
Market
Pre-case product class distribution
Number of product class(s) and
distribution if standard did not exist
N/A DOE GRIM Model
Took from GRIM (which takes from
NIA)
DOE TSD
Post-case case product class distribution
Number of product class(s) and
distribution factoring in the effective
standard
N/A DOE GRIM Model
Took from GRIM (which takes from
NIA)
DOE TSD
Pre-case efficiency level distribution
Efficiency distribution of each product class if standard did not exist
N/A DOE GRIM Model
Took from GRIM (which takes from
NIA)
DOE TSD

Momentum Savings from Appliance Standards 111
Input Description
Regional Value
Different from DOE
NIA?
Regional Value
DOE Value Notes Data Source
Post-case efficiency level distribution
Efficiency distribution of each product class
factoring in the effective standard
N/A DOE GRIM Model
Took from GRIM (which takes from
NIA)
DOE TSD
Appliance Saturation Saturation rate of Ovens in the NW
region
97.5%; 100%; 96%
DOE model does not
break out by different
building type
RBSA
Pre-case product class distribution
Number of product class(s) and
distribution if standard did not exist
N/A DOE GRIM Model
Took from GRIM (which takes from
NIA)
DOE TSD
Post-case case product class distribution
Number of product class(s) and
distribution factoring in the effective
standard
N/A DOE GRIM Model
Took from GRIM (which takes from
NIA)
DOE TSD
Pre-case efficiency level distribution
Efficiency distribution of each product class if standard did not exist
N/A DOE GRIM Model
Took from GRIM (which takes from
NIA)
DOE TSD

Momentum Savings from Appliance Standards 112
Input Description
Regional Value
Different from DOE
NIA?
Regional Value
DOE Value Notes Data Source
Post-case efficiency level distribution
Efficiency distribution of each product class
factoring in the effective standard
N/A DOE GRIM Model
Took from GRIM (which takes from
NIA)
DOE TSD
Appliance Saturation Saturation rate of Ovens in the NW
region
97.5%; 100%; 96%
DOE model does not
break out by different
building type
RBSA
Pre-case product class distribution
Number of product class(s) and
distribution if standard did not exist
N/A DOE GRIM Model
Took from GRIM (which takes from
NIA)
DOE TSD
Post-case case product class distribution
Number of product class(s) and
distribution factoring in the effective
standard
N/A DOE GRIM Model
Took from GRIM (which takes from
NIA)
DOE TSD
Pre-case efficiency level distribution
Efficiency distribution of each product class if standard did not exist
N/A DOE GRIM Model
Took from GRIM (which takes from
NIA)
DOE TSD

Momentum Savings from Appliance Standards 113
Input Description
Regional Value
Different from DOE
NIA?
Regional Value
DOE Value Notes Data Source
Post-case efficiency level distribution
Efficiency distribution of each product class
factoring in the effective standard
N/A DOE GRIM Model
Took from GRIM (which takes from
NIA)
DOE TSD
Appliance Saturation Saturation rate of Ovens in the NW
region
97.5%; 100%; 96%
RBSA
Pre-case product class distribution
Number of product class(s) and
distribution if standard did not exist
N/A DOE GRIM Model DOE TSD
Post-case case product class distribution
Number of product class(s) and
distribution factoring in the effective
standard
N/A DOE GRIM Model DOE TSD
Pre-case efficiency level distribution
Efficiency distribution of each product class if standard did not exist
N/A DOE GRIM Model DOE TSD

Momentum Savings from Appliance Standards 114
Input Description
Regional Value
Different from DOE
NIA?
Regional Value
DOE Value Notes Data Source
Post-case efficiency level distribution
Efficiency distribution of each product class
factoring in the effective standard
N/A DOE GRIM Model DOE TSD
Appliance Saturation Saturation rate of Ovens in the NW
region
97.5%; 100%; 96%
RBSA
Stock Model
Product Lifetime Residential Ovens
Spreadsheet Cooking Eff Tab
Yes, different
from DOE 20 years 19 years DOE TSD, Sixth Plan
Product Lifetime Residential Ovens
Spreadsheet Cooking Eff Tab
Yes, different
from DOE 20 years 19 years Product Lifetime
Product Lifetime Residential Ovens
Spreadsheet Cooking Eff Tab
Yes, different
from DOE 20 years 19 years DOE TSD, Sixth Plan

Momentum Savings from Appliance Standards 115
Input Description
Regional Value
Different from DOE
NIA?
Regional Value
DOE Value Notes Data Source
Product Lifetime Residential Ovens
Spreadsheet Cooking Eff Tab
Yes, different
from DOE 20 years 19 years DOE TSD, Sixth Plan