monday 23 january 2012 – morning - meimei.org.uk/files/papers/2012_jan_s2.pdf · 3 the lifetime...
TRANSCRIPT
Monday 23 January 2012 – MorningA2 GCE MATHEMATICS (MEI)
4767 Statistics 2
QUESTION PAPER
*4732170112*
INSTRUCTIONS TO CANDIDATES
These instructions are the same on the Printed Answer Book and the Question Paper.
• The Question Paper will be found in the centre of the Printed Answer Book.• Write your name, centre number and candidate number in the spaces provided on the
Printed Answer Book. Please write clearly and in capital letters.• Write your answer to each question in the space provided in the Printed Answer
Book. Additional paper may be used if necessary but you must clearly show your candidate number, centre number and question number(s).
• Use black ink. HB pencil may be used for graphs and diagrams only.• Read each question carefully. Make sure you know what you have to do before starting
your answer.• Answer all the questions.• Do not write in the bar codes.• You are permitted to use a scientific or graphical calculator in this paper.• Final answers should be given to a degree of accuracy appropriate to the context.
INFORMATION FOR CANDIDATES
This information is the same on the Printed Answer Book and the Question Paper.
• The number of marks is given in brackets [ ] at the end of each question or part question on the Question Paper.
• You are advised that an answer may receive no marks unless you show sufficient detail of the working to indicate that a correct method is being used.
• The total number of marks for this paper is 72.• The Printed Answer Book consists of 12 pages. The Question Paper consists of 4 pages.
Any blank pages are indicated.
INSTRUCTION TO EXAMS OFFICER / INVIGILATOR
• Do not send this Question Paper for marking; it should be retained in the centre or recycled. Please contact OCR Copyright should you wish to re-use this document.
OCR is an exempt CharityTurn over
© OCR 2012 [L/102/2657]DC (LEO) 43761/3
Candidates answer on the Printed Answer Book.
OCR supplied materials:• Printed Answer Book 4767• MEI Examination Formulae and Tables (MF2)
Other materials required:• Scientific or graphical calculator
Duration: 1 hour 30 minutes

2
4767 Jan12© OCR 2012
1 Nine long-distance runners are starting an exercise programme to improve their strength. During the first session, each of them has to do a 100 metre run and to do as many push-ups as possible in one minute. The times taken for the run, together with the number of push-ups each runner achieves, are shown in the table.
Runner A B C D E F G H I
100 metre time (seconds) 13.2 11.6 10.9 12.3 14.7 13.1 11.7 13.6 12.4
Push-ups achieved 32 42 22 36 41 27 37 38 33
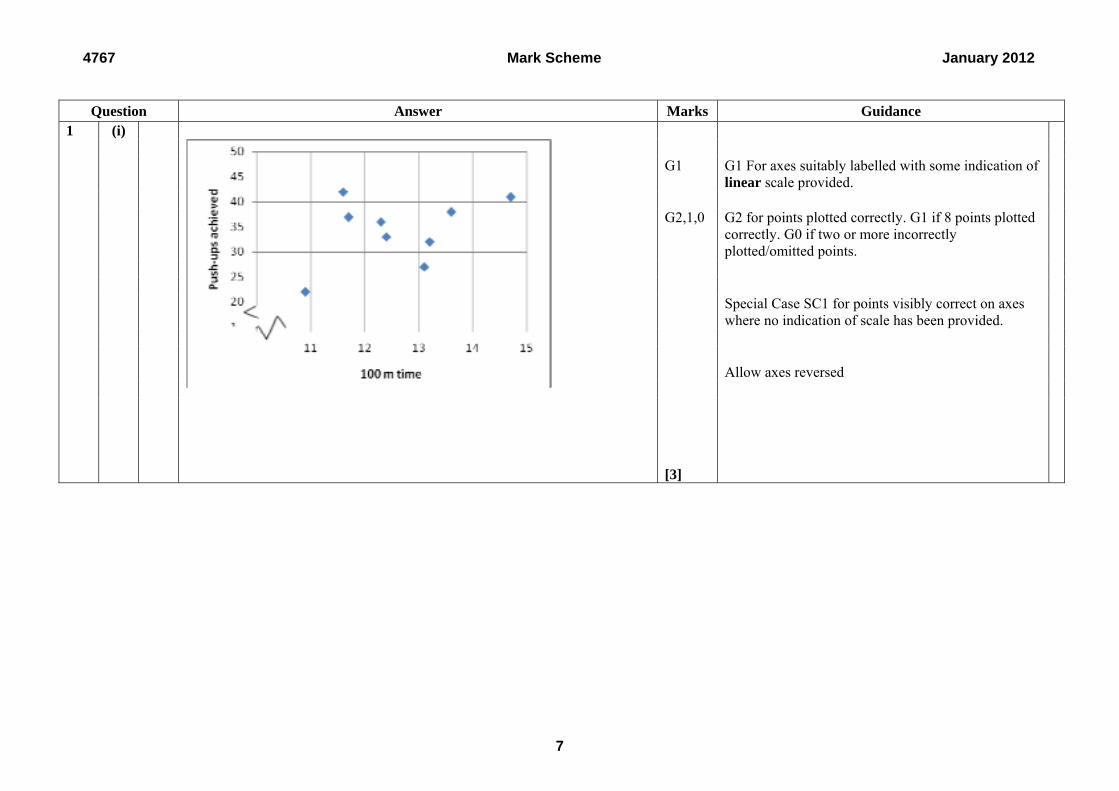
(i) Draw a scatter diagram to illustrate the data. [3]
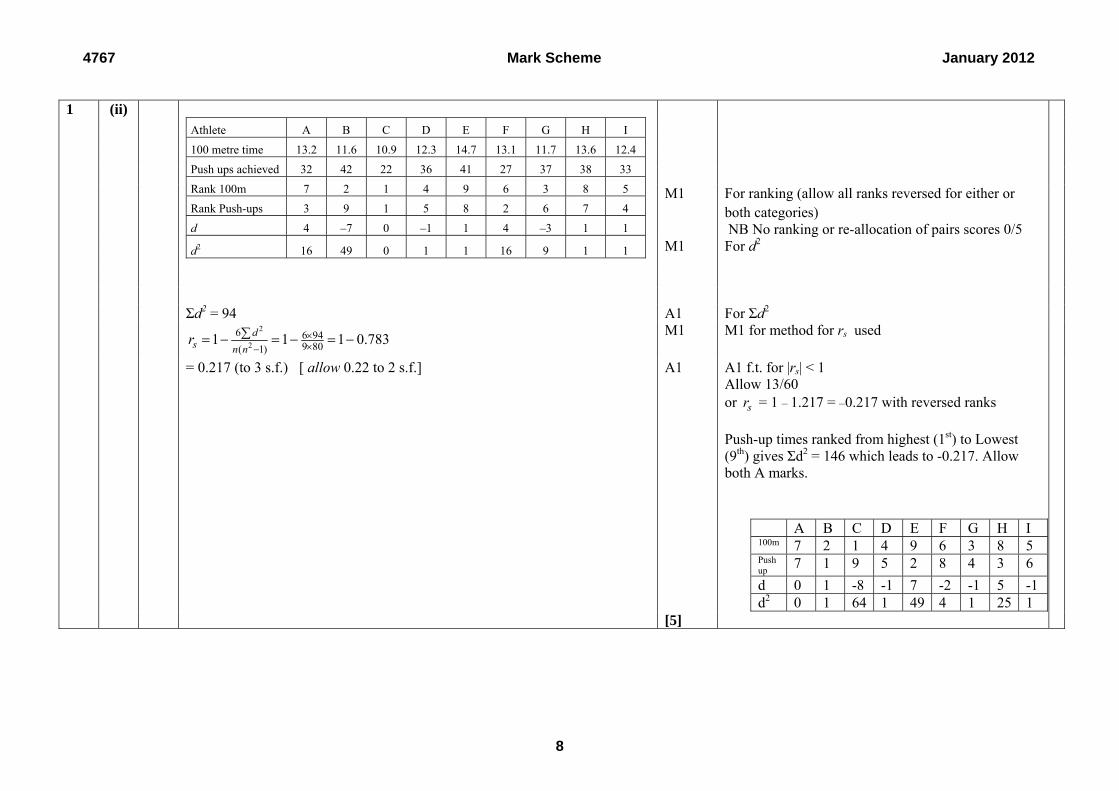
(ii) Calculate the value of Spearman’s rank correlation coefficient. [5]
(iii) Carry out a hypothesis test at the 5% significance level to examine whether there is any association between time taken for the run and number of push-ups achieved. [6]
(iv) Under what circumstances is it appropriate to carry out a hypothesis test based on the product moment correlation coefficient? State, with a reason, which test is more appropriate for these data. [3]
2 The number of printing errors per page in a book is modelled by a Poisson distribution with a mean of 0.85.
(i) State conditions for a Poisson distribution to be a suitable model for the number of printing errors per page. [2]
(ii) A page is chosen at random. Find the probability of
(A) exactly 1 error on this page,
(B) at least 2 errors on this page. [5]
10 pages are chosen at random.
(iii) Find the probability of exactly 10 errors in these 10 pages. [3]
(iv) Find the least integer k such that the probability of there being k or more errors in these 10 pages is less than 1%. [4]
30 pages are chosen at random.
(v) Use a suitable approximating distribution to find the probability of no more than 30 errors in these 30 pages. [5]

3
4767 Jan12 Turn over© OCR 2012
3 The lifetime of a particular type of light bulb is X hours, where X is Normally distributed with mean 1100 and variance 2000.
(i) Find P(1100 < X < 1200). [3]
(ii) Use a suitable approximating distribution to find the probability that, in a random sample of 100 of these light bulbs, no more than 40 have a lifetime between 1100 and 1200 hours. [5]
(iii) A factory has a large number of these light bulbs installed. As soon as 1% of the bulbs have come to the end of their lifetimes, it is company policy to replace all of the bulbs. After how many hours should the bulbs need to be replaced? [3]
(iv) The bulbs are to be replaced by low-energy bulbs. The lifetime of these bulbs is Normally distributed and the mean is claimed by the manufacturer to be 7000 hours. The standard deviation is known to be 100 hours. A random sample of 25 low-energy bulbs is selected. Their mean lifetime is found to be 6972 hours. Carry out a 2-tail test at the 10% level to investigate the claim. [8]
[Question 4 is printed overleaf.]
Copyright Information
OCR is committed to seeking permission to reproduce all third-party content that it uses in its assessment materials. OCR has attempted to identify and contact all copyright holders whose work is used in this paper. To avoid the issue of disclosure of answer-related information to candidates, all copyright acknowledgements are reproduced in the OCR Copyright Acknowledgements Booklet. This is produced for each series of examinations and is freely available to download from our public website (www.ocr.org.uk) after the live examination series.
If OCR has unwittingly failed to correctly acknowledge or clear any third-party content in this assessment material, OCR will be happy to correct its mistake at the earliest possible opportunity.
For queries or further information please contact the Copyright Team, First Floor, 9 Hills Road, Cambridge CB2 1GE.
OCR is part of the Cambridge Assessment Group; Cambridge Assessment is the brand name of University of Cambridge Local Examinations Syndicate (UCLES), which is itself a department of the University of Cambridge.

4
4767 Jan12© OCR 2012
4 Birds are observed at feeding stations in three different places – woodland, farm and garden. The numbers of finches, thrushes and tits observed at each site are summarised in the table. The birds observed are regarded as a random sample from the population of birds of these species that use these feeding stations.
Observed FrequencyPlace
Farm Garden Woodland Totals
Species
Thrushes 11 74 7 92
Tits 70 26 88 184
Finches 17 2 10 29
Totals 98 102 105 305
The expected frequencies under the null hypothesis for the usual χ 2 test are shown in the table below.
Expected FrequencyPlace
Farm Garden Woodland
Species
Thrushes 29.5607 30.7672 31.6721
Tits 59.1213 61.5344 63.3443
Finches 9.3180 9.6984 9.9836
(i) Verify that the entry 9.3180 is correct. [2]
The corresponding contributions to the test statistic are shown in the table below.
ContributionPlace
Farm Garden Woodland
Species
Thrushes 11.6539 60.7489 19.2192
Tits 2.0017 20.5201 9.5969
Finches 6.3332 6.1108 0.0000
(ii) Verify that the entry 6.3332 is correct. [2]
(iii) Carry out the test at the 1% level of significance. [7]
(iv) For each place, use the table of contributions to comment briefly on the differences between the observed and expected distributions of species. [6]

Monday 23 January 2012 – MorningA2 GCE MATHEMATICS (MEI)
4767 Statistics 2
PRINTED ANSWER BOOK
INSTRUCTIONS TO CANDIDATESThese instructions are the same on the Printed Answer Book and the Question Paper.• The Question Paper will be found in the centre of the Printed Answer Book.• Write your name, centre number and candidate number in the spaces provided on the
Printed Answer Book. Please write clearly and in capital letters.• Write your answer to each question in the space provided in the Printed Answer
Book. Additional paper may be used if necessary but you must clearly show your candidate number, centre number and question number(s).
• Use black ink. HB pencil may be used for graphs and diagrams only.• Read each question carefully. Make sure you know what you have to do before starting
your answer.• Answer all the questions.• Do not write in the bar codes.• You are permitted to use a scientific or graphical calculator in this paper.• Final answers should be given to a degree of accuracy appropriate to the context.
INFORMATION FOR CANDIDATESThis information is the same on the Printed Answer Book and the Question Paper.• The number of marks is given in brackets [ ] at the end of each question or part
question on the Question Paper.• You are advised that an answer may receive no marks unless you show sufficient detail
of the working to indicate that a correct method is being used.• The total number of marks for this paper is 72• The Printed Answer Book consists of 12 pages. The Question Paper consists of 4 pages.
Any blank pages are indicated.
* 4 7 6 7 *
OCR is an exempt CharityTurn over
© OCR 2012 [L/102/2657]DC (LEO/CGW) 43763/3
Candidates answer on this Printed Answer Book.
OCR supplied materials:• Question Paper 4767 (inserted)• MEI Examination Formulae and Tables (MF2)
Other materials required:• Scientific or graphical calculator
*4732180112*
Duration: 1 hour 30 minutes

2
© OCR 2012
1 (i)
1 (ii)

3
Turn over© OCR 2012
1 (ii) (continued)
1 (iii)

4
© OCR 2012
1 (iv)
2 (i)
2 (ii) (A)

5
Turn over© OCR 2012
2 (ii) (B)
2 (iii)
2 (iv)

6
© OCR 2012
2 (v)

7
Turn over© OCR 2012
3 (i)
3 (ii)

8
© OCR 2012
3 (iii)
3 (iv)

9
Turn over© OCR 2012
3 (iv) (continued)

10
© OCR 2012
4 (i)
4 (ii)

11
Turn over© OCR 2012
4 (iii)

12
© OCR 2012
4 (iv)
Copyright Information
OCR is committed to seeking permission to reproduce all third-party content that it uses in its assessment materials. OCR has attempted to identify and contact all copyright holders whose work is used in this paper. To avoid the issue of disclosure of answer-related information to candidates, all copyright acknowledgements are reproduced in the OCR Copyright Acknowledgements Booklet. This is produced for each series of examinations and is freely available to download from our public website (www.ocr.org.uk) after the live examination series.
If OCR has unwittingly failed to correctly acknowledge or clear any third-party content in this assessment material, OCR will be happy to correct its mistake at the earliest possible opportunity.
For queries or further information please contact the Copyright Team, First Floor, 9 Hills Road, Cambridge CB2 1GE.
OCR is part of the Cambridge Assessment Group; Cambridge Assessment is the brand name of University of Cambridge Local Examinations Syndicate (UCLES), which is itself a department of the University of Cambridge.

Oxford Cambridge and RSA Examinations
GCE
Mathematics (MEI) Advanced GCE
Unit 4767: Statistics 2
Mark Scheme for January 2012

OCR (Oxford Cambridge and RSA) is a leading UK awarding body, providing a wide range of qualifications to meet the needs of candidates of all ages and abilities. OCR qualifications include AS/A Levels, Diplomas, GCSEs, OCR Nationals, Functional Skills, Key Skills, Entry Level qualifications, NVQs and vocational qualifications in areas such as IT, business, languages, teaching/training, administration and secretarial skills. It is also responsible for developing new specifications to meet national requirements and the needs of students and teachers. OCR is a not-for-profit organisation; any surplus made is invested back into the establishment to help towards the development of qualifications and support, which keep pace with the changing needs of today’s society. This mark scheme is published as an aid to teachers and students, to indicate the requirements of the examination. It shows the basis on which marks were awarded by examiners. It does not indicate the details of the discussions which took place at an examiners’ meeting before marking commenced. All examiners are instructed that alternative correct answers and unexpected approaches in candidates’ scripts must be given marks that fairly reflect the relevant knowledge and skills demonstrated. Mark schemes should be read in conjunction with the published question papers and the report on the examination. OCR will not enter into any discussion or correspondence in connection with this mark scheme. © OCR 2012 Any enquiries about publications should be addressed to: OCR Publications PO Box 5050 Annesley NOTTINGHAM NG15 0DL Telephone: 0870 770 6622 Facsimile: 01223 552610 E-mail: [email protected]

4767 Mark Scheme January 2012
3
1. Annotations and abbreviations Annotation in scoris Meaning and BOD Benefit of doubt FT Follow through ISW Ignore subsequent working M0, M1 Method mark awarded 0, 1 A0, A1 Accuracy mark awarded 0, 1 B0, B1 Independent mark awarded 0, 1 SC Special case ^ Omission sign MR Misread Highlighting Other abbreviations in mark scheme
Meaning
E1 Mark for explaining U1 Mark for correct units G1 Mark for a correct feature on a graph M1 dep* Method mark dependent on a previous mark, indicated by * cao Correct answer only oe Or equivalent rot Rounded or truncated soi Seen or implied www Without wrong working

4767 Mark Scheme January 2012
4
2. Subject-specific Marking Instructions for GCE Mathematics (MEI) Pure strand
a Annotations should be used whenever appropriate during your marking. The A, M and B annotations must be used on your standardisation scripts for responses that are not awarded either 0 or full marks. It is vital that you annotate standardisation scripts fully to show how the marks have been awarded. For subsequent marking you must make it clear how you have arrived at the mark you have awarded.
b An element of professional judgement is required in the marking of any written paper. Remember that the mark scheme is designed to assist in marking incorrect solutions. Correct solutions leading to correct answers are awarded full marks but work must not be judged on the answer alone, and answers that are given in the question, especially, must be validly obtained; key steps in the working must always be looked at and anything unfamiliar must be investigated thoroughly. Correct but unfamiliar or unexpected methods are often signalled by a correct result following an apparently incorrect method. Such work must be carefully assessed. When a candidate adopts a method which does not correspond to the mark scheme, award marks according to the spirit of the basic scheme; if you are in any doubt whatsoever (especially if several marks or candidates are involved) you should contact your Team Leader.
c The following types of marks are available. M A suitable method has been selected and applied in a manner which shows that the method is essentially understood. Method marks are not usually lost for numerical errors, algebraic slips or errors in units. However, it is not usually sufficient for a candidate just to indicate an intention of using some method or just to quote a formula; the formula or idea must be applied to the specific problem in hand, eg by substituting the relevant quantities into the formula. In some cases the nature of the errors allowed for the award of an M mark may be specified. A Accuracy mark, awarded for a correct answer or intermediate step correctly obtained. Accuracy marks cannot be given unless the associated Method mark is earned (or implied). Therefore M0 A1 cannot ever be awarded. B Mark for a correct result or statement independent of Method marks.
4767 Mark Scheme January 2012
5
E A given result is to be established or a result has to be explained. This usually requires more working or explanation than the establishment of an unknown result. Unless otherwise indicated, marks once gained cannot subsequently be lost, eg wrong working following a correct form of answer is ignored. Sometimes this is reinforced in the mark scheme by the abbreviation isw. However, this would not apply to a case where a candidate passes through the correct answer as part of a wrong argument.
d When a part of a question has two or more ‘method’ steps, the M marks are in principle independent unless the scheme specifically says otherwise; and similarly where there are several B marks allocated. (The notation ‘dep *’ is used to indicate that a particular mark is dependent on an earlier, asterisked, mark in the scheme.) Of course, in practice it may happen that when a candidate has once gone wrong in a part of a question, the work from there on is worthless so that no more marks can sensibly be given. On the other hand, when two or more steps are successfully run together by the candidate, the earlier marks are implied and full credit must be given.
e The abbreviation ft implies that the A or B mark indicated is allowed for work correctly following on from previously incorrect results. Otherwise, A and B marks are given for correct work only — differences in notation are of course permitted. A (accuracy) marks are not given for answers obtained from incorrect working. When A or B marks are awarded for work at an intermediate stage of a solution, there may be various alternatives that are equally acceptable. In such cases, exactly what is acceptable will be detailed in the mark scheme rationale. If this is not the case please consult your Team Leader. Sometimes the answer to one part of a question is used in a later part of the same question. In this case, A marks will often be ‘follow through’. In such cases you must ensure that you refer back to the answer of the previous part question even if this is not shown within the image zone. You may find it easier to mark follow through questions candidate-by-candidate rather than question-by-question.
f Wrong or missing units in an answer should not lead to the loss of a mark unless the scheme specifically indicates otherwise. Candidates are expected to give numerical answers to an appropriate degree of accuracy, with 3 significant figures often being the norm. Small variations in the degree of accuracy to which an answer is given (e.g. 2 or 4 significant figures where 3 is expected) should not normally be penalised, while answers which are grossly over- or under-specified should normally result in the loss of a mark. The situation regarding any particular cases where the accuracy of the answer may be a marking issue should be detailed in the mark scheme rationale. If in doubt, contact your Team Leader.
g Rules for replaced work If a candidate attempts a question more than once, and indicates which attempt he/she wishes to be marked, then examiners should do as the candidate requests.
If there are two or more attempts at a question which have not been crossed out, examiners should mark what appears to be

4767 Mark Scheme January 2012
6
the last (complete) attempt and ignore the others. NB Follow these maths-specific instructions rather than those in the assessor handbook.
h For a genuine misreading (of numbers or symbols) which is such that the object and the difficulty of the question remain unaltered, mark according to the scheme but following through from the candidate’s data. A penalty is then applied; 1 mark is generally appropriate, though this may differ for some units. This is achieved by withholding one A mark in the question. Note that a miscopy of the candidate’s own working is not a misread but an accuracy error.
4767 Mark Scheme January 2012
7
Question Answer Marks Guidance
G1 G1 For axes suitably labelled with some indication of
linear scale provided.
G2,1,0 G2 for points plotted correctly. G1 if 8 points plotted
correctly. G0 if two or more incorrectly plotted/omitted points.
Special Case SC1 for points visibly correct on axes
where no indication of scale has been provided.
Allow axes reversed
1 (i)
[3]
4767 Mark Scheme January 2012
8
M1 For ranking (allow all ranks reversed for either or
both categories) NB No ranking or re-allocation of pairs scores 0/5
M1 For d2
Athlete A B C D E F G H I
100 metre time 13.2 11.6 10.9 12.3 14.7 13.1 11.7 13.6 12.4
Push ups achieved 32 42 22 36 41 27 37 38 33
Rank 100m 7 2 1 4 9 6 3 8 5
Rank Push-ups 3 9 1 5 8 2 6 7 4
d 4 –7 0 –1 1 4 –3 1 1
d2 16 49 0 1 1 16 9 1 1
Σd2 = 94 A1 For Σd2
2
2
6 6 949 80( 1)
1 1 1 0.783ds n n
r
M1 M1 for method for rs used
= 0.217 (to 3 s.f.) [ allow 0.22 to 2 s.f.] A1 A1 f.t. for |rs| < 1 Allow 13/60 or sr = 1 – 1.217 = –0.217 with reversed ranks Push-up times ranked from highest (1st) to Lowest (9th) gives Σd2 = 146 which leads to -0.217. Allow both A marks.
A B C D E F G H I 100m 7 2 1 4 9 6 3 8 5 Push up
7 1 9 5 2 8 4 3 6
d 0 1 -8 -1 7 -2 -1 5 -1 d2 0 1 64 1 49 4 1 25 1
1 (ii)
[5]

4767 Mark Scheme January 2012
9
H0: no association between 100m time and number of push-ups achieved in the population of long distance runners
B1 B1 for H0 in context (not x & y)
H1: some association between 100m time and number of push-ups achieved in the population of long distance runners
B1 B1 for H1 in context (not x & y) SC1 for both correct but no context provided
B1 B1 for population SOI NB H0 H1 not ito ρ Do not condone the use of the word ‘correlation’ in place of ‘association’. Population’ should be mentioned to award B1, unless clear, unambiguous alternative wording is used.
Two tail test critical value at 5% level is 0.7000 B1 B1 for ±0.7000 (or ±0.6000 only if H1 indicates a 1-tailed test is intended)
1 (iii)
Since 0.217 < 0.7000, there is insufficient evidence to reject H0, M1 M1 for sensible comparison with c.v leading to a conclusion seen, provided |rs| < 1 NOTE The comparison can be in the form of a diagram as long as it is clear and unambiguous. Sensible comparison: e.g. – 0.217 > – 0.7000 is ‘sensible’ whereas – 0.217 < 0.7000 is ‘not sensible’. Allow -0.7000 < 0.217 < 0.7000 Reversed inequality sign e.g. 0.217 > 0.7000 etc gets max M1 A0. Also, if the c.v. comes from the p.m.c.c. table (0.6664 for 2-tailed test and 0.5822 for a 1-tailed test) award max M1 A0.
4767 Mark Scheme January 2012
10
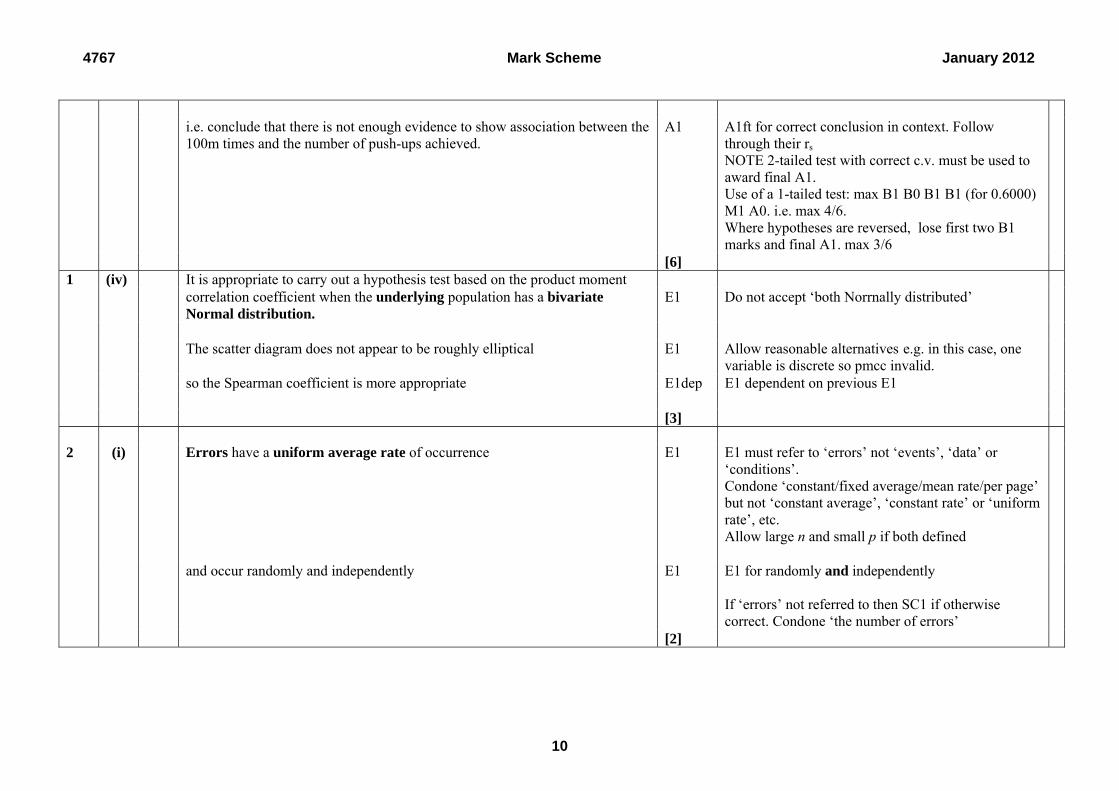
i.e. conclude that there is not enough evidence to show association between the 100m times and the number of push-ups achieved.
A1
A1ft for correct conclusion in context. Follow through their rs NOTE 2-tailed test with correct c.v. must be used to award final A1. Use of a 1-tailed test: max B1 B0 B1 B1 (for 0.6000) M1 A0. i.e. max 4/6. Where hypotheses are reversed, lose first two B1 marks and final A1. max 3/6
[6] It is appropriate to carry out a hypothesis test based on the product moment correlation coefficient when the underlying population has a bivariate Normal distribution.
E1 Do not accept ‘both Norrnally distributed’
The scatter diagram does not appear to be roughly elliptical E1 Allow reasonable alternatives e.g. in this case, one
variable is discrete so pmcc invalid.
so the Spearman coefficient is more appropriate E1dep E1 dependent on previous E1
1 (iv)
[3]
Errors have a uniform average rate of occurrence E1 E1 must refer to ‘errors’ not ‘events’, ‘data’ or ‘conditions’. Condone ‘constant/fixed average/mean rate/per page’ but not ‘constant average’, ‘constant rate’ or ‘uniform rate’, etc. Allow large n and small p if both defined
and occur randomly and independently E1 E1 for randomly and independently If ‘errors’ not referred to then SC1 if otherwise correct. Condone ‘the number of errors’
2 (i)
[2]

4767 Mark Scheme January 2012
11
(A)
P(X = 1) =
10.85 0.851!
e = 0.3633 M1 A1
M1 for attempt to find P(X = 1) either by Poisson p.d.f. or use of tables. A1 CAO 3 s.f. for answers which round to 0.363 www NOTE If P(X ≤ 1) used for final answer, award M0A0. Interpolation gives 0.79065 – 0.42795 = 0.3627
(B) P(X ≥ 2) = 1 – P(X ≤ 1) = 1 – 00.85 0.85
0!e –
10.85 0.851!
e M1 M1
M1 for method for P(X = 0) M1 for correct structure used
= 1 – 0.4274 – 0.3633 = 0.2093 A1
A1 CAO 3 s.f for answers which round to 0.209 Allow 0.2094 if interpolation used. [Interpolation gives 0.42795 for P(X = 0) and 0.20935 for P(X ≤ 1)]
2 (ii)
[5] New λ = 100.85 = 8.5 B1 B1 for 8.5 P(Exactly 10 in 10 pages) = 0.7634 – 0.6530 = 0.1104 M1 M1 for P(X = 10) calculation using λ = 8.5 A1 CAO Allow 0.110 and 0.11 www
Or = !10
5.8 105.8e
= 0.1104
Award M1 only if λ = 8.5 used
2 (iii)
[3]
4767 Mark Scheme January 2012
12
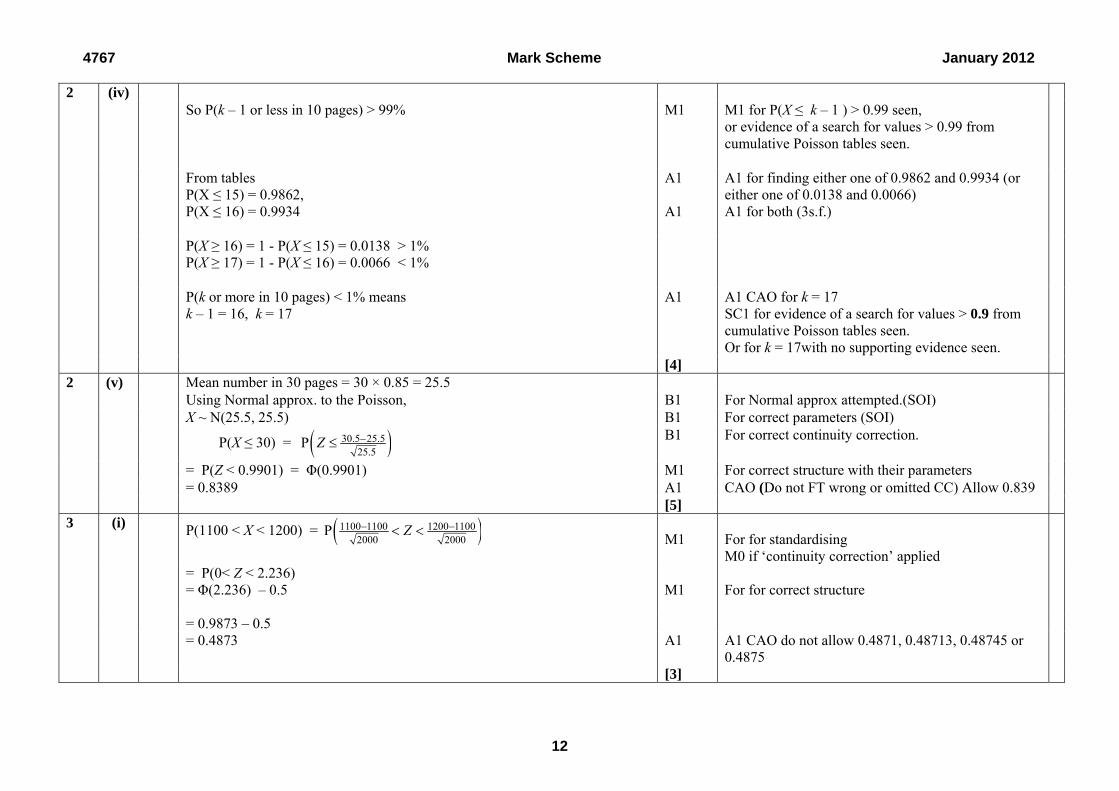
So P(k – 1 or less in 10 pages) > 99% M1 M1 for P(X ≤ k – 1 ) > 0.99 seen,
or evidence of a search for values > 0.99 from cumulative Poisson tables seen.
From tables P(X ≤ 15) = 0.9862, P(X ≤ 16) = 0.9934
A1 A1
A1 for finding either one of 0.9862 and 0.9934 (or either one of 0.0138 and 0.0066) A1 for both (3s.f.)
P(X ≥ 16) = 1 - P(X ≤ 15) = 0.0138 > 1% P(X ≥ 17) = 1 - P(X ≤ 16) = 0.0066 < 1%
P(k or more in 10 pages) < 1% means k – 1 = 16, k = 17
A1 A1 CAO for k = 17 SC1 for evidence of a search for values > 0.9 from cumulative Poisson tables seen. Or for k = 17with no supporting evidence seen.
2 (iv)
[4] Mean number in 30 pages = 30 × 0.85 = 25.5 Using Normal approx. to the Poisson, B1 For Normal approx attempted.(SOI) X ~ N(25.5, 25.5) B1 For correct parameters (SOI)
P(X ≤ 30) = 30.5 25.525.5
P Z B1
For correct continuity correction.
= P(Z < 0.9901) = Φ(0.9901) M1 For correct structure with their parameters = 0.8389 A1 CAO (Do not FT wrong or omitted CC) Allow 0.839
2 (v)
[5]
P(1100 < X < 1200) = 1100 1100 1200 11002000 2000
P Z M1
For for standardising M0 if ‘continuity correction’ applied
= P(0< Z < 2.236) = Φ(2.236) – 0.5 M1 For for correct structure
= 0.9873 – 0.5 = 0.4873 A1 A1 CAO do not allow 0.4871, 0.48713, 0.48745 or
0.4875
3 (i)
[3]
4767 Mark Scheme January 2012
13
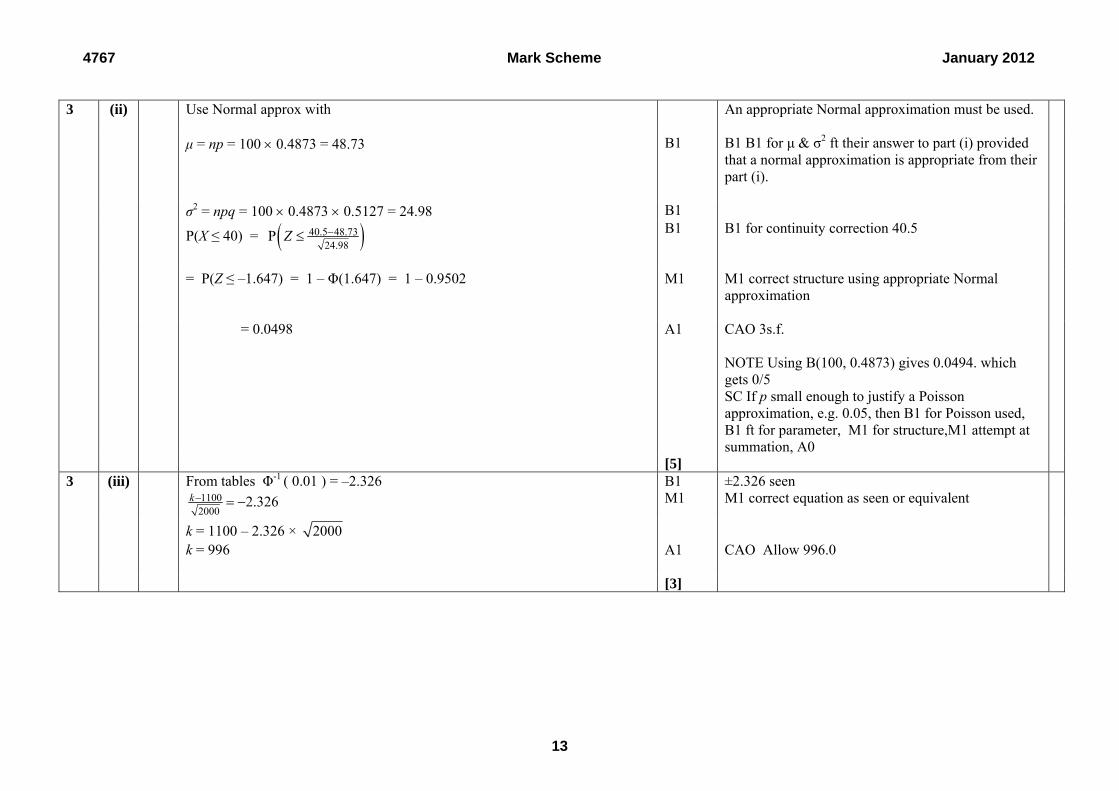
Use Normal approx with An appropriate Normal approximation must be used.
μ = np = 100 0.4873 = 48.73 B1 B1 B1 for μ & σ2 ft their answer to part (i) provided that a normal approximation is appropriate from their part (i).
σ2 = npq = 100 0.4873 0.5127 = 24.98 B1
P(X ≤ 40) = 40.5 48.7324.98
P Z B1
B1 for continuity correction 40.5
= P(Z ≤ –1.647) = 1 – Φ(1.647) = 1 – 0.9502 M1
M1 correct structure using appropriate Normal approximation
= 0.0498 A1 CAO 3s.f. NOTE Using B(100, 0.4873) gives 0.0494. which gets 0/5 SC If p small enough to justify a Poisson approximation, e.g. 0.05, then B1 for Poisson used, B1 ft for parameter, M1 for structure,M1 attempt at summation, A0
3 (ii)
[5] From tables Φ-1 ( 0.01 ) = –2.326 B1 ±2.326 seen
11002000
2.326k M1 M1 correct equation as seen or equivalent
k = 1100 – 2.326 × 2000
k = 996 A1 CAO Allow 996.0
3 (iii)
[3]
4767 Mark Scheme January 2012
14
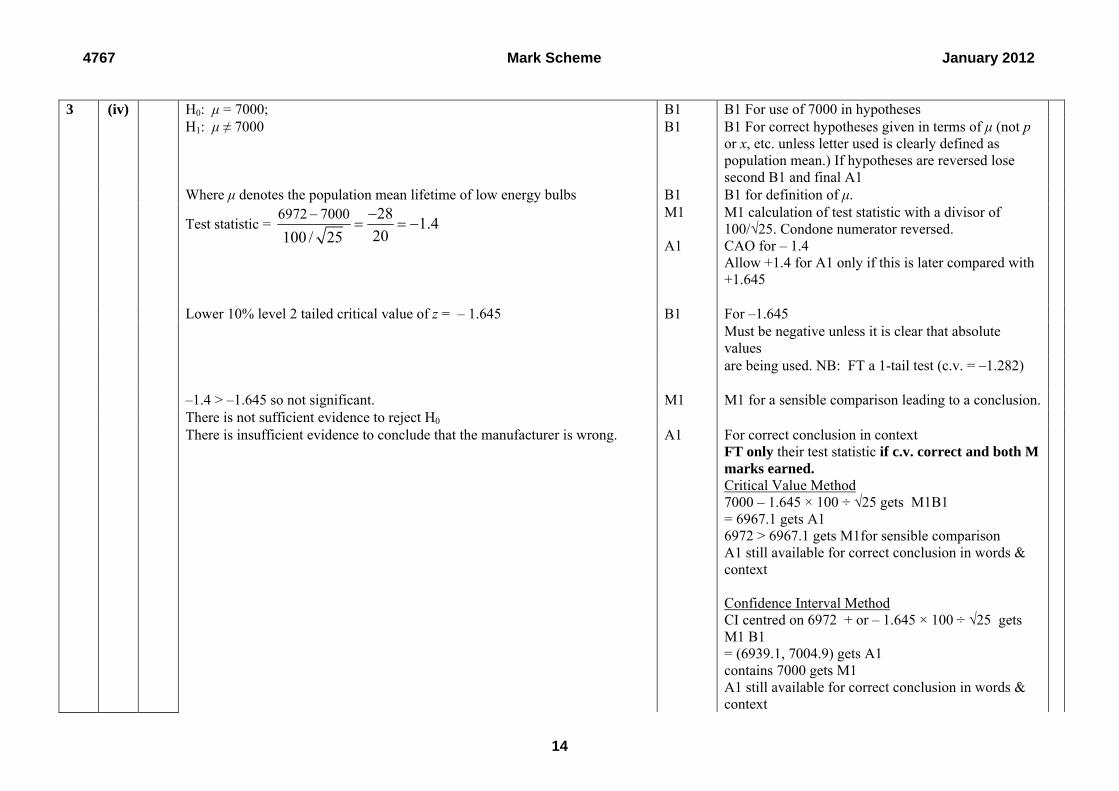
H0: μ = 7000; B1 B1 For use of 7000 in hypotheses H1: μ ≠ 7000 B1 B1 For correct hypotheses given in terms of μ (not p
or x, etc. unless letter used is clearly defined as population mean.) If hypotheses are reversed lose second B1 and final A1
Where μ denotes the population mean lifetime of low energy bulbs B1 B1 for definition of μ.
Test statistic = 6972 7000 28
1.420100 / 25
M1 A1
M1 calculation of test statistic with a divisor of 100/√25. Condone numerator reversed. CAO for – 1.4 Allow +1.4 for A1 only if this is later compared with +1.645
Lower 10% level 2 tailed critical value of z = – 1.645 B1 For –1.645 Must be negative unless it is clear that absolute
values
are being used. NB: FT a 1-tail test (c.v. = –1.282)
–1.4 > –1.645 so not significant. M1 M1 for a sensible comparison leading to a conclusion. There is not sufficient evidence to reject H0
3 (iv)
There is insufficient evidence to conclude that the manufacturer is wrong. A1 For correct conclusion in context FT only their test statistic if c.v. correct and both M marks earned. Critical Value Method 7000 – 1.645 × 100 ÷ √25 gets M1B1 = 6967.1 gets A1 6972 > 6967.1 gets M1for sensible comparison A1 still available for correct conclusion in words & context Confidence Interval Method CI centred on 6972 + or – 1.645 × 100 ÷ √25 gets M1 B1 = (6939.1, 7004.9) gets A1 contains 7000 gets M1 A1 still available for correct conclusion in words & context
4767 Mark Scheme January 2012
15
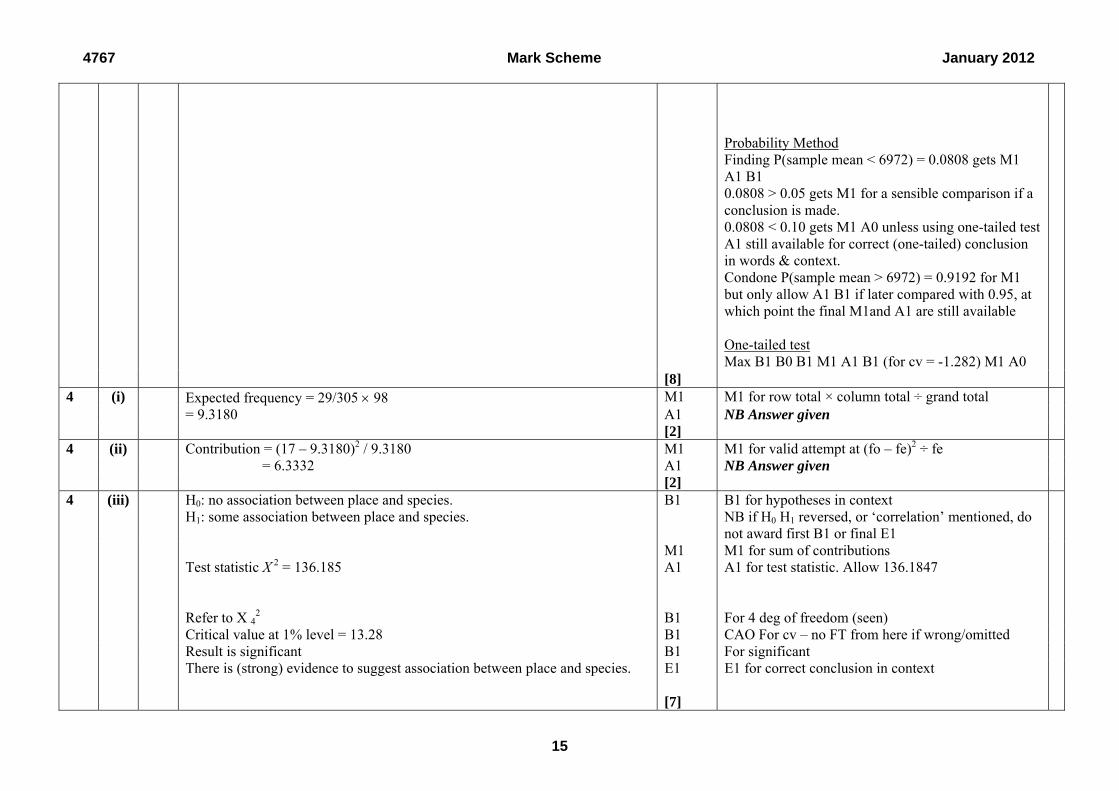
Probability Method Finding P(sample mean < 6972) = 0.0808 gets M1 A1 B1 0.0808 > 0.05 gets M1 for a sensible comparison if a conclusion is made. 0.0808 < 0.10 gets M1 A0 unless using one-tailed test A1 still available for correct (one-tailed) conclusion in words & context. Condone P(sample mean > 6972) = 0.9192 for M1 but only allow A1 B1 if later compared with 0.95, at which point the final M1and A1 are still available One-tailed test Max B1 B0 B1 M1 A1 B1 (for cv = -1.282) M1 A0
[8] Expected frequency = 29/305 98 M1 M1 for row total × column total ÷ grand total = 9.3180 A1 NB Answer given
4 (i)
[2] Contribution = (17 – 9.3180)2 / 9.3180 M1 M1 for valid attempt at (fo – fe)2 ÷ fe = 6.3332 A1 NB Answer given
4 (ii)
[2] H0: no association between place and species. H1: some association between place and species.
B1 B1 for hypotheses in context NB if H0 H1 reversed, or ‘correlation’ mentioned, do not award first B1 or final E1
Test statistic X 2 = 136.185
M1 A1
M1 for sum of contributions A1 for test statistic. Allow 136.1847
Refer to X 4
2 B1 For 4 deg of freedom (seen) Critical value at 1% level = 13.28 B1 CAO For cv – no FT from here if wrong/omitted Result is significant B1 For significant There is (strong) evidence to suggest association between place and species. E1 E1 for correct conclusion in context
4 (iii)
[7]
4767 Mark Scheme January 2012
16
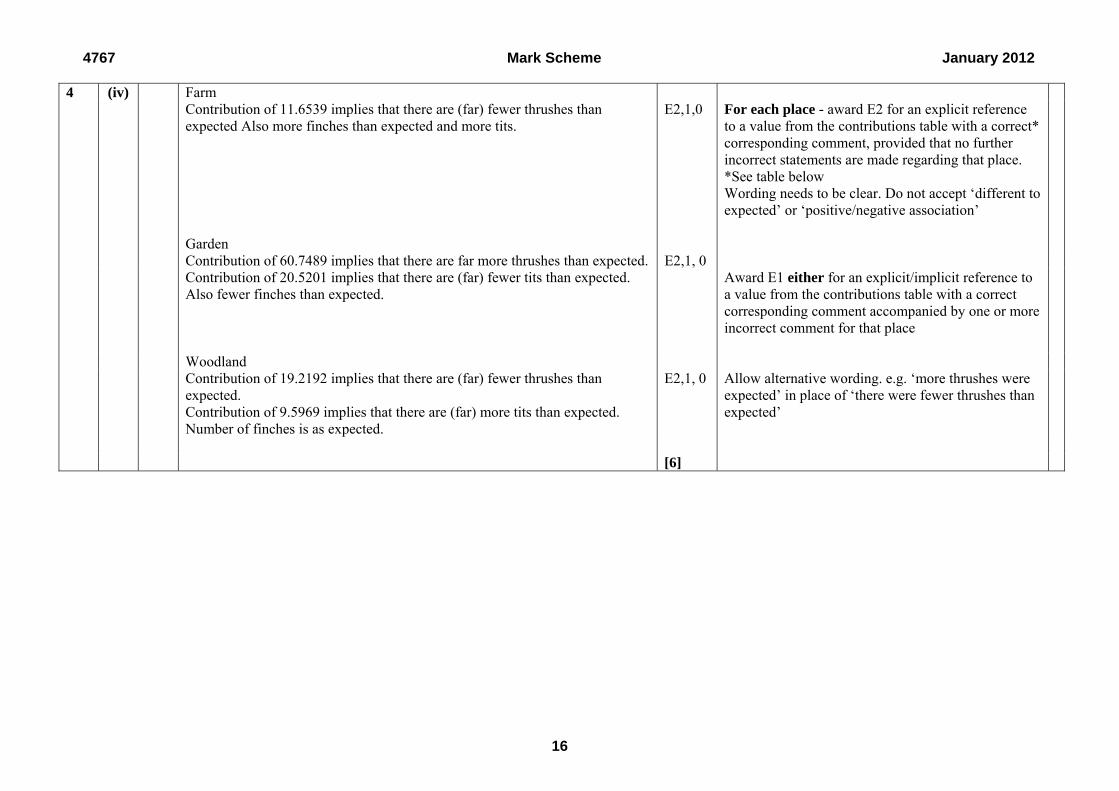
Farm Contribution of 11.6539 implies that there are (far) fewer thrushes than expected Also more finches than expected and more tits.
E2,1,0 For each place - award E2 for an explicit reference to a value from the contributions table with a correct* corresponding comment, provided that no further incorrect statements are made regarding that place. *See table below Wording needs to be clear. Do not accept ‘different to expected’ or ‘positive/negative association’
Garden Contribution of 60.7489 implies that there are far more thrushes than expected. E2,1, 0 Contribution of 20.5201 implies that there are (far) fewer tits than expected. Also fewer finches than expected.
Award E1 either for an explicit/implicit reference to a value from the contributions table with a correct corresponding comment accompanied by one or more incorrect comment for that place
Woodland Contribution of 19.2192 implies that there are (far) fewer thrushes than expected. Contribution of 9.5969 implies that there are (far) more tits than expected. Number of finches is as expected.
E2,1, 0 Allow alternative wording. e.g. ‘more thrushes were expected’ in place of ‘there were fewer thrushes than expected’
4 (iv)
[6]

4767 Mark Scheme January 2012
17
Farm Garden Woodland
Thrushes 11.6539
(far) fewer than expected
60.7489
Far more than expected
19.2192
(far) fewer than expected
Tits 2.0017
As expected/ more than expected
20.5201
(far) fewer than expected
9.5969
(far) more than expected
Finches 6.3332
(far) more than expected
6.1108
fewer than expected
0.0000
as expected
Oxford Cambridge and RSA Examinations is a Company Limited by Guarantee Registered in England Registered Office; 1 Hills Road, Cambridge, CB1 2EU Registered Company Number: 3484466 OCR is an exempt Charity OCR (Oxford Cambridge and RSA Examinations) Head office Telephone: 01223 552552 Facsimile: 01223 552553 © OCR 2012
OCR (Oxford Cambridge and RSA Examinations) 1 Hills Road Cambridge CB1 2EU OCR Customer Contact Centre Education and Learning Telephone: 01223 553998 Facsimile: 01223 552627 Email: [email protected] www.ocr.org.uk For staff training purposes and as part of our quality assurance programme your call may be recorded or monitored
OCR Report to Centres – January 2012
4767 Statistics 2
General Comments Once again, the overall level of ability shown by candidates taking this paper was very impressive. Most candidates demonstrated proficiency in the use of approximating distributions. A small number of candidates lost accuracy marks through providing final answers given correct to 5 or more significant figures. Candidates also showed a good understanding when carrying out hypothesis tests; it should be noted that the preferred form of conclusion is one which is not too assertive and which states clearly, in context, whether or not the evidence supports the alternative hypothesis. When stating hypotheses about a population mean, the explicit appearance of the word "population" has hitherto been insisted on. With effect from the June 2012 examination, it will be assumed that correct use of the correct notation μ will imply that this is a population mean. If any other notation is used, or if the hypotheses are stated verbally, use of the word "population" will continue to be insisted on. Comments on Individual Questions 1 (i) Well answered, with some issues concerning scaling of axes and lack of labels.
Unusual scales sometimes led to inaccurate plotting of points.
1 (ii) Generally very well answered. Errors in ranking and arithmetic (in squaring and adding up the d2) were noted, as well as incorrect rounding of final answers. Very few candidates failed to rank their data.
1 (iii) Most candidates correctly stated their hypotheses in terms of “association” and “no association” and referred to the context of the question. However, most candidates lost a mark by not making it clear what population their hypotheses applied to. Many candidates referred to “correlation” in their hypotheses and often provided hypotheses
written in terms of . Critical value and comparisons were substantially correct, but some candidates lost the final mark either by being too assertive in their claim or by neglecting to refer to the alternative hypothesis.
1 (iv) Many candidates failed to score on this part of the question. The words ‘bivariate’, ‘Normal’ and ‘distribution’ were seen often but not always together. The need for the underlying population to be bivariate Normal was not made clear by candidates as many seemed not to appreciate the difference between ‘data’ and ‘population’. Successful responses made clear that the shape of the points on the scatter diagram indicated that a test based on Spearman’s rank correlation coefficient was more appropriate; a small number of candidates recognised that one of the variables was discrete, thus invalidating the p.m.c.c. test.
2 (i) Many candidates did not provide clear enough explanations to justify the use of a Poisson distribution as a suitable model; those referring to “events” rather than “errors” were penalised.
2 (ii) Parts (A) and (B) were both well answered with the majority of candidates gaining full marks. Marks lost were usually in part (B), and due either to rounding errors or to mistakes when attempting to apply 1 – P(X ≤ 1).
2 (iii) Very well answered.
31
OCR Report to Centres – January 2012
2 (iv) Many candidates failed to score a mark here; of those that did score marks, not many gained all four available marks. For those who clearly knew what was needed, often one mark was lost through incomplete justification of the final answer. Some candidates appeared to be searching for k such that P(X = k) < 0.01 and produced k = 16 as their solution. As this value is close to the correct answer, and frequently given as the answer by those using the correct method, credit could only be given to well-explained work.
2 (v) Well answered with many gaining full marks. Commonly, marks were lost through not using the appropriate continuity correction. Some errors regarding incorrect variance, or incorrect use of variance when standardising, led to loss of marks.
3 (i) Very well answered with most gaining full marks. Marks were lost typically through inaccurate use of Normal tables or confusion caused by one of the z values being zero.
3 (ii) The expected Normal approximation caused problems for many; most correctly identified the mean but many struggled to obtain the correct variance. Again, many candidates struggled with the continuity correction. Some candidates correctly identified a Binomial distribution but then failed to use a Normal approximation. This led to a variety of wrong responses the most common of which was to try to work out P(− = 40) using their Binomial distribution.
3 (iii) There were many incorrect responses giving 1204 hours instead of 996. This resulted from candidates using 2.326 rather than −2.326 in their calculation. Commonly, marks were lost when answers were given to 5 or more significant figures.
3 (iv) Many candidates scored at least 6 of the 8 available marks for this part of the question. Typically, for these candidates, marks were lost through failure to correctly define μ as the population mean or through being too assertive in the final conclusion. Once again a variety of approaches was seen, with that outlined in the mark scheme being the most popular. Some candidates attempted a one-tailed test despite the clear instruction in the question. Those failing to realise that the test statistic was based on a sample mean were heavily penalised.
4 (i) Very well answered.
4 (ii) Very well answered.
4 (iii) This question was answered well by many. Common mistakes included reversal of hypotheses, use of “correlation” in hypotheses, incorrect addition of the contributions provided, incorrect critical value and over-assertive conclusions.
4 (iv) Some good answers were seen but many candidates chose to ignore the instructions given within the question and answered it in their own way. Thus, instead of focussing on “each place” the type of bird was chosen as the key factor; such responses could still earn full marks. Despite being asked to “use the table of contributions” many failed to refer to it in their comments. In such questions, candidates are required to recognise that large contributions support the alternative hypothesis and small contributions support the null hypothesis. Comments such as “the large contribution of 60.7489 shows that there were many more thrushes observed in the garden than would be expected if there was no association” were seen, but many candidates simply reeled off figures from the tables of observed and expected frequencies without any reference to contributions or attempt at interpretation.
32