monetary authority of singapore report.pdf · bank of china-mas bilateral currency swap arrangement...
TRANSCRIPT

Monetary Authority of SingaporeAnnuAl RepoRt 2013/14


Monetary Authority of SingaporeAnnuAl RepoRt 2013/14

Contents05 Chairman’s Message
08 Board of Directors
10 Management Team
11 Governance Structure
12 Board Committees
13 Organisational Structure
14 Key Economic and Financial Statistics
16 Financial Structure: Number of Financial Institutions in Singapore
ANChOr OF ECONOMIC AND FINANCIAl STABIlITy
20 the eConomy
20 the Global Recovery picked up pace
20 private Demand Supported Growth in the G3
21 external Demand Driving Growth in Asia ex-Japan
21 Financial Vulnerabilities and Risks
21 Headline Inflation Declined in the G3
22 Singapore Recorded Faster Growth
23 Core Inflation Rose in H2 2013
24 monetary PoliCy
24 manaGement oF liQuiDity
24 enhancing Singapore Dollar liquidity Management Framework
24 enhancing MAS Renminbi Facility
26 manaGement oF oFFiCial ForeiGn reserves
rOBuST, TruSTED, AND PurPOSEFulFINANCIAl CENTrE
30 a robust FinanCial Centre
30 overall
30 Banking
31 Securities
33 Insurance
34 International Supervisory Cooperation
34 Box 1: International Monetary Fund’s Financial Sector Assessment programme
35 a trusteD FinanCial Centre
35 Financial Benchmarks
35 preventing Money laundering and terrorism Financing
36 enhancing exchange of Information on tax
37 a DynamiC anD PurPoseFul FinanCial Centre
37 Growing our Core Industry pillars
38 Box 2: Singapore as a Global Insurance Marketplace
39 new Growth Areas
39 enhancing Workforce Competencies
40 Box 3: Milestones in Developing the RMB Market in Singapore
SErvING ThE PuBlIC, ENGAGING STAKEhOlDErS
44 enGaGinG the PubliC
44 Managing Dollars and Cents
45 MoneySenSe
46 Box 4: MoneySenSe 10th Anniversary
47 ProteCtinG Consumers
47 Financial Advisory Industry Review
47 enhancing prospectus Disclosure Rules for offers of Securities
47 WorKinG With inDustry
47 Industry Initiative on Contract Certainty
48 MASnet-Access
48 partnership with Academia

vAluED PArTNEr ON ThEINTErNATIONAl FrONT
52 international Forums
52 promoting Global Growth and Stability
52 International Financial Regulatory Reforms
53 reGional Forums
53 Asia Region Funds passport
53 ASeAn Cooperation
54 ASeAn+3
54 Box 5: opening of a Representative office in Beijing
55 executive Meeting of east Asia-pacific Central Banks
55 bilateral CooPeration
55 training and technical Assistance
56 Box 6: MAS’ technical Assistance programmes
ONE MAS: INTEGrATED ANDCOhESIvE
60 risK manaGement anD business Continuity
60 Controls anD oPerations
60 Audit Assurance
60 procurement Management
60 Building Services and Safety
60 enhancing Mobility and productivity
61 builDinG a stronG mas Family
61 leadership Development
61 Functional and General training
61 Attachments and Secondments
62 organisational Review exercise
62 Recognition of Staff
62 Fostering esprit De Corps
64 Box 7: Community outreach
67 FinanCial statements
97 statistiCal annex
115 Glossary

our mission is to promote sustained non-inflationary economic growth, and a sound and progressive financial centre
MAS’ FuNCTIONS• to act as the central bank of Singapore,
including the conduct of monetary policy, the issuance of currency, the oversight of payment systems and serving as banker to and financial agent of the Government
• to conduct integrated supervision of financial services and financial stability surveillance
• to manage the official foreign reserves of Singapore
• to develop Singapore as an international financial centre
WhATWe DO

Chairman’s MeSSAGe
the recovery in the global economy has entered a new phase. the advanced economies, which have experienced a slow and protracted recovery from the global financial crisis, are expected to provide much of the impetus for growth in the coming year. the united States is seeing continued labour market strengthening and resilience in private consumption, enabling it to begin a gradual process of normalising monetary policy. In the euro zone, financial stresses are receding, supporting a modest recovery from recession. Japan has experienced a spurt in growth, aided by unprecedented monetary easing. Asia could benefit from a slight uplift in exports this year, although tighter financial conditions and pockets of political uncertainty are weighing down on domestic demand. Growth in China, still a major engine of the world economy, is expected to moderate as it seeks to rein in the shadow banking sector and restructure its economy.
Global financial resilience has also improved. Bank balance sheets have seen further repair in the advanced economies. Asian banks could face some headwinds from slower economic growth, normalisation of global monetary conditions, and moderation in asset prices. But they remain anchored by healthy capital buffers and sound funding profiles.
the Singapore economy has shifted to a path of lower growth, constrained by slower labour force growth. In this context, the economy grew by a relatively strong 3.9%, compared with 2.5% in 2012. CpI-All Items inflation eased to 2.4% in 2013 from 4.6% in 2012, with the sustained appreciation of the Singapore Dollar dampening imported inflation and policy measures to contain Certificate of entitlement price increases and property market rentals bearing fruit.
With the gradual improvement in the global economic environment, our economy should see growth of 2–4% this year. CpI-All Items inflation is projected to average 1.5–2.0% in 2014. However, MAS Core Inflation which excludes the cost of accommodation and private road transport is expected to remain firm at 2–3% during this period of economic restructuring. this is higher than the historical norm, and is underpinned by the persistence of a tight labour market while improvements in productivity growth take time.
MAS will remain vigilant in ensuring that cost pressures are contained over the medium term, and inflation expectations are well-anchored. our monetary policy stance has been consistent with that aim. the slope of the S$ nominal effective exchange rate policy band was kept on a modest and gradual appreciation path in April and october 2013, and in April 2014.
the International Monetary Fund conducted a rigorous assessment of Singapore’s financial system in 2013 under its Financial Sector Assessment programme. the assessment affirmed Singapore’s standing as a sound and stable financial centre. It found Singapore’s regulatory and supervisory frameworks and practices to be among the best globally. the financial system was also assessed to be resilient against robust stress test scenarios.
“the International Monetary Fund conducted a rigorous assessment of Singapore’s financial system in 2013... (and) found Singapore’s regulatory and supervisory frameworks and practices to be among the best globally.”
5Annual Report 2013/14

MAS introduced further measures in 2013 to sustain financial stability and foster prudence among financial institutions and borrowers. We introduced a total Debt Servicing Ratio (tDSR) framework in June 2013 to govern property loans granted by financial institutions. the tDSR will help strengthen FIs’ credit underwriting practices over the long term and encourage financial prudence among borrowers. More immediately, it has had a salutary effect in cooling the property market.
together with the Singapore exchange (SGX), MAS launched a public consultation on measures to strengthen the securities market. MAS and SGX had, following a review of the securities market structure and practices, developed proposals to promote orderly trading and responsible investing, enhance the transparency of market intervention measures, and strengthen the process for admitting new listings and enforcement against listing rule breaches.
MAS has been working closely with the industry in implementing the recommendations of the Financial Advisory Industry Review (FAIR). these include a direct channel for consumers to buy life insurance products without having to pay commissions, a web aggregator for consumers to compare life insurance products, and a balanced scorecard remuneration framework to promote professional and ethical conduct among advisers. the FAIR initiatives will raise the standards and professionalism of the financial advisory industry, and encourage greater efficiency in the distribution of life insurance and investment products in Singapore.
2013 also marked the 10th anniversary of MoneySenSe, the national financial education and literacy programme that MAS has led, alongside various government agencies and financial industry associations. MoneySenSe has reached out to Singaporeans from all walks of life, through a wide range of channels including school programmes, workplace talks, community events,
public seminars, and the mass and social media. In the coming years, we will step up efforts to tailor financial education and outreach to the different segments of the population, such as low-income families and senior citizens as well as couples getting married. We will also equip social workers with basic financial knowledge so that they can better support Singaporeans seeking help.
Singapore continues to actively support global efforts to combat money laundering and the financing of terrorism. together with the Ministry of Home Affairs and the Ministry of Finance, MAS published Singapore’s first national Money laundering and terrorist Financing Risk Assessment (nRA) report in January 2014. Most of the industries covered by the report, including banks and casinos, were found to have robust preventive regimes. MAS is working to further strengthen the frameworks for anti-money laundering and countering the financing of terrorism
“the FAIR initiatives will raise the standards and professionalism of the financial advisory industry, and encourage greater efficiency in the distribution of life insurance and investment products in Singapore. ”
Chairman’s messaGe
in the segments identified for improvement in the report, including remittance agents, money-changers, and internet-based stored value facility holders. We are also introducing new regulations to address risks entailed in virtual currency intermediaries.
the launch of RMB clearing services in Singapore in May 2013 marked a significant milestone. We have taken active steps to support RMB market development, including enhancing the people’s Bank of China-MAS Bilateral Currency Swap Arrangement and the MAS RMB Facility. the introduction of RMB cross-border channels
6 Monetary Authority of Singapore

between Singapore and Suzhou Industrial park and tianjin eco-city, and the RMB Qualified Foreign Institutional Investor programme, should also enable greater RMB flows between China and Singapore. In addition, MAS will be working to foster greater connectivity and cooperation between the key RMB centres globally.
MAS is also working actively to sustain Singapore’s development as a financial centre and provide good career opportunities for Singaporeans in the industry.
We will continue to support the growth of globally competitive teams in Singapore, and work with key financial institutions to develop promising Singaporean talents in the industry. this includes structured programmes to groom Singaporeans for future leadership positions through rotation across various business lines and taking on overseas assignments. A new Asian Financial
“We will continue to support the growth of globally competitive teams in Singapore, and work with key financial institutions to develop promising Singaporean talents in the industry. ”
leaders programme will be launched to equip local practitioners with Asia-relevant leadership capabilities and prepare them for senior regional and global positions.
I would like to thank the financial industry players and our partners who work alongside MAS, and the management and staff of MAS, for their continued commitment to achieving sustainable growth and developing Singapore as a dynamic and well-respected international financial centre.
Tharman ShanmugaratnamChairman
7Annual Report 2013/14

boarD oF DIReCtoRS
Tharman ShanmugaratnamChairmanDeputy prime MinisterMinister for Finance
lim hng KiangDeputy ChairmanMinister for trade & Industry
heng Swee KeatMinister for education
lawrence Wong Shyun TsaiMinister for Culture, Community and Youth, Second Minister for Communications and Information
Quek See TiatChairman of Audit CommitteeChairman, Building and Construction Authority
lim Chee OnnChairman of Risk Committee, Senior International Advisor, Singbridge private ltd
8 Monetary Authority of Singapore

Peter Ong Boon Kweepermanent Secretary,Ministry of Finance
Tan Chorh Chuanpresident,national university of Singapore
ravi MenonManaging Director, MAS
Goh Chok TongSenior Advisor to MASemeritus Senior Minister
9Annual Report 2013/14

manaGement teAM
A. ravi Menon managing Director
B. Ong Chong Tee Deputy managing Director Financial Supervision
C. Jacqueline loh Deputy managing Director Monetary policy & Investment
/ Development & International
D. Andrew Khoo Deputy managing Director Corporate Development
E. Chia Der Jiun assistant managing Director Markets & Investment
F. Chua Kim leng assistant managing Director Banking & Insurance
G. lee Boon Ngiap assistant managing Director Capital Markets
h. leong Sing Chiong assistant managing Director Development & International
I. low Kwok Mun assistant managing Director Finance, Risk and Currency
J. Ng Nam Sin assistant managing Director Corporate, HR & It Services
K. Edward robinson assistant managing Director and Chief economist economic policy
l. Wong Nai Seng assistant managing Director policy, Risk & Surveillance
IK
C
e
ABD
H l JG
F
10 Monetary Authority of Singapore

GovernanCeStRuCtuRe
the Board is responsible for the high-level governance of MAS. the Board Committees exercise broad oversight and approve major changes to policies and strategies relating to the principal functions of MAS. the Managing Director is responsible for the day-to-day operations of MAS and is assisted by various groups and management committees within
MAS Board
Monetary and Investment
policy Meeting
Chairman’s Meeting
Risk Committee
Board StaffCommittee
Audit Committee
executive Committee
Management Committee
Financial Stability
Committee
Financial Supervision Committee
Development and
International Committee
Markets and Investment Committee
payment Systems
Development Steering Group
payments and
Settlement Committee
Civil penalty enforcement Committee
Management Staff
Committee I
Management Staff
Committee II
MAS. the executive Committee is the key decision making body at the management level. Chaired by the Managing Director, it is responsible for ensuring that MAS’ policies and initiatives are aligned with its overall direction and objectives. the executive Committee also oversees matters referred to it by other management decision-making fora.
Board and Board Committees
Management Committees
11Annual Report 2013/14

boarD CoMMItteeS
the MAS Act provides that the Board of Directors shall be responsible for the policy and general administration of the affairs and business of MAS. the Board is assisted by the following committees:
Chairman’s Meeting the Chairman’s Meeting approves major changes to MAS’ supervisory policies and regulatory framework. It also approves major changes to policies and strategies relating to financial centre development and international and regional relations. the Chairman’s Meeting comprises tharman Shanmugaratnam (Chairman), lim Hng Kiang, Heng Swee Keat, lawrence Wong and Ravi Menon.
Monetary and Investment Policy Meeting the Monetary and Investment policy Meeting deliberates and decides on issues relating to the formulation and implementation of monetary policy with the objective of maintaining price stability for sustainable economic growth. the Meeting also oversees the investment of MAS’ reserves. the Monetary and Investment policy Meeting comprises tharman Shanmugaratnam (Chairman), lim Hng Kiang, Heng Swee Keat, lawrence Wong and Ravi Menon.
Audit Committee the Audit Committee provides an independent assessment of MAS’ internal controls and financial reporting process. the Committee also reviews the efforts of MAS’ internal and external auditors. the Audit Committee comprises Quek See tiat (Chairman), peter ong and tan Chorh Chuan.
risk Committee the Risk Committee provides oversight and guidance on the management of risks faced by MAS. the Committee oversees the MAS-wide risk management framework, and reviews MAS’ risk management policies and processes for reporting of risks. the Risk Committee comprises lim Chee onn (Chairman), tan Chorh Chuan and Ravi Menon.
Staff Committeethe Staff Committee approves MAS’ key personnel policies, including overall pay policy. It also approves matters relating to the appointment, promotion and remuneration of senior management staff. the Staff Committee comprises tharman Shanmugaratnam (Chairman), lim Hng Kiang, Heng Swee Keat and Ravi Menon.
As at 1 July 2014
12 Monetary Authority of Singapore

orGanisationalStRuCtuRe
MONETAry POlICy & INvESTMENT / DEvElOPMENT & INTErNATIONAlJacqueline loh Deputy Managing Director
ECONOMIC POlICyedward robinson Assistant Managing Director and Chief economist
Economic Analysisng bok engexecutive Director
Economic Surveillance & ForecastingCeline siaexecutive Director
MArKETS & INvESTMENTChia Der JiunAssistant Managing Director
Monetary & Domestic Markets ManagementChia Der Jiun Assistant Managing Director
reserve Managementyap Chuin houiexecutive Director
DEvElOPMENT & INTErNATIONAlleong sing Chiong Assistant Managing Director
Financial Centre Developmentvalerie tayexecutive Director
Financial Markets Strategybenny Chey Director
Internationalbernard Weeexecutive Director
FINANCIAl SuPErvISIONong Chong teeDeputy Managing Director
BANKING & INSurANCEChua Kim lengAssistant Managing Director
Banking Department IChua Kim leng Assistant Managing Director
Banking Department IIWan aik Chye executive Director
Banking Department IIItai boon leongexecutive Director
Insuranceloo siew yeeexecutive Director
CAPITAl MArKETSlee boon ngiapAssistant Managing Director
Capital Markets Intermediariesmerlyn eeexecutive Director
Investment IntermediariesChristopher tanexecutive Director
Market ConductPaul yuenexecutive Director
Markets Policy & Infrastructureng yao loongexecutive Director
POlICy, rISK & SurvEIllANCEWong nai sengAssistant Managing Director
Prudential Policylim tuang lee executive Director
Specialist riskho hern shinexecutive Director
Macroeconomic Surveillancelam san lingexecutive Director
COrPOrATE DEvElOPMENTandrew KhooDeputy Managing Director
COrPOrATE, hr & IT SErvICESng nam sinAssistant Managing Director
Corporate Servicesbernard yeoexecutive Director
Information Technologylawrence angexecutive Director
human resourceluz Fooexecutive Director
MAS Academyng nam sinAssistant Managing Director
FINANCE, rISK & CurrENCylow Kwok munAssistant Managing Director
Financeteo Kok mingexecutive Director
risk ManagementDaniel Wangexecutive Director
CurrencyChung Wei Kenexecutive Director
As at 1 July 2014
ravi menonManaging Director
MANAGING DIrECTOr’S OFFICE
legalng heng FattGeneral Counsel
Strategic Planning and Communicationsmerlyn eeexecutive Director
Internal Audittimothy ngexecutive Director
teo swee lianSpecial Advisor
13Annual Report 2013/14

Key eConomiCAnD FInAnCIAl StAtIStICS
2009 2010 2011 2012 2013
National Income AggregatesGross Domestic product At Current Market prices (S$m) 279,858.0 322,361.1 344,712.4 358,542.6 372,813.9 Growth Rate (% change) 2.9 15.2 6.9 4.0 4.0 At 2010 Market prices (S$m) 279,729.3 322,361.1 341,886.1 350,446.0 363,941.9 Growth Rate (% change) -0.6 15.2 6.1 2.5 3.9 Gross national Income At Current Market prices (S$m) 266,889.0 320,526.6 339,767.8 350,029.7 363,827.2 Growth Rate (% change) 2.8 20.1 6.0 3.0 3.9
labour Forceunemployment Rate (%) 3.0 2.2 2.0 2.0 1.9 productivity Growth (% change) -3.3 11.6 2.2 -1.4 -0.2 Changes in employment ('000) 37.6 115.9 122.6 129.1 136.2 Average Monthly earnings (% change) -2.6 5.6 6.0 2.3 4.3 unit labour Cost (% change) 0.7 -3.2 1.8 3.9 2.6
Savings and Investment Gross national Savings (S$m) 124,493.0 166,120.1 172,782.5 171,566.5 176,576.1 As % of GnI 46.6 51.8 50.9 49.0 48.5 Gross Domestic Capital Formation (S$m) 77,424.4 89,841.2 94,053.8 108,894.9 108,311.5 As % of GnI 29.0 28.0 27.7 31.1 29.8
Balance of Payments (S$m)Goods Balance 69,205.5 85,682.2 87,472.2 79,249.8 84,827.9 exports of Goods 417,971.9 504,848.8 543,154.4 542,645.1 547,495.9 Growth Rate (% change) -16.3 20.8 7.6 -0.1 0.9 Imports of Goods 348,766.4 419,166.6 455,682.2 463,395.3 462,668.0 Growth Rate (% change) -20.8 20.2 8.7 1.7 -0.2 Services and other Balances -22,136.9 -9,403.3 -8,743.5 -16,578.2 -16,563.3 Current Account Balance 47,068.6 76,278.9 78,728.7 62,671.6 68,264.6 As % of GnI 17.6 23.8 23.2 17.9 18.8 Capital and Financial Account Balance -30,796.5 -24,920.6 -58,122.5 -28,898.2 -46,832.1 Balancing Item 184.1 6,122.2 881.5 -1,167.5 1,298.4 overall Balance 16,456.2 57,480.5 21,487.7 32,605.9 22,730.9 official Foreign Reserves 263,955.4 288,954.1 308,403.2 316,744.2 344,729.2
Inflation (% change)Consumer price Index 0.6 2.8 5.2 4.6 2.4 GDp Deflator 3.5 0.0 0.8 1.5 0.1
Monetary Aggregates (% change)M1 23.5 20.3 16.1 7.7 9.9 M2 11.3 8.6 10.0 7.2 4.3 M3 10.6 8.3 10.1 7.6 4.3
14 Monetary Authority of Singapore

2009 2010 2011 2012 2013
Interest rates (period average, % per annum)prime lending Rate 5.38 5.38 5.38 5.38 5.38Banks' 3-month Fixed Deposit Rate 0.29 0.21 0.17 0.14 0.143-month S$ SIBoR 0.70 0.56 0.41 0.39 0.383-month uS$ lIBoR 0.69 0.34 0.34 0.43 0.27
Exchange rates (period average, S$ per)uS Dollar 1.4545 1.3635 1.2579 1.2497 1.2513 pound Sterling 2.2737 2.1073 2.0161 1.9803 1.9573 euro 2.0242 1.8095 1.7495 1.6071 1.6621 100 Japanese Yen 1.5562 1.5543 1.5780 1.5672 1.2840 Malaysian Ringgit 0.4126 0.4234 0.4111 0.4046 0.3973
Banking and FinanceCommercial Banks' Assets/
liabilities (S$m)706,814.2 781,607.4 855,811.4 911,009.0 973,216.9
Growth Rate (% change) 5.8 10.6 9.5 6.4 6.8
Finance Companies' Assets/ liabilities (S$m)
11,691.9 11,523.6 12,165.3 14,967.5 14,985.7
Growth Rate (% change) -7.1 -1.4 5.6 23.0 0.1
Merchant Banks' Assets/ liabilities (S$m)
76,354.4 89,760.3 87,851.1 92,411.0 84,941.3
Growth Rate (% change) 5.2 17.6 -2.1 5.2 -8.1
Asian Currency units' Assets/ liabilities (uS$m)
869,399.6 971,299.4 1,019,532.9 1,093,264.6 1,180,617.4
Growth Rate (% change) -4.7 11.7 5.0 7.2 8.0
Insurancelife Insurers' Assets/liabilities (S$m) 119,895.5 131,903.7 133,905.4 148,592.5 153,208.7 Growth Rate (% change) 19.9 10.0 1.5 11.0 3.1
General Insurers' Assets/ liabilities (S$m) 15,905.8 17,431.6 27,209.4 26,267.6 26,484.0 Growth Rate (% change) 5.6 9.6 56.1 -3.5 0.8
CPFexcess of Contributions over
Withdrawals (S$m)9,404.4 12,374.2 14,184.8 14,321.6 13,666.8
Domestic Capital Market net Funds Raised in Domestic
Capital Market (S$m)56,566.5 62,296.5 82,763.7 78,664.9 100,252.1
Note: Domestic interbank rates have been discontinued with effect from 1 January 2014 and replaced with S$ SIBOR. US$ SIBOR rates have been also replaced with the US$ LIBOR.
15Annual Report 2013/14

FinanCial struCture:nuMBeR oF FInAnCIAl InStItutIonS In SInGApoRe
31 March 2005 2006 2007 2008 2009 2010 2011 2012 2013 2014
Banks 111 108 108 113 114 120 120 123 123 124local1 5 5 5 6 6 7 6 6 6 5 Foreign 106 103 103 107 108 113 114 117 117 119 Full banks 24 24 24 24 27 25 26 26 27 28 Wholesale banks2 35 34 36 42 41 46 50 52 53 55 offshore banks 47 45 43 41 40 42 38 39 37 36
(Banking offices including head offices and main offices) (396) (397)
(399) (408) (409) (421) (428) (432) (425) (449)
Asian Currency units 153 151 154 158 161 162 163 165 161 159Banks 106 104 106 111 112 117 117 120 120 121Merchant banks 47 47 48 47 49 45 46 45 41 38
Finance Companies 3 3 3 3 3 3 3 3 3 3(Finance companies' offices including head offices)
(39) (39) (39) (39) (39) (39) (39) (39) (39)
(39)
Merchant Banks 48 48 49 49 50 46 47 46 42 39
Insurance Companies 140 149 153 151 158 158 157 164 168 177Direct insurers 55 56 61 59 62 64 63 70 72 79Reinsurers 28 28 27 25 27 26 28 29 28 31Authorised reinsurers 0 5 5 5 6 6 6 6 6 6Captive insurers 57 60 60 62 63 62 60 59 62 61
Insurance Brokers 61 63 62 65 66 63 64 67 69 71
representative Offices 45 42 43 45 36 32 37 38 40 37Banks 45 42 43 45 36 30 34 36 38 36Merchant banks - - - - - - - - - -Insurance3 - - - - - 2 3 2 2 1
International Money Brokers 10 9 10 10 10 10 10 9 9 9
16 Monetary Authority of Singapore

1 Local banks comprise 5 full banks. 2 Previously known as restricted banks. 3 Data is unavailable for the period between 2004 and 2009. 4 Regulation of real estate investment trust management came into effect on 1 August 2008. 5 Regulation of credit rating services came into effect on 17 January 2012. 6 Regulation of trust companies came under the purview of MAS when the Trust Companies Act came into effect
on 1 February 2006. 7 Registration of fund management companies commenced under an enhanced regulatory regime which came into effect on 7 August 2012.
31 March 2005 2006 2007 2008 2009 2010 2011 2012 2013 2014
licensed Financial Advisers 56 61 67 69 73 71 67 67 62 58
Capital Markets Services licensees
168 171 183 215 221 224 251 250 295 443
Dealing in Securities 65 72 77 93 90 99 98 94 106 118trading in Futures Contracts
34 38 40 46 50 48 47 50 52 59
Advising on Corporate Finance
30 33 36 37 37 34 33 34 37 40
Fund Management 91 92 97 110 113 107 118 119 158 289leveraged Foreign exchange trading
11 13 14 18 19 19 19 20 23 24
Securities Financing 15 16 15 16 16 17 18 17 17 17providing Custodial Services for Securities
27 31 34 38 40 39 40 40 38 37
Real estate Investment trust Management4
- - - - 1 7 22 23 26 31
providing Credit Rating Services5
- - - - - - - - 3 3
licensed Trust Companies6 - - 31 35 38 40 48 50 51 52
registered Fund Management Companies7
- - - - - - - - 74 236
17Annual Report 2013/14


ANChOR of
eCONOMIC and FINANCIAL STABILITY

ThE ECONOMy
ThE GlOBAl rECOvEry PICKED uP PACE
the global economy expanded by 3.8% in 2013, similar to the 3.9% growth in 2012. However, the recovery gathered momentum as the year progressed. In the united States (uS), private consumption remained resilient despite a large fiscal contraction that dragged growth down, particularly in the first half of the year. the euro zone emerged from recession in the second quarter of 2013, on the back of strengthening private investment. Japan’s growth was boosted by fiscal and monetary stimuli, although weaker exports dampened momentum in the second half. In Asia ex-Japan, a slowdown in domestic demand was partially offset by a strengthening of external trade in late 2013.
After five years of unconventional monetary policy, the uS Federal Reserve started the process towards policy normalisation last year. In mid-2013, concern over the timing of the Federal Reserve’s withdrawal of quantitative easing (Qe) sparked a market sell-off and an abrupt reversal of capital flows in some emerging economies. Following this bout of financial volatility, several countries in Asia took decisive policy action to halt the build-up of external imbalances and bolster confidence. As a result, market reactions following the start of Qe tapering in December 2013 were generally more subdued.
PrIvATE DEMAND SuPPOrTED GrOWTh IN ThE G3
Growth in the uS economy slowed to 1.9% in 2013, from 2.8% in 2012, as the fiscal drag and heightened uncertainty over future economic policies worsened investor sentiment. In FY2013,
anChor oF eConomiC AnD FInAnCIAl StABIlItY
fiscal tightening amounted to an estimated 2.9% of GDp, mainly due to the budget sequester that came into effect in March 2013. expectations of an early Qe tapering in May 2013 triggered a rise in mortgage rates, dampening the recovery in the housing market, while the partial government shutdown in october 2013 weighed further on business sentiment. nonetheless, household confidence remained resilient and private consumption spending stayed firm throughout the year, on the back of steady employment gains. policy uncertainty was significantly lifted towards the end of the year when the uS Congress agreed on a budget that would keep the federal government funded for the next two fiscal years.In Q1 2014, however, an unusually cold winter led to a contraction in uS GDp, although the economy has since picked up.
economic conditions in the euro zone improved progressively in 2013. the region exited from recession in Q2 and continued to expand at a modest pace in the two subsequent quarters. private investment led the recovery, as borrowing costs fell and corporate profitability improved. the recovery broadened to the periphery in H2 2013, with Spain and Italy returning to positive growth in Q3 and Q4, respectively, after being mired in recession for two years. However, private consumption remained sluggish and government spending in the highly indebted economies was cut back to meet deficit targets. As a result, the pace of recovery was insufficient to prevent an overall contraction in GDp of 0.4% for the whole of 2013, after a 0.6% decline in 2012. nevertheless, the euro zone economy continued to expand in Q1 2014, registering GDp growth of 0.7% on a q-o-q seasonally adjusted annualised rate (SAAR) basis.
Japan’s GDp growth picked up to 1.5%, from 1.4% in the previous year, as large-scale monetary
20 Monetary Authority of Singapore

easing and fiscal expansion were rolled out in the first half of the year. the effects of the stimulus measures waned towards the end of the year and flagging exports weighed on growth. nonetheless, economic activity in Q4 2013 was supported by the frontloading of household expenditure in anticipation of the scheduled rise in the consumption tax from 5% to 8% in April 2014. In the first three months of 2014, GDp growth accelerated to 6.7% q-o-q SAAR, as discretionary spending peaked ahead of the tax hike.
ExTErNAl DEMAND DrIvING GrOWTh IN ASIA Ex-JAPAN
Growth in the Asia ex-Japan economies slowed slightly to 5.1% in 2013 from 5.2% in 2012, as domestic demand weakened due to several headwinds. In China, monetary tightening and curbs on the informal financial sector restrained manufacturing and real estate investment, while an official campaign to rein in lavish government spending curtailed retail sales. nonetheless, China’s economy grew by 7.7% in 2013, unchanged from 2012, as state-financed infrastructure spending helped to shore up investment in the second half of the year.
Growth in the ASeAn-4 economies slowed more rapidly to 5.0% in 2013, from 6.1% in 2012. Credit expansion, which had been constrained by deteriorating external balances and rising household leverage, moderated further amid tighter global liquidity and higher long-term interest rates. economic activity across the region was also dampened by the partial retraction of fiscal spending. nevertheless, an improvement in external demand in the second half of the year helped to cushion the pullback in domestic demand, with net exports contributing positively to growth since Q3 2013, after posing a drag for seven consecutive quarters.
the newly industrialised economies’ (nIes) strong economic fundamentals enabled them to better weather the effects of market volatility arising from Qe tapering. As a result, GDp growth in the nIes as a whole accelerated to 2.7% in 2013, from 1.7% in 2012, as an export-led recovery towards the end of 2013 boosted domestic demand. Despite some slippage in Q1 2014 due to the temporary retraction in uS demand and slower growth in China, Asia ex-
Japan exports and economic activity have picked up again in recent months.
FINANCIAl vulNErABIlITIES AND rISKS
Global financial markets performed strongly in FY2013, underpinned by improved economic prospects in advanced economies and still-accommodative global monetary conditions. From April 2013 to March 2014, the S&p 500 rose by 19.9%, the DJ eurostoxx rose by 21.5%, and the nikkei 225 rose by 22.2%. Meanwhile, the MSCI Asia ex-Japan Index rose by a more moderate 0.6% as emerging markets experienced some market volatility triggered by uncertainty over Qe tapering.
In the advanced economies, financial conditions have improved significantly alongside continued progress in financial system reforms and the repairing of bank balance sheets. In europe, investor confidence was buoyed by the successful bailout exits by a number of crisis-hit euro zone economies. While immediate risks to the euro zone have been contained, structural reforms to ensure fiscal sustainability and the clean-up of bank and corporate balance sheets are needed to avoid further flare-ups.
In China, there are concerns over shadow banking and rising local government debt. policymakers are taking active measures to contain growth in shadow banking and reform China’s banking system.
Despite market volatility in emerging markets, Asian banks have remained resilient, supported by healthy capital buffers and sound funding profiles. looking ahead, Asian banks face headwinds from Qe tapering, slower economic growth and declining asset quality - risks that may be amplified by the continued build-up of leverage in emerging Asia.
hEADlINE INFlATION DEClINED IN ThE G3
Global inflation remained benign in 2013. In the G3, headline inflation fell to 1.3% in 2013 from 1.9% in 2012. the uS and the euro zone faced mild disinflationary pressures stemming from lower energy costs and slack in capacity utilisation. However, Japan saw a significant rise in inflation in H2 2013, as higher prices of imported goods were
21Annual Report 2013/14

passed through to consumer prices. Meanwhile, inflation in Asia ex-Japan was unchanged at 3.9% in 2013. While supply-side constraints in India kept prices elevated and the rationalisation of fuel subsidies in some ASeAn-4 countries put upward pressure on inflation rates in the second half of 2013, these were offset by an easing of price pressures in the nIes due to subdued commodity prices.
In the first three months of 2014, global inflation remained subdued. While headline inflation increased slightly in the uS, a stronger euro held down import costs and contributed to much smaller price increases in the euro zone. price pressures in Asia ex-Japan eased somewhat, on account of lower food prices in India and China.
SINGAPOrE rECOrDED FASTEr GrOWTh
the domestic economy grew by 3.9% in 2013, following a modest outturn of 2.5% in the preceding year. notwithstanding intermittent bouts of volatility, economic activity in Singapore strengthened throughout the course of last year (see Chart 1).
this was largely on account of the pickup in trade-related activities. In particular, Singapore’s electronics production posted its first annual expansion after two consecutive years of contraction, on the back of a turnaround in the
anChor oF eConomiC anD FinanCial stability
global It cycle. Growth in the manufacturing sector, in turn, led to positive spillovers to the supporting wholesale trade, and transport and storage industries. At the same time, financial services staged a strong rebound amid positive investor sentiment and strong credit demand from the trade-related industries. Meanwhile, domestic demand remained resilient. notably, the construction sector recorded robust growth, boosted by a steady roll-out of commercial and residential projects.
nonetheless, growth momentum eased at the start of this year with the Singapore economy recording a sequential expansion of 2.3% q-o-q SAAR in Q1 2014, following a 6.9% increase in the preceding quarter. Despite the stellar outturn in the manufacturing sector, most of the trade-related industries saw some pullback in Q1 2014. In particular, Singapore’s re-exports to the uS and China contracted amid a slowdown in both economies early this year. Meanwhile, the sentiment-sensitive financial services segment experienced some headwinds as global financial markets retracted on a resurgence of jitters over possible risk events, such as a sharper-than-expected slowdown in China, and an escalation of conflict in ukraine. Concurrently, sectors dependent on domestic demand slowed, partly reflecting weaker private sector construction activities and softer demand for real estate business services.
Chart 1. Singapore’s real GDP Growth
YoY
QoQ SAARper
Cen
t
12
8
4
0
-4
2012Q1 Q2 Q3 Q4 Q2 Q3 Q4 2014Q12013Q1
22 Monetary Authority of Singapore

Chart 2. Contribution to CPI-All Items Inflation
For the rest of the year, gradual improvements in the external environment, together with a sustained recovery in the global It industry, should provide some support to Singapore’s external-oriented industries. Meanwhile, the domestic-oriented sectors are expected to remain resilient over the course of the year, buttressed by public infrastructure expansions in the construction, education and healthcare industries. nonetheless, while cyclical factors are broadly supportive of growth this year, the effects of the ongoing restructuring could dampen growth. this is because pressures from resource constraints continue to be binding, given slowing resident labour force growth and foreign worker inflows. Firms could also experience compressed profit margins in this transitional period, even as they undertake the necessary investments in capital, improve work processes and augment the skill sets of workers. on balance, the Singapore economy is projected to expand by 2–4% this year. COrE INFlATION rOSE IN h2 2013
Singapore’s labour market remained tight in 2013, with the overall unemployment rate falling to 1.9%, a 16-year low. this reflected strong labour demand from the domestic-oriented sectors alongside further foreign worker tightening measures. Consequently, resident wage growth rose from 2.3% in 2012 to 4.3% in 2013, which, together
with flat labour productivity, resulted in a build-up in business cost last year.
While the pass-through of domestic cost to consumer prices was muted in H1 2013, it picked up in H2. As a result, MAS Core Inflation, which excludes the cost of accommodation and private road transport, edged up in the latter part of the year. For the whole of 2013, MAS Core Inflation was 1.7% compared to 2.5% in 2012. Meanwhile, CpI-All Items inflation came in at 2.4% in 2013, lower than the 4.6% in the preceding year, due to softer housing rentals and a correction in Certificate of entitlement premiums following the introduction of motor vehicle loan restrictions in February 2013.
As the economy transits towards more sustainable, productivity-driven growth, the labour market will remain tight. Wage pressures will persist and firms are likely to continue passing on higher business cost to consumer prices. In comparison, price pressures from most of Singapore’s key import source countries should remain subdued. the impact from global commodity prices should also be relatively contained, given the supply buffers in most markets. nonetheless, there are risks from higher oil prices if geopolitical tensions in the Middle east escalate significantly. taking these factors into account, MAS Core Inflation is expected to stay elevated at 2–3% in 2014. CpI-All Items inflation would be lower, with modest contributions from
2012Q1 Q2 Q3 Q4 2013Q1 Q2 Q3 Q4 2014Q1-1
0
1
2
3
4
5
6
% P
oint
Con
trib
utio
n
CpI-All Items Inflation Services Food Accommodation others Car prices oil-Related
23Annual Report 2013/14

anChor oF eConomiC anD FinanCial stability
car prices and imputed rentals on owner-occupied accommodation.
MONETAry POlICy
economic activity in Singapore in 2013 saw sustained albeit uneven growth as the year progressed, underpinned by a mild recovery in the G3. the trade-related activities improved, while financial services rebounded on the back of robust lending. Domestic-driven sectors, such as construction and other services, were broadly resilient. overall job creation was strong, while the supply of labour was constrained by tighter foreign worker policies. Accordingly, the economy remained at full employment and wage pressures picked up.
Against this backdrop, MAS kept the slope of the S$ nominal effective exchange rate (S$neeR) policy band on a modest and gradual appreciation path in April and october 2013. Despite near-term uncertainties in the emerging economies, the Singapore economy is projected to grow at a moderate pace in 2014. the labour market will likely remain tight and MAS Core Inflation should stay elevated as firms pass on accumulated costs to consumer prices. MAS therefore maintained the policy stance in April 2014 to keep inflationary pressures contained.
Monetary policy in Singapore is formulated with the objective of promoting price stability over the medium term as the basis for sustainable economic growth. Chart 3 traces the evolution of monetary policy against the backdrop of changes in key macroeconomic variables. MAS has maintained a modest and gradual appreciation path for the S$neeR policy band since April 2010, which has restrained but not fully offset temporary inflationary pressures from economic restructuring.
MANAGEMENT OF lIQuIDITy
ENhANCING SINGAPOrE DOllAr lIQuIDITy MANAGEMENT FrAMEWOrK
In 2013, MAS continued to enhance our liquidity management framework, to improve our ability
to provide Singapore dollar (SGD) liquidity and to meet the demand for high quality liquid assets by banks operating in Singapore.
BOJ Cross-border Collateral ArrangementMAS has been entering into cross-border collateral arrangements (CBCAs) with foreign central banks since 2009 to strengthen our ability to provide banks in Singapore with SGD liquidity against safe and liquid foreign currency and foreign currency-denominated collateral. In July 2013, MAS added the Bank of Japan (BoJ) to the list of CBCAs established with foreign central banks. the arrangement with BoJ allows banks in Singapore to pledge Japanese government securities at the Standing Facility to obtain SGD liquidity. this collaboration reinforces the commitment of BoJ and MAS to support the long-standing economic and financial relationship between Japan and Singapore, and brings the total number of CBCAs established by MAS to eight.
Introduction of 24-week MAS Billsto continue to meet the banking system’s demand for high quality liquid assets and further deepen domestic money markets, MAS has stepped up the issuance of MAS Bills, which have replaced 3- and 6-month t-Bills. to further develop the capacity of the MAS Bill market, MAS also extended the maturity of MAS Bills to include the 24-week tenor in January 2014. At the end of FY2013, about S$74.4 billion in outstanding MAS Bills was available to financial institutions, including S$12.8 billion of 24-week MAS Bills.
ENhANCING MAS rENMINBI FACIlITy
In March 2013, MAS renewed and enhanced the bilateral currency swap arrangement with the people’s Bank of China. under this arrangement, up to RMB 300 billion is available to eligible financial institutions in Singapore for trade and market stability purposes. In July 2013, MAS enhanced the MAS Renminbi (RMB) Facility to provide RMB liquidity in tenors of one week and one month for market stability purposes, in addition to the existing 3-month tenor for trade and direct investment into China. the pool of eligible collateral was also expanded from SGD cash to include Singapore Government Securities (SGS) and MAS Bills.
& Wi
24 Monetary Authority of Singapore

Chart 3. Key Macroeconomic variables and the Monetary Policy Stance
Wide
25Annual Report 2013/14
116
112
108
104
100
96
6
4
2
0
6
5
4
3
2
1
0
20
16
12
8
4
02010 2011 2012 2013 2014Q1
Inde
x (Q
1 20
10=1
00)
% o
f Pot
entia
l GD
P%
yO
y%
yO
y
2014Q1:4.9%
2014Q1:2.0%
1.0%
real GDP Growth
Output Gap
CPI-All Items Inflation
MAS Core Inflation
S$NEEr
neutralpolicy
Re-centre
ReduceSlope
Shift to Modest & Gradual
Appreciation & Re-centre
Increase Slope Slightly & Widen Band
Increase Slope Slightly & Restore narrower
Band
Maintain
Modest & Gradual Appreciation
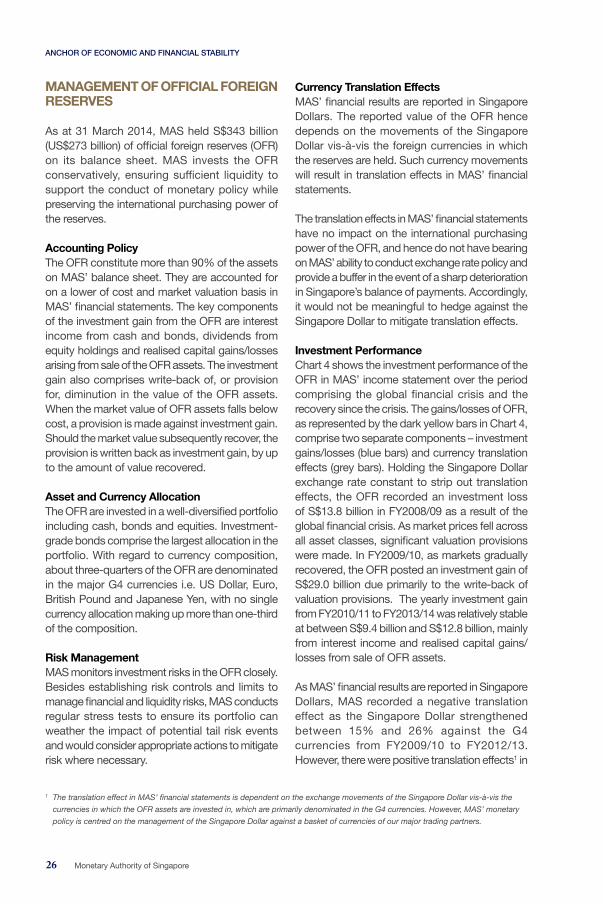
MANAGEMENT OF OFFICIAl FOrEIGN rESErvES
As at 31 March 2014, MAS held S$343 billion (uS$273 billion) of official foreign reserves (oFR) on its balance sheet. MAS invests the oFR conservatively, ensuring sufficient liquidity to support the conduct of monetary policy while preserving the international purchasing power of the reserves.
Accounting Policy the oFR constitute more than 90% of the assets on MAS’ balance sheet. they are accounted for on a lower of cost and market valuation basis in MAS’ financial statements. the key components of the investment gain from the oFR are interest income from cash and bonds, dividends from equity holdings and realised capital gains/losses arising from sale of the oFR assets. the investment gain also comprises write-back of, or provision for, diminution in the value of the oFR assets. When the market value of oFR assets falls below cost, a provision is made against investment gain. Should the market value subsequently recover, the provision is written back as investment gain, by up to the amount of value recovered.
Asset and Currency Allocation the oFR are invested in a well-diversified portfolio including cash, bonds and equities. Investment-grade bonds comprise the largest allocation in the portfolio. With regard to currency composition, about three-quarters of the oFR are denominated in the major G4 currencies i.e. uS Dollar, euro, British pound and Japanese Yen, with no single currency allocation making up more than one-third of the composition.
risk Management MAS monitors investment risks in the oFR closely. Besides establishing risk controls and limits to manage financial and liquidity risks, MAS conducts regular stress tests to ensure its portfolio can weather the impact of potential tail risk events and would consider appropriate actions to mitigate risk where necessary.
Currency Translation EffectsMAS’ financial results are reported in Singapore Dollars. the reported value of the oFR hence depends on the movements of the Singapore Dollar vis-à-vis the foreign currencies in which the reserves are held. Such currency movements will result in translation effects in MAS’ financial statements.
the translation effects in MAS’ financial statements have no impact on the international purchasing power of the oFR, and hence do not have bearing on MAS’ ability to conduct exchange rate policy and provide a buffer in the event of a sharp deterioration in Singapore’s balance of payments. Accordingly, it would not be meaningful to hedge against the Singapore Dollar to mitigate translation effects.
Investment PerformanceChart 4 shows the investment performance of the oFR in MAS’ income statement over the period comprising the global financial crisis and the recovery since the crisis. the gains/losses of oFR, as represented by the dark yellow bars in Chart 4, comprise two separate components – investment gains/losses (blue bars) and currency translation effects (grey bars). Holding the Singapore Dollar exchange rate constant to strip out translation effects, the oFR recorded an investment loss of S$13.8 billion in FY2008/09 as a result of the global financial crisis. As market prices fell across all asset classes, significant valuation provisions were made. In FY2009/10, as markets gradually recovered, the oFR posted an investment gain of S$29.0 billion due primarily to the write-back of valuation provisions. the yearly investment gain from FY2010/11 to FY2013/14 was relatively stable at between S$9.4 billion and S$12.8 billion, mainly from interest income and realised capital gains/losses from sale of oFR assets.
As MAS’ financial results are reported in Singapore Dollars, MAS recorded a negative translation effect as the Singapore Dollar strengthened between 15% and 26% against the G4 currencies from FY2009/10 to FY2012/13. However, there were positive translation effects1 in
anChor oF eConomiC anD FinanCial stability
1 The translation effect in MAS’ financial statements is dependent on the exchange movements of the Singapore Dollar vis-à-vis the
currencies in which the OFR assets are invested in, which are primarily denominated in the G4 currencies. However, MAS’ monetary
policy is centred on the management of the Singapore Dollar against a basket of currencies of our major trading partners.
26 Monetary Authority of Singapore
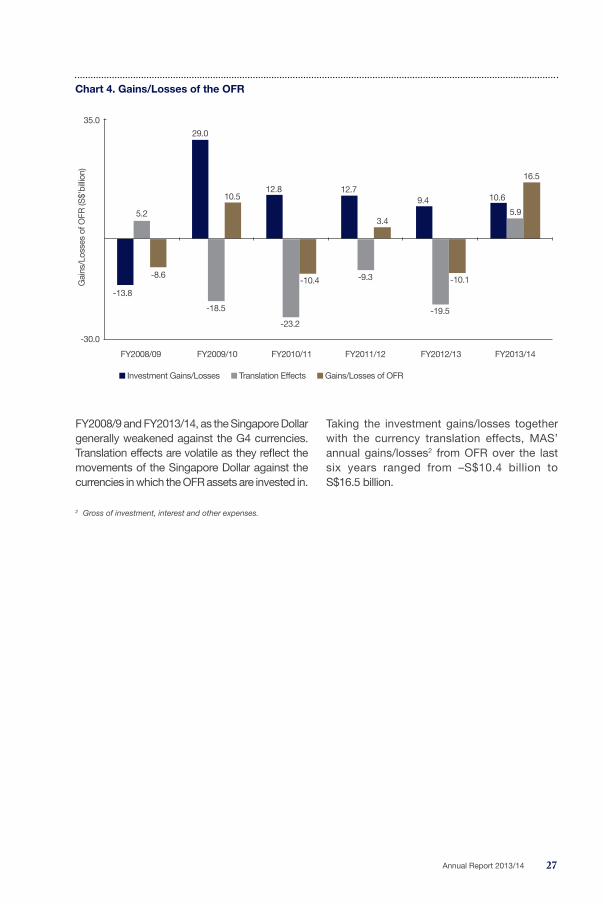
Chart 4. Gains/losses of the OFr
-30.0
FY2008/09
Investment Gains/losses translation effects Gains/losses of oFR
FY2009/10 FY2010/11 FY2011/12 FY2012/13 FY2013/14
Gai
ns/l
osse
s of
oFR
(S$’
billi
on)
35.0
-13.8
-8.6
29.0
10.512.8 12.7
9.4
-19.5
-10.1
10.6
5.9
16.5
3.4
-9.3
-23.2
-10.4
-18.5
5.2
FY2008/9 and FY2013/14, as the Singapore Dollar generally weakened against the G4 currencies. translation effects are volatile as they reflect the movements of the Singapore Dollar against the currencies in which the oFR assets are invested in.
2 Gross of investment, interest and other expenses.
taking the investment gains/losses together with the currency translation effects, MAS’ annual gains/losses2 from oFR over the last six years ranged from –S$10.4 billion to S$16.5 billion.
27Annual Report 2013/14


ROBUST, TRUSTeD, and PURPOSeFUL FINANCIAL CeNTRe

robust, trusteD, anD puRpoSeFul FInAnCIAl CentRe
A rOBuST FINANCIAl CENTrE
OvErAll
Industry-Wide Stress TestsMAS conducts industry-wide stress tests of financial institutions in Singapore annually. In 2013, financial institutions were stress tested on two adverse scenarios – a V-shaped recession where GDp declines sharply in the first year and recovers thereafter, and a protracted recession where GDp declines over three years. Both scenarios entail large declines in domestic and regional economic activity. the stress tests showed that banks and insurers are resilient to adverse macroeconomic scenarios. the International Monetary Fund’s Financial Sector Assessment programme in 2013 also assessed that Singapore’s financial system is resilient to the domestic and global risks it is exposed to.
Industry-Wide Business Continuity ManagementMAS published an information paper in December 2013, providing a comprehensive overview of the Business Continuity Management landscape in the financial industry. Drawing on the results from an extensive survey of the industry, the information paper shared good practices as well as opportunities for improvement in various areas, such as business resiliency and crisis management.
Financial District Security ProgrammeIn 2013, the Financial District Security programme (FDSp) was restructured to engage and strengthen partnership with the industry on physical security, contingency planning and business continuity management issues. the FDSp now has more
financial institutions represented on its Steering Committee and senior representatives from financial institutions (such as Chief operating officers or equivalent) as Steering Committee members.
Enhancing Technology risk ManagementMAS issued the technology Risk Management Guidelines and notice to financial institutions in June 2013. the Guidelines set out MAS’ minimum expectations of financial institutions’ technology risk governance and security practices to address existing and emerging technology risks within the financial industry.
the notice allows specific penalties to be imposed on financial institutions that fail to maintain a high level of reliability, availability and recoverability of their critical It systems, or do not implement strong It controls to protect customer information from unauthorised access or disclosure.
BANKING
Strengthening resilienceMAS implemented fully the Basel III capital standards for Singapore-incorporated banks with effect from 1 January 2013. MAS requires Singapore-incorporated banks to meet capital adequacy standards that are higher than the Basel capital standards. For Common equity tier 1 capital, Singapore-incorporated banks will be required to maintain a ratio of at least 9% by 1 January 2015 (inclusive of a capital conservation buffer requirement of 2.5%) compared to the Basel III requirement of 7%. MAS also implemented in 2013 the other Basel III capital reforms to improve the quality of capital, enhance risk coverage and begin monitoring the leverage ratio.
30 Monetary Authority of Singapore

effective 1 January 2014, MAS also implemented the disclosure and submission requirements set out in the Basel Committee on Banking Supervision (BCBS)’s framework for assessing global systemically important banks (G-SIBs). this will facilitate assessment of the systemic importance of Singapore-incorporated banks based on the BCBS’ G-SIB assessment methodology.
Mortgage loans underwriting StandardsMAS conducted a thematic inspection of the residential property loans business of major banks in late 2012. the thematic inspection revealed that the banks have put in place adequate policies and procedures to assess the credit worthiness and repayment capability of their borrowers. the inspection also found that the overall non-performing loan ratio across the major banks was low. In addition, the banks have also been subjecting their residential property portfolios to regular monitoring and reviews, as well as stress testing to ensure that any vulnerabilities or deterioration in asset quality is promptly detected and addressed.
nonetheless, there were variations in the methodologies and practices used by banks to compute the debt servicing ratio and determine the loan approval thresholds. to strengthen and standardise credit underwriting practices among banks, MAS issued the notice on Computation of total Debt Servicing Ratio (tDSR) for property loans and refined the existing housing loan rules for banks in June 2013.
Macroprudential PoliciesMAS introduced a tDSR framework in June 2013 to strengthen the credit underwriting practices of financial institutions and encourage financial prudence among borrowers. the tDSR has to be computed for individual borrowers obtaining a property loan from a financial institution and should generally not exceed 60%.
to instil greater financial prudence among borrowers, MAS also lowered the maximum tenure of new loans granted by financial institutions for the purchase of HDB flats from 35 years to 30 years in August 2013. loans with tenures that exceed 25 years or whose loan periods extend beyond the borrower’s age of 65 are subject to tighter loan-to-value limits. In addition, MAS introduced
a mortgage servicing ratio of 30% on loans for the purchase of executive condominium units bought directly from property developers in December 2013.
SECurITIES
review of Market Structure and Practices In February 2014, MAS and Singapore exchange (SGX) published a consultation paper on a review of the securities market structure and practices. the consultation paper follows an extensive review by MAS and SGX, and sets out broad policy proposals that are aimed at strengthening the securities market in Singapore. the review concluded that the securities market remains sound but identified three key areas for possible enhancements:
• promoting orderly trading and responsible investing;
• Improving the transparency of market intervention measures; and
• Strengthening the process for admitting new listings and enforcing against listing rule breaches.
Key proposals in the consultation paper include:
• Introducing a minimum trading price for issuers listed on the SGX Mainboard to address risks of high volatility generally associated with low-priced securities, which in turn make them more susceptible to excessive speculation and potential market manipulation;
• Requiring securities intermediaries to impose minimum collateral for securities trading based on customers’ open positions;
• Introducing short position reporting requirements to enhance transparency;
• Requiring trading restrictions by securities intermediaries to be announced through the SGX website to ensure fair and transparent dissemination of such information; and
• Strengthening SGX’s process for admitting new listings and enforcing against listing rule breaches by setting up an independent listings Advisory Committee, listings Disciplinary Committee and
listings Appeals Committee.
31Annual Report 2013/14

MAS and SGX will consider carefully all feedback received during the 12-week consultation period, and will further engage key stakeholders and the public before we implement any of the proposals.
OTC Derivatives reforms MAS remains fully committed to meeting the G20 objective to strengthen regulation of over-the-counter (otC) derivatives. In line with G20 and Financial Stability Board (FSB) recommendations to strengthen regulation of the global otC derivatives markets, MAS has been implementing reforms in domestic otC derivatives steadily over the past year.
the regulatory regimes for otC derivatives clearing facilities and trade repositories commenced in August 2013. Following the introduction of the regulatory regime for trade repositories, DtCC Data Repository (Singapore) pte ltd (DDRS) set up the first local trade repository and was approved by MAS as a licensed trade repository in Singapore in november 2013. DDRS enables reporting of otC derivative trades and is an important financial market infrastructure in enhancing transparency and regulatory oversight of the otC derivatives market in Singapore.
the Securities and Futures Act (SFA) amendments to allow MAS to mandate central clearing came into effect in november 2012. MAS is currently drafting regulations on mandatory central clearing. In line with the G20’s recommendation of implementing a trading mandate where appropriate, MAS is studying the implications of implementing a trading mandate in Singapore. We participated actively in discussions at various international fora, such as the FSB, the International organisation of Securities Commissions (IoSCo) and the Committee on payment and Settlement Systems (CpSS). MAS also chairs the IoSCo Working Group on Risk Mitigation Standards for non-Centrally Cleared Derivatives, which is developing standards on risk mitigation techniques for uncleared otC derivative transactions.
At the bilateral level, MAS has continued to engage in constructive discussions with foreign regulators, such as the uS Commodity Futures trading Commission (CFtC), the european Commission
(eC) and the european Securities and Markets Authority (eSMA), on substituted compliance or equivalence assessments of our otC derivatives regulatory regime.
Singapore exchange Derivatives Clearing limited (SGX-DC) is the first Asian-based central clearing counterparty (CCp) to be registered by CFtC as a derivatives clearing organisation (DCo). With effect from 31 December 2013, SGX-DC, as a DCo, is able to clear swaps for uS persons. In connection with the DCo registration, MAS signed a supervisory Memorandum of understanding with CFtC in December 2013.
eSMA has also assessed and recommended to the eC that our clearing house and trade repository regulatory regimes are broadly equivalent to the european regime. MAS continues to engage the eC to finalise the outcome of the assessment.
MAS views these assessments as important measures to avoid the application of potentially duplicative or conflicting rules on entities with cross-border operations. Recognition of regulatory frameworks across jurisdictions through substituted compliance or equivalence assessments will enable entities to comply with the set of rules applied by the jurisdictions in which they operate, and avoid market fragmentation.
Electronic lodgement of Prospectuses and OffersMAS has enhanced the offers and prospectuses electronic Repository and Access (opeRA) platform. Since January 2014, lodgements of prospectuses for offers of shares, debentures, and units in business trusts can be made electronically through opeRA. physical attendance at MAS is no longer required. electronic lodgement of applications for the authorisation or recognition of collective investment schemes (CIS) and their offer documents will be made available in the second half of 2014.
Enforcement Actions2013 was an eventful year for MAS’ enforcement efforts. We obtained a default judgment for S$100,000 against an individual for contravening the provision against false trading in part XII of the SFA in october 2013. We also commenced
robust, trusteD, anD PurPoseFul FinanCial Centre
32 Monetary Authority of Singapore

3 With the exception of marine mutual insurers, captives and Lloyds’ insurers.
two further court actions, seeking civil penalties of up to S$150,000 against two individuals for unauthorised trading and about S$2.5 million against another individual for insider trading.
Besides taking court action, MAS entered into settlement agreements with five separate individuals in 2013. these individuals admitted to contravening a range of provisions in part XII of the SFA and paid a civil penalty of S$50,000 to S$150,000 without court action. one of these individuals, a director of a listed company, also undertook not to be a company director for a period of one year.
Separately, in november 2013, MAS successfully obtained an injunction on a bank account belonging to the former Chief executive officer (Ceo) of a listed company in Singapore. the High Court allowed MAS’ application to freeze uS$3.7 million in the bank account, pending the outcome of on-going investigations into possible breaches of the SFA. this is MAS’ first application for a freezing order on a bank account, pursuant to its powers under the SFA.
Between April 2013 and March 2014, MAS also published a total of 43 formal regulatory and enforcement actions against companies and individuals for market conduct breaches. these actions included reprimands, composition fines, civil penalties and prohibition orders. over this period, MAS took other regulatory and administrative actions in another 159 cases.
INSurANCE
Enhanced Macroprudential Framework In 2011, MAS carried out a pilot study based on a group of larger insurers to establish a macroprudential surveillance framework for insurers. Since then, MAS has collected more granular data on all insurers’3 assets and liability exposures on a regular basis through MAS notice 122. this allowed MAS to extend the macroprudential surveillance framework to the entire insurance industry and conduct more comprehensive analysis of the insurance sector’s vulnerabilities, as well as the interconnectedness and linkages with the economy, financial markets and other financial intermediaries.
risk Based Capital FrameworkMAS is reviewing its Risk Based Capital Framework (RBC 2) for insurers to keep pace with evolving market practices and global regulatory developments. the review aims to improve the comprehensiveness of risk coverage and the risk sensitivity of the framework, as well as define more clearly MAS’ supervisory approach with respect to the solvency intervention levels. the review has taken into account the practices of major jurisdictions as well as the risk profile of the Singapore insurance sector.
MAS issued its second consultation paper in March 2014, following the first consultation that set out the broad direction of the RBC 2 review about two years ago. the latest consultation paper revisited several earlier proposals, taking into consideration responses received for the first consultation paper. the consultation paper also contained technical specifications of a first quantitative impact study (QIS 1) to be conducted by the insurers, in order for insurers to understand the full impact of the proposals. the key proposals include:
• Introduction of a matching adjustment to the discount rate for life insurers;
• Recalibration of the risk requirements to a consistent target criterion i.e. Value at Risk (VaR) measure of 99.5% confidence level over a one year period;
• Recognition of diversification benefits between the insurance and asset risk requirements, as well as between some of the underlying risk requirements within these two categories of risk requirements; and
• Alignment of insurers’ available capital components with those in MAS’ capital adequacy framework for banks, wherever appropriate.
MAS expects to finalise the main features of the RBC 2 framework by 2014 and formally implement the RBC 2 requirements from 1 January 2017, subject to further consultation with the industry. MAS will continue to engage the industry closely on the review, especially on the implementation timeline and the transitional provisions.
33Annual Report 2013/14

requirements on Key PersonsMAS amended the Insurance (Actuaries) Regulations (Actuaries Regulations) in April 2013 to expand the responsibilities of actuaries approved by MAS. Specifically, certain existing responsibilities of actuaries of direct life insurers were extended to actuaries of other types of insurers. these include the requirement to assist the insurer on matters such as investment policy and risk management, as well as to report to MAS and notify the insurer’s board of directors if the insurer has failed to take appropriate steps to rectify any matter that has a material adverse effect on the insurer’s financial condition. the amended Actuaries Regulations also provide for the actuaries to have free and unfettered access to the insurer’s board of directors.
At the same time, a new MAS notice 106 on Appointment of Directors, Chairman and Key executive persons was issued. the new notice clarifies that insurers should ensure that approved persons meet the board of directors’ approved fit and proper policy not only at the time of appointment but also on a continuing basis.
robust, trusteD, anD PurPoseFul FinanCial Centre
INTErNATIONAl SuPErvISOry COOPErATION
Promoting Consolidated Supervision and Cooperation with Foreign regulators MAS continues to participate in supervisory college meetings of international and regional banks as host supervisor. this allows MAS to cooperate more closely with the home supervisors of foreign banks and strengthen our understanding of developments in other parts of the group that may have an impact on the Singapore operations. MAS also hosted supervisory college meetings for the three Singapore banking groups, involving supervisors in the region where the banks have sizeable operations. these meetings provided a forum for MAS and host supervisors of these institutions to exchange views and assessments of the institutions’ cross-border activities.
Crisis Management Group Meetings MAS is a member of the Crisis Management Group (CMG) of six of the G-SIBs that have significant operations in Singapore and participates in their
BOx 1: international monetary Fund’s Financial sector assessment Programme
As one of 29 systemically-important financial centres in the world, Singapore underwent the International Monetary Fund’s (IMF) Financial Sector Assessment programme (FSAp) in 2013. the FSAp is an in-depth external assessment of the stability and resilience of a country’s financial sector.
the FSAp findings were published by the IMF in november 2013. they affirmed Singapore’s standing as a sound and stable financial centre. the assessment found that Singapore maintained a very high level of compliance with international standards
for the regulation and supervision of the banking, insurance and securities sectors, and financial market infrastructures. Stress tests conducted as part of the assessment indicated that banks and insurers were resilient to adverse macroeconomic scenarios. Crisis management and resolution arrangements were also generally strong, with the necessary framework in place for crisis information sharing and coordination.
MAS has been reviewing the IMF’s recommendations and will take appropriate measures where needed.
34 Monetary Authority of Singapore

CMG meetings. the meetings facilitate information exchanges between home and host supervisors and the establishment of institution-specific cross-border cooperation agreements to support recovery and resolution planning. this enhances preparedness and cross-border coordination for crisis management, including recovery and resolution planning, for these institutions.
Alternative Investment Fund Managers Directive MAS entered into an Mou with the authorities of 27 european union or european economic Area countries on 22 July 2013. this provides a formal basis for supervisory cooperation between MAS and the european authorities for the regulation and supervision of alternative investment funds (AIFs), managers of AIFs and depositaries of AIFs. the Mou paves the way for enhanced sharing of information and mutual assistance between MAS and the european authorities for more effective supervision of AIFs’ managers that operate on a cross-border basis.
A TruSTED FINANCIAl CENTrE
FINANCIAl BENChMArKS
Following the completion of MAS’ supervisory review in June 2013, the Association of Banks in Singapore and the Singapore Foreign exchange Markets Committee announced new measures to strengthen the governance and design of benchmark rates setting processes for key financial benchmarks in Singapore. Benchmarks which were not widely used were discontinued. SGD SoR and several FX benchmarks were transitioned from a poll-based methodology to a traded methodology that uses price data from actual market transactions, while the governance of SGD SIBoR submission processes was strengthened at each submitter bank and at the administrator in line with a set of industry guidelines on benchmark rate setting. In line with international regulatory developments on financial benchmarks, MAS proposed a new regulatory framework in June 2013 with two key thrusts:
• Introduction of criminal sanctions for the manipulation of any financial benchmarks under the SFA; and
• Regulation of the setting of key financial benchmarks set in Singapore.
MAS has consulted the public on its policy recommendations and plans to table the proposed legislative amendments to the SFA in parliament in the first half of 2015. If passed by parliament, MAS will have powers under the SFA to designate key benchmarks based on considerations such as systemic importance of the benchmark, and an assessment of its susceptibility to manipulation. Administrators and submitters of designated benchmarks will be regulated by MAS. In formulating the regulatory framework, MAS took reference from the work of the IoSCo principles for Financial Benchmarks published in July 2013, which MAS helped to develop. these principles were endorsed by the FSB as the roadmap for benchmarks reform. they seek to enhance the integrity and reliability of benchmarks by providing guidelines to benchmark administrators on areas such as governance, methodology and accountability. MAS also contributed to international reform efforts as a member of the IoSCo Review team that conducted an assessment of the degree of implementation of the IoSCo principles by the administrators of the most widely used global interest rate benchmarks (lIBoR, euRIBoR and tIBoR). In addition, MAS was a member of the FSB official Sector Steering Group (oSSG). Apart from providing oversight of the IoSCo review, the oSSG worked to encourage private sector participants to identify alternative benchmarks.
PrEvENTING MONEy lAuNDErING AND TErrOrISM FINANCING
As an international financial centre and transport hub, Singapore supports global efforts to combat money laundering (Ml), terrorism financing (tF) and proliferation financing. Singapore is a member of the Financial Action task Force (FAtF) and a founding member of the Asia pacific Group on Money laundering, and is committed to implementing a robust regulatory and supervisory regime in line with the revised FAtF Standards and international best practices.
35Annual Report 2013/14

robust, trusteD, anD PurPoseFul FinanCial Centre
on 10 January 2014, Ministry of Home Affairs, Ministry of Finance (MoF) and MAS published Singapore’s first national Risk Assessment (nRA) report on Ml/tF. the nRA report was the culmination of a government-wide exercise that lasted two years and covered 14 financial sub-sectors4 and eight non-financial sectors5 in Singapore. Most of these sectors were found to have a robust regime in place to combat Ml/tF. nonetheless, there are a number of areas where controls need to be strengthened. In the financial sector, MAS is focusing on strengthening the supervisory framework for remittance agents, money-changers and internet-based stored value facility holders. Virtual currencies have also been identified as an emerging risk in the financial sector for further study and, in March 2014, MAS announced that it will be putting in place a new regime to address Ml/tF risks in the area.
Financial institutions operating in Singapore are required to put in place the necessary controls to detect and deter the flow of illicit funds through Singapore’s financial system. Such controls include the need to identify and know their customers (including beneficial owners), to conduct regular account reviews, and to monitor and report any suspicious transactions. Singapore is also committed to implementing the various united nations Security Council Resolutions against countries such as Iran and north Korea. the MAS notices and Guidelines relating to the prevention of Ml/tF will be updated in the second half of 2014 following a consultation with the industry.
In 2013, MAS conducted 83 anti-money laundering and countering the financing of terrorism (AMl/CFt) inspections covering banks, insurance companies, money-changers, remittance agents, capital markets services licensees and licensed trust companies. Arising from the inspections, MAS noted several areas where there was room for improvement. Some institutions needed to put in place more robust AMl/CFt controls for their trade finance and correspondent banking businesses,
while others had to strengthen customer due diligence measures for higher risk clients, clear backlog of suspicious transaction alerts in a more timely manner, as well as enhance transaction monitoring reports in line with changing business and/or customer profiles. MAS had required the affected institutions to promptly address all deficiencies and take steps to strengthen their controls and risk management framework.
MAS continues to take a serious view of breaches of AMl/CFt regulations and failure by FIs to institute a robust AMl/CFt control framework. Sanctions are imposed on institutions for regulatory contraventions and deficiencies in AMl/CFt measures. these include formal warnings, reprimands, restrictions on operations, financial penalties and revocation of licences. In 2013, MAS issued a total of nine warnings and reprimands to financial institutions, restricted the operations of or imposed special conditions on six institutions, and revoked or did not renew the licences of two money-changers/remittance agents. In the past year, MAS has also imposed financial penalties on five institutions, ranging from approximately S$12,000 to S$450,000. ENhANCING ExChANGE OF INFOrMATION ON TAx
Singapore has significantly strengthened its channels for international cooperation to combat cross-border tax fraud and tax evasion. on 14 May 2013, MAS, MoF and Inland Revenue Authority of Singapore announced four measures to further enhance the exchange of Information (eoI) framework:
• extension of eoI assistance on tax in accordance with the international eoI-on-request Standard;
• Signing of the Multilateral Convention on Mutual Administrative Assistance in tax Matters;
• Removal of the court order requirement to obtain bank and trust information; and
4 The 14 financial sub-sectors are: (i) full banks and qualifying full banks, (ii) wholesale banks, offshore banks and merchant banks, (iii)
finance companies, (iv) money-changers, (v) remittance agents, (vi) direct life and composite insurers, (vii) other insurers, (viii) insurance
brokers, (ix) fund management companies (x) trust companies, (xi) broker-dealers, (xii) corporate finance advisory firms, (xiii) financial
advisory firms, and (xiv) stored value facility holders.
5 The eight non-financial sectors covered are: (i) casinos, (ii) pawnbrokers, (iii) moneylenders, (iv) corporate service providers, (v) real estate
sector, (vi) lawyers, (vii) public accountants and other professional accountants, and (viii) non-profit organisations.
36 Monetary Authority of Singapore

• negotiation of a Model 1 Foreign Account tax Compliance Act Intergovernmental Agreement with the uS.
these changes followed a comprehensive review of the eoI framework in 2009 and represent another major step taken to enhance international tax cooperation. the Global Forum on transparency and exchange of Information for tax purposes has affirmed that Singapore’s eoI regime is in line with the international eoI-on-request Standard. In addition, Singapore criminalised serious tax offences as an Ml predicate offence on 1 July 2013 and completed a critical review of high tax-risk accounts.
Singapore has been progressively and pre-emptively taking steps to enhance our regulatory regime to prepare financial institutions operating in Singapore for the more tax transparent global operating environment. the private banking industry in Singapore has also issued industry sound practices that set out clear guidelines to detect and deter movement of tax-illicit monies through Singapore.
A DyNAMIC AND PurPOSEFul FINANCIAl CENTrE
GrOWING Our COrE INDuSTry PIllArS
BankingSingapore continues to serve as the regional funding centre for trade flows within Asia as well as between Asia and the rest of the world. As at March 2014, total outstanding trade finance in Singapore grew by 17% to S$574.2 billion. Bank lending remained strong, bolstered by sustained growth in the region. total assets in the banking sector increased by 7% to S$973.1 billion as at March 2014.
Insurance Singapore’s insurance market continued to grow strongly, with non-life gross premiums rising 7.0% to reach S$11.2 billion and life insurance total assets increasing by 2.9% to reach S$142.5 billion in 2013. Further growth can be expected in tandem with increasing insurance demand in Asia.
the market has built up significant expertise in specialty insurance, namely marine, energy, catastrophe, credit and political risks. Most Asian risks, including entire large reinsurance programmes and specialty risks, can be fully placed in Singapore.
Asset Management Singapore’s asset management industry continued to grow in size and diversity. Assets under management (AuM) grew by 11.8% from S$1.63 trillion in 2012 to S$1.82 trillion in 2013, contributed by growth in various sub-sectors including traditional and alternative managers, insurers and wealth managers. the Asia-pacific region continues to be a key investment destination for global investors with longer term investment horizons, both within and outside Asia. Allocation to the Asia-pacific region accounted for 67% of total AuM in 2013.
Foreign Exchange and listed Derivatives Markets the Bank for International Settlements (BIS) 2013 triennial Foreign exchange (FX) survey ranked Singapore as the third largest FX centre globally after london and new York, and the largest FX centre in Asia. Average daily FX turnover volume in Singapore grew by 44% to uS$383 billion in April 2013, compared to uS$266 billion in April 2010.
Singapore also continued to grow strongly as a trading hub for listed financial and commodity derivatives. total futures and options volume on SGX increased 32% year-on-year to hit a new high of 100.6 million contracts in 2013. products such as the nikkei 225 futures and options contracts, as well as the China A50 and MSCI Indonesia futures contracts also registered new highs in average daily traded volume. In addition, SGX launched a suite of Asian FX futures in 2013 to promote greater transparency and to serve the investment and risk management needs in the Asian time zone. Six currency pairs were initially launched in november 2013. SGX has since announced plans to expand this current suite to include five currency pairs in 2014. In the commodities space, SGX launched iron ore futures contracts on the back of its successful suite of iron ore swap contracts.
37Annual Report 2013/14

SGX also signed an Mou with the Shanghai Futures exchange to jointly explore areas of cooperation in the development of derivatives for energy, metals, chemicals and commodity indexes. the Mou would enable customers of SGX to access greater opportunities in Asia and further boost SGX’s long-term commitment to China. the year also saw
robust, trusteD, anD PurPoseFul FinanCial Centre
more global exchanges building up their Asian footprints through acquisitions in Singapore, with the Intercontinental exchange Group acquiring the Singapore Mercantile exchange and Deutsche Börse acquiring a majority stake in Cleartrade exchange.
Singapore’s vision is to become a global insurance marketplace by 2020, with the ability to accept regional and global risks. to achieve this, MAS has embarked on initiatives in four key areas:
Increasing supply-side capacitythis aims to build up specialty and reinsurance underwriting and broking capabilities in Singapore. Aside from existing business lines, MAS is also keen to promote new business lines, such as cyber risks. MAS is working with the industry to create a test-bed for cyber risks where insurers and potential clients can come together to simulate loss events.
Promoting insurance demandthis aims to catalyse the development of insurance demand in the region by:
• Facilitating greater cross-border access to regional markets, under the ASeAn financial services liberalisation process.
• Increasing the availability of Asian risk data to support robust pricing and risk modelling through the work of research institutions such as the Institute of Catastrophe Risk Management and the Insurance Risk and Finance Research Centre. MAS also established a natural Catastrophe Working Group in october 2013 to develop Singapore’s catastrophe insurance capabilities.
• Increasing risk awareness in the region. Asia’s first association for risk managers, the pan-Asian Risk and Insurance Management Association (pARIMA), was set up in Singapore in April 2013. pARIMA will serve as an important platform for dialogue between risk managers and the insurance industry.
Developing a vibrant insurance marketplacethis aims to foster the development of a deep and vibrant insurance marketplace by:
• Developing an effective broker network.
• Encouraging a true subscription market, where insurers not only share risks, but also expertise, in order to underwrite larger and more complex risks.
• Creating more platforms to bring buyers and sellers together to share market knowledge and negotiate renewals.
Fostering a conducive business environmentthis aims to enhance the supply of industry talent. the Insurance talent Development Framework, which maps out training and career progression pathways for insurance professionals, was introduced in 2013. In line with this, the Singapore College of Insurance will be launching a spectrum of new training and development programmes to better meet the needs of industry players.
BOx 2: singapore as a Global insurance marketplace
38 Monetary Authority of Singapore

Corporate Debt MarketSingapore’s corporate debt market, comprising SGD and non-SGD debt, registered an 18% year-on-year growth in 2013 to S$272 billion. SGD-denominated corporate debt outstanding rose by 9% to S$119 billion while non-SGD debt outstanding increased by 26% to S$153 billion. Foreign issuers accounted for 15% of SGD bond issuances.
During the year, several significant developments have contributed to the corporate debt market’s growth. the commencement of RMB clearing arrangements by the Industrial and Commercial Bank of China (ICBC) Singapore branch in May 2013 helped spur the issuance of RMB 7.5 billion of lion City Bonds up to March 2014. these saw strong demand among investors in Singapore and the region.
NEW GrOWTh ArEAS
Infrastructure FinanceSingapore is well-placed to develop further as a regional infrastructure financing hub to support Asia’s huge infrastructure needs. MAS has continued to work with other government agencies, industry partners and multilateral development banks such as the World Bank and Asian Development Bank (ADB) to develop new initiatives across the infrastructure development and financing value chain. For example, the Asia Infrastructure Centre of excellence (AICoe), a joint initiative of Singapore and the ADB, commenced operations in April 2014. the AICoe works with governments to identify their infrastructure needs and create a larger pipeline of bankable projects in the region.
Developing a rMB EcosystemSingapore’s RMB market has grown strongly following the commencement of RMB clearing services by ICBC Singapore branch in May 2013. the use of RMB has gained traction among companies in Singapore and the region. From March 2013 to March 2014, total RMB deposits rose 91% to RMB 220 billion, RMB trade financing grew by 60% to RMB 397 billion and the average daily traded volume for RMB FX in Singapore grew by 415% to uS$67 billion.
In october 2013, new RMB initiatives were announced at the Joint Council for Bilateral
Cooperation meeting to further promote the international use of RMB through Singapore. these measures included a RMB Qualified Foreign Institutional Investor quota of RMB 50 billion, considering Singapore as an investment destination under the RMB Qualified Domestic Institutional Investor scheme, establishing cross-border RMB channels for registered entities in the Suzhou/tianjin industrial parks and launching SGD-CnY direct trading.
In February 2014, Singapore and the united Kingdom (uK) announced plans to establish a private-sector led forum on RMB to promote efficient cross-border RMB flows. MAS will continue to work with the industry and our partners to facilitate the growth of RMB activities and the broader ecosystem in Singapore. ENhANCING WOrKFOrCE COMPETENCIES
In 2013, MAS partnered with the Institute of Banking and Finance (IBF) to update competency roadmaps for finance professionals under the IBF Standards (previously known as Financial Industry Competency Standards). programmes accredited under the IBF Standards now include functional training at both foundational and advanced levels. new foundation level programmes have been developed in technology, compliance, corporate banking, wealth management and insurance. MAS also worked with IBF to implement the new Continuous professional Development (CpD) framework for private banking professionals. Almost all of private banking professionals undertook more than 12 hours of CpD in 2013, with more than half going beyond the minimum requirement.
MAS has worked with key financial institutions to develop promising young Singaporean talents for future positions of leadership in the financial services sector through structured programs that provide opportunities to rotate in various business lines. they are also given regional and international exposure through overseas secondments. MAS will also continue to work with financial institutions to develop specialist leaders through scholarships. looking ahead, a new Asian Financial leaders programme will be launched to equip local practitioners with Asia-relevant leadership capabilities and prepare them for regional or global leadership positions.
39Annual Report 2013/14

BOx 3: milestones in Developing the rmb market in singapore
February 2013 people’s Bank of China (pBC) appointed the Industrial and Commercial Bank of China (ICBC) Singapore branch as the RMB Clearing Bank in Singapore.
March 2013 MAS and pBC expanded the bilateral currency swap arrangement, doubling the size of the swap to RMB 300 billion. the scope of the swap was also expanded to allow provision of liquidity support by MAS.
April 2013 MAS and pBC signed an Mou on RMB business cooperation. Both central banks committed to work closely in developing the RMB market in Singapore under the Mou. In addition, pBC and ICBC simultaneously announced the signing of their RMB clearing agreement.
May 2013 ICBC Singapore branch commenced its RMB clearing operations in Singapore. Four banks issued a total of RMB 2.5 billion of RMB bonds which were cleared and settled in Singapore (lion City bonds).
October 2013 Singapore and China agreed at the 10th Joint Council for Bilateral Co-operation on new initiatives to further promote the international use of RMB through Singapore. these initiatives included an RMB Qualified Foreign Institutional Investor quota of RMB 50 billion, considering Singapore as an investment destination under the RMB Qualified Domestic Institutional Investor scheme, establishing cross-border RMB channels for registered entities in the Suzhou/tianjin industrial parks and launching SGD-CnY direct trading.
November 2013 ICBC Singapore branch issued RMB 2 billion of lion City bonds.
February 2014 Bank of China Singapore branch issued RMB 3 billion of lion City bonds. In addition, Singapore and the uK announced plans to establish a private-sector led forum on RMB to promote efficient cross-border RMB flows.
robust, trusteD, anD PurPoseFul FinanCial Centre
40 Monetary Authority of Singapore

rMB Deposits, rMB bn
250
200
150
100
50
0
138
Jun-13 Sep-13 Dec-13 Mar-14
154
195
220
41Annual Report 2013/14
Total rMB Fx Average Daily Traded volume, uS$ bn
80
Jun-13
18 20
32
67
Sep-13 Dec-13 Mar-14
70
60
50
40
3020100
rMB loans & Trade Financing, rMB bn
450
400
350
300
250
200
150
100
50 17
252
19
278
23
366
33
397
0Jun-13 Sep-13 Dec-13 Mar-14
loans
Bills


SeRVING the PUBLIC,eNGAGING STAKehOLDeRS

servinG the PubliC,enGAGInG StAKeHolDeRS
ENGAGING ThE PuBlIC
MANAGING DOllArS AND CENTS
As at 31 March 2014, the gross currency in circulation was S$33.9 billion (Chart 4). the gross currency in circulation increased 7.3% over the year, with S$53.4 billion worth of notes and coins issued to banks and S$51.1 billion returned for the financial year.
on 25 June 2013, MAS issued the third Series coins into circulation. the new coins mark Singapore’s progress as a nation and their designs feature national icons and landmarks.the third Series coins were presented the finalist award for the 2013 Best new Circulation Coin or Series in the Currency Awards by the International Association of Currency Affairs.
the Go Green “good-as-new” S$2 notes initiative this lunar new Year was better received than last year. of the S$2 notes issued for the lunar new Year, 14% comprised “good-as-new” notes, an increase of 3% from 2013. the number of brand new S$2 notes issued remained the same as last year as the increase in demand for S$2 notes was met entirely by “good-as-new” notes. the encouraging take-up of “good-as-new” notes this year reflects the growing public support for this Go Green initiative.
MAS launched a series of puzzle coin sets featuring designs of past Chinese Almanac series in november 2013. Minted in 999 fine silver, each set comprises a centre coin surrounded by 12 coins using a three-way interlocking concept, a first for MAS numismatic coins. For the first set issued on 1 January 2014, each of the 12
Gross Circulation (s$billion) 2010 2011 2012 2013 2014notes 22.65 24.74 27.58 30.27 32.52
Coins 1.15 1.20 1.25 1.29 1.34
total 23.80 25.94 28.83 31.56 33.86
Chart 5. Gross Currency in Circulation
2010
0
5
10
15
S$B
illio
n
20
25
30
35
40
2011 2012 2013 2014
44 Monetary Authority of Singapore

surrounding coins depicts an animal from the first Chinese Almanac series issued from 1981 to 1992, while the centre coin features a peony flower. the coin set has a limited mintage of 3,000 sets.
MONEySENSE
2013 marked 10 years of MoneySenSe providing financial education to Singaporeans to help them build financial capabilities and make informed financial decisions. Since its launch in 2003, MoneySenSe has reached out to many Singaporeans through a multitude of channels including schools, tertiary institutions, workplace talks, community events, public seminars as well as the mass and social media.
MoneySENSE for the youngMoneySenSe supported the Ministry of education (Moe)’s move to incorporate financial literacy in the Food and Consumer education (FCe) syllabus for all lower secondary students. MoneySenSe worked closely with the Moe and national Institute of education to equip teachers with the pedagogical skills and knowledge needed to deliver the FCe syllabus. Helping students form the right values and attitudes towards saving and spending when young will better prepare them for future financial challenges.
MoneySenSe also lent its support to the national Cashflow Competition (nCF) 2014 organised by the nanyang technological university Investment Interactive Club. the nCF 2014 seeks to promote understanding of basic financial concepts to secondary and tertiary students, as well as undergraduates and members of the public, through the use of board games and social media. prior to the competition, training sessions were held at regional libraries to equip participants with basic financial knowledge. through these platforms, nCF 2014 achieved a total outreach of 50,400 and was an interactive and engaging way of imparting financial knowledge to the young. this initiative complements other existing MoneySenSe programmes for the young including skits and financial literacy workshops for primary and secondary students as well as competitions for tertiary students such as the nuS-national economics and Financial Management Quiz.
Equipping Social Workers in Financial literacythe MoneySenSe-Singapore polytechnic Institute for Financial literacy (IFl) embarked on its first train-the-trainer workshop for social workers in September 2013. the workshop was designed to equip social workers with the knowledge and skills to help Singaporeans apply useful tools on basic money management in their daily lives. the feedback from the pilot session enabled the IFl to fine-tune the programme such as incorporating more case studies so that social workers can apply what they have learnt to real-life situations.
Singapore’s first puzzle coin set in the Almanac coin series
45Annual Report 2013/14

servinG the PubliC, enGaGinG staKeholDers
BOx 4: moneysense 10th anniversary
In conjunction with its 10th anniversary, MoneySenSe organised a slew of initiatives in 2013, including:
• A carnival-style roadshow held at the toa payoh HDB Hub on 19 and 20 october 2013 to impart financial literacy concepts through simple financial education messages and family-friendly interactive games. Industry associations and other public sector agencies also participated in the event. the roadshow, with a mix of educational activities and family entertainment, was well received by the public. to reach out to more Singaporeans, a scaled-down version of the roadshow was brought to selected libraries in november and December 2013. In total, the roadshows attracted over 20,000 participants. plans are underway to further extend MoneySenSe’s outreach to the community by bringing the roadshow to various community clubs in 2014.
• the launch of a MoneySenSe video to encourage Singaporeans to take charge and plan ahead for their finances, so as to secure a better future for themselves and their loved ones.
• the launch of the “My Money Book”, featuring nuggets of wisdom from prominent public and private sector leaders as well as ordinary Singaporeans on ways to better manage their finances. the booklet was designed in the form of a savings passbook to convey the virtues of saving and managing money wisely.
• two online campaigns on Facebook to raise awareness of the MoneySenSe website and Facebook page as an independent and trusted source of information on financial matters. one campaign encouraged Singaporeans to share their favourite money management tip, from which selected tips were featured in the “My Money Book”. the other campaign comprised a financial literacy quiz, where the answers could be found in the MoneySenSe website. Besides raising public awareness of MoneySenSe, the campaigns also helped to draw in more MoneySenSe Facebook subscribers, especially those in the younger age group.
46 Monetary Authority of Singapore

As a next step, the IFl will be conducting full-day workshops for the Social Service office Division officers from the Ministry of Social and Family Development to equip them with the necessary skills and knowledge to better help Singaporeans seeking their assistance.
PrOTECTING CONSuMErS
FINANCIAl ADvISOry INDuSTry rEvIEW
In March 2012, MAS launched the Financial Advisory Industry Review (FAIR) with the aim of raising standards of practice in the financial advisory (FA) industry and improving efficiency in the distribution of life insurance and investment products in Singapore.
the FAIR panel concluded its review in late 2012 and released a report in January 2013 with 28 recommendations. Following a public consultation, MAS fully accepted 19 of the recommendations, modified eight and dropped one recommendation proposed by the FAIR panel.
the key initiatives under FAIR include:
• Implementation of a balanced scorecard remuneration framework for FA representatives and their supervisors that rewards the provision of good quality advice;
• Development of an online web aggregator to allow consumers to more easily compare pricing and other features of life insurance products offered by different insurers on a single platform; and
• Allowing consumers to purchase life insurance products directly from insurers without distribution cost and advice.
MAS is currently working closely with the FA industry to implement the FAIR initiatives over the next six to 12 months.
ENhANCING PrOSPECTuS DISClOSurE rulES FOr OFFErS OF SECurITIES
In october 2013, MAS issued a policy consultation paper proposing measures to improve the readability of prospectuses and facilitate better
understanding by retail investors of key information presented in prospectuses. the proposals include:
• extending the requirement for a product highlights sheet (pHS) to offers of equity, debt and hybrid securities; and
• Allowing certain information located outside a prospectus to be incorporated into the prospectus by making reference to the information.
MAS is currently fine-tuning the proposals in view of the feedback received and will be issuing the consultation responses within the next few months. We will also be consulting the public on the relevant legislative amendments for the proposals, as well as on a regulatory guide to promote good drafting practices for prospectuses.
WOrKING WITh INDuSTry
INDuSTry INITIATIvE ON CONTrACT CErTAINTy
Since 2011, MAS has supported the industry initiative to foster reinsurance contract certainty. A Contract Certainty Working Group (CCWG), comprising members from the Reinsurance Brokers Association of Singapore, lloyd’s Asia, Singapore Reinsurers’ Association, General Insurance Association of Singapore and life Insurance Association Singapore, was formed to develop a set of guidelines on the best practices to achieve reinsurance contract certainty. the CCWG finalised its set of best practices in February 2013 and has shared it with all direct insurers, reinsurers and brokers.
In April 2013, MAS amended the “MAS Guidelines on Risk Management practices for Insurance Business – Core Activities” to encourage all insurers to adopt the industry’s definition, guidance, and best market practices and standards in the area of contract certainty. In an effort to monitor the industry’s progress in achieving contract certainty, the CCWG has also developed an online portal (www.contractcertainty.sg) where the industry (direct insurers, reinsurers and brokers) are encouraged to submit compliance reports on a monthly basis. this would allow the CCWG to
47Annual Report 2013/14

servinG the PubliC, enGaGinG staKeholDers
closely analyse the level of contract certainty and identify areas for further improvement.
In May and June 2013, the CCWG held multiple workshops for the industry to clarify questions on its proposals and to demonstrate the online portal. the CCWG commenced the collection of monthly reports in July 2013.
MASNET-ACCESS
MASnet is the communication hub set up to provide efficient and secured data exchange services between MAS and the financial institutions in Singapore. today, MASnet has close to 1,000 participating organisations comprising financial institutions, SGX and government agencies using its services. MASnet services include submission of electronic regulatory returns to MAS, exchange of electronic payment instruction and requests from banks for deposit and withdrawal of notes and coins.
In our continuous effort to improve MASnet to support industry needs, MAS launched a new data exchange platform, MASnet-Access, in 2014. MASnet-Access streamlines the data exchange operations between financial institutions and reduces the turnaround time of setting up and exchanging information amongst the participants at a lower cost. PArTNErShIP WITh ACADEMIA
Since 2009, MAS has sponsored a term professorship in economics and Finance at the national university of Singapore (nuS). the professorship programme seeks to enhance Singapore’s financial and economic research infrastructure and contribute to a vibrant research community and culture at local universities. In 2013, professors Benjamin Friedman (Harvard university), Darrell Duffie (Graduate School of Business, Stanford university) and Douglas Diamond (Booth School of Business, university of Chicago) were appointed term professors. they interacted with faculty and students at the nuS and shared their insights on global economic and
regulatory developments with senior management at MAS. In addition, they delivered public lectures on issues of relevance to public policy.
over the programme’s five-year span, the term professorship in economics and Finance has successfully facilitated the exchange of research ideas and interests in applied economics and finance in Singapore. In March 2014, MAS reaffirmed its commitment to sponsor the professorship in economics and Finance at the nuS for another five years, commencing 1 April 2014.
During the year, MAS also hosted other academics and former senior policymakers under its eminent Visitor programme. In addition to meeting with MAS’ senior management, eminent Visitors usually conduct in-house seminars, lectures and discussion sessions with MAS staff. In August 2013, MAS welcomed Mr Masaaki Shirakawa, 30th Governor of the Bank of Japan, who shared his insights and experience on central banking. In addition, MAS hosted professor Andrew Rose (university of California, Berkeley) in June and professor philip lane (trinity College Dublin) in november. their lectures were beneficial in updating economists from MAS and the rest of the government, as well as others from the financial industry and academia, on the latest developments in research on international economics and finance. Separately, MAS also consulted with local academics, such as professor Ilian Mihov (InSeAD) and Associate professor Martin Bodenstein (nuS). professor Mihov completed a study formalising Singapore’s exchange rate-centred monetary policy framework in the new Keynesian framework, while Associate professor Bodenstein worked with MAS to estimate a new Keynesian philips Curve for Singapore. MAS invited some of the term professors and eminent Visitors to contribute articles to MAS’ Macroeconomic Review. MAS also began the process of inviting local academics to contribute an article in each issue of the Review, on an applied topic of relevance to policymakers in Singapore.
48 Monetary Authority of Singapore


VALUeD PARTNeR on the INTeRNATIONAL FRONT

valueD Partner on tHe InteRnAtIonAl FRont
INTErNATIONAl FOruMS
PrOMOTING GlOBAl GrOWTh AND STABIlITy
At the request of the IMF’s International Monetary and Financial Committee (IMFC), Deputy prime Minister (DpM) and MAS Chairman tharman Shanmugaratnam extended his chairmanship by one year to March 2015. Members of the IMFC viewed the continuity of DpM tharman’s strong leadership in the year ahead as particularly helpful in ensuring that all members’ views on key issues are taken into account, including with respect to significant ongoing IMF reforms.
under DpM tharman’s chairmanship, the IMFC facilitated policy discussions among IMF members for strong, sustainable and balanced growth, along with managing multiple transitions in the global economy. the IMFC supported actions to promote sustained and inclusive growth, in particular for low-income countries; progress in the implementation of a strengthened IMF surveillance framework; and further work to improve IMF lending capabilities, including through a review of key IMF financing instruments and lending policies.
In April 2014, the IMFC also discussed how to strike a balance between short-term austerity and medium-term fiscal sustainability in major economies; ways to manage the effects of unconventional monetary policies and preparations for the normalising of monetary conditions; and reforms to reduce unemployment and boost productivity.
the IMFC Chair and G20 presidency worked together to advance the work of IMF quota and governance reforms, including through a joint Ministerial meeting at the IMF/World Bank Spring Meetings in April 2014. the IMFC reaffirmed its commitment to implement the IMF’s 2010 reforms on quota and governance as the highest priority, while calling on members to ratify the reforms at
the earliest opportunity, and called on the IMF to develop options to further progress governance discussions by year-end.
MAS and MoF hosted the G20 Investment and Infrastructure Working Group Meeting in June 2014, alongside the G20/oeCD task Force and High level Roundtable on Institutional Investors and long term Financing. the events aimed to review commitments to improve domestic investment environments and put together a package of collective actions for delivery by the Brisbane Summit.
INTErNATIONAl FINANCIAl rEGulATOry rEFOrMS
Mr Ravi Menon, MAS Managing Director, chairs the FSB Standing Committee on Standards Implementation (SCSI), which monitors the progress of implementing G20/FSB financial reforms in coordination with relevant standard setters. In 2014, the SCSI completed a thematic review on reducing mechanistic reliance on credit ratings, and launched another thematic review on supervision of systemically important banks. In 2013 and 2014, it also completed country peer reviews of the uS, uK, Germany and Indonesia, and commenced reviews of the netherlands, China and Russia. In the coming year, the SCSI will also continue to enhance its implementation monitoring and reporting mechanisms in line with its mandate.
Mr ong Chong tee, MAS’ Deputy Managing Director (Financial Supervision) led the assessment of Canada’s regulations implementing the Basel capital framework under the BCBS’ Regulatory Consistency Assessment programme (RCAp) from 4Q 2013 to 2Q 2014. the RCAp aims to improve public confidence in regulatory ratios and promote a level regulatory playing field for internationally active banks through timely and consistent implementation of the Basel III standards by BCBS member jurisdictions. the BCBS has published the assessment report on Canada in June 2014. Ms
52 Monetary Authority of Singapore

Jacqueline loh, MAS’ Deputy Managing Director (Monetary policy & Investment / Development & International) co-chairs the BCBS’ Macroprudential Supervision Group (MpG). the MpG monitors and reports to the BCBS on systemic risk and global developments that relate to macroprudential and systemically important bank (SIB) supervision. the MpG is also responsible for designing the G-SIB assessment methodology and developing broad policy guidance on the overall framework of macroprudential/SIB supervision.
MAS is a member of the Board of IoSCo and the Asia pacific Regional Committee. MAS participates actively in various IoSCo policy Committees and task Forces, which work on the development and implementation of international standards on a range of regulatory issues in areas relating to market infrastructure, intermediaries, investment management and commodity markets.
MAS continues to contribute to the development of global insurance regulatory standards through active participation as member of several main committees and working groups of the International Association of Insurance Supervisors (IAIS). MAS provided input to the development of the Common Framework for the Supervision of Internationally Active Insurance Groups (ComFrame), which is a set of international supervisory requirements focusing on effective group-wide supervision of internationally active insurance groups (IAIGs). In addition, MAS continues to contribute to the development of the Insurance Capital Standard (ICS), which is a group-wide risk based global insurance capital standard designed to achieve greater comparability of the capital requirements applying to IAIGs across jurisdictions.
rEGIONAl FOruMS
ASIA rEGION FuNDS PASSPOrT
In September 2013, Singapore, Australia, Korea and new Zealand signed a Statement of Intent to jointly develop the Asia Region Funds passport (ARFp) to facilitate cross-border offers of funds in the ApeC region. In April 2014, the signatories, together with philippines and thailand, issued a joint consultation paper on the proposed rules and arrangements that will govern the operation of the ARFp.
Following the consultation, the economies that decide to participate in the ARFp will together work towards the launch of the ARFp in 2016.
ASEAN COOPErATION
MAS chairs the ASeAn Working Committee on Capital Market Development (WCCMD). the WCCMD monitors initiatives and progress towards building capacity and laying infrastructure for the development of ASeAn capital markets, with a long-term goal of achieving a more integrated ASeAn capital market.
MAS and the Bank of thailand co-chair the ASeAn Senior level Committee (SlC). the SlC oversees the key workstreams for ASeAn financial integration and provides guidance to the respective ASeAn Working Committees on central banking issues. MAS also participates actively in the ASeAn Working Committees, focussing on capital account liberalisation, financial services liberalisation and payment and settlement systems.
MAS chairs the ASeAn Capital Markets Forum (ACMF) and actively contributes to ACMF’s initiatives to harmonise various aspects of securities laws among ASeAn countries. these are aimed at achieving greater integration of the region’s capital markets under the ASeAn economic Community Blueprint 2015.
In october 2013, MAS signed an Mou with the securities regulators of Malaysia and thailand to establish the ASeAn Collective Investment Schemes Framework (ASeAn CIS Framework) for cross-border offering of CIS to retail investors. under the ASeAn CIS Framework, fund managers from participating countries will be able to offer their retail funds directly to investors in the other countries under a streamlined process.
In support of their agreement to put in place regulations in their respective jurisdictions to exempt or fast-track offerings of CIS to non-retail investors, MAS also signed an Mou with the securities regulators of Malaysia and thailand in october 2013 to provide a framework for mutual assistance and exchange of information.
MAS is an active member of the annual ASeAn Insurance Regulators Meeting (AIRM). AIRM
53Annual Report 2013/14

valueD Partner on the international Front
aims to promote closer cooperation and sharing of experience on insurance matters among the ASeAn regulators. the meetings are held on an annual basis and are hosted on a rotational basis among the ASeAn countries. the recent 16th AIRM held in Vietnam discussed the different supervisory approaches of the ASeAn regulators, disaster risk financing and insurance initiatives, as well as the liberalisation of the insurance market in line with the ASeAn Framework Agreement on Services enhancement and Regional Comprehensive economic partnership Initiatives.
ASEAN+3
ASeAn+3 members and the ASeAn+3 Macroeconomic Research office (AMRo) made significant progress in developing the operational readiness of the Chiang Mai Initiative Multilateralisation (CMIM) Agreement, a regional financial safety net.
the AMRo, as the independent macroeconomic surveillance unit of the CMIM Agreement, also developed the first full set of indicators of the “economic Review and policy Dialogue (eRpD) Matrix”, which consists of various economic and
BOx 5: Opening of a Representative Office in Beijing
MAS officially opened its Beijing Representative office in May 2013. the office was established to further strengthen bilateral collaboration between MAS and Chinese financial authorities, including people’s Bank of China (pBC), China Banking Regulatory Commission (CBRC), China Securities Regulatory Commission (CSRC) and China Insurance Regulatory Commission (CIRC). this is MAS’ first overseas representative
office in Asia and testifies to the strong financial and economic linkages between Singapore and China. Mr Zhou Xiaochuan, Governor of the pBC, was the Guest-of-Honour for the opening Ceremony, which was attended by more than 100 guests including the Vice Chairmen of CBRC, CSRC and CIRC, heads of financial institutions and other senior representatives of MAS’ key partners in China.
Mr Tharman Shanmugaratnam, Deputy Prime Minister and Chairman of MAS (fourth from right), Mr Zhou Xiaochuan, Governor of the People’s Bank of China (fifth from right), MD MAS (second from right) and other distinguished guests at the opening ceremony of MAS’ Beijing Representative Office
54 Monetary Authority of Singapore

financial indicators of all ASeAn+3 members. the eRpD Matrix is intended to be used in the assessment of ASeAn+3 members’ qualification for the CMIM’s crisis prevention facility.
AMRo is hosted by Singapore in the MAS Building, and MAS and the Ministry of Finance jointly provide host country support for AMRo. ExECuTIvE MEETING OF EAST ASIA-PACIFIC CENTrAl BANKS
MAS continued to play an active role at the executive Meeting of east Asia-pacific Central Banks (eMeAp). In our capacity as deputy chair of the Monetary and Financial Stability Committee, MAS facilitated exchange of views among members, key international financial institutions and private-sector entities on changes in the global environment, as well as policy responses that could help enhance financial stability and economic resilience. MAS also hosted the Financial Stability Institute of the BIS-eMeAp Regional Seminar on Resolution Frameworks and Crisis Management, and contributed to the various eMeAp Working Groups on Banking Supervision, Financial Markets, and payment and Settlement Systems.
BIlATErAl COOPErATION
MAS maintains regular policy dialogues and exchanges with fellow central banks and financial regulators. Singapore and uK agreed on the establishment of a formal Financial Dialogue in February 2014, as part of uK Chancellor of the exchequer, George osborne’s trip to Singapore. the dialogue will provide a platform for a regular and structured exchange of views on domestic and international financial issues. led by MAS and HM treasury, the dialogue will deepen financial and economic cooperation between two of the world’s leading international financial centres. there was also agreement to establish a private sector-led forum focused on increasing cooperation between the Singapore and uK markets to boost the development of the offshore RMB market.
In the past year, MAS also held high-level bilateral exchanges such as with the China Banking Regulatory Commission and the Bank of thailand. Issues discussed included macroeconomic policy, international supervisory developments and global
financial market developments. the bilateral meetings further enhanced the strong cooperative relationship between MAS and our counterparts and provided a regular platform for us to discuss issues of mutual interest.
In conjunction with the State Visit of the Sultan of Brunei, MAS and the Autoriti Monetari Brunei Darussalam (AMBD) signed an Mou on 22 April 2014 with the aim of strengthening bilateral financial ties, building on existing arrangements such as the Currency Interchangeability Agreement (CIA) and regular bilateral dialogues. the Mou provides for enhanced cooperation in capital market development and capacity building, as well as the exchange of views and practices in monetary management and operations, payment and settlement, banking supervision, human resources and information technology.
TrAINING AND TEChNICAl ASSISTANCE
MAS contributes to capacity building of central banks and regulatory authorities in the region through training and technical assistance programmes.
Regional training programmes offered by MAS included the MAS Banking Supervisors training programme, the MAS-toronto Centre Regional leadership programme for Securities Regulators and the MAS Information technology Workshop for Financial Regulators.
MAS hosted two SeACen seminars in Singapore in 2013, and contributed speakers to a number of SeACen’s learning programmes conducted in member countries.
Mr Ravi Menon, Managing Director of MAS, and Dato Mohd Rosli Sabtu, Managing Director of AMBD, at the signing of the MOU on bilateral cooperation
55Annual Report 2013/14

valueD Partner on the international Front
BOx 6: mas’ technical assistance Programmes
A new technical Assistance programme was implemented in August 2013 to provide customised capacity building for more than 180 participants from the central banks of Cambodia, lao pDR, Myanmar and Vietnam (ClMV), with funding from the temasek Foundation. the two-year initiative includes high level policy dialogues for senior officials of the ClMV central banks; a regional banking supervision training programme for mid-level officials; and in-country training programmes conducted by MAS.
As part of the on-going technical assistance between Singapore and Myanmar under the Singapore-Myanmar technical Cooperation programme Mou, MAS and the Central Bank of Myanmar (CBM) jointly organised the High-level Seminar on Financial Sector liberalisation in nay pyi taw, Myanmar in January 2014. Myanmar Finance Minister u Win Shein, CBM Governor u Kyaw Kyaw Maung, and MAS Managing Director Ravi
Menon delivered addresses at the Seminar. there were other speakers from both the public and private sectors, including international organisations such as the IMF and World Bank. Senior level delegates from the CBM and the Myanmar Ministry of Finance participated in the Seminar.
Mr Ravi Menon, Managing Director of MAS and U Win Shein, Myanmar Finance Minister, at the High-Level Seminar on Financial Sector Liberalisation in Myanmar
56 Monetary Authority of Singapore


ONe MAS: INTeGRATeDand COheSIVe

one mas:InteGRAteD AnD CoHeSIVe
rISK MANAGEMENT AND BuSINESS CONTINuITy
During the year, the Risk Management Department (RiMD) continued to work with MAS departments on their self-assessments, a structured process where departments identify, assess and prioritise their risks, and review the adequacy of controls that are in place. RiMD continued efforts to promote and enhance the risk awareness of staff and foster a vigilant risk culture in MAS.
to strengthen MAS’ business continuity preparedness, MAS worked closely with relevant government agencies to review its pandemic flu plan to take into account changes to the national pandemic planning assumptions. MAS also enhanced its haze management plan to cater to more severe haze conditions should these arise.
CONTrOlS AND OPErATIONS
AuDIT ASSurANCE
the Internal Audit Department (IAD) completed an extensive program of risk-focused audits to ascertain the adequacy and effectiveness of controls and procedures across MAS’ operations. It also worked with departments to identify the inherent risks and provided inputs on the key controls to be incorporated at the outset of new operations and systems. For audit efficiency and effectiveness, IAD continued to enhance its data analytic capabilities to achieve a wider audit coverage.
PrOCurEMENT MANAGEMENT
MAS emphasises a transparent, open and fair procurement process. We reviewed our
procurement practices and put in place new controls to strengthen our procedures. We also introduced initiatives to raise awareness of procurement best practices in MAS.
BuIlDING SErvICES AND SAFETy
MAS is in the process of compacting offices to optimise space usage and to enhance work synergy between functional work units. As part of Whole-of-Government environmental sustainability efforts, the building infrastructures and services will be upgraded by 2016 to meet new building requirements and energy standards.
MAS received the national Safety & Security Watch Group Award for the third year running. this year, MAS was among the top 20 organisations nationwide to receive the outstanding Individual Award for efforts in developing robust security measures and preparedness against the threat of terrorism as well as for contributions to information sharing and collaboration efforts with others.
the security systems capability and operations were enhanced with the replacement of the Card Access Control System and Security turnstiles, and implementing a fully automated Visitor Registration & Management System, which was operational in June 2014.
ENhANCING MOBIlITy AND PrODuCTIvITy
In support of our initiative to facilitate telecommuting, enhance workplace mobility and improve productivity, MAS provided staff with mobile devices to access office email and information resources securely. Secure document reader and secure voice/video telephony capabilities are introduced to provide secured communications for staff on the move.
60 Monetary Authority of Singapore

to better leverage on It to bolster staff’s productivity, MAS has implemented the Financial Institution Relationship Management (FIRM) system, an integrated platform to better manage MAS’ interactions with financial institutions and stakeholders. the new It system introduced capabilities such as Financial Institution Contact Management, Activity Management and Case Management, and empowers staff with all the key information intuitively presented in a central platform across MAS.
BuIlDING A STrONG MAS FAMIly
lEADErShIP DEvElOPMENT
Developing strong leaders in MAS is key to sustaining our values and culture, and in driving high performance within the organisation. As a multi-faceted knowledge-based organisation, strong leadership capabilities as well as deep specialist skills are important. to emphasise the importance of building specialisations and to strengthen the career prospects for staff, MAS has introduced Specialist leader initiatives. Specialist leaders will provide technical advice across MAS departments, lead projects and represent MAS at international technical meetings. they will be mentors to younger staff in their areas of expertise. Seven pioneer Specialist leaders were appointed in April 2014 in the areas of economics and International Finance, Banking Supervision, AMl and CFt Supervision, Financial Markets Infrastructure, enforcement and Investigation, and Mergers and Acquisitions.
presently, MAS has two in-house milestone development programmes. the Young professionals programme (Ypp) is a development programme offered to officers at an early-stage of their career to help them acquire skills in influencing, communications, effective feedback giving and in strengthening collaboration in the workplace. the 10th Ypp run was conducted in 2013 with 24 participants. the people leadership programme (plp) is the next milestone programme designed for new team leads to equip them with the people-centric leadership skills needed for their roles. these include self-awareness, situational
leadership, conflict management and building high performance teams. the plp is into its fifth year with 30 leaders trained in 2013. MAS will develop a third milestone programme targeted at Division Heads and Specialist leaders, which will focus on areas such as leadership development, policy making and stakeholder engagement.
MAS also invests in equipping our supervisors with skills to effectively coach their team members for personal development and work performance. We are growing our internal pool of professionally trained and certified coaches. these coaches provide professional coaching to staff including those taking on leadership responsibilities for the first time. FuNCTIONAl AND GENErAl TrAINING
the MAS Academy offers a comprehensive suite of learning and development programmes, covering functional and general development courses. these programmes are designed to cater to the needs of officers at different levels of seniority and are reviewed regularly to ensure that the courses remain relevant in a changing environment.
the MAS Academy supports and collaborates with peer Groups, which are communities of practice that conduct learning and sharing activities to keep abreast of developments and trends in specialist subject areas. through the sharing and exchange of ideas, peer Groups have helped MAS staff to develop deep technical knowledge and professional competence in many subject matters. For example, the AMl/CFt peer Group organised training sessions on the revised AMl penalty framework and good practices in AMl/CFt controls in private banking, trade finance and correspondent banking.
ATTAChMENTS AND SECONDMENTS
In addition to a wide range of training programmes, we also develop our officers through attachments and secondments to foreign regulators, supranational organisations, and financial institutions. these provide our officers with valuable opportunities to acquire technical expertise, learn best supervisory practices and to keep closer
61Annual Report 2013/14

pace with trends and developments in the financial sector. there were eight attachments and 15 secondments in 2013. OrGANISATIONAl rEvIEW ExErCISE
MAS collected a wealth of staff feedback and suggestions through its 2012 employee engagement Survey. With a better understanding of what mattered to our people, we embarked on an organisational Review exercise in 2013 covering three broad areas, namely, providing more opportunities for our people to grow and develop; seeking measures to enhance productivity and work-life effectiveness; and strengthening esprit de corps within MAS through cultivating people-centred leadership and fostering a people-oriented workplace. Recommendations arising from the review have been finalised, and several initiatives have already been rolled out. Implementation efforts will continue throughout the year. MAS is committed to staff engagement and organisation development, and will continue its efforts on this front for the long term.
rECOGNITION OF STAFF
Service Appreciation Awardsthe Service Appreciation Award (SAA) recognises and celebrates the loyalty and contributions of our dedicated staff. the awards ceremony was held on 6 August 2013. In all, 176 staff received the SAA for service in MAS ranging from five years to 40 years.
eighteen staff received the 40-year award and one of the recipients, Saleha Sadley from the economic Analysis Department, remarked “I am proud to be part of this esteemed organisation for the past four decades. I am happy to be in this friendly and family-oriented office environment, although it might be stressful at times and increasingly fast-paced. It is most satisfying to be given the opportunities to contribute my best, however small it is, to MAS.”
National Day Awardsthis year, 11 MAS staff were honoured for their contributions and service to the nation. Among the recipients was General Counsel ng Heng Fatt, who was conferred the public Administration (Silver Bar) Medal. We extend our heartiest congratulations to all our national Day Award recipients.
one mas: inteGrateD anD Cohesive
FOSTErING ESPrIT DE COrPS
Following an organisation-wide staff engagement exercise, the 42nd MAS Recreational Club (MASRC) was revamped to better serve the MAS community. the changes included broadening the Committee membership base to include majority of new staff, ensure greater management participation in activities, enhancing well-being initiatives, expanding Special Interest Groups to include new sports and social activities, and offering greater opportunities for community service.
Dinner and DanceIt was a flashback to school on 6 July 2013 at the Marina Bay Sands. the theme of the 2013 Dinner & Dance was MASchool Days and staff came dressed in a wide range of costumes, from traditional uniforms to the magical capes of the Hogwarts School of Witchcraft and Wizardry. Staff of all ages showed a different side of themselves as they took the stage and entertained with stirring performances. It was a night filled with shared laughter and memories.
Inter-Central Bank GamesMAS hosted the 37th Inter-Central Bank Games from 26 to 29 September 2013, achieving its best ever performance after finishing joint-second
62 Monetary Authority of Singapore

with Bank Indonesia. our Speed-climbing team clinched gold while the Volleyball and Captains’ Ball teams bagged silver. Bowling and Virtual Games were placed third and fourth respectively. More importantly, ties with our regional counterparts were strengthened and new friends were made across all levels.
ChristMASon Christmas eve, the young children of MAS staff were treated to Kidz@Work, a musical and carnival event that brought both the children and their parents Christmas cheer. the musical, put on by singers and dancers from various departments, focused on the antics of Santa Claus and his group of musically-talented elves and reindeer. this was followed by a Christmas carnival, with fun games such as darts and mini-basketball. parents dressed their children up in festive attire and brought them on impromptu tours of their workspaces.
Chinese New year BazaarMAS organised a Chinese new Year bazaar in January 2014 to usher in the Year of the Horse. the bazaar featured a wide variety of traditional Chinese new Year goodies ranging from pineapple tarts, love letters to the essential bak kwa. Many MAS staff visited the bazaar to celebrate together the coming festivities.
Family DayMAS staff and their families gathered under the Supertrees at Gardens by the Bay for MAS Family Day on 15 March 2014. the carnival was attended by approximately 600 staff and family members, who were treated to a morning of fun, music and laughter. For many families, this was followed by a visit to one of the conservatories.
Inter-Group Games Inter-Group Games 2014 was held on 29 March 2014, allowing staff at different levels and from different departments to bond over Men’s Futsal, ladies Frisbee, Mixed Badminton, Mixed Bowling and Virtual Games. this year, Banking and Insurance Group and Managing Director’s office emerged as the overall champions.
63Annual Report 2013/14

one mas: inteGrateD anD Cohesive
BOx 7: Community outreach
the Community Sub-committee was set up in october 2013 under the revamped MASRC in response to strong interest from staff to participate in community service. this year, MASRC adopted three voluntary welfare organisations (VWo) - lions Befrienders, Grace orchard School and the new Horizon Centre - as our beneficiaries.
the committee worked with the VWos to organise activities that are meaningful for their beneficiaries. We spring cleaned the homes of lions Befrienders seniors during the lunar new Year period and organised an outing for other elders. the committee also rallied MAS staff to support the Red Cross donation drive for the victims of typhoon
Haiyan as well as the Community Chest Fu Dai donation drive to help elders who live alone in one room flats. We supported the Boys Brigade annual Share-A-Gift initiative, contributing more than 70 bags of daily essentials to the needy. During the course of this year, the committee will roll out more activities including career skills workshops for intellectually challenged youths at the Grace orchard School and block parties for our seniors from lions Befrienders and the new Horizon Centre. We also hope to rally staff to participate in a walkathon to raise funds for Community Chest. these initiatives are geared towards galvanising the wider MAS population to give back to the community.
64 Monetary Authority of Singapore


68 FinancialStatementHighlights
69 StatementbyDirectors
70 Auditor’sReport
72 ConsolidatedStatementOfComprehensiveIncome
73 ConsolidatedBalanceSheet
74 ConsolidatedStatementofChangesinEquity
75 ConsolidatedCashFlowStatement
76 StatementofBackingofCurrencyinCirculation
77 NotestotheConsolidatedFinancialStatements
financial statements

MaS fY2013/2014 FInanCIaL statement HIGHLIGHts
the authority’s total assets, including the Currency Fund, increased by $18.60 billion to $380.45 billion, arising mainly from the net profit of $15.84 billion for the financial year ended 31 march 2014. the Currency Fund’s net external assets grew by 12.9% to $43.12 billion, whilst the currency-in-circulation rose at a slower 7.3%. as a result, the net external asset backing of the currency-in-circulation increased to 127%, from 121% a year ago.
total liabilities increased by $2.77 billion to $340.07 billion. the authority raised the issuance of mas bills for its money market operations and to meet increasing needs of banks for liquid assets. With the increase in mas bills, the singapore Government’s treasury bills were not rolled over, and singapore Government’s balances with the authority declined accordingly. the additional deposits of financial institutions and a higher amount of currency in circulation also contributed to the increase in liabilities.
the authority holds foreign assets as reserves for the conduct of the monetary policy and the defence of the singapore dollar. During the year, the euro, Us dollar, and the sterling Pound appreciated by 9.1%, 1.4% and 11.3% respectively against the singapore dollar, giving rise to foreign exchange gains, which were eroded partially by the depreciation of foreign currencies like the Japanese Yen, which weakened by 7.3%. the authority’s total expenditure increased from $0.82 billion to $0.92 billion, as investment, interest and personnel expenditure rose during the year.
Based on the framework for Contributions to Consolidated Fund, no contribution to the Consolidated Fund is required for this financial year as there are carried forward losses from previous financial years to offset against the net profit for the year. there will not be a return of profits to the Government as the authority rebuilds its reserves, in accordance with the monetary authority of singapore act.
68 Monetary Authority of Singapore

StateMent bY DirectorSFor the Financial year ended 31 March 2014
In the opinion of the directors,
(a) the consolidated financial statements of the authority and its wholly-owned subsidiary, singapore sukuk Pte Ltd, as set out on pages 72 to 96 are drawn up so as to present fairly the state of affairs of the authority as at 31 march 2014, the results and changes in equity of the authority for the financial year ended on that date, and of the cash flows of the authority for the financial year then ended; and
(b) at the date of this statement, there are reasonable grounds to believe that the authority will be able to pay its debts as and when they fall due.
On behalf of the Board of Directors,
THARMANSHANMUGARATNAMChairman
RAVIMENONmanaging Director
26 June 2014
69Annual Report 2013/14

the accompanying financial statements of the monetary authority of singapore (the “authority”), its subsidiary and Currency Fund, set out on pages 72 to 96, have been audited under my direction. these financial statements comprise the consolidated balance sheet as at 31 march 2014, the consolidated statement of comprehensive income, consolidated statement of changes in equity, consolidated cash flow statement and statement of backing of currency in circulation for the financial year then ended, and a summary of significant accounting policies and other explanatory information.
MANAGEMENT’SRESpONSIBIlITyFORTHEFINANCIAlSTATEMENTS
the management is responsible for the preparation and fair presentation of these financial statements in accordance with the provisions of the monetary authority of singapore act (Chapter 186, 1999 Revised edition) and Currency act (Chapter 69, 2002 Revised edition) and applicable singapore Financial Reporting standards as explained in note 3.1(a) to the consolidated financial statements, and for such internal controls as management determines are necessary to enable the preparation of financial statements that are free from material misstatement, whether due to fraud or error.
AUDITOR’SRESpONSIBIlITy
my responsibility is to express an opinion on these financial statements based on the audit. the audit was conducted in accordance with the provisions of the monetary authority of singapore act and Currency act and having regard to singapore standards on auditing. those standards require that ethical requirements be complied with, and that the audit be planned and performed to obtain reasonable assurance about whether the financial statements are free from material misstatement.
an audit involves performing procedures to obtain audit evidence about the amounts and disclosures in the financial statements. the procedures selected depend on the auditor’s judgment, including the assessment of the risks of material misstatement of the financial statements, whether due to fraud or error. In making those risk assessments, the auditor considers internal controls relevant to the entity’s preparation and fair presentation of the financial statements in order to design audit procedures that are appropriate in the circumstances, but not for the purpose of expressing an opinion on the effectiveness of the entity’s internal controls. an audit also includes evaluating, within the context of applicable laws, the appropriateness of accounting policies used and the reasonableness of accounting estimates made by the management, as well as evaluating the overall presentation of the financial statements.
I believe that the audit evidence obtained is sufficient and appropriate to provide a basis for my audit opinion.
inDePenDent aUDitor’S rePort on tHe aUDit of tHe financial StateMentS of tHe MonetarY aUtHoritY of SinGaPore FOR tHe FInanCIaL YeaR enDeD 31 maRCH 2014
70 Monetary Authority of Singapore

OpINION
as disclosed in note 3.1(a) to the consolidated financial statements, the authority, in preparing these financial statements, is allowed under section 34(3) of the monetary authority of singapore act and section 21(10) of the Currency act to comply with accounting standards to the extent that it is, in the opinion of the authority, appropriate to do so, having regard to its objects and functions. as also disclosed in note 3.1(a), the authority has considered its responsibilities for managing the singapore dollar exchange rate and the Official Foreign Reserves and is of the view that, for effective management of singapore’s monetary policy, it would be appropriate not to meet, in some respects, the singapore Financial Reporting standards. the financial statements accordingly disclose less information than would be required under those standards.
Having regard to the power given to the authority under section 34(3) of the monetary authority of singapore act and section 21(10) of the Currency act, in my opinion, the consolidated financial statements present fairly, based on the framework of accounting standards adopted by the authority, the state of affairs of the authority and its subsidiary as at 31 march 2014 and the financial transactions of the authority and its subsidiary for the financial year ended on that date.
TANyOKEMENGWIllIEaUDItOR-GeneRaLsInGaPORe
27 June 2014
71Annual Report 2013/14

conSoliDateD StateMent of coMPreHenSiVe incoMe
GeneralReserveFund
CurrencyFund Total
Fortheyearended31March Note 2014 2013 2014 2013 2014 2013
in$millions
Income/(Loss) from Foreign Operations [after transfers to/from provisions] 4 13,958 (10,297) 2,535 225 16,493 (10,072)
Income from Domestic and Other Operations 5 246 268 5 1 251 269
non-operating Income 6 9 9 – 2 9 11
TotalIncome/(loss)[aftertransfersto/fromprovisions] 14,213 (10,020) 2,540 228 16,753 (9,792)
Less:
Investment, Interest and Other expenses 7 541 453 89 118 630 571
Personnel expenditure 8 210 184 – – 210 184
General and administrative expenditure 9 55 49 – – 55 49
Depreciation/amortisation 16 21 17 – – 21 17
TotalExpenditure 827 703 89 118 916 821
profit/(loss)fortheyear[aftertransfersto/fromprovisions] 13,386 (10,723) 2,451 110 15,837 (10,613)
Less:
Contribution to Consolidated Fund 19.2 – – – – – –
Netprofit/(loss)andTotalComprehensiveIncome/(loss)fortheyear[aftertransfersto/fromprovisions] 13,386 (10,723) 2,451 110 15,837 (10,613)
the accompanying notes form an integral part of these financial statements.
72 Monetary Authority of Singapore

conSoliDateD balance SHeet
Asat31March Note 2014 2013
in$millions
CApITAlANDRESERVES
Issued and Paid-up Capital 10 25,000 25,000
General Reserve Fund 11 6,115 (7,082)
Currency Fund Reserves 12 9,261 6,621
40,376 24,539
Represented by:
ASSETS
Cash and Bank Balances 882 858
singapore Dollar securities 13 7,007 7,115
Foreign Financial assets 14 360,026 342,623
Gold 266 262
Other assets 15 12,093 10,816
Property and Other Fixed assets 16 176 172
380,450 361,846
Less:
lIABIlITIES
Currency in Circulation 33,859 31,566
Deposits of Financial Institutions 17 34,357 21,657
mas Bills 18 76,337 41,576
Foreign Financial Liabilities 14 15,487 21,441
Provisions and Other Liabilities 18 64,303 56,968
amounts Due to singapore Government 19 115,731 164,099
340,074 337,307
NETASSETSOFTHEAUTHORITy 40,376 24,539
NETASSETSOFFINANCIAlSECTORDEVElOpMENTFUND 20 1,207 1,154
the accompanying notes form an integral part of these financial statements.
73Annual Report 2013/14

the accompanying notes form an integral part of these financial statements.
conSoliDateD StateMent of cHanGeS in eQUitY
in$millions
Issuedandpaid-upCapital
GeneralReserve
Fund
CurrencyFund
Reserves Total
Balanceasat1April2012 25,000 2,481 7,671 35,152
total Comprehensive Income/(Loss) for the Year (after transfers to/from provisions) – (10,723) 110 (10,613)
transfer of Reserves from Currency Fund – 1,160 (1,160) –
Balanceasat31March2013 25,000 (7,082) 6,621 24,539
total Comprehensive Income/(Loss) for the Year (after transfers to/from provisions) – 13,386 2,451 15,837
transfer of Reserves to Currency Fund – (189) 189 –
Balanceasat31March2014 25,000 6,115 9,261 40,376
74 Monetary Authority of Singapore

the accompanying notes form an integral part of these financial statements.
conSoliDateD caSH floW StateMent
Fortheyearended31March 2014 2013
in$millions
Cash Flows from Operating activities
Profit/(Loss) for the Year (after transfers to/from provisions) 15,837 (10,613)
adjustments for: Depreciation/amortisation of Fixed assets and Other assets 21 17
Profit/(Loss) before Working Capital Changes 15,858 (10,596)
(Increase)/Decrease in singapore Dollar securities 108 (104) Foreign Financial assets (17,403) (18,516) Gold (4) 4 Other assets (1,277) (5,150)
Increase/(Decrease) in Deposits of Financial Institutions 12,700 3,676 mas Bills 34,761 23,583 Foreign Financial Liabilities (5,954) 2,564 Provisions and Other Liabilities 7,340 (12,678) amounts due to singapore Government
(excluding Contribution to Consolidated Fund and Return of Profit to singapore Government) (48,368) 14,494
NetCashusedinOperatingActivities (2,239) (2,723)
CashFlowsfromInvestingActivitiesPurchase of Fixed assets (30) (19)
NetCashusedinInvestingActivities (30) (19)
CashFlowsfromFinancingActivitiesIncrease in Currency in Circulation 2,293 2,740
NetCashfromFinancingActivities 2,293 2,740
NetIncrease/(Decrease)inCashandBankBalances 24 (2)
CashandBankBalancesasatbeginningoftheyear 858 860
CashandBankBalancesasatendoftheyear 882 858
75Annual Report 2013/14

the Currency Fund is established under section 21 of the Currency act (Chapter 69, 2002 Revised edition). section 22 of the act states that the external assets of the Currency Fund shall not be less than 100% of the face value of the Currency in Circulation.
Asat31March Note 2014 2013
in$millions
the value of external assets and the Currency in Circulation are:
Currency in Circulation 12.2 33,859 31,566
external assets 12.2 45,229 41,833
Less:
Foreign Financial Liabilities 12.2 1,753 3,028
Provisions and Other Liabilities 12.2 356 618
2,109 3,646
net external assets 43,120 38,187
StateMent of bacKinG of cUrrencY in circUlation
the accompanying notes form an integral part of these financial statements.
76 Monetary Authority of Singapore

NOTES TO THE CONSOLIDATED FINANCIAL STATEMENTSFOR THE YEAR ENDED 31 MARCH 2014
these notes form an integral part of and should be read in conjunction with the accompanying consolidated financial statements.
1 GENERAl
1.1 the monetary authority of singapore (the “authority”) is a statutory board established in singapore under the monetary authority of singapore act (Chapter 186, 1999 Revised edition) on 1 January 1971 and is located at 10 shenton Way, mas Building, singapore 079117.
1.2 the consolidated financial statements presented relate to those of the authority and its wholly-owned subsidiary, singapore sukuk Pte Ltd (ssPL). the financial statements of the authority are not materially different from the consolidated financial statements and have not been presented separately.
2 pRINCIpAlACTIVITIES
2.1 the principal activities of the authority are:
a) the conduct of monetary policy, issuance of currency, management of the official foreign reserves and acting as the banker to and financial agent of the Government; and
b) the supervision of the banking, insurance, securities and futures industries, and development of strategies in partnership with the private sector to promote singapore as an international financial centre.
2.2 the authority’s subsidiary, ssPL, is a special purpose entity incorporated in singapore, to issue sukuk certificates as shariah-compliant assets to Islamic financial institutions to meet regulatory requirements.
3 SIGNIFICANTACCOUNTINGpOlICIES
3.1 CompliancewiththeMonetaryAuthorityofSingaporeAct,CurrencyActandSingaporeFinancialReportingStandards
a) the consolidated financial statements of the authority, are prepared in accordance with the monetary authority of singapore act (Chapter 186, 1999 Revised edition), Currency act (Chapter 69, 2002 Revised edition) and applicable singapore Financial Reporting standards (FRs). section 34(3) of the monetary authority of singapore act and section 21(10) of the Currency act provide that the authority, in preparing its consolidated financial statements, may comply with accounting standards to the extent that it is, in the opinion of the authority, appropriate to do so, having regard to the objects and functions of the authority. the authority, having considered its responsibilities for managing the singapore dollar exchange rate and the official foreign reserves, is of the opinion that, for effective management of singapore’s monetary policy, it is appropriate not to meet, in some respects, the singapore Financial Reporting standards. the consolidated financial statements accordingly disclose less information than would be required under those standards.
77Annual Report 2013/14

NOTES TO THE CONSOLIDATED FINANCIAL STATEMENTSFOR THE YEAR ENDED 31 MARCH 2014
b) to align with the authority’s policy of making provision for diminution in value of financial assets based on the lower of cost and market value on an individual investment basis, the authority has changed its accounting policy of making such provision for forwards and currency swaps from a portfolio basis to an individual investment basis. the change in the accounting policy has no significant impact on the authority’s consolidated financial statements.
c) amendments to FRss applicable in the current financial year did not have a significant impact on the authority’s consolidated financial statements.
d) the preparation of consolidated financial statements in conformity with FRs requires
management to exercise its judgement in the process of applying the authority’s accounting policies, having regard to the objects and functions of the authority. It also requires the use of accounting estimates and assumptions that affect the reported amounts of assets and liabilities and disclosure of contingent assets and liabilities at the date of the consolidated financial statements, and the reported amounts of income and expenditure during the financial year. although these estimates are based on management’s best knowledge of current events and actions, actual results may ultimately differ from these estimates.
3.2 BasisofAccounting
the consolidated financial statements have been prepared under the historical cost convention and on an accrual basis, except as otherwise disclosed.
3.3 BasisofConsolidation
a) a subsidiary is an entity that the authority, directly or indirectly, has power to govern the financial and operating policies of, in order to obtain benefits from its activities. It is generally accompanied by a shareholding of more than 50% of voting rights. Potential voting rights that are exercisable or convertible are considered when determining whether an entity is considered a subsidiary.
b) a subsidiary is consolidated from the date control is established, acquired or transferred to the authority to the date control ceases. the cost of an acquisition is measured as the fair value of the assets given, equity instruments issued or liabilities incurred or assumed at the date of exchange.
c) Balances and transactions between the authority and its subsidiary, together with any unrealised profits and losses arising from these transactions are eliminated, in preparing the consolidated financial statements.
3.4 ForeignCurrencyTranslation
a) the consolidated financial statements are presented in singapore dollars, the authority’s functional currency, and rounded to the nearest million, unless otherwise stated.
b) transactions in foreign currency are measured at the exchange rate prevailing at the date of transaction. Foreign currency gains or losses resulting from the settlement of such transactions are recognised in the consolidated statement of comprehensive income.
78 Monetary Authority of Singapore

NOTES TO THE CONSOLIDATED FINANCIAL STATEMENTSFOR THE YEAR ENDED 31 MARCH 2014
c) assets and liabilities denominated in foreign currencies are translated into singapore dollars, at the exchange rate prevailing on the balance sheet date, except for shareholdings in Bank for International settlements (BIs) and society for Worldwide Interbank Financial telecommunication (sWIFt) which are converted at the rates of exchange prevailing on the acquisition dates. exchange differences arising from the translation are recognised in the consolidated statement of comprehensive income.
3.5 RecognitionandDerecognition
Purchases and sales of investments are recognised on the trade date when the authority commits to purchase or sell the asset. Investments are derecognised when the rights to receive cash flows from the financial assets have expired or have been transferred and the authority has transferred substantially all risks and rewards of ownership.
3.6 IncomeRecognition
a) Dividend income is recognised when the right to receive payment is established.
b) Interest income is recognised on a time-proportionate basis using the effective interest method. the effective interest rate is the rate that discounts estimated future cash payments or receipts through the expected life of the financial instrument or, where appropriate, a shorter period to the net carrying amount.
c) Profits/losses on disposal of investments are taken to the consolidated statement of comprehensive income.
d) Licence fee income is recognised on a straight-line basis over the period of the licence.
3.7 SingaporeDollarSecurities
singapore Government treasury bills and bonds and corporate bonds held are stated at cost. Provision has been made for diminution in value, if any, based on the lower of cost and market value on an individual investment basis.
3.8 Gold
Gold is a long-term investment stated at cost. Provision for diminution in value would be made in the event of a decline other than temporary in its value.
3.9 ForeignFinancialAssetsandliabilities
Foreign financial assets and liabilities represent the authority’s investments in a global diversified portfolio and are stated at cost. Provision has been made for diminution in value, if any, based on the lower of cost and market value on an individual investment basis.
79Annual Report 2013/14

NOTES TO THE CONSOLIDATED FINANCIAL STATEMENTSFOR THE YEAR ENDED 31 MARCH 2014
3.10 FinancialDerivatives
Financial derivatives include forwards, swaps, futures and options and are included in foreign financial assets and foreign financial liabilities. Other than financial instruments that are subject to margin requirements or central clearing which are fair valued, provision has been made for diminution in value, if any, of other financial derivatives based on the lower of cost and market value on an individual investment basis.
3.11 RepurchaseandReverseRepurchaseAgreements(“Repos”and“ReverseRepos”)
Reverse repos are treated as collateralised borrowings and the amounts borrowed are included in “Provisions and Other Liabilities”. the securities sold under reverse repos are treated as pledged assets and remain on the consolidated balance sheet. Repos are treated as collateralised lending and the amounts lent are included in “Other assets”. the difference between the amount received and the amount paid under repos and reverse repos is recognised as interest income and interest expense respectively.
3.12 property,OtherFixedAssetsandDepreciation
a) Property and other fixed assets are stated at cost less accumulated depreciation and impairment losses, if any. the cost includes expenditure that is directly attributable to the acquisition of the items. Depreciation is calculated on a straight-line basis to write off the cost less residual value of the fixed assets over their estimated useful lives as follows:
UsefullivesLeasehold Land Period of leaseBuildings 50 years or period of lease whichever is lowerBuilding Improvements 10 yearsComputer Hardware and software 3 to 5 yearsFurniture, Fixtures, motor Vehicles
and Other equipment 3 to 5 years
the residual values and useful lives are reviewed and adjusted as appropriate, at each balance sheet date.
b) Computer software costs of less than $100,000 and other assets costing $1,000 and below are expensed off in the year of purchase. any computer software costs not written off, are included in fixed assets.
c) Property and other fixed assets are reviewed for impairment whenever there is any indication that these assets may be impaired. If such indication exists, the recoverable amount of the asset is estimated to determine the amount of impairment loss. the impairment loss is recognised in the consolidated statement of comprehensive income for the period.
80 Monetary Authority of Singapore

NOTES TO THE CONSOLIDATED FINANCIAL STATEMENTSFOR THE YEAR ENDED 31 MARCH 2014
Reversal of impairment losses recognised in prior years is recorded when there is an indication that the impairment losses recognised for the asset no longer exist or have decreased. the reversal, if any, is recognised in the consolidated statement of comprehensive income. However, the increased carrying amount of an asset due to a reversal of an impairment is recognised to the extent that it does not exceed the carrying amount that would have been determined (net of depreciation or amortisation) had no impairment losses been recognised for the asset in prior years.
d) On disposal of fixed assets, the difference between the net disposal proceeds and its carrying amount is taken to the consolidated statement of comprehensive income.
3.13 Operatingleases
a) Leases where substantially all the rewards and risks of ownership remain with the lessors are accounted for as operating leases. Rental receipts or payments under operating leases are accounted for in the consolidated statement of comprehensive income on an accrual basis according to the terms of the agreements.
b) When an operating lease is terminated before the lease period has expired, any payment required to be made to the lessor by way of penalty is recognised as an income or expense in the period in which termination takes place.
3.14 EmployeeBenefits
a) Defined contribution plans
Defined contribution plans are post-employment benefit plans under which the authority pays fixed contributions into entities such as the Central Provident Fund, and will have no legal or constructive obligation to pay further contributions. the authority’s contributions to defined contribution plans are recognised in the financial year to which they relate.
b) employee leave entitlement
employee entitlements to annual leave are recognised when they accrue to employees. a provision is made for annual leave as a result of services rendered by employees up to the balance sheet date.
4 INCOME/(lOSS)FROMFOREIGNOpERATIONS
Income/(Loss) from foreign operations includes interest, dividends, profit/loss on disposal of investments, foreign exchange gain/loss and write-back of/additional provision for diminution in value of investments.
81Annual Report 2013/14

NOTES TO THE CONSOLIDATED FINANCIAL STATEMENTSFOR THE YEAR ENDED 31 MARCH 2014
5 INCOMEFROMDOMESTICANDOTHEROpERATIONS
Income from domestic and other operations includes mainly interest and write-back of/additional provision for diminution in value of singapore Dollar securities, licence and inspection fees, revenue from currency-related operations, custody fee and revenue from services rendered to banks and financial institutions on mas network and mas electronic Payment system which provides real-time gross settlement of payments.
6 NON-OpERATINGINCOME
non-operating income includes rental and carpark income, liquidated damages and management service fees.
7 INVESTMENT,INTERESTANDOTHERExpENSES
Investment and interest expenses include management fees, futures/options commissions, bank, custody and other charges arising from foreign operations, and interest paid on borrowings and reverse repurchase agreements arising from domestic and other operations. Other expenses include costs of printing of currency notes and coin operations.
8 pERSONNElExpENDITURE
8.1 this includes the following:
in$millions 2014 2013
salaries 182 158
employer’s Contribution to the Central Provident Fund 16 15
training and Personnel Development 4 4
staff Benefits 4 3
the minister-in-charge of the authority is not paid a salary by the authority. Directors’ fees for the year totalled $0.11 million (2013: $0.12 million). all ministers serving on the authority’s Board of Directors do not receive directors’ fees.
82 Monetary Authority of Singapore

NOTES TO THE CONSOLIDATED FINANCIAL STATEMENTSFOR THE YEAR ENDED 31 MARCH 2014
8.2 the key management personnel compensation is as follows:
in$millions 2014 2013
salaries and Other short-term employee Benefits 22 18
Other Long-term employee Benefits 4 3
Post-employment benefits of $0.6 million (2013: $0.6 million) were also provided to key management personnel.
executive Directors, Department Heads and above, are considered as key management personnel
for this purpose.
9 GENERAlANDADMINISTRATIVEExpENDITURE
this includes the following:
in$millions 2014 2013
Information technology 12 11
It Operating Lease 4 4
Information services 4 4
Official trips and Conferences 4 4
Building and mechanical and electrical maintenance 3 3
audit Fee 1 1
10 CApITAlANDRESERVES
10.1 the issued and paid-up capital is wholly-owned by the Government of the Republic of singapore.
10.2 the authority manages its capital and reserves at an appropriate and adequate level, in pursuit of the authority’s principal objects, as set out in section 4 of the monetary authority of singapore act (Chapter 186, 1999 Revised edition) that is, to maintain price stability conducive to sustainable economic growth, foster a sound and reputable financial centre, grow singapore as an internationally competitive financial centre and ensure prudent and effective management of the official foreign reserves of singapore. as required by the Constitution of the Republic of singapore, the authority has to determine and safeguard the past reserves of the authority which were not accumulated during the current term of office of the Government.
10.3 taking into consideration the authority’s capital and reserves needs for its principal objects, the authority conducts capital and reserves adequacy assessment regularly. It includes a comprehensive assessment of risks that the authority is exposed to, the measurement, monitoring and stress testing of these risks and an evaluation of the adequacy of the authority’s capital and reserves in relation to these risks.
83Annual Report 2013/14

NOTES TO THE CONSOLIDATED FINANCIAL STATEMENTSFOR THE YEAR ENDED 31 MARCH 2014
10.4 the return of profit to the singapore Government, from the General Reserve Fund and/or from the net profit for each financial year, is determined by the authority and the remainder of the net profit, if any, is credited to the General Reserve Fund, in accordance with section 6 of the monetary authority of singapore act (Chapter 186, 1999 Revised edition).
11 GENERAlRESERVEFUND
the General Reserve Fund is established under section 6(1) of the monetary authority of singapore act (Chapter 186, 1999 Revised edition).
12 CURRENCyFUNDRESERVES
12.1 the Currency Fund, established under section 21 of the Currency act (Chapter 69, 2002 Revised edition), is maintained and managed by the authority in the manner prescribed by the act.
12.2 the assets and liabilities of the Currency Fund as at 31 march are as follows:
in$millions Note 2014 2013
ExternalAssets
Gold 208 205
Foreign Investments 14.1(a) 45,021 41,628
45,229 41,833
Less:
liabilities
active Currency in Circulation 33,002 30,724
Currency Held by the authority 857 842
Currency in Circulation 33,859 31,566
Foreign Financial Liabilities 14.1(a) 1,753 3,028
Provisions and Other Liabilities 356 618
2,109 3,646
35,968 35,212
CurrencyFundReserves 9,261 6,621
84 Monetary Authority of Singapore

NOTES TO THE CONSOLIDATED FINANCIAL STATEMENTSFOR THE YEAR ENDED 31 MARCH 2014
13 SINGApOREDOllARSECURITIES
singapore Dollar securities comprise:
in$millions 2014 2013
singapore Government Bonds 6,997 7,105
singapore Dollar Corporate Bonds 10 10
7,007 7,115
14 FOREIGNFINANCIAlASSETSANDlIABIlITIES
14.1(a) these comprise the following:
Note
GeneralReserveFund CurrencyFund Total
in$millions 2014 2013 2014 2013 2014 2013
ForeignInvestments
Bank Balances and Deposits 63,553 49,842 2,322 2,681 65,875 52,523
securities (including treasury Bills, Bonds and equities) 242,801 237,631 40,868 37,644 283,669 275,275
Other Foreign Investments 14.1(b) 5,521 10,623 1,831 1,303 7,352 11,926
InternationalMonetaryFund(IMF)Assets 14.2
Reserve tranche 1,010 881 – – 1,010 881
special Drawing Rights 1,698 1,622 – – 1,698 1,622
Loans under new arrangements to
Borrow 22.1(d) 318 292 – – 318 292
Poverty Reduction and Growth Facility – Heavily Indebted Poor Countries 8 8 – – 8 8
ShareholdinginBankforInternationalSettlements(BIS) 14.3 96 96 – – 96 96
ForeignFinancialAssets 315,005 300,995 45,021 41,628 360,026 342,623
ForeignFinancialliabilities 14.1(b) 13,734 18,413 1,753 3,028 15,487 21,441
85Annual Report 2013/14

NOTES TO THE CONSOLIDATED FINANCIAL STATEMENTSFOR THE YEAR ENDED 31 MARCH 2014
14.1(b) Forwards and currency swaps are included in “Other Foreign Investments” and “Foreign Financial Liabilities” on an individual investment basis instead of on a portfolio basis previously.
GeneralReserveFund CurrencyFund
BeforeRestate-
ment Change
AfterRestate-
ment
BeforeRestate-
ment Change
AfterRestate-
ment
in$millions 2013 2013 2013 2013
ForeignFinancialAssets
Foreign Investments
Other Foreign Investments 9,502 1,121 10,623 1,289 14 1,303
ForeignFinancialliabilities 17,292 1,121 18,413 3,014 14 3,028
14.1(c) In prior years, “Foreign Financial assets” and “Foreign Financial Liabilities” were presented separately in the note to the financial statements and the net amount of foreign financial assets presented on the Consolidated Balance sheet. With effect from this financial year, “Foreign Financial assets” and “Foreign Financial Liabilities” are presented separately on the Consolidated Balance sheet. Comparative figures reported on the Consolidated Balance sheet also conform with current year’s presentation.
14.2 InternationalMonetaryFund(IMF)Assets
the Reserve tranche represents the amount of the paid-up portion of the singapore quota. special Drawing Rights (sDRs) are interest-yielding balances with ImF that can be exchanged for convertible currencies. singapore participates in the Poverty Reduction and Growth Facility-Heavily Indebted Poor Countries (PRGF-HIPC). the PRGF-HIPC outstanding balance as at 31 march 2014 is sDR4.0 million [$7.9 million] (31 march 2013: sDR4.0 million [$7.5 million]), being the balance in Post-special Contingent account-2 with ImF which was transferred to the PRGF-HIPC on 24 april 2001 as an interest-free deposit maturing at the end of 2018.
14.3 BankForInternationalSettlements(BIS)
the authority’s shareholding in the BIs comprises the 25% paid-up value of 4,285 (31 march 2013: 4,285) shares with a nominal value of sDR5,000 ($9,719) (31 march 2013: sDR5,000 [$9,290]) each.
15 OTHERASSETS
these comprise the following:
in$millions 2014 2013
Loans, Deposits and Other Receivables 6,883 3,881
Receivable from mas Bills Issued 1,997 4,398
Repurchase agreements with singapore Government 3,213 2,537
12,093 10,816
86 Monetary Authority of Singapore

NOTES TO THE CONSOLIDATED FINANCIAL STATEMENTSFOR THE YEAR ENDED 31 MARCH 2014
16 pROpERTyANDOTHERFIxEDASSETS
in$millionsleasehold
land Buildings
BuildingImprove-ments
ComputerHardware
andSoftware
Furniture,Fixtures,Motor
VehiclesandOtherEquipment
Work-in-progress Total
COST
as at 1.4.2012 48 171 94 85 26 17 441
additions – – – 2 1 19 22
Disposals – – – (1) – – (1)
transfers – – – 25 1 (26) –
as at 31.3.2013 48 171 94 111 28 10 462
ACCUMUlATEDDEpRECIATION
as at 1.4.2012 15 79 85 71 24 – 274
Disposals – – – (1) – – (1)
Depreciation Charge 1 4 3 8 1 – 17
as at 31.3.2013 16 83 88 78 25 – 290
NETBOOKVAlUEASAT31.3.2013 32 88 6 33 3 10 172
COST
as at 1.4.2013 48 171 94 111 28 10 462
additions – – – – 1 24 25
Disposals – – – (4) – – (4)
transfers – – – 10 – (10) –
as at 31.3.2014 48 171 94 117 29 24 483
ACCUMUlATEDDEpRECIATION
as at 1.4.2013 16 83 88 78 25 – 290
Disposals – – – (4) – – (4)
Depreciation Charge 1 5 3 11 1 – 21
as at 31.3.2014 17 88 91 85 26 – 307
NETBOOKVAlUEASAT31.3.2014 31 83 3 32 3 24 176
87Annual Report 2013/14

NOTES TO THE CONSOLIDATED FINANCIAL STATEMENTSFOR THE YEAR ENDED 31 MARCH 2014
17 DEpOSITSOFFINANCIAlINSTITUTIONS
in$millions 2014 2013
Banks 31,901 21,243
Finance Companies 330 323
securities Companies 8 7
32,239 21,573
International Financial Institutions 25 34
Foreign Central Banks and Others 2,093 50
34,357 21,657
Deposits from banks and finance companies in singapore include the minimum cash balances maintained by banks and finance companies with the authority as required under the Banking act (Chapter 19, 2008 Revised edition) and the Finance Companies act (Chapter 108, 2011 Revised edition) respectively. Deposits from securities companies represent statutory deposits from holders of capital markets services licences required under the securities and Futures (Licensing and Conduct of Business) Regulations.
18 MASBIllS,pROVISIONSANDOTHERlIABIlITIES
18.1 as part of the authority’s money market operations to manage the liquidity in the banking system, the authority issues its own short-term bills.
18.2 Provisions have been made for contingencies under section 6(2) of the monetary authority of singapore act (Chapter 186, 1999 Revised edition). Other liabilities include borrowings from banks, borrowings under reverse repurchase agreements, the authority’s allocations of special Drawing Rights in ImF, creditors, sukuk payable, accounts payable and accruals.
18.3 the authority’s allocations of special Drawing Rights in ImF amounting to $1,447 million as at 31 march 2014 (31 march 2013: $1,383 million) is included in “Provisions and Other Liabilities”.
18.4 During the financial year ended 31 march 2014, ssPL, a wholly-owned subsidiary of the authority, issued $110 million (2013: $100 million) sukuk trust certificates with one year maturity and an income distribution rate of 0.28% (2013: 0.29%) per annum. the sukuk issuance by ssPL is structured on the sale-and-leaseback or al Ijarah of property assets of the authority. Under agreements with ssPL, the authority will sell, leaseback, provide a purchase undertaking of the property assets and receive from and make periodic payments to ssPL.
88 Monetary Authority of Singapore

NOTES TO THE CONSOLIDATED FINANCIAL STATEMENTSFOR THE YEAR ENDED 31 MARCH 2014
19 AMOUNTSDUETOSINGApOREGOVERNMENT
19.1 the amounts due to the singapore Government comprise the following:
in$millions 2014 2013
amounts due to singapore Government, arising from Repurchase agreements 3,213 2,537
Balances and Deposits of singapore Government 112,518 161,562
115,731 164,099
19.2 Contribution to the Consolidated Fund is in accordance with the statutory Corporations (Contributions to Consolidated Fund) act (Chapter 319a, 2004 Revised edition) and is based on 17% (2013: 17%) of the net profit for the year. In the financial year ended 31 march 2014, no contribution to the Consolidated Fund (2013: nil) is payable as the cumulative loss from previous financial years is brought forward and offset against the net profit for the year.
89Annual Report 2013/14

NOTES TO THE CONSOLIDATED FINANCIAL STATEMENTSFOR THE YEAR ENDED 31 MARCH 2014
20 FINANCIAlSECTORDEVElOpMENTFUND
20.1 the Financial sector Development Fund (hereinafter called the Fund) is established under section 30a of the monetary authority of singapore act (Chapter 186, 1999 Revised edition). It is controlled and administered by the authority. the authority provides administrative and accounting support to the Fund. the Fund shall be used for the objects and purposes set out in section 30B of the act.
20.2 the financial statements of the Fund have been prepared in accordance with the provisions of the monetary authority of singapore act (Chapter 186, 1999 Revised edition) and the singapore Financial Reporting standards. the assets and liabilities of the Fund at fair value as at 31 march are as follows:
in$thousands Note 2014 2013
ACCUMUlATEDFUND
Capital account 471,635 471,635
accumulated surplus 735,737 681,934
1,207,372 1,153,569
Represented by:
ASSETS
Bank Balances and Deposits 20.4 221,449 241,206
Financial assets at Fair Value through Profit or Loss 989,601 952,426
Loans and Receivables 54,921 21,515
1,265,971 1,215,147
Less:
lIABIlITIES
Financial Liabilities at Fair Value through Profit or Loss 3,309 2,360
accruals and Other Liabilities 55,290 59,218
58,599 61,578
NETASSETSOFTHEFUND 1,207,372 1,153,569
90 Monetary Authority of Singapore
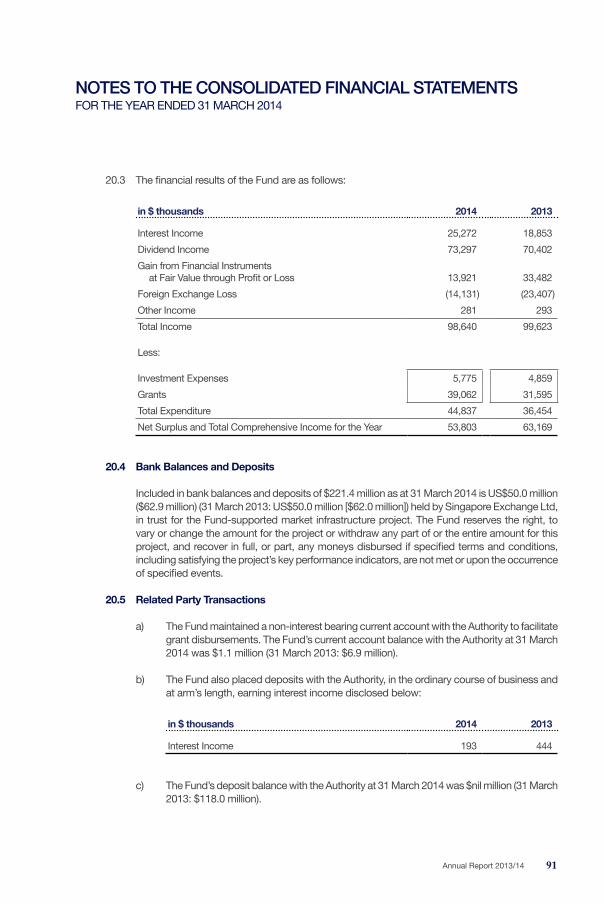
NOTES TO THE CONSOLIDATED FINANCIAL STATEMENTSFOR THE YEAR ENDED 31 MARCH 2014
20.3 the financial results of the Fund are as follows:
in$thousands 2014 2013
Interest Income 25,272 18,853
Dividend Income 73,297 70,402
Gain from Financial Instruments at Fair Value through Profit or Loss 13,921 33,482
Foreign exchange Loss (14,131) (23,407)
Other Income 281 293
total Income 98,640 99,623
Less:
Investment expenses 5,775 4,859
Grants 39,062 31,595
total expenditure 44,837 36,454
net surplus and total Comprehensive Income for the Year 53,803 63,169
20.4 BankBalancesandDeposits
Included in bank balances and deposits of $221.4 million as at 31 march 2014 is Us$50.0 million ($62.9 million) (31 march 2013: Us$50.0 million [$62.0 million]) held by singapore exchange Ltd, in trust for the Fund-supported market infrastructure project. the Fund reserves the right, to vary or change the amount for the project or withdraw any part of or the entire amount for this project, and recover in full, or part, any moneys disbursed if specified terms and conditions, including satisfying the project’s key performance indicators, are not met or upon the occurrence of specified events.
20.5 RelatedpartyTransactions
a) the Fund maintained a non-interest bearing current account with the authority to facilitate grant disbursements. the Fund’s current account balance with the authority at 31 march 2014 was $1.1 million (31 march 2013: $6.9 million).
b) the Fund also placed deposits with the authority, in the ordinary course of business and at arm’s length, earning interest income disclosed below:
in$thousands 2014 2013
Interest Income 193 444
c) the Fund’s deposit balance with the authority at 31 march 2014 was $nil million (31 march 2013: $118.0 million).
91Annual Report 2013/14

NOTES TO THE CONSOLIDATED FINANCIAL STATEMENTSFOR THE YEAR ENDED 31 MARCH 2014
20.6 ComparativeFigures
During the financial year, the Fund has reclassified gains/losses on foreign exchange forwards from Gain/Loss from Financial Instruments at Fair Value through Profit or Loss to Foreign exchange Gain/Loss to better reflect the effects of foreign exchange on financial instruments. as a result, gain on foreign exchange forwards of $7.3 million in the comparative figures has been reclassified to conform with the current year’s presentation.
20.7 the notes to the assets and liabilities and financial results of the Fund are available on the authority’s website at http://www.mas.gov.sg.
21 STATUTORyDEpOSITSOFINSURANCECOMpANIES,REMITTANCElICENSEESANDCApITAlMARKETSSERVICESlICENSEES
statutory bank deposits, guarantees and singapore Government bonds of insurance companies,
remittance licensees and capital markets services licensees, are retained by the authority under the Insurance act (Chapter 142, 2002 Revised edition), the money-changing and Remittance Businesses act (Chapter 187, 2008 Revised edition) and the securities and Futures act (Chapter 289, 2006 Revised edition) respectively, and in the events specified, dealt with accordingly under the respective acts.
22 COMMITMENTS
22.1 InternationalMonetaryFund(IMF)
a) the authority has an obligation to pay $1,669 million as at 31 march 2014 (31 march 2013: $1,791 million) which represents the unpaid portion of the singapore quota due to ImF under section 4 of article III of the articles of agreement.
b) On 15 December 2010, the ImF’s Board of Governors passed a resolution that would double the Fund’s total quotas and result in a major realignment of quota shares among members. singapore accepted its full quota increase of sDR2,484 million ($4,828 million) (31 march 2013: sDR2,484 million [$4,615 million]) on 31 October 2011.
c) On 20 april 2012, the authority announced that singapore would make a bilateral contingent loan of Us$4 billion ($5 billion) (31 march 2013: Us$4 billion [$5 billion]) to the ImF as part of the broader international effort to boost ImF’s resources and strengthen global economic and financial stability.
d) as a participant in the ImF’s ‘new arrangements to Borrow’ (naB), the authority undertakes to provide a credit line in the event of a financial emergency as specified by the naB. as at 31 march 2014, the loans granted by the authority under the naB totalled sDR163 million ($318 million) (31 march 2013: sDR157 million [$292 million]). the remaining undrawn credit is sDR1,114 million ($2,165 million) as at 31 march 2014 (31 march 2013: sDR1,120 million [$2,080 million]).
92 Monetary Authority of Singapore

NOTES TO THE CONSOLIDATED FINANCIAL STATEMENTSFOR THE YEAR ENDED 31 MARCH 2014
e) During the financial year ended 31 march 2014, the authority received sDR10.3 million ($20.1 million) being singapore’s share of the second distribution of sDR1,750 million ($3,402 million) by ImF arising from the profits made in the ImF’s gold sales. together with the authority’s share of sDR4.1 million ($8 million) from the first distribution received during the financial year ended 31 march 2013, singapore pledged to contribute its share of both distributions to the Poverty Reduction and Growth trust (“PRGt”) subsidy account, subject to legislative amendments.
22.2 BankforInternationalSettlements(BIS)
the authority has a commitment, amounting to sDR16.1 million ($31.3 million) as at 31 march 2014 (31 march 2013: sDR16.1 million [$29.9 million]), in respect of the uncalled portion of its shareholding in the BIs.
22.3 RepurchaseAgreementswithCentralBanksandMonetaryAuthority
the authority entered into bilateral repurchase agreements totalling Us$5,500 million ($6,917 million) (31 march 2013: Us$5,500 million [$6,822 million]) with various asian central banks and a monetary authority to provide liquidity assistance in times of emergency. For the financial year ended 31 march 2014, there was no request for liquidity assistance from any counterpart.
22.4 CurrencySwapArrangementswithCentralBanksandMonetaryAuthority
a) the authority is a participant in the multilateral asean swap arrangement (asa) together with other asean central banks and a monetary authority to provide short-term foreign exchange liquidity support for member countries that may experience balance of payments difficulties. In november 2013, the asa was renewed for an additional two years up to 16 november 2015. Under this agreement, the authority’s commitment is Us$300 million ($377 million) (31 march 2013: Us$300 million [$372 million]).
b) the authority is singapore’s swap Providing / Requesting Party in the Chiang mai Initiative multilateralisation (CmIm) agreement involving the asean member states, China (including the Hong Kong monetary authority, China), Japan and Korea. the CmIm agreement, effective from 24 march 2010, provides financial support through currency swap transactions, to address balance of payments and short-term liquidity difficulties in the region, and supplements existing international financial arrangements. On may 2012, the Chiang mai Initiative multilateralisation (CmIm) members agreed to strengthen the regional financial safety net and double the total size of the currency swap transactions with members to Us$240 billion. the authority’s commitment is Us$9,104 million ($11,449 million) (31 march 2013: Us$9,104 million [$11,292 million]) and the authority can swap singapore dollars for Us dollars up to 2.5 times singapore’s commitment.
c) the authority established a 3-year China-singapore currency swap arrangement of CnY150 billion ($30 billion) with the People’s Bank of China on 23 July 2010, to promote bilateral trade and direct investment for the economic development of the two countries. On 8 march 2013, the authority renewed and expanded the swap facility to CnY300 billion ($60 billion). this CnY/sGD swap facility allows the authority to provide Chinese Yuan liquidity to financial institutions for trade and financial stability purposes. as at 31 march 2014, the authority has a currency swap of CnY10 billion ($2.0 billion) (31 march 2013: $nil) with People’s Bank of China.
93Annual Report 2013/14

NOTES TO THE CONSOLIDATED FINANCIAL STATEMENTSFOR THE YEAR ENDED 31 MARCH 2014
d) aside from this CnY swap, there was no other drawdown of any of the currency swap arrangements, (a) and (b), in financial years ended 31 march 2013 and 31 march 2014.
22.5 liquidityloanFacility
the authority entered into an agreement with the singapore Deposit Insurance Corporation Limited (sDIC) on 9 February 2012 where the authority may provide the sDIC a contingent liquidity facility of up to $20 billion (31 march 2013: $20 billion), in the event a Deposit Insurance scheme member fails and liquidity is needed for compensation payments to insured depositors. there was no request and drawdown on the facility in financial years ended 31 march 2013 and 31 march 2014.
22.6 CapitalExpenditureCommitments
Capital expenditure not provided for in the consolidated financial statements is as follows:
in$millions 2014 2013
amount contracted for 31 14
22.7 leases
a) Future minimum lease payments under non-cancellable operating leases are as follows:
in$millions 2014 2013
Less than 1 year 1 1
1 to 5 years 3 2
4 3
b) Future minimum lease rental receipts under non-cancellable operating leases are as follows:
in$millions 2014 2013
Less than 1 year 8 6
1 to 5 years 10 6
18 12
23 FINANCIAlRISKMANAGEMENT
23.1 the Risk Committee, chaired by an independent Board Director, assists the Board of Directors in providing oversight and guidance over the management of risks assumed by the authority. this encompasses the management of financial risks inherent in the authority’s investment portfolios, amongst other organisational risks faced by the authority.
94 Monetary Authority of Singapore

NOTES TO THE CONSOLIDATED FINANCIAL STATEMENTSFOR THE YEAR ENDED 31 MARCH 2014
23.2 the Risk management Department provides senior management and the Risk Committee with regular reports of the risk profiles of the authority’s investments. these reports cover risk measurement and analysis of the authority’s investment portfolios. the department also formulates risk policies and controls, and performs independent risk monitoring of the portfolios in accordance with the stipulated investment guidelines.
23.3 MarketRisk
a) market risk is the risk that the fair value or future cash flows of a financial instrument will fluctuate because of changes in market prices and includes currency, interest rate and other price risks.
i) Currency risk is the risk of loss on foreign assets and liabilities arising from changes in foreign exchange rates.
ii) Interest rate risk is the risk of loss arising from changes in market interest rates.
iii) Other price risk is the risk that the fair value or future cash flows of a financial instrument will fluctuate because of changes in market prices (other than those arising from interest rate risk or currency risk), whether those changes are caused by factors specific to the individual financial instrument or its issuer, or factors affecting all similar financial instruments traded in the market.
b) market risk is managed through regular monitoring of the market risk exposure of the authority’s investments, the diversification of the authority’s investments across different markets and currencies, and the establishment of investment risk tolerance and controls at both the aggregate and individual portfolio levels.
23.4 CreditRisk
a) Credit risk is the risk of loss arising from a party’s failure to discharge an obligation under a financial contract and includes counterparty and issuer credit risk.
b) the authority’s credit risks are managed by transacting with well-rated entities within assigned limits. Credit risks are also mitigated by diversifying credit exposures across counterparties and issuers and through collateral arrangements with counterparties whom the authority has signed the International swaps and Derivatives association (IsDa) Credit support annex.
c) the authority manages issuer credit risk by imposing minimum credit rating requirements on the investment of fixed income securities. single issuer limits are placed to control the credit exposure to any one issuer and to mitigate the extent of loss resulting from a default.
23.5 CountryRisk
the authority’s foreign assets are exposed to country credit risk arising from political, economic and financial events in the country of investment. Country limits are established to control the authority’s credit risk exposure to individual countries.
95Annual Report 2013/14

NOTES TO THE CONSOLIDATED FINANCIAL STATEMENTSFOR THE YEAR ENDED 31 MARCH 2014
23.6 liquidityRisk
Liquidity risk is the risk arising from the inability to sell a financial asset at close to its fair value at short notice due to inadequate market depth or market disruptions. the authority manages liquidity risk by investing mostly in liquid financial instruments and markets, and imposing limits on investments to ensure sufficient diversification.
24 SEGMENTREpORTING
Owing to their integrated nature, the authority’s operations, including those of its subsidiary, ssPL, comprise one main operating segment only, i.e. the conduct of monetary policy, issuance of currency, management of the official foreign reserves and acting as the banker to and financial agent of the Government, for segment reporting purposes. In addition, the authority’s operations are mainly in one geographical area, singapore. all other segment information are below the quantitative thresholds for separate disclosure.
25 NEWORREVISEDACCOUNTINGSTANDARDSANDINTERpRETATIONS
new or revised accounting standards and interpretations to existing standards have been issued that are relevant for the authority’s accounting periods beginning on or after 1 January 2014 or later periods and which the authority has not early adopted. the authority does not expect the following revised accounting standards that are applicable, to have a significant impact on the authority’s consolidated financial statements.
FRs 110 Consolidated Financial statements FRs 110 establishes principles for the presentation and preparation of consolidated financial statements
when an entity controls one or more entities. It replaces all of the guidance on control and consolidation in FRs 27 “Consolidated and separate Financial statements” and Int FRs 12 “Consolidation – special Purpose entities”. Control exists under FRs 110 when the investor has power, exposure or rights to variable returns and the ability to use that power to affect its return from the investee.
FRs 112 Disclosure of Interests in Other entities FRs 112 requires disclosure of information that enables the evaluation of the nature, risks and financial
effects associated with the entity’s interests in (a) subsidiaries, (b) associates, (c) joint arrangements and (d) unconsolidated structured entities.
26 COMpARATIVEFIGURES
Comparative figures have been reclassified to conform with the presentation in the current year and other than the disclosure in note 14.1, have no significant impact on the consolidated financial statements.
27 AUTHORISATIONOFCONSOlIDATEDFINANCIAlSTATEMENTS
the consolidated financial statements for the year ended 31 march 2014 were authorised by the Board of Directors for issuance and signed by Chairman and managing Director on 26 June 2014.
96 Monetary Authority of Singapore

A. MONETARY STATISTICS98 A1. Money Supply99 A2. Official Foreign Reserves100 A3. Exchange Rates101 A4. Domestic Interest Rates
B. COMMERCIAL BANKS102 B1. Assets And Liabilities103 B2. Loans And Advances By
Industrial Classification104 B3. Types Of Loans And Advances To
Non-Bank Customers105 B4. Types Of Deposits Including
S$NCDS106 B5. Liquidity Position
C. FINANCE COMPANIES107 C1. Assets And Liabilities
D. MERCHANT BANKS108 D1. Consolidated Assets And Liabilities109 D2. Assets And Liabilities Of Domestic
Unit Operations
E. INSURANCE INDUSTRY110 E1. Assets & Premiums
F. NON-BANK FINANCIAL INSTITUTIONS111 F1. Central Provident Fund Board
G. DOMESTIC CAPITAL MARKET112 G1. Net Funds Raised In The Domestic
Capital Market
H. ASIAN DOLLAR MARKET113 H1. Assets And Liabilities114 H2. Maturity Transformation By Asian
Currency Units
STATISTICAL ANNEX

A.1
MO
NET
AR
Y S
TATI
STI
CS
:
MO
NEY
SU
PP
LYS
$ M
illio
nM
arch
End
of P
erio
d20
0520
0620
0720
0820
0920
1020
1120
1220
1320
14
Mon
ey S
uppl
y (M
1)46
,085
.952
,242
.663
,938
.675
,703
.893
,472
.111
2,48
7.0
130,
591.
914
0,70
9.1
154,
603.
215
9,13
3.4
C
urre
ncy
in a
ctiv
e ci
rcul
atio
n 114
,584
.515
,284
.716
,668
.518
,997
.420
,216
.522
,299
.524
,690
.326
,361
.328
,851
.629
,907
.8
Dem
and
depo
sits
31,5
01.4
36,9
57.9
47,2
70.1
56,7
06.4
73,2
55.6
90,1
87.5
105,
901.
611
4,34
7.8
125,
751.
612
9,22
5.6
Q
uasi
-mon
ey17
3,71
2.4
210,
127.
223
3,62
0.3
257,
707.
327
7,73
5.8
290,
609.
131
2,76
6.2
334,
683.
434
1,31
0.5
343,
142.
6
Fi
xed
depo
sits
107,
714.
314
1,61
9.4
151,
731.
715
5,12
1.9
156,
731.
115
4,41
7.3
160,
699.
617
5,27
0.8
171,
989.
316
7,51
9.3
Sav
ings
and
oth
er d
epos
its65
,588
.968
,287
.081
,822
.910
2,56
7.4
121,
004.
713
6,17
1.8
151,
901.
615
9,32
2.4
168,
838.
417
5,14
8.5
S$N
CD
s40
9.2
220.
865
.718
.00.
020
.016
5.0
90.2
482.
847
4.8
Mon
ey S
uppl
y (M
2)21
9,79
8.3
262,
369.
829
7,55
8.9
333,
411.
137
1,20
7.9
403,
096.
144
3,35
8.1
475,
392.
549
5,91
3.7
502,
276.
0
Net
dep
osits
with
fina
nce
com
pani
es5,
901.
36,
379.
39,
196.
08,
976.
47,
318.
17,
013.
28,
308.
210
,522
.910
,992
.211
,066
.9
Mon
ey S
uppl
y (M
3)22
5,69
9.6
268,
749.
130
6,75
4.9
342,
387.
537
8,52
6.0
410,
109.
345
1,66
6.3
485,
915.
450
6,90
5.9
513,
342.
9
1 F
igur
es e
xclu
de
com
mem
orat
ive,
num
ism
atic
and
bul
lion
coin
s is
sued
by
the
Mon
etar
y A
utho
rity
of S
inga
por
e an
d c
ash
held
by
com
mer
cial
ban
ks a
nd o
ther
fina
ncia
l ins
titut
ions
. The
B
oard
of C
omm
issi
oner
s of
Cur
renc
y, S
inga
por
e, m
erge
d w
ith t
he M
onet
ary
Aut
horit
y of
Sin
gap
ore
in O
ctob
er 2
002.
98 Monetary Authority of Singapore
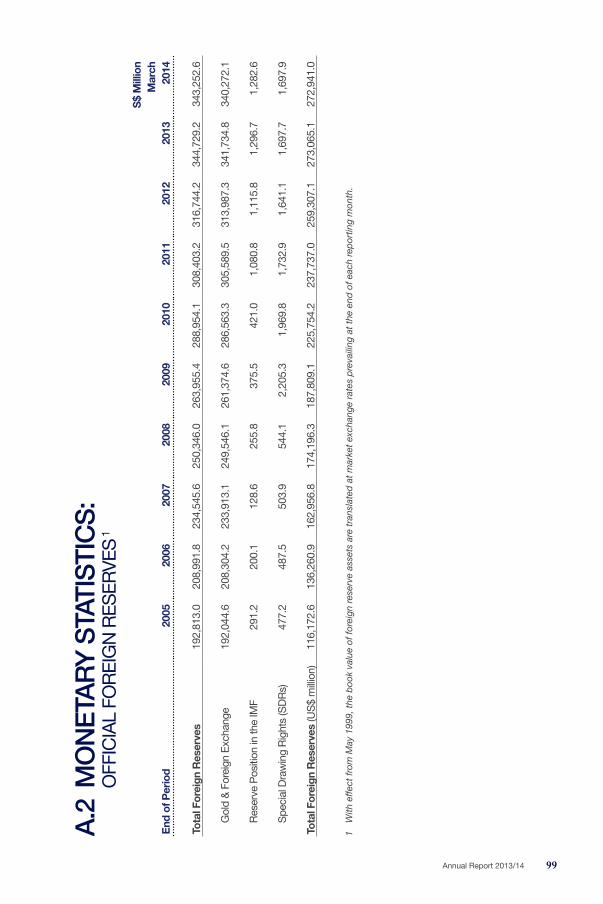
S$
Mill
ion
Mar
chE
nd o
f Per
iod
2005
2006
2007
2008
2009
2010
2011
2012
2013
2014
Tota
l For
eign
Res
erve
s19
2,81
3.0
208,
991.
823
4,54
5.6
250,
346.
026
3,95
5.4
288,
954.
130
8,40
3.2
316,
744.
234
4,72
9.2
343,
252.
6
G
old
& F
orei
gn E
xcha
nge
192,
044.
620
8,30
4.2
233,
913.
124
9,54
6.1
261,
374.
628
6,56
3.3
305,
589.
531
3,98
7.3
341,
734.
834
0,27
2.1
R
eser
ve P
ositi
on in
the
IMF
291.
220
0.1
128.
625
5.8
375.
542
1.0
1,08
0.8
1,11
5.8
1,29
6.7
1,28
2.6
S
peci
al D
raw
ing
Rig
hts
(SD
Rs)
477.
248
7.5
503.
954
4.1
2,20
5.3
1,96
9.8
1,73
2.9
1,64
1.1
1,69
7.7
1,69
7.9
Tota
l For
eign
Res
erve
s (U
S$
mill
ion)
116,
172.
613
6,26
0.9
162,
956.
817
4,19
6.3
187,
809.
122
5,75
4.2
237,
737.
025
9,30
7.1
273,
065.
127
2,94
1.0
1 W
ith e
ffect
from
May
199
9, t
he b
ook
valu
e of
fore
ign
rese
rve
asse
ts a
re t
rans
late
d a
t m
arke
t ex
chan
ge r
ates
pre
vaili
ng a
t th
e en
d o
f eac
h re
por
ting
mon
th.
A.2
MO
NET
AR
Y S
TATI
STI
CS
:
OFF
ICIA
L FO
REI
GN
RES
ERVE
S 1
99Annual Report 2013/14

S
$ P
er F
orei
gn C
urre
ncy
1st Q
trP
erio
d A
vera
ge20
0520
0620
0720
0820
0920
1020
1120
1220
1320
14
US
Dol
lar
1.66
461.
5889
1.50
711.
4148
1.45
451.
3635
1.25
791.
2497
1.25
131.
2689
100
Japa
nese
Yen
1.51
381.
3667
1.28
061.
3738
1.55
621.
5543
1.57
801.
5672
1.28
401.
2344
Eur
o2.
0719
1.99
522.
0638
2.07
712.
0242
1.80
951.
7495
1.60
711.
6621
1.73
86P
ound
Ste
rling
3.02
902.
9261
3.01
612.
6162
2.27
372.
1073
2.01
611.
9803
1.95
732.
0999
Sw
iss
Fran
c1.
3383
1.26
841.
2563
1.30
901.
3407
1.30
891.
4201
1.33
321.
3503
1.42
09A
ustr
alia
n D
olla
r1.
2686
1.19
671.
2624
1.20
161.
1473
1.25
241.
2971
1.29
401.
2107
1.13
7610
0 K
orea
n W
on0.
1625
0.16
640.
1622
0.13
060.
1143
0.11
800.
1135
0.11
090.
1144
0.11
8710
0 N
ew T
aiw
an D
olla
r5.
1768
4.88
704.
5870
4.48
744.
4023
4.32
924.
2798
4.22
624.
2155
4.19
17H
ong
Kon
g D
olla
r0.
2140
0.20
450.
1932
0.18
170.
1876
0.17
550.
1616
0.16
110.
1613
0.16
35M
alay
sian
Rin
ggit
0.43
950.
4331
0.43
840.
4247
0.41
260.
4234
0.41
110.
4046
0.39
730.
3847
Thai
Bah
t0.
0414
0.04
190.
0436
0.04
240.
0424
0.04
300.
0413
0.04
020.
0408
0.03
8910
0 In
done
sian
Rup
iah
0.01
720.
0173
0.01
650.
0147
0.01
400.
0150
0.01
430.
0133
0.01
200.
0107
Not
e: C
urre
ncie
s q
uote
d a
re t
hose
freq
uent
ly r
eque
sted
from
the
Aut
horit
y.
A.3
MO
NET
AR
Y S
TATI
STI
CS
:
EXC
HA
NG
E R
ATES
100 Monetary Authority of Singapore

Per
Cen
t Per
Ann
um1s
t Qtr
Per
iod
Ave
rage
2005
2006
2007
2008
2009
2010
2011
2012
2013
2014
Ban
ks1
Prim
e Le
ndin
g R
ate
5.30
5.31
5.33
5.38
5.38
5.38
5.38
5.38
5.38
5.35
Fixe
d D
epos
it R
ate
3-
mon
th0.
440.
570.
530.
420.
290.
210.
170.
140.
140.
15
6-m
onth
0.55
0.67
0.64
0.54
0.37
0.30
0.24
0.19
0.20
0.22
12
-mon
th0.
760.
880.
850.
730.
560.
480.
400.
300.
320.
33S
avin
gs D
epos
it R
ate
0.24
0.26
0.25
0.23
0.18
0.14
0.12
0.11
0.10
0.12
Fina
nce
Com
pani
es 2
Fixe
d D
epos
it R
ate
3-
mon
th0.
660.
940.
750.
490.
290.
220.
160.
160.
190.
18
6-m
onth
0.83
1.39
1.09
0.59
0.33
0.27
0.23
0.24
0.26
0.25
12
-mon
th1.
251.
851.
570.
900.
620.
540.
500.
480.
530.
53S
avin
gs D
epos
it R
ate
0.32
0.34
0.33
0.26
0.25
0.25
0.22
0.17
0.17
0.17
S$
SIB
OR
1-
mon
th2.
153.
392.
661.
140.
440.
380.
300.
310.
320.
36
3-m
onth
2.22
3.44
2.76
1.33
0.70
0.56
0.41
0.39
0.38
0.40
US
$ LI
BO
R
1-m
onth
3.38
5.09
5.25
2.67
0.33
0.27
0.23
0.24
0.19
0.16
3-
mon
th3.
565.
195.
302.
910.
690.
340.
340.
430.
270.
24
6-m
onth
3.76
5.27
5.25
3.04
1.12
0.52
0.51
0.69
0.41
0.33
1 A
vera
ge o
f 10
lead
ing
ban
ks.
2
Ave
rage
of a
ll fin
ance
com
pan
ies.
A.4
MO
NET
AR
Y S
TATI
STI
CS
:
DO
MES
TIC
INTE
RES
T R
ATES
Not
e: In
tere
st r
ates
for
ban
ks (e
xcep
t fo
r P
rime
Lend
ing
Rat
e) a
nd fi
nanc
e co
mp
anie
s re
fer
to a
vera
ge o
f end
of m
onth
rat
es.
Not
e: D
omes
tic in
terb
ank
rate
s ha
ve b
een
dis
cont
inue
d w
ith e
ffect
from
1 J
anua
ry 2
014
and
rep
lace
d w
ith S
$ S
IBO
R. U
S$
SIB
OR
rat
es h
ave
bee
n al
so r
epla
ced
with
the
US
$ LI
BO
R.
101Annual Report 2013/14

S$
Mill
ion
Mar
chE
nd o
f Per
iod
2005
2006
2007
2008
2009
2010
2011
2012
2013
2014
Ass
ets
Cas
h in
han
d1,
349.
41,
665.
41,
772.
91,
739.
82,
026.
82,
219.
92,
796.
42,
756.
02,
807.
52,
877.
3B
alan
ces
with
MA
S7,
466.
18,
802.
09,
530.
413
,466
.013
,999
.915
,878
.717
,815
.319
,503
.332
,107
.031
,386
.5S
$NC
Ds
held
267.
698
.20.
00.
00.
00.
09.
920
1.8
210.
021
1.3
Am
ount
s du
e fro
m b
anks
133,
505.
218
3,98
9.2
194,
828.
821
7,08
9.8
227,
923.
923
2,27
2.3
216,
223.
018
4,90
2.7
142,
977.
016
0,06
3.2
In
Sin
gapo
re39
,004
.251
,554
.459
,924
.152
,572
.157
,188
.277
,972
.858
,857
.644
,059
.527
,601
.443
,342
.8
AC
Us
51,0
23.1
63,4
76.1
58,9
45.9
73,1
34.5
87,2
08.0
69,1
52.1
62,1
25.1
44,0
61.6
29,2
16.8
32,1
92.6
O
utsi
de S
inga
pore
43,4
77.9
68,9
58.7
75,9
58.8
91,3
83.2
83,5
27.7
85,1
47.4
95,2
40.3
96,7
81.5
86,1
58.8
84,5
27.7
Inve
stm
ents
70,2
28.9
80,6
27.0
91,9
43.8
98,7
15.0
122,
968.
013
0,08
1.3
137,
711.
515
3,31
8.2
167,
478.
716
2,59
3.6
In
Sin
gapo
re60
,626
.767
,707
.678
,349
.484
,826
.298
,742
.610
7,52
6.2
118,
078.
412
9,13
0.0
139,
193.
413
5,49
9.1
Gov
ernm
ent s
ecur
ities
43,7
50.4
50,7
38.3
59,9
34.1
66,6
96.1
81,3
18.8
84,8
53.4
91,4
17.5
98,4
15.4
94,9
67.5
92,6
80.3
Oth
ers
16,8
76.3
16,9
69.3
18,4
15.3
18,1
30.1
17,4
23.8
22,6
72.8
26,6
60.9
30,7
14.6
44,2
25.9
42,8
18.8
O
utsi
de S
inga
pore
9,60
2.3
12,9
19.4
13,5
94.3
13,8
89.0
24,2
25.6
22,5
55.2
19,6
33.2
24,1
88.2
28,2
85.3
27,0
94.4
Loan
s an
d ad
vanc
es to
non
-ban
k cu
stom
ers
183,
109.
419
4,59
7.6
233,
393.
927
2,17
5.4
281,
296.
832
2,74
3.8
420,
455.
549
0,70
6.5
574,
271.
958
7,68
5.1
of
whi
ch b
ills
finan
cing
5,30
8.1
6,16
0.2
9,03
5.2
9,48
9.7
11,3
08.5
20,0
50.4
44,5
82.2
56,2
92.0
79,6
54.8
85,8
60.3
Fixe
d an
d ot
her a
sset
s29
,296
.038
,670
.551
,389
.265
,112
.358
,598
.778
,411
.460
,799
.759
,620
.653
,364
.752
,819
.8
Liab
ilitie
sP
aid-
up c
apita
l and
rese
rves
38,1
61.7
39,0
17.4
41,4
36.9
51,3
15.7
54,9
67.6
62,4
41.7
64,8
45.4
66,3
05.4
66,2
91.7
68,5
67.5
Dep
osits
of n
on-b
ank
cust
omer
s22
3,71
8.0
272,
462.
631
4,98
5.8
347,
507.
439
1,49
5.1
433,
757.
848
3,11
0.3
518,
840.
753
7,57
3.4
549,
335.
1S
$NC
Ds
issu
ed67
6.7
319.
065
.718
.00.
020
.017
5.0
292.
069
2.8
686.
0A
mou
nts
due
to b
anks
120,
849.
114
6,46
8.4
165,
520.
818
4,40
5.1
176,
394.
418
8,56
4.9
226,
427.
624
4,89
2.2
293,
986.
630
5,38
2.0
In
Sin
gapo
re23
,010
.919
,879
.917
,225
.718
,283
.913
,869
.414
,189
.79,
900.
512
,088
.711
,244
.213
,438
.9
AC
Us
67,8
42.2
78,8
40.4
95,8
67.3
92,3
13.0
113,
588.
111
9,35
0.8
147,
478.
716
2,74
6.8
206,
129.
621
7,99
5.9
O
utsi
de S
inga
pore
29,9
96.0
47,7
48.1
52,4
27.8
73,8
08.1
48,9
36.9
55,0
24.4
69,0
48.4
70,0
56.7
76,6
12.7
73,9
47.2
Bill
s pa
yabl
e62
0.8
998.
31,
254.
390
4.0
1,02
3.4
1,09
6.3
1,49
5.7
1,77
8.4
1,62
4.2
1,76
3.4
Oth
er li
abili
ties
41,1
96.2
49,1
84.3
59,5
95.5
84,1
48.2
82,9
33.6
95,7
26.8
79,7
57.3
78,9
00.3
73,0
48.2
71,9
02.7
Tota
l Ass
ets/
Liab
ilitie
s42
5,22
2.5
508,
449.
958
2,85
9.0
668,
298.
470
6,81
4.2
781,
607.
485
5,81
1.4
911,
009.
097
3,21
6.9
997,
636.
8
B.1
CO
MM
ERC
IAL
BA
NK
S:
A
SS
ETS
AN
D L
IAB
ILIT
IES
102 Monetary Authority of Singapore

S$
Mill
ion
Mar
chE
nd o
f Per
iod
2005
2006
2007
2008
2009
2010
2011
2012
2013
2014
Agr
icul
ture
, min
ing
and
quar
ryin
g29
3.0
325.
923
2.1
283.
226
0.3
382.
21,
719.
72,
104.
34,
905.
95,
761.
4
Man
ufac
turin
g10
,108
.010
,863
.210
,225
.811
,786
.110
,547
.310
,917
.619
,023
.527
,166
.331
,600
.431
,210
.9
Bui
ldin
g an
d co
nstr
uctio
n23
,031
.126
,345
.537
,508
.950
,006
.648
,940
.653
,593
.967
,304
.478
,704
.091
,275
.190
,951
.1
Hou
sing
and
brid
ging
loan
s61
,954
.663
,345
.173
,139
.179
,587
.091
,429
.511
2,38
1.3
131,
106.
515
2,00
3.0
166,
542.
016
8,88
3.5
Gen
eral
com
mer
ce19
,885
.220
,059
.022
,269
.024
,861
.623
,357
.430
,982
.948
,809
.657
,349
.875
,889
.081
,982
.5
Tran
spor
t, st
orag
e an
d
com
mun
icat
ion
4,32
7.0
6,29
7.1
9,12
9.8
9,21
1.7
10,6
12.3
9,01
8.1
11,8
83.2
13,0
89.2
17,1
62.7
17,2
49.3
Non
-ban
k fin
anci
al in
stitu
tions
21,9
93.1
23,8
05.6
31,3
60.4
33,5
06.1
32,4
65.3
37,9
84.6
55,5
50.9
64,8
95.1
76,3
87.4
82,7
21.3
Pro
fess
iona
l and
priv
ate
indi
vidu
als
32,4
82.3
32,3
18.3
35,0
70.9
37,8
72.3
39,4
76.3
42,3
96.1
52,6
69.8
60,4
51.0
65,6
88.0
65,9
90.5
Oth
ers
9,03
5.3
11,2
37.9
14,4
58.1
25,0
60.6
24,2
08.0
25,0
87.2
32,3
87.8
34,9
43.8
44,8
21.4
42,9
34.5
Tota
l18
3,10
9.4
194,
597.
623
3,39
3.9
272,
175.
428
1,29
6.8
322,
743.
842
0,45
5.5
490,
706.
557
4,27
1.9
587,
685.
1
B.2
CO
MM
ERC
IAL
BA
NK
S:
LO
AN
S A
ND
AD
VAN
CES
BY
IND
US
TRIA
L C
LAS
SIF
ICAT
ION
103Annual Report 2013/14
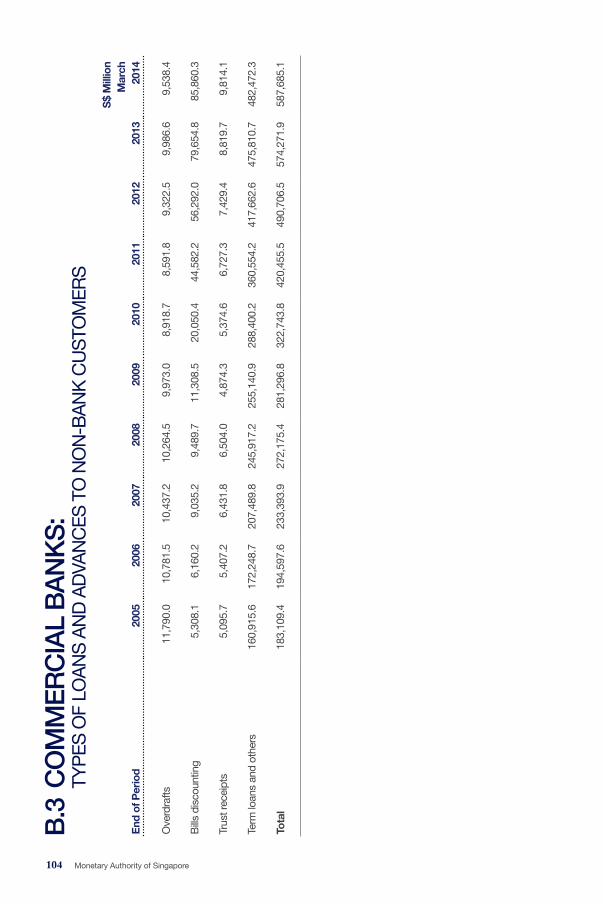
S$
Mill
ion
Mar
chE
nd o
f Per
iod
2005
2006
2007
2008
2009
2010
2011
2012
2013
2014
Ove
rdra
fts11
,790
.010
,781
.510
,437
.210
,264
.59,
973.
08,
918.
78,
591.
89,
322.
59,
986.
69,
538.
4
Bill
s di
scou
ntin
g5,
308.
16,
160.
29,
035.
29,
489.
711
,308
.520
,050
.444
,582
.256
,292
.079
,654
.885
,860
.3
Trus
t rec
eipt
s5,
095.
75,
407.
26,
431.
86,
504.
04,
874.
35,
374.
66,
727.
37,
429.
48,
819.
79,
814.
1
Term
loan
s an
d ot
hers
160,
915.
617
2,24
8.7
207,
489.
824
5,91
7.2
255,
140.
928
8,40
0.2
360,
554.
241
7,66
2.6
475,
810.
748
2,47
2.3
Tota
l 18
3,10
9.4
194,
597.
623
3,39
3.9
272,
175.
428
1,29
6.8
322,
743.
842
0,45
5.5
490,
706.
557
4,27
1.9
587,
685.
1
B.3
CO
MM
ERC
IAL
BA
NK
S:
TY
PES
OF
LOA
NS
AN
D A
DVA
NC
ES T
O N
ON
-BA
NK
CU
STO
MER
S
104 Monetary Authority of Singapore

S$
Mill
ion
Mar
chE
nd o
f Per
iod
2005
2006
2007
2008
2009
2010
2011
2012
2013
2014
Dem
and
35,1
40.1
41,4
73.1
52,0
80.2
62,1
00.4
81,0
47.0
100,
394.
212
0,13
3.3
130,
965.
714
2,66
7.2
153,
314.
3
Fixe
d11
8,49
6.4
158,
168.
317
5,42
1.2
175,
646.
917
9,57
1.8
185,
564.
819
7,60
9.5
213,
657.
921
0,49
0.5
204,
879.
3
Sav
ings
69,3
06.2
71,7
60.9
86,4
96.0
109,
033.
512
9,99
5.1
146,
802.
516
3,78
2.5
171,
785.
518
1,86
5.7
187,
879.
8
S$N
CD
s (n
et)
409.
222
0.8
65.7
18.0
0.0
20.0
165.
090
.248
2.8
474.
8
Oth
ers
775.
41,
060.
398
8.5
726.
688
1.3
996.
31,
585.
12,
431.
72,
549.
93,
261.
7
Tota
l22
4,12
7.2
272,
683.
431
5,05
1.6
347,
525.
439
1,49
5.1
433,
777.
848
3,27
5.4
518,
930.
953
8,05
6.2
549,
809.
9
B.4
CO
MM
ERC
IAL
BA
NK
S:
TY
PES
OF
DEP
OS
ITS
INC
LUD
ING
S$N
CD
S
105Annual Report 2013/14

S$
Mill
ion
1st Q
trP
erio
d A
vera
ge20
0520
0620
0720
0820
0920
1020
1120
1220
1320
14
Liab
ilitie
s B
ase
216
,346
.6
242
,434
.1
289
,744
.0
343
,846
.6
373,
193.
141
3,31
3.7
465,
704.
051
5,36
0.4
555,
837.
5 5
60,5
74.3
Liqu
id A
sset
s
(a) M
inim
um R
equi
rem
ent
38,
238.
1 4
2,98
0.6
51,
699.
6 3
6,27
9.1
36,7
95.0
40,0
45.8
40,8
21.9
42,7
29.4
46,2
48.9
43,
361.
0
(b) T
otal
Act
ual L
iqui
d A
sset
s 5
2,88
9.6
53,
597.
5 6
5,08
8.2
65,
787.
4 70
,449
.171
,212
.677
,987
.985
,250
.692
,558
.8 8
9,58
7.9
(c
) Fre
e Li
quid
Ass
ets
(b) -
(a)
14,
651.
5 1
0,61
6.9
13,
388.
6 2
9,50
8.3
33,6
54.0
31,1
66.8
37,1
65.9
42,5
21.2
46,3
09.9
46,2
26.9
Liqu
idity
Rat
ios
24.
4% 2
2.1%
2
2.5%
1
9.1%
18
.9%
17.2
%16
.7%
16.5
%16
.7%
16.0
%
B.5
CO
MM
ERC
IAL
BA
NK
S:
LI
QU
IDIT
Y P
OS
ITIO
N
106 Monetary Authority of Singapore

S$
Mill
ion
M
arch
End
of P
erio
d20
0520
0620
0720
0820
0920
1020
1120
1220
1320
14
Ass
ets
Res
erve
s w
ith M
AS
187.
620
3.1
274.
927
4.8
220.
121
5.1
251.
931
8.0
328.
233
0.1
Dep
osits
with
ban
ks a
nd o
ther
fin
anci
al in
stitu
tions
455.
175
7.1
881.
798
8.5
1,80
9.4
1,88
5.0
1,17
6.2
1,81
0.1
1,36
9.2
1,39
7.4
Ban
ks45
5.1
757.
188
1.7
988.
51,
809.
41,
885.
01,
176.
21,
810.
11,
369.
21,
397.
4
O
ther
inst
itutio
ns0.
00.
00.
00.
00.
00.
00.
00.
00.
00.
0Lo
ans
and
adva
nces
7,86
9.7
7,97
2.2
10,1
79.7
9,74
3.1
8,09
2.0
8,05
8.2
9,46
0.2
11,3
11.5
11,6
53.9
11,6
98.0
Hou
sing
loan
s1,
583.
31,
681.
31,
767.
11,
587.
61,
226.
41,
485.
51,
517.
11,
402.
81,
394.
01,
387.
5
H
ire p
urch
ase
2,46
7.6
2,24
5.8
2,71
3.1
2,75
5.6
2,36
1.3
2,06
9.9
2,03
7.7
2,08
9.9
1,89
1.5
1,84
5.3
Leas
e fin
ance
0.0
0.0
0.0
0.0
0.0
0.0
0.0
0.0
0.0
0.0
Oth
ers
3,81
8.7
4,04
5.1
5,69
9.4
5,39
9.9
4,50
4.3
4,50
2.8
5,90
5.4
7,81
8.8
8,36
8.4
8,46
5.2
Sec
uriti
es a
nd e
quiti
es82
7.3
1,00
8.0
1,27
7.7
1,45
6.9
1,45
3.7
1,25
9.3
1,16
1.9
1,41
4.7
1,52
2.5
1,54
4.2
Oth
er a
sset
s10
5.2
126.
216
7.9
123.
011
6.7
106.
011
5.1
113.
111
2.0
104.
4
Liab
ilitie
sC
apita
l and
rese
rves
1,65
8.4
1,69
3.1
1,68
3.3
1,71
3.0
1,82
4.9
1,92
6.2
1,99
9.2
2,10
4.8
2,10
9.6
2,13
2.6
Dep
osits
6,36
5.5
7,15
0.3
10,0
87.2
9,97
5.7
9,11
1.0
8,89
1.4
9,48
1.0
12,3
47.6
12,3
96.1
12,4
98.9
Fixe
d6,
240.
47,
035.
39,
939.
59,
799.
78,
861.
18,
614.
69,
218.
711
,909
.911
,887
.012
,067
.7
S
avin
gs12
1.6
108.
914
0.0
162.
423
8.2
266.
625
2.7
220.
924
0.3
232.
4
O
ther
s3.
56.
07.
713
.611
.710
.29.
721
6.8
268.
719
8.8
Bor
row
ings
685.
460
3.7
256.
913
4.9
97.5
79.6
45.6
22.6
17.0
10.1
Oth
er li
abili
ties
735.
761
9.5
754.
576
2.8
658.
562
6.4
639.
549
2.5
463.
043
2.3
Tota
l Ass
ets/
Liab
ilitie
s9,
444.
910
,066
.612
,781
.812
,586
.411
,691
.911
,523
.612
,165
.314
,967
.514
,985
.715
,074
.1
C.1
FIN
AN
CE
CO
MPA
NIE
S:
A
SS
ETS
AN
D L
IAB
ILIT
IES
107Annual Report 2013/14

S$
Mill
ion
Mar
chE
nd o
f Per
iod
2005
2006
2007
2008
2009
2010
2011
2012
2013
2014
Ass
ets
Am
ount
s du
e fro
m b
anks
24
,548
.332
,683
.236
,261
.832
,093
.522
,327
.022
,604
.222
,815
.121
,646
.521
,226
.519
,429
.9
In S
inga
pore
665.
377
1.4
660.
51,
262.
21,
488.
42,
254.
72,
567.
33,
170.
63,
433.
73,
945.
4
Asi
an C
urre
ncy
Uni
ts14
,189
.815
,049
.020
,688
.913
,853
.37,
153.
95,
097.
94,
615.
05,
300.
35,
212.
75,
472.
3
Out
side
Sin
gapo
re9,
693.
216
,862
.814
,912
.316
,978
.013
,684
.715
,251
.715
,632
.813
,175
.612
,580
.010
,012
.3Lo
ans
and
adva
nces
to n
on-b
ank
cust
omer
s26
,675
.027
,562
.028
,157
.121
,754
.623
,451
.125
,976
.829
,095
.726
,832
.325
,533
.824
,438
.0
Sec
uriti
es a
nd e
quiti
es11
,209
.115
,650
.221
,072
.013
,182
.724
,484
.636
,100
.028
,618
.038
,303
.332
,642
.134
,712
.9O
ther
ass
ets
2,41
2.7
2,13
3.9
3,57
9.3
5,57
1.5
6,09
1.7
5,07
9.2
7,32
2.2
5,62
8.9
5,53
8.9
6,22
1.8
Liab
ilitie
sC
apita
l and
rese
rves
8,37
4.1
8,10
4.5
9,16
4.4
8,44
3.2
8,85
5.7
9,51
0.2
9,98
3.6
12,1
68.2
12,3
81.3
12,5
69.4
Am
ount
s du
e to
ban
ks
29,4
71.5
35,8
34.0
36,4
78.5
35,6
98.1
37,9
63.7
51,2
64.3
46,9
28.5
55,0
45.1
51,6
58.0
51,7
22.4
In
Sin
gapo
re90
4.5
1,63
5.2
1,46
3.7
530.
73,
265.
63,
101.
858
5.8
615.
240
8.6
427.
1
Asi
an C
urre
ncy
Uni
ts13
,730
.917
,851
.119
,614
.017
,419
.113
,138
.022
,920
.923
,772
.522
,413
.920
,349
.218
,820
.2
Out
side
Sin
gapo
re14
,836
.216
,347
.715
,400
.717
,748
.221
,560
.025
,241
.522
,570
.232
,016
.030
,900
.232
,475
.1B
orro
win
gs fr
om n
on-b
ank
cust
omer
s23
,036
.828
,859
.036
,904
.222
,781
.323
,824
.021
,249
.122
,623
.417
,741
.813
,600
.611
,978
.9O
ther
liab
ilitie
s3,
962.
75,
231.
86,
523.
25,
679.
75,
711.
07,
736.
88,
315.
77,
456.
07,
301.
48,
532.
1
Tota
l Ass
ets/
Liab
ilitie
s64
,845
.178
,029
.389
,070
.272
,602
.376
,354
.489
,760
.387
,851
.192
,411
.084
,941
.384
,802
.8
1 D
ata
are
der
ived
from
the
con
solid
atio
n of
mer
chan
t b
anks
’ dom
estic
and
Asi
an d
olla
r op
erat
ions
.
D.1
MER
CH
AN
T B
AN
KS
:
CO
NS
OLI
DAT
ED A
SS
ETS
AN
D L
IAB
ILIT
IES
1
108 Monetary Authority of Singapore

S$
Mill
ion
Mar
chE
nd o
f Per
iod
2005
2006
2007
2008
2009
2010
2011
2012
2013
2014
Ass
ets
Am
ount
s du
e fro
m b
anks
4,
034.
74,
403.
24,
387.
45,
323.
15,
528.
55,
886.
66,
718.
57,
564.
18,
105.
68,
598.
0
In S
inga
pore
664.
277
0.6
659.
61,
261.
81,
488.
42,
254.
62,
567.
03,
109.
23,
414.
53,
944.
7
Asi
an C
urre
ncy
Uni
ts2,
900.
63,
121.
93,
112.
03,
062.
92,
988.
72,
368.
82,
539.
62,
894.
13,
520.
23,
584.
5
Out
side
Sin
gapo
re46
9.9
510.
661
5.8
998.
41,
051.
31,
263.
21,
611.
91,
560.
81,
170.
91,
068.
8Lo
ans
and
adva
nces
to n
on-b
ank
cu
stom
ers
685.
271
5.1
1,13
8.5
781.
784
5.6
1,91
7.8
1,66
0.0
1,73
8.0
1,47
5.6
1,48
2.5
Sec
uriti
es a
nd e
quiti
es1,
137.
61,
864.
01,
641.
21,
221.
13,
067.
13,
024.
93,
043.
12,
663.
92,
388.
71,
816.
2O
ther
ass
ets
299.
839
7.2
1,17
0.7
1,46
9.6
769.
060
1.1
715.
679
2.8
554.
951
7.4
Liab
ilitie
sC
apita
l and
rese
rves
2,61
3.4
2,13
3.6
2,74
5.3
3,26
2.9
3,13
8.4
3,56
4.6
3,21
9.2
4,02
5.9
3,44
0.8
3,79
2.8
Am
ount
s du
e to
ban
ks
2,84
2.4
4,23
6.7
3,94
4.6
3,64
7.8
6,03
9.7
6,45
3.8
7,43
9.2
7,31
8.0
7,63
9.8
7,25
8.2
In
Sin
gapo
re90
4.5
1,63
5.2
1,44
9.3
527.
91,
340.
264
9.2
553.
357
8.5
389.
742
7.1
A
sian
Cur
renc
y U
nits
1,27
2.3
1,87
3.2
1,64
2.6
1,48
2.4
1,94
8.4
2,79
6.1
3,46
2.1
3,05
0.0
4,94
1.8
5,17
2.4
O
utsi
de S
inga
pore
665.
672
8.3
852.
71,
637.
52,
751.
13,
008.
53,
423.
83,
689.
52,
308.
41,
658.
8B
orro
win
gs fr
om n
on-b
ank
cust
omer
s23
7.8
365.
552
1.9
341.
631
8.2
360.
945
7.7
395.
333
2.2
315.
8O
ther
liab
ilitie
s46
3.7
643.
81,
126.
11,
543.
271
3.9
1,05
1.1
1,02
1.2
1,01
9.5
1,11
1.9
1,04
7.1
Tota
l Ass
ets/
Liab
ilitie
s6,
157.
37,
379.
68,
337.
88,
795.
510
,210
.211
,430
.412
,137
.212
,758
.712
,524
.712
,414
.1
1
Cor
por
ate
finan
cial
ad
viso
ry s
ervi
ces,
und
erw
ritin
g ac
tiviti
es a
nd o
per
atio
ns in
the
gol
d m
arke
t ar
e no
t re
flect
ed in
the
dat
a.
D.2
MER
CH
AN
T B
AN
KS
:
AS
SET
S A
ND
LIA
BIL
ITIE
S O
F D
OM
ESTI
C U
NIT
OP
ERAT
ION
S 1
109Annual Report 2013/14

S$
Mill
ion
Mar
ch20
0520
0620
0720
0820
0920
1020
1120
1220
1320
14
Tota
l Ass
ets
of In
sura
nce
Indu
stry
(E
nd P
erio
d)10
2,42
8.4
113,
422.
412
8,77
7.4
115,
047.
713
5,80
1.3
149,
335.
316
1,11
4.8
174,
860.
117
9,69
2.7
181,
058.
0
D
irect
Insu
rers
94,3
24.6
105,
060.
611
8,86
0.0
104,
487.
912
3,58
5.0
136,
028.
014
3,01
9.7
156,
802.
616
1,59
7.3
165,
388.
4
Pro
fess
iona
l Rei
nsur
ers
6,07
0.0
6,62
2.5
7,96
0.1
8,65
5.2
9,95
0.4
10,8
27.6
15,2
77.2
15,0
22.1
14,8
86.3
15,6
69.6
C
aptiv
e In
sure
rs2,
033.
81,
739.
31,
957.
31,
904.
62,
265.
92,
479.
72,
817.
93,
035.
43,
209.
1N
.A.
Gen
eral
Bus
ines
s: G
ross
Pre
miu
ms 1
Tota
l Gen
eral
Bus
ines
s5,
330.
75,
481.
36,
105.
46,
829.
37,
436.
28,
580.
09,
820.
410
,416
.511
,102
.42,
908.
2
Dom
estic
Bus
ines
s2,
346.
72,
385.
92,
621.
92,
962.
52,
940.
83,
230.
63,
423.
63,
626.
73,
738.
11,
111.
2
Offs
hore
Bus
ines
s2,
984.
03,
095.
43,
483.
53,
866.
84,
495.
45,
349.
46,
396.
86,
789.
87,
364.
31,
797.
0
Life
Bus
ines
s: P
rem
ium
sP
rem
ium
s in
For
ce (E
nd P
erio
d)6,
839.
87,
181.
57,
660.
88,
347.
59,
719.
111
,374
.912
,412
.713
,663
.615
,073
.215
,359
.9N
ew B
usin
ess
Pre
miu
ms
A
nnua
l Pre
miu
m P
olic
ies
982.
986
8.8
1,12
1.9
1,45
9.2
1,84
0.7
3,01
4.8
2,46
6.4
2,45
3.7
3,11
4.6
681.
8
Sin
gle
Pre
miu
m P
olic
ies
Life
Insu
ranc
e5,
354.
36,
975.
89,
031.
78,
038.
26,
501.
67,
276.
77,
253.
46,
423.
67,
397.
11,
746.
4
A
nnui
ty26
3.1
377.
440
2.9
554.
218
9.4
152.
216
8.2
171.
136
.89.
0
1 Fi
gure
s fo
r M
arch
201
4 d
oes
not
incl
ude
gene
ral c
aptiv
es a
nd m
arin
e m
utua
l ins
urer
s.N
.A: N
ot a
vaila
ble
E.1
INS
UR
AN
CE
IND
US
TRY:
A
SS
ETS
& P
REM
IUM
S
110 Monetary Authority of Singapore

F.1
NO
N-B
AN
K F
INA
NC
IAL
INS
TITU
TIO
NS
:
CEN
TRA
L P
RO
VID
ENT
FUN
D B
OA
RD
S$
mill
ion
1st Q
tr
2005
2006
2007
2008
2009
2010
2011
2012
2013
2014
**
Exc
ess
of c
ontr
ibut
ions
ove
r w
ithdr
awal
s4,
238.
32,
089.
56,
555.
19,
265.
19,
404.
412
,374
.214
,184
.814
,321
.613
,666
.84,
148.
3
Con
trib
utio
ns (n
et o
f ref
unds
) by
mem
bers
1 16
,013
.916
,438
.818
,117
.820
,232
.320
,124
.921
,992
.724
,628
.426
,048
.428
,530
.08,
282.
5
With
draw
als
(net
of r
efun
ds) b
y m
embe
rs2
11,7
75.6
14,3
49.3
11,5
62.7
10,9
67.2
10,7
20.5
9,61
8.5
10,4
43.6
11,7
26.8
14,8
63.2
4,13
4.2
A
ppro
ved
hous
ing
sche
mes
37,
364.
38,
355.
05,
867.
95,
847.
05,
836.
54,
852.
76,
810.
97,
993.
78,
341.
42,
376.
8
Und
er S
ectio
n 15
and
Sec
tion
25 o
f
CP
F A
ct2,
440.
33,
028.
03,
081.
02,
799.
82,
622.
92,
628.
92,
909.
43,
112.
23,
967.
099
3.9
M
edic
al s
chem
es4
903.
599
6.3
1,07
6.7
1,30
2.9
1,47
6.4
1,64
5.4
1,79
2.1
1,84
0.4
2,38
1.1
493.
9
Oth
ers
1,06
7.5
1,97
0.0
1,53
7.1
1,01
7.5
784.
749
1.5
-1,0
68.8
-1,2
19.5
173.
726
9.6
In
tere
st c
redi
ted
to m
embe
rs3,
675.
43,
926.
84,
228.
05,
455.
16,
092.
66,
709.
87,
472.
78,
290.
69,
144.
22,
448.
7
Adv
ance
dep
osits
with
MA
S5
10,0
91.7
1,57
4.4
17,8
74.2
14,1
67.3
15,4
08.0
18,7
65.9
19,9
35.0
19,1
19.1
18,6
36.3
6,31
4.9
Inte
rest
ear
ning
s fr
om in
vest
men
ts6
3,84
4.1
4,11
4.7
4,43
2.1
5,65
1.4
6,27
6.3
6,97
8.9
7,79
2.7
8,64
6.9
9,57
1.6
2,54
0.7
Hol
ding
s of
Gov
ernm
ent S
ecur
ities
711
5,36
2.2
118,
918.
012
8,62
6.5
141,
325.
515
7,44
6.7
176,
142.
019
7,24
5.5
219,
037.
624
1,42
8.2
251,
034.
0M
embe
rs’ a
ccou
nts
119,
787.
512
5,80
3.8
136,
586.
915
1,30
7.1
166,
804.
018
5,88
8.0
207,
545.
523
0,15
7.7
252,
968.
625
9,56
5.6
Sou
rce:
Cen
tral
Pro
vid
ent
Fund
Boa
rd
1
Con
trib
utio
ns in
clud
e d
ivid
end
s fr
om S
pec
ial D
isco
unte
d S
hare
s an
d G
over
nmen
t G
rant
s.
2 W
ithd
raw
als
incl
ude
tran
sfer
s to
/ fr
om R
eser
ve A
ccou
nt /
gen
eral
mon
eys
of t
he F
und
.3
Ap
pro
ved
hou
sing
sch
emes
incl
ude
Pub
lic H
ousi
ng a
nd R
esid
entia
l Pro
per
ties
sche
mes
.
4
Med
ical
sch
emes
incl
udes
Med
isav
e, M
ediS
hiel
d, P
rivat
e M
edic
al In
sura
nce
and
Eld
erS
hiel
d s
chem
es.
5 D
epos
its p
lace
d w
ith M
AS
dur
ing
the
year
exc
lud
es: a
) int
eres
ts o
n b
ond
s &
inte
rest
on
Ad
vanc
e D
epos
its r
etai
ned
as
dep
osits
by
MA
S; a
nd b
) con
vers
ions
and
red
emp
tions
of
G
over
nmen
t b
ond
s.
6
Inc
lud
es in
tere
st e
arne
d fr
om in
vest
men
ts h
eld
in fu
nds
that
are
ad
min
iste
red
by
the
CP
F B
oard
. Thi
s in
clud
es t
he C
entr
al P
rovi
den
t Fu
nd, L
ifelo
ng In
com
e Fu
nd, M
ediS
hiel
d F
und
, H
ome
Pro
tect
ion
Fund
and
Dep
end
ants
’ Pro
tect
ion
Res
idua
l Fun
d.
7
Hol
din
gs e
xclu
de
adva
nce
dep
osits
with
MA
S.
**
P
rovi
sion
al fi
gure
s (u
naud
ited
)
111Annual Report 2013/14

S$
Mill
ion
1st Q
tr20
0520
0620
0720
0820
0920
1020
1120
1220
1320
14
A N
et fu
nds
rais
ed b
y G
over
nmen
t13
,056
.13,
200.
222
,837
.317
,526
.116
,793
.223
,742
.441
,075
.239
,864
.360
,985
.518
,498
.0
1) G
ross
issu
e of
Gov
ernm
ent
se
curit
ies 1
28,2
99.8
19,9
46.1
35,9
30.9
38,0
97.7
41,2
01.3
60,3
83.4
49,6
09.3
50,8
26.4
57,2
91.6
16,4
87.8
Less
:
Red
empt
ion
of G
over
nmen
t
se
curit
ies
16,7
00.0
13,0
90.3
21,0
22.5
21,8
98.7
21,1
80.0
36,5
89.0
23,8
15.5
25,5
15.5
28,2
93.8
5,45
4.0
C
onve
rsio
n fro
m a
ccum
ulat
ed
adva
nce
depo
sits
6,89
9.8
3,55
5.8
9,70
8.4
12,6
99.0
17,1
21.3
20,1
94.4
21,5
93.9
22,1
10.9
25,5
97.8
10,1
33.7
2)
New
adv
ance
dep
osits
7,65
6.1
-1,3
74.8
16,2
22.3
13,5
26.1
15,1
64.2
18,4
02.4
19,2
80.2
18,2
84.3
18,5
45.5
6,29
8.0
3)
Net
issu
es o
f sta
tuto
ry b
oard
s’
se
curit
ies
700.
01,
275.
01,
415.
050
0.0
-1,2
71.0
1,74
0.0
17,5
95.0
18,3
80.0
39,0
40.0
11,3
00.0
B N
ew c
apita
l rai
sed
by th
e pr
ivat
e
se
ctor
11,6
80.0
11,8
40.1
22,6
50.2
9,83
9.0
24,4
52.8
12,6
73.4
16,8
87.8
6,01
9.8
13,7
67.1
1,09
9.7
1)
Pub
lic is
sues
of s
hare
s6,
916.
87,
761.
37,
805.
95,
538.
63,
209.
96,
744.
410
,420
.22,
315.
16,
315.
043
3.0
2)
Rig
hts
issu
es 2
,783
.5
1,31
7.8
6,70
9.6
3,36
5.0
17,2
16.2
2,14
3.4
3,83
4.8
1,43
8.3
3,14
3.9
196.
7
3) P
rivat
e pl
acem
ents
of l
iste
d
sh
ares
1,97
9.7
2,76
1.0
8,13
4.7
935.
44,
026.
83,
785.
72,
632.
82,
266.
44,
308.
247
0.0
C I
ssue
s of
deb
t sec
uriti
es
20,0
10.3
25,7
54.7
29,9
86.7
15,4
94.3
15,3
20.5
25,8
80.7
24,8
00.7
32,7
80.8
25,4
99.5
6,70
9.2
1)
Lis
ted
bond
s, d
eben
ture
s an
d
lo
an s
tock
s 25,
074.
58,
422.
017
,940
.28,
804.
06,
816.
617
,793
.015
,797
.026
,708
.018
,427
.74,
115.
0
2)
Unl
iste
d bo
nds 3
14,9
35.8
17,3
32.7
12,0
46.5
6,69
0.3
8,50
3.9
8,08
7.7
9,00
3.7
6,07
2.8
7,07
1.8
2,59
4.2
Tota
l net
fund
s ra
ised
(A+B
+C)
44,7
46.4
40,7
95.0
75,4
74.2
42,8
59.4
56,5
66.5
62,2
96.5
82,7
63.7
78,6
64.9
100,
252.
126
,306
.9
1 G
over
nmen
t se
curit
ies
excl
udin
g tr
easu
ry b
ills.
2
Sin
gap
ore
dol
lar-
den
omin
ated
bon
ds
liste
d o
n th
e S
inga
por
e E
xcha
nge
(SG
X).
3 T
his
incl
udes
bon
ds
that
are
not
list
ed o
n th
e S
GX
but
list
ed o
n ot
her
exch
ange
s.
G.1
DO
MES
TIC
CA
PIT
AL
MA
RK
ET:
N
ET F
UN
DS
RA
ISED
IN T
HE
DO
MES
TIC
CA
PIT
AL
MA
RK
ET
112 Monetary Authority of Singapore

U
S$
Mill
ion
Mar
chE
nd o
f Per
iod
2005
2006
2007
2008
2009
2010
2011
2012
2013
2014
Ass
ets
Loan
s to
non
-ban
k cu
stom
ers
120,
865.
513
9,49
9.6
197,
823.
121
4,38
1.9
219,
614.
426
8,08
1.7
312,
814.
034
0,91
4.0
400,
596.
942
5,40
2.7
Inte
rban
k fu
nds
389,
485.
143
4,02
2.9
532,
674.
649
8,66
9.6
460,
726.
450
1,89
1.4
528,
823.
256
2,97
0.6
614,
563.
760
0,21
5.9
In
Sin
gapo
re40
,766
.451
,409
.566
,398
.364
,140
.580
,941
.592
,715
.511
3,36
1.8
133,
171.
616
2,83
0.7
172,
884.
2
Inte
r-A
CU
29,1
02.0
43,6
28.2
53,6
10.7
54,6
20.3
41,6
78.4
53,7
62.1
53,3
83.9
53,7
68.7
56,2
74.7
54,5
07.2
O
utsi
de S
inga
pore
319,
616.
733
8,98
5.2
412,
665.
537
9,90
8.9
338,
106.
535
5,41
3.7
362,
077.
537
6,03
0.3
395,
458.
337
2,82
4.4
NC
Ds
held
3,36
7.2
5,79
0.8
2,52
0.4
1,05
2.5
1,18
7.7
1,11
1.3
686.
11,
745.
64,
883.
36,
703.
6O
ther
ass
ets
97,6
59.5
119,
335.
217
3,97
2.9
198,
635.
418
7,87
1.2
200,
215.
017
7,20
9.6
187,
634.
316
0,57
3.4
164,
804.
9
Liab
ilitie
sD
epos
its o
f non
-ban
k cu
stom
ers
162,
834.
221
6,81
8.1
275,
256.
926
2,16
2.1
269,
370.
227
3,98
0.3
296,
376.
632
7,86
3.5
365,
058.
037
0,69
6.9
Inte
rban
k fu
nds
394,
080.
540
9,87
8.0
540,
688.
352
3,69
0.5
502,
232.
658
4,21
8.2
599,
568.
362
8,10
9.0
648,
170.
865
7,87
0.9
In
Sin
gapo
re37
,337
.349
,139
.650
,438
.662
,600
.987
,208
.379
,206
.477
,629
.475
,466
.960
,529
.358
,469
.8
Inte
r-A
CU
29,0
67.8
42,9
71.6
53,6
70.1
54,8
48.7
41,7
78.1
53,8
12.3
53,6
03.0
53,9
34.8
56,2
61.1
54,6
40.7
O
utsi
de S
inga
pore
327,
675.
431
7,76
6.8
436,
579.
640
6,24
0.9
373,
246.
245
1,19
9.5
468,
335.
949
8,70
7.3
531,
380.
354
4,76
0.4
NC
Ds
issu
ed2,
952.
44,
733.
13,
652.
11,
593.
91,
416.
21,
780.
41,
686.
83,
572.
89,
916.
711
,079
.8O
ther
liab
ilitie
s51
,510
.267
,219
.287
,393
.712
5,29
2.9
96,3
80.6
111,
320.
512
1,90
1.2
133,
719.
315
7,47
1.9
157,
479.
4
Tota
l Ass
ets/
Liab
ilitie
s61
1,37
7.4
698,
648.
590
6,99
1.0
912,
739.
486
9,39
9.6
971,
299.
41,
019,
532.
91,
093,
264.
61,
180,
617.
41,
197,
127.
1
H.1
AS
IAN
DO
LLA
R M
AR
KET
:
AS
SET
S A
ND
LIA
BIL
ITIE
S
113Annual Report 2013/14

US
$ B
illio
nM
arch
End
of P
erio
d20
0520
0620
0720
0820
0920
1020
1120
1220
1320
14
Net
Pos
ition
1
Up
to 6
mon
ths
-89.
5-1
04.5
-162
.6-1
69.1
-160
.8-1
78.5
-178
.1-1
54.3
-169
.8-1
89.3
Ove
r 6 m
onth
s to
1 y
ear
27.3
19.1
27.0
21.7
15.6
28.7
33.3
20.4
28.1
33.6
Ove
r 1 to
3 y
ears
25.7
29.1
46.8
50.8
60.4
67.2
58.4
56.9
56.9
62.4
Ove
r 3 y
ears
37.8
61.6
83.9
83.4
73.0
79.6
75.3
67.8
76.3
79.7
Cla
ims 1
Up
to 6
mon
ths
427.
547
9.2
603.
357
0.3
561.
662
1.9
642.
170
1.1
764.
376
1.6
Ove
r 6 m
onth
s to
1 y
ear
48.5
44.4
55.3
52.4
42.6
54.4
68.0
65.2
78.2
90.2
Ove
r 1 to
3 y
ears
41.4
50.6
71.7
80.9
85.0
101.
910
9.5
115.
612
1.5
130.
2O
ver 3
yea
rs59
.987
.211
7.7
117.
410
5.8
122.
412
6.8
129.
913
5.7
141.
9
Liab
ilitie
s 1
Up
to 6
mon
ths
517.
058
3.7
765.
973
9.4
722.
480
0.4
820.
285
5.4
934.
195
0.9
Ove
r 6 m
onth
s to
1 y
ear
21.2
25.3
28.3
30.7
27.0
25.7
34.7
44.8
50.1
56.6
Ove
r 1 to
3 y
ears
15.7
21.5
24.9
30.1
24.6
34.7
51.1
58.7
64.6
67.8
Ove
r 3 y
ears
22.1
25.6
33.8
34.0
32.8
42.8
51.5
62.1
59.4
62.2
1 D
ata
excl
ude
thos
e cl
aim
s or
liab
ilitie
s w
ith u
nallo
cate
d m
atur
ity p
erio
ds.
The
refo
re t
he s
um o
f all
the
mat
urity
cat
egor
ies
for
clai
ms
may
not
be
equa
l to
the
sum
of a
ll th
e m
atur
ity
cate
gorie
s fo
r lia
bili
ties.
H.2
AS
IAN
DO
LLA
R M
AR
KET
:
MAT
UR
ITY
TR
AN
SFO
RM
ATIO
N B
Y A
SIA
N C
UR
REN
CY
UN
ITS
114 Monetary Authority of Singapore

GLOSSARY

Glossary
AMl/CFT Anti-Money laundering and Countering the Financing of terrorism
ASEAN Association of Southeast Asian nations
ASEAN+3 ASeAn plus China, Japan, South Korea
AuM Assets under Management
BCBS Basel Committee on Banking Supervision
BIS Bank for International Settlements
CBrC China Banking Regulatory Commission
CCWG the Contract Certainty Working Group
CMG Crisis Management Group
COE Certificate of entitlement
CPI Consumer price Index
CPSS Committee on payment and Settlement Systems
ECB european Central Bank
FATF Financial Action task Force
FDSP Financial District Security programme
FSB Financial Stability Board
Fx Foreign exchange
G20 Group of twenty
G3 Group of three
GDP Gross Domestic product
IAIS International Association of Insurance Supervisors
IMF International Monetary Fund

IMFC International Monetary and Financial Committee
IOSCO International organisation of Securities Commissions
IT Information technology
lTv loan-to-value
MEPS+ MAS electronic payment System
MOu Memorandum of understanding
NuS national university of Singapore
OTC over-the-counter
q-o-q SAAr Quarter-on-Quarter Seasonally Adjusted Annualised Rate
S$/SGD Singapore Dollar
S$NEEr nominal effective exchange Rate
SEACEN South east Asian Central Banks
SGS Singapore Government Securities
SGx Singapore exchange
SWIFT Society for Worldwide Interbank Financial telecommunication
uS$/uSD united States Dollar

Published by Monetary Authority of SingaporeDesigned and produced by: Oculus Design Pte ltd
Copyright © Monetary Authority of Singapore 2014this annual report is copyright under the Monetary Authority of Singapore.no reproduction without permission. All rights reserved.
monetary authority of singapore10 Shenton Way MAS Building Singapore 079117www.mas.gov.sg


10 Shenton WayMAS Building
Singapore 079117www.mas.gov.sg