monetary policy and the stock market - university of … the stock market, monetary policy actions...
TRANSCRIPT
Monetary Policy and the Stock Market: Some
International evidence
Christos Ioannidis a and Alexandros Kontonikas b*
a School of Management, University of Bath, Bath, UK
b Department of Economics, University of Glasgow, Glasgow, UK
Abstract
This paper investigates the impact of monetary policy on stock returns in thirteen OECD
countries over the period 1972-2002. Our results indicate that monetary policy shifts significantly affect
stock returns, thereby supporting the notion of monetary policy transmission via the stock market. Our
contribution with respect to previous work is threefold. First, we show that our findings are robust to
various alternative measures of stock returns. Second, our inferences are adjusted for the non-normality
exhibited by the stock returns data. Finally, we take into account the increasing co-movement among
international stock markets. The sensitivity analysis indicates that the results remain largely unchanged.
JEL classifications: E44; E52; E60 Keywords: Monetary policy; Asset prices
September 2006
* Corresponding author: Dr Alexandros Kontonikas, Department of Economics, Adam Smith Building, University of Glasgow, Glasgow, G12 8RT, UK. Tel.: +44 (0)141 3306866. Fax: +44 (0)141 3304940. Email: [email protected]
1
1. Introduction
Monetary policy attempts to achieve a set of objectives that are expressed in terms of
macroeconomic variables such as inflation, real output and employment. However, monetary
policy actions such as changes in the central bank discount rate have at best an indirect effect
on these variables and considerable lags are involved in the policy transmission mechanism.
Broader financial markets though, for example the stock market, government and corporate
bond markets, mortgage markets, foreign exchange markets, are quick to incorporate new
information. Therefore, a more direct and immediate effect of changes in the monetary policy
instruments may be identified using financial data. Identifying the link between monetary
policy and financial asset prices is highly important to gain a better insight in the transmission
mechanism of monetary policy, since changes in asset prices play a key role in several
channels.
In this paper, we provide empirical evidence on the relationship between monetary
policy and one of the most important financial markets, the stock market. Stock prices are
among the most closely monitored asset prices in the economy and are commonly regarded as
being highly sensitive to economic conditions. In the context of the transmission mechanism
through the stock market, monetary policy actions affect stock prices, which themselves are
linked to the real economy through their influence on consumption spending (wealth effect
channel) and investment spending (balance sheet channel)1. As Bernanke and Kuttner (2005)
point out, some observers view the stock market as an independent source of macroeconomic
volatility to which policymakers may wish to respond. Stock prices often exhibit pronounced
volatility and boom-bust cycles leading to concerns about sustained deviations from their
‘fundamental’ values that, once corrected, may have significant adverse consequences for the
broader economy. Hence, establishing quantitatively the existence of a stock market response
to monetary policy changes will not only be germane to the study of stock market
determinants but will also contribute to a deeper understanding of the conduct of monetary
policy and of the potential economic impact of policy actions or inactions.
According to the discounted cash flow model, stock prices are equal to the present
value of expected future net cash flows. Monetary policy should then play an important role
in determining equity returns either by altering the discount rate used by market participants
or by influencing market participants’ expectations of future economic activity. These
channels of influence are interlinked since more restrictive monetary policy usually implies
both higher discount rates and lower future cash flows. Thus, monetary policy tightening
1 Goodhart and Hofmann (2000) establish empirically the link between output growth, credit aggregates, and asset price movements in a number of major economies.
2
should be associated with lower stock prices given the higher discount rate for the expected
stream of cash flows and/or lower future economic activity. In contrast, an expansive
monetary environment is commonly viewed as good news as these periods are usually
associated with low interest rates, increases in economic activity and higher earnings for the
firms in the economy. Consequently, stock market participants pay close attention to
strategies based on the stance of the monetary authority as inferred by changes in indicators of
central bank policy. Also, the financial press often interprets asset price movements as
reaction to monetary policy shifts, attributing for instance increases in stock markets to low
interest rates.
Previous empirical evidence broadly supports the notion that restrictive (expansive)
monetary policy decreases (increases) contemporaneous stock returns, as well as expected
stock returns2. These studies typically relate stock returns to measures of monetary policy
stringency in the context of single equation specifications and/or multivariate Vector
Autoregressions (VAR’s). In this paper we take a closer look at the impact of monetary policy
on stock returns by utilising thirty years of data across thirteen OECD countries. Given the
considerable debate on the relative merits of money aggregates during the late 1970s and
early 1980s, we adopt the nowadays standard approach of measuring monetary policy using
interest rate variables. We expand previous work by examining the sensitivity of our findings
to the inclusion of dividend payments in the stock returns calculation, while considering both
nominal and real returns. Our results indicate that for the majority of the countries under
investigation the monetary environment is an important determinant of investors’ required
returns. This holds across a variety of returns specifications (nominal, real, dividend adjusted,
non-adjusted). We also examine the contemporaneous effect of monetary policy on stock
returns taking into account the non-normality typically inherent in such data as well as the
significant co-movement of international stock markets. The main result, that expansionary
monetary policy boosts the stock market, remains largely robust in most sample countries.
The implications of such findings for monetary policy making and investor portfolio
formation are highly important. Central bankers and stock market participants should be
aware of the relationship between monetary policy and stock market performance in order to
better understand the effects of policy shifts. Monetary authorities in particular face the
dilemma of whether to react to stock price movements, above and beyond the standard
response to inflation and output developments. There is an ongoing debate in the monetary
policy rules literature between the proactive and reactive approach. On the one hand, the
proactive view advocates that monetary policymakers should alter interest rates in response to
2 See among others, Conover, Jensen and Johnson (1999), and Thorbecke (1997).
3
developing stock price bubbles in order to reduce overall macroeconomic volatility (see e.g.
Cecchetti et al., 2000; Kontonikas and Ioannidis, 2005). On the other hand, according to the
reactive approach, monetary authorities should wait and see whether the stock price reversal
occurs, and if it does, to react accordingly to the extent that there are implications for inflation
and output stability. Hence, the reactive approach is consistent with an accommodative ex
post response to stock price changes (see Bernanke and Gertler, 1999, 2001). Despite the
difference in the timing of the reaction, both approaches effectively assume that the monetary
authorities can affect stock market value. It is apparent then, that the empirical verification of
this assumption is important for monetary policy formulation.
The rest of the paper is organised as follows. The next section discusses the theoretical
framework underlying the relationship between monetary policy and the stock market.
Section 3 provides a short survey of the related vast empirical literature. Section 4 describes
the data. Section 5 presents the empirical estimates of the impact of monetary policy changes
on contemporaneous and expected stock returns, respectively. Section 6 provides conclusions
and policy implications.
2. Monetary policy and the stock market: theoretical background
The present value or discounted cash flow model offers useful insights on the stock
market effects of monetary policy changes. According to this widely used model the stock
price (St) is the present value of expected future dividends (Dt+j). Under the assumption of
constant discount rate (R), it can be shown that3:
1
1 11 1
j KK
t t t j t t Kj
S E D E SR R+
=
⎡ ⎤ ⎡⎛ ⎞ ⎛ ⎞= +⎢ ⎥ ⎢⎜ ⎟ ⎜ ⎟+ +⎝ ⎠ ⎝ ⎠⎢ ⎥ ⎢⎣ ⎦ ⎣∑ +
⎤⎥⎥⎦
(1)
where, Et is the conditional expectations operator based on information available to market
participants at time t, R is the rate of return used by market participants to discount future
dividends, and K is the investor’s time horizon (stock holding period). The standard
transversality condition implies that as the horizon K increases the second term in the right-
hand side of Eq. (1) vanishes to zero (no rational stock price bubbles):
3 To derive Eq. (1) we may assume for simplicity that there is an investor with two alternative investment opportunities over a one-period horizon: either a stock with expected gross return Et[St+1 + Dt+1] / St, or a risk-free bond with constant nominal gross return 1+R. Arbitrage opportunities imply that, for the investor to be indifferent between the two alternatives, they must yield the same expected return: Et[St+1 + Dt+1] / St = 1+R. We then solve forward the resulting expectational difference equation and obtain Eq. (1).
4
1lim 01
K
t t KKE S
R +→∞
⎡ ⎤⎛ ⎞ =⎢⎜ ⎟+⎝ ⎠⎢ ⎥⎣ ⎦⎥ (2)
Thus, we obtain the familiar version of the present value model4:
1
11
jK
t t t jj
S E DR +
=
⎡ ⎤⎛ ⎞= ⎢ ⎜ ⎟+⎝ ⎠⎢ ⎥⎣ ⎦∑ ⎥
(3)
Eq. (3) indicates that a change in monetary policy can affect stock returns in a dual
manner. First, there is a direct effect on stock returns by altering the discount rate used by
market participants. Tighter monetary policy leads to an increase in the rate at which firms’
future cash flows are capitalised causing stock prices to decline. The underlying assumptions
are that, first, the discount factors used by market participants are generally linked to market
rates of interest and second, the central bank is able to influence market interest rates5.
Second, monetary policy changes exert an indirect effect on the firms’ stock value by altering
expected future cash flows. Monetary policy easing is expected to increase the overall level of
economic activity and the stock price responds in a positive manner (expecting higher cash
flows in the future). Hence, this channel generally assumes the existence of a link between
monetary policy and the aggregate real economy. As Patelis (1997) argues, stocks are claims
on future economic output, so if monetary policy has real economic effects then stock markets
should be influenced by monetary conditions. In the next section we review the previous
empirical evidence on the links between monetary policy, the real economy, and the stock
market.
3. Monetary policy and the stock market: previous empirical evidence
Thorbecke (1997) employs a number of alternative methodologies to examine the
relationship between monetary policy and stock prices in the United States. Using a VAR
system that includes monthly equity returns, output growth, inflation, and the federal funds
rate, he finds that monetary policy shocks, measured by orthogonalized innovations in the
federal funds rate, have a greater impact on smaller capitalisation stocks, this is in line with
the hypothesis that monetary policy affects firms’ access to credit (see Gertler and Gilchrist,
4 Campbell, Lo, and MacKinlay (1996, p.258) discuss models of rational bubbles that relax the transversality condition. They also derive the present value model with time varying discount rates. 5 Fuhrer (1995) shows that the US monetary policy instrument (federal funds rate) constitutes a source of change for many longer term interest rates.
5
1993)6. In the same paper, Thorbecke (1997) adopts the Boschen and Mills’ (1995) index as
an alternative measure of monetary policy conditions7. In line with his VAR estimates, he
finds that expansionary monetary policy exerts a large and statistically significant positive
effect on monthly stock returns. In a recent study, Cassola and Morana (2004) also employ the
VAR methodology. In particular, they use a cointegrated VAR system including real GDP,
inflation, real M3 balances, short term interest rate, bond yield, and real stock prices in order
to examine the transmission mechanism of monetary policy in the Euro area. Their results
from impulse response analysis indicate that a permanent positive monetary shock has a
temporary positive effect on real stock prices.
Patelis (1997) examines whether some portion of the observed predictability in excess
US stock returns can be attributed to shifts in the monetary policy stance. Following Fama
and French8 (1989), he employs the long-horizon regression methodology, using two sets of
explanatory variables: monetary policy variables and financial variables. He finds that
monetary policy variables are significant predictors of future returns, although they cannot
account fully for the observed stock return predictability. Patelis’ explanation for the finding
that monetary policy indicators are significant predictors of excess stock returns relates to the
financial propagation mechanism (Bernanke and Gertler, 1989) and to the credit channel of
monetary policy transmission (Bernanke and Gertler, 1995)9.
Jensen and Johnson (1995) also find that monetary policy developments are associated
with patterns in stock returns. They show that long-term stock returns following discount rate
decreases are higher and less volatile than returns following rate increases. Their motivation
for the employment of the discount rate as a proxy for the stance of monetary policy follows
from the view that the discount rate is typically regarded as a signal of monetary and possibly
economic developments. This argument is based on Waud’s (1970) suggestion that discount
rate changes affect market participants’ expectations about monetary policy. Since rate
6 In order to identify the structural parameters from the VAR estimates, the Choleski identification scheme places equity returns at the last position of the chain order. Such ordering is consistent with the efficient market hypothesis that assumes that the stock market reacts sensitively to shocks in macroeconomic variables (see e.g. Chen, Roll and Ross, 1986) 7 This index uses a five-category classification of the monetary policy stance (from strongly anti-inflationary to strongly pro-growth) and is based on the Federal Open Market Committee records and other relevant information. 8 Fama and French (1989) regress stock returns at increasing time horizons on the dividend yield, the default spread and the term spread. They find that predictability increases with the time horizon. 9 Both theories assume that monetary policy shocks are propagated depending on the financial health of the firms in the economy. Shocks to firms’ balance sheets are amplified by the financial propagation mechanism through endogenous changes in the agency costs of lending, and the spread between external and internal finance. A monetary policy shock during a easy money period has smaller effects than one during tight money periods, since the financial health of firms has already improved due to higher balance-sheet income (and thus smaller dependence on costlier external finance), and increased bank loan supply.
6
changes are made only at substantial intervals, they represent a somewhat discontinuous
instrument of monetary policy, and they are established by a public body perceived as being
competent in judging the economy’s cash and credit needs. Financial economists discuss
various reasons why changes in the discount rate may affect stock returns. For example,
discrete policy rate changes influence forecasts of market determined interest rates and the
equity cost of capital. Also, changes in the discount rate possibly affect expectations of
corporate profitability (Waud, 1970).
In a subsequent study, Jensen, Mercer and Johnson (1996) extend the Fama and
French (1989) analysis by suggesting that the monetary environment affects investors’
required returns. Monetary policy stance is proxied by a binary dummy variable indicating
discount rate changes (see also Booth and Booth, 1997). Jensen et al. (1996) find that
predictable variation in stock returns depends on monetary as well as business conditions,
with expected stock returns being higher in tight money periods than in easy money periods.
The results also indicate an asymmetry in the relation between business conditions and stock
returns: business conditions could predict future stock returns only in periods of expansive
monetary policy.
Conover, Jensen and Johnson (1999) argue that not only US stock returns, but also
returns on foreign markets are related with US monetary environments (as well as their local
monetary environment). They find that stock returns in twelve OECD countries over the
period 1956-1995 are generally higher in expansive US and local monetary environments than
they are in restrictive environments. As in Jensen and Johnson (1995) and Jensen et al.
(1996), the monetary policy proxy used by Conover et al. (1999) is a dummy variable based
on discount rate changes. Jensen et al. (1996) show that this categorisation of monetary
regimes effectively differentiates US monetary conditions10.
4. Data and descriptive statistics
We employ monthly stock prices and interest rates data from thirteen countries over
the period January 1972 to July 2002. The data are obtained from OECD’s Main Economic
Indicators: Historical Statistics. Our sample of advanced economies, includes the G7 (United
States, United Kingdom, Japan, Germany, France, Italy and Canada), and other European
economies: Sweden, Finland, Switzerland, Belgium, Netherlands, Spain. Out of the nine
European Union sample countries: Germany, France, Italy, Finland, Belgium, Netherlands,
10 Note that as Conover et al. (1999) argue, while this method for monetary regime classification effectively differentiates monetary conditions, the procedure is not advocated as the best technique of identifying minor changes in the stringency of monetary policy.
7
Spain, UK, Sweden, the first seven have adopted the single European currency and common
monetary policy in the context of the European Monetary Union (EMU) ever since 1999.
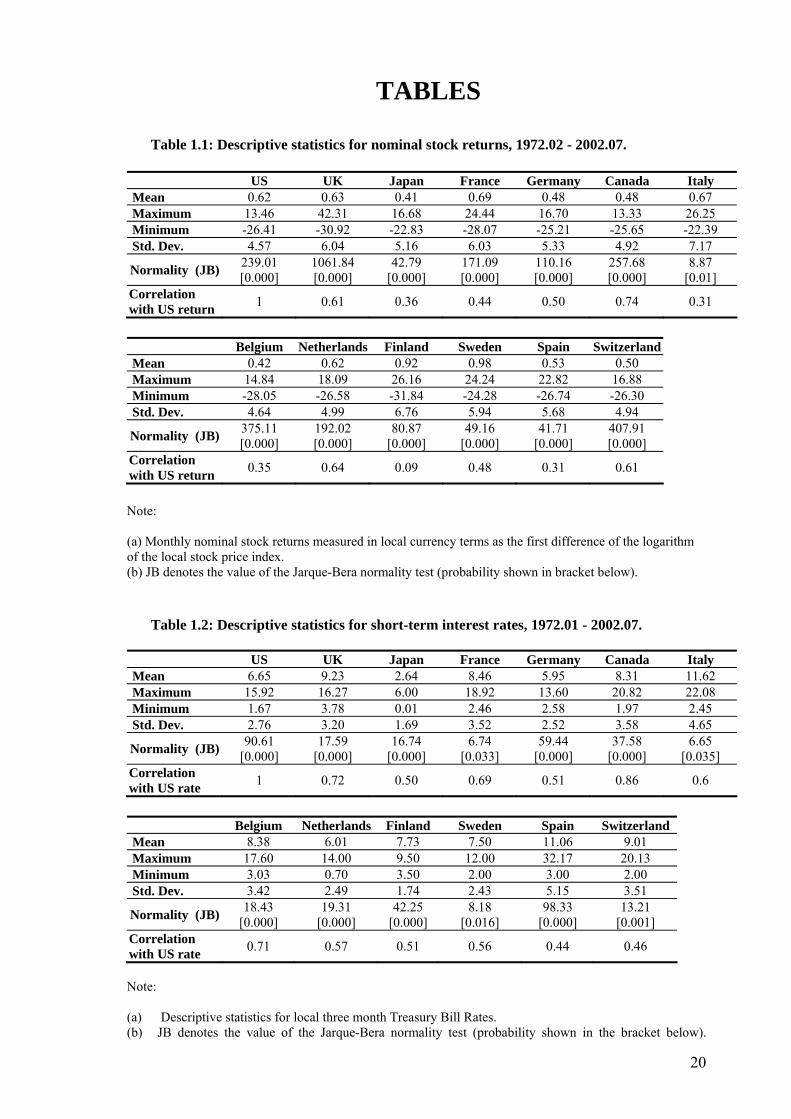
Table 1.1 presents summary statistics for monthly nominal stock returns over the
thirty year sample period. The mean monthly stock return for Sweden, Finland, and France is
the highest while it is the lowest for Japan, Belgium, Germany, and Canada. The standard
deviation of returns is the highest for Italy, Finland, and UK while it is the lowest for the US,
Belgium, and Canada. The Jarque-Bera test for normality indicates that stock returns are non-
normally distributed. Non-normality is a typical feature of stock returns data, especially in
higher frequencies, potentially leading to problems with hypothesis testing based on reported
probability statistics from regression analysis. The non-normality of stock returns will be
accounted for, through bootstrap analysis.
[TABLE 1.1]
We also calculate the correlation coefficient of local stock returns with US stock
returns. The correlation is positive for all countries and exceeds 40% for Canada, Netherlands,
UK, Switzerland, Germany, Sweden, and France. The correlation is less than 40% for Japan,
Belgium, Italy, Spain, and Finland. The emerging high degree of correlation between
international equity markets is a relatively recent phenomenon11. Several explanations have
been suggested, including the increasing level of diversification of firms’ sales and financing
across countries that exposes firms, more than before, to the global business cycle, causing
national stock markets to move together more. Another explanation for the rise in co-
movement since the mid-1990s is that it simply a temporary phenomenon associated with the
recent stock market bubble. Finally, additional reasons include the convergence in industrial
composition and greater policy coordination across countries, or simply that country-specific
shocks have declined in importance (Brooks and Del Negro, 2002). The high degree of
international correlation is another feature of stock returns data that will be taken into account
in the empirical estimations.
[TABLE 1.2]
Table 1.2 presents summary statistics for short-term interest rates. From the early
1990’s researchers and policy makers focused mainly on interest rate variables and spreads as
indicators of monetary policy. The change in the short-term interest rate is one of our
measures for the stance of the monetary authority. Short-term interest rates are proxied by the
three-month Treasury Bill (TB) rate (see also, Nelson, 2000). TB rates are highly correlated
11 As Brooks and Del Negro (2002) argue, the monthly correlation coefficient of US stock returns with stock returns in other developed economies has risen from a relatively stable level of around 0.4 from the mid-1980s through the mid-1990s to close to 0.9 more recently.
8
with the central bank interest rate instruments12. In Euro-members, national monetary policies
were abolished on December 1998. Thereafter, common monetary policy is implemented by
the European Central Bank (ECB) through changes in the ECB refinancing rate. Local TB
rates reflect the single ECB interest rate plus local market risk. Over the period 1999.01-
2002.07, the correlation between the local three-month TB rate and the ECB refinancing rate
is equal to 0.84, 0.89, 0.97, 0.97, 0.98, 0.97, 0.99 in Finland, France, Germany, Italy,
Belgium, Netherlands and Spain, respectively.
The average short tem interest rate is the highest for Italy, Spain, and UK while it is
the lowest for Japan, Germany, and Netherlands. The volatility of short-term rates is
substantially lower than the equity return volatility. Interest rate standard deviations obtain
values in the neighbourhood of 2% to 5%, while the equity return standard deviations range
from 4% to 7%. The standard deviation of short-term rates is the highest for Spain, Italy, and
Canada while it is the lowest for Japan, Finland, and Sweden. The average standard deviation
of sample short-term interest rates is almost two times smaller than the average standard
deviation of stock returns (2.85% as opposed to 5.55%), reflecting the higher risk associated
with stock market investment. The Jarque-Bera test shows that, similarly to stock returns,
interest rates are non-normal variables. The correlation between local short-term rates and US
rates is the highest for Canada, UK and Belgium (see also Conover et al., 1999). In contrast,
the correlation coefficient with the US rate is the lowest for Spain and Switzerland. The
results in Tables 1.1 and 1.2 suggest that our sample exhibits a high degree of diversity with
respect to average stock market performance and monetary policy, and their unconditional
volatilities. Foreign stock market returns and short-term interest rates are positively correlated
with their US counterparts, but their correlations range substantially across the sample. The
results from ADF unit root tests with intercept and/or trend indicate that over the period 1972-
2002, stock returns (nominal, real, dividend adjusted) and the first difference of short-term
interest rates can be treated as stationary variables in all sample countries13.
Apart from the change in the short term interest rate, we also employ an alternative
proxy for the stance of the monetary authority, that is, a binary dummy variable based upon
changes in the discount rate constructed according to Jensen et al. (1996) approach. Unlike
the TB rate, the discount rate is not market determined but administered by the central bank14.
The discount rate dummy variable is equal to one if the previous discount rate change was an
12 Calculations from the authors (available upon request) indicate that the correlation coefficient between three month TB rates and central bank discount rates over the period 1972-2002 is close to one (except from Switzerland where it is 0.58). 13 The results are available from the authors upon request. 14 The discount rate is the rate of interest at which the central bank is willing to supply reserves to the financial system and is used to cover rates such as the federal funds rate in the US and the repo rate in the Euro area.
9
increase (restrictive monetary policy) and zero (expansive monetary policy) if the previous
change was a decrease. The monetary environment classification remains the same until the
discount rate is changed in the opposite direction, since the central bank is assumed to be
operating under the same fundamental monetary policy until the discount rate is changed in
the opposite direction from the prevailing trend15. Following Jensen et al. (1996), we exclude
months when the discount rate was pegged to a market rate than being set by the central bank
itself. This results in elimination of data for Canada from March 1980 to December 199316.
Local discount rate data for Belgium, France, Finland, Germany, Italy (Euro members) is
available up till December 1998; over the rest of the sample period (1999.01-2002.07), we use
the ECB refinancing rate as a proxy for the Euro-members discount rate.
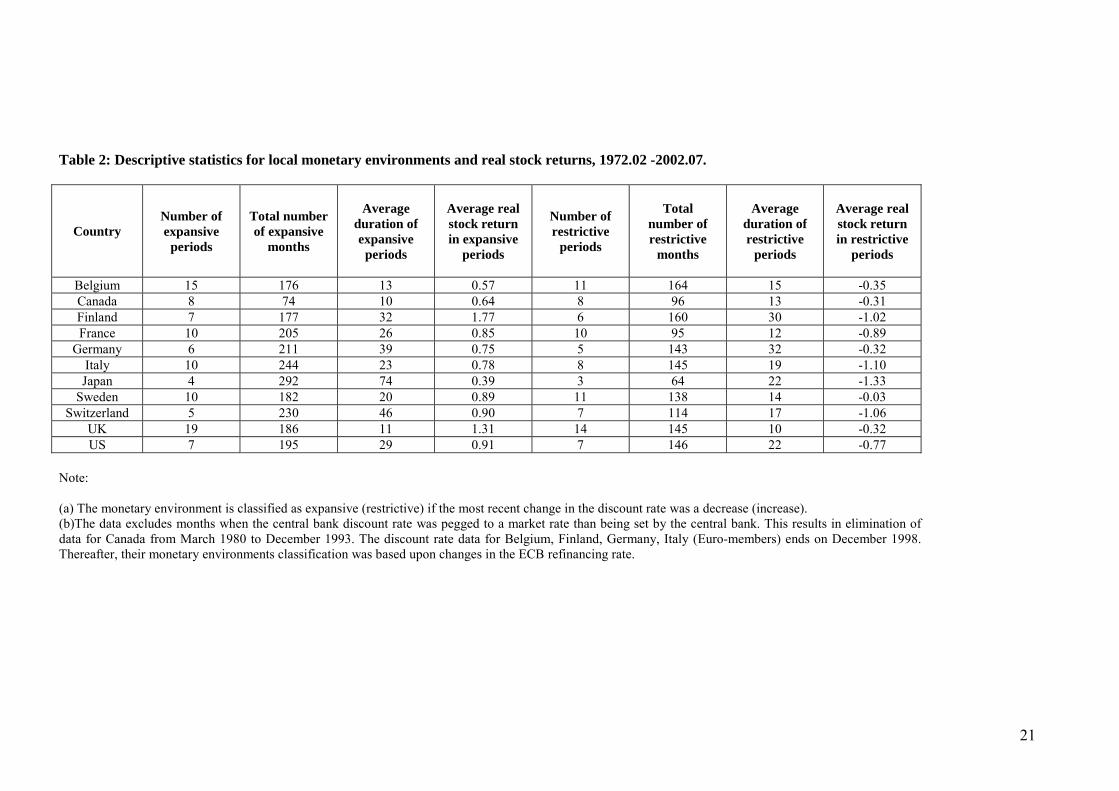
[TABLE 2]
As shown in Table 2, the number of expansive and restrictive periods varies
substantially from country to country implying a disparity in how actively discount rates were
used by the sample central banks. In the United Kingdom there were 19 expansive and 14
restrictive periods, while in Japan we document only 4 periods of expansive and 3 periods of
restrictive monetary policy. The average duration of the monetary environments varies
significantly, with Japan reporting the highest average duration of expansive periods (74
months) and Germany the highest average duration of restrictive periods (32 months).
Switzerland also has long expansive monetary periods, while Finland and UK have about the
same mean duration for restrictive and expansive periods. The United States experienced 7
expansive and 7 restrictive monetary policy periods, giving a total of 195 expansive and 146
restrictive months, respectively. Table 2 also shows summary statistics for the average
monthly real stock returns across monetary environments. It appears that in all sample
countries, stock returns are lower during periods of restrictive monetary policy. The average
real equity return during expansive periods is positive, ranging from 0.39% per month in
Japan to 1.77% in Finland. On the other hand, during periods of tighter monetary policy the
average return on stocks is negative.
5. Econometric framework and results
In this section, we extend the literature that examines the contemporaneous relationship
between monetary policy and stock returns by utilizing a more up-to-date dataset, by checking
15 For example, the period following a discount rate decrease is classified as expansive. Further discount rate decreases do not alter the classification of the monetary environment. The initial categorization of monetary environments cannot begin until there is a change in the discount rate. For instance, the first change in the discount rate for Sweden, and hence the first characterisation of the monetary environment, occurs in April 1974. 16 Spain and Netherlands are also excluded from the empirical analysis using the discount rate dummy variable, due to the lack of adequate number of discount rate observations in the Datastream series.
10
the robustness of the empirical findings to inclusion of dividend payments in stock returns,
and by taking into account the non-normality inherent in our data as well as the significant co
movement of international stock markets. We also estimate the impact of monetary policy
shifts on expected stock returns across a variety of returns’ specifications.
5.1 Monetary policy and contemporaneous stock returns
The contemporaneous relationship between monetary conditions and stock returns is
examined using the following regression model:
t t ts a r uβ∆ = + ∆ + (4)
where is a measure of equity returns (measured in local currency). Measures used in this
study are nominal returns (with and without dividends), and real returns (with and without
dividends). The independent variable,
ts∆
tr∆ , denotes our measure of monetary policy changes.
It is assumed that positive (negative) values of the change of the short-term rate are associated
with a restrictive (expansive) monetary environment. If the β coefficient is negative and
statistically significant, then it is implied that monetary tightening depresses the stock market
within the same month that the interest rates increase(s) occurred. Eq. (4) has been frequently
used in the financial economics literature with previous international evidence broadly
supporting a negative relationship between stock returns and (the level or the first difference
of) interest rates17. We estimate Eq. (4) using both single and multivariate estimators whilst
making inferences under both heteroscedasticity consistent variance estimators and test
statistics obtained by using the bootstrap. Thus, our results are robust to both the measure of
the change in monetary policy and the employed inferential and estimation procedures.
We begin by estimating Eq. (4) using ordinary least squares and using the Newey-
West heteroscedasticity consistent covariance matrix estimator. As we are using several
combinations of the measure of the dependent variable and estimators, we present a small
sub-set of our detailed results, and provide a summary of all results in Table 6 later on in the
text. In Table 3, the estimated intercepts are all positive and the majority of them statistically
significant at the conventional significance levels, reflecting the generally positive average
returns associated with stock market investment. The F statistic indicates acceptance of the
null of joint insignificance only in the cases of Finland, Japan, Spain and Switzerland. Ten of
17 In the literature that examines the effect of inflation on stock prices, using a generalised Fisher effect framework (which relates nominal stock returns with expected inflation), expected inflation is often proxied by the nominal Treasury Bill rate at the beginning of the period, see e.g. Fama and Schwert (1977). Fama and Schwert justify this approach by observing that almost all of the variability in the nominal TB rate is due to revisions of inflation expectations (see also Fama, 1975). More recent literature on monetary policy rules also suggests a positive correlation between the level of short-term interest rates and inflation, (Taylor, 1993).
11
the thirteen coefficient estimates for local monetary conditions are negative and statistically
different from zero at conventional significance levels, indicating that higher interest rates are
associated with lower stock returns. Hence, it appears that monetary policy shifts are
transmitted to the stock market.
[TABLE 3]
Some of the largest return differences are observed in the UK, France, Canada, and
Italy. On an annualized basis, the returns in expansive monetary environments exceeded the
returns in restrictive environments for these countries by approximately 31%, 28%, 20%, and
16%, respectively. These differences exceed the difference of approximately 10% exhibited
by the US market. Especially strong statistical relationships are observed for four of the
thirteen sample countries. Specifically, the monetary conditions coefficient is significant at
the 1% level in Belgium, Canada, France and UK. The regression R-squares suggest that, for
these four countries, the monetary policy variable explains approximately 3% to 8% of the
variation in stock returns. Given the monthly horizon of our data, the proportion of stock
variation that is explained is relatively high. The results indicate that only in Finland, Japan
and Spain stock returns are unrelated to the change in short-term interest rate.
The fifth column of Table 3 shows the Jarque-Bera test for normality of the residuals
from regression Eq. (4). The Jarque-Bera test rejects residual normality in all sample
countries. In order to calculate the non-normality-adjusted critical values, we undertook
bootstrap analysis. In particular, we created 1000 bootstrapped versions of the original
dependent variable (nominal stock returns) using the reshuffled (random draw with
replacement) scaled residuals. The generated dependent variable is then regressed on the
original explanatory variable (lagged change in short-term rate). This process is repeated 1000
times for each country in the sample, generating 1000 t-ratios. These 1000 t-ratios are then
sorted, so that the 5% critical values can be selected as the 25th (lower bound) and 975th
(upper bound) values of the series. Finally, average critical values are computed from 100
repetitions of 1000 iterations producing a distribution of critical values18.
Another sensitivity test for the validity of the results involves taking into account the
contemporaneous correlation in the error terms across equations of the local country model .
As we showed, US stock returns are strongly correlated with stock returns in the other sample
countries. We suspect that this correlation may be present in the residuals of Eq. (4) across
different countries, and therefore, we form the following system of equations, to be estimated
with the seemingly unrelated regression method (SUR):
18 The OLS results using bootstrapped confidence intervals are summarised in Table 6. The confidence intervals themselves are not presented but are available from the authors upon request.
12
, , ,j t j j j t jS a i u tβ∆ = + ∆ + (5)
where, j = Belgium, Canada, Finland, France, Germany, Italy, Japan, Netherlands,
Spain, Sweden, Switzerland, UK, US. The SUR method, also known as the multivariate
regression (or Zellner’s method) estimates the parameters of the system, accounting for
heteroskedasticity, and contemporaneous correlation in the errors across equations. SUR
results are summarized in Table 6. To establish the robust nature our results to the choice of
dependent variable, we proceed by repeating the estimation using real stock returns.
Real stock returns
Stock returns usually respond negatively to increased inflation (see e.g. Fama, 1981)
and at the same time central banks typically respond with interest rate increases to increases in
inflation. In this scenario, stock returns will decrease when monetary policy is contractionary,
but this decrease will be related with changes in inflationary expectations. To determine
whether the patterns identified in nominal returns are also present in real returns, we estimate
the following regression model:
t t tsr a r uβ∆ = + ∆ + (6)
where, t tsr s tπ∆ = ∆ − is the monthly real stock return, πt is the monthly inflation rate.
We use monthly consumer price indices from the OECD’s Main Economic Indicators:
Historical Statistics in order to calculate πt as the first difference of the natural log of
consumer prices.
[TABLE 4]
The results in Table 4 are qualitatively the same with those in Table.3, where nominal
equity returns were used in the estimation. For all countries, but Finland and Spain, the
coefficient of the change of the short-term interest rate is negative and statistically different
from zero at the usual levels of significance. For seven countries (Belgium, Canada, France,
Italy, Netherlands, Sweden, UK) the relationship is significant at the 1% level. Large real
return differences, associated with higher interest rates, are observed in UK and France. One
striking difference between the results of Tables 3 and 4 is the statistical insignificance of the
intercept for all the sample countries (except Sweden) when real returns are employed.
Overall, we find that contractionary monetary environments depresses not only
nominal but also inflation adjusted stock returns. Bootstrap analysis summarized in Table 6
reveal that after non-normality in the residuals is taken into account, the relationship between
changes in interest rates and stock returns is statistically different from zero at the 5% level in
13
10 out of the 13 countries. Multivariate estimation of Eq. (6) for the 13 sample countries using
the SUR method, indicates that the findings are identical to those obtained using nominal
stock returns (see Table 6).
Dividend adjusted stock returns
The national stock price indices employed for the construction of the nominal and real
return series are not adjusted for dividend payments. In order to perform an additional
examination of the results’ robustness, return series that include dividends were obtained from
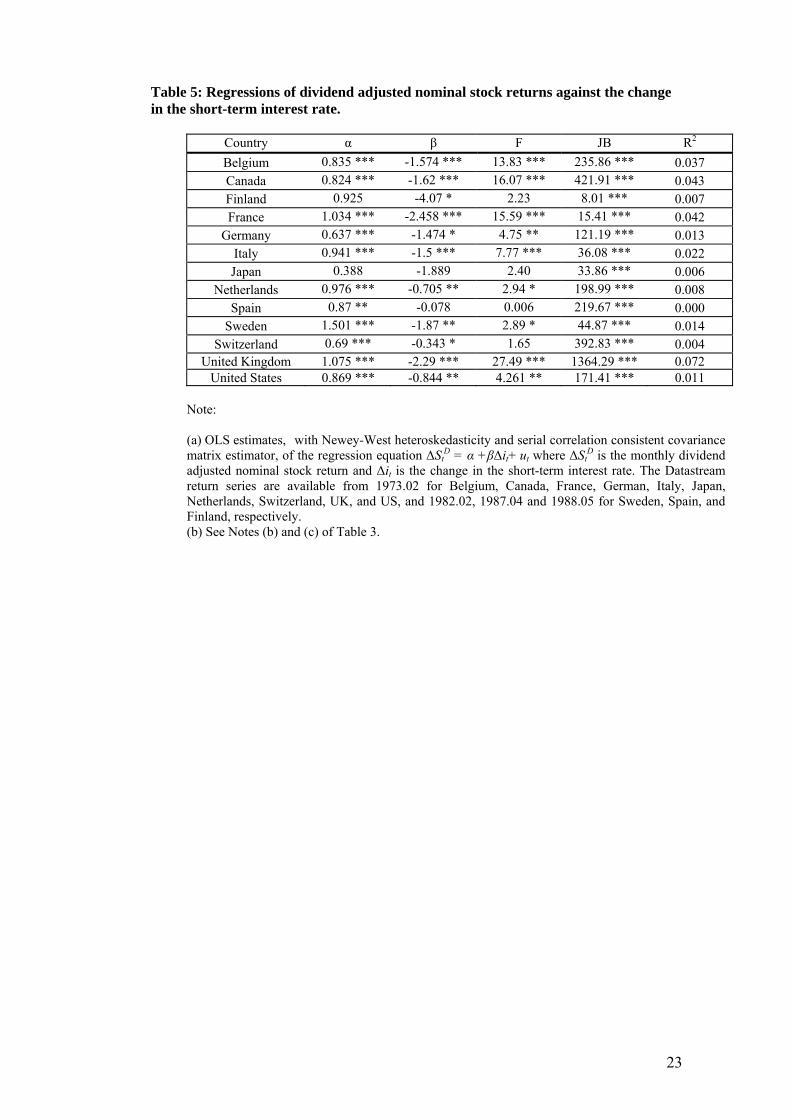
the Datastream Total Markets series19. Table 4.3 presents the results from the estimation of
Eq. (6) using dividend adjusted nominal stock returns (∆StD). It is evident that inclusion (or
exclusion) of dividends in the calculation of the returns doesn’t affect the strongly negative
relationship between changes in the short-term interest rate and stock returns in Belgium,
Canada, France, Italy, Netherlands, UK, US. Using nominal dividend adjusted returns, the
coefficient of the proxy for monetary tightening is negative and statistically significant at the
10% level of significance in 11 of the 13 sample countries. Especially strong patterns are
observed in France and the UK, where return differences of more than 2% (on a monthly
basis) are observed. The majority of the estimated intercepts are positive and significant and
higher in value, as compared to the case when we exclude dividends from the returns
calculation. The Jarque-Bera tests in Table 5 indicate the presence of non-normality in the
residuals of our estimated models. Bootstrapped confidence intervals show that the impact of
interest rate changes on equity returns remains statistically significant in the majority of our
sample countries, even when error non-normality is accounted for, in line with the findings
for non-dividend adjusted returns (see Table 6).
[TABLE 5]
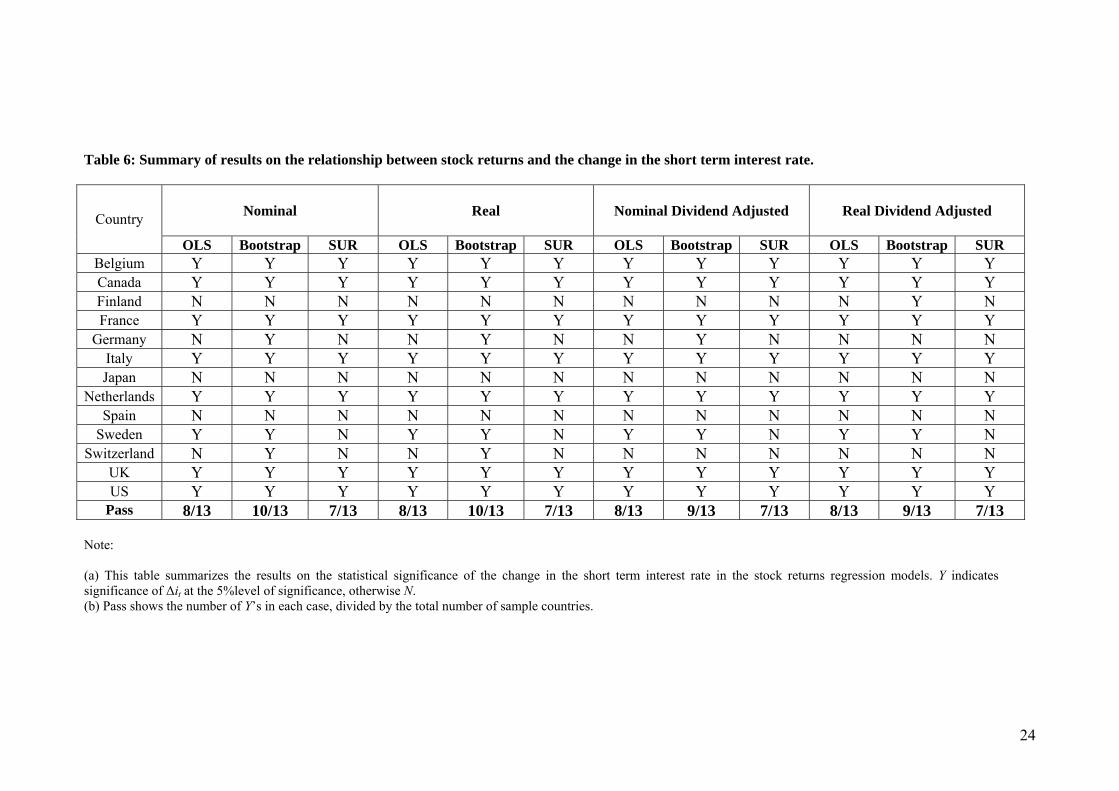
Table 6 provides a comprehensive summary of the econometric evidence obtained
using all our measures of equity returns and estimators. Summarizing the findings of this sub-
section, we obtain a consistent strong negative contemporaneous impact of monetary policy
on stock returns in seven sample countries: Belgium, Netherlands, Italy, France, UK, US and
Canada. In contrast, the results do not suggest any contemporaneous relationship at the 5%
level in Finland, Spain and Japan. Japan is a particularly interesting case given the size of its
economy and the huge boom and bust cycle that it experienced in land and stock prices over
the end of the 1980s and the beginning of the 1990s. As Okina, Shirakawa and Shiratsuka
(2001) point-out, from the start of 1989 the Bank of Japan began seriously addressing the
19 The series commence on February 1973 for Belgium, Canada, France, German, Italy, Japan, Netherlands, Switzerland, UK, and US while for Sweden, Spain, and Finland on 1982.02, 1987.04 and 1988.05, respectively.
14
question of raising the discount rate, but faced difficulties in persuading the government or the
general public on the need to tighten monetary policy. Eventually, Japanese monetary policy
start tightening on May 1989, while the bubble was in full swing, but “the economy expanded
rigorously even after the official discount rate was raised” and “it took a considerable time for
these hikes to have visible effects on money supply and asset prices... Stock prices continued
to rise until end-1989, and in 1990 plummeted with a few rebounds on the way” (Okina,
Shirakawa and Shiratsuka, 2001, p. 425). Hence, historical experience alone suggests that the
effect of policy changes may not be contemporaneous, and lags may be involved in the
transmission of monetary policy to stock prices. Taking this into consideration, in the next
sub-section we will look at the lagged effect of monetary policy on stock returns, or in other
words, the effect of discount rate changes on expected stock returns.
[TABLE 6]
Finally, sensitivity analysis indicates that accounting for non-normality in equity
returns generally increases the number of countries with a significant contemporaneous
relationship between monetary policy and stock returns. Bootstrap results show that Germany
should be included in the list of countries with significant monetary policy betas (and
Switzerland in the case of non-dividend adjusted stock returns). Also, comparing single
equation OLS estimates, with system SUR estimates, we see that controlling for international
stock market correlation affects the monetary policy-stock returns relationship only in
Sweden, rendering it insignificant. Overall, the results broadly support the notion that stock
market valuations are affected by contemporaneous monetary policy changes.
5.2 Monetary policy and expected stock returns
The previous sub-section verified a strong negative contemporaneous response of
stock markets to increases in the level of interest rates. In the majority of our sample
countries, the empirical results suggest that stock returns are generally higher in expansive
monetary environments than they are in restrictive environments. In this sub-section we use
the Jensen et al. (1996) dummy variable measure of monetary policy and examine whether the
monetary environment is an important consideration for investor required returns. We expand
on previous work by Jensen et al. (1996) and Conover et al. (1999) by utilising a more up-to-
date dataset and by looking at the robustness of the findings to inclusion of dividend payments
in the calculation of stock returns. We estimate Eq. (7) using nominal (∆St), real (∆st),
nominal dividend-adjusted (∆StD) and real dividend-adjusted stock returns (∆st
D):
15
t tQ a D utβ∆ = + + (7)
where, ∆Qt is the monthly equity return (∆St, ∆st, ∆StD, ∆st
D), and Dt is the directional
discount-rate change dummy variable, which takes a value of 1 if the most recent change in
the central bank discount rate was an increase and zero if it was a decrease.
Following Jensen et al. (1996), months that include the first rate change in a series are
eliminated from the sample. This is done to filter out announcement effects and focus on the
relationship between longer-term stock returns and the monetary environment. In essence, we
examine whether expected stock returns are time-varying and to some extent predictable,
using as an information variable a dummy that represents monetary conditions20. The
monetary policy variable is an ex-ante measure of monetary conditions, since it is known in
advance of the stock returns measurement interval, hence investors could conceivably
replicate the results. As Conover et al. (1999) argue, if the observed stock return patterns do
not correspond with similar patterns in investor required returns, investors could predict
periods of abnormal return performance.
[TABLE 7]
Table 7 presents the results from the estimation of Eq. (7) using nominal stock returns.
The estimated intercepts are all positive and statistically significant, indicating the generally
positive return that is expected from stock market investment. The estimated β coefficients
associated with the local monetary environment variable are negative and statistically
significant in six countries (Finland, France, Italy, Switzerland, UK, US). Hence, for those
countries our measure of the stance of monetary policy contains significant information,
which can be used to forecast expected stock returns. Particularly, we find that restrictive
(expansive) monetary policy stance decreases (increases) expected stock returns. The largest
expected return differences are observed in Finland and Switzerland. On an annualized basis,
the expected returns in expansive monetary environments exceeded the expected returns in
restrictive environments for these countries by approximately 27% and 20%, respectively.
These differences exceed the difference of approximately 17% exhibited by the UK, US stock
markets. Especially strong statistical relationships are observed for three of the eleven
countries under investigation21. Specifically, the discount rate dummy coefficient is
significant at the 1% level in Finland, Switzerland and the US. In Belgium, Canada, Germany,
20 As Patelis (1997) argues, in order to disprove the constant expected returns hypothesis, one has to show that a variable contained in time t information set can help predict asset returns at time t+k. By deleting the months that include the first discount rate change we filter out the contemporaneous effect of monetary policy on stock returns and focus on whether expected stock returns are time varying and whether the monetary policy variable is a significant predictor of future returns. 21 Recall that Spain and Netherlands are excluded from the empirical analysis in this section, due to the lack of adequate number of discount rate observations in the Datastream series.
16
Japan and Sweden expected stock returns appear to be unrelated to local monetary
conditions22.
[TABLE 8]
Table 8 summarizes the econometric evidence obtained using Eq. (7) and all our
alternative measures of equity returns23. Our results agree with previous evidence by Conover
et al. (1999) in that, in those countries where there is a significant relationship between local
monetary conditions and expected nominal stock returns (dividend adjusted or not), there is
also a significant relationship between local monetary policy and expected real stock returns.
Using real returns, Italy and Japan are added to the list of countries where the negative
relationship between monetary tightening and expected stock returns is significant at the 5%
level. When dividends are included in the calculation of returns the difference between results
using nominal and real returns is even more striking. Particularly, the number of countries
where there is a statistically significant relationship at the 5% level between the monetary
policy dummy variable and expected stock returns increases from four to eight, as France,
Germany, Italy, and Japan are added to the list. The results are generally consistent with the
argument that monetary conditions are related to investor-required returns. If monetary
authorities tend to follow expansive policies when the economy is weak, then investors may
require higher rates of return to invest in the stock market.
6. Conclusions and policy implications
This paper examined the relationship between stock returns and monetary conditions
in a sample of thirteen OECD countries. The existence of such a relationship has important
implications for both stock market participants and central bankers since, with respect to the
former this issue relates to the broader topic of stock price determination and portfolio
formation, while the latter are interested in whether monetary policy actions are transmitted
through financial markets. Our proxies for shifts in monetary policy are based on interest rate
variables including the change in the short-term Treasury Bill rate and a dummy variable
reflecting discount rate changes. Our main contribution to the existing literature is that when
we examine the impact of interest rate changes on stock price changes, we take into account
the non-normal distribution of stock returns as well as the co-movement in international stock
markets. The results suggest that in 80% of the countries under investigation, periods of tight
22 We should mention, though, that as Conover et al. (1999) point out, tests of significance of the monetary environment variable are actually joint tests of the hypotheses that the monetary policy variable effectively differentiates monetary conditions, and that the monetary environment is related to stock returns. Thus, an insignificant dummy coefficient may reflect either a flow in the monetary variable, or that stock returns are genuinely unrelated to monetary conditions. 23 The full set of results is available from the authors upon request.
17
money are associated with contemporaneous declines in stock market value. These findings
can be understood in the context of the present value model, whereas interest rate increases
are associated with lower stock prices via higher discount rates and lower future cash flows.
Another important result is that following monetary policy changes, not only
contemporaneous but also future stock returns, across a variety of returns specifications, are
affected. Hence, our interest rate measure of monetary policy contains significant information
that can be used to forecast expected stock returns. Specifically, we find that in most sample
countries a restrictive monetary policy stance decreases expected stock returns. Such shifts in
required returns do not necessarily contradict market efficiency since central banks often
adopt expansive monetary policy when there is increased concern of an economic downturn.
Hence, the finding that during these periods investors require higher returns to invest in the
stock market may be a reasonable expectation after all. Our results imply that stock market
investors should be aware of the international portfolio diversification opportunities across
countries with different monetary environments.
The implications of our findings for monetary policy formulation are profound, since
we establish that central banks can affect stock market valuations by altering interest rates.
This result broadly holds across a variety of countries that have adopted different monetary
policy frameworks. These alternative policy regimes range from explicit inflation targeting
(as practiced e.g. in the UK, Sweden, Canada and, more recently, Japan), to implicit targeting,
where no formal targets are in place (as e.g. in the US), and the two-pillar strategy of the
ECB. Despite their operational differences, all these regimes focus on price stability as the
primary monetary policy objective and they were successful since inflation has been largely
contained for quite some time. Nevertheless, large fluctuations in stock prices during the late
1990s-early 2000 in an environment of stable consumer prices, the so-called ‘paradox of
central bank credibility’, generated an intense debate in academic and policy circles regarding
the appropriate monetary policy reaction to stock price movements. Notwithstanding that the
two main competing views differ regarding the timing of the interest rate reaction to stock
price misalignments (as early as possible, according to the proactive view; after the stock
price reversal occurs, according to the reactive view), they both effectively assume that stock
prices are sufficiently interest rate sensitive. In this paper, we did not attempt to answer the
perennial question of whether monetary policy should respond to stock prices, this can be
done only within a structural model, but rather took a step backwards and showed that the
underlying assumption, that stock market valuations are affected by interest rate changes, is
robust to close empirical inspection. Given this information, it is up to the monetary authority
to calibrate the appropriate policy response to potential stock price misalignments.
18
REFERENCES
Bernanke, B., and Gertler M., 1989. Agency Costs, Net Worth, and Business Fluctuations. American Economic Review 79, 14-31.
Bernanke, B., and Gertler M., 1995. Inside the Black Box: The Credit Channel of the Monetary Policy Transmission. Journal of Economic Perspectives 9, 27-48.
Bernanke, B., and Gertler M., 1999. Monetary Policy and Asset Price Volatility. Economic Review, Federal Reserve of Kansas City, Fourth Quarter, 17-51.
Bernanke, B., and Gertler M., 2001. Should Central Banks Respond to Movements in Asset Prices? American Economic Review Papers and Proceedings 91, 253-257.
Bernanke, B., and Kuttner N., 2005. What Explains the Stock Market’s Reaction to Federal Reserve Policy? Journal of Finance 60, 1221-1257.
Booth, J., and Booth, L., 1997. Economic Factors, Monetary Policy, and Expected Returns on Stocks and Bonds. Federal Reserve Bank of San Francisco 2.
Boschen, J., and Mills, L., 1995. The Relation between Narrative and Money Market Indicators of Monetary Policy. Economic Inquiry 33, 24-44.
Brooks, R., and Del Negro, M., 2002. The Rise in Comovement Across National Stock Markets: Market Integration or IT Bubble? Federal Reserve Bank of Atlanta Working Paper 2002-17.
Campbell, J., Lo, A., and MacKinlay, C., 1996. The Econometrics of Financial Markets. Princeton University Press.
Cecchetti, S., Genberg H., Lipsky J., and Wadhwani S., 2000. Asset Prices and Central Bank Policy, International Centre for Monetary and Banking Studies, London.
Cassola, N. and Morana, C., 2004. Monetary Policy and the Stock Market in the Euro Area. Journal of Policy Modeling 26, 387-399.
Chen, N., Roll, R., and Ross, S., 1986. Economic Forces and the Stock Market. Journal of Business 59, 383-403.
Conover M., Jensen, G., Johnson, R., 1999. Monetary Environments and International Stock Returns. Journal of Banking and Finance 23, 1357-1381.
Fama E., 1975. Short-Term Interest Rates as Predictors of Inflation. American Economic Review 65, 269-282.
Fama E., 1981. Stock Returns, Real Activity, Inflation and Money. American Economic Review 71, 545-65.
Fama, E., and French, K., 1989. Business Conditions and Expected Returns on Stocks and Bonds. Journal of Financial Economics 25, 23-49.
Fama, E., and Schwert, G., 1977. Asset Returns and Inflation. Journal of Financial Economics 5, 115-146.
Fuhrer, J., 1995. Monetary policy and the behaviour of long-term real interest rates. New England Economic Review Sep-Oct 1995, 39-52.
Gertler, M., and Gilchrist, S., 1993. The Role of Credit Market Imperfections in the Monetary Transmission Mechanism: Arguments and Evidence. Scandinavian Journal of Economics 95, 43-64.
Goodhart, C., and Hofmann, B. (2000). “Financial Variables and the Conduct of Monetary Policy”, Sveriges Riskbank Working Paper, No. 12.
Jensen, G., and Johnson, R., 1995. Discount Rate Changes and Security Returns in the US, 1962-1991. Journal of Banking and Finance 19, 79-95.
Jensen, G., Mercer, J., and Johnson, R., 1996. Business Conditions, Monetary Policy, and Expected Security Returns. Journal of Financial Economics 40, 213-237.
Kontonikas, A. and Ioannidis, C., 2005. Should Monetary Policy Respond to Asset Price Misalignments? Economic Modelling 22, 1105-1121.
Nelson, E., 2000. UK Monetary Policy 1972-1997: A Guide Using Taylor Rules. Bank of England Working Paper 120.
Okina, K., Shirakawa, M., and Shiratsuka, S., 2001. The Asset Price Bubble and Monetary Policy: Japan’s Experience in the Late 1980s and the Lessons. Monetary and Economic Studies (Special Edition) February 2001, 395-450.
Patelis, A., 1997. Stock Return Predictability and the Role of Monetary Policy. Journal of Finance 52, 1951-1972.
Taylor, J., 1993. Discretion Versus Policy Rules in Practice. Carnegie-Rochester Conference Series on Public Policy 39, 195-214.
Thorbecke, W., 1997. On Stock Market Returns and Monetary Policy. Journal of Finance 52, 635-654. Waud, R., 1970. Public Interpretation of Federal Reserve Discount Rate Changes: Evidence on the
‘Announcement Effect’. Econometrica 38, 231-250.
19
TABLES
Table 1.1: Descriptive statistics for nominal stock returns, 1972.02 - 2002.07.
US UK Japan France Germany Canada Italy Mean 0.62 0.63 0.41 0.69 0.48 0.48 0.67 Maximum 13.46 42.31 16.68 24.44 16.70 13.33 26.25 Minimum -26.41 -30.92 -22.83 -28.07 -25.21 -25.65 -22.39 Std. Dev. 4.57 6.04 5.16 6.03 5.33 4.92 7.17
Normality (JB) 239.01 [0.000]
1061.84 [0.000]
42.79 [0.000]
171.09 [0.000]
110.16 [0.000]
257.68 [0.000]
8.87 [0.01]
Correlation with US return 1 0.61 0.36 0.44 0.50 0.74 0.31
Belgium Netherlands Finland Sweden Spain Switzerland Mean 0.42 0.62 0.92 0.98 0.53 0.50 Maximum 14.84 18.09 26.16 24.24 22.82 16.88 Minimum -28.05 -26.58 -31.84 -24.28 -26.74 -26.30 Std. Dev. 4.64 4.99 6.76 5.94 5.68 4.94
Normality (JB) 375.11 [0.000]
192.02 [0.000]
80.87 [0.000]
49.16 [0.000]
41.71 [0.000]
407.91 [0.000]
Correlation with US return 0.35 0.64 0.09 0.48 0.31 0.61
Note: (a) Monthly nominal stock returns measured in local currency terms as the first difference of the logarithm of the local stock price index. (b) JB denotes the value of the Jarque-Bera normality test (probability shown in bracket below).
Table 1.2: Descriptive statistics for short-term interest rates, 1972.01 - 2002.07.
US UK Japan France Germany Canada Italy Mean 6.65 9.23 2.64 8.46 5.95 8.31 11.62 Maximum 15.92 16.27 6.00 18.92 13.60 20.82 22.08 Minimum 1.67 3.78 0.01 2.46 2.58 1.97 2.45 Std. Dev. 2.76 3.20 1.69 3.52 2.52 3.58 4.65
Normality (JB) 90.61 [0.000]
17.59 [0.000]
16.74 [0.000]
6.74 [0.033]
59.44 [0.000]
37.58 [0.000]
6.65 [0.035]
Correlation with US rate 1 0.72 0.50 0.69 0.51 0.86 0.6
Belgium Netherlands Finland Sweden Spain Switzerland Mean 8.38 6.01 7.73 7.50 11.06 9.01 Maximum 17.60 14.00 9.50 12.00 32.17 20.13 Minimum 3.03 0.70 3.50 2.00 3.00 2.00 Std. Dev. 3.42 2.49 1.74 2.43 5.15 3.51
Normality (JB) 18.43 [0.000]
19.31 [0.000]
42.25 [0.000]
8.18 [0.016]
98.33 [0.000]
13.21 [0.001]
Correlation with US rate 0.71 0.57 0.51 0.56 0.44 0.46
Note: (a) Descriptive statistics for local three month Treasury Bill Rates. (b) JB denotes the value of the Jarque-Bera normality test (probability shown in the bracket below).
20
21
Table 2: Descriptive statistics for local monetary environments and real stock returns, 1972.02 -2002.07.
Country Number of expansive
periods
Total number of expansive
months
Average duration of expansive
periods
Average real stock return in expansive
periods
Number of restrictive
periods
Total
number of restrictive
months
Average duration of restrictive
periods
Average real stock return in restrictive
periods
Belgium 15 176 13 0.57 11 164 15 -0.35 Canada 8 74 10 0.64 8 96 13 -0.31 Finland 7 177 32 1.77 6 160 30 -1.02 France 10 205 26 0.85 10 95 12 -0.89
Germany 6 211 39 0.75 5 143 32 -0.32 Italy 10 244 23 0.78 8 145 19 -1.10 Japan 4 292 74 0.39 3 64 22 -1.33
Sweden 10 182 20 0.89 11 138 14 -0.03 Switzerland 5 230 46 0.90 7 114 17 -1.06
UK 19 186 11 1.31 14 145 10 -0.32 US 7 195 29 0.91 7 146 22 -0.77
Note: (a) The monetary environment is classified as expansive (restrictive) if the most recent change in the discount rate was a decrease (increase). (b)The data excludes months when the central bank discount rate was pegged to a market rate than being set by the central bank. This results in elimination of data for Canada from March 1980 to December 1993. The discount rate data for Belgium, Finland, Germany, Italy (Euro-members) ends on December 1998. Thereafter, their monetary environments classification was based upon changes in the ECB refinancing rate.
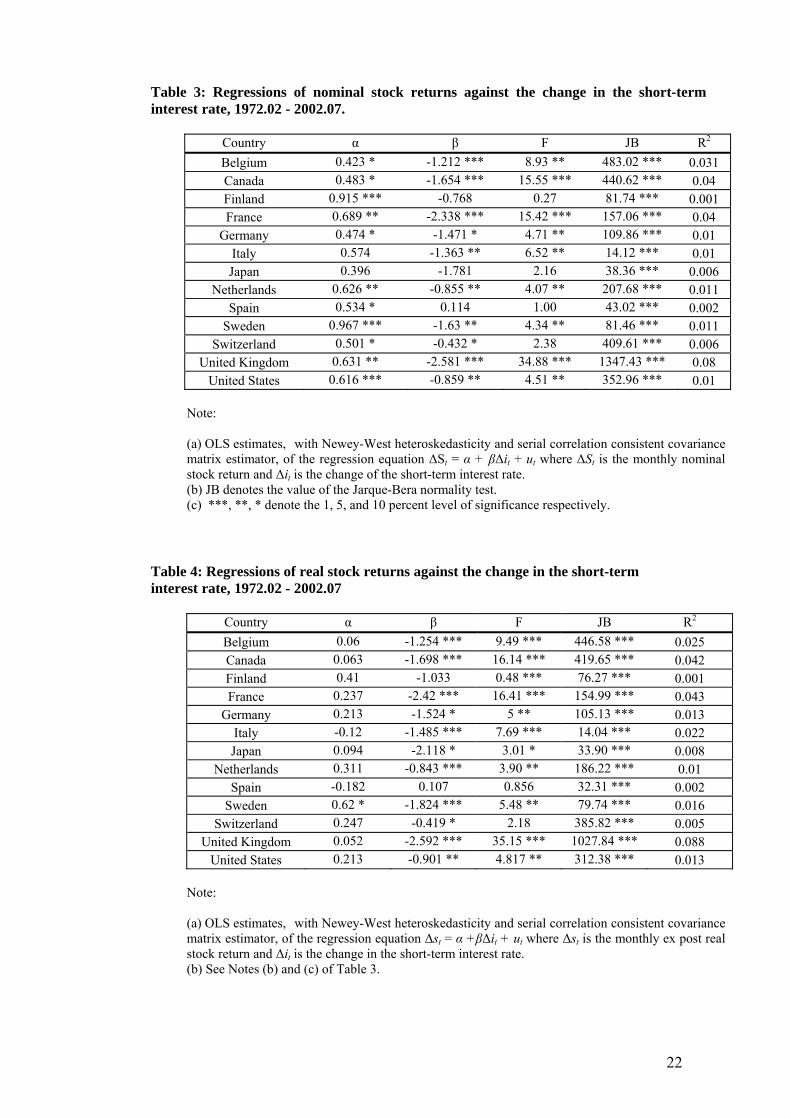
Table 3: Regressions of nominal stock returns against the change in the short-term interest rate, 1972.02 - 2002.07.
Country α β F JB R2
Belgium 0.423 * -1.212 *** 8.93 ** 483.02 *** 0.031 Canada 0.483 * -1.654 *** 15.55 *** 440.62 *** 0.04 Finland 0.915 *** -0.768 0.27 81.74 *** 0.001 France 0.689 ** -2.338 *** 15.42 *** 157.06 *** 0.04
Germany 0.474 * -1.471 * 4.71 ** 109.86 *** 0.01 Italy 0.574 -1.363 ** 6.52 ** 14.12 *** 0.01 Japan 0.396 -1.781 2.16 38.36 *** 0.006
Netherlands 0.626 ** -0.855 ** 4.07 ** 207.68 *** 0.011 Spain 0.534 * 0.114 1.00 43.02 *** 0.002
Sweden 0.967 *** -1.63 ** 4.34 ** 81.46 *** 0.011 Switzerland 0.501 * -0.432 * 2.38 409.61 *** 0.006
United Kingdom 0.631 ** -2.581 *** 34.88 *** 1347.43 *** 0.08 United States 0.616 *** -0.859 ** 4.51 ** 352.96 *** 0.01
Note: (a) OLS estimates, with Newey-West heteroskedasticity and serial correlation consistent covariance matrix estimator, of the regression equation ∆St = α + β∆it + ut where ∆St is the monthly nominal stock return and ∆it is the change of the short-term interest rate. (b) JB denotes the value of the Jarque-Bera normality test. (c) ***, **, * denote the 1, 5, and 10 percent level of significance respectively.
Table 4: Regressions of real stock returns against the change in the short-term interest rate, 1972.02 - 2002.07
Country α β F JB R2
Belgium 0.06 -1.254 *** 9.49 *** 446.58 *** 0.025 Canada 0.063 -1.698 *** 16.14 *** 419.65 *** 0.042 Finland 0.41 -1.033 0.48 *** 76.27 *** 0.001 France 0.237 -2.42 *** 16.41 *** 154.99 *** 0.043
Germany 0.213 -1.524 * 5 ** 105.13 *** 0.013 Italy -0.12 -1.485 *** 7.69 *** 14.04 *** 0.022 Japan 0.094 -2.118 * 3.01 * 33.90 *** 0.008
Netherlands 0.311 -0.843 *** 3.90 ** 186.22 *** 0.01 Spain -0.182 0.107 0.856 32.31 *** 0.002
Sweden 0.62 * -1.824 *** 5.48 ** 79.74 *** 0.016 Switzerland 0.247 -0.419 * 2.18 385.82 *** 0.005
United Kingdom 0.052 -2.592 *** 35.15 *** 1027.84 *** 0.088 United States 0.213 -0.901 ** 4.817 ** 312.38 *** 0.013
Note: (a) OLS estimates, with Newey-West heteroskedasticity and serial correlation consistent covariance matrix estimator, of the regression equation ∆st = α +β∆it + ut where ∆st is the monthly ex post real stock return and ∆it is the change in the short-term interest rate. (b) See Notes (b) and (c) of Table 3.
22
23
Table 5: Regressions of dividend adjusted nominal stock returns against the change in the short-term interest rate.
Country α β F JB R2
Belgium 0.835 *** -1.574 *** 13.83 *** 235.86 *** 0.037 Canada 0.824 *** -1.62 *** 16.07 *** 421.91 *** 0.043 Finland 0.925 -4.07 * 2.23 8.01 *** 0.007 France 1.034 *** -2.458 *** 15.59 *** 15.41 *** 0.042
Germany 0.637 *** -1.474 * 4.75 ** 121.19 *** 0.013 Italy 0.941 *** -1.5 *** 7.77 *** 36.08 *** 0.022 Japan 0.388 -1.889 2.40 33.86 *** 0.006
Netherlands 0.976 *** -0.705 ** 2.94 * 198.99 *** 0.008 Spain 0.87 ** -0.078 0.006 219.67 *** 0.000
Sweden 1.501 *** -1.87 ** 2.89 * 44.87 *** 0.014 Switzerland 0.69 *** -0.343 * 1.65 392.83 *** 0.004
United Kingdom 1.075 *** -2.29 *** 27.49 *** 1364.29 *** 0.072 United States 0.869 *** -0.844 ** 4.261 ** 171.41 *** 0.011
Note: (a) OLS estimates, with Newey-West heteroskedasticity and serial correlation consistent covariance matrix estimator, of the regression equation ∆St
D = α +β∆it+ ut where ∆StD is the monthly dividend
adjusted nominal stock return and ∆it is the change in the short-term interest rate. The Datastream return series are available from 1973.02 for Belgium, Canada, France, German, Italy, Japan, Netherlands, Switzerland, UK, and US, and 1982.02, 1987.04 and 1988.05 for Sweden, Spain, and Finland, respectively. (b) See Notes (b) and (c) of Table 3.
24
Table 6: Summary of results on the relationship between stock returns and the change in the short term interest rate.
Nominal
Real Nominal Dividend Adjusted Real Dividend Adjusted Country
OLS Bootstrap SUR OLS Bootstrap SUR OLS Bootstrap SUR OLS Bootstrap SURBelgium Y Y Y Y Y Y Y Y Y Y Y YCanada Y Y Y Y Y Y Y Y Y Y Y YFinland N N N N N N N N N N Y NFrance Y Y Y Y Y Y Y Y Y Y Y Y
Germany N Y N N Y N N Y N N N NItaly Y Y Y Y Y Y Y Y Y Y Y YJapan N N N N N N N N N N N N
Netherlands Y Y Y Y Y Y Y Y Y Y Y YSpain N N N N N N N N N N N N
Sweden Y Y N Y Y N Y Y N Y Y NSwitzerland N Y N N Y N N N N N N N
UK Y Y Y Y Y Y Y Y Y Y Y YUS Y Y Y Y Y Y Y Y Y Y Y Y
Pass 8/13 10/13 7/13 8/13 10/13 7/13 8/13 9/13 7/13 8/13 9/13 7/13
(a) This table summarizes the results on the statistical significance of the change in the short term interest rate in the stock returns regression models. Y indicates significance of ∆it at the 5%level of significance, otherwise N. (b) Pass shows the number of Y’s in each case, divided by the total number of sample countries.
Note:
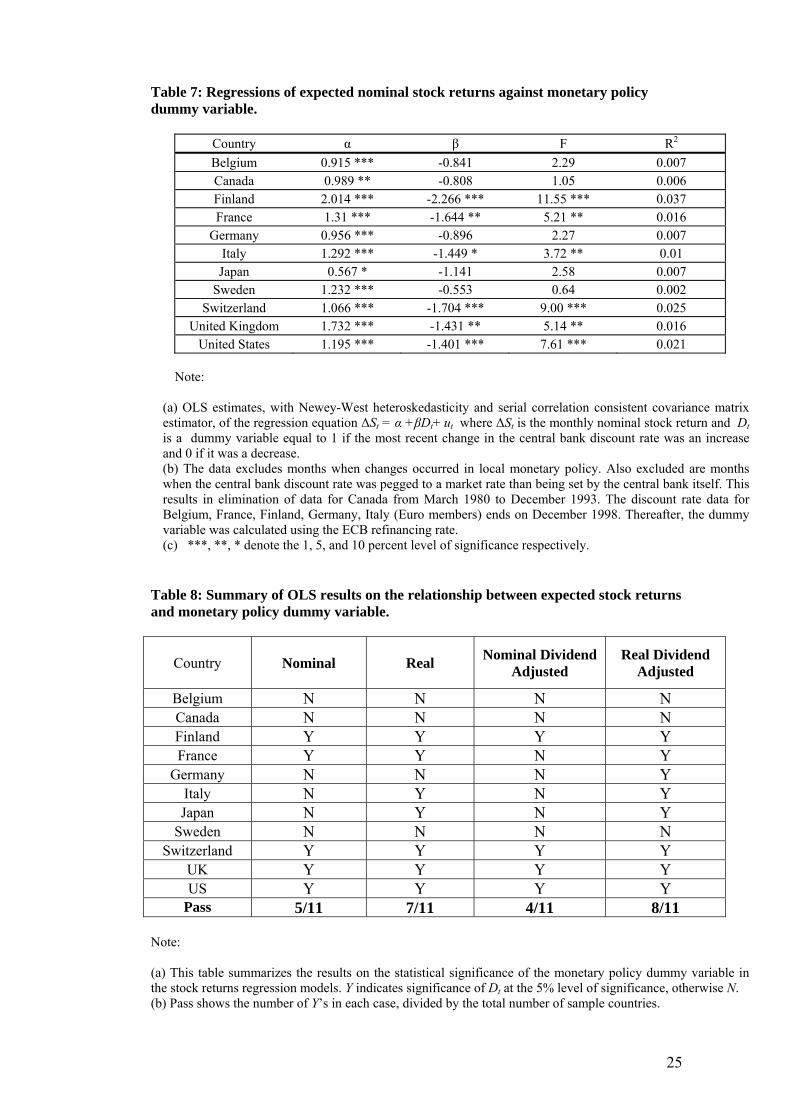
Table 7: Regressions of expected nominal stock returns against monetary policy dummy variable.
Country α β F R2
Belgium 0.915 *** -0.841 2.29 0.007 Canada 0.989 ** -0.808 1.05 0.006 Finland 2.014 *** -2.266 *** 11.55 *** 0.037 France 1.31 *** -1.644 ** 5.21 ** 0.016
Germany 0.956 *** -0.896 2.27 0.007 Italy 1.292 *** -1.449 * 3.72 ** 0.01 Japan 0.567 * -1.141 2.58 0.007
Sweden 1.232 *** -0.553 0.64 0.002 Switzerland 1.066 *** -1.704 *** 9.00 *** 0.025
United Kingdom 1.732 *** -1.431 ** 5.14 ** 0.016 United States 1.195 *** -1.401 *** 7.61 *** 0.021
Note: (a) OLS estimates, with Newey-West heteroskedasticity and serial correlation consistent covariance matrix estimator, of the regression equation ∆St = α +βDt+ ut where ∆St is the monthly nominal stock return and Dt is a dummy variable equal to 1 if the most recent change in the central bank discount rate was an increase and 0 if it was a decrease. (b) The data excludes months when changes occurred in local monetary policy. Also excluded are months when the central bank discount rate was pegged to a market rate than being set by the central bank itself. This results in elimination of data for Canada from March 1980 to December 1993. The discount rate data for Belgium, France, Finland, Germany, Italy (Euro members) ends on December 1998. Thereafter, the dummy variable was calculated using the ECB refinancing rate. (c) ***, **, * denote the 1, 5, and 10 percent level of significance respectively.
Table 8: Summary of OLS results on the relationship between expected stock returns and monetary policy dummy variable.
Country
Nominal
Real Nominal Dividend Adjusted
Real Dividend Adjusted
Belgium N N N N Canada N N N N Finland Y Y Y Y France Y Y N Y
Germany N N N Y Italy N Y N Y Japan N Y N Y
Sweden N N N N Switzerland Y Y Y Y
UK Y Y Y Y US Y Y Y Y
Pass 5/11 7/11 4/11 8/11 Note:
(a) This table summarizes the results on the statistical significance of the monetary policy dummy variable in the stock returns regression models. Y indicates significance of Dt at the 5% level of significance, otherwise N. (b) Pass shows the number of Y’s in each case, divided by the total number of sample countries.
25